


方案详情
文
采用LaVision公司的FlameMaster系统。测量了火焰对象的2D平面激光诱导荧光信号。并依据结果估算了3D火焰表面密度和全局燃料消耗速率。
方案详情

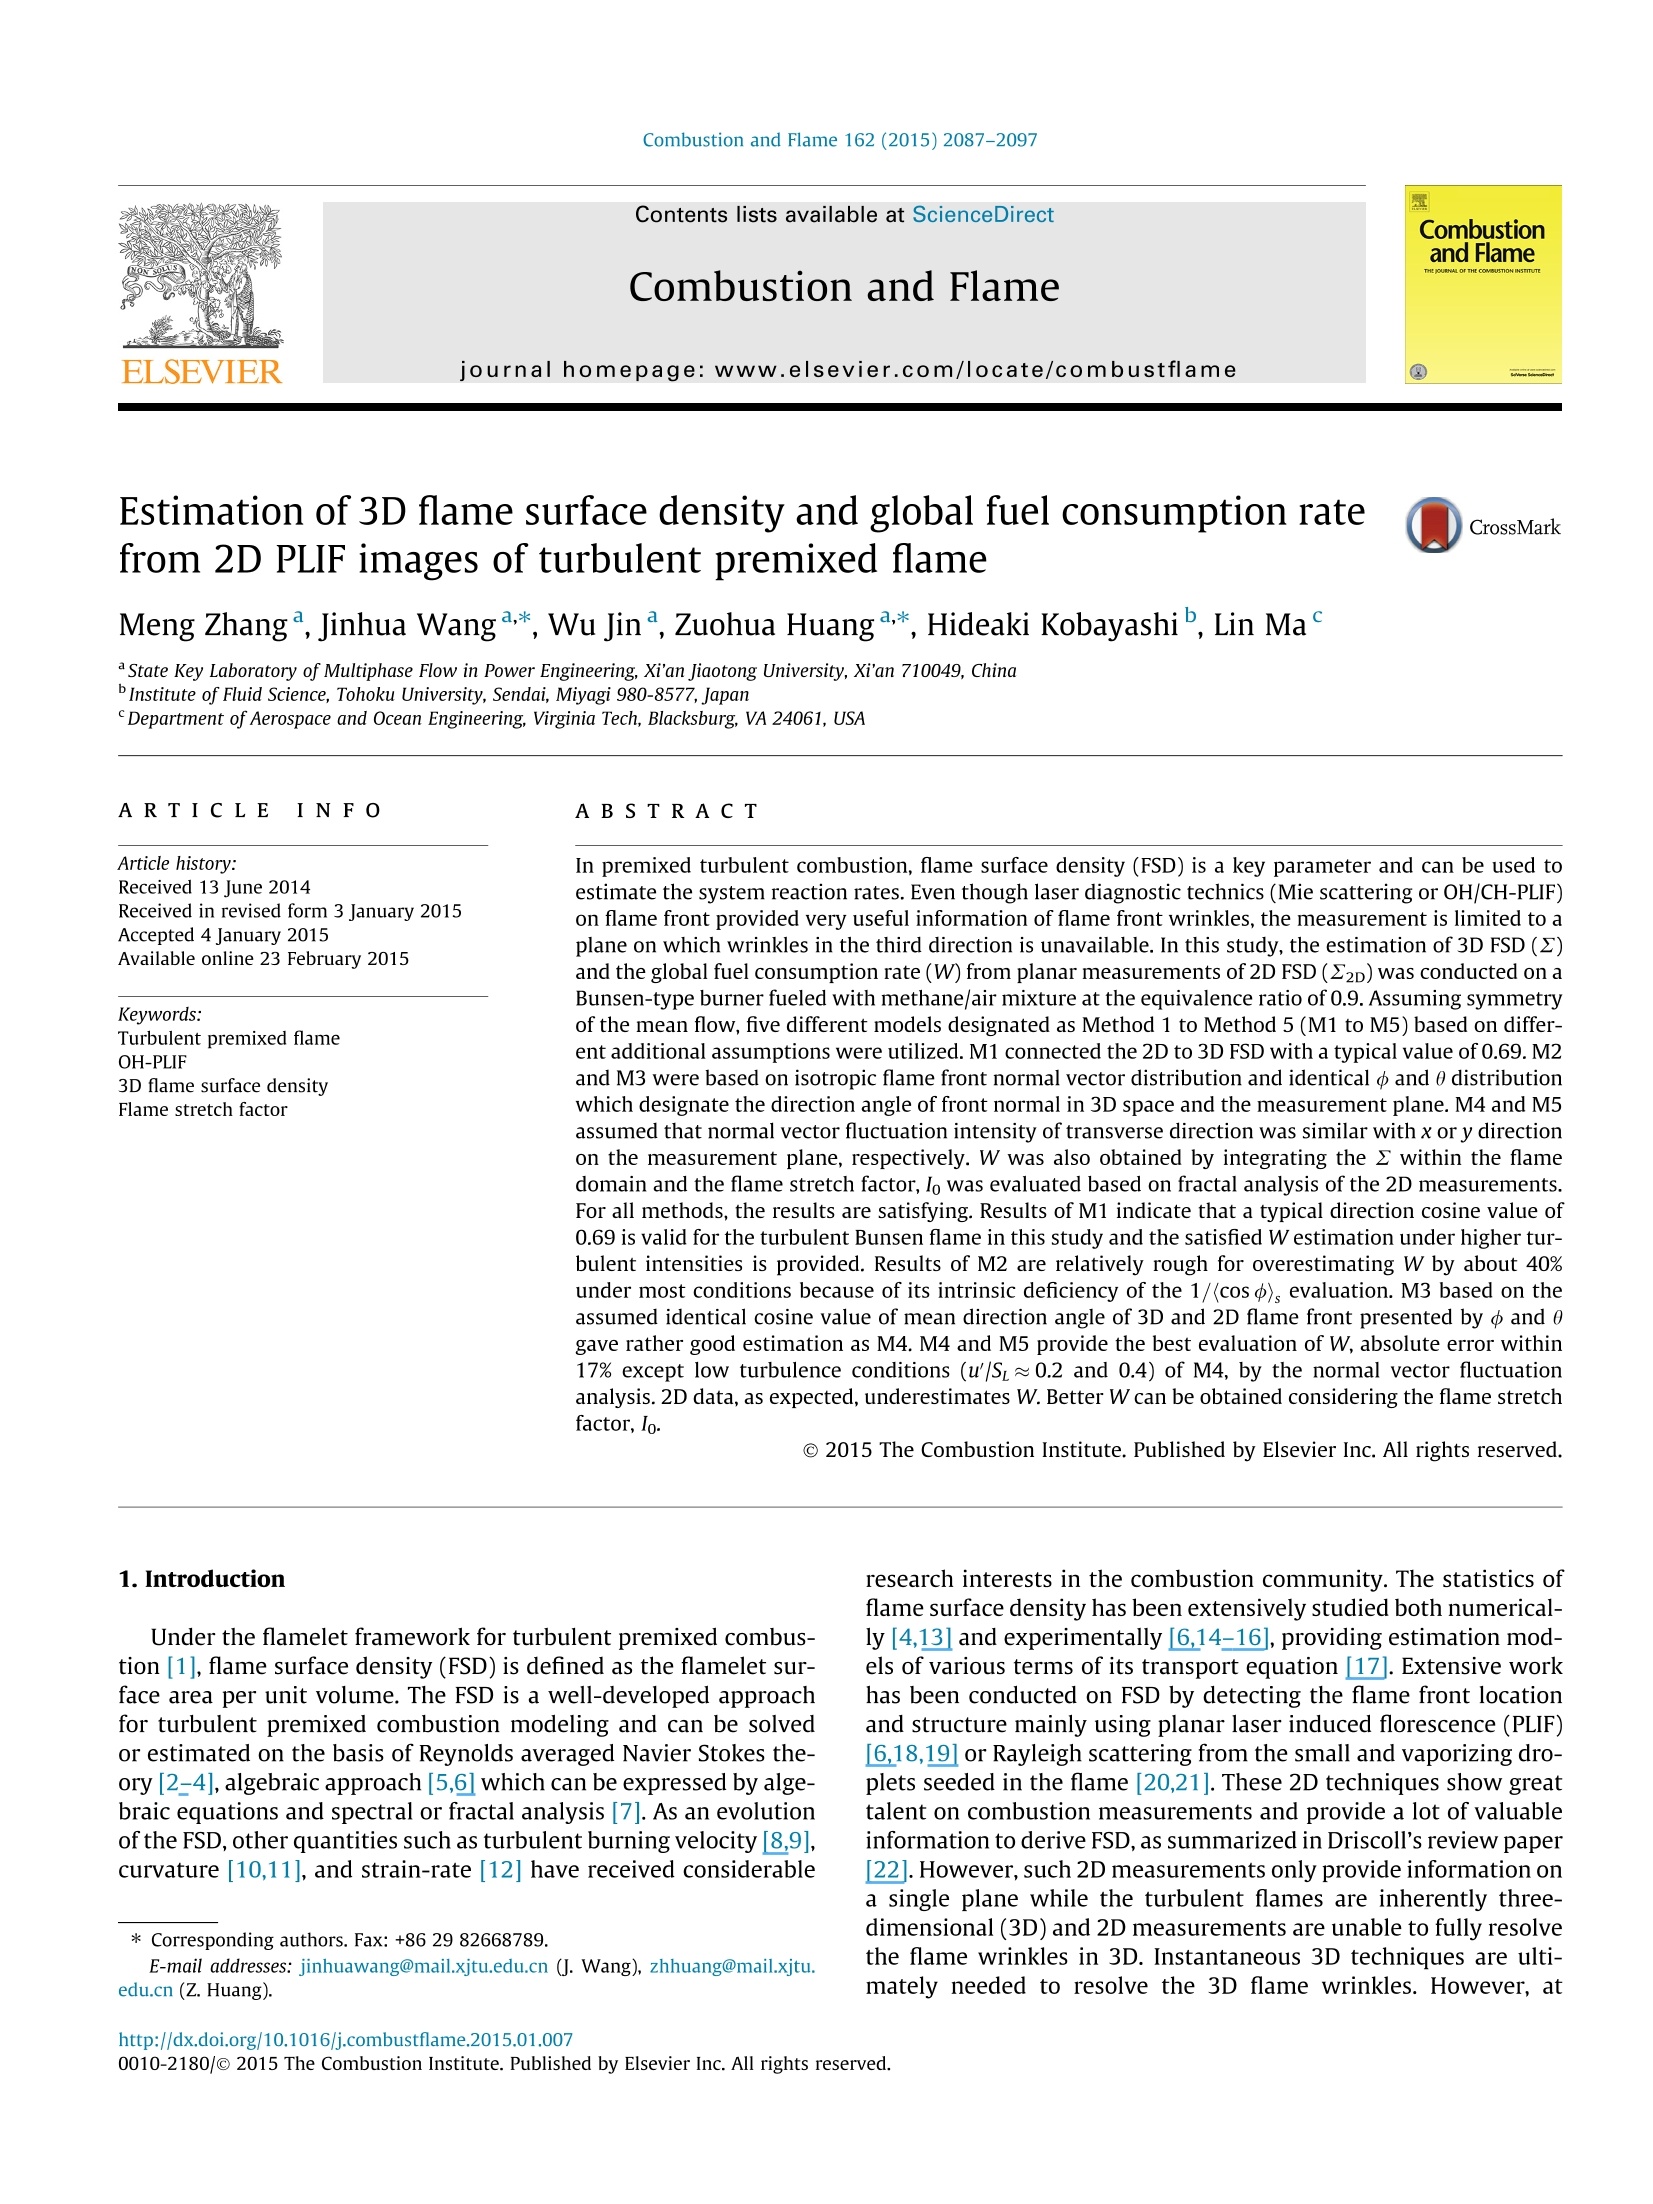
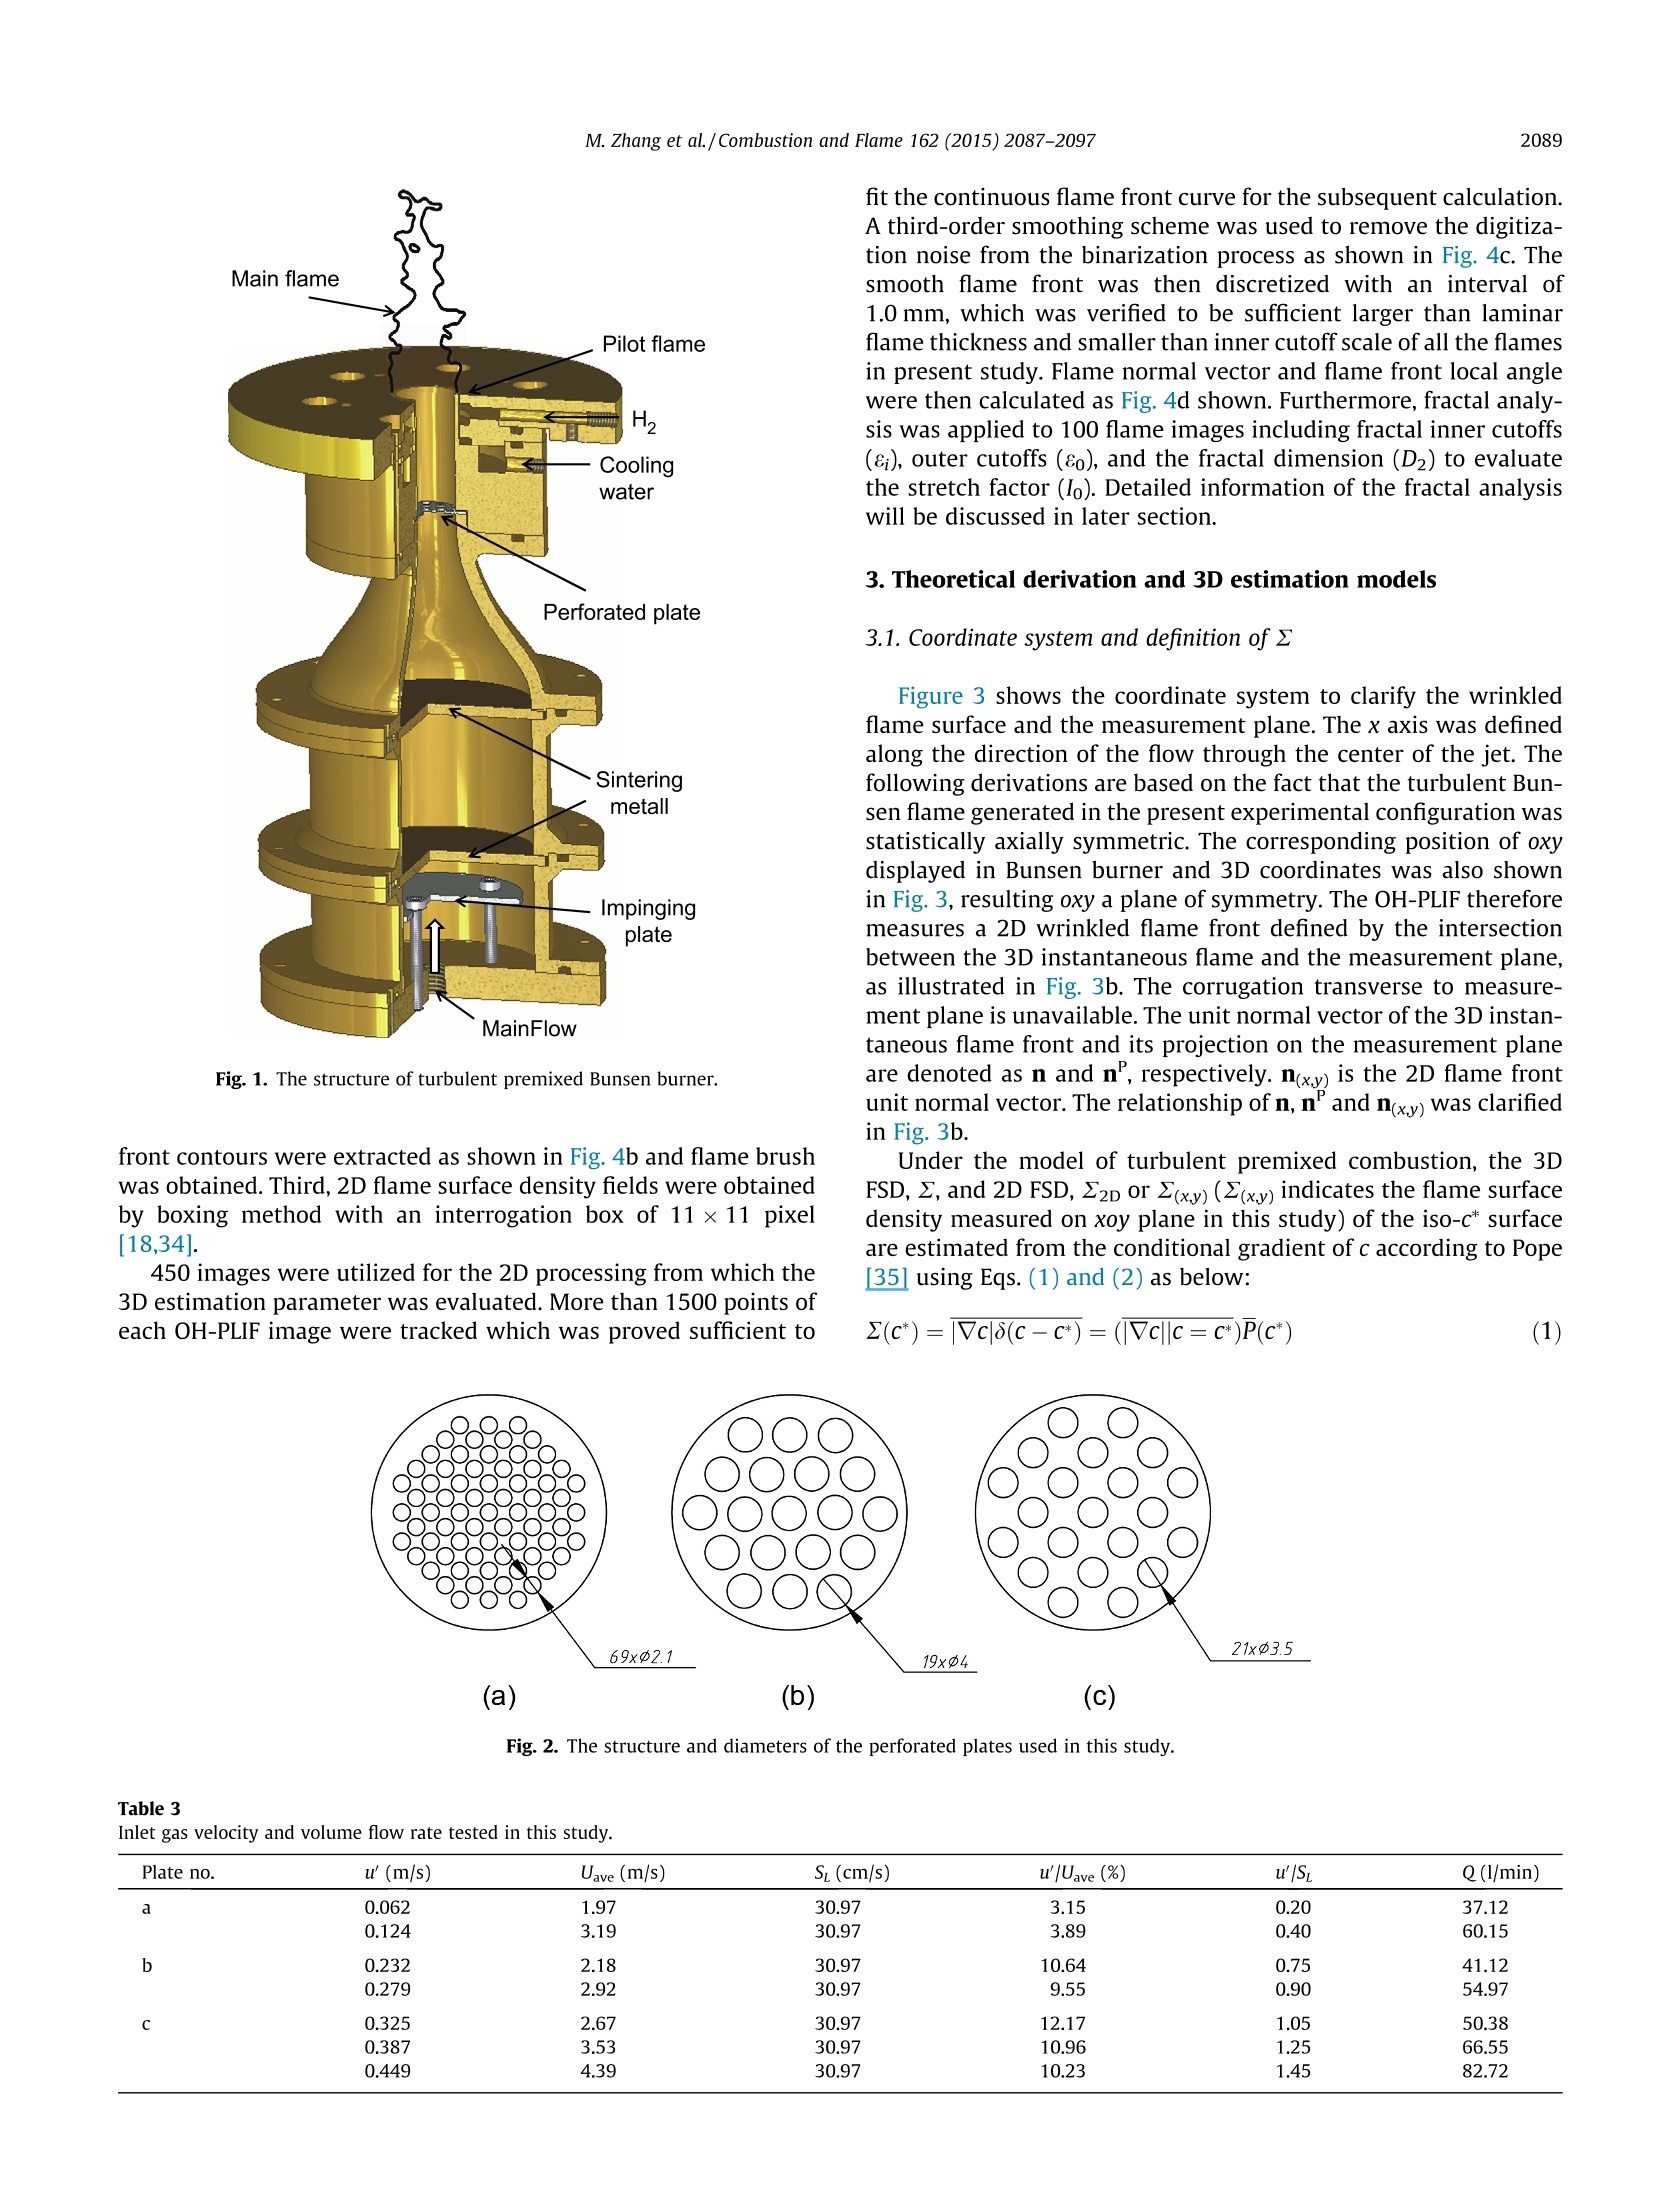
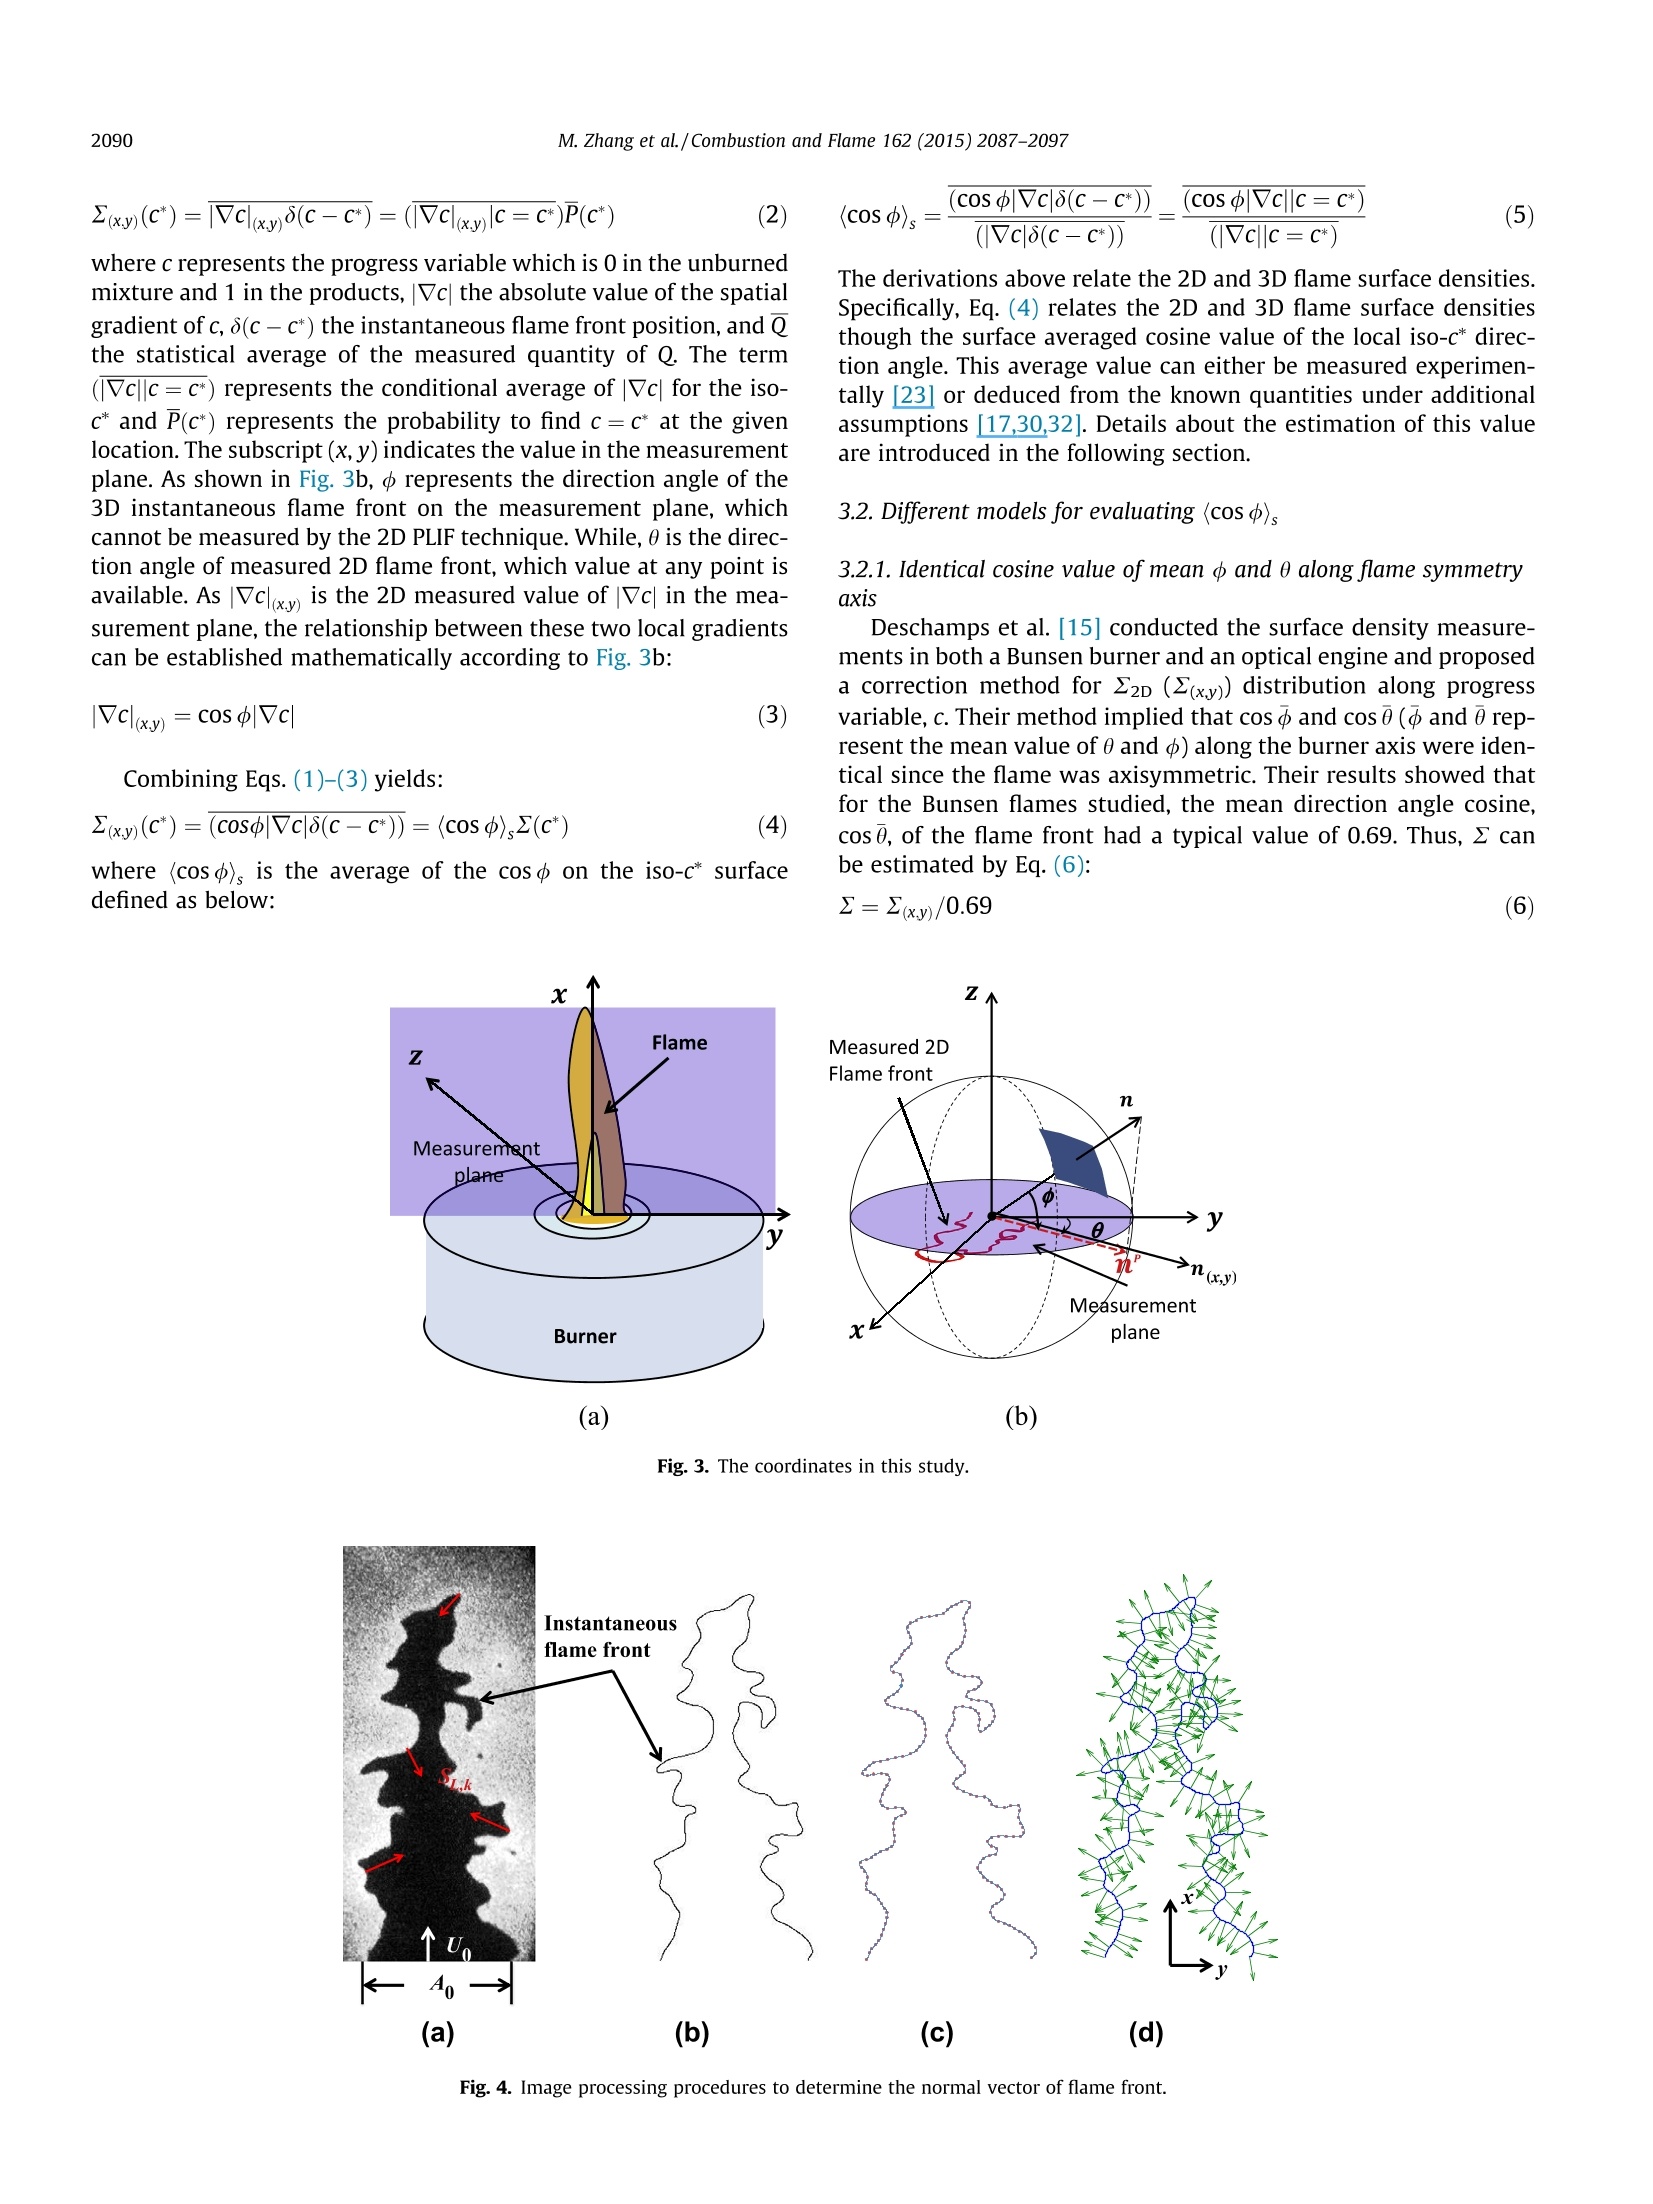
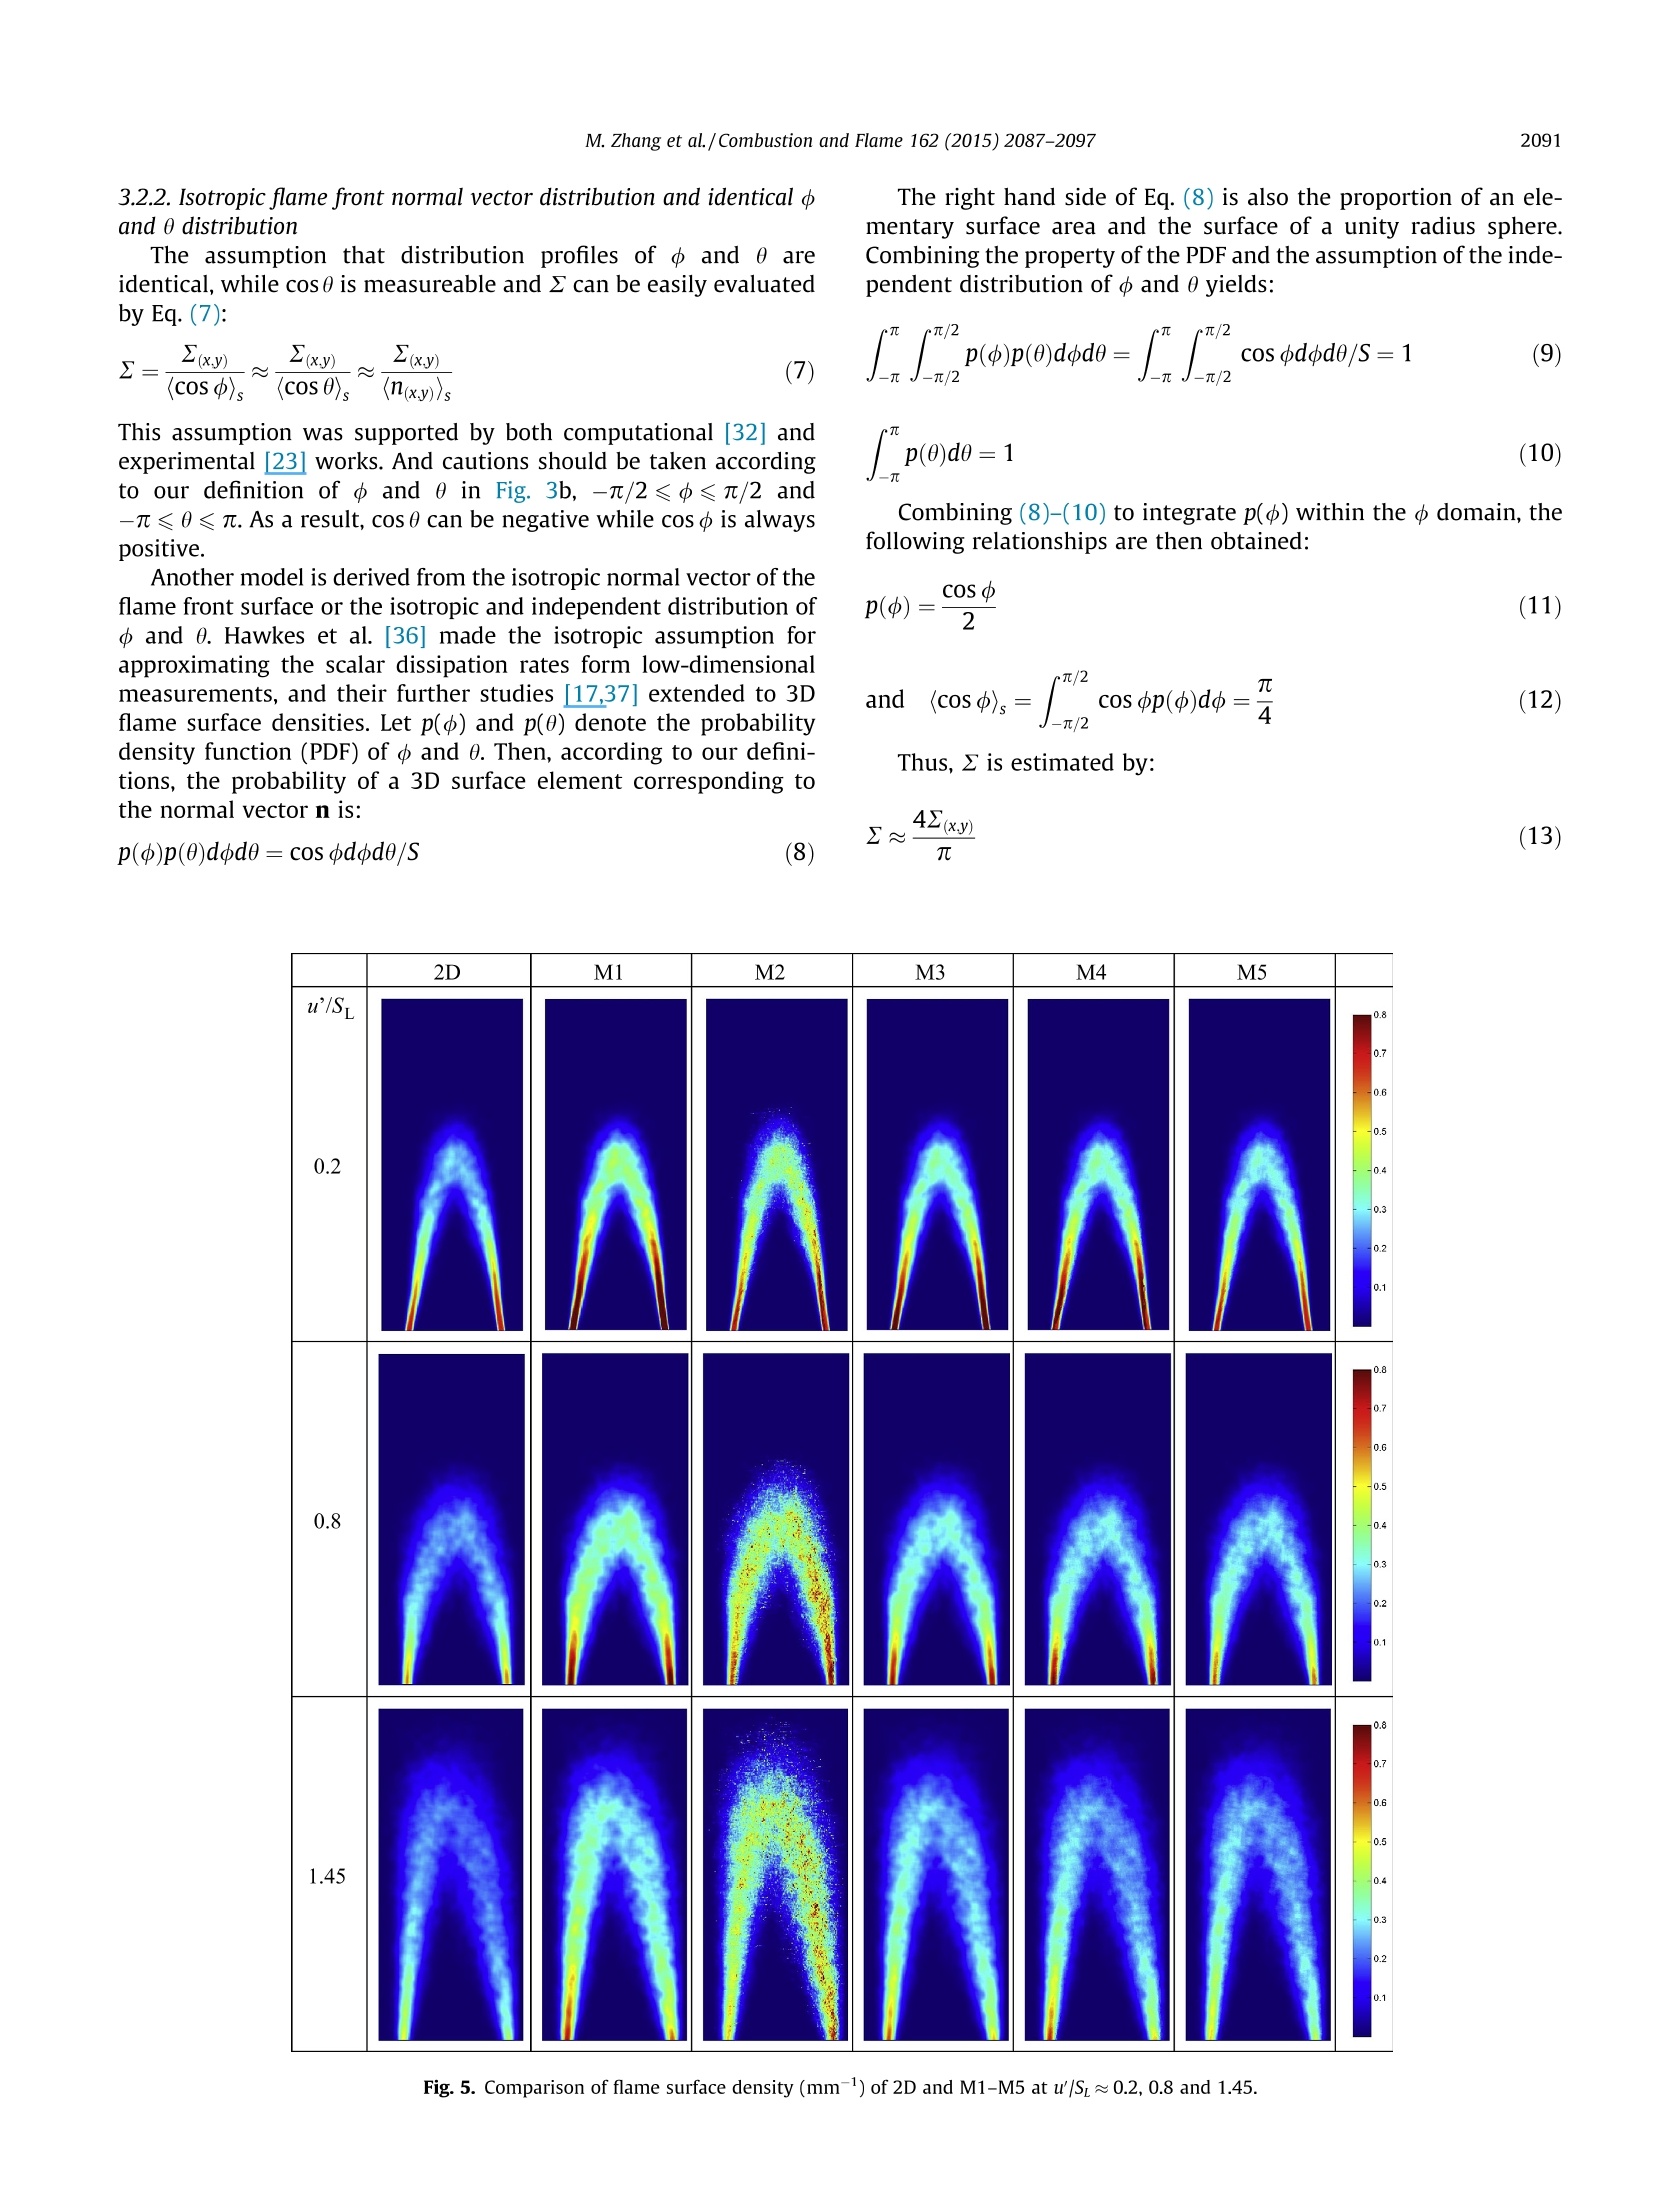
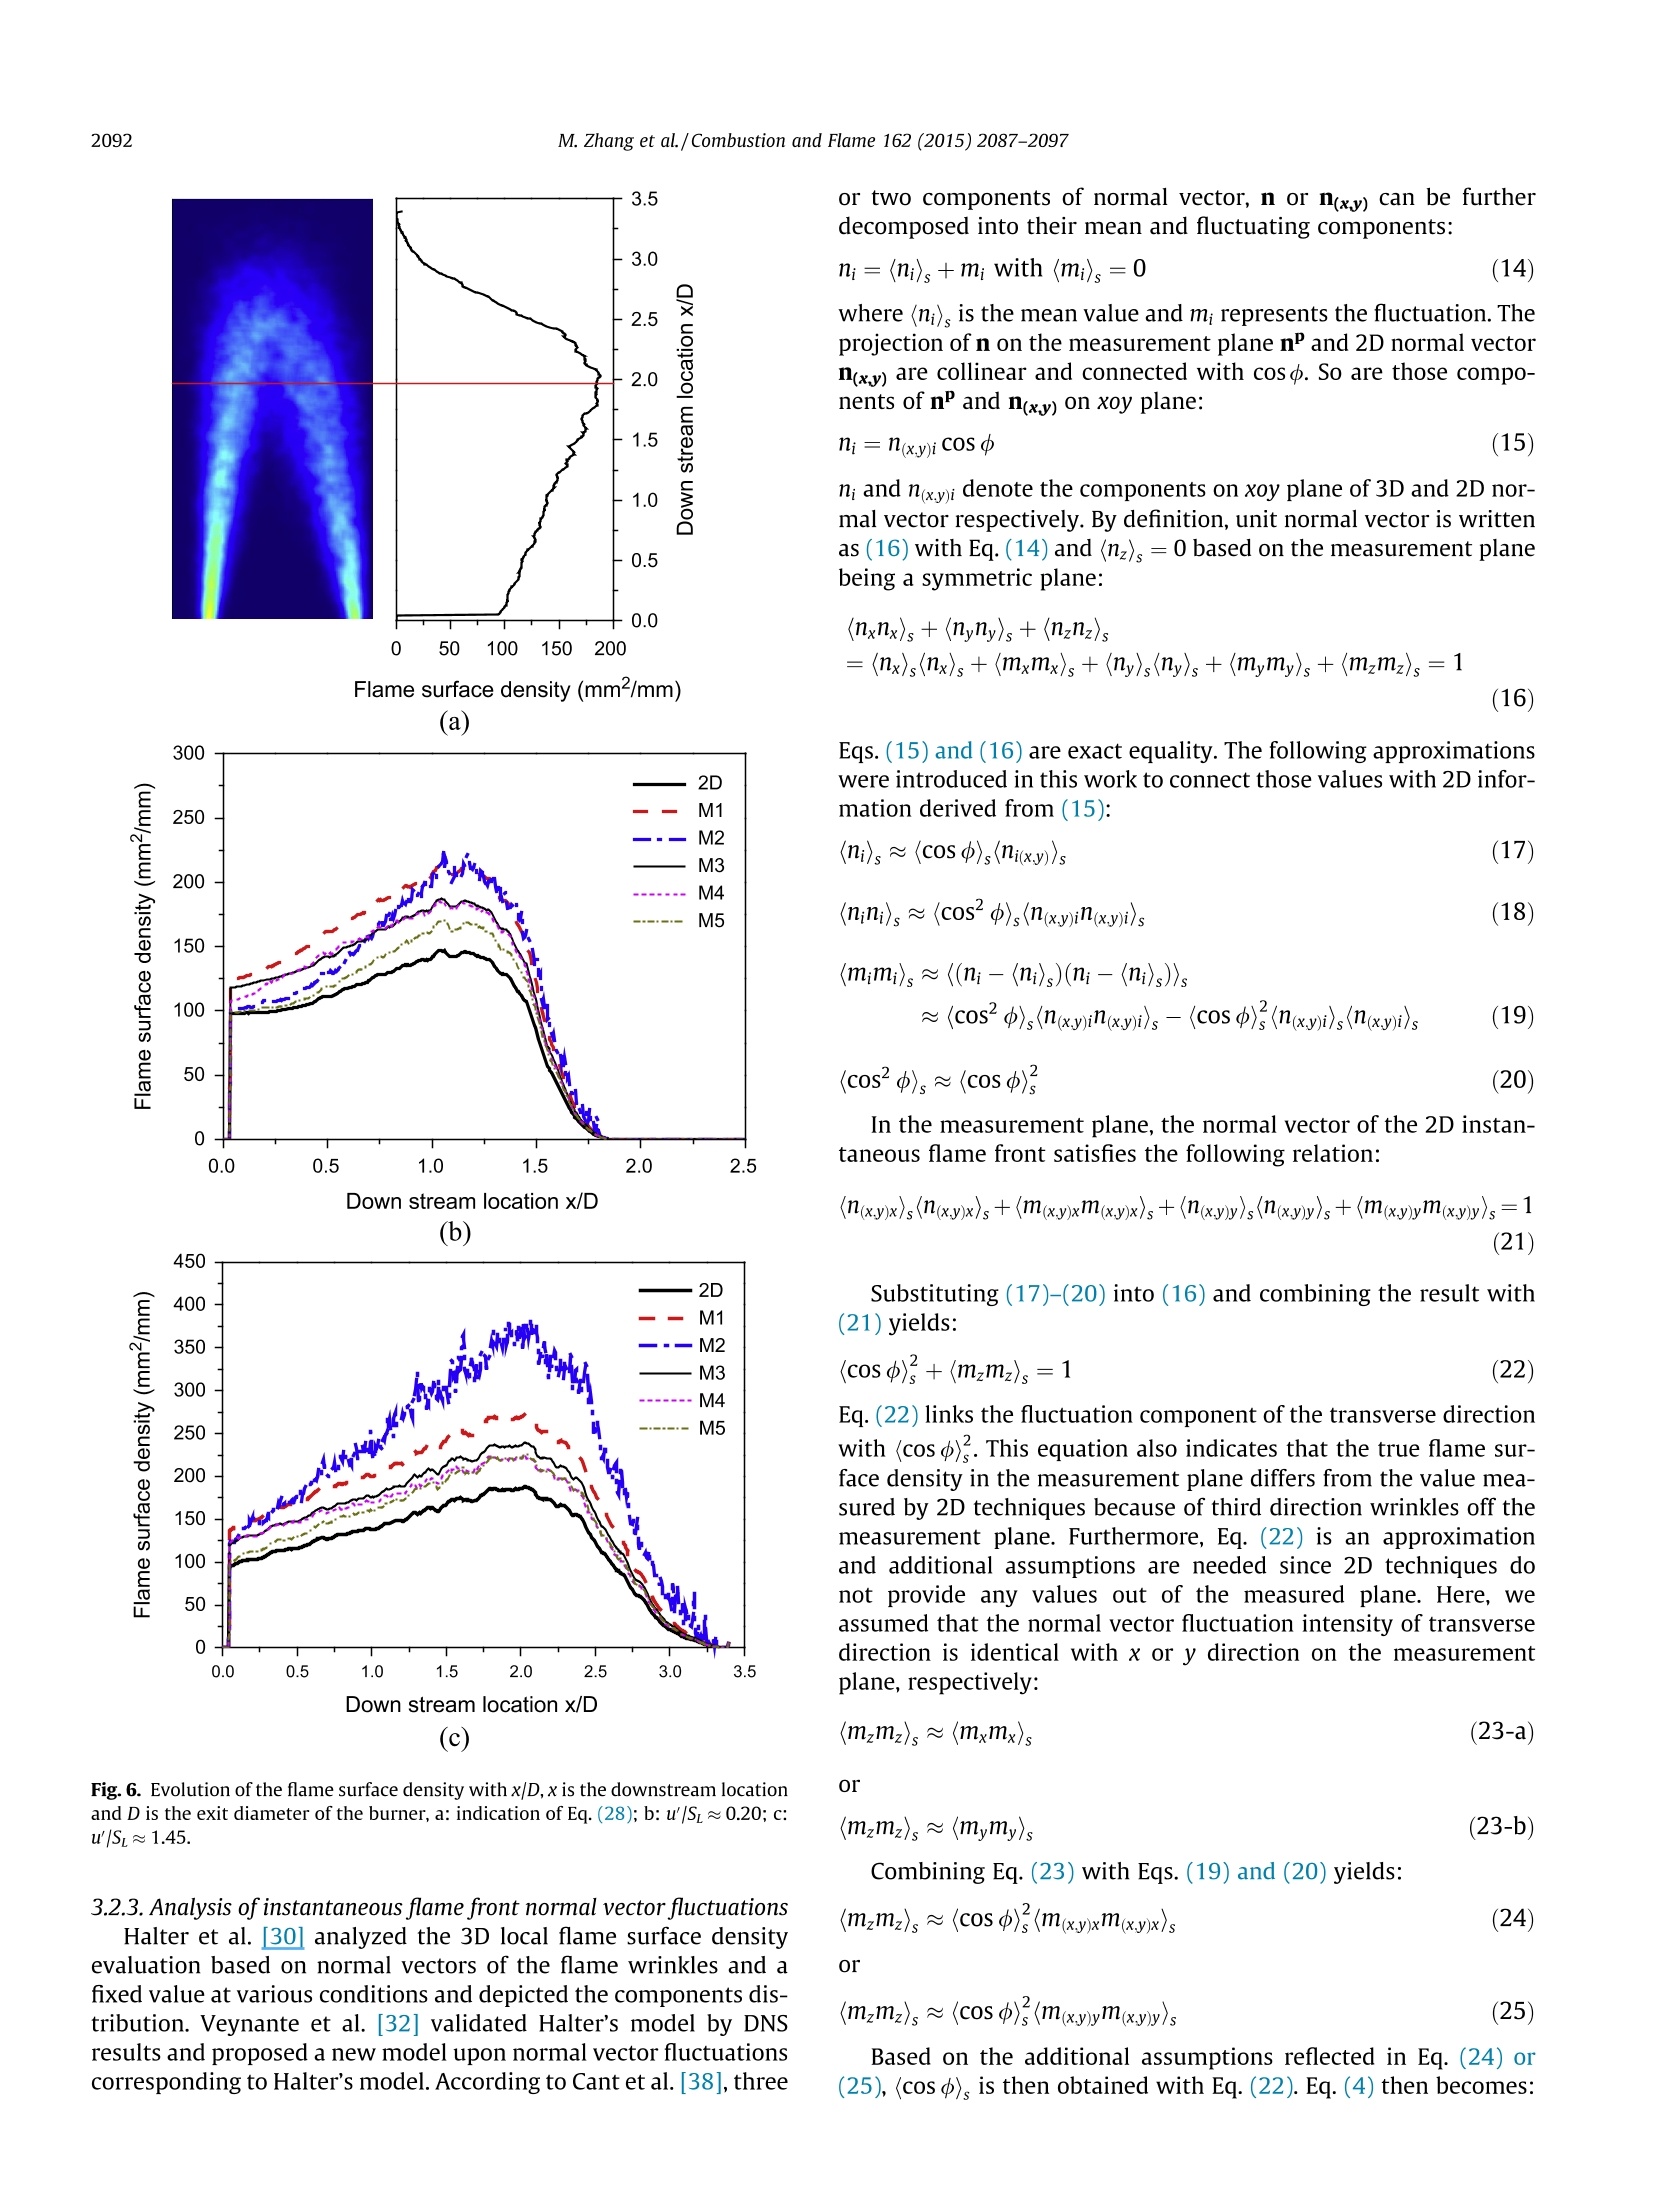
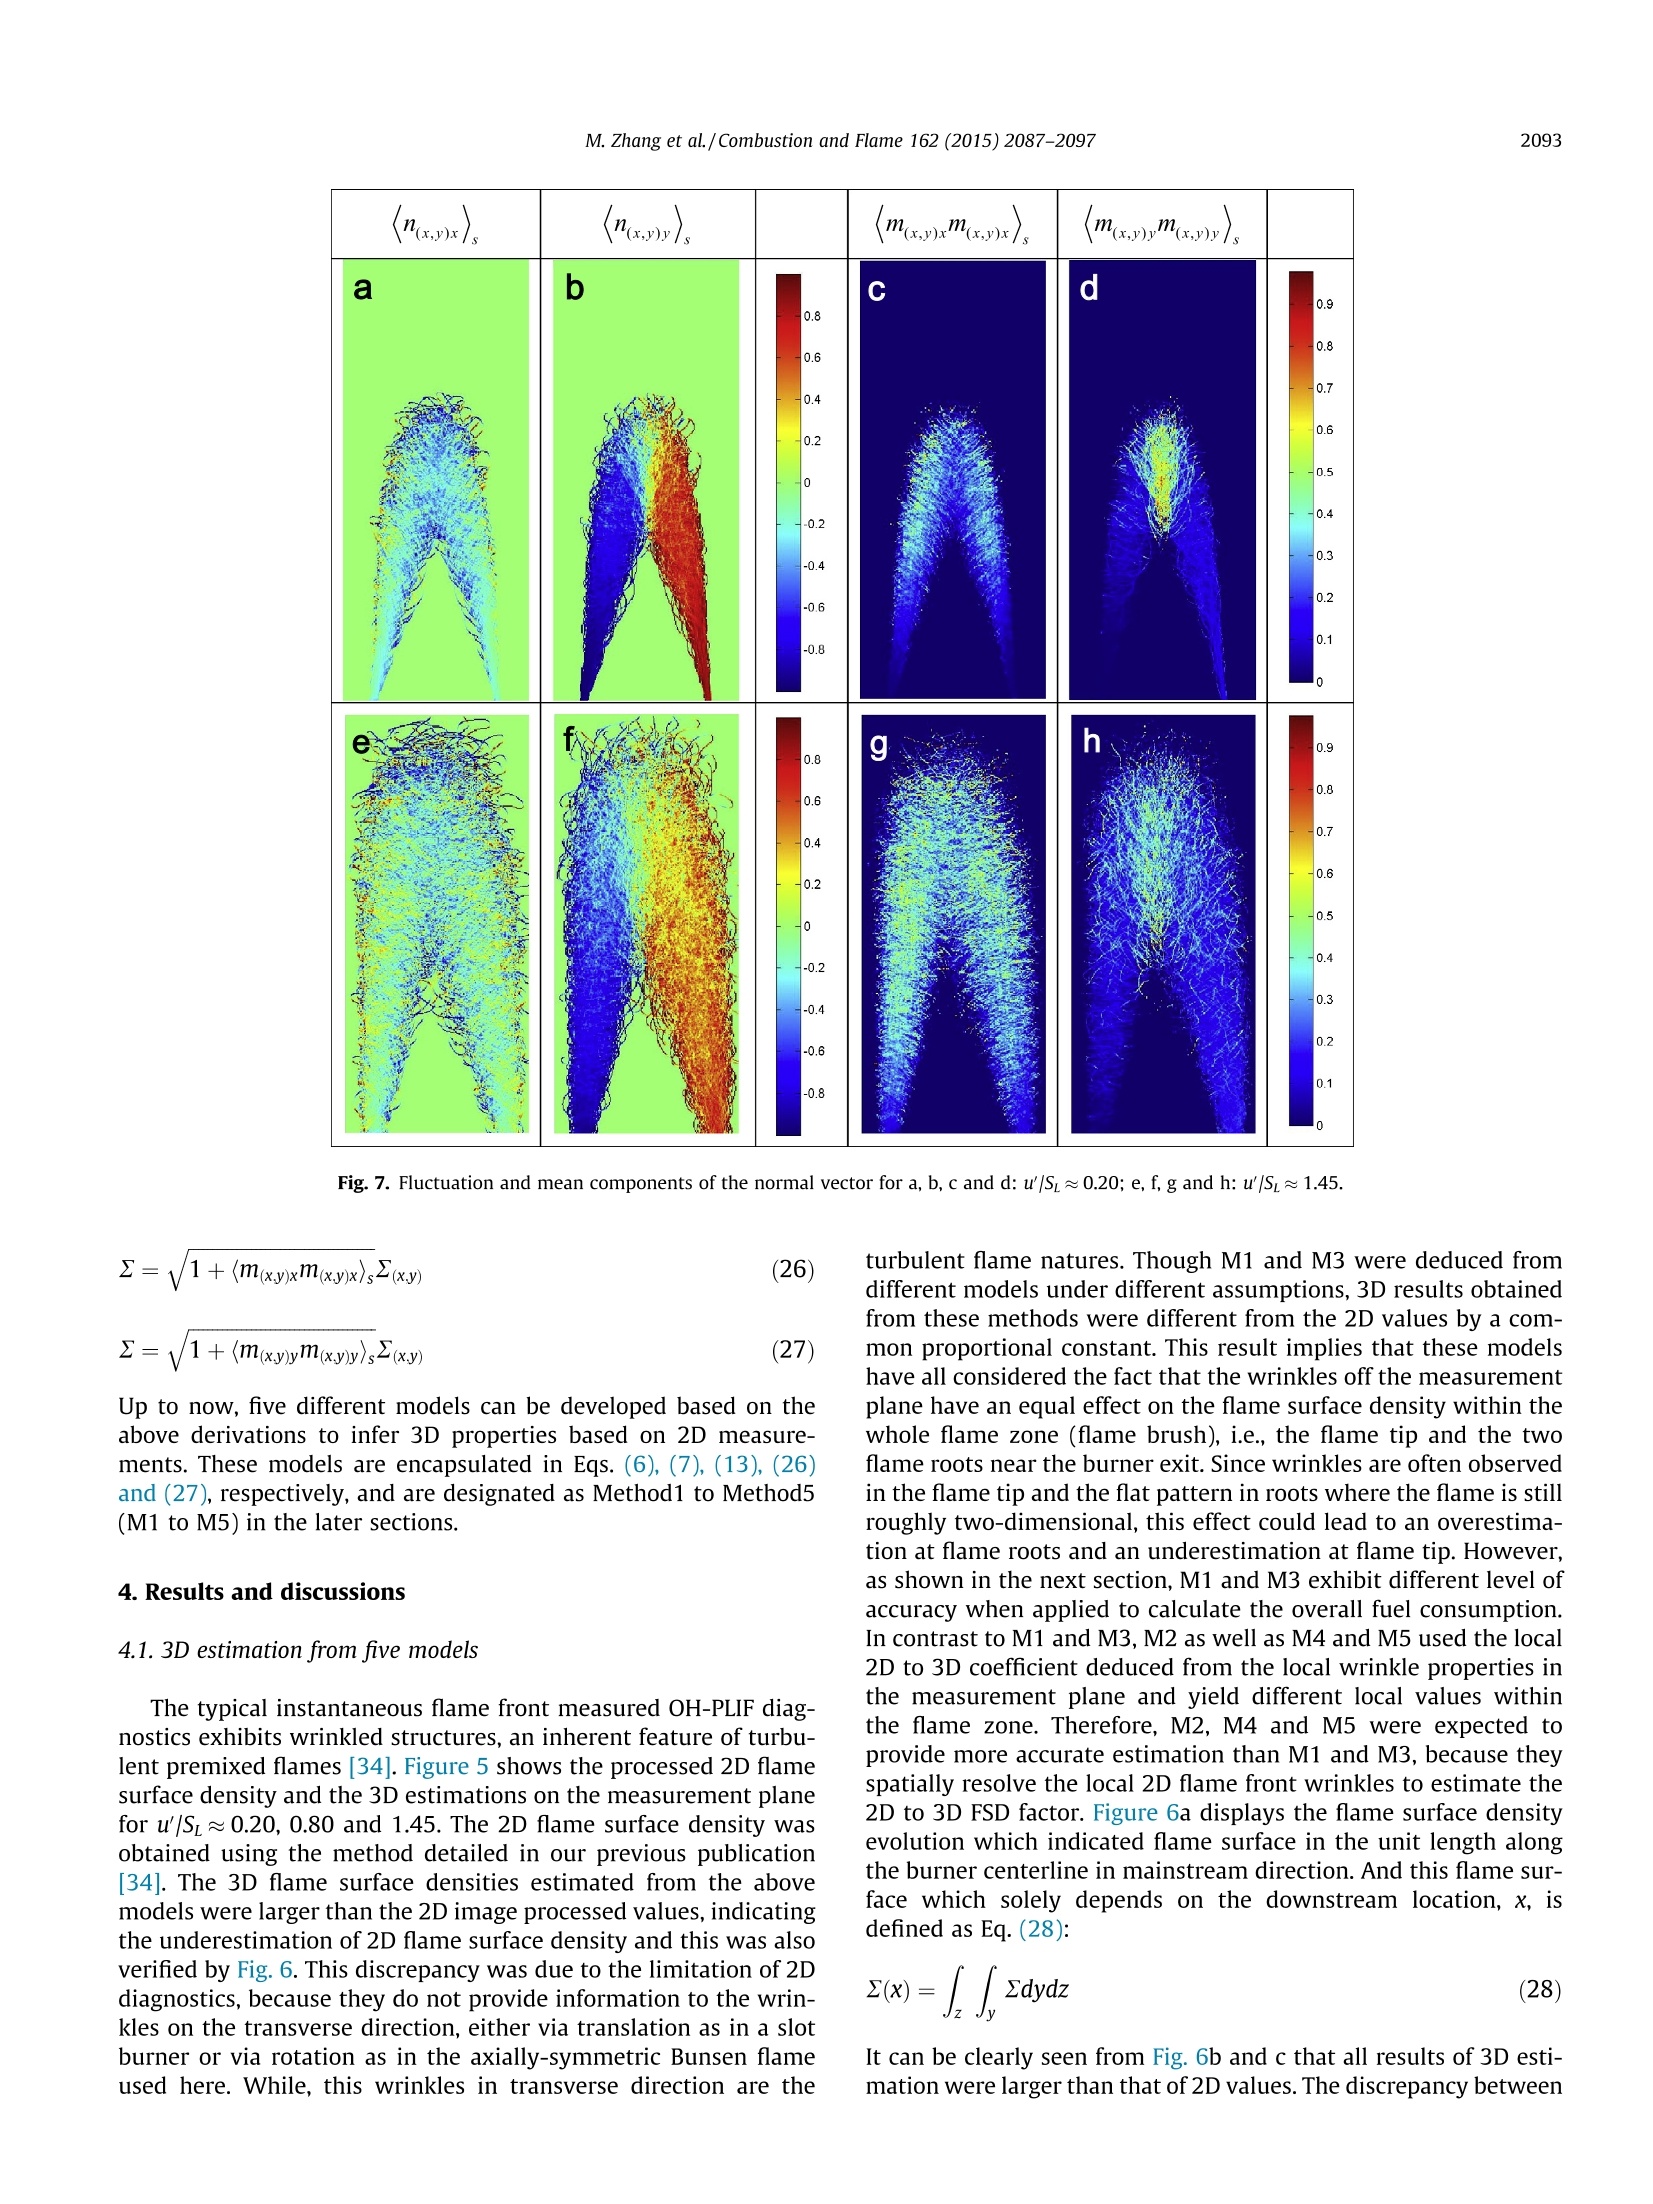
ResearchGateSee discussions,stats, and author profiles for this publication at: https://www.researchgate.net/publication/274714364 Combustion and Flame 162 (2015)2087-2097Contents lists available at ScienceDirectCombustion and Flame View publication stats Estimation of 3D flame surface density andglobal fuel consumption rate from 2D PLIFimages of turbulent premixed flame Article in Combustion and Flame· April 2015 DOI: 10.1016/j.combustflame.2015.01.007 READS CITATIONS6 85 6 authors,including: Zhang MengXi'an Jiaotong University Jinhua Wang Xi'an Jiaotong University 17 PUBLICATIONS 95 CITATIONS 39 PUBLICATIONS 777 CITATIONS SEE PROFILE SEE PROFILE Wu Jin Zuohua Huang Xi'an Jiaotong University Xi'an Jiaotong University 24 PUBLICATIONS 132 CITATIONS 499 PUBLICATIONS 7,037 CITATIONS SEE PROFILE SEE PROFILE ELSEVIER journal homepage : www.elsevier.com/locate/combustflame Estimation of 3D flame surface density and global fuel consumption ratefrom 2D PLIF images of turbulent premixed flame eng Zhang, Jinhua Wang a*, Wu jin, Zuohua Huang a*, Hideaki Kobayashi', Lin Ma State Key Laboratory ofMultiphase Flow in Power Engineering, Xi'an Jiaotong University, Xi'an 710049, China Institute of Fluid Science, Tohoku University, Sendai, Miyagi 980-8577, Japan Department of Aerospace and Ocean Engineering, Virginia Tech, Blacksburg, VA 24061, USA Article history: Received 13 June 2014Received in revised form 3 January 2015Accepted 4 January 2015 Available online 23 February 2015 Keywords: A BSTRACT In premixed turbulent combustion, flame surface density (FSD) is a key parameter and can be used toestimate the system reaction rates. Even though laser diagnostic technics (Mie scattering or OH/CH-PLIF)on flame front provided very useful information of flame front wrinkles, the measurement is limited to aplane on which wrinkles in the third direction is unavailable. In this study, the estimation of 3D FSD (2)and the global fuel consumption rate (W) from planar measurements of 2D FSD (Z2D) was conducted on aBunsen-type burner fueled with methane/air mixture at the equivalence ratio of 0.9. Assuming symmetryof the mean flow, five different models designated as Method 1 to Method 5 (M1 to M5) based on differ-ent additional assumptions were utilized. M1 connected the 2D to 3D FSD with a typical value of 0.69. M2and M3 were based on isotropic flame front normal vector distribution and identical o and 0 distributionwhich designate the direction angle of front normal in 3D space and the measurement plane. M4 and M5assumed that normal vector fluctuation intensity of transverse direction was similar with x or y directionon the measurement plane, respectively. W was also obtained by integrating the 2 within the flamedomain and the flame stretch factor, Io was evaluated based on fractal analysis of the 2D measurements.For all methods, the results are satisfying. Results of M1 indicate that a typical direction cosine value of0.69 is valid for the turbulent Bunsen flame in this study and the satisfied W estimation under higher tur-bulent intensities is provided.Results of M2 are relatively rough for overestimating W by about 40%under most conditions because of its intrinsic deficiency of the 1/(cos ), evaluation. M3 based on theassumed identical cosine value of mean direction angle of 3D and 2D flame front presented by d and 0gave rather good estimation as M4. M4 and M5 provide the best evaluation of W, absolute error within17% except low turbulence conditions (u'/Sz≈0.2 and 0.4) of M4, by the normal vector fluctuationanalysis. 2D data, as expected, underestimates W. Better W can be obtained considering the flame stretchfactor, Io. @ 2015 The Combustion Institute. Published by Elsevier Inc. All rights reserved. 1. Introduction Under the flamelet framework for turbulent premixed combus-tion [1], flame surface density (FSD) is defined as the flamelet sur-face area per unit volume. The FSD is a well-developed approachfor turbulent premixed combustion modeling and can be solvedor estimated on the basis of Reynolds averaged Navier Stokes the-ory[2-4],algebraic approach [5,6] which can be expressed by alge-braic equations and spectral or fractal analysis [7]. As an evolutionof the FSD, other quantities such as turbulent burning velocity [8,9],curvature [10,11], and strain-rate [12] have received considerable ( * C orresponding authors.Fax: +86 2 9 8 2 668789. ) ( E-mail a ddresses: jinhuawan g @mail . xjt u .edu.cn ( J . Wang), z hhua ng@ mail.xjtu. ed u .cn (Z. Huang). ) research interests in the combustion community. The statistics offlame surface density has been extensively studied both numerical-ly [4,13] and experimentally [6,14-16], providing estimation mod-els of various terms of its transport equation [17]. Extensive workhas been conducted on FSD by detecting the flame front locationand structure mainly using planar laser induced florescence (PLIF)[6,18,19] or Rayleigh scattering from the small and vaporizing dro-plets seeded in the flame [20,21]. These 2D techniques show greattalent on combustion measurements and provide a lot of valuableinformation to derive FSD, as summarized in Driscoll's review paper[22]. However, such 2D measurements only provide information ona single plane while the turbulent flames are inherently three-dimensional (3D) and 2D measurements are unable to fully resolvethe flame wrinkles in 3D. Instantaneous 3D techniques are ulti-mately needed to resolve the 3D flame wrinkles. However, at ( ht tp ://dx.doi.org/10 . 1 0 16/j.combustflam e .2015.01.007 0010-2180/O 20 1 5 The Combustion Institute. Published by Elsevier Inc. All rights res e rved. ) While these 3D techniques are still in development, it is impor-tant to analyze and understand the various assumptions invoked inthe interpretation of 2D planar measurements. For instance, thedetermination of 2D FSD from OH-PLIF images is typically basedon the assumption that the instantaneous corrugated flame frontis not wrinkled in the transverse or tangential direction normalto the measuring plane [11]. It is important to quantify the accura-cy and applicable range of correcting 22D (denotes the 2D FSDmeasured by planar techniques) to obtain statistics of FSD in 3D(2). The importance of such analysis also extends beyond the mea-surement of FSD itself. For example, once 2 is estimated, the globalfuel consumption rates (W), another critical concept in turbulentcombustion models, can be obtained by integrating the local burn-ing rate over the available flame surface. Based on the past work, the overall objective of this paper is toperform an experimental study of the relationship between themean statistics of 22D and 2. The specific objectives are to performcontrolled experiments to examine the following assumptionsinvoked in Veynante's methods [32]: (1) The flow is statistically2D, (2) the measurement plane is a plane of symmetry for themean flow, either in the translational or rotational sense, and (3)the flame front movements in the third direction are similar to thatof the measurement plane. Five models are proposed and analyzedto evaluate the 2 by considering unknown flame front wrinklingparameters embedded in the third dimension from known quanti-ties. Global fuel consumption rate was then obtained subsequently.Flame stretch effect on the local laminar flame speeds due to flowstrain or front curvature was taken into account to correct theglobal fuel consumption rate. The rest of the paper is organized as follows. Section 2 describesthe experimental setup and the flame conditions tested in thisstudy. Section 3 introduces the formulations of the correctionmethods. Section 4 presents the results and our observations.Lastly, Section 5 concludes the paper. 2.1. Experiment setup and the measurement The experimental setup is schematically shown and has beendetailed in Zhang et al. [33]. CH4/air mixture at equivalence ratioof 0.9 and various turbulent intensities was tested. The compo-nents and laminar flame parameters of the tested mixture areshown in Tables 1 and 2. A brief summary is provided here to facil-itate the discussion. The experimental apparatus included the airsupply system, the turbulent Bunsen burner, and the OH-PLIF sys-tem. Figure 1 shows the standard turbulent Bunsen burner with anaxially-symmetric copper nozzle with the diameter of 20 mm andwater cooling. An impinging plate and two pieces of sintering met-als were used to enhance the mixing of fuel and air and also to rec-tify the flow. Three kinds of perforated plates with different holearrangements and diameters, shown in Fig. 2, were installed40 mm upstream of the nozzle outlet to generate the turbulence.A H2 diffusion flame around the nozzle outlet served as a pilotflame to stabilize the turbulent flame. Different turbulence intensities(normalizedby theun-stretched laminar burning velocity) had been investigated andthe performed experimental condition matrix was shown inTable 3. Turbulence intensities were measured using a constant-temperature hot-wire anemometer (Dantec, Streamline 90N) atthe center and 1 mm above the burner outlet. The measurementswere performed at a sampling rate of 300 kHz for duration of 5 s.The turbulence intensity was then calculated under the assump-tion of Taylor's hypothesis, isotropy of the turbulence, and its lin-earity with respect to the velocity at the burner exit asdemonstrated in our previous research [33]. Figure 3 illustrates the position of the measurement plane rela-tive to the flame and the 3D coordinate system used in currentstudy. The instantaneous flame front structure was imaged byOH-PLIF, at an excitation wavelength of 282.769 nm. The laser sys-tem consists of an Nd:YAG laser (Quanta-Ray Pro-190), wavelengthof 355 nm, 10 Hz with 10 ns pulse duration and a dye laser (SirahPRSC-G-3000) with a frequency doubler to excite the Q1(8) lineof the A2Z←X2II(1,0) bands of OH at a the excitation wavelength.The OH fluorescence was detected byan ICCD camera through a UVlens (Nikon Rayfact PF 10545MF-UV) with intensified Relay Optics(LaVisionVC08-0094)andOH bandpassfilter(LaVisionVZ08-0222). The OH images were focused onto the CCD chip witha resolution of 800 ×600 pixels, with each pixel corresponding to136 um in the measurement plane. 2.2. Image processing method The image processing method is illustrated in Fig. 4. First, theOH-PLIF images were filtered to remove the pixel noise by applyinga 5 x5 median filter and then were binarized based on the his-togram of the intensity of the images, as Fig. 4a. Then, the flame Table 1 Components 中 XcH4 XN2 Xo2 CH4/air 0.85 0.082 0.725 0.193 Table 2Parameters of burner outlet and the fuel mixture. S (m/s) So (m²) po(kg/m’) Ma LM Leeff 8r(mm) 0.3097 0.000314 1.1118 3.81 0.25 0.96 0.066 Fig.1. The structure of turbulent premixed Bunsen burner. front contours were extracted as shown in Fig. 4b and flame brushwas obtained. Third, 2D flame surface density fields were obtainedby boxing method with an interrogation box of 11 ×11 pixel[18,34]. 450 images were utilized for the 2D processing from which the3D estimation parameter was evaluated. More than 1500 points ofeach OH-PLIF image were tracked which was proved sufficient to fit the continuous flame front curve for the subsequent calculation.A third-order smoothing scheme was used to remove the digitiza-tion noise from the binarization process as shown in Fig. 4c. Thesmooth flame front was then discretized with an interval of1.0 mm, which was verified to be sufficient larger than laminarflame thickness and smaller than inner cutoff scale of all the flamesin present study. Flame normal vector and flame front local anglewere then calculated as Fig. 4d shown. Furthermore, fractal analy-sis was applied to 100 flame images including fractal inner cutoffs(8;), outer cutoffs (8o), and the fractal dimension (D2) to evaluatethe stretch factor (Io). Detailed information of the fractal analysiswill be discussed in later section. 3. Theoretical derivation and 3D estimation models 3.1. Coordinate system and definition of 2 Figure 3 shows the coordinate system to clarify the wrinkledflame surface and the measurement plane. The x axis was definedalong the direction of the flow through the center of the jet. Thefollowing derivations are based on the fact that the turbulent Bun-sen flame generated in the present experimental configuration wasstatistically axially symmetric. The corresponding position of oxydisplayed in Bunsen burner and 3D coordinates was also shownin Fig. 3, resulting oxy a plane of symmetry. The OH-PLIF thereforemeasures a 2D wrinkled flame front defined by the intersectionbetween the 3D instantaneous flame and the measurement plane,as illustrated in Fig. 3b. The corrugation transverse to measure-ment plane is unavailable. The unit normal vector of the 3D instan-taneous flame front and its projection on the measurement planeare denoted as n and n', respectively. n(xy) is the 2D flame frontunit normal vector. The relationship of n, n and n(xy) was clarifiedin Fig. 3b. Under the model of turbulent premixed combustion, the 3DFSD, Z, and 2D FSD, Z2D or 2(xy)(2(xy) indicates the flame surfacedensity measured on xoy plane in this study) of the iso-c* surfaceare estimated from the conditional gradient ofc according to Pope[35] using Eqs. (1) and(2) as below: Fig. 2. The structure and diameters of the perforated plates used in this study. Table 3Inlet gas velocity and volume flow rate tested in this study. Plate no. u' (m/s) Uave (m/s) SL (cm/s) u'/Uave (%) u'/SL Q (1/min) a 0.062 1.97 30.97 3.15 0.20 37.12 0.124 3.19 30.97 3.89 0.40 60.15 b 0.232 2.18 30.97 10.64 0.75 41.12 0.279 2.92 30.97 9.55 0.90 54.97 c 0.325 2.67 30.97 12.17 1.05 50.38 0.387 3.53 30.97 10.96 1.25 66.55 0.449 4.39 30.97 10.23 1.45 82.72 where c represents the progress variable which is 0 in the unburnedmixture and 1 in the products, |Vc| the absolute value of the spatialgradient of c, 8(c - c*) the instantaneous flame front position, and Qthe statistical average of the measured quantity of Q. The term(|Vc||c= c*) represents the conditional average of |Vc| for the iso-c* and P(c*) represents the probability to find c= c* at the givenlocation. The subscript (x,y)indicates the value in the measurementplane. As shown in Fig. 3b, o represents the direction angle of the3D instantaneous flame front on the measurement plane, whichcannot be measured by the 2D PLIF technique. While, 0 is the direc-tion angle of measured 2D flame front, which value at any point isavailable. As |Vclxy is the 2D measured value of |Vc| in the mea-surement plane, the relationship between these two local gradientscan be established mathematically according to Fig. 3b: where (cos ), is the average of the cos d on the iso-c* surfacedefined as below: Fig. 3. The coordinates in this study. Fig. 4. Image processing procedures to determine the normal vector of flame front. 3.2.2. Isotropic flame front normal vector distribution and identical oand 0 distribution The assumption that distribution profiles of o and 0 areidentical, while cos 0 is measureable and 2 can be easily evaluatedby Eq.(7): This assumption was supported by both computational [32] andexperimental [23] works. And cautions should be taken accordingto our definition of and 0 in Fig. 3b, -n/2<中
确定


还剩10页未读,是否继续阅读?

产品配置单


北京欧兰科技发展有限公司为您提供《火焰中全局燃料消耗速率检测方案(粒子图像测速)》,该方案主要用于其他中全局燃料消耗速率检测,参考标准--,《火焰中全局燃料消耗速率检测方案(粒子图像测速)》用到的仪器有德国LaVision PIV/PLIF粒子成像测速场仪、PLIF平面激光诱导荧光火焰燃烧检测系统
推荐专场


相关方案
更多
该厂商其他方案
更多