


基于流动特性的26种常用饲料原料的分类Classification of commonly used feed ingredients based on flow properties
方案详情

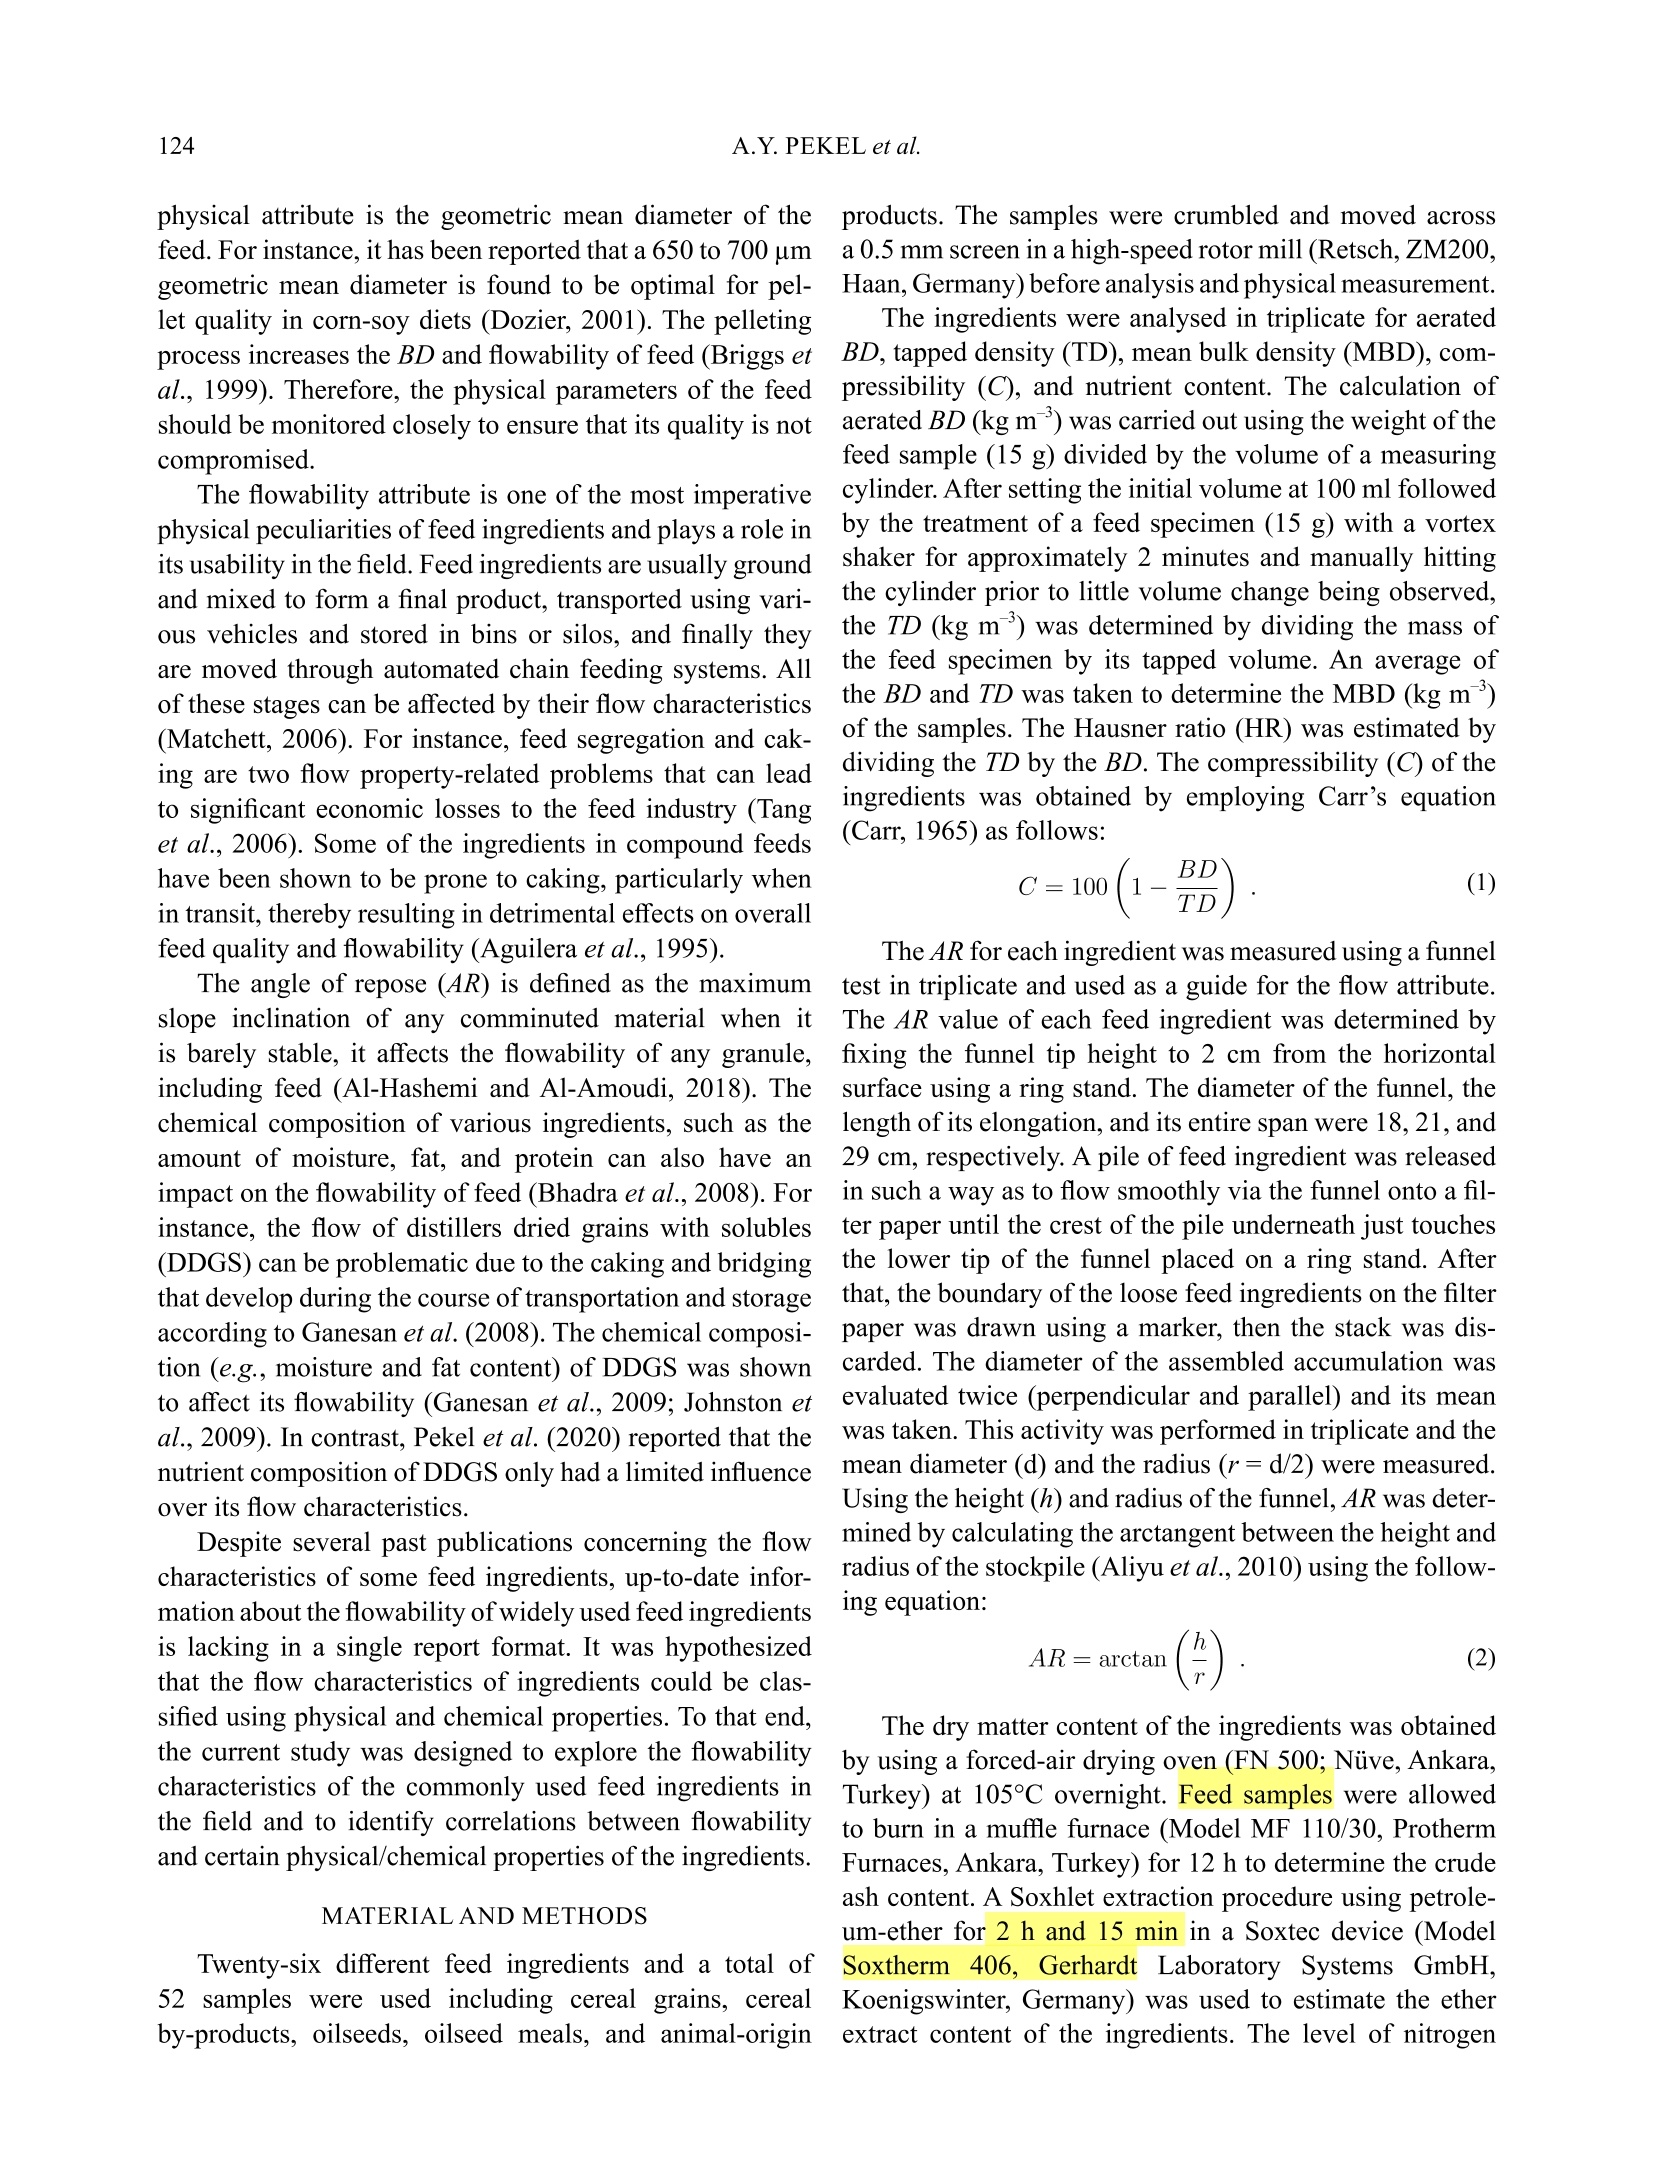
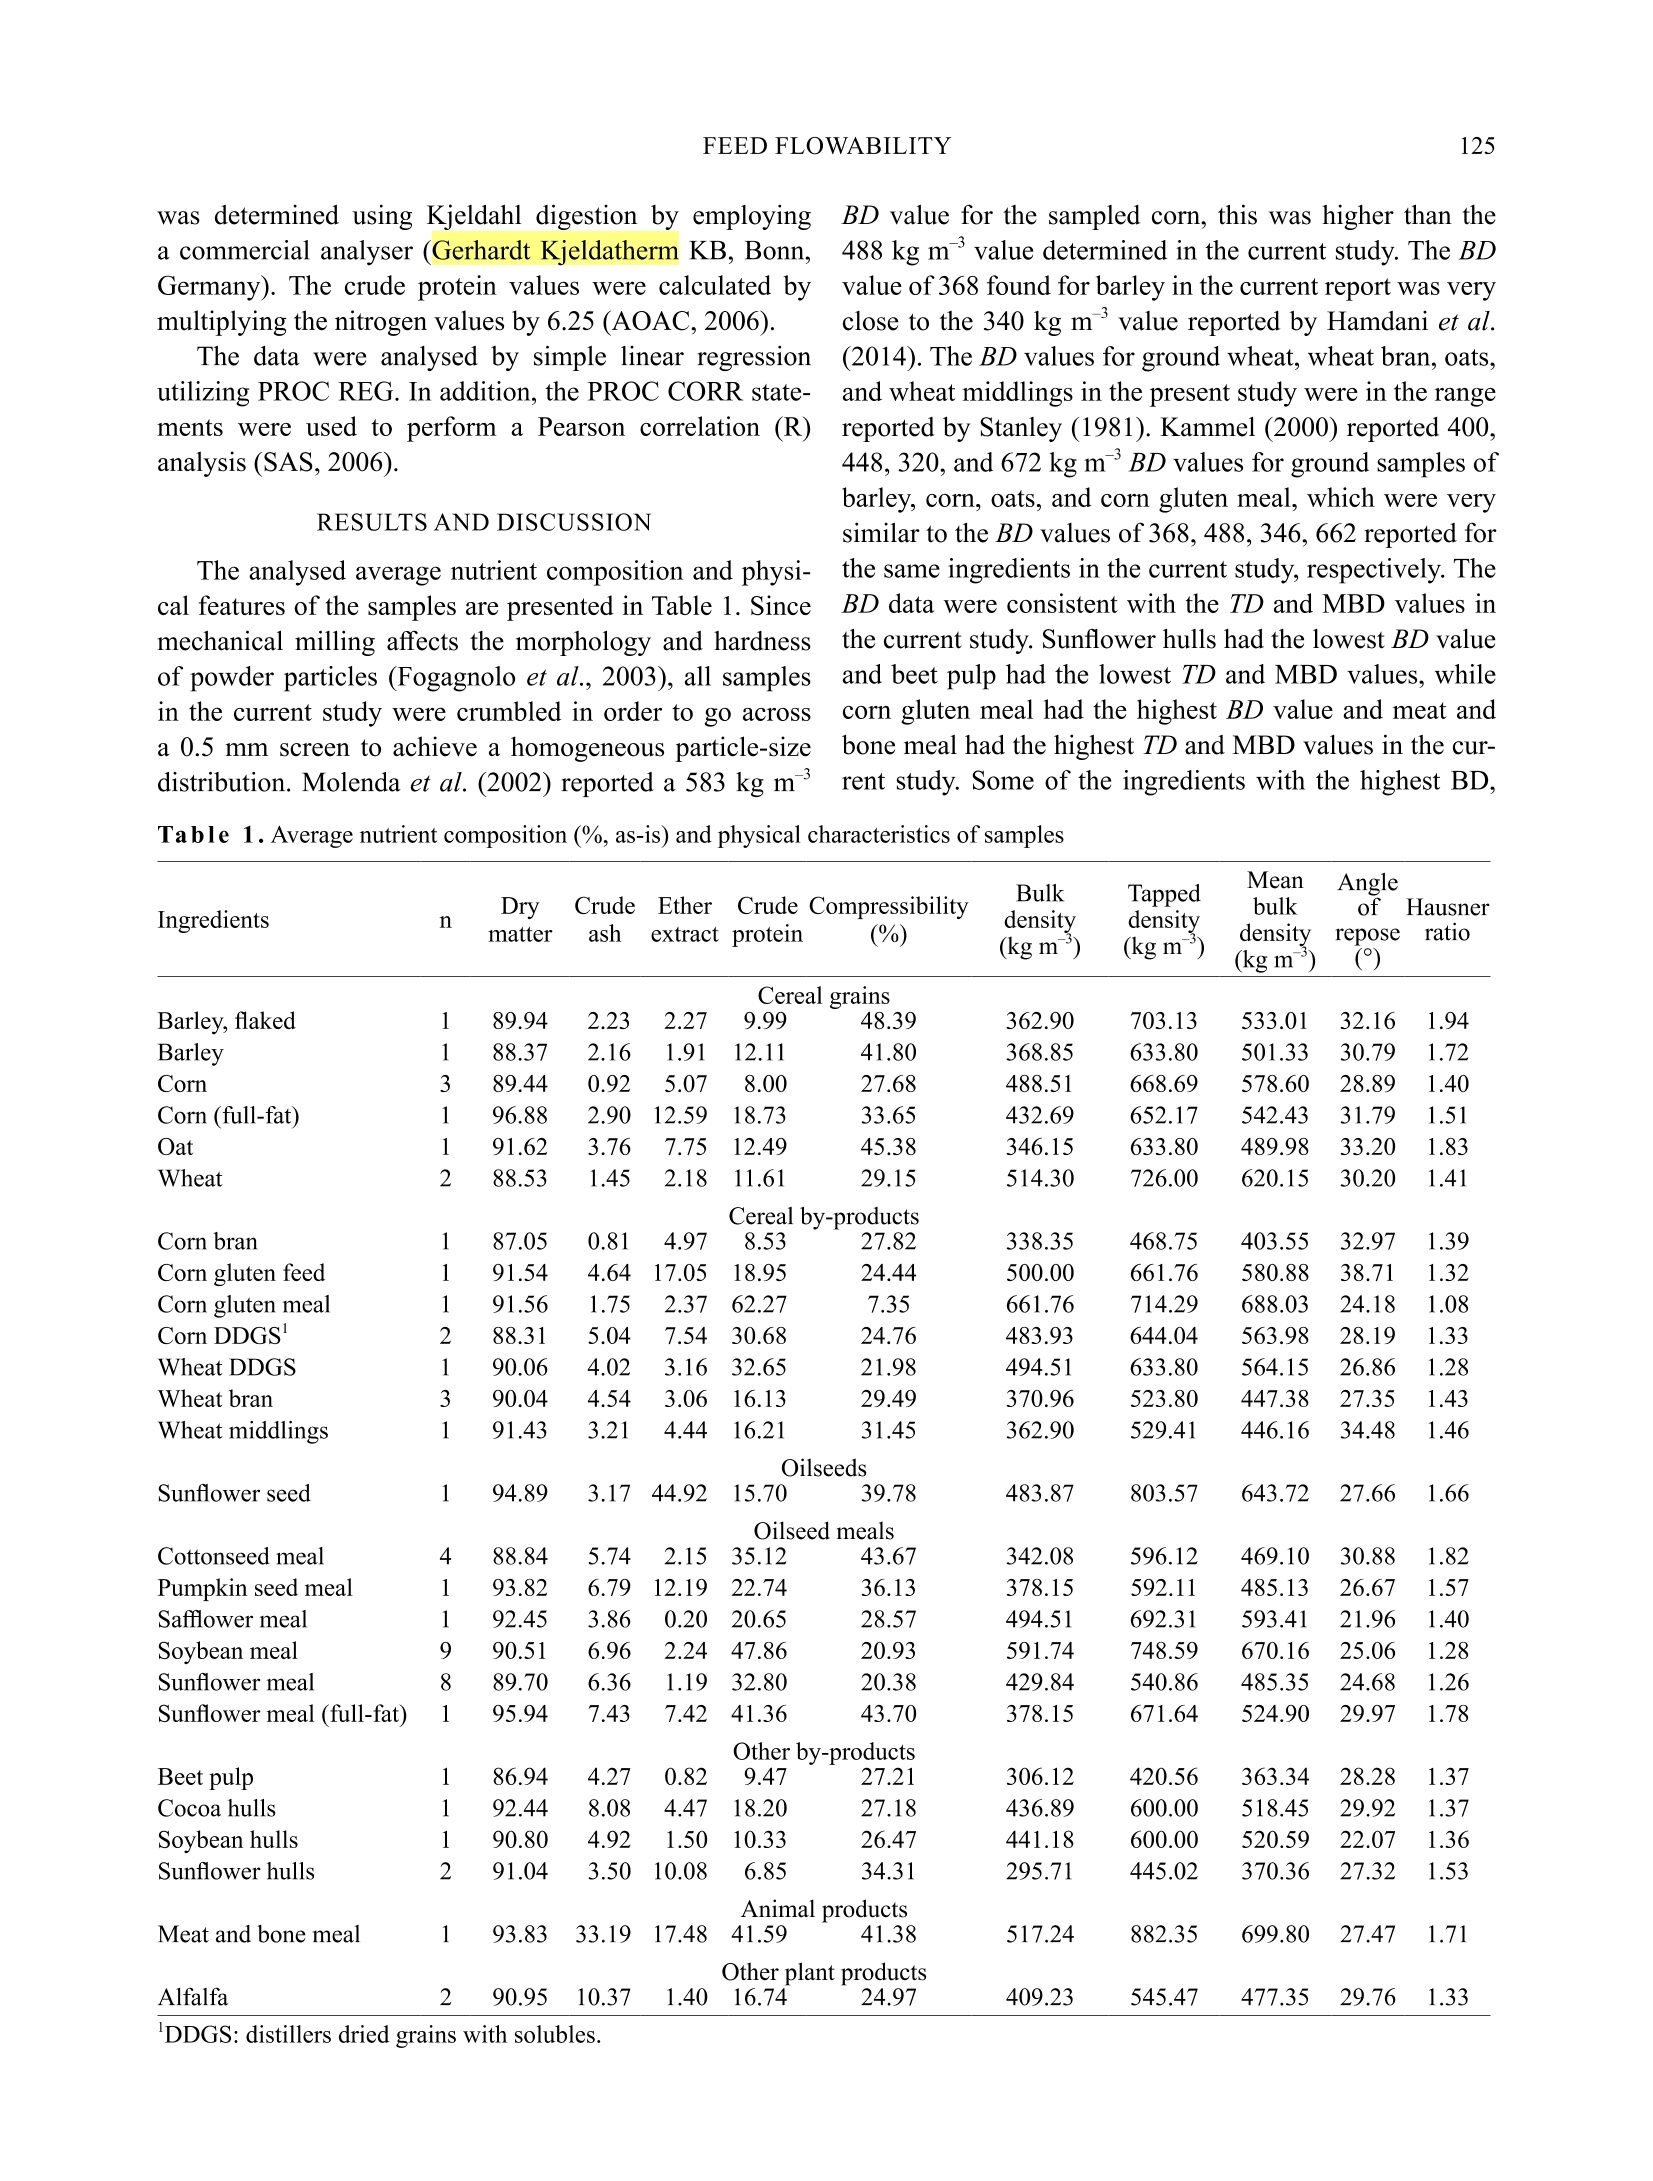
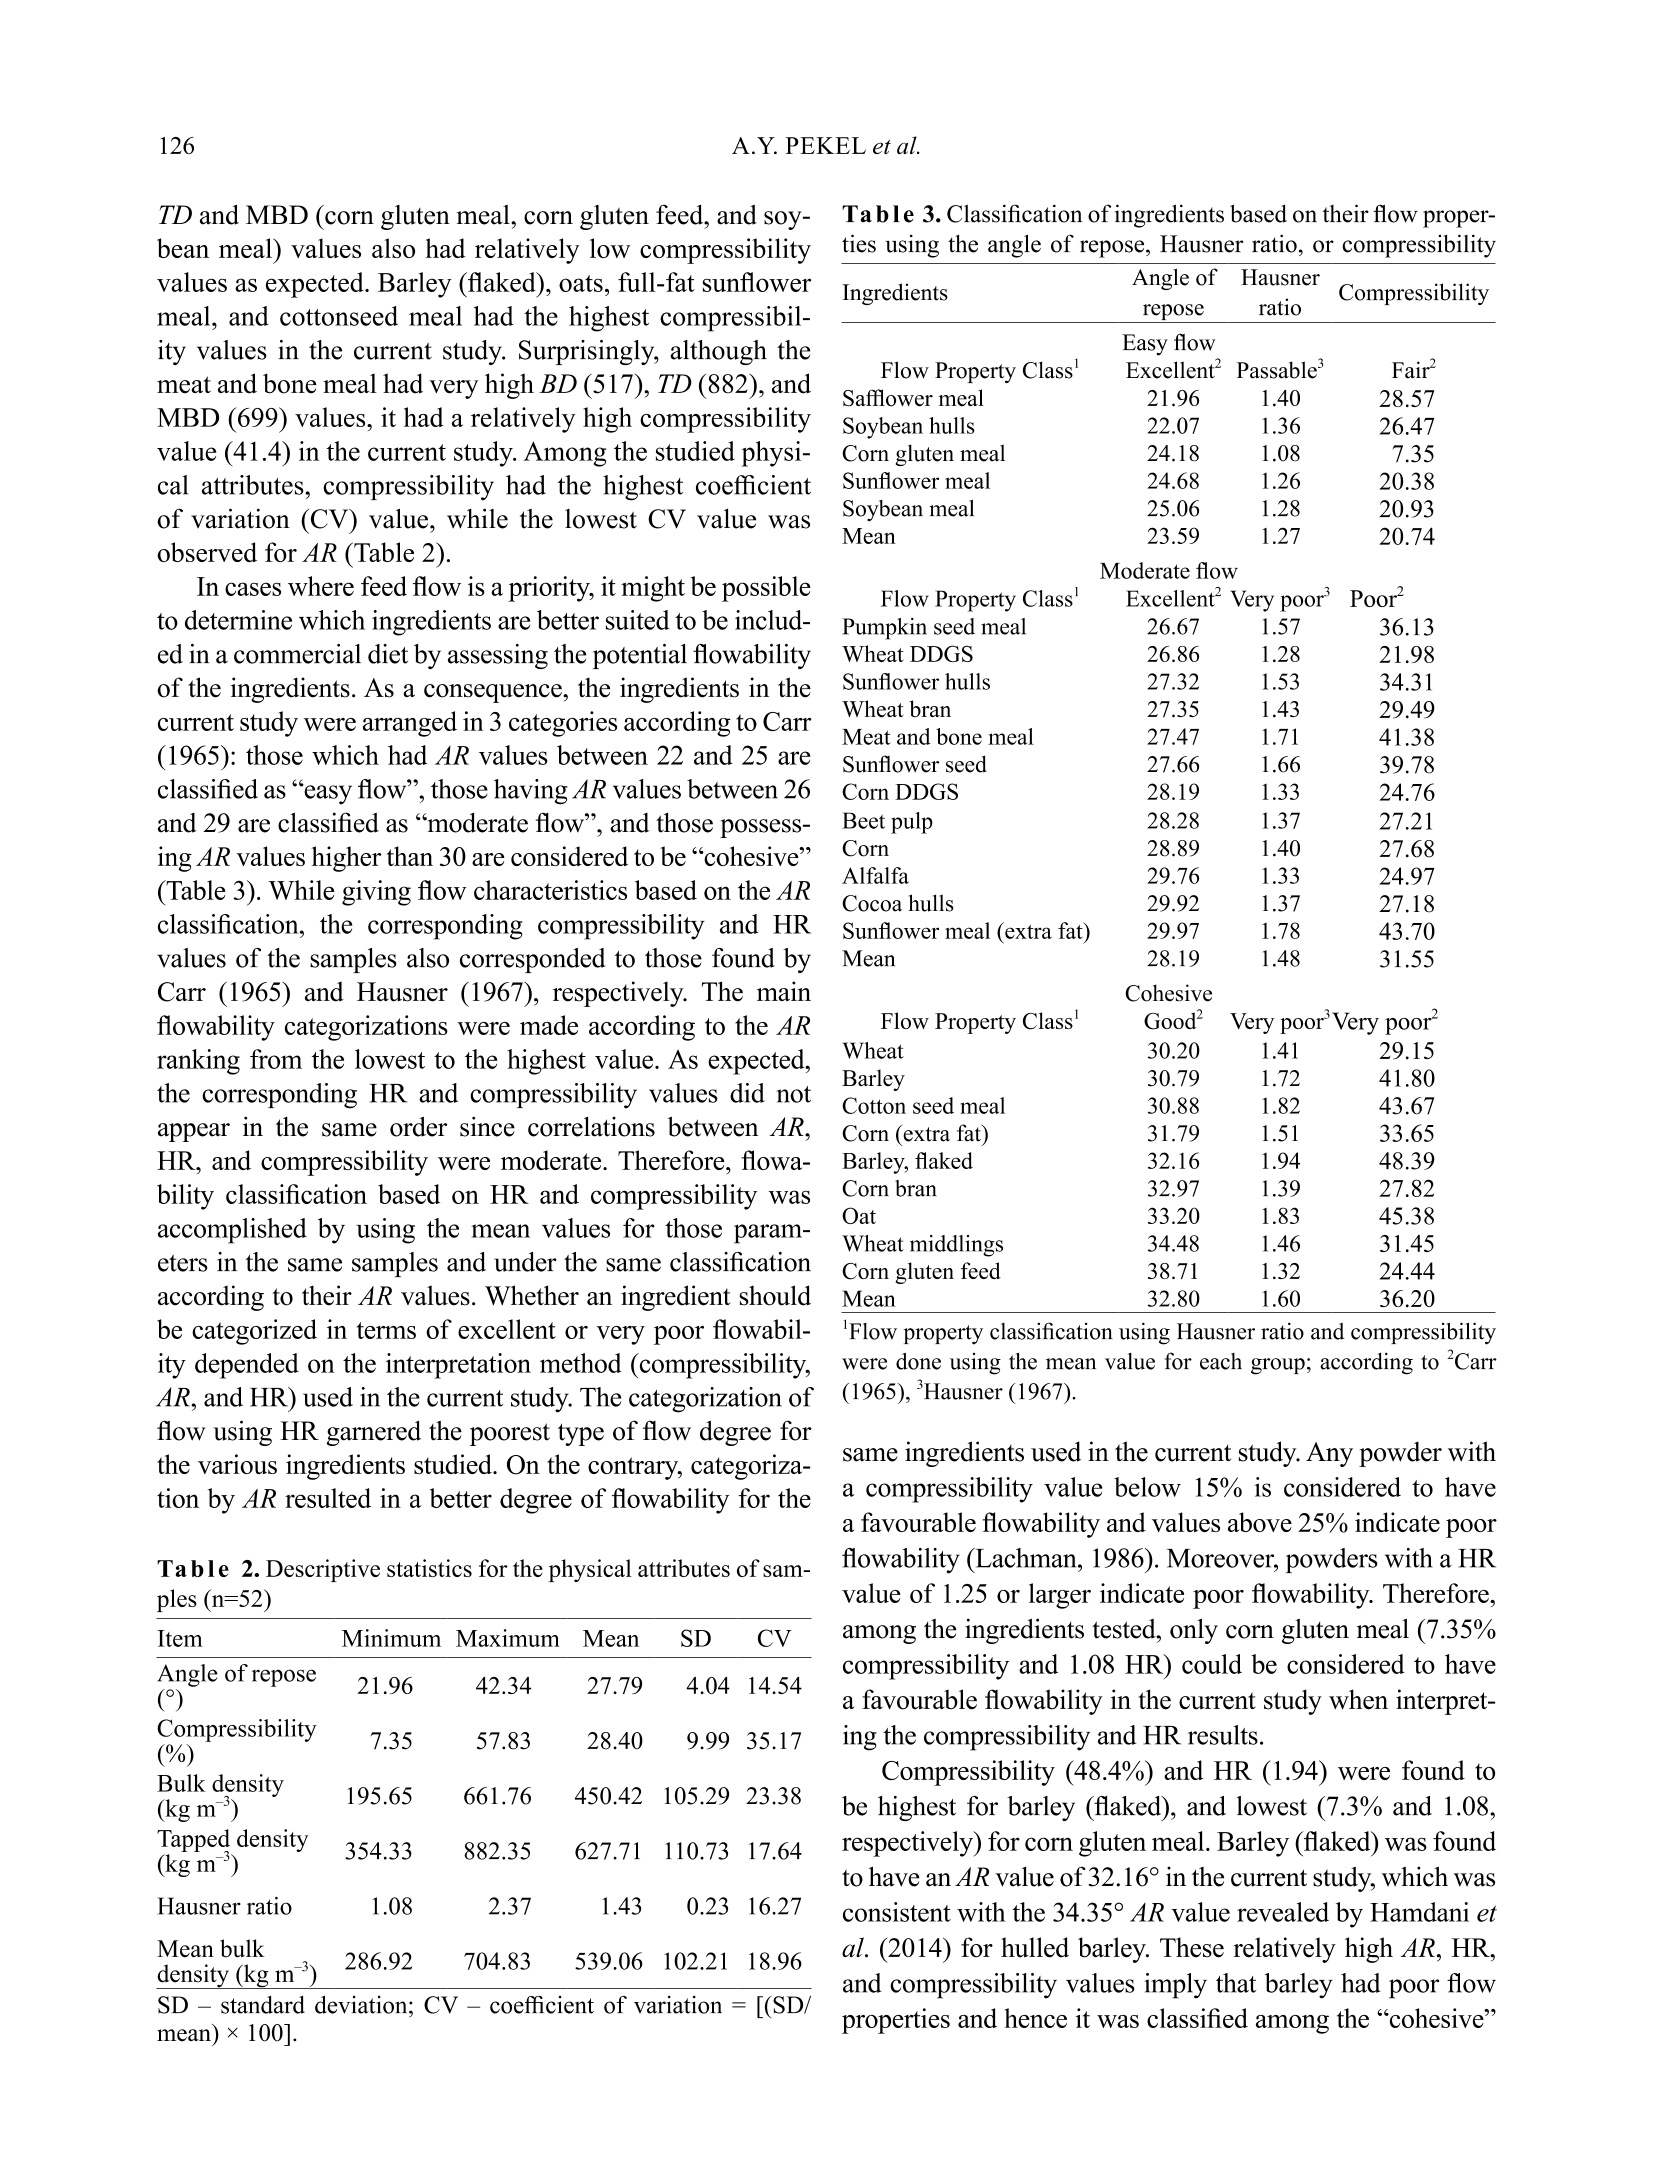
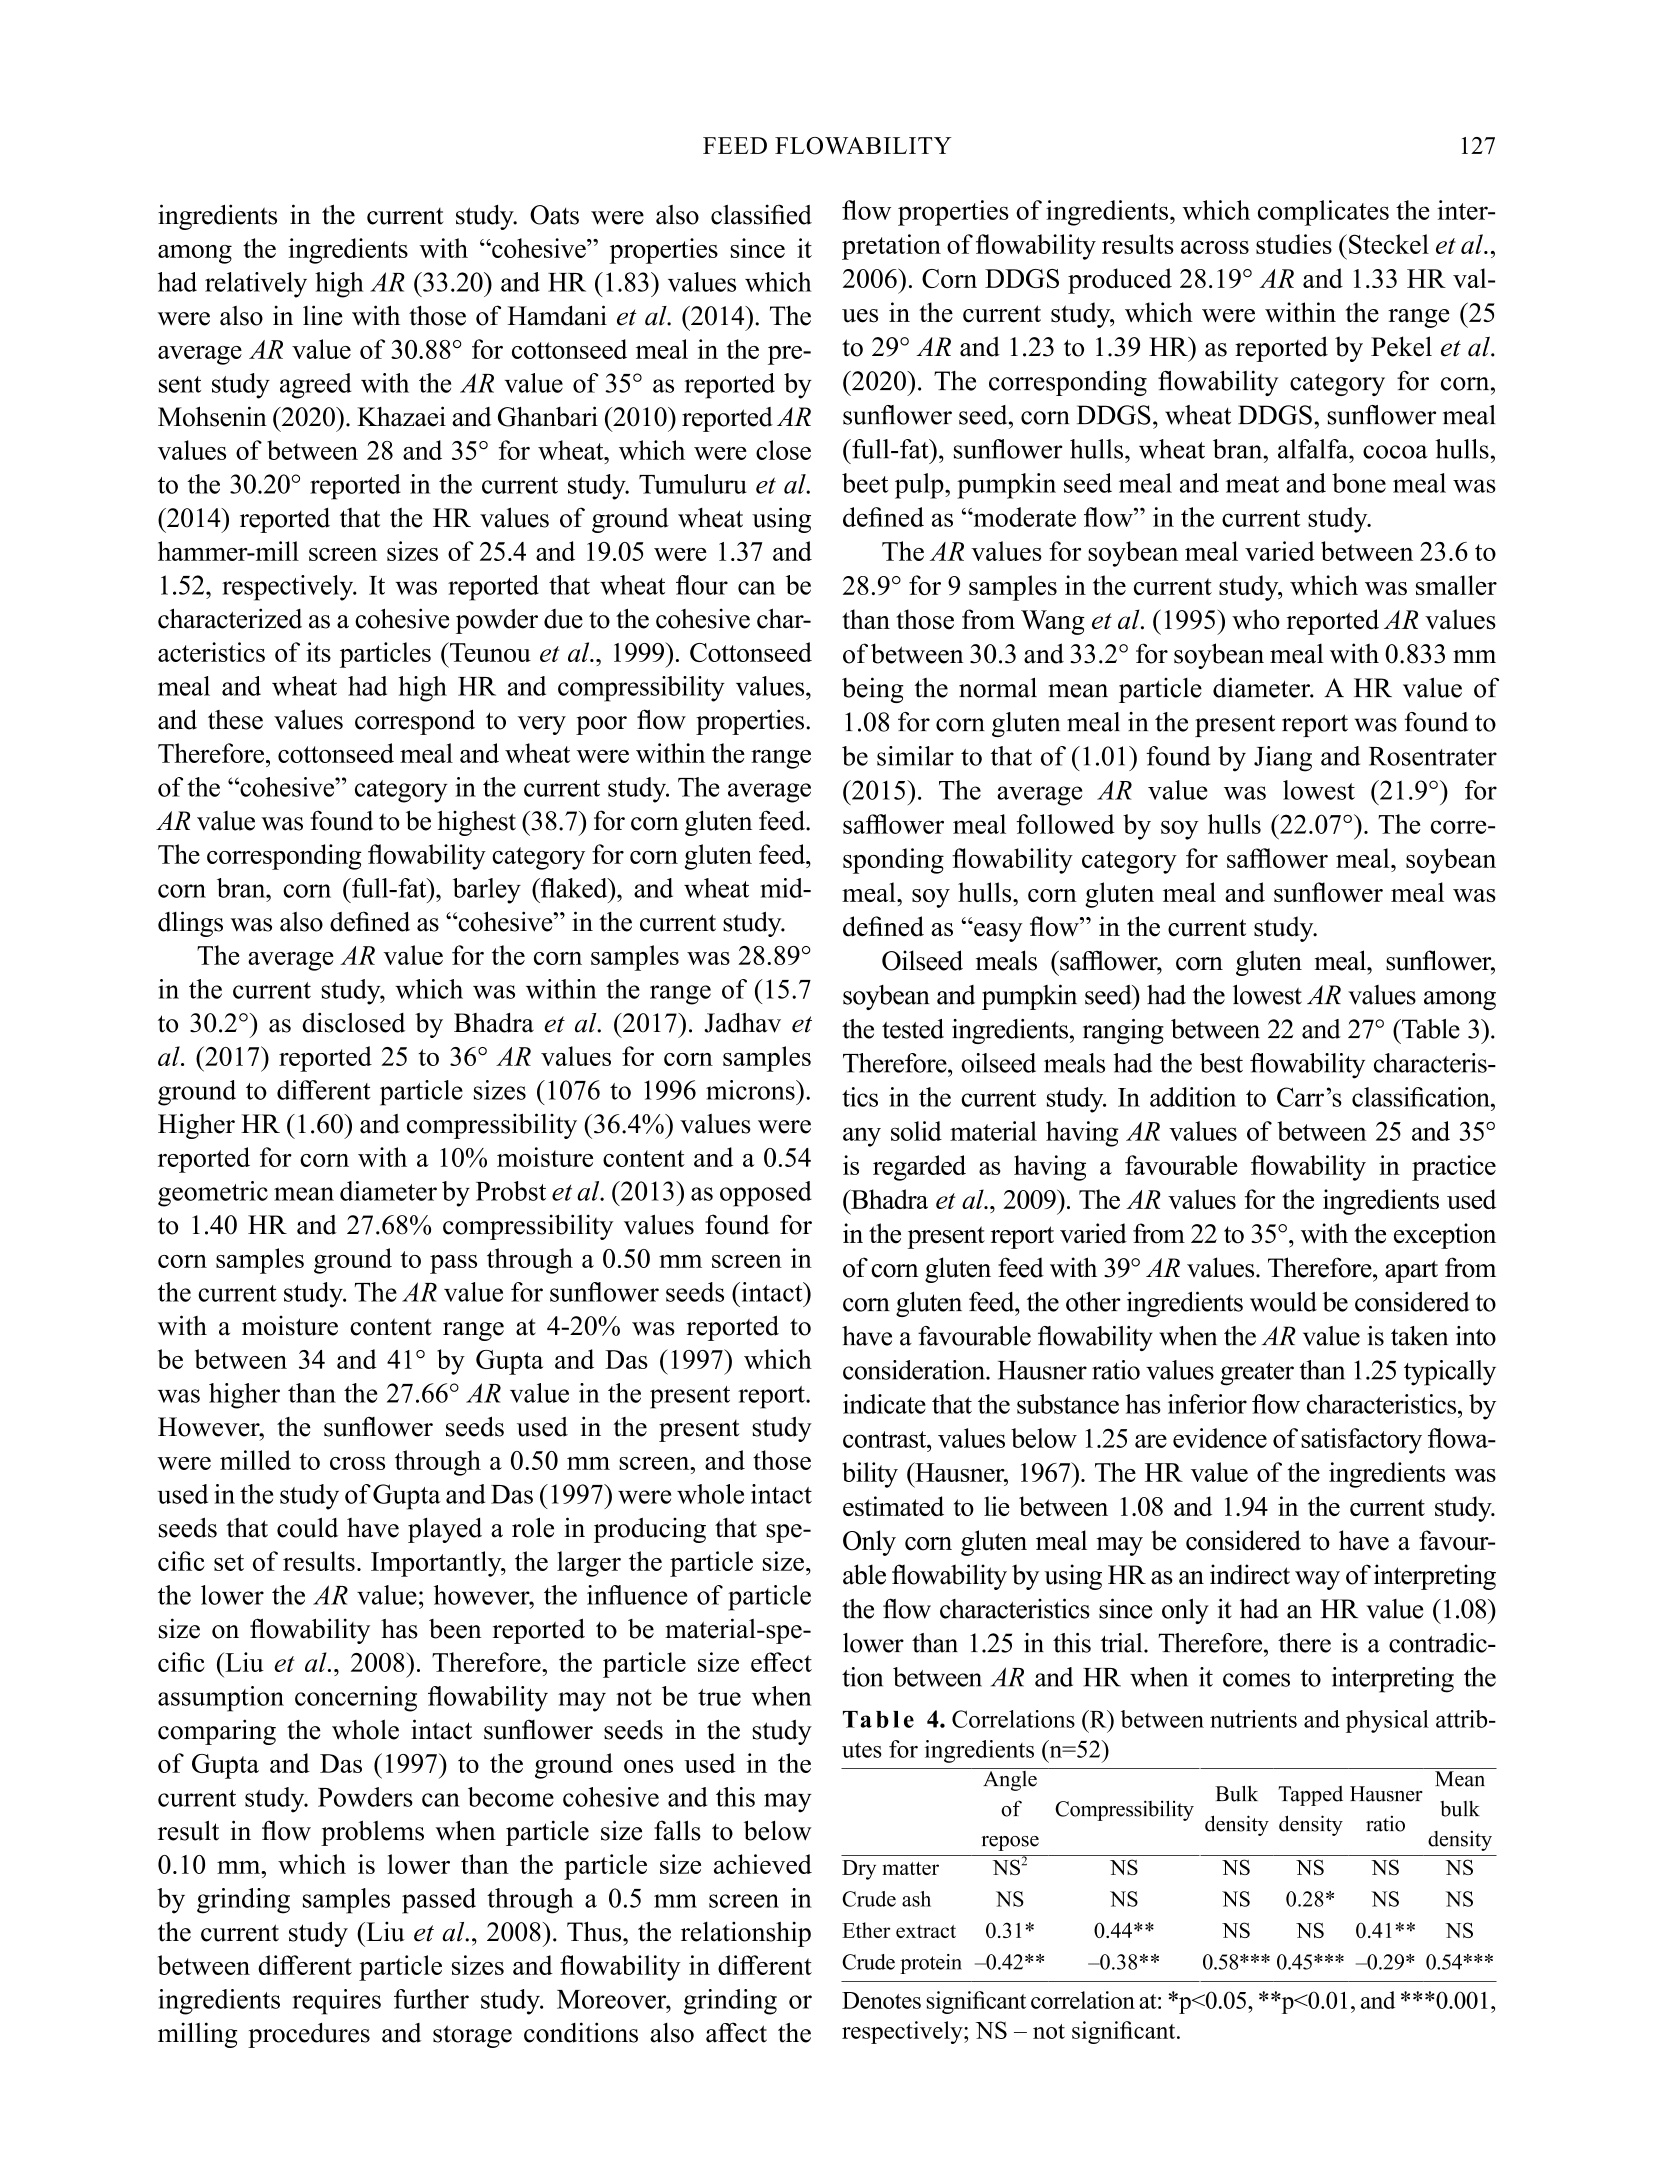
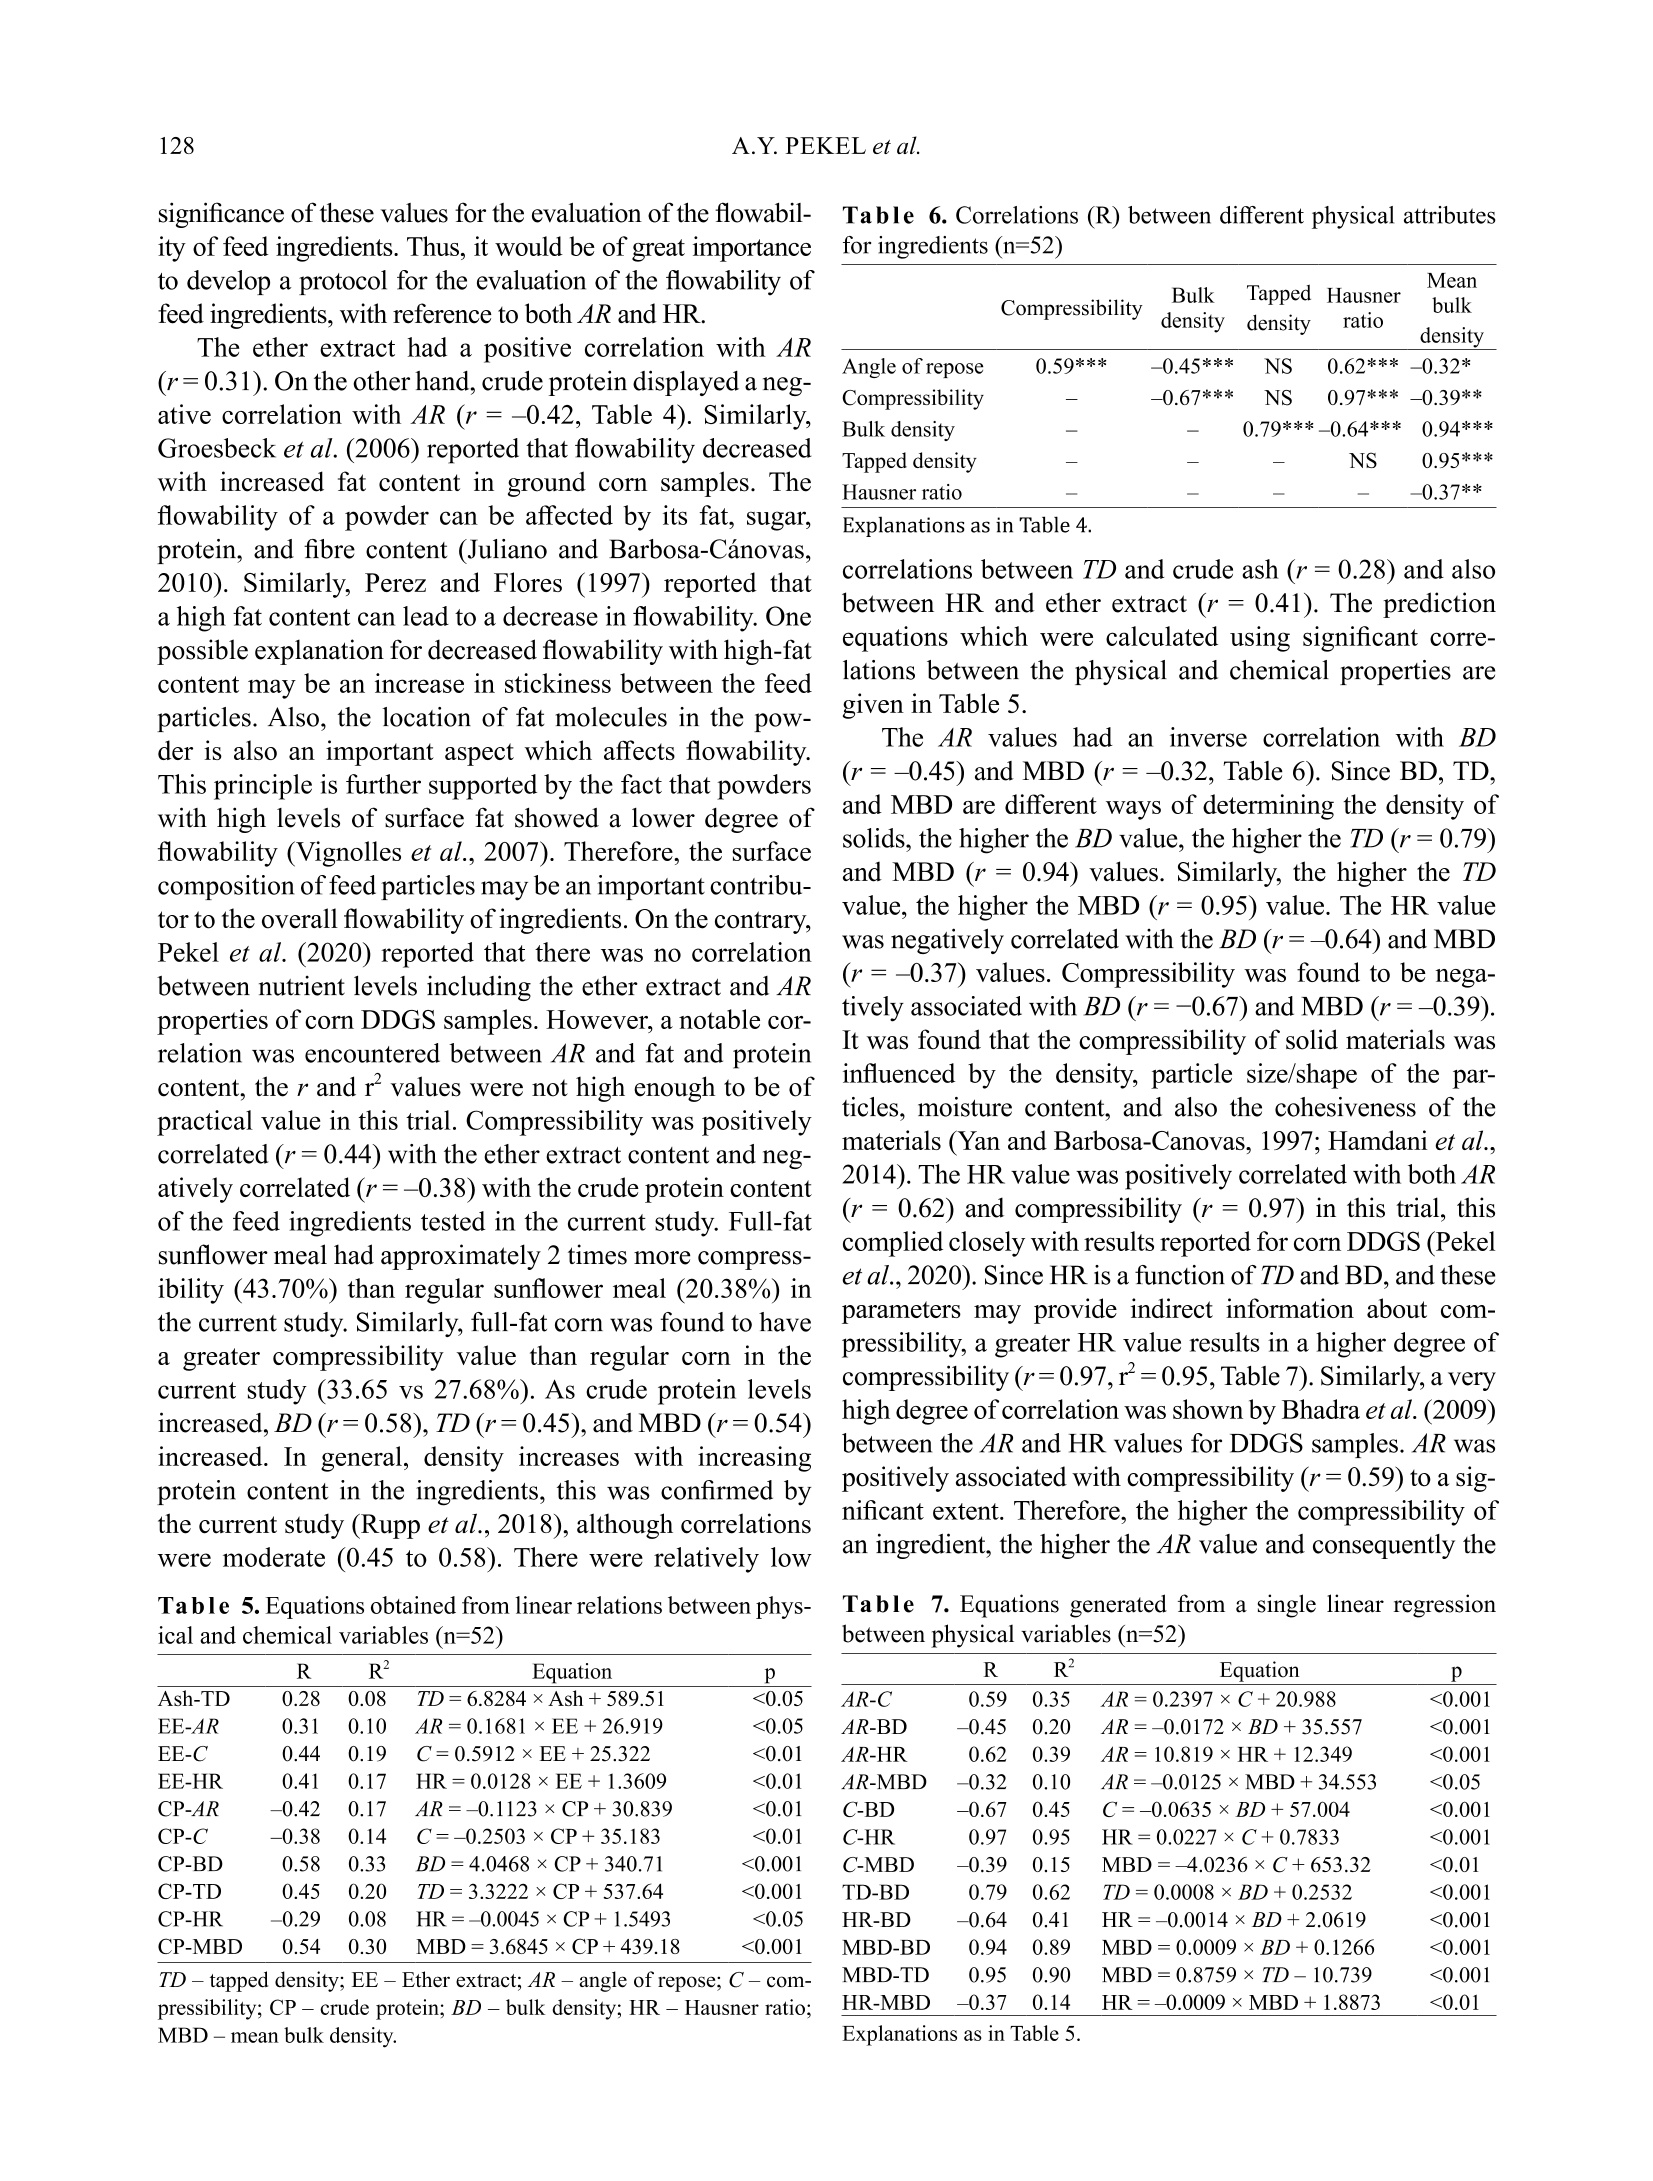
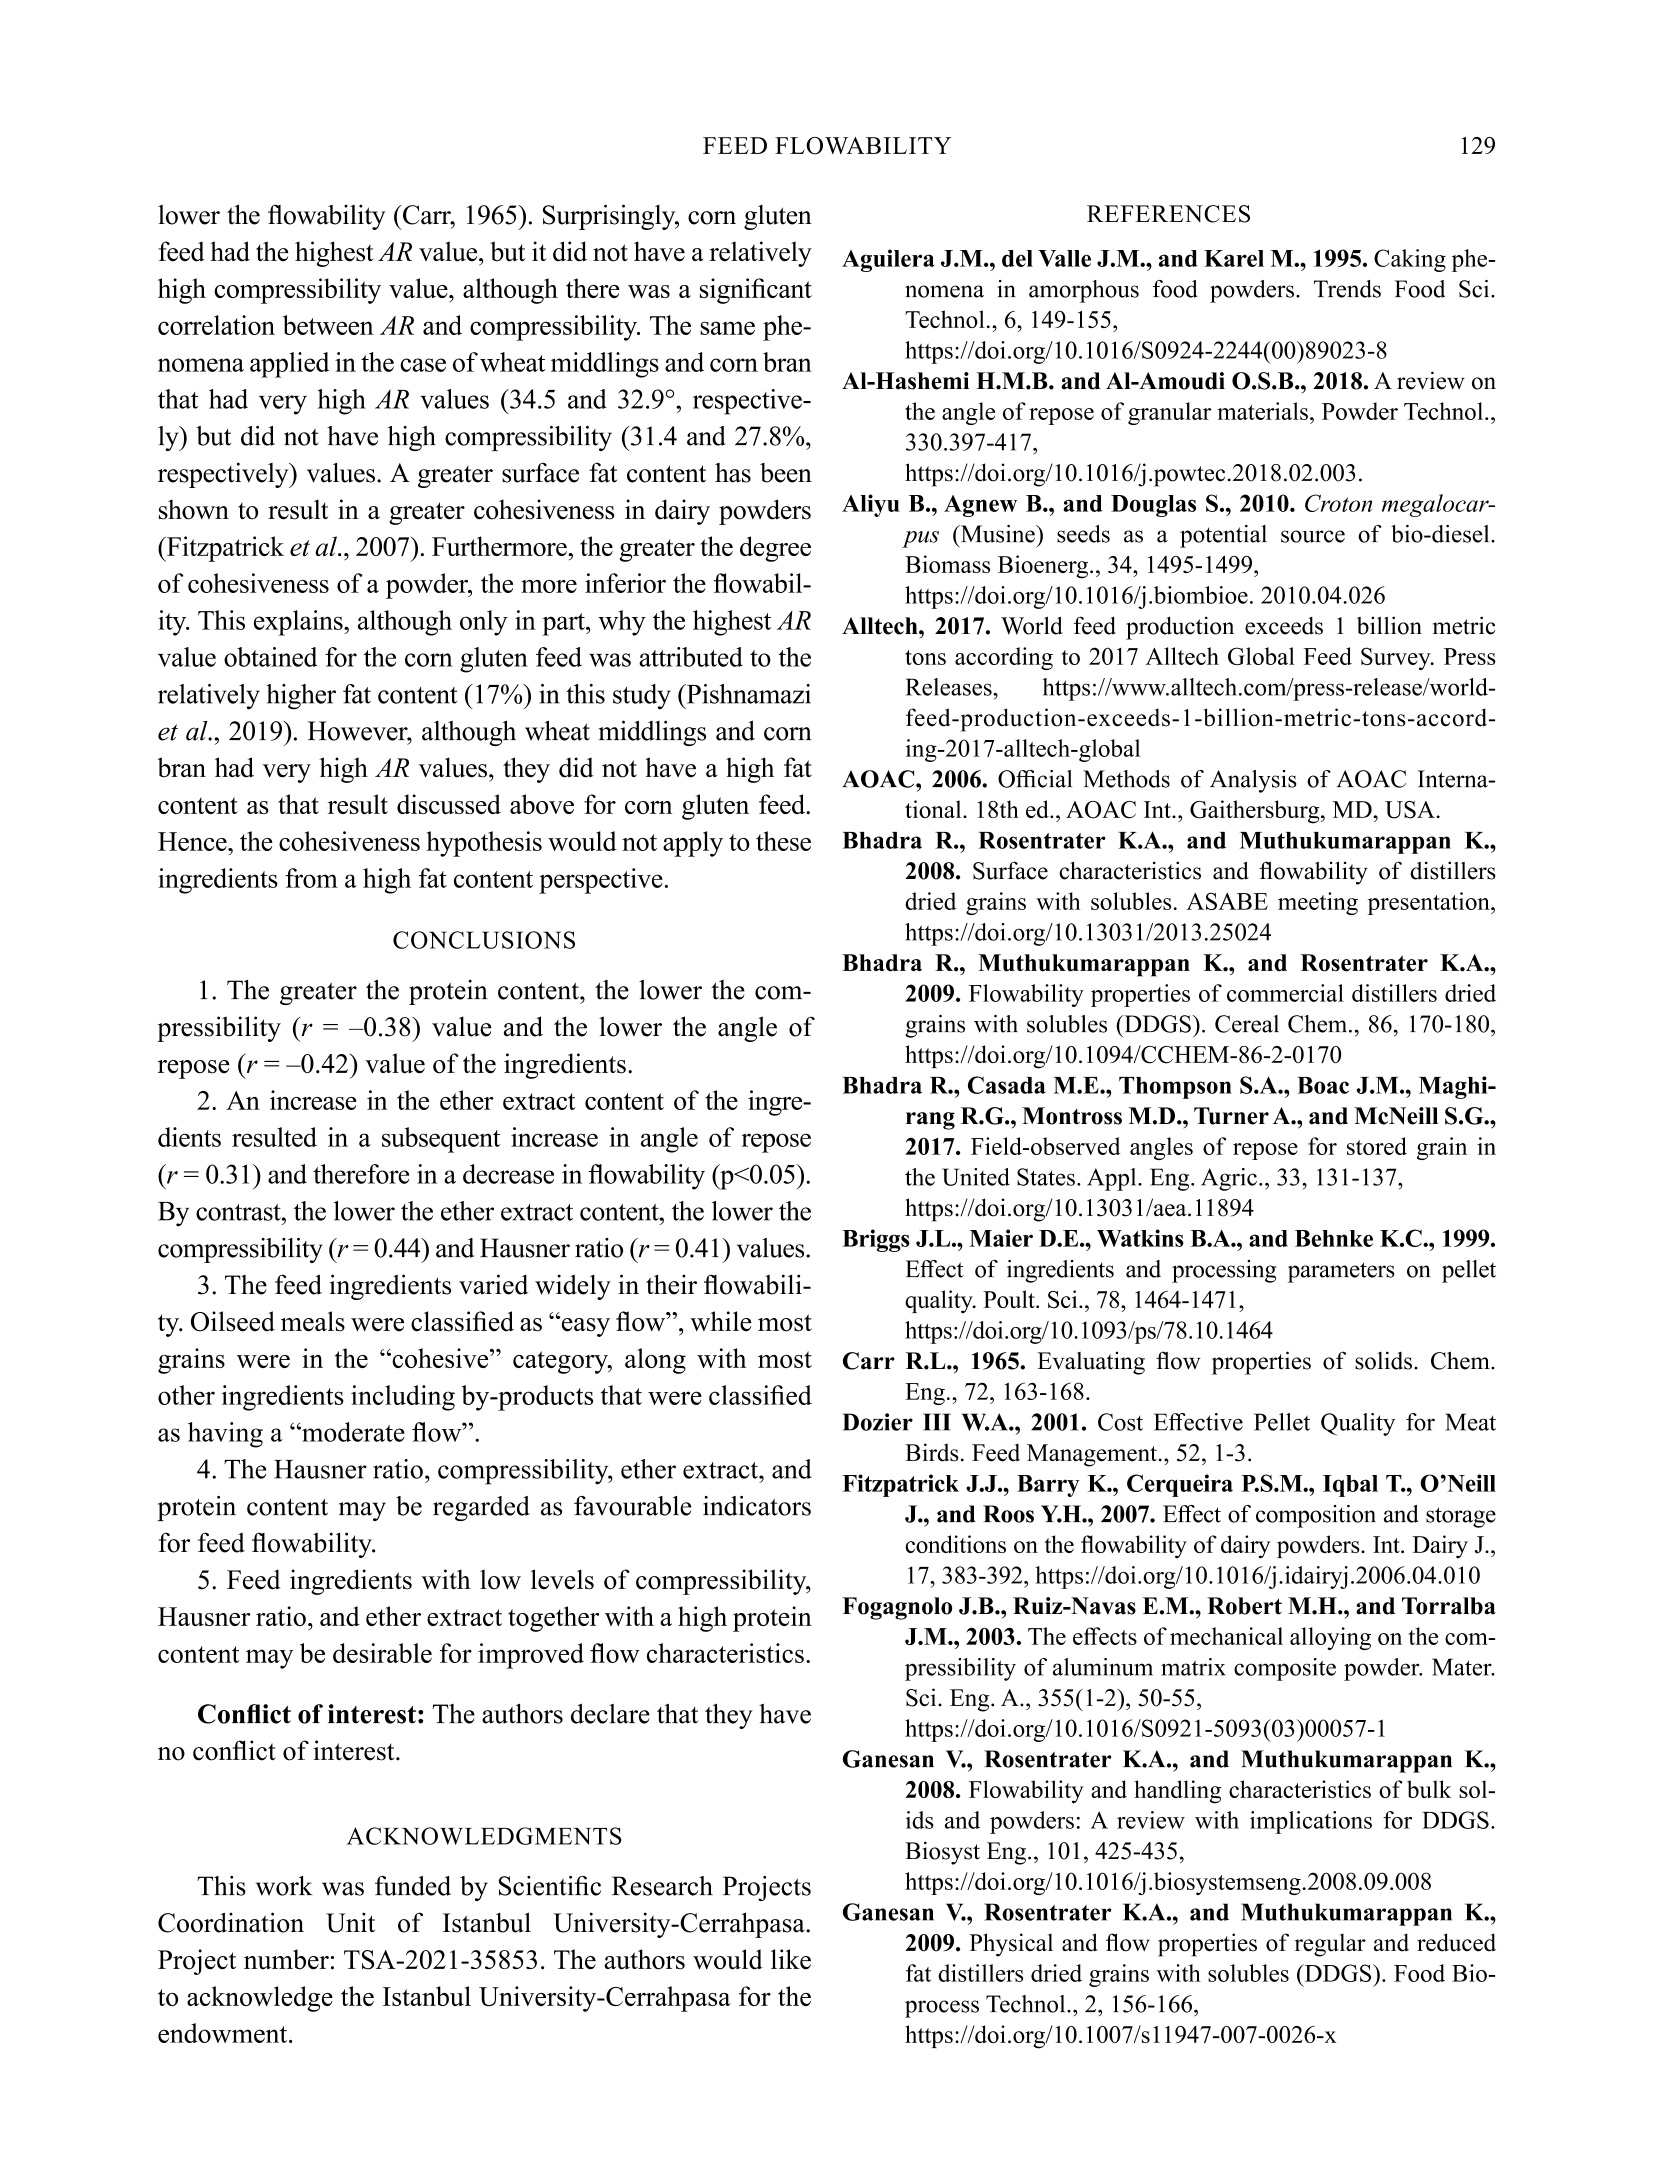
基于流动特性的26种常用饲料原料的分类Classification of commonly used feed ingredients based on flow propertiesINTERNATIONALAgrophysicswww.international-agrophysics.orgInt. Agrophys., 2022,36,123-130doi: 10.31545/intagr/149295 124A.Y. PEKEL et al. 基于流动特性的常用饲料成分的分类 Classification of commonly used feed ingredients based on flow properties** Ahmet Yavuz Pekel io D *, Abdurrahman Kizil D, Ali Calik @, Eren Kuter D, Umair Ahsan @,Mustafa S. Alatas'D, and Oguzhan Kahraman D Department of Animal Nutr i tion and Nutritional Diseases, Faculty of Veterinary Medicine, Istanbul University-Cerrahpasa,Istanbul 34320, Turkey Department of Animal Nutrition and Nutritional Diseases, Faculty of Veter i nary Medicine, Ankara University, Ankara 06110, Turkey Department of Animal Nutrition and Nutritional Diseases, Faculty of Veterinary Medicine, Burdur Mehmet Akif Ersoy University,Istiklal Campus, Burdur 15030,Turkey “Department of Plant and Animal Production, Vocational School of Food, Agr i culture and Livestock, Burdur Mehmet Akif Ersoy University, I stiklal Campus, Burdur 15030, Turkey Research and Application Centre for Agr i culture, Livestock and Food, Burdur Mehmet Akif Ersoy University, Istiklal Campus, Burdur 15030, Turkey Department of Animal Nutrition and Nutritiona l Diseases, Faculty of Veterinary Medicine, Selcuk University, Konya 42003, Turkey Received December 13, 2021; accepted April 19, 2022 Abstract . The objective of this report was to classify ingredients based on their f lowability. Twenty-six different feed ingredients (52 samples) were used including cereal grains, cereal by-products, oilseeds, oilseed meals, and animal-origin products.As an indication of f lowabi l ity, the angle of repose was determined using a funnel test. In general, high protein oilseed meals had t he lowest angle of repose, and therefore they had t he highest flow-abil i ty with the exception of cottonseed meal. Corn gluten feed and wheat middlings had the highest angle of repose values (39and 34°, respectively), and therefore they had the lowest flowabil-ity. I ngredients with a range of angle of repose values between 22and 25°, between 27 and 30°, and more than 30°, were categorized as having an easy flow, a moderate flow, and cohesive,respective-ly. The greater the protein content, the smaller the compressibility value (r=-0.38) and the lower the angle of repose (r=-0.42)An increase in the ether extract content of the ingredients resulted in a subsequent i ncrease in angle of repose (r=0.31) and there-fore a decrease in f lowability (p<0.05). The angle of repose was positively correlated with compressibility and the Hausner ratio.In conclusion, oilseed meals were classified as “easy flow”, most by-products as “moderate flow”, and cereal grains as “cohesive”. Keywords: angle of repose, compressibility, feed, flowabil-ity, Hausner ratio *Corresponding authors e-mail: pekel@istanbul .edu.tr **Thi I s S work was funded by Scient ifi c Research Projects Coordination Unit of Istanbul University-Cerrahpasa. Project num-ber: TSA-2021-35853 (2021-2022). INTRODUCTION Global compound feed production was estimated to be approximately one billion tonnes in 2017 (Alltech,2017). Compound feed is produced for the most part from a wide range of ingredients including cereal grains, cereal by-products, oilseeds, oilseed meals, and animal-origin products. Each of these different ingredients possesses di f -ferent physical and chemical characteristics that may vary widely due to harvesting, storing, processing, and other related processes (Moss et al., 2021). Even though the nutrient composition of the feeds is closely monitored in the field, the physical characteristics of the i ngredients have been neglected by the feed industry for a variety of reasons (including both economic and t echnical issues). Water holding capacity, bulk density (BD), apparent density, solubility, swelling, and particle size are some of the most important indicative physical parameters for high-quality ingredient selection and feed production (Hao et al., 2016). As an example, the pellet quality of feeds is influenced by the physical characteristics of each ingredi-ent used to produce the pel l ets, in addition to i ts chemical composition. (Thomas and Van der Poel, 1996). One such O 2022 Inst i tute of Agrophysics, Polish Academy of Sciences physical attribute is the geometric mean diameter of the feed. For instance, it has been reported that a 650 to 700 um geometric mean diameter is found to be optimal for pel 1-一 let qual i ty i n corn-soy diets (Dozier, 2001). The pellet i ng process increases the BD and flowabi l ity of feed (Briggs et al., 1999). Therefore, the physical parameters of the feed should be monitored closely to ensure that its quality is not compromised. The flowability attribute is one of t he most i mperative physical peculiarities of feed ingredients and plays a role i n its usability in the field. Feed ingredients are usually ground and mixed to form a final product, transported using vari-ous vehicles and stored in bins or silos, and finally they are moved through automated chain feeding systems. Al 1l 1of these stages can be affected by their f low characteristics (Matchett, 2006). For i nstance, feed segregation and cak-ing are two flow property-related problems that can lead to signif i cant economic losses to the feed industry (Tang et al., 2006). Some of the ingredients in compound feeds have been shown to be prone to caking, particularly when in transit, thereby resulting in detrimental effects on overall feed quality and f lowability (Aguilera et al., 1995). The angle of repose (AR) is defined as the maximum slope incl i nation of any comminuted material when it is barely stable, i t affects the f lowability of any granule,including feed (Al-Hashemi and Al-Amoudi, 2018). The chemical composition of various ingredients, such as the amount of moisture, fat, and protein can also have an impact on the flowability of feed (Bhadra et al., 2008). For instance, the flow of distillers dried grains with solubles (DDGS) can be problematic due to the caking and bridging that develop during the course of transportation and storage according to Ganesan et al.(2008). The chemical composi-tion (e.g., moisture and fat content) of DDGS was shown to affect i ts flowability (Ganesan et al., 2009; Johnston et al., 2009). In contrast , Pekel et al. (2020) reported that the nutrient compos i tion of DDGS only had a l i mited influence over its flow characteristics. Despite several past publications concerning the flow characteristics of some feed ingredients, up-to-date infor 厂 -一 mation about the flowability of widely used feed ingredients is lacking in a single report format. It was hypothesized that the flow characteristics of ingredients could be clas-sified using physical and chemical properties. To that end,the current study was designed to explore the flowability characteristics of the commonly used feed ingredients in the field and to identify correlations between flowability and certain physical/chemical properties of the ingredients. MATERIAL AND METHODS Twenty-six different feed ingredients and a total of 52 samples were used inc l uding cereal grains, cereal by-products, oilseeds, oilseed meals, and animal-origin products. The samples were crumbled and moved across a 0.5 mm screen in a high-speed rotor mill (Retsch,ZM200,Haan, Germany) before analysis and physica l measurement. The ingredients were analysed in triplicate for aerated BD, tapped density (TD), mean bulk density (MBD), com-pressibility (C), and nutrient content. The calculation of aerated BD (kg m) was carried out using the weight of the feed sample (15 g) divided by the volume of a measuring cylinder. After setting the initial volume at 100 ml followed by the treatment of a feed specimen (15 g) with a vortex shaker for approximately 2 minutes and manually hitting the cylinder prior to little volume change being observed,the TD (kg m-’) was determined by dividing the mass of the feed specimen by its tapped volume. An average of the BD and TD was taken to determine the MBD (kgm~)of the samples. The Hausner ratio (HR) was est i mated by div i ding the TD by the BD. The compressibi l ity (C) of the ingredients was obtained by employing Carr’s equation (Carr, 1965) as follows: The AR for each ingredient was measured using a funnel test i n triplicate and used as a guide for the flow attribute.The AR value of each feed ingredient was determined by fixing the funnel tip height to 2 cm from the horizontal surface using a ring stand. The diameter of the funnel, the length of it s elongation, and its entire span were 18,21,and 29 cm, respectively. A pile of feed ingredient was released in such a way as to f low smoothly via the funnel onto a fil-ter paper unt i l the crest of the pile underneath just touches the lower tip of the funnel placed on a ring stand. After that , the boundary of the loose feed ingredients on the fi l ter paper was drawn using a marker, then the stack was dis-carded. The diameter of the assembled accumulation was evaluated twice (perpendicular and parallel) and i ts mean was taken. This activity was performed in triplicate and the mean diameter (d) and the radius (r = d/2) were measured.Using the height (h) and radius o f the f unnel, AR was deter-mined by calculating the arctangent between the height and radius of t he stockpile (Aliyu et al., 2010) using the follow-ing equation: was determined using Kjeldahl digestion by employing a commercial analyser (Gerhardt Kjeldatherm KB, Bonn,Germany ). The crude protein values were calculated by multiplying the nitrogen values by 6.25 (AOAC, 2006). The data were analysed by simple linear regression ut i lizing PROC REG . In addition, the PROC CORR state-ments were used to perform a Pearson correlation (R)analysis (SAS, 2006). RESULTS AND DISCUSSION The analysed average nutrient composition and physi -cal features of the samples are presented i n Table 1. Since mechanical milling affects the morphology and hardness of powder particles (Fogagnolo et al., 2003), all samples in the current study were crumbled in order to go across a 0.5 mm screen to achieve a homogeneous particle-size distribution. Molenda et al. (2002) reported a 583kg m ’ BD value for the sampled corn, this was higher than the 488 kg m’value determined in the current study. The BD value of 368 found for barley in the current report was very close to t he 340 kg m’value repor t ed by Hamdani et al.(2014). The BD values for ground wheat, wheat bran, oats,and wheat middlings in the present study were i n the range reported by Stanley (1981). Kammel (2000) reported 400,448,320, and 672 kg mBD values for ground samples of barley, corn, oats, and corn gluten meal, which were very simi l ar to the BD values of 368, 488, 346, 662 reported for the same i ngredients in the current study, respectively. The BD data were consistent with the TD and MBD values in the current study. Sunflower hulls had the lowest BD value and beet pulp had the lowest TD and MBD values, while corn gluten meal had the highest BD value and meat and bone meal had the highest TD and MBD values in the cur-rent study. Some of the ingredients with the highest BD, Table 1. Average nutrient composition (%, as-is ) and physical characteristics of samples Ingredients n Bulk Tapped Mean Angle Dry Crude Ether Crude Compressibility bulk of Hausner matter ash extract protein (%) density (kg m) density (kgm3) density (kgm~) repose () ratio Barley, flaked Cereal grains 1 89.94 2.23 2.27 9.99 48.39 362.90 703.13 533.01 32.16 1.94 Barley 1 88.37 2.16 1.91 12.11 41.80 368.85 633.80 501.33 30.79 1.72 Corn 3 89.44 0.92 5.07 8.00 27.68 488.51 668.69 578.60 28.89 1.40 Corn (full-fat) 1 96.88 2.90 12.59 18.73 33.65 432.69 652.17 542.43 31.79 1.51 Oat 1 91.62 3.76 7.75 12.49 45.38 346.15 633.80 489.98 33.20 1.83 Wheat 2 88.53 1.45 2.18 11.61 29.15 514.30 726.00 620.15 30.20 1.41 Corn bran Cereal by-products 1 87.05 0.81 4.97 8.53 27.82 338.35 468.75 403.55 32.97 1.39 Corn gluten feed 1 91.54 4.64 17.05 18.95 24.44 500.00 661.76 580.88 38.71 1.32 Corn gluten meal 1 91.56 1.75 2.37 62.27 7.35 661.76 714.29 688.03 24.18 1.08 Corn DDGS 2 88.31 5.04 7.5430.68 24.76 483.93 644.04 563.98 28.19 1.33 Wheat DDGS 1 90.06 4.02 3.1632.65 21.98 494.51 633.80 564.15 26.86 1.28 Wheat bran 3 90.04 4.54 3.06 16.13 29.49 370.96 523.80 447.38 27.35 1.43 Wheat middlings 1 91.43 3.21 4.44 16.21 31.45 362.90 529.41 446.16 34.48 1.46 Sunflower seed Oilseeds 1 94.89 3.1744.92 15.70 39.78 483.87 803.57 643.72 27.66 1.66 Oilseed meals Cottonseed meal 4 88.84 5.74 2.15 35.12 43.67 342.08 596.12 469.10 30.88 1.82 Pumpkin seed meal 1 93.82 6.79 12.19 22.74 36.13 378.15 592.11 485.13 26.67 1.57 Safflower meal 1 92.45 3.86 0.20 20.65 28.57 494.51 692.31 593.41 21.96 1.40 Soybean meal 9 90.51 6.96 2.2447.86 20.93 591.74 748.59 670.16 25.06 1.28 Sunflower meal 8 89.70 6.36 1.19 32.80 20.38 429.84 540.86 485.35 24.68 1.26 Sunflower meal (full-fat) 1 95.94 7.43 7.4241.36 43.70 378.15 671.64 524.90 29.97 1.78 Beet pulp Other by-products 1 86.94 4.27 0.82 9.47 27.21 306.12 420.56 363.34 28.28 1.37 Cocoa hulls 1 92.44 8.08 4.47 18.20 27.18 436.89 600.00 518.45 29.92 1.37 Soybean hulls 1 90.80 4.92 1.50 10.33 26.47 441.18 600.00 520.59 22.07 1.36 Sunflower hulls 2 91.04 3.50 10.08 6.85 34.31 295.71 445.02 370.36 27.32 1.53 Meat and bone meal Animal products 1 93.83 33.1917.4841.59 41.38 517.24 882.35 699.80 27.47 1.71 Alfalfa Other plant products 2 90.95 10.37 1.40 16.74 24.97 409.23 545.47 477.35 29.76 1.33 'DDGS: distillers dried grains with solubles. TD and MBD (corn gluten meal, corn gluten feed, and soy-bean meal ) values also had relatively low compressibility values as expected. Barley (flaked), oats, full-fat sunflower meal, and cottonseed meal had the highest compressibil-ity values in the current study. Surprisingly, although the meat and bone meal had very high BD(517),TD (882), and MBD (699) values, it had a relatively high compressibility value (41.4) in the current study. Among the studied physi1-一 cal attributes, compressibility had the highest coefficient of variation (CV) value, while the lowest CV value was observed for AR (Table 2). In cases where feed flow i s a priority, it might be possible to determine which ingredients are better suited to be includ-一 ed i n a commercial diet by assessing the potent i al flowability of the ingredients. As a consequence, the i ngredients i n the current study were arranged in 3 categories according to Carr (1965): those which had AR values between 22 and 25 are classified as “easy f low", those having AR values between 26and 29 are classified as “moderate flow”, and those possess-ing AR values higher than 30 are considered to be“cohesive”(Table 3). While giving flow characteristics based on the AR classification, the corresponding compressibility and HR values of the samples also corresponded to those found by Carr (1965) and Hausner (1967), respectively. The main flowabil i ty categorizations were made according to the AR ranking from the lowest to t he highest value. As expected,the corresponding HR and compressibility values did not appear in the same order since correlations between AR,HR, and compressibility were moderate. Therefore, flowa-bility classification based on HR and compressibil i ty was accompl i shed by using the mean values for those param-eters in the same samples and under the same classification according to their AR values. Whether an i ngredient should be categorized in terms of excellent or very poor flowabil-ity depended on the interpretation method (compressibility,AR, and HR) used in t he current study. The categorization of flow using HR garnered the poorest type of flow degree for the various ingredients studied. On the contrary, categoriza-tion by AR resulted in a better degree of flowabi li ty for the Table 2.Descriptive statistics for the physical attributes of sam-ples (n=52) Item Minimum Maximum Mean SD CV Angle of repose () 21.96 42.34 27.79 4.04 114.54 Compressibility (%) 7.35 57.83 28.40 9.99 35.17 Bulk density (kg m) 195.65 661.76 450.42105.2923.38 Tapped density (kg m) 354.33 882.35 627.71 110.73 117.64 Hausner ratio 1.08 2.37 1.43 0.23 116.27 Mean bulk density (kg m) 286.92 704.83 539.06 1 102.21 118.96 SD - standard deviation; CV - coefficient of variation =[(SD/mean)×100]. Table 3. Classificat i on of ingredients based on their f low proper-ties using the angle of repose, Hausner ratio, or compressibility Ingredients Angle of Hausner Compressibility repose ratio Easy flow Flow Property Class Excellent’ Passable Fair Safflower meal 21.96 1.40 28.57 Soybean hulls 22.07 1.36 26.47 Corn gluten meal 24.18 1.08 7.35 Sunflower meal 24.68 1.26 20.38 Soybean meal 25.06 1.28 20.93 Mean 23.59 1.27 20.74 Moderate flow Flow Property Class Excellent’ Very poor 3 Poor Pumpkin seed meal 26.67 1.57 36.13 Wheat DDGS 26.86 1.28 21.98 Sunflower hulls 27.32 1.53 34.31 Wheat bran 27.35 1.43 29.49 Meat and bone meal 27.47 1.71 41.38 Sunflower seed 27.66 1.66 39.78 Corn DDGS 28.19 1.33 24.76 Beet pulp 28.28 1.37 27.21 Corn 28.89 1.40 27.68 Alfalfa 29.76 1.33 24.97 Cocoa hulls 29.92 1.37 27.18 Sunflower meal (extra fat) 29.97 1.78 43.70 Mean 28.19 1.48 31.55 Cohesive Flow Property Class Good² Very poor Very poor Wheat 30.20 1.41 29.15 Barley 30.79 1.72 41.80 Cotton seed meal 30.88 1.82 43.67 Corn (extra fat) 31.79 1.51 33.65 Barley, flaked 32.16 1.94 48.39 Corn bran 32.97 1.39 27.82 Oat 33.20 1.83 45.38 Wheat middlings 34.48 1.46 31.45 Corn gluten feed 38.71 1.32 24.44 Mean 32.80 1.60 36.20 Flow property classification using Hausner ratio and compressibility were done using t he mean value for each group; according to ’Carr (1965),Hausner (1967). same ingredients used in the current study. Any powder with a compressibility value below 15% i s considered to have a favourable flowabi l ity and values above 25% indicate poor flowability (Lachman, 1986). Moreover, powders with a HR value of 1.25 or larger indicate poor f lowability. Therefore,among the ingredients tested, only corn gluten meal (7.35%compressibility and 1.08 HR) could be considered to have a favourable flowability in the current study when interpret-ing the compressibility and HR results. Compressibility (48.4%) and HR (1.94) were found to be highest for barley (flaked), and lowest (7.3% and 1.08,respectively) for corn gluten meal. Barley (flaked) was found to have an AR value of 32.16° in the current study, which was consistent with the 34.35° AR value revealed by Hamdani et al. (2014) for hul l ed barley. These relatively high AR, HR,and compressibility values imply t hat barley had poor f low properties and hence it was classified among the“cohesive” ingredients in the current study. Oats were also classified among the ingredients with “cohesive” properties since it had relatively high AR (33.20) and HR (1.83) values which were also in line with those of Hamdani et al. (2014). The average AR value of 30.88° for cottonseed meal i n the pre-sent study agreed with the AR value of 35° as reported by Mohsenin (2020). Khazaei and Ghanbari (2010) reported AR values of between 28 and 35° for wheat , which were close to t he 30.20° reported in the current study. Tumuluru et al.(2014) reported that the HR values of ground wheat using hammer-mil l screen sizes of 25.4 and 19.05 were 1.37 and 1.52, respectively. It was reported that wheat f lour can b )e e characterized as a cohesive powder due to the cohesive char-acteristics of its particles (Teunou et al.,1999). Cottonseed meal and wheat had high HR and compressibility values,and these values correspond to very poor f low properties.Therefore, cottonseed meal and wheat were within the range of the “cohesive”category in the current study. The average AR value was found to be highest (38.7) for corn gluten feed.The corresponding flowability category for corn gluten feed,corn bran, corn (full-fat), barley (flaked), and wheat mid 1-一 dlings was also defined as “cohesive” in the current study. The average AR value for the corn samples was 28.89°in the current study, which was within the range of (15.7to 30.2°) as disclosed by Bhadra et al. (2017). Jadhav et al. (2017) reported 25 to 36° AR values for corn samples ground to di f ferent particle sizes (1076 to 1996 microns).Higher HR (1.60) and compressibility (36.4%) values were reported for corn with a 10% moisture content and a 0.54geometric mean diameter by Probst et al . (2013) as opposed to 1.40 HR and 27.68% compressibi l ity values found for corn samples ground to pass through a 0.50 mm screen in the current study. The AR value for sunflower seeds (intact)with a moisture content range at 4-20% was reported to be between 34 and 41° by Gupta and Das (1997) which was higher than the 27.66° AR value i n the present report.However, the sunflower seeds used in the present study were milled to cross through a 0.50 mm screen, and t hose used in the study of Gupta and Das (1997) were whole i ntact seeds that could have played a role in producing that spe 一 -一 cific set of results. I mportantly, the larger the particle size,the lower the AR value; however, the influence of particle size on flowability has been reported to be material-spe-cific (Liu et al., 2008). Therefore, the particle size effect assumption concerning flowability may not be true when comparing the whole intact sunflower seeds in the study of Gupta and Das (1997) to the ground ones used in the current study. Powders can become cohesive and this may result in flow problems when particle size falls to below 0.10 mm, which is lower than the particle size achieved by grinding samples passed through a 0.5 mm screen in m the current study (Liu et al., 2008). Thus, the relationship -p between different particle sizes and flowabil i ty in different ingredients requires further study. Moreover, grinding or milling procedures and storage conditions also affect the flow properties of ingredients, which complicates the inter-pretation of flowability results across studies (Steckel et al.,2006). Corn DDGS produced 28.19° AR and 1.33 HR val-ues in t he current study, which were within the range (25to 29° AR and 1.23 to 1.39 HR) as reported by Pekel et al.(2020). The corresponding flowabil i ty category for corn,sunflower seed, corn DDGS, wheat DDGS, sunflower meal (full-fat ), sunflower hulls, wheat bran, alfalfa, cocoa hulls,beet pulp, pumpkin seed meal and meat and bone meal was defined as“moderate flow”" in the current study. The AR values for soybean mea l varied between 23.6 to 28.9° for 9 samples in the current study, which was smaller than t hose from Wang et al. (1995) who reported AR values of between 30.3 and 33.2° for soybean meal with 0.833mm being the normal mean par t icle diameter. A HR value of 1.08 for corn gluten meal in the present report was found to be similar to that of (1.01) found by J i ang and Rosentrater (2015). The average AR value was lowest (21.9°) for saff l ower meal followed by soy hulls (22.07). The corre-sponding f lowabi l ity category for saf f lower meal , soybean meal, soy hulls, corn gluten meal and sunflower meal was defined as “easy f low” in the current study. Oilseed meals (safflower, corn gluten meal, sunflower,soybean and pumpkin seed) had the lowest AR values among the tested i ngredients, ranging between 22 and 27° (Table 3).Therefore, oilseed meals had the best f lowability characteris-tics in t he current study. In addition to Carr’s classification,any solid material having AR values of between 25 and 35°is regarded as having a favourable flowability in practice (Bhadra et al., 2009). The AR values for the ingredients used in the present report varied from 22 to 35°, with the exception of corn gluten f eed with 39° AR values. Therefore, apart f rom corn gluten feed, the other ingredients would be considered to have a f avourable flowability when the AR value is taken into consideration. Hausner ratio values greater than 1.25 typically indicate that the substance has inferior flow characteristics, by contrast, values below 1.25 are evidence of satisfactory flowa-bility (Hausner, 1967). The HR value of the ingredients was estimated to l ie between 1.08 and 1.94 in the current study Only corn gluten meal may be considered to have a favour-able flowability by using HR as an indirect way of interpreting the flow characteristics since only it had an HR value (1.08)lower than 1.25 in this trial. Therefore, there is a contradic-tion between AR and HR when it comes to interpreting the Table 4. Correlations (R) between nutrients and physical attrib-utes for ingredients (n=52) Angle Bulk Tapped Hausner Mean of Compressibility d density density 1ratio bulk density repose Dry matter NS NS NS NS Crude ash NS 0.28* NS Ether extract 0.31* 0.44** NS 0.41** Crude protein -0.42** -0.38** 0.58***0.45***-0.29* 0.54*** Denotes significant correlation at: *p<0.05,**p<0.01, and ***0.001,respectively; NS- not signi f icant. significance of these values for the evaluation of t he f lowabil 1--ity of feed ingredients. Thus, i t would be of great importance to develop a protocol for the evaluation of the flowability of feed i ngredients, with reference to both AR and HR. The ether extract had a positive correlation wi t h AR (r=0.31). On the other hand, crude protein displayed a neg-ative correlation with AR (r=-0.42, Table 4). Similarly,Groesbeck et al. (2006) reported that flowability decreased with increased fat content in ground corn samples. The flowability of a powder can be affected by i ts fat, sugar,protein, and fibre content (Juliano and Barbosa-Canovas,2010). Similarly, Perez and Flores (1997) reported that a high fat content can lead to a decrease in flowability. One possible explanation for decreased flowability with high-fat content may be an increase in stickiness between the feed particles. Also, the location of fat molecules in the pow-der is also an important aspect which affects f lowability.This principle is further supported by the fact that powders with high levels of surface fat showed a lower degree of flowability (Vignolles et al., 2007). Therefore, the surface composition of feed particles may be an important contribu-tor to the overal l f lowability of ingredients. On the contrary,Pekel et al. (2020) reported that there was no correlation between nutrient levels including the ether extract and AR properties of corn DDGS samples. However, a notable cor-relation was encountered between AR and fat and protein content, the r and r values were not high enough to be of practical value in this trial. Compressibi l ity was positively correlated(r=0.44) with the ether extract content and neg-atively correlated (r =-0.38) with the crude protein content of the feed ingredients tested in the current study. Full-fat sunflower meal had approximately 2 times more compress-ibility (43.70%) than regular sunflower meal (20.38%) in the current study. Similarly, full-fat corn was found to have a greater compressibility value than regular corn in the current study (33.65 vs 27.68%). As crude protein levels increased, BD (r =0.58),TD(r =0.45), and MBD(r =0.54)increased. In general, density increases with increasing protein content i n the ingredients, this was confirmed by the current study (Rupp et al.,2018), although correlations were moderate (0.45 to 0.58). There were relatively low Table 5.Equations obtained from l inear relations between physS--ica l and chemica l variables (n=52) R R² Equation p Ash-TD 0.28 0.08 TD=6.8284×Ash+589.51 <0.05 EE-AR 0.31 0.10 AR=0.1681xEE+26.919 <0.05 EE-C 0.44 0.19 C=0.5912×EE+25.322 <0.01 EE-HR 0.41 0.17 HR=0.0128×EE+1.3609 <0.01 CP-AR -0.42 0.17 AR=-0.1123×CP+30.839 <0.01 CP-C -0.38 0.14 C=-0.2503×CP+35.183 <0.01 CP-BD 0.58 0.33 BD=4.0468×CP+340.71 <0.001 CP-TD 0.45 0.20 TD=3.3222×CP+537.64 <0.001 CP-HR -0.29 0.08 HR=-0.0045×CP+1.5493 <0.05 CP-MBD 0.54 0.30 MBD=3.6845×CP+439.18 <0.001 TD - tapped dens i ty; EE - Ether extract; A R - angl e of repose; C-com-pressibility; CP - crude protein; BD -bulk density; HR - Hausner ratio;MBD - mean bulk density. R R² Equation AR-C 0.59 0.35 AR=0.2397×C+20.988 <0.001 AR-BD -0.45 0.20 AR=-0.0172×BD+35.557 <0.001 AR-HR 0.62 0.39 AR=10.819×HR+12.349 <0.001 AR-MBD -0.32 0.10 AR=-0.0125×MBD+34.553 <0.05 C-BD -0.67 0.45 C=-0.0635×BD+57.004 <0.001 C-HR 0.97 0.95 HR=0.0227×C+0.7833 <0.001 C-MBD -0.39 0.15 MBD=-4.0236×C+653.32 <0.01 TD-BD 0.79 0.62 TD=0.0008×BD+0.2532 <0.001 HR-BD -0.64 0.41 HR=-0.0014×BD+2.0619 <0.001 MBD-BD 0.94 0.89 MBD=0.0009×BD+0.1266 <0.001 MBD-TD 0.95 0.90 MBD=0.8759×TD-10.739 <0.001 HR-MBD -0.37 0.14 HR=-0.0009×MBD+1.8873 <0.01 Table 6. Correlations (R) between different physical attributes for i ngredients (n=52) Mean Bulk Tapped Hausner Compressibility bulk density density ratio density Angle of repose 0.59*** -0.45*** NS 0.62*** -0.32* Compressibility -0.67*** 0.97*** -0.39** Bulk density 0.79***-0.64*** 0.94*** Tapped density NS 0.95*** Hausner ratio -0.37** Explanations as in Table 4. correlations between TD and crude ash (r =0.28) and also between HR and ether extract (r=0.41). The prediction equations which were calculated using significant corre-lations between the physical and chemical properties are given in Table 5. The AR values had an inverse correlation with BD (r=-0.45) and MBD (r=-0.32, Table 6). Since BD, TD,and MBD are different ways of determining the density of solids, the higher t he BD value, the higher t he TD (r=0.79)and MBD (r = 0.94) values. Similarly, the higher the TD value, the higher the MBD (r=0.95) value. The HR value was negatively correlated with the BD (r=-0.64) and MBD (r=-0.37) values. Compressibility was found to be nega-tively associated with BD (r=-0.67) and MBD (r=-0.39).It was found that the compressibility of solid materials was inf l uenced by the density, particle size/shape of the par-ticles, moisture content, and also the cohesiveness of the materials (Yan and Barbosa-Canovas, 1997; Hamdani et al.,2014). The HR value was positively correlated with both AR (r = 0.62) and compressibility (r = 0.97) in this t rial, this complied closely with results reported for corn DDGS (Pekel et al., 2020). Since HR is a function of TD and BD, and these parameters may provide indirect information about com-pressibility, a greater HR value results in a higher degree of compressibility (r=0.97,r²=0.95,Table 7). Similarly, a very high degree o f correlation was shown by Bhadra et al.(2009)between the AR and HR values for DDGS samples. AR was positively associated with compressibility (r=0.59) to a sig-nificant extent. Therefore, the higher t he compressibility of an ingredient, the higher the AR value and consequently the Table 7. Equations generated from a single linear regression between physical variables (n=52) lower the flowability (Carr, 1965). Surprisingly, corn gluten feed had the highest AR value, but it did not have a relatively high compressibility value, although there was a significant correlation between AR and compressibility. The same phe-nomena applied in the case of wheat middlings and corn bran that had very high AR values (34.5 and 32.9°, respective-ly) but did not have high compressibility (31.4 and 27.8%,respectively) values. A greater surface fat content has been shown to result in a greater cohesiveness in dairy powders (Fitzpatrick et al., 2007). Furthermore, the greater the degree of cohesiveness of a powder, the more inferior the f lowabil-ity. This explains, although only i n part, why the highest AR value obtained for the corn gluten feed was attributed to t he relatively higher fat content (17%) in this study (Pishnamazi et al., 2019). However, although wheat middlings and corn bran had very high AR values, they did not have a high fat content as that result discussed above for corn gluten feed.Hence, the cohesiveness hypothesis would not apply to these ingredients from a high f at content perspective. CONCLUSIONS 1. The greater the protein content, the lower the com-pressibility (r=-0.38) value and the lower the angle of repose (r =-0.42) value of the ingredients. 2. An increase in the ether extract content of the ingre-一 dients resulted in a subsequent increase in angle of repose (r=0.31) and therefore in a decrease in flowability (p<0.05).By contrast, the lower the ether extract content, the lower the compressibil i ty (r=0.44) and Hausner ratio (r=0.41) values. 3. The feed i ngredients varied widely in their flowabi l i-ty. Oilseed meals were classified as “easy flow”, while most grains were i n the “cohesive" category, along with most other ingredients i ncluding by-products that were classified as having a “moderate f low”. 4. The Hausner ratio, compressibility, ether extract, and protein content may be regarded as favourable indicators for feed flowability. 5. Feed ingredients with low levels of compressibility,Hausner ratio, and ether extract together with a high protein content may be desirable for i mproved flow characteristics. Conflict of interest: The authors declare that they have no conflict of interest. ACKNOWLEDGMENTS This work was funded by Scientific Research Projects Coordination Unit of Istanbul University-Cerrahpasa.Project number: TSA-2021-35853. The authors would like to acknowledge t he Istanbul University-Cerrahpasa for the endowment. REFERENCES Aguilera J.M., del Valle J.M., and Karel M., 1995. Caking phe-nomena in amorphous food powders. Trends Food Sci.Technol ., 6, 149-155,https://doi.org/10.1016/S0924-2244(00)89023-8 Al-Hashemi H.M.B. and Al-Amoudi O.S.B., 2018. A review on the angle of repose of granular materials, Powder Technol.,330.397-417,https://doi .org/10.1016/j.powtec.2018.02.003. Aliyu B., Agnew B., and Douglas S., 2010. Croton megalocar-pus (Musine) seeds as a potential source of bio-diesel.Biomass Bioenerg., 34, 1495-1499,https://doi .org/10.1016/j.biombioe. 2010.04.026 Al l tech, 2017. World feed production exceeds 1 bil l ion metric tons according to 2017 Alltech Global Feed Survey. Press Releases S ., https://www.alltech.com/press-release/world-feed-production-exceeds-1-billion-metric-tons-accord-ing-2017-alltech-global AOAC, 2006. Official Methods of Analysis of AOAC Interna-tional. 18th ed.,AOAC Int., Gaithersburg, MD, USA. Bhadra R., Rosentrater K.A., and Muthukumarappan K.,2008. Surface characteristics and f lowability of distillers dried grains with solubles. ASABE meeting presentation,https://doi.org/10.13031/2013.25024 Bhadra R., Muthukumarappan K., and Rosentrater K.A.,2009. Flowability properties of commercial distillers dried grains with solubles (DDGS). Cereal Chem., 86,170-180,https://doi.org/10.1094/CCHEM-86-2-0170 Bhadra R., Casada M.E., Thompson S.A., Boac J.M., Maghi-rang R.G., Montross M.D., Turner A., and McNeill S.G.,2017. Field-observed angles of repose for stored grain in the United States. Appl . Eng. Agric., 33,131-137,https://doi.org/10.13031/aea.11894 Briggs J.L.,Maier D.E., Watkins B.A., and Behnke K.C., 1999.Effect of ingredients and processing parameters on pellet qual i ty. Poult. Sci., 78,1464-1471,https://doi.org/10.1093/ps/78.10.1464 Carr R.L., 1965. Evaluating flow properties of solids. Chem.Eng., 72,163-168. Dozier ⅢI W.A., 2001. Cost Effective Pellet Quality for Meat Birds. Feed Management., 52,1-3. Fitzpatrick J.J., Barry K., Cerqueira P.S.M., Iqbal T., O'Neill J., and Roos Y.H., 2007. Effect of composition and storage conditions on the flowability of dairy powders. Int. Dairy J.,17, 383-392, https://doi.org/10.1016/j.idairyj.2006.04.010 Fogagnolo J.B., Ruiz-Navas E.M.,Robert M.H., and Torralba J.M., 2003. The effects of mechanical alloying on the com-pressibility of aluminum matrix composite powder. Mater.Sci . Eng. A., 355(1-2),50-55,https://doi.org/10.1016/S0921-5093(03)00057-1 Ganesan V., Rosentrater K.A., and Muthukumarappan K.,2008. Flowability and handling characteristics of bulk sol-ids and powders: A review with i mplications for DDGS.Biosyst Eng., 101,425-435,https://doi.org/10.1016/j.biosystemseng.2008.09.008 Ganesan V., Rosentrater K.A., and Muthukumarappan K.,2009. Physical and f low properties of regular and reduced fat di s tillers dried grains with solubles (DDGS). Food Bio-process Technol.,2,156-166,https://doi.org/10.1007/s11947-007-0026-X Groesbeck C.N., Goodband R.D., Tokach M.D., Nelssen J.L.,Dritz S.S., and DeRouchey J.M., 2006. Particle size, mil 1l 1type, and added fat influence angle of repose of ground corn. Prof. Anim. Sci ., 22, 120-125,https://doi.org/10.15232/S1080-7446(15)31075-5 Gupta R.K. and Das S.K., 1997. Physical properties of sunflow-er seeds. J . Agric. Eng. Res., 66, 1-8,https://doi.org/10.1006/jaer.1996.0111 Hamdani A.,Rather S.A., Shah A., Gani A., Wani S.M., Masoodi F.A., and Gani A., 2014. Physical properties of barley and oats cultivars grown in high altitude Himalayan regions of India. J . Food Meas. Charact.,8,296-304,https://doi.org/10.1007/s11694-014-9188-1 Hao X.Y., Xin H.S., Gao H., Zhang X.Y., Lin C., Xu W.B.,Wang,Y.Z., and Zhang Y.G., 2016. Relationship between the physical parameters, chemical compositions and rumen degradation kinetics parameters of certain feedstuffs for ru-minants. Anim. Feed Sci. Technol., 211, 84-91,ht t ps://doi.org/10.1016/j.anifeedsci.2015.11.009 Hausner H.H., 1967. Friction conditions in a mass of metal pow-der. Polytechnic Inst. of Brooklyn. Univ. of California, LA USA. Jadhav H.T.,Ozoh C., Marripudi S.T., Cao X., and Rosentrater K.A., 2017. Studies on ground corn flowability as affected by particle size and moisture content. In 2017 ASABE Annual International Meeting. American Society of Agricultural and Biologica l Engineers. Jiang X., and Rosentrater K., 2015. Factors i nfluencing feed i n-gredient flowability. In 2015 ASABE Annual Internationa Meeting. American Society of Agricultural and Biological Engineers. Johnston L.J., Goihl J., and Shurson G.C., 2009. Selected ad-ditives did not improve flowability of DDGS i n commercial systems. Appl . Eng. Agric.,25(1),75-82,ht t ps://doi.org/10.13031/2013.25422 Juliano P. and Barbosa-Canovas G.V, 2010. Food powders flowability characterization: t heory, methods, and applica-tions. Annu. Rev. Food., 1, 211-239,https://doi.org/10.1146/annurev.food.102308.124155 Kammel D.W., 2000. Physical Characteristics of Alternatives Feed, USA: Agricultural Engineering Department Univer-sity of Wisconsin-Madison Cooperative Extension. Khazaei J. and Ghanbari S., 2010. New method for simultane-ously measuring the angles of repose and frictional properties of wheat grains. Int. Agrophys., 24, 275-286. Lachman L., Lieberman H., and Kanig J., 1986. The Theory and Practice of Ind u strial Pharmacy. Pa.: Lea and Febiger Philadelphia, USA. Liu L.X., Marziano I., Bentham A.C., Litster J.D., White E.T.,and Howes T., 2008. Effect of particle properties on the flowability of ibuprofen powders. I nt. J. Pharm., 362,109-117,https://doi.org/10.1016/j .ijpharm.2008.06.023 Matchett A.J., 2006. Stresses i n a bulk solid in a cylindrica l silo,including an analysis of ratholes and an interpretation of rathole stabi li ty criteria. Chem. Eng. Sci ., 61,2035-2047,https://doi.org/10.1016/j.ces.2005.10.049 Mohsenin N.N., 2020. Physical Properties of Plant and Animal Materials: v. 1: Physical Characteristics and Mechanical Properties. Routledge. Molenda M., Montross M.D., Horabik J., and Ross I.J., 2002.Mechanical properties of corn and soybean meal. Trans.ASAE.,45,1929-1936,https://doi.org/10.13031/2013.11408 Moss A., Chrystal P., Crowley T., and Pesti G., 2021. Raw mate-rial nutrient variability has substantial impact on the potential profitability of chicken meat production.J. Appl . Poult. Res.,30, 10012, https://doi.org/10.1016/j.japr.2020.100129 Pekel A.Y., Calik A., Kuter E., Alatas M.S., Oklen S.B., Kizil A., Bulat M., and Cengiz O., 2020. Impact of chemical and physical properties on flowability characteristics of corn disti l lers dried grains with solubles. Int. Agrophys.,34,195-202, https://doi.org/10.31545/intagr/117502 Perez M.F. and Flores R.A., 1997. Particle size of spray dried soymilk . Appl . Eng.Agric., 13,647-652,https://doi.org/10.1515/intag-2015-0051 Pishnamazi M., Casilagan S., Clancy C., Shirazian S., Iqbal J.,Egan D., Edlin C., Croker D.M., Walker G.M., and Collins M.N., 2019. Microcrystalline cel l ulose, l actose and lignin blends: process mapping of dry granulation via roll compaction. Powder Technol., 341,38-50,https://doi.org/10.1016/j.powtec.2018.07.003 Probst K.V.,Ambrose R.P.K.,Pinto R.L.,Bali R.,Krishnakumar P., and Ileleji K.E., 2013. The effect o f moisture content on the grinding performance of corn and corn cobs by hammer milling. T r ans. ASABE., 56, 1025-1033,https://doi.org/10.13031/TRANS.56.9996 Rupp L.S., Molitor M.S., and Lucey J.A., 2018. Effect of pro-cessing methods and protein content of the concentrate on the properties of milk protein concentrate with 80% protein.J . Dairy Sc i ., 101,7702-7713,https://doi.org/10.3168/jds.2018-14383 SAS Institute ., 2006.“SAS/STAT User’s Guide. Release 9.1”,Cary, SAS Inst Inc., NC,USA. Stanley L.M., 1981. Agricultural materials handling manual , Part 7 Engineering properties. Section 7.1 Properties of agricul-tural materials. Steckel H., Markefka P., and Kammelar R., 2006. Effect of milling and sieving on functional i ty of dry powder inhala-tion products. Int. J. Pharm., 309,51-59,https://doi.org/10.1016/j.ijpharm.2005.10.043 Tang P., Patterson P.H., and Puri V.M., 2006. Effect of feed segre-gation on the commercial hen and egg quality. J. Appl. Poult.Res., 15, 564-573, https://doi.org/10.1093/japr/15.4.564 Teunou E., Fitzpatrick J.J., and Synnott E.C., 1999. Characteri-zat i on of food powder f l owability. J. Food Eng., 39, 31-37,https://doi.org/10.1016/S0260-8774(98)00140-X Thomas M., and van der Poel A.F.B., 1996. Physical quality of pelleted animal feed 1. Criteria for pellet qual i ty. Anim.Feed Sci . Technol ., 61,89-112,https://doi.org/10.1016/0377-8401(96)00949-2 Tumuluru J.S., Tabil L.G., Song Y., Iroba K.L., and Meda V.,2014. Gr i nding energy and physical propert i es of chopped and hammer-milled barley, wheat , oat, and canola straws.Biomass Bioenerg.,60, 58-67,https://doi.org/10.1016/j.biomass.2013.10.011 Wang Y.U.J.I.E., Chung D.S., and Spillman C.K., 1995. Physi-cal propert i es of soybean meal . Cereal Chem., 72, 523-526. Vignolles M.L., Jeantet R., Lopez C., and Schuck P., 2007.Free fat, surface fat and dairy powders: interactions be-tween process and product. A review. Le Lait.,87,187-236,https://doi .org/10.1051/la i t:2007010 Yan H. and Barbosa-Canovas G.V., 1997. Compression charac-teristics ofagglomerated food powders: Effect ofagglomerate size and water activity. Food Sci. Technol. Int., 3,351-359,https://doi .org/10.1177/108201329700300506
确定
还剩6页未读,是否继续阅读?

产品配置单


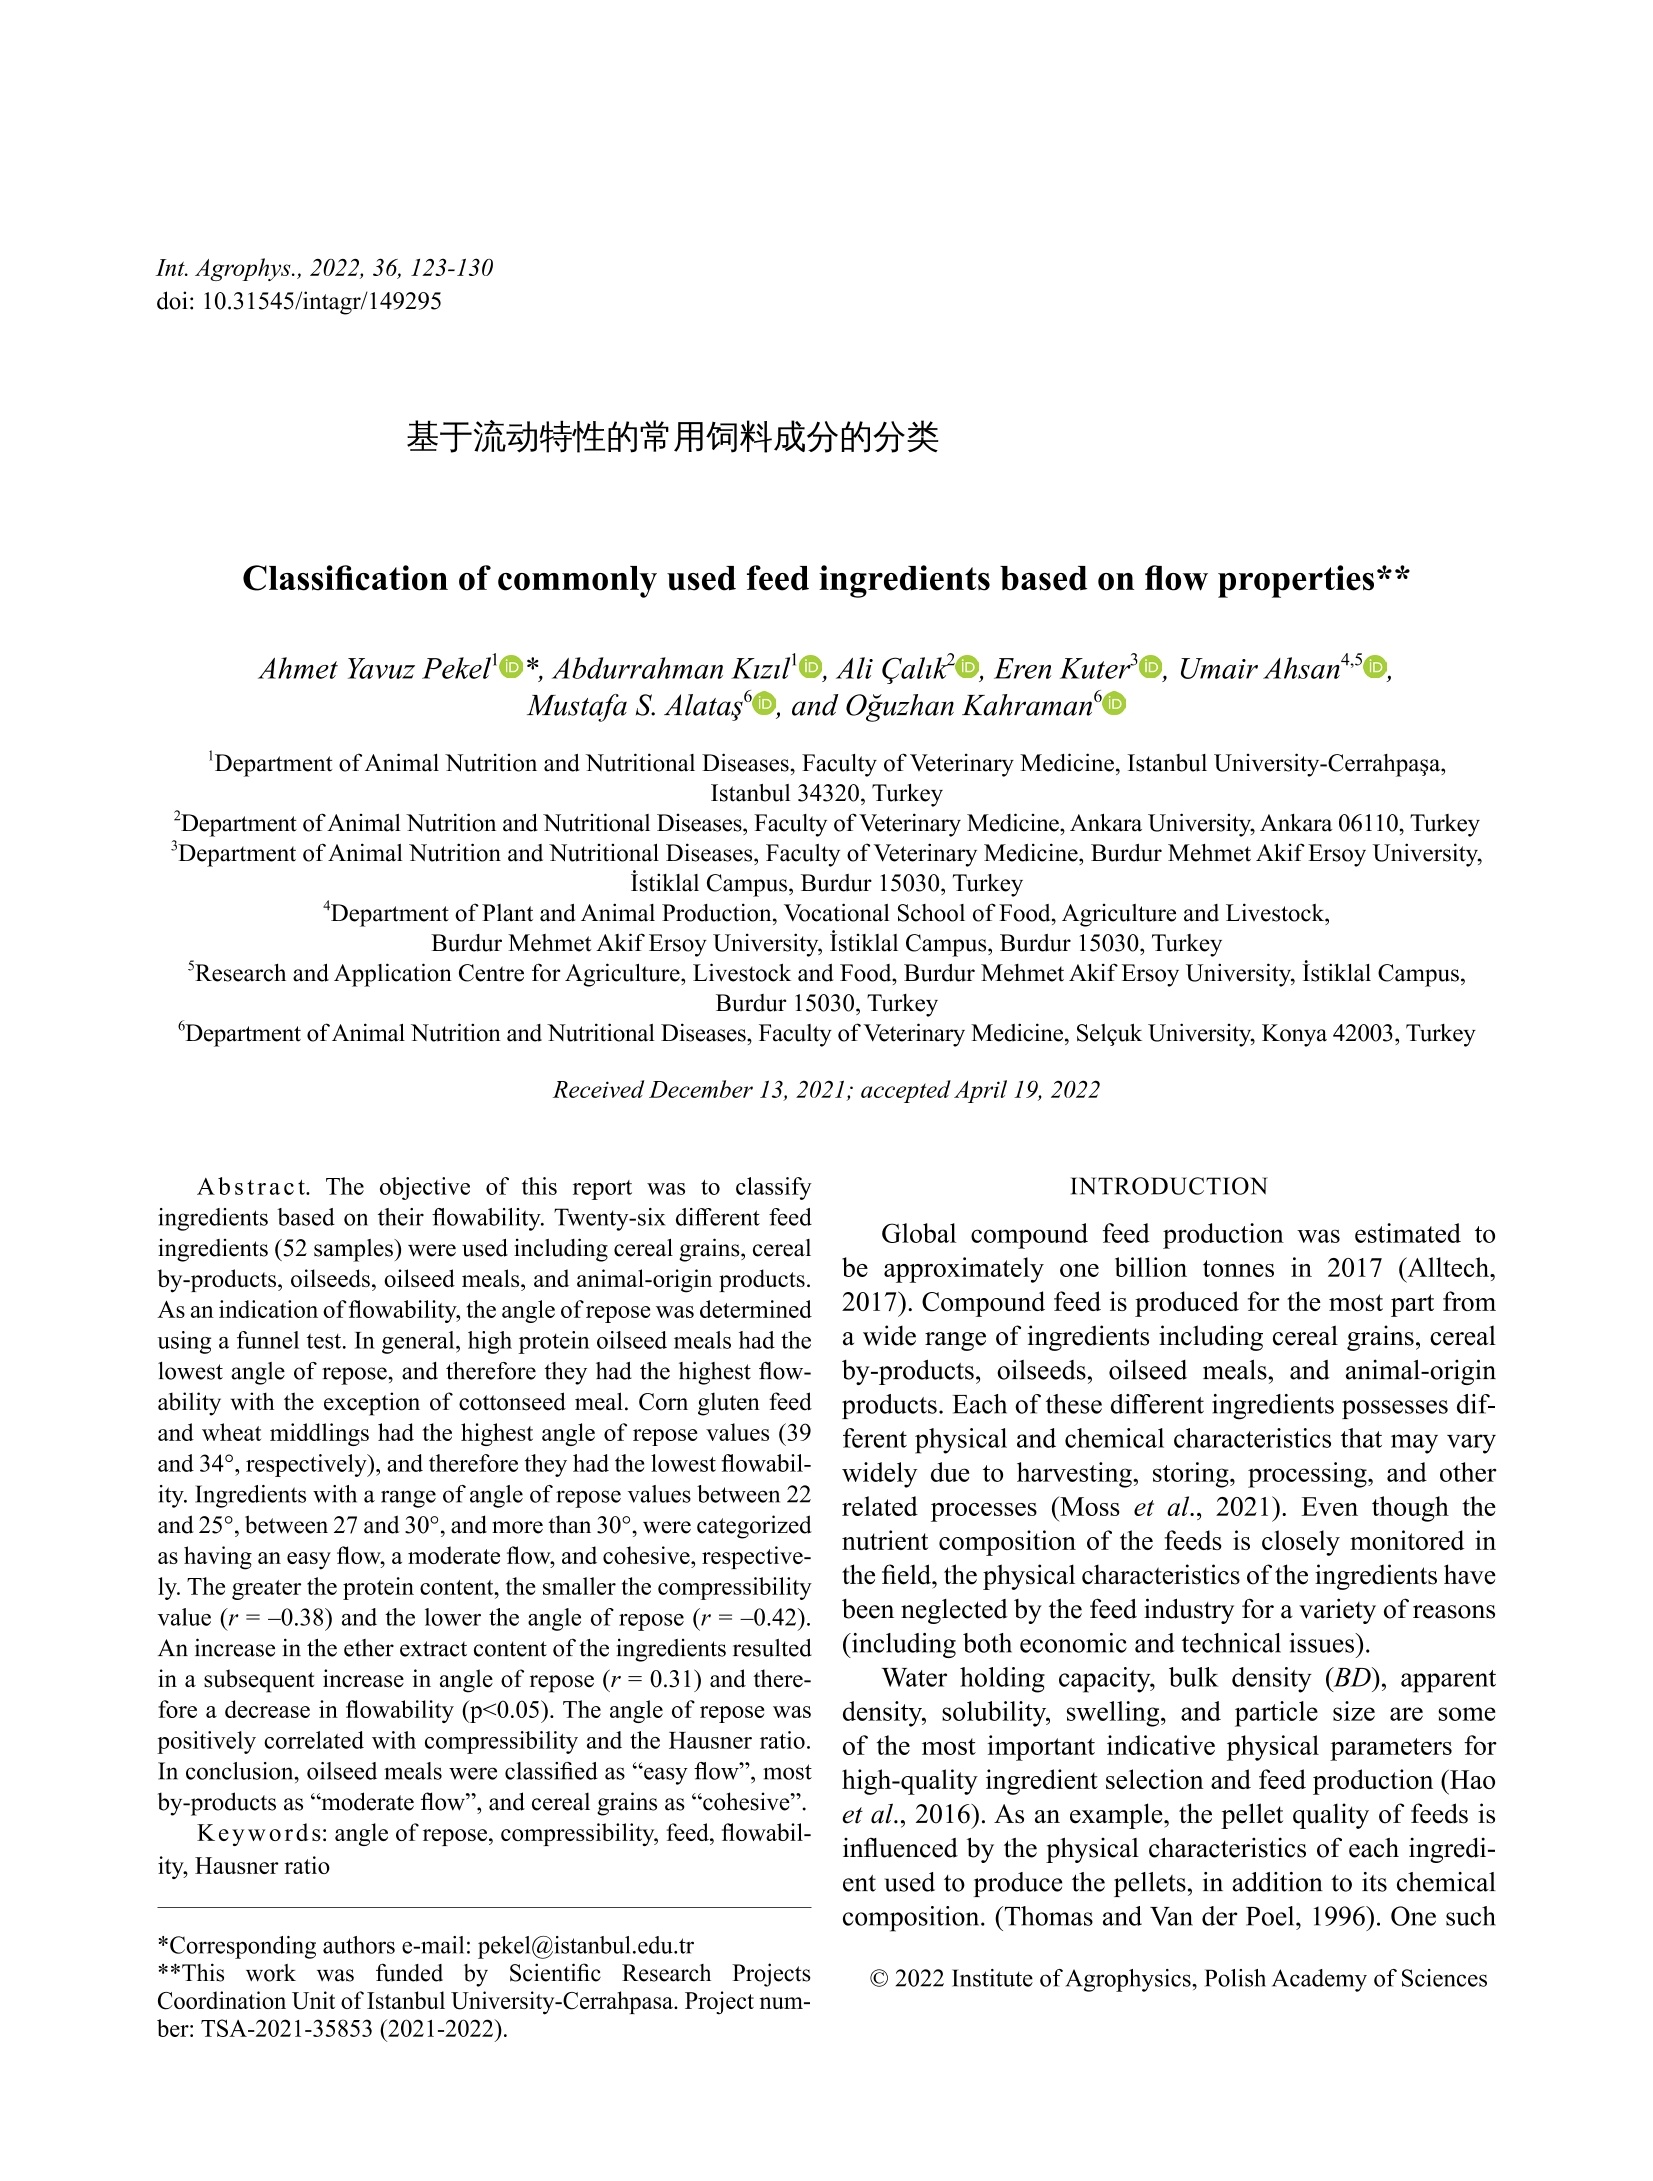
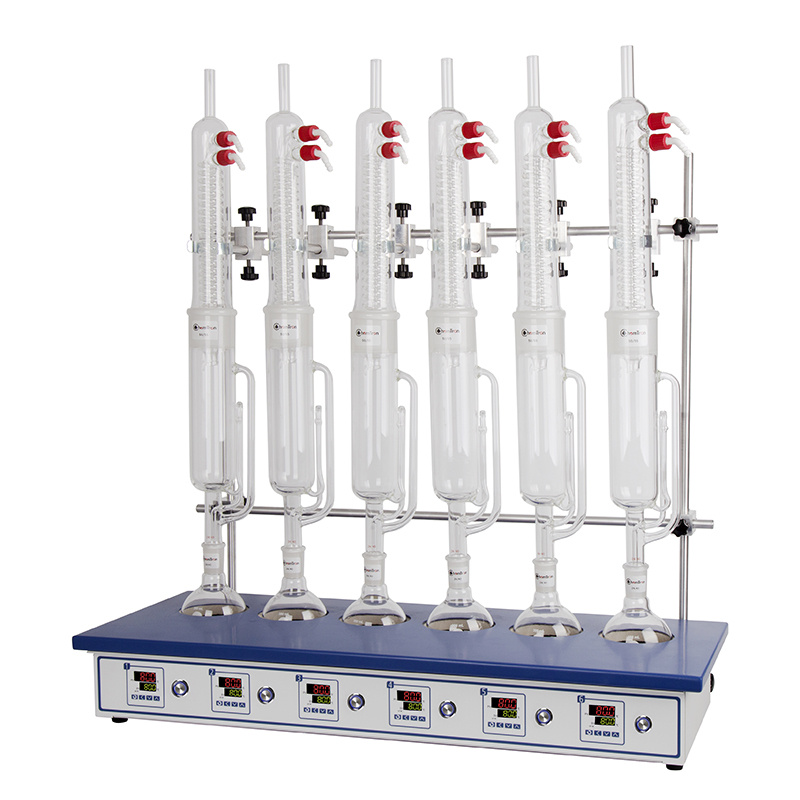
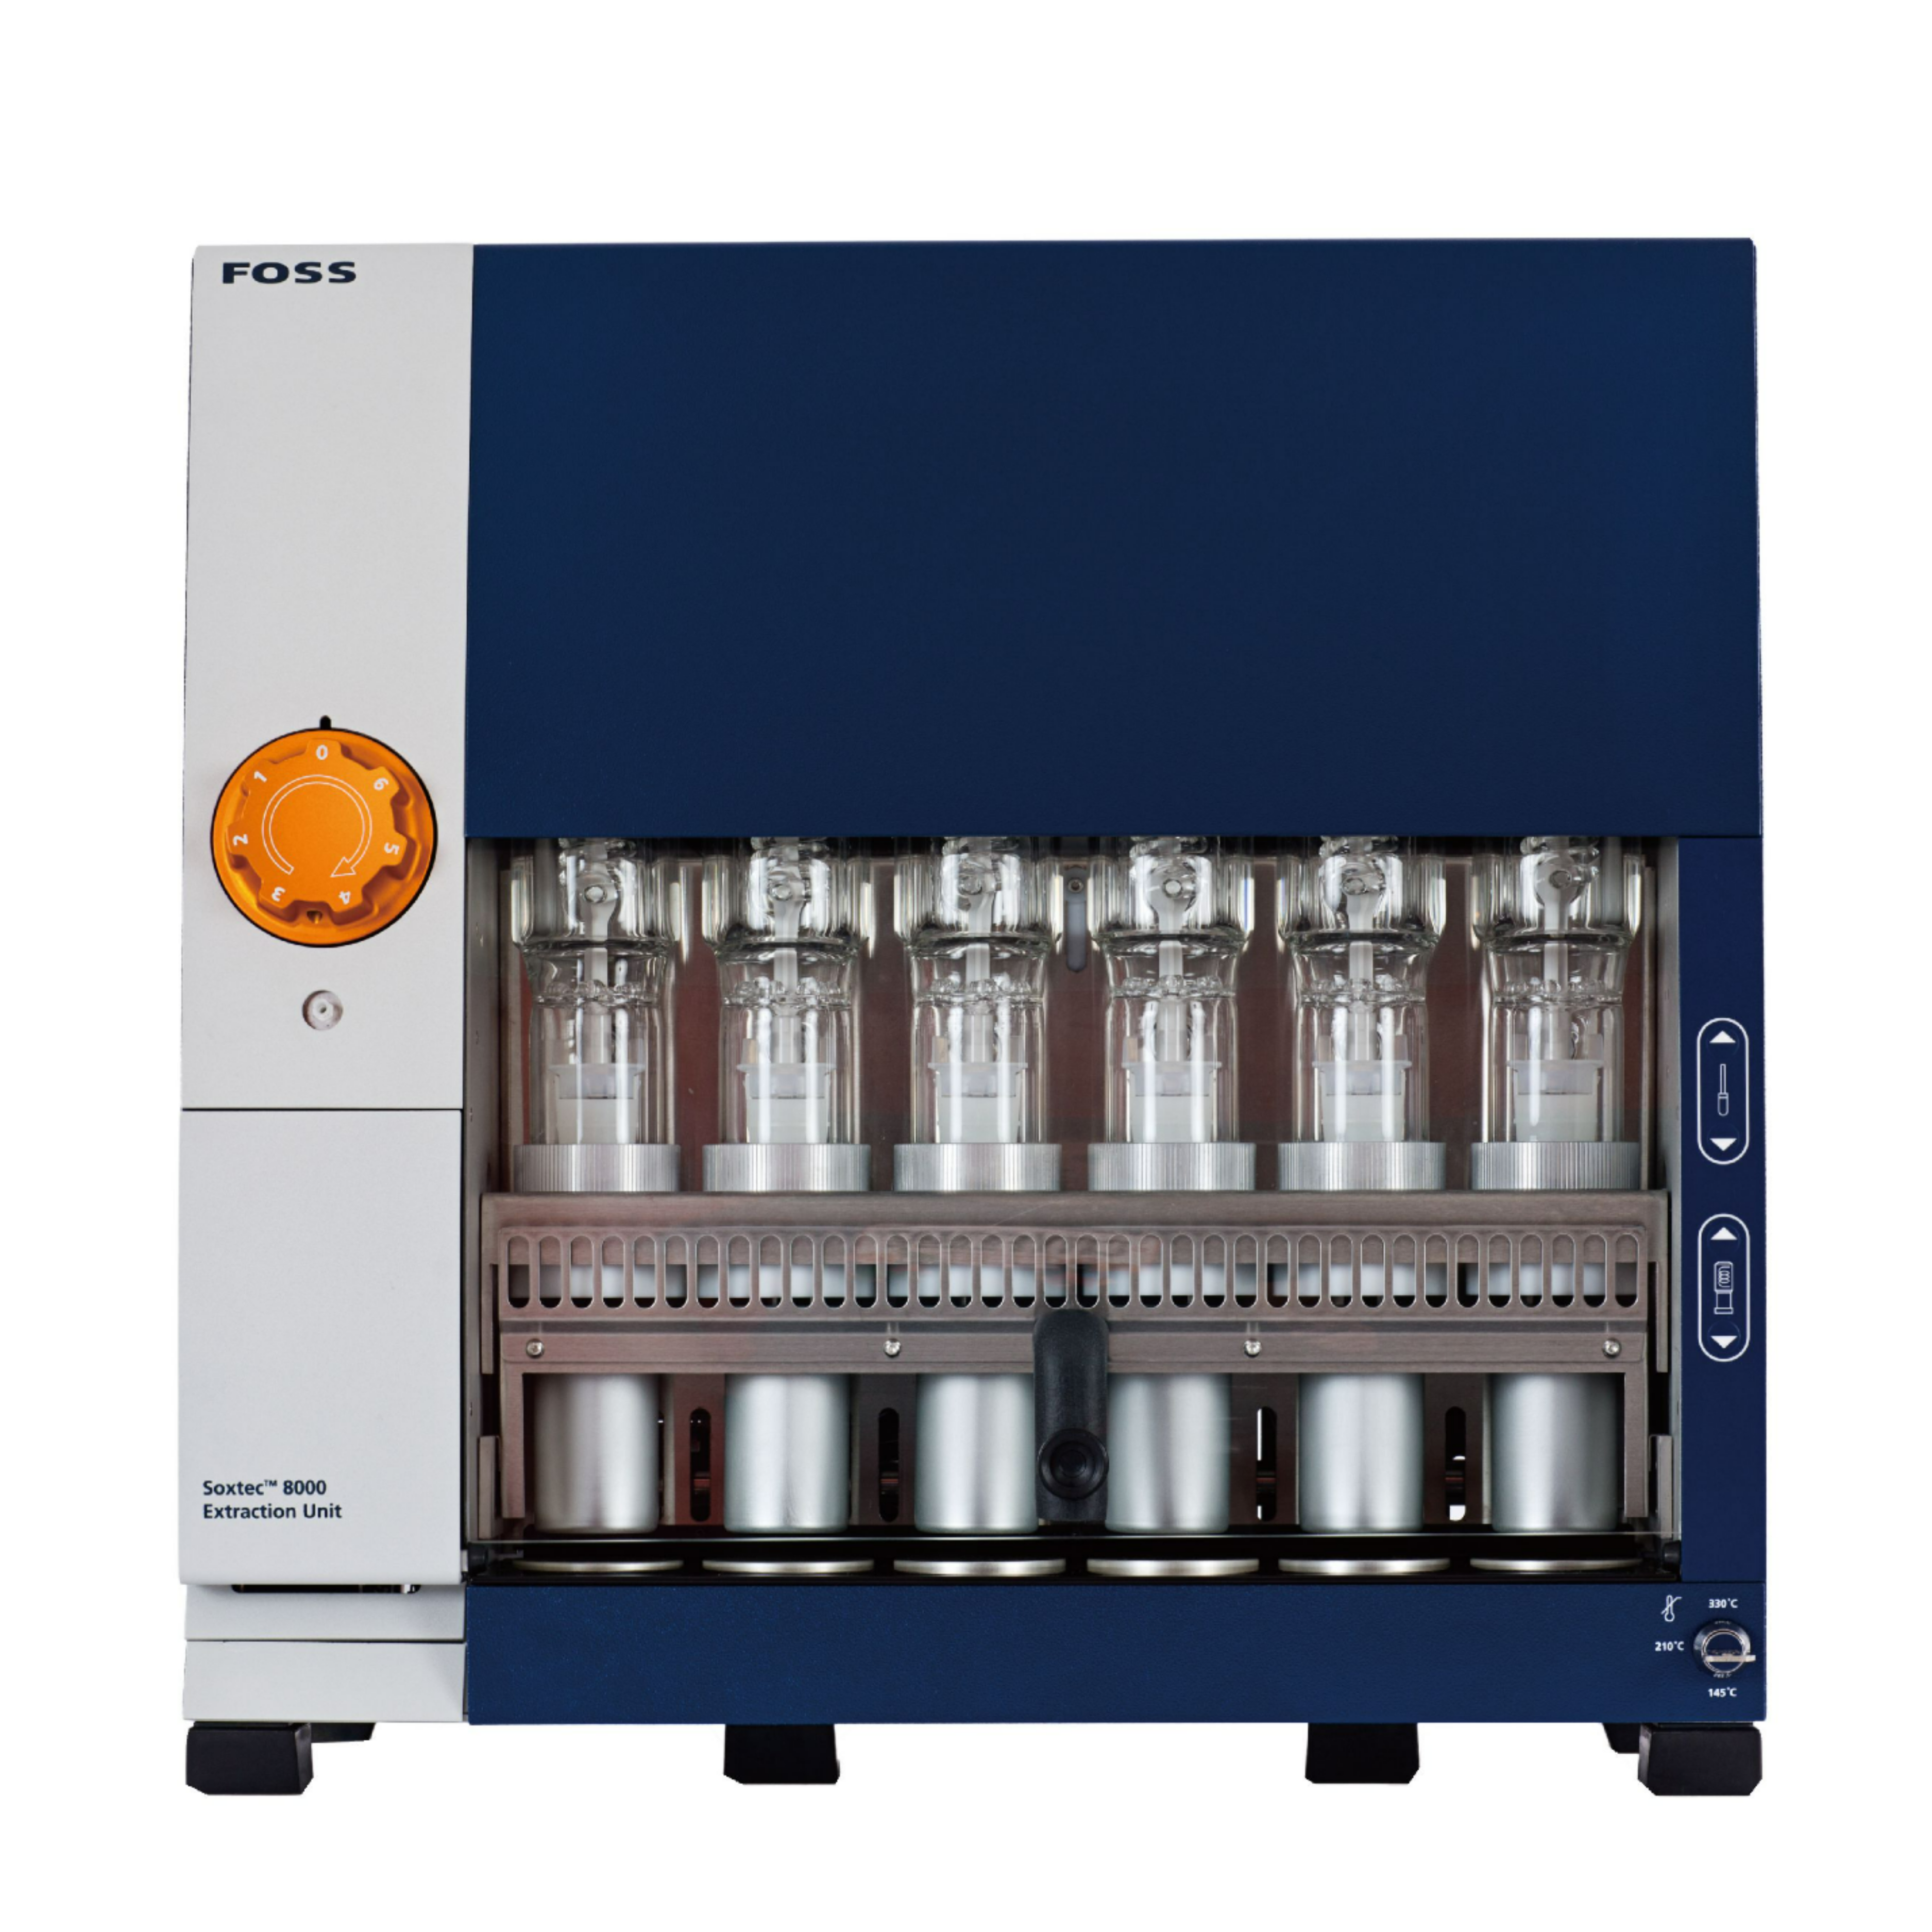
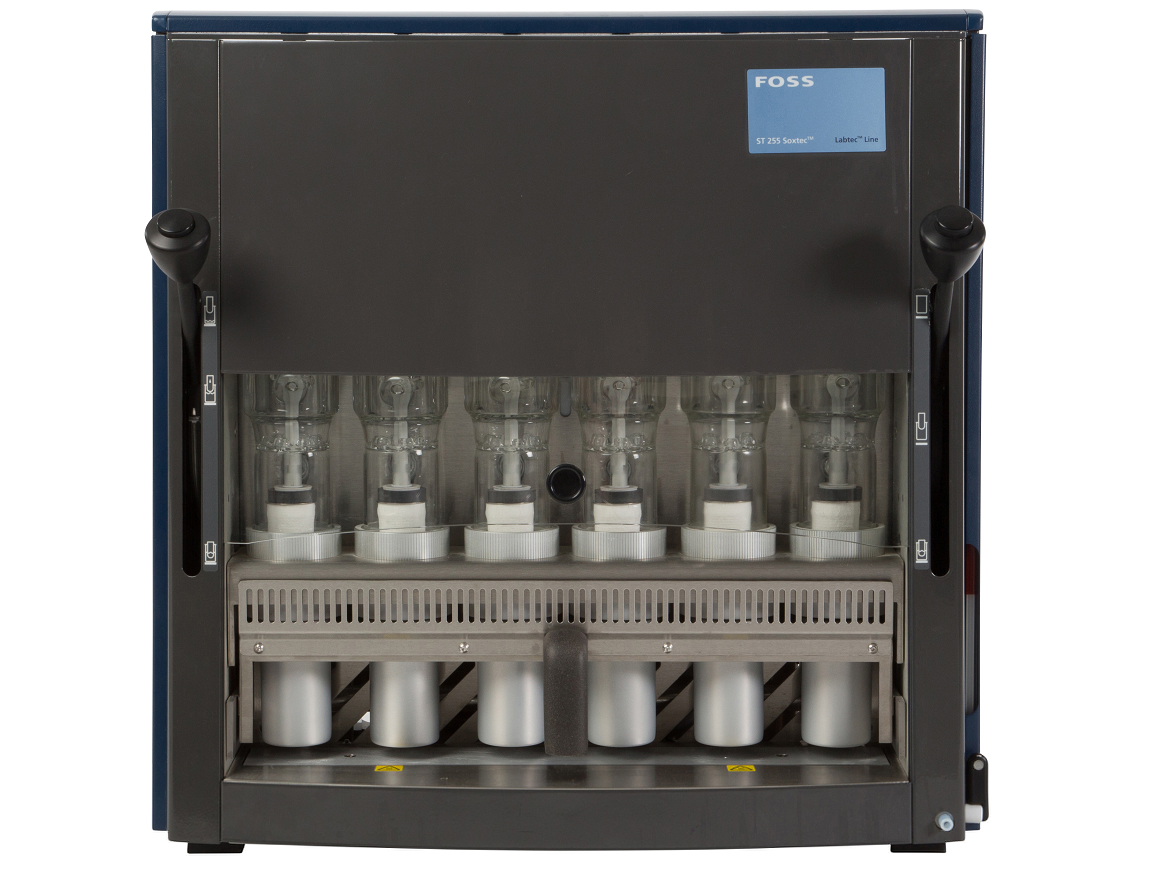
中国格哈特为您提供《26种常用饲料原料中蛋白质和脂肪含量的检测》,该方案主要用于饲料中营养成分检测,参考标准--,《26种常用饲料原料中蛋白质和脂肪含量的检测》用到的仪器有格哈特全自动超级总脂肪测定系统HT6+SOX416、格哈特维克松废气实验室废物处理系统涤气VS、格哈特凯氏消化系统KT8S、格哈特带自动进样器凯氏定氮仪VAP500C、德国加液器MM、滤纸筒


相关方案
更多
该厂商其他方案
更多