


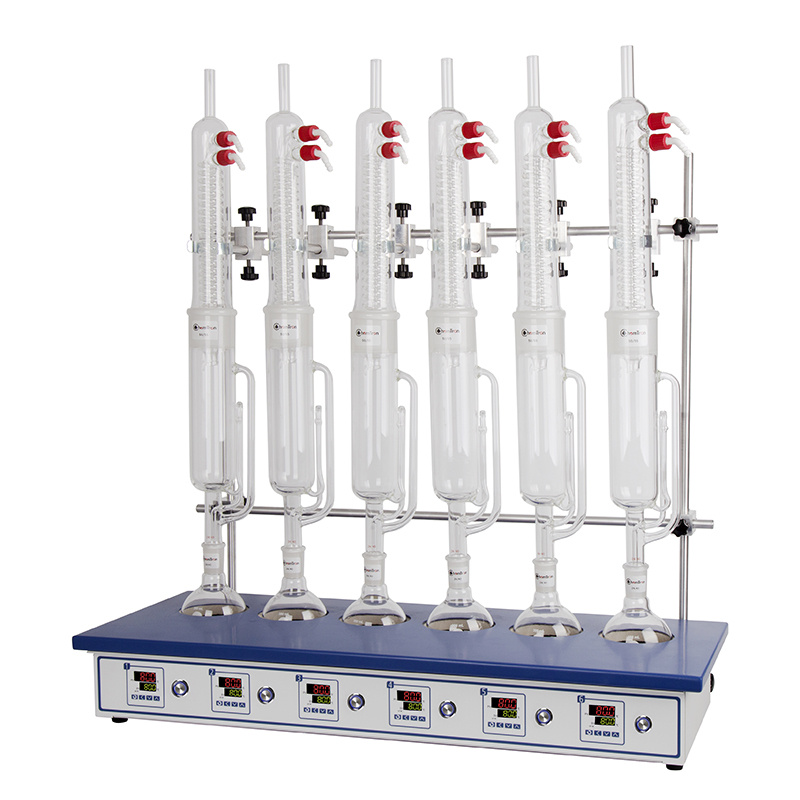
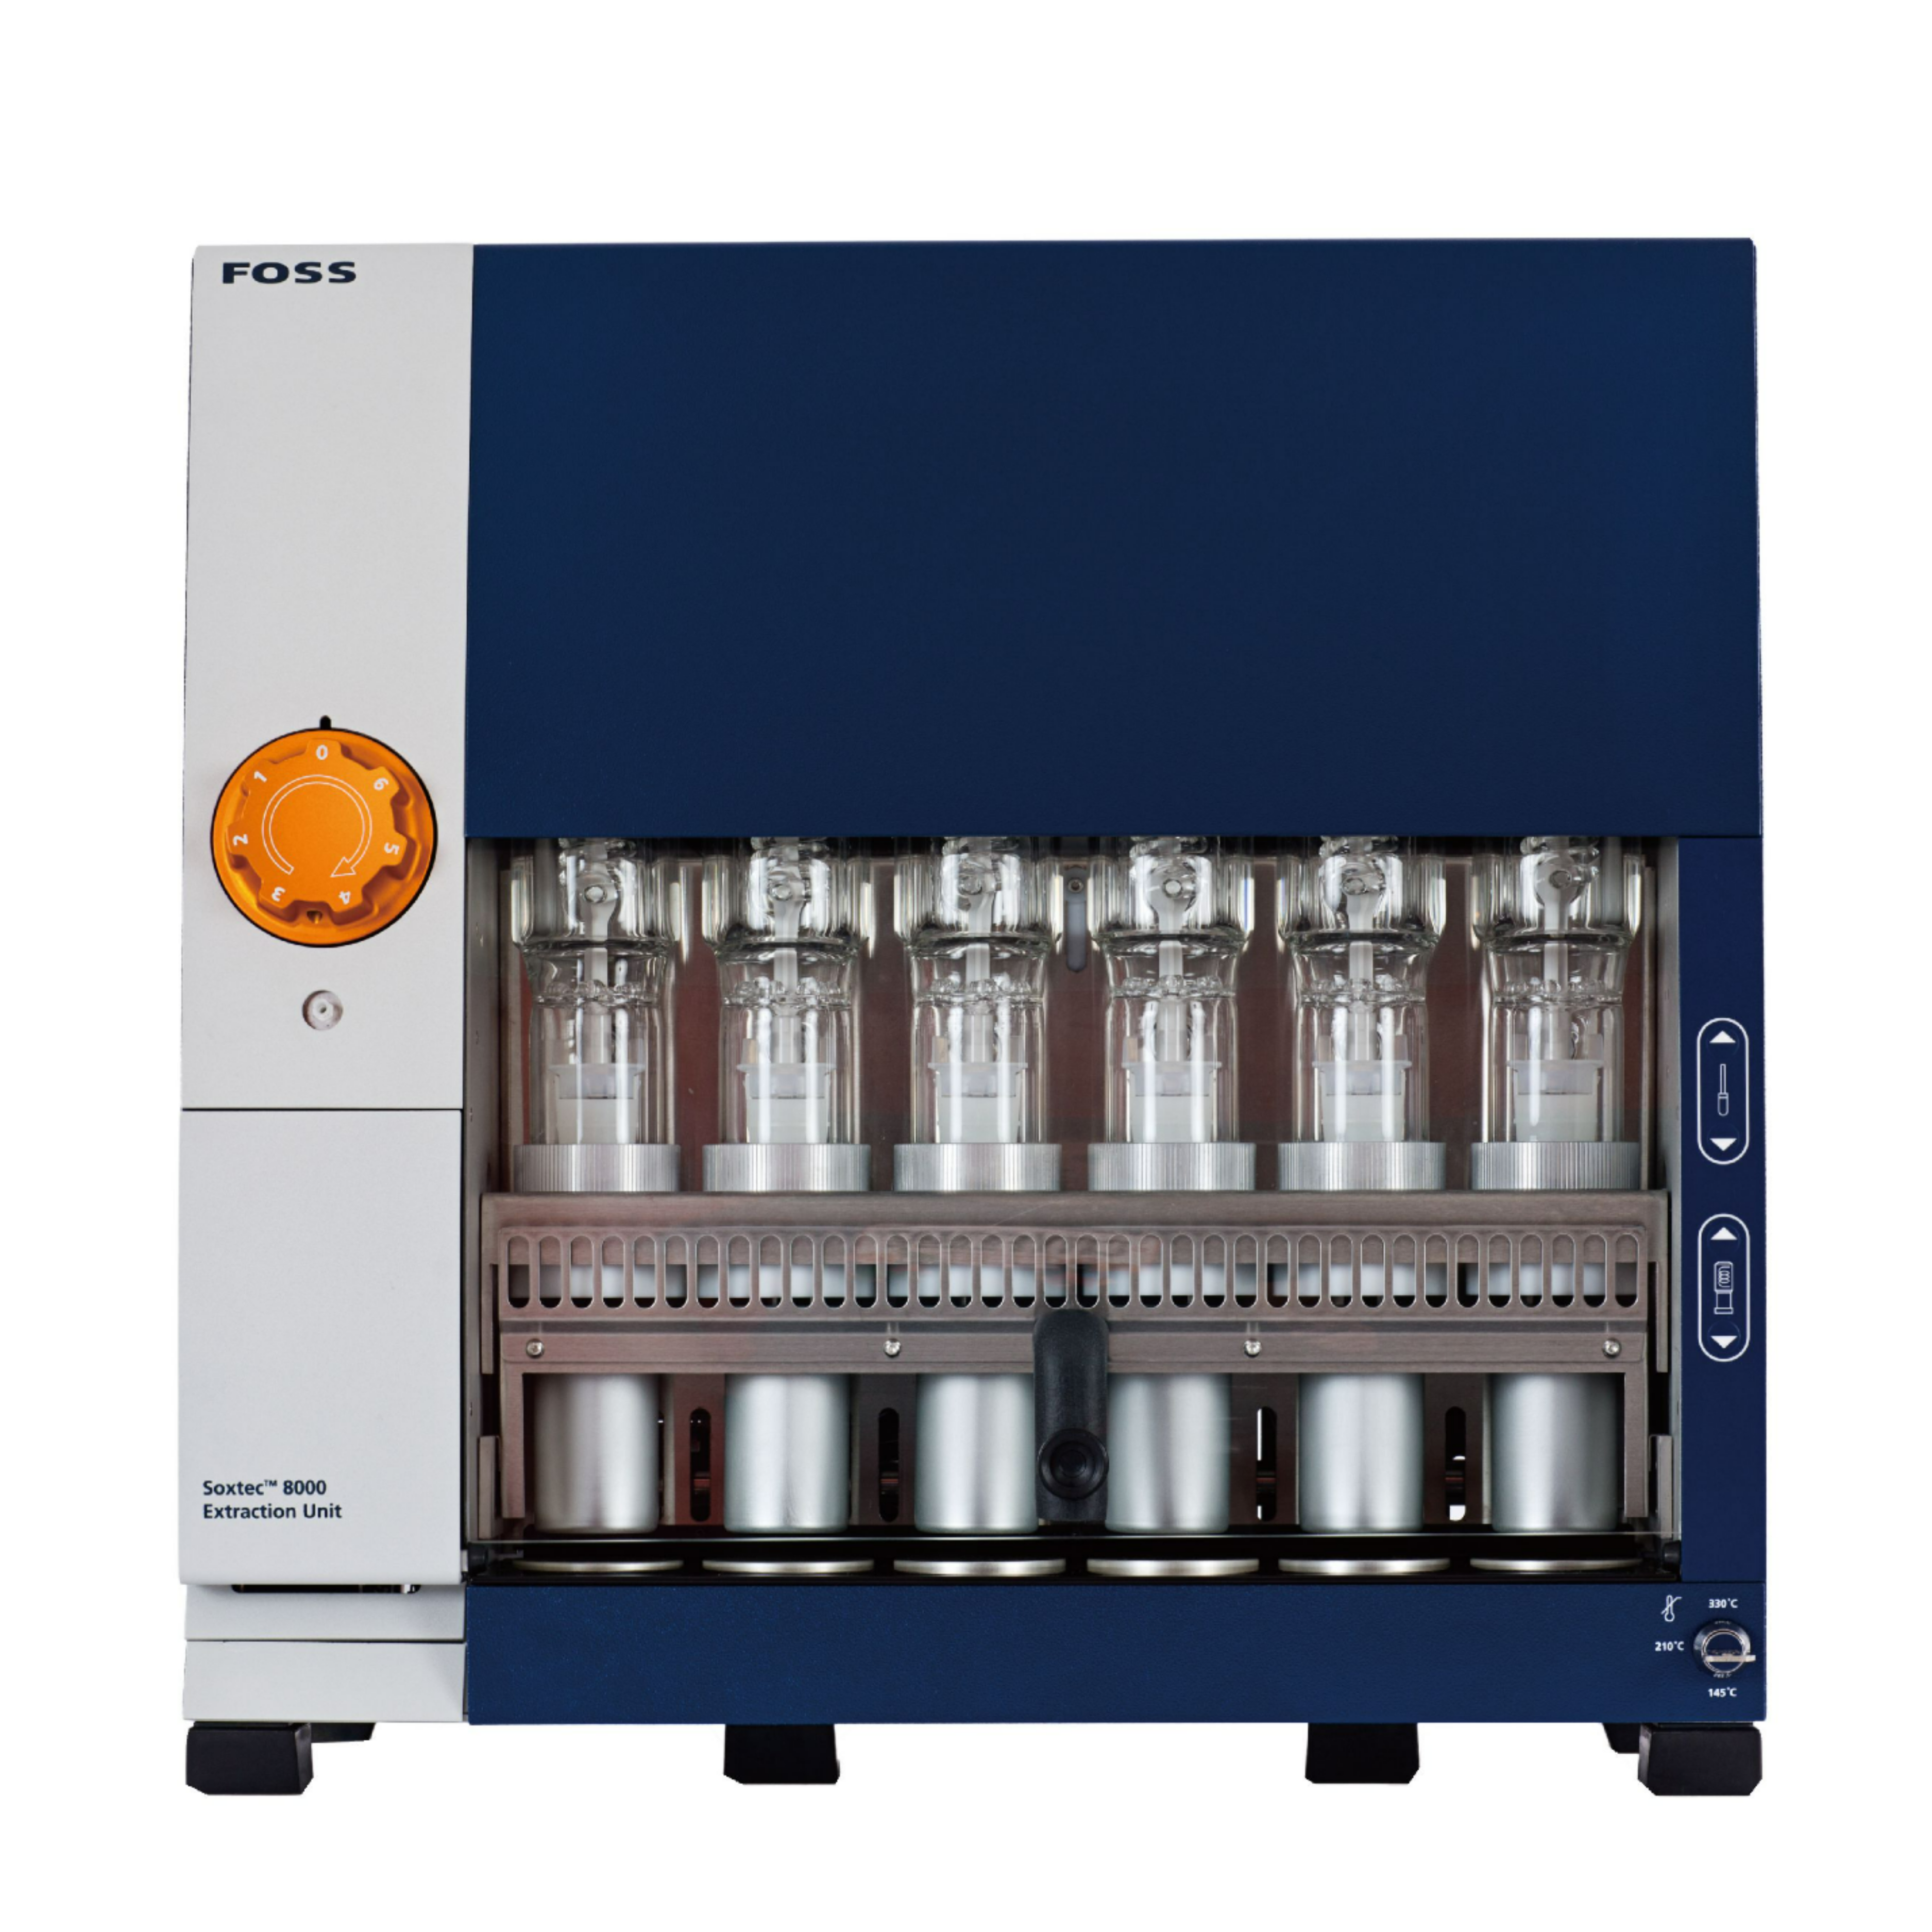
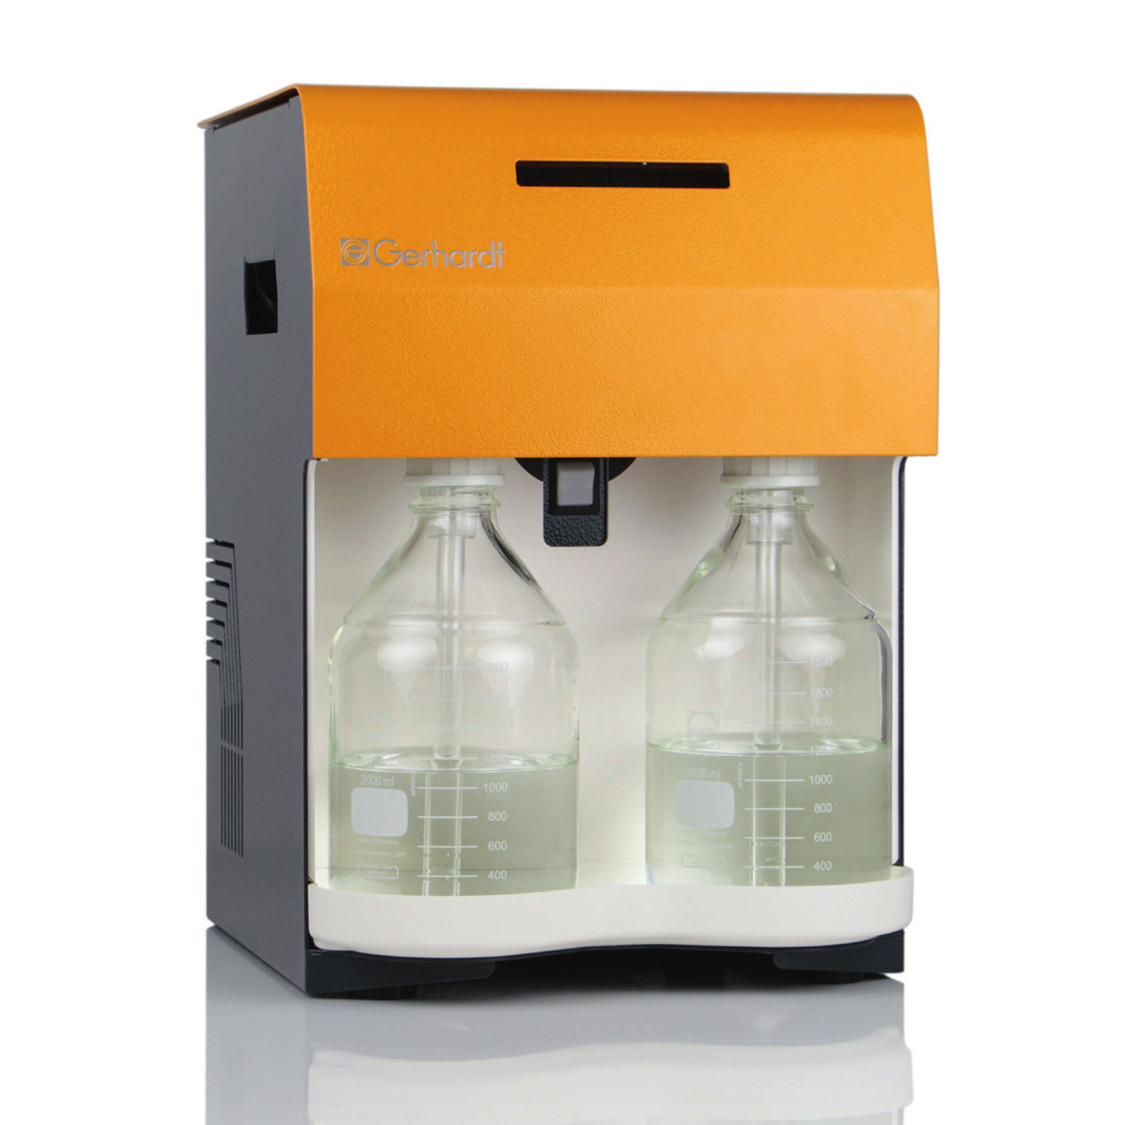
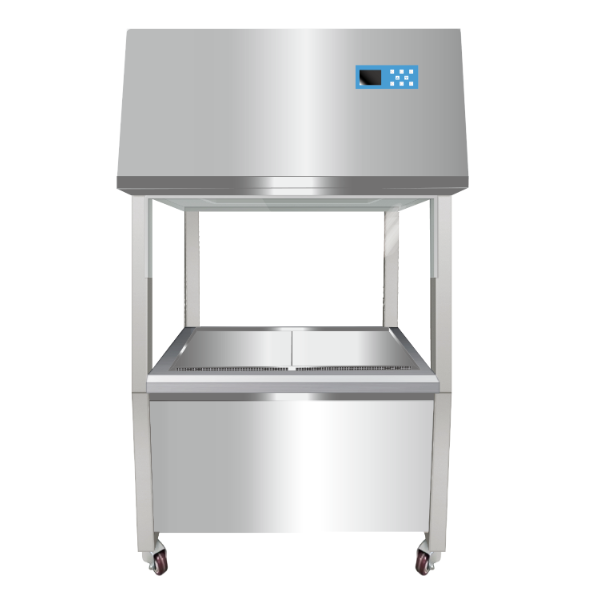
使用格哈特公司凯氏定氮仪测定虹鳟鱼鱼肉,及其粪便中蛋白质含量,使用格哈特公司海卓森Hydrotherm全自动超级酸水解结合索克森Soxtherm全自动快速索氏提取仪测定虹鳟鱼鱼肉,及其粪便中总脂肪含量。
方案详情

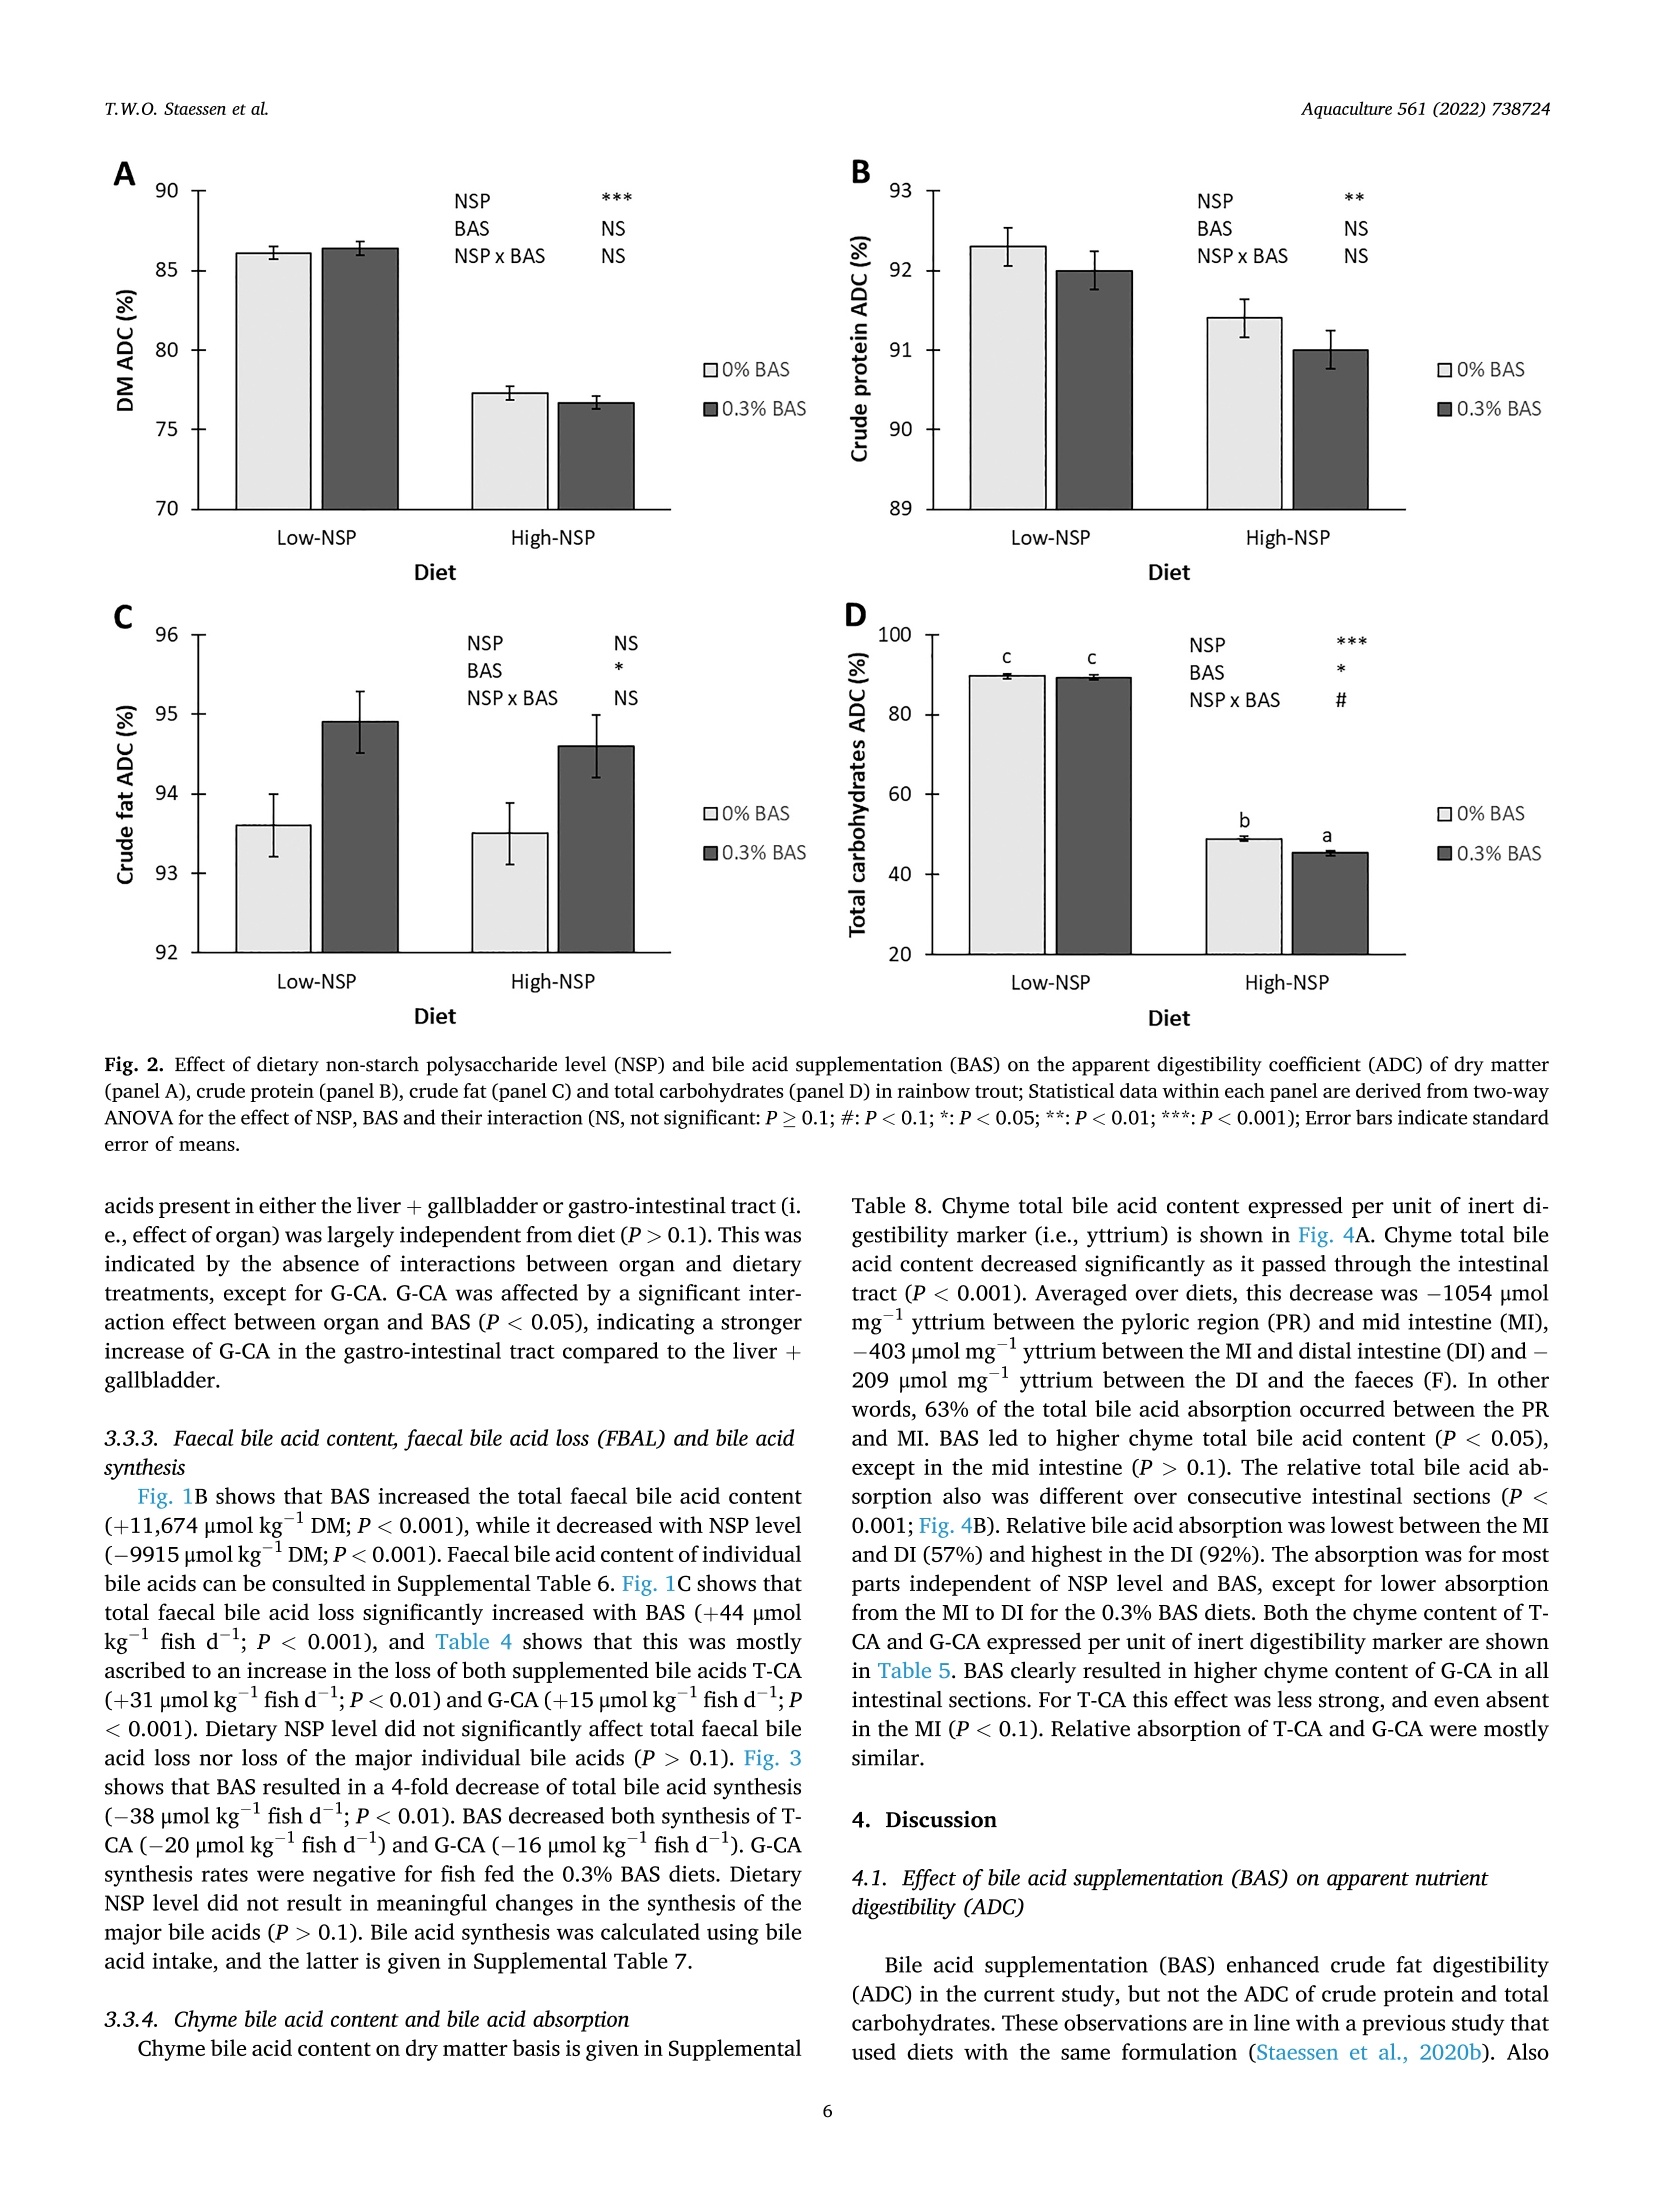
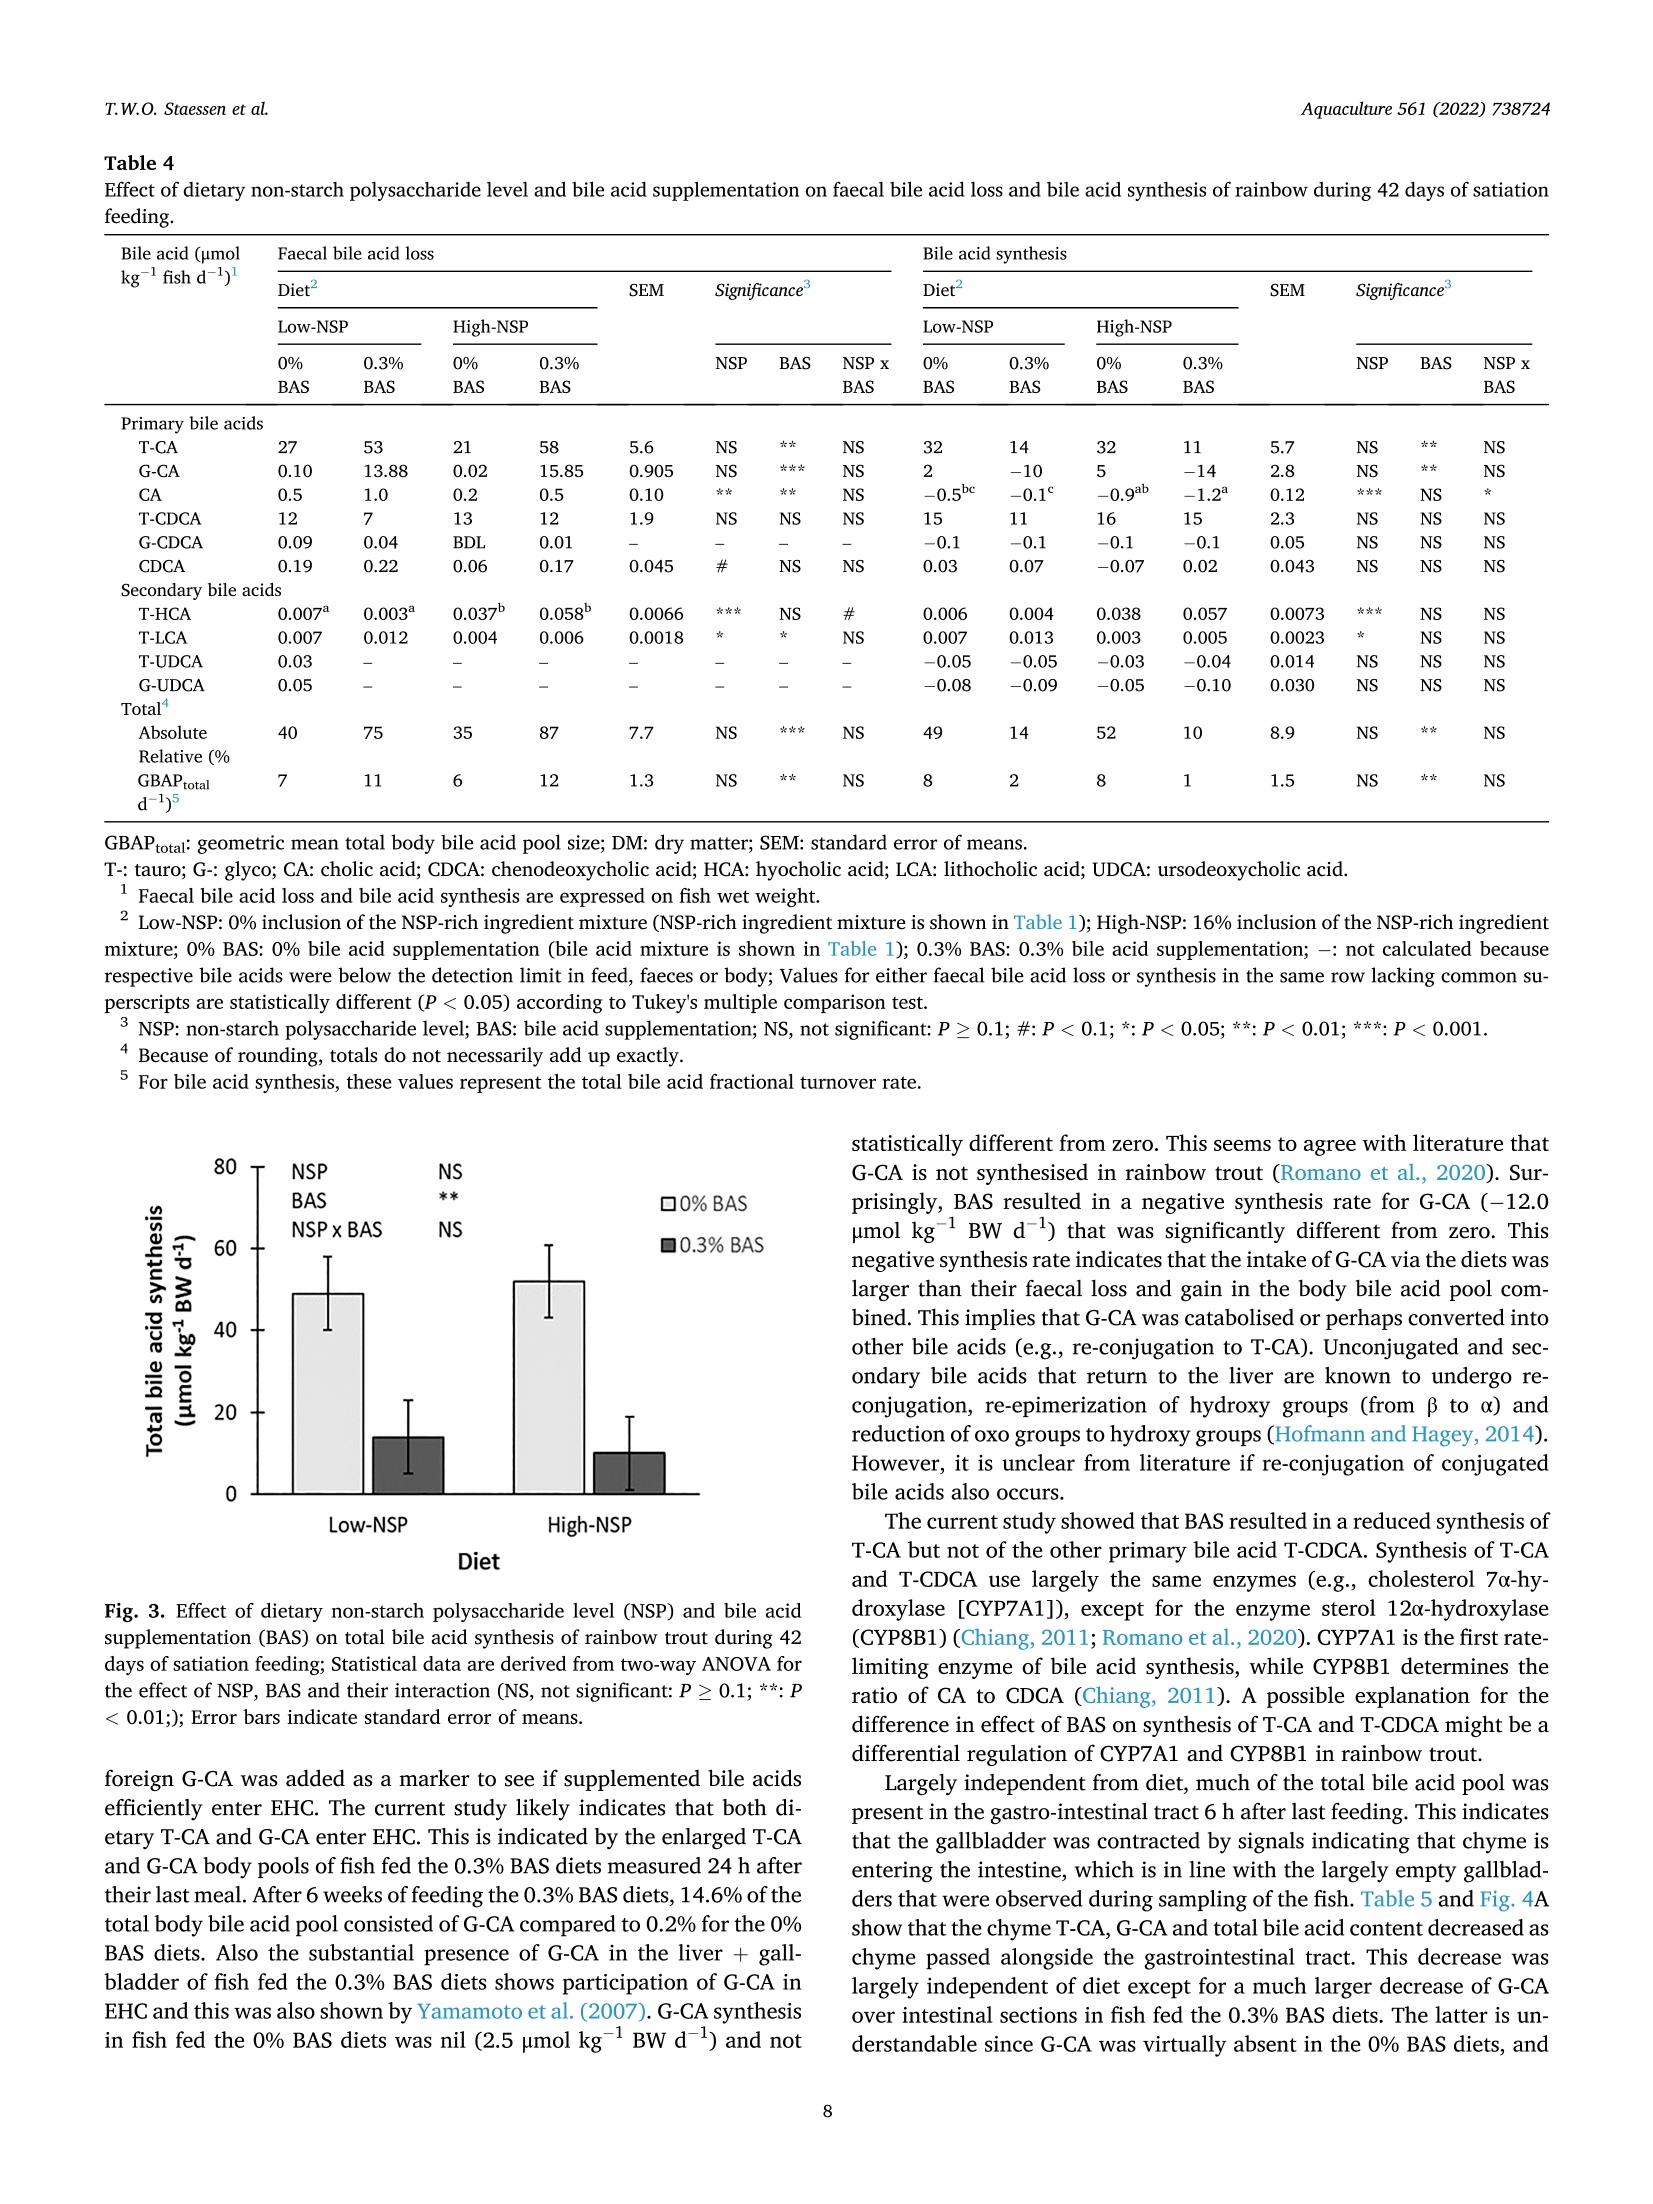
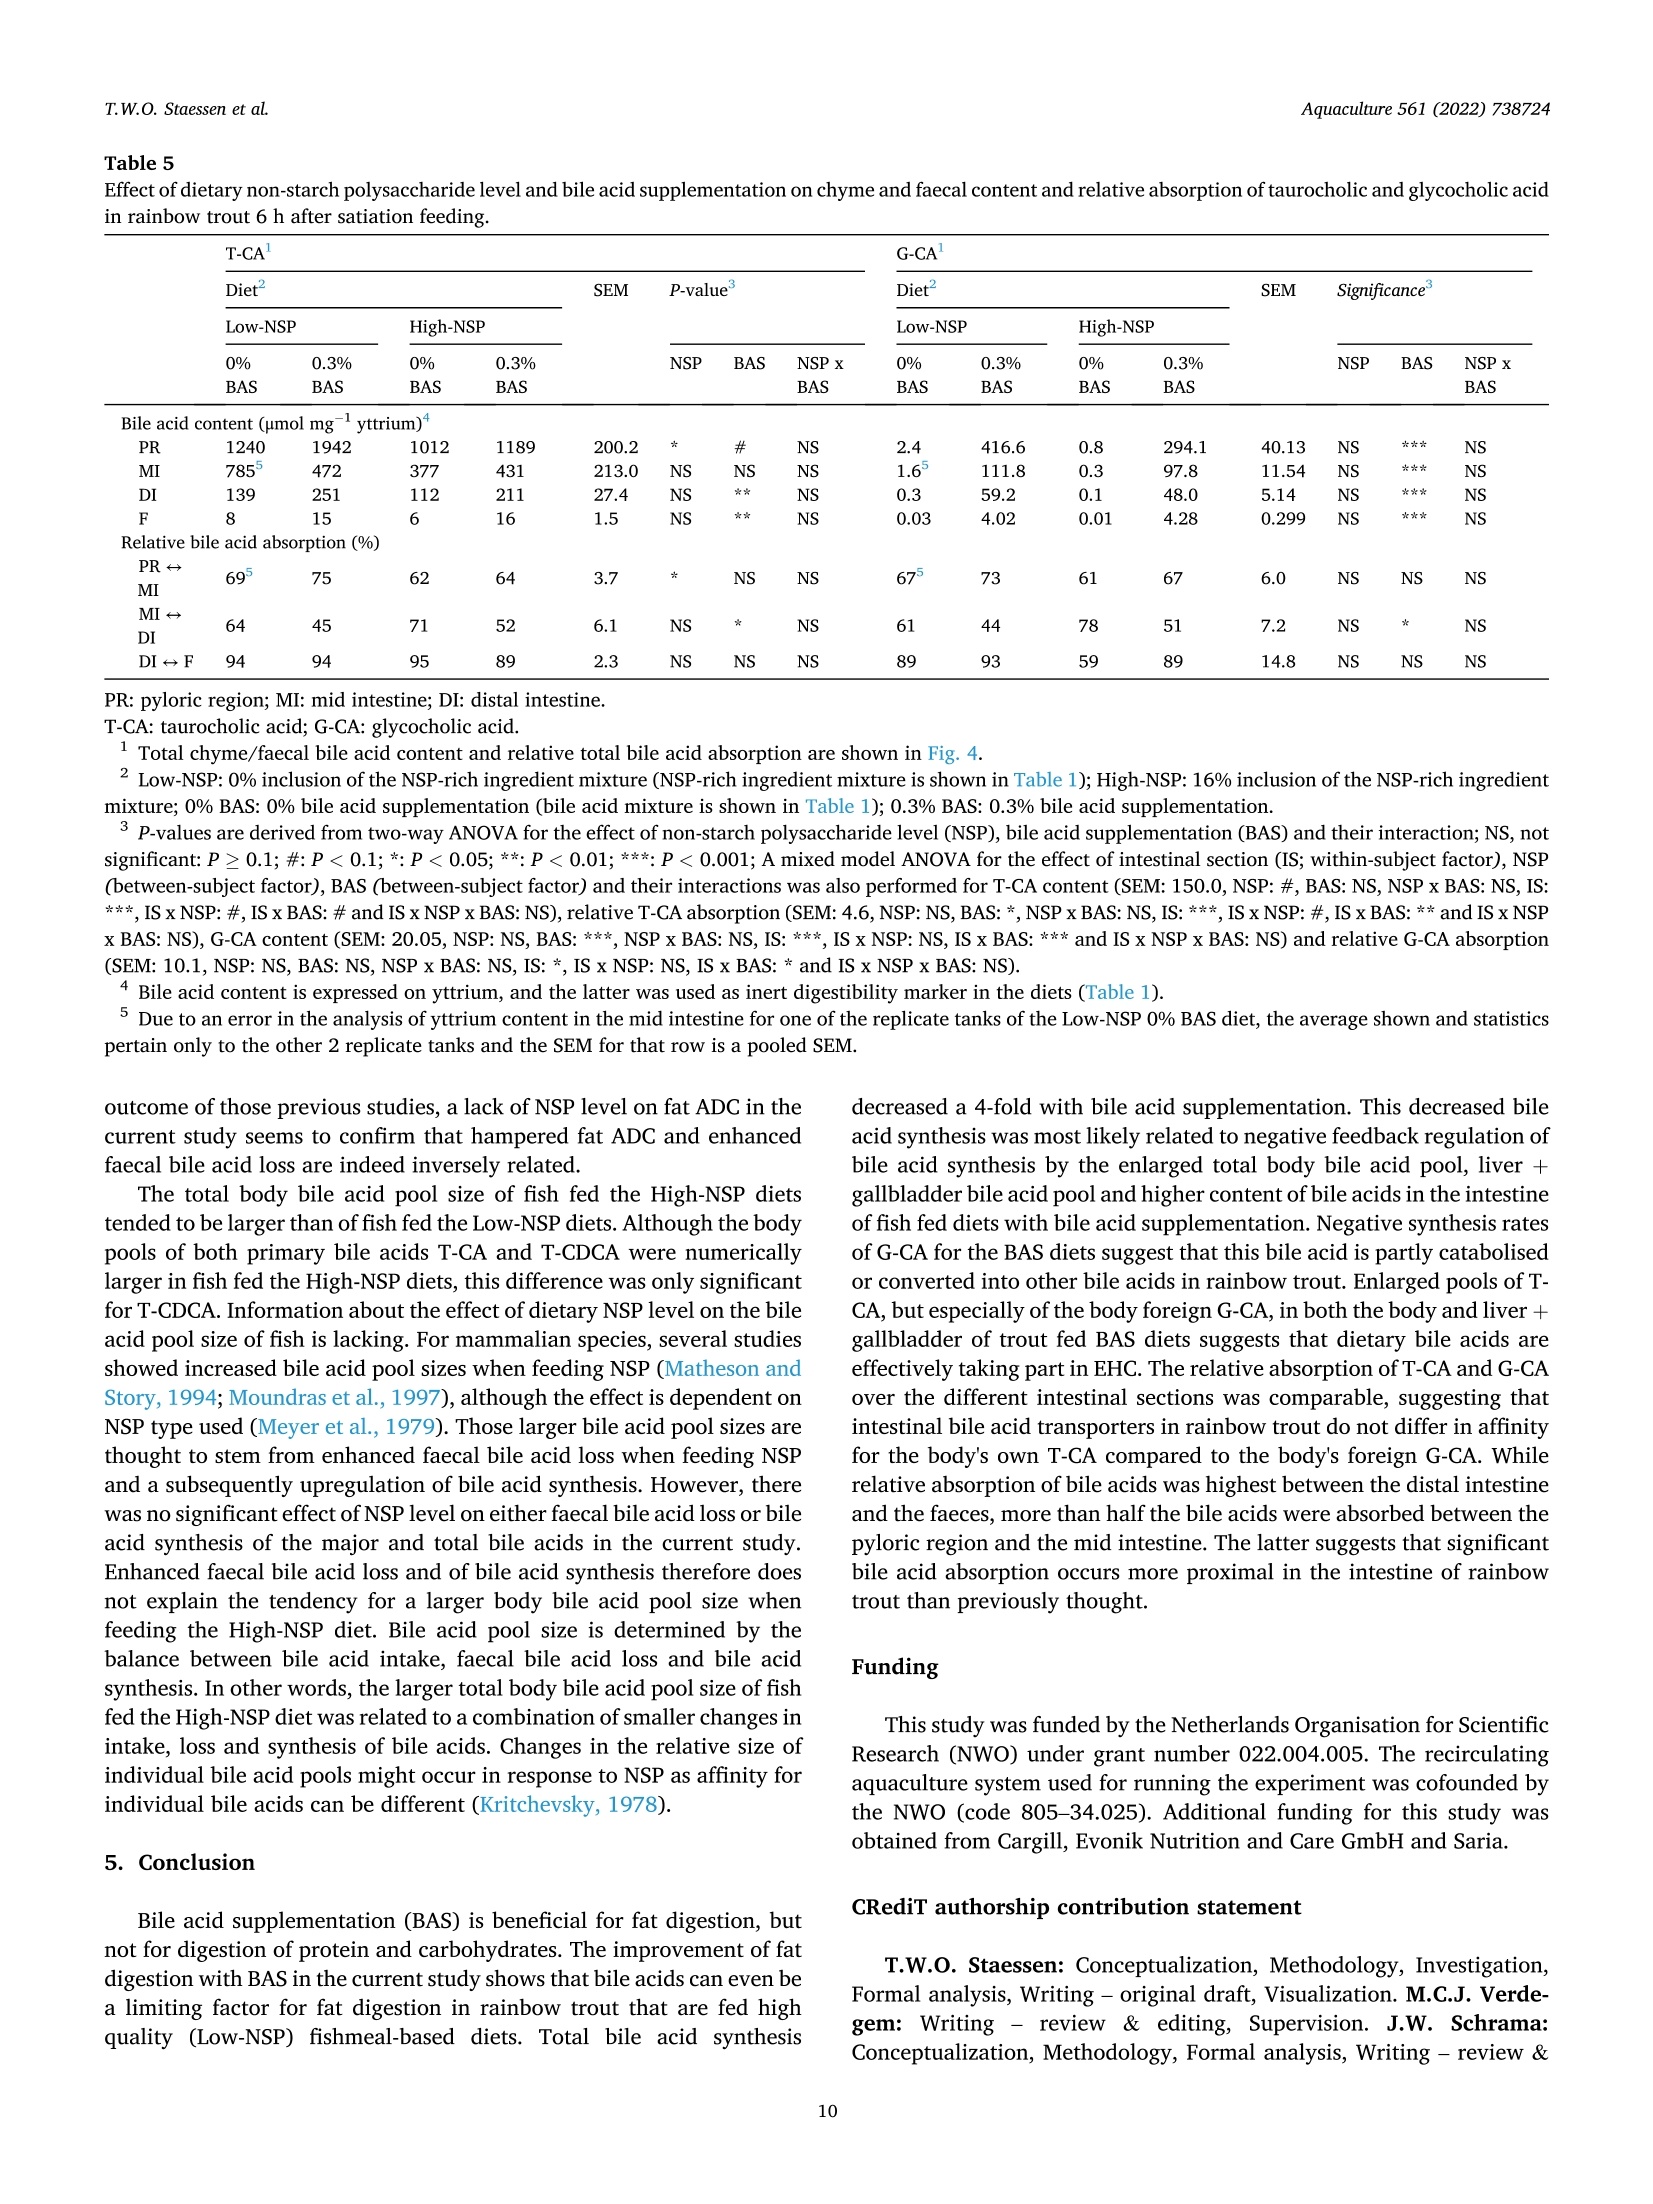
The effects of dietary bile acid supplementation (BAS) on apparent digestibility coefficients (ADC) and the bile acid metabolism in rainbow trout (Oncorhynchus mykiss) were investigated for diets differing in non-starch polysaccharide (NSP) level. Four experimental diets were formulated according to an 2 by 2 factorial design. A low-NSP and High-NSP diet (0 vs. 160 g kg− 1 inclusion of an NSP-rich ingredient mixture) were first formulated. The aim of this was to create differences in the amount of faecal waste produced, and consequently as previously shown in rainbow, the amount of faecal bile acid loss (FBAL). Both NSP-level diets were tested with 0% and 0.3% BAS (0 vs. 3 g kg− 1 inclusion of a bile acid mixture). The bile acid mixture contained taurocholic acid (T-CA) and glycocholic acid (G-CA) in a 2:1 ratio. Glycocholic acid does not naturally occur in trout and was used as marker to see if supplemented bile acids are efficiently absorbed and enter enterohepatic circulation (EHC). Fish were fed to apparent satiation for 42 days. Dietary NSP level did not enhance FBAL. BAS was beneficial for fat ADC, but not for the ADC of protein and carbohydrates. BAS improved fat ADC regardless of NSP level, which suggests that bile acids are a limiting factor for fat digestion in rainbow trout. Total bile acid synthesis was a 4-fold lower in fish fed the 0.3% BAS diets compared to the 0% BAS diets. Lower bile acid synthesis with BAS occurred alongside enlarged body and liver + gallbladder bile acid pools and a higher content of bile acids in the chyme. These higher bile acid levels most likely caused a negative feedback inhibition of bile acid synthesis. Negative synthesis rates of G-CA were found when feeding the 0.3% BAS diets, which suggests that this bile acid is catabolised or converted into other bile acid types in rainbow trout. The enlarged pool of TCA, but especially of the body foreign G-CA, with BAS in both the body and liver + gallbladder shows that dietary bile acids are effectively taking part in EHC. The relative absorption of T-CA and G-CA over the different intestinal compartments was comparable, which shows that EHC does not differentiate between T-CA and G-CA. While relative absorption of bile acids was highest between the distal intestine and the faeces, the absolute decrease in chyme bile acid content was highest between the pyloric region and the mid intestine. The latter shows that significant bile acid absorption occurs more proximal in the intestine of rainbow trout than previously thought. 研究了日粮补充胆酸(BAS)对虹鳟鱼(Oncorhynchusmykiss)表观消化系数(ADC)和胆酸代谢的影响,研究了日粮中非淀粉多糖(NSP)水平的差异。按照2乘2的工厂设计制定了四种实验饮食。首先制定了低NSP和高NSP饮食(0对160克公斤-1含有富含NSP的成分混合物)。这样做的目的是在产生的粪便废物的数量上产生差异,因此,正如前面在虹鳟鱼中所显示的,粪便酸度损失的数量(FBAL)。NSP水平的饮食都用0%和0.3%BAS(0对3克千克-1掺入半酸混合物)进行测试。胆汁酸混合物以2:1的比例含有牛磺胆酸(T-CA)和糖胆酸(G-CA)。糖胆酸在鳟鱼中不是自然发生的,被用作标志物,以了解补充的酸是否被有效吸收并进入肠肝循环(EHC)。鱼被喂食到明显的满足42天。饮食NSP水平并不能提高FBAL。BAS对脂肪ADC有益,但对蛋白质和碳水化合物ADC不有益。BAS提高了脂肪ADC,而不考虑NSP水平,这表明胆汁酸是虹鳟鱼脂肪消化的限制因素。与0%BAS相比,0.3%BAS饮食中的鱼的总氢氟酸合成量低4倍。较低的苯甲酸合成与BAS发生在扩大的身体和肝脏+胆囊苯甲酸池和较高含量的苯甲酸在乳糜。这些较高的苯甲酸水平最有可能导致苯甲酸合成的负反馈抑制。当喂食0.3%BAS饮食时,发现G-CA的负合成率,这表明这种双酸在虹鳟鱼中被分解或转化为其他类型的胆汁酸。增加的TCA池,但特别是身体外的G-CA,在身体和肝脏+胆囊中都有BAS,表明膳食中的胆汁酸在EHC中的作用是有效的。不同肠室对T-CA和G-CA的相对吸收是可比的,这表明EHC对T-CA和G-CA没有区别。虽然远端肠和粪便对胆酸的相对吸收最高,但幽门区和中端肠对胆酸含量的绝对减少最高。后来的研究表明,比以前想象的更接近虹鳟鱼肠道的部位发生了显著的氢酸吸收。Aquaculture 561 (2022)738724Contents lists available at ScienceDirect Aquaculture 561 (2022)738724T.W.O. Staessen et al. Aquaculture journal homepage: www.elsevier.com/locate/aquaculture 膳食非淀粉多糖 (NSP)水平和添加胆汁酸对虹鳝鱼营养素消化和胆汁酸代谢的影响 Effect of dietary NSP level and bile acid supplementation on nutrientdigestibility and the bile acid metabolism in rainbow trout(Oncorhynchus mykiss) T.W.O. Staessen, M.C.J. Verdegem, J.W. Schrama★ Aquaculture and Fisheries Group, Wageningen Institute of Animal Science (WIAS), Wageningen University, PO Box 338, 6700 AH Wageningen, The Netherlands ARTICLEINFO ABSTRACT Keywords:Apparent nutrient digestibilityBile acid synthesisCholic acidFaecal bile acid lossNon-starch polysaccharide The effects of dietary bile acid supplementation (BAS) on apparent digestibility coefficients (ADC) and the bileacid metabolism in rainbow trout (Oncorhynchus mykiss) were investigated for diets differing in non-starchpolysaccharide (NSP) level. Four experimental diets were formulated according to an 2 by 2 factorial design.A low-NSP and High-NSP diet (0 vs. 160 g kg-inclusion of an NSP-rich ingredient mixture) were firstformulated. The aim of this was to create differences in the amount of faecal waste produced, and consequentlyas previously shown in rainbow, the amount of faecal bile acid loss (FBAL). Both NSP-level diets were tested with0% and 0.3% BAS (0 vs. 3 g kg-inclusion of a bile acid mixture). The bile acid mixture contained taurocholicacid (T-CA) and glycocholic acid (G-CA) in a 2:1 ratio. Glycocholic acid does not naturally occur in trout and wasused as marker to see if supplemented bile acids are efficiently absorbed and enter enterohepatic circulation(EHC). Fish were fed to apparent satiation for 42 days. Dietary NSP level did not enhance FBAL. BAS wasbeneficial for fat ADC, but not for the ADC of protein and carbohydrates. BAS improved fat ADC regardless ofNSP level, which suggests that bile acids are a limiting factor for fat digestion in rainbow trout. Total bile acidsynthesis was a 4-fold lower in fish fed the 0.3% BAS diets compared to the 0% BAS diets. Lower bile acidsynthesis with BAS occurred alongside enlarged body and liver+gallbladder bile acid pools and a higher contentof bile acids in the chyme. These higher bile acid levels most likely caused a negative feedback inhibition of bileacid synthesis. Negative synthesis rates of G-CA were found when feeding the 0.3% BAS diets, which suggeststhat this bile acid is catabolised or converted into other bile acid types in rainbow trout. The enlarged pool of T-CA, but especially of the body foreign G-CA, with BAS in both the body and liver+gallbladder shows that dietarybile acids are effectively taking part in EHC. The relative absorption of T-CA and G-CA over the different in-testinal compartments was comparable, which shows that EHC does not differentiate between T-CA and G-CA.While relative absorption of bile acids was highest between the distal intestine and the faeces, the absolutedecrease in chyme bile acid content was highest between the pyloric region and the mid intestine. The lattershows that significant bile acid absorption occurs more proximal in the intestine of rainbow trout than previouslythought. Fat is an important source of energy for carnivorous fish species(Oliva-Teles et al., 2015), and bile acids are essential for proper fatdigestion (Hagey et al., 2010). Bile acids namely form micelles with dietary fat, the latter otherwise practically insoluble in the wateryenvironment of the intestine (Romano et al., 2020). Micelle formationenlarges the surface area on which lipases can act and facilitates trans-port of fat and hydrolysates to the brush border for absorption (Pasquieret al., 1996). Bile acids can also activate the bile acid-activated lipase Abbreviations: ADC, apparent digestibility coefficient; BAS, bile acid supplementation; BW, body weight; CA, cholic acid; CDCA, chenodeoxycholic acid; DCA,deoxycholic acid; DI, distal intestine; DM, dry matter; EHC, enterohepatic circulation; FBAL, faecal bile acid loss; FCR, feed conversion ratio; FI, feed intake; G-,glyco;HCA, hyocholic acid; HDCA, hyodeoxycholic acid; IS, intestinal section; LCA, lithocholic acid; MI, mid intestine; NSP, non-starch polysaccharide; PR, pyloric region;RFP, relative faeces production; SGR, specific growth rate; T-, tauro; UDCA, ursodeoxycholic acid. * Corresponding author. E-mail address: johan.schrama@wur.nl (J.W. Schrama). ( https: // doi . org/10.1016 / j. aquaculture . 2022.738724 ) ( Received 1 April 2022; Received in revised form 20 July 2022; Accepted 9 August 2022 ) ( Avai l able online 13 August 2022 ) ( 0044-8486/C 2022 The Authors. Published by Elsevier B.V. This is an open access article under the CC BY license ( http://creativecommons.org/licenses/by /4 .0/ ). ) (Kurtovic et al.,2009). Bile acids are synthesised in the liver starting by oxidation ofcholesterol and subsequent conjugation with glycine or predominantlywith taurine in fish (Vessey et al., 1990; Hagey et al.,2010). Bile acidsare stored as part of bile in the gallbladder, the latter emptying itscontent into the intestine after contraction upon receiving hormonalsignals (cholecystokinin) when chyme enters (Hagey et al., 2010). Mammalian studies show that the majority of bile acids that aresecreted in the intestine are reabsorbed in the ileum via specific bile acidtransporters before they are returned to the liver as part of the enter-ohepatic circulation (EHC) (Cai and Chen, 2014; Russell, 2009). Infor-mation about bile acid absorption in the intestine of fish is scarce, but itis generally assumed that most bile acids are absorbed in the distal in-testine. This is also suggested by Murashita et al. (2014), which showedfor rainbow trout (Oncorhynchus mykiss) that the expression of animportant intestinal bile acid transporter (i.e., apical sodium-dependentbile salt transporter; ASBT) occurs primarily in the distal intestine.Under homeostatic conditions, loss of bile acids that escape EHC via thefaeces is compensated with de novo synthesis (Lanzini and Lanzarotto,2000). One previous review concluded that plant ingredients canadversely affect the bile acid metabolism of fish (e.g.,enhance faecal bileacid loss (FBAL), reduce bile acid pools, disturb EHC), and that sucheffects often occur alongside a hampered fat digestion (Romano et al.,2020). Plant ingredients can disturb the bile acid metabolism in severalways, including lowering the dietary supply of cholesterol and taurinewhich are needed for bile acid synthesis (de Moura et al., 2019; Denget al., 2013), inducing symptoms of enteritis which possibly disturbs bileacid cycling and synthesis (Krogdahl et al., 2010) and enhancing FBALby presence of anti-nutritional factors such as saponins (Kregiel et al.,2017; Murashita et al., 2018) and non-starch polysaccharides (NSP)(Staessen et al., 2020a; Staessen et al.,2020b). Of particular interest tothe current study are the effects of NSP, which can sequester bile acids inthe intestine and consequently enhance FBAL (Sinha et al., 2011). Thedegree to which NSP enhance FBAL is dependent on NSP type. The exactmechanism(s) behind NSP-bile acid sequestration are not well-understood, but possibilities are direct binding/entrapment of bileacids to the NSP molecules, reduced reabsorption of bile acids due toincreased chyme viscosity and flush-out of bile acids with increasedfaeces production (Adam et al., 2001; Dongowski, 2007; Ide et al., 1989;Ikegami et al., 1990; Matin et al., 2016; Staessen et al., 2020a;Staessenet al.,2020b). Our previous studies showed for rainbow trout an inverse relation-ship between fat digestion and enhanced FBAL, the latter induced bysatiation feeding of a high-NSP diet (Staessen et al., 2020a). This inverserelationship between fat ADC and FBAL disappeared when bile acidswere supplemented to the diet (Staessen et al., 2020b), showing that bileacids were a limiting factor for fat digestion in the fish with enhanced Diet Low-NSP High-NSP 0% BAS 0.3% BAS 0% BAS 0.3% BAS Ingredients (g kg-) Fishmeal 480.0 480.0 480.0 480.0 Plant oil mixture 220.0 220.0 220.0 220.0 Palm oil 110.0 110.0 110.0 110.0 Rapeseed oil 110.0 110.0 110.0 110.0 Wheat feed flour 254.8 251.8 94.8 91.8 NSP-rich ingredient mixture 二 二一 160.0 160.0 Soy hulls 一 一 80.0 80.0 Wheat bran 一 80.0 80.0 Monocalcium phosphate 30.0 30.0 30.0 30.0 Vitamin/mineral premix 10.0 10.0 10.0 10.0 Chalk (CaCO3) 5.0 5.0 5.0 5.0 Yttrium oxide 0.2 0.2 0.2 0.2 Bile acid mixture 一 3.0 一 3.0 Sodium taurocholic acid 一 2.0 2.0 Sodium glycocholic acid 一 1.0 一 1.0 Analysed nutrient content (g kg-DM) DM (gkg-) 943 951 945 947 Ash 99 98 105 104 Crude protein (Nx 6.25) 399 399 407 406 Crude fat 282 281 282 285 Total carbohydrates 220 222 206 205 Gross energy (kJ gDM) 23.9 24.0 24.2 24.3 Calcium 21 21 21 21 Phosphorus 18 18 19 18 Yttrium 0.2 0.2 0.2 0.2 Bile acids (umol kg-}DM) 734 4695 761 4931 DM: dry matter; N: nitrogen; NSP: non-starch polysaccharide. Vitamins (IU or mg kgdiet): thiamin, 10 mg; riboflavin, 10 mg; pyridoxine, 10 mg; panthotenic acid, 40 mg; niacin, 20 mg; biotin, 0.2 mg; cyanocobalamin, 0.015 mg; folic acid, 2 mg; ascorbic acid, 100 mg; DL-alpha; tocopherol acetate, 100 IU; retinyl palmitate, 3000 IU; DL-cholecalciferol, 2400 IU; sodium menadione bisulfite; (51%), 10 mg; inositol, 400 mg; choline, 2000 mg; butylhydroxytolueen, 100 mg; calcium propionate, 1000 mg; anti-oxidant BHT (E300-321),100 mg.Minerals (mg kgdiet): iron (as FeSO4·7H20), 50 mg; zinc (as ZnSO47H2O), 30 mg; cobalt (as CoSO4:7H2O),0.1; mg; copper (as CuSO4:5H20), 10 mg; selenium (asNa2SeO3),0.5 mg; manganese (as MnSO4.4H20), 20 mg; magnesium (as MgSO4·7H20),500 mg; chromium (as CrClg6H20), 1 mg; calcium (as CaIOs·6H2O),2 mg.Low-NSP: 0% inclusion of the NSP-rich ingredient mixture; High-NSP: 16% inclusion of the NSP-rich ingredient mixture; 0% BAS: 0% supplementation of the bile acid mixture; 0.3% BAS: 0.3% supplementation of the bile acid mixture. LT fishmeal -crude protein 72%, Triple Nine Fish protein, Esbjerg, Denmark. °Vitamin/mineral premix. 4Sodium taurocholic acid (≥ 98%), Carl Roth, The Netherlands. Sodium glycocholic acid (98%), BOC Sciences, USA. ( °Dietary content of individually measured bile acids is given in Supplemental Table 4. ) Table 2 Initial body bile acid pool and effect of dietary non-starch polysaccharide level and bile acid supplementation on the body bile acid pool of rainbow trout after 42 day ofsatiation feeding. Initial² Diet SEM Significance* Low-NSP High-NSP 0% BAS 0.3% BAS 0% BAS 0.3% BAS NSP BAS NSP x BAS Body bile acid pool (umol kgfish DM) Primary bile acids T-CA 1376 2055 2649 2385 2805 194.2 NS NS G-CA 4 5 491 5 523 20.3 NS ★★ NS CA 3 3 2 3 1 0.5 NS NS T-CDCA 360 258 185 437 295 33.7 ★ NS G-CDCA 1 BDL BDL BDL BDL 一 CDCA 2 2 2 2 2 0.3 NS NS NS Secondary bile acids T-HCA 0.07 0.4 0.3 0.3 0.3 0.08 NS NS NS T-LCA 0.36 0.05 0.07 0.06 0.07 0.036 NS NS NS Total 1746 2323 3329 2832 3627 191.9 # NS Bile acid ratio Primary: secondary 4133:1 6265:1 11,103:1 8115:1 9943:1 1654.5:1 NS # NS Conjugated: unconjugated 370:1 495:1 922:1 552:1 1048:1 106.7:1 NS NS Taurine: glycine conjugated 357:1 559:1 6:1 583:1 6:1 84.4:1 NS *** NS Total CA: total CDCA 4:1 9:1 17:1 6:1 11:1 1.6:1 ★ NS BDL: below detection limit (detection limits are given in Supplemental Table 9); DM: dry matter; SEM: standard error of means.T-: tauro; G-: glyco; CA: cholic acid;CDCA: chenodeoxycholic acid; HCA: hyocholic acid; LCA: lithocholic acid; total CA: sum of both conjugated and unconjugated CA;total CDCA: sum of both conjugated and unconjugated CDCA. ·T-DCA (taurodeoxycholic acid), G-DCA (glycodeoxycholic acid), DCA (deoxycholic acid), G-HCA (glycohyocholic acid), HCA (hyocholic acid), T-HDCA (taur-ohyodeoxycholic acid), G-HDCA (glycohyodeoxycholic acid), HDCA (hyodeoxycholic acid), G-LCA (glycolithocholic acid), LCA (lithocholic acid), T-UDCA (taur-ousrsodeoxycholic acid), G-UDCA (glycoursodeoxycholic acid) and UDCA (ursodeoxycholic acid) were also measured, but their levels in the body were below thedetection limit. Initial body bile acid pool at the start of the experiment. °Low-NSP: 0% inclusion of the NSP-rich ingredient mixture (NSP-rich ingredient mixture is shown in Table 1); High-NSP: 16% inclusion of the NSP-rich ingredientmixture; 0% BAS: 0% bile acid supplementation (bile acid mixture is shown in Table 1); 0.3% BAS: 0.3% bile acid supplementation. 4NSP: non-starch polysaccharide level; BAS: bile acid supplementation; P-values are derived from two-way ANOVA for the effect of NSP, BAS and their interaction,and thus do not relate to the values reported for initial body bile acid pool; NS, not significant: P≥ 0.1; #:P<0.1; *: P<0.05; **:P <0.01; ***:P<0.001; : notcalculated because respective bile acids were below the detection limit in (replicate) samples. Because of rounding, totals and bile acid ratios do not necessarily add up exactly. FBAL. From these studies, it was hypothesised that enhanced FBALdisturbs the bile acid metabolism, possibly reducing the total body bileacid pool size and/or bile acid content in the intestine, and subsequentlyfat digestion. Bile acid supplementation (BAS) was hypothesised to in-crease bile acid levels in the body and/or intestine, also explaining theremediation effect on fat digestion. Several other studies with fishshowed that hamperd fat digestion could be (partially) remediated usingdietary BAS (Gu et al., 2017; Iwashita et al., 2008; Yamamoto et al.,2007). However, quantitative data on bile acid pools, bile acid synthesis,and bile acid absorption in the intestine of fish in response to BAS, aswell as enhanced FBAL are lacking in literature. Based on the foregoing, the current study aimed to quantify bile acidsynthesis, bile acid pools and absorption of bile acids in the intestine ofrainbow trout in response to changes in FBAL (i.e., induced by a contrastin dietary NSP content) and BAS. Both rainbow trout body's own taur-ocholic acid (T-CA) and body's foreign glycocholic acid (G-CA) weresupplemented, and the latter was used as marker to see if supplementedbile acids are efficiently participating in the EHC. With the aim to testthe effect of BAS under conditions of ‘normal’ and ‘enhanced'FBAL,both a diet low and high in NSP-rich ingredients were used. 2. Materials and methods This study was conducted after approval by the Central AnimalCommittee (CCD) of The Netherlands (DEC.No.2018.W-0010.003). Theexperiment was run in accordance with Dutch and European law on theuse of experimental animals. The ingredient and nutrient composition of the diets are given inTable 1. Four experimental diets were formulated according to an 2 by 2factorial design. Two levels of dietary NSP were created, a Low-NSP andHigh-NSP diet, by the inclusion of 0 or 160 g kg- of an NSP-richingredient mixture, the latter composed of wheat bran and soy hulls(1:1). Both NSP diets were supplemented with either 0% or 0.3% of abile acid mixture consisting of taurocholic acid (T-CA) and glycocholicacid (G-CA) (2:1). The inclusion level of the NSP mixture was chosenbased on previous studies which showed that this level is sufficient toincrease faecal bile acid loss significantly (Staessen et al., 2020a, 2020c).The level of taurocholic acid was chosen to provide compensation for theexpected difference in total faecal bile acid loss between the Low-andHigh NSP diets as calculated from the results of Staessen et al. (2020a).Additionally 0.1% glycocholic acid was added to the diets. Glycocholicacid does not naturally occur in the body of rainbow trout. As such thistype of bile acid was used as internal marker, and occurrence in forexample the liver or gallbladder indicates absorption in the intestine andpartaking of supplemented bile acids in enterohepatic circulation. Sincemany commercially available bile acid products are derived frommammalian species, they do contain glycine-conjugated bile acids. Thelatter are therefore economically more interesting for practical appli-cation. A mixture of rapeseed oil and palm oil (1:1) was the main fatsource. All diets met know nutrient requirements of rainbow trout (NRC,2011). Yttrium oxide was included as inert digestibility marker. Feedpellets were extruded (3 mm; Research Diet Services B.V., TheNetherlands) and vacuum coated with the oil mixture (WageningenUniversity, The Netherlands). The experiment was run in a recirculating aquaculture system atWageningen University in The Netherlands. A detail description of thesystem and its husbandry conditions consulted in Staessen et al. (2020a). 2.3. Experimental procedures and sampling Rainbow trout (Oncorhynchus mykiss) were obtained from MohnenAquaculture GmbH in Germany. Seven days before the start of theexperiment, fish were fed the Low-NSP 0% BAS diet. Two days beforethe start of the feeding experiment, 10 fish from the base populationwere sampled for collection of chyme. The intestine was removed in itsentirety from each fish, and subsequently divided into 3 equally longsections (consecutively defined as the pyloric region, the mid intestineand the distal intestine). After division of the intestine, chume wasstripped and collected separately per section. From the same 10 fish, alsothe liver + gallbladder was sampled. Chyme for identical intestinalsections, and livers + gallbladders were respectively pooled and storedat-20°C. At the start of the feeding experiment, 10 fish from the base popu-lation were sampled for initial body composition and determination ofwhole-body bile acid pools. The remaining fish were randomly distrib-uted over the experimental units at a stocking density of 30 fish tank,and subsequently batch weighed for determination of biomass. Dietswere randomly assigned to the experimental units in triplicate. Fishwere hand-fed twice daily (9:00 and 15:30h) to apparent satiation for 6weeks. Satiation was reached when fish stopped eating, or when thefeeding time exceeded 1 h. Uneaten feed pellets were removed andcounted. Faeces were collected in bottles attached to swirl separators.The collection bottles were submerged in ice water to minimize bacterialdegradation of the faeces. Faeces were pooled per tank and stored at-20 °C. At the end of the feeding experiment, fish were again batchweighed. Per tank, 5 fish were sampled and stored at -20 °C for finalbody composition and body bile acid pool. The remaining fish were fedtwo more days before sampling of chyme and livers + gallbladders asdescribed before. Fish were starved for 24 h before initial and final batchweighing to allow emptying of the gastro-intestinal tract. All sampledfish were euthanized by an overdose of anaesthetic (1 mL L-2-phenox-yethanol). A period of 6 h was maintained between last feeding andsampling of the fish for chyme and livers + gallbladders, and this toensure that chyme would be present in each intestinal section allowingcalculation of bile acid absorption of sections. 2.4. Analytical methods Faecal samples were dried at 70 °C until constant weight. Driedfaeces were pulverized using a mixer mill with a 1 mm fixed screenopening set at 12,000 RPM (MM 200 Retch, Brinkmann, Germany).Frozen fish samples were cut into small pieces using a band saw andhomogenized by grinding two times in a meat mincer with a 4.5 mm die(TW-R 70, Feuma Gastromaschinen GmbH, Germany). Ground fishsamples were subsequently freeze-dried. Liver + gallbladder samplesand chyme from each intestinal section were freeze dried. Both feedsamples and freeze-dried fish samples were pulverized using the mixermill without fixed screen set at 18,000 RPM. Diets, faeces, whole fish,livers + gallbladders and chyme fish were analysed in triplicate forproximate composition and for bile acid content. Dry matter was determined gravimetrically by drying samples untilconstant weight at 103 °C (ISO 6496, 1999). Ash content was deter-mined gravimetrically by incineration of samples until constant weightin a muffle furnace at 550 °℃ (ISO 5984, 2002). Yttrium, phosphorus,calcium and magnesium content of the samples were measured by ICP-OES (NEN 15510,2007). Crude protein (Nx6.25) content was measuredaccording to Kjeldahl's method (ISO 5983-2, 2009). Crude fat wasdetermined gravimetrically using acid hydrolysis (Hydrotherm,C. 2.5. Calculations 2.5.1. Fish performance Mortality (%) was calculated as ((No-N)/No)×100, where No andNt are the initial and final number of fish, respectively. Feed conversionratio (FCR; g DMg-) was calculated as (FIx dmF)/(W-Wo), where FIis feed intake (g fish), dmF is the dry matter content of the feed(fraction), and Wo and Wt are the initial and final body weight (BW) (gfish), respectively. The geometric mean BW (Wg, g fish) wascalculated as e ((n Wt+ln W0)/2). Feed intake (% BW d-l) was calculated as((FI x dmF)/t/Wg)× 100, where t is the length of the experimentalperiod in days (d). Faeces production (RFP,%BW d-) was calculated as((FI x dmF x (Di/F;))/t/Wg)x 100, where Di is the percentage inertmarker of the diet DM, and Fi is the percentage inert marker of the faecesDM. Specific growth rate (SGR;% BW d-) was calculated as ((ln Wt-lnWo)/t)×100. 2.5.2. Nutrient apparent digestibility coefficients (ADC) Total carbohydrates (g kg-DM) in feed and faeces was calculated as1000-ash-crude protein-crude fat, with ash, crude protein and crudefat expressed in g kg-DM. The ADC (%) of each nutrient was calculatedusing the formula described by Bureau et al. (2003): 100-(100x(F/D)x(Di/F;)), where D is the percentage nutrient (or kJ ggross energy) ofthe diet, and F the percentage nutrient (or kJ ggross energy) of thefaeces. 2.5.3. Bile acid metabolism Bile acids were measured in the diets, chyme, faeces, liver + gall-bladder and whole body. Intake of bile acids was calculated from thefeed intake and dietary bile acid content. Loss of bile acids was calcu-lated from the faecal waste production and the faecal bile acid content.Bile acid synthesis was calculated using methodology common for en-ergy and protein (nitrogen) balances (Kaushik and Schrama, 2022). Bile acid synthesis over a certain time period was calculated as the differencebetween dietary bile acid intake and the sum of the change in body bileacid pool and faecal bile acid loss. For this calculations it was assumedthat no bile acid breakdown is taken place inside the body. Furthermore,it was assumed that bile acid losses via urine and gills are minimal.Chyme bile acid absorption was calculated similar to apparent di-gestibility calculations, using chyme bile acid content and chime levelsof an inert digestibility marker. All formulas concerning calculationsrelated to the bile acid metabolism can be consulted in Staessen et al.(2020c) or in Supplemental Table 10. 2.6. Statistical analysis Tanks (n = 12) were used as experimental units in the statisticalanalysis for the effect of dietary treatments. Data that were measuredbetween tanks, were analysed using a two-way ANOVA for the effect ofNSP level, BAS and their interaction. Data that were measured withintanks (i.e., organ and intestinal compartment) were analysed using amixed model ANOVA for the effect of organ/intestinal section, NSPlevel, BAS, their interaction effects and the random effect of tank nestedwithin NSP level and BAS. The effect of NSP level, BAS and theirinteraction was tested against the random effect of tank nested withinNSP level and BAS. The effect of organ/intestinal section and its in-teractions with NSP level and BAS were tested against the random errorof the whole model (i.e., random variation within tanks between organ/intestinal section). Data were tested for sphericity using Mauchly's test.Prior to ANOVA, data were tested for normality using the Kolmogorov-Smirnov test and for homogeneity of using Levene's test. ANOVA wasfollowed by a Tukey test for pairwise comparison of means. Statisticalsignificance was tested at the 0.05 probability level. P-values between0.1 and 0.05 were defined as close to statistical significance and asindicative for tendencies in the data. All statistical tests were performedusing the program SAS 9.4, SAS Institute, North Carolina, USA. 3. Results 3.1. Fish performance Full fish performance data are shown in Supplemental Table 1. Theexperiment ran without mortality. The average initial body weight was81 g fish-and not significantly different between treatments (P≥0.1).Feed intake increased with dietary NSP level (P <0.001). Also faecesproduction increased with NSP level, being nearly twice as high for theHigh-NSP diets compared to the Low-NSP diets (Fig. 1A). BAS did notaffect feed intake nor faeces production (P≥0.1). 3.2. Nutrient apparent digestibility coefficients (ADC) and body nutrientcomposition All calculated ADC are given in Supplemental Table 2. Fig. 2A, B, Cand D shows respectively the ADC of dry matter (DM), crude protein, crude fat and total carbohydrates. Dietary NSP level adversely affectedthe ADC of DM (-9.3%; P< 0.001), protein (-1.0%; P<0.1) andcarbohydrates (-45.4%;P<0.001),while the ADC of fat was unaffected(P>0.1). BAS was beneficial only for the ADC of fat (+1.2%;P<0.05).Effects of NSP level and BAS on body nutrient composition were outsidethe scope of this study and are therefore given in Supplemental Table 3. 3.3. Bile acid metabolism Of the 21 bile acids that were quantified, glycodeoxycholic acid (G-DCA), deoxycholic acid (DCA), glycohyocholic acid (G-HCA), hyocholicacid (HCA), glycohyodeoxycholic acid (G-HDCA), hyodeoxycholic acid(HDCA) glycolithocholic acid (G-LCA), lithocholic acid (LCA) andursodeoxycholic acid (UDCA) were not detected in any of the samples. 3.3.1. Dietary bile acid content Total dietary bile acid content of the 0.3% BAS diets was more thansix times higher (+4066 umolkg-DM) compared to the 0% BAS diets(Table 1). Dietary content of individual bile acids is given in Supple-mental Table 4. Both T-CA and G-CA were supplemented, and theircontent in the 0.3% BAS diets was respectively five times higher (+2646umolkg-DM) and 234 times higher (+1397 umol kg-DM) comparedto the 0% BAS diets. 3.3.2. Body bile acid pool, liver+ gallbladder and gastro-intestinal bile acidpool The main constituents of the total body bile acid pool of trout fed the0% BAS diets were T-CA (86.3%) and T-CDCA (13.3%), while G-CA(<1%) was virtually absent. BAS led to a significantly enlarged totalbody bile acid pool size (+900 umol kg-fish DM; P <0.01), which wasmainly ascribed to both an increase of the T-CA pool (+507 umol kg一1DM; P <0.05) and G-CA pool (+ 502 umol kg-fish DM; P<0.001). G-CA (14.6% of total pool) replaced T-CDCA (6.8%) as second mostabundant bile acid in the body pool of fish fed the 0.3% BAS diets, whileT-CA (78.5%) remained the most present bile acid. The body bile acidpool size tended to be larger for fish fed the High-NSP diets (P<0.1),However, for individual bile acids, the increase of pool size with NSPlevel was significant only for T-CDCA (+145 umol kgfish DM; P<0.01). BAS enlarged the pool of G-CA (+9664 umol kg-DM; P <0.05) inthe liver + gallbladder of fish that were sampled 6 h after last feeding(Supplemental Table 5). Pools of other bile acids in the liver + gall-bladder were not significantly affected by BAS (P > 0.1). No significanteffects of NSP level on the liver + gallbladder pools of individual andtotal bile acids were found (P>0.1). Liver +gallbladder bile acid poolswere expressed on body weight dry matter in Table 3. The share of thebile acid pools present in the gastro-intestinal tract was estimated usingthe difference between the body and liver + gallbladder bile acid pools.Most bile acids were present somewhere in the gastro-intestinal tract 6hafter feeding (T-CA: 80.9%; G-CA: 87.9%; T-CDCA: 88.1% and total:81.5% of respective bile acids in the total body pool). The level of bile Diet Diet Diet Fig. 1. Effect of dietary non-starch polysaccharide level (NSP) and bile acid supplementation (BAS) on faeces production (panel A), total faecal bile acid content(panel B) and total faecal bile acid loss (panel C) of rainbow trout during 42 days of satiation feeding; Statistical data within each panel are derived from two-wayANOVA for the effect of NSP, BAS and their interaction (NS, not significant: P ≥ 0.1; **:P< 0.01; ***:P<0.001); Error bars indicate standard error of means. Fig. 2. Effect of dietary non-starch polysaccharide level (NSP) and bile acid supplementation (BAS) on the apparent digestibility coefficient (ADC) of dry matter(panel A), crude protein (panel B), crude fat (panel C) and total carbohydrates (panel D) in rainbow trout; Statistical data within each panel are derived from two-wayANOVA for the effect of NSP, BAS and their interaction (NS, not significant: P ≥ 0.1; #: P <0.1; *:P<0.05;**:P<0.01; ***:P<0.001); Error bars indicate standarderror of means. acids present in either the liver+ gallbladder or gastro-intestinal tract (i.e., effect of organ) was largely independent from diet (P >0.1). This wasindicated by the absence of interactions between organ and dietarytreatments, except for G-CA. G-CA was affected by a significant inter-action effect between organ and BAS (P <0.05), indicating a strongerincrease of G-CA in the gastro-intestinal tract compared to the liver +gallbladder. 3.3.3. Faecal bile acid content, faecal bile acid loss (FBAL) and bile acidsynthesis Fig. 1B shows that BAS increased the total faecal bile acid content(+11,674 umol kg-DM;P<0.001), while it decreased with NSP level(-9915 umolkg-l DM; P <0.001). Faecal bile acid content of individualbile acids can be consulted in Supplemental Table 6. Fig. 1C shows thattotal faecal bile acid loss significantly increased with BAS (+44 umolkg-fish d-; p< 0.001), and Table 4 shows that this was mostlyascribed to an increase in the loss of both supplemented bile acids T-CA(+31 umolkg-fish d-l;p<0.01)and G-CA (+15 umol kg-fish d-;P< 0.001). Dietary NSP level did not significantly affect total faecal bileacid loss nor loss of the major individual bile acids (P > 0.1). Fig. 3shows that BAS resulted in a 4-fold decrease of total bile acid synthesis(-38 umolkg-fish d-1; P<0.01). BAS decreased both synthesis of T-CA (-20 umolkg-fish d-) and G-CA (-16 umol kg-fish d-1). G-CAsynthesis rates were negative for fish fed the 0.3% BAS diets. DietaryNSP level did not result in meaningful changes in the synthesis of themajor bile acids (P >0.1). Bile acid synthesis was calculated using bileacid intake, and the latter is given in Supplemental Table 7. 3.3.4. Chyme bile acid content and bile acid absorption Chyme bile acid content on dry matter basis is given in Supplemental Table 8. Chyme total bile acid content expressed per unit of inert di-gestibility marker (i.e., yttrium) is shown in Fig. 4A. Chyme total bileacid content decreased significantly as it passed through the intestinaltract (P <0.001). Averaged over diets, this decrease was -1054 umolmg- yttrium between the pyloric region (PR) and mid intestine (MI),-403 umol mgyttrium between the MI and distal intestine (DI) and -209 umol mgyttrium between the DI and the faeces (F). In otherwords, 63% of the total bile acid absorption occurred between the PRand MI. BAS led to higher chyme total bile acid content (P <0.05),except in the mid intestine (P >0.1). The relative total bile acid ab-sorption also was different over consecutive intestinal sections (P<0.001; Fig. 4B). Relative bile acid absorption was lowest between the MIand DI (57%) and highest in the DI (92%). The absorption was for mostparts independent of NSP level and BAS, except for lower absorptionfrom the MI to DI for the 0.3% BAS diets. Both the chyme content of T-CA and G-CA expressed per unit of inert digestibility marker are shownin Table 5. BAS clearly resulted in higher chyme content of G-CA in allintestinal sections. For T-CA this effect was less strong, and even absentin the MI (P <0.1). Relative absorption of T-CA and G-CA were mostlysimilar. 4. Discussion 4.1. Effect of bile acid supplementation (BAS) on apparent nutrientdigestibility (ADC) Bile acid supplementation (BAS) enhanced crude fat digestibility(ADC) in the current study, but not the ADC of crude protein and totalcarbohydrates. These observations are in line with a previous study thatused diets with the same formulation (Staessen et al., 2020b). Also Effect of dietary non-starch polysaccharide level and bile acid supplementation on the liver + gallbladder bile acid pool and estimated gastro-intestinal bile acidcontent of rainbow trout 6 h after satiation feeding. Bile acid (umol Liver + gallbladder bile acid pool Estimated gastro-Intestinal bile acid SEM Significance* kg-fish DM) content Diet Diet LOw-NSP High-NSP Low-NSP High-NSP 0% 0.3% 0% 0.3% 0% 0.3% 0% 0.3% NSP BAS NSP X Organ Organ x Organ x Organ x BAS BAS BAS BAS BAS BAS BAS BAS BAS NSP BAS NSPX BAS Primary bile acids T-CA 523 334 259 775 1532 2315 2126 2029 414.4 NS NS ** NS NS NS G-CA 0.4 53.1 0.0 152.1 4.4 437.5 5.2 371.2 59.17 NS NS NS NS CA 1.1 0.9 0.7 0.1 1.5 1.0 2.3 1.3 0.52 NS ★ NS # NS NS NS T-CDCA 43 8 34 55 214 177 403 241 38.1 ★ NS # NS NS CDCA 0.6 1.0 0.5 0.4 1.6 0.9 1.8 1.7 0.26 NS NS NS NS NS Secondary bile acids T-HCA 0.01 0.01 0.01 0.01 0.34 0.26 0.31 0.30 0.057 NS NS NS ★★★ NS NS NS T-LCA 0.02 0.03 0.01 0.01 0.02 0.04 0.05 0.06 0.036 NS NS NS NS NS NS NS Total 569 397 294 983 1754 2931 2539 2644 487.6 # NS ★★ NS NS NS DM: dry matter; SEM: standard error of means. T-: tauro; G-: glyco; CA: cholic acid; CDCA: chenodeoxycholic acid; HCA: hyocholic acid; LCA: lithocholic acid. G-CDCA (glycochenodeoxycholic acid), T-DCA (taurodeoxycholic acid), G-DCA (glycodeoxycholic acid), DCA (deoxycholic acid), G-HCA (glycohyocholic acid),HCA (hyocholic acid), T-HDCA (taurohyodeoxycholic acid), G-HDCA (glycohyodeoxycholic acid), HDCA (hyodeoxycholic acid), G-LCA (glycolithocholic acid), LCA(lithocholic acid), T-UDCA (taurousrsodeoxycholic acid), G-UDCA (glycoursodeoxycholic acid) and UDCA (ursodeoxycholic acid) were also measured, but their levelsin the body and liver + gallbladder were below the detection limit (detection limits are given in Supplemental Table 9). 2Estimated intestinal bile acid pool = body bile acid pool-(liver + gallbladder bile acid pool); Data on the body bile acid pool is given in Table 2.Low-NSP: 0% inclusion of the NSP-rich ingredient mixture (NSP-rich ingredient mixture is shown in Table 1); High-NSP: 16% inclusion of the NSP-rich ingredientmixture; 0% BAS: 0% bile acid supplementation (bile acid mixture is shown in Table 1); 0.3% BAS: 0.3% bile acid supplementation. 4P-values are derived from a mixed model three-way ANOVA for the effect of organ (within-subject factor), non-starch polysaccharide level (NSP; between-subjectfactor), bile acid supplementation (BAS; between subject factor) and their interactions; NS, not significant: P ≥ 0.1; #: P<0.1;*:P<0.05;**:P<0.01; ***:P<0.001. Because of rounding, totals do not necessarily add up exactly. several other studies with fish have shown that BAS can be beneficial forfat ADC (Gu et al., 2017; Iwashita et al., 2008; Yamamoto et al., 2007).Furthermore, Kortner et al. (2016) and Robic et al. (2011) reportedenhanced trypsin activity in the presence of bile acids, which also sug-gests a beneficial role of BAS for protein digestion, but was not the casefor this study. Nevertheless, literature generally agrees that the greatestbenefit of BAS is achieved for fat digestion. The obvious reason for thisare the emulsifying properties of bile acids, which allows for moreefficient hydrolysis of fat by lipases in the intestine (Pasquier et al.,1996; Romano et al., 2020). Furthermore, bile acids can activate the bileacid-activated lipase (Kurtovic et al., 2009). Higher fat ADC of fish fedthe BAS diets in the current study was most likely related to the enlargedtotal body bile acid pool size and/or the higher bile acid concentrationsin the intestine, which resulted in better emulsification of dietary fatand/or activation of lipases. The improvement of fat ADC with BAS inthe current study occurred independently from NSP level. As in thisstudy fishmeal-based diets were fed, this suggests that bile acids can be alimiting factor for fat digestion in rainbow trout. 4.2. Effect of bile acid supplementation (BAS) on the bile acid metabolism Quantitative data on body bile acid pools of fish is lacking in liter-ature. However, bile acid-supplemented diets were reported to causeelevated biliary bile acid concentrations in Atlantic salmon (Salmo salar)(Kortner et al., 2016) and rainbow trout (Yamamoto et al., 2007), whichsuggest enlarged total body bile acid pool sizes with BAS similar like inthe current study. The enlarged total body bile acid pool size with BAS inthe current study occurred despite an increase in faecal bile acid loss anda decrease in bile acid synthesis compared to diets without BAS. Theeffect of BAS on faecal bile acid loss has to our knowledge not yet beenreported for fish. However, enhanced faecal bile acids loss with BAS wasalso reported in the study by Jones et al. (2012) with mice. Faecal bile acid loss is the product of faeces production and faecal bile acid content.Since BAS did not affect faeces production in this study, enhanced faecalbile acids loss with BAS was fully ascribed to an increase in faecal bileacid content. Furthermore, this study showed a>4-fold decrease of totalbile acid synthesis with BAS. Murashita et al. (2018) observed alteredexpression of genes involved in bile acid synthesis when trout was fedBAS diets (i.e.,cyp7a1, cyp8b1 and shp), suggesting a decrease in bileacid synthesis. However, in the same study soybean meal-based dietswere used, and it is unclear if the reduction in gene expression wasrelated to BAS or anti-nutrients in soybean meal itself. Also in large-mouth bass (Micropterus salmoides) BAS seems to lead to a reduction insynthesis of bile acids, as indicated by a reduction in the expression ofthe rate-limiting enzyme cyp7a1 (Romano et al., 2022). Mainly throughstudies with mammalian species, literature shows that bile acids regu-late their own synthesis via a positive and negative feedback in EHCcontrolled by the liver X receptor and the intestinal farnesoid X receptor,respectively (Romano et al., 2020). Most likely, the elevated content ofbile acids in the chyme, an increased return of bile acids to the liver andan elevated bile acid pool in the liver + gallbladder when feeding theBAS diets supressed bile acid synthesis in the current study. Results of the current study show that taurine-conjugates of cholicacid (T-CA) and chenodeoxycholic acid (T-CDCA) are the main con-stituents of the naturally occurring (i.e., 0% BAS diets) total body bileacid pool of rainbow trout. This is in line with literature (Denton et al.,1974; Hagey et al., 2010; Yamamoto et al., 2007). Compared to mam-mals, glycine-conjugated bile acids (G-) are much rarer in fish since theirCoA: amino acid N-acyltransferase has a much lower affinity for glycinethan for taurine (Vessey et al., 1990). Even stronger, for several fishspecies including rainbow trout, studies report that taurine is the onlyamino acid that conjugates with bile acids (Kim et al., 2005; Kim et al.,2015; Kortner et al., 2016; Yamamoto et al., 2007). In the current study,both T-CA and G-CA were incorporated in the 0.3% BAS diets. The body Table 4 Effect of dietary non-starch polysaccharide level and bile acid supplementation on faecal bile acid loss and bile acid synthesis of rainbow during 42 days of satiationfeeding. Bile acid (umol kg-fish d-)1 Faecal bile acid loss Bile acid synthesis Diet² SEM Significance Diet SEM Significance Low-NSP High-NSP Low-NSP High-NSP 0% 0.3% 0% 0.3% NSP BAS NSPX 0% 0.3% 0% 0.3% NSP BAS NSP X BAS BAS BAS BAS BAS BAS BAS BAS BAS BAS Primary bile acids T-CA 27 53 21 58 5.6 NS NS 32 14 32 11 5.7 NS NS G-CA 0.10 13.88 0.02 15.85 0.905 NS NS 2 -10 5 -14 2.8 NS NS CA 0.5 1.0 0.2 0.5 0.10 ★★ NS -0.5bc -0.1 -0.gab -1.2 0.12 NS T-CDCA 12 7 13 12 1.9 NS NS NS 15 11 16 15 2.3 NS NS NS G-CDCA 0.09 0.04 BDL 0.01 一 -0.1 -0.1 -0.1 -0.1 0.05 NS NS NS CDCA 0.19 0.22 0.06 0.17 0.045 # NS NS 0.03 0.07 -0.07 0.02 0.043 NS NS NS Secondary bile acids T-HCA 0.007 0.003 0.037b 0.058 0.0066 ★★★ NS # 0.006 0.004 0.038 0.057 0.0073 ★★★ NS NS T-LCA 0.007 0.012 0.004 0.006 0.0018 NS 0.007 0.013 0.003 0.005 0.0023 NS NS T-UDCA 0.03 一 一 一 一 一 一 一 -0.05 -0.05 -0.03 -0.04 0.014 NS NS NS G-UDCA 0.05 一 一 一 一 一 一 一 -0.08 -0.09 0.05 -0.10 0.030 NS NS NS Total+ Absolute 40 75 35 87 7.7 NS ★★★ NS 49 14 52 10 8.9 NS NS Relative (% GBAPtotal 7 11 6 12 1.3 NS NS 8 2 8 1 1.5 NS NS d-1)5 GBAPtotal: geometric mean total body bile acid pool size; DM: dry matter; SEM: standard error of means. T-: tauro; G-: glyco; CA: cholic acid; CDCA: chenodeoxycholic acid; HCA: hyocholic acid; LCA: lithocholic acid; UDCA: ursodeoxycholic acid. Faecal bile acid loss and bile acid synthesis are expressed on fish wet weight. “Low-NSP: 0% inclusion of the NSP-rich ingredient mixture (NSP-rich ingredient mixture is shown in Table 1); High-NSP: 16% inclusion of the NSP-rich ingredientmixture; 0% BAS: 0% bile acid supplementation (bile acid mixture is shown in Table 1); 0.3% BAS: 0.3% bile acid supplementation; -: not calculated becauserespective bile acids were below the detection limit in feed, faeces or body; Values for either faecal bile acid loss or synthesis in the same row lacking common su- perscripts are statistically different (P <0.05) according to Tukey's multiple comparison test. °NSP: non-starch polysaccharide level; BAS: bile acid supplementation; NS, not significant: P ≥ 0.1; #: P<0.1;*:P<0.05;**:P< 0.01;***:P<0.001.“Because of rounding, totals do not necessarily add up exactly. For bile acid synthesis, these values represent the total bile acid fractional turnover rate. Fig. 3. Effect of dietary non-starch polysaccharide level (NSP) and bile acidsupplementation (BAS) on total bile acid synthesis of rainbow trout during 42days of satiation feeding; Statistical data are derived from two-way ANOVA forthe effect of NSP, BAS and their interaction (NS, not significant: P ≥ 0.1; **:P<0.01;); Error bars indicate standard error of means. foreign G-CA was added as a marker to see if supplemented bile acidsefficiently enter EHC. The current study likely indicates that both di-etary T-CA and G-CA enter EHC. This is indicated by the enlarged T-CAand G-CA body pools of fish fed the 0.3% BAS diets measured 24 h aftertheir last meal. After 6 weeks of feeding the 0.3% BAS diets, 14.6% of thetotal body bile acid pool consisted of G-CA compared to 0.2% for the 0%BAS diets. Also the substantial presence of G-CA in the liver + gall-bladder of fish fed the 0.3% BAS diets shows participation of G-CA inEHC and this was also shown by Yamamoto et al.(2007). G-CA synthesisin fish fed the 0% BAS diets was nil (2.5 umol kg-BW d-) and not statistically different from zero. This seems to agree with literature thatG-CA is not synthesised in rainbow trout (Romano et al., 2020). Sur-prisingly, BAS resulted in a negative synthesis rate for G-CA (-12.0umol kg-l BW d-l) that was significantly different from zero. Thisnegative synthesis rate indicates that the intake of G-CA via the diets waslarger than their faecal loss and gain in the body bile acid pool com-bined. This implies that G-CA was catabolised or perhaps converted intoother bile acids (e.g., re-conjugation to T-CA). Unconjugated and sec-ondary bile acids that return to the liver are known to undergo re-conjugation, re-epimerization of hydroxy groups (from β to d) andreduction of oxo groups to hydroxy groups (Hofmann and Hagey, 2014).However, it is unclear from literature if re-conjugation of conjugatedbile acids also occurs. The current study showed that BAS resulted in a reduced synthesis ofT-CA but not of the other primary bile acid T-CDCA. Synthesis of T-CAand T-CDCA use largely the same enzymes (e.g., cholesterol 70-hy-droxylase [CYP7A1]), except for the enzyme sterol 12o-hydroxylase(CYP8B1) (Chiang, 2011; Romano et al.,2020). CYP7A1 is the first rate-limiting enzyme of bile acid synthesis, while CYP8B1 determines theratio of CA to CDCA (Chiang, 2011). A possible explanation for thedifference in effect of BAS on synthesis of T-CA and T-CDCA might be adifferential regulation of CYP7A1 and CYP8B1 in rainbow trout. Largely independent from diet, much of the total bile acid pool waspresent in the gastro-intestinal tract 6 h after last feeding. This indicatesthat the gallbladder was contracted by signals indicating that chyme isentering the intestine, which is in line with the largely empty gallblad-ders that were observed during sampling of the fish. Table 5 and Fig. 4Ashow that the chyme T-CA, G-CA and total bile acid content decreased aschyme passed alongside the gastrointestinal tract. This decrease waslargely independent of diet except for a much larger decrease of G-CAover intestinal sections in fish fed the 0.3% BAS diets. The latter is un-derstandable since G-CA was virtually absent in the 0% BAS diets, and Intestinal section口Low-NSP 0% BAS 口LOW-NSP 0.3% BAS 口High-NSP 0% BAS ■High-NSP 0.3% BAS 口LOw-NSP 0% BAS 口LOw-NSP 0.3% BAS 口 High-NSP 0% BAS ■ High-NSP 0.3% BAS Fig. 4. Effect of dietary non-starch polysaccharide level (NSP) and bile acidsupplementation (BAS) on chyme/faecal total bile acid content expressed perunit of inert digestibility marker (yttrium) (panel A; logarithmic scale) andrelative total bile acid absorption (panel B) for rainbow trout 6 h after satiationfeeding; PR: pyloric region, MI: mid intestine, DI: distal intestine, F: faeces;Statistical data within panel and per intestinal section are derived from two-way ANOVA done per intestinal section for the effect of NSP, BAS and theirinteraction (NS, not significant: P ≥0.1;#:P<0.1; *: P <0.05;**:P<0.01);Error bars indicate standard error of means; Averages over diets per intestinalsection are represented by braces, and are within panel statistically different (P< 0.05) according to Tukey's multiple comparison test when lacking a commonletter. A mixed model ANOVA was performed also for the effect of intestinalsection (IS; within-subject factor), NSP (between-subject factor), BAS (between-subject factor) and their interactions for both chyme/faecal total bile acidcontent expressed per unit of inert digestibility marker (SEM: 165.9, NSP: #,BAS: #, NSP x BAS: NS, IS: ***, IS x NSP: #, IS x BAS: * and IS x NSP x BAS: NS)and relative total bile acid absorption between intestinal sections (SEM: 5.0,NSP: NS,BAS: #,NSP x BAS: NS, IS: ***, IS x NSP: NS, IS x BAS: * and IS x NSP xBAS: NS); Due to an error in the analysis of yttrium content in the mid intestinefor one of the replicate tanks of the Low-NSP 0% BAS diet, the average shownand statistics pertains only to the other 2 replicate tanks. once again shows that dietary G-CA participated in EHC. Bile acids arestored in the gallbladder until they are secreted into the intestine duringdigestion. The bile duct of trout opens into the pyloric region of theintestine, the latter being the major site for fat absorption by enterocytes(Bakke et al., 2010). While the transporters associated with intestinalbile acid uptake in mammals have been extensively studied, relativelylittle information is available for fish. Romarheim et al. (2008) reportedfor rainbow trout the largest reduction in content of bile acids betweenthe mid and distal intestine, suggesting that the distal intestine is themajor site for absorption of bile acids. Furthermore, Murashita et al.(2014) identified an apical sodium-dependent bile salt transporter(ASBT) in the brush border membrane of the intestine of rainbow trout.Tissue distribution analysis revealed that this ASBT was primarily expressed in the distal intestine. The relative absorption of T-CA, G-CAand total bile acids in the current study was higher in the distal part ofthe intestine, which might be explained by higher expression of bile acidtransporters. However, absolute absorption in the current study showsthat more than half of the bile acids are reabsorbed between the pyloricregion and mid intestine. The latter shows that significant more bile acidabsorption can occur in the proximal intestine of rainbow trout thanpreviously thought. Relative absorption of T-CA and G-CA in the currentstudy were very similar, suggesting that the intestinal bile acid trans-porters in rainbow trout do not show a different affinity for the body'sown T-CA compared to the body's foreign G-CA. 4.3. Effect of dietary non-starch polysaccharide (NSP) level on the bileacid metabolism The effects of BAS were aimed to be investigated under conditions of“normal”and“enhanced”faecal bile acid loss. Based on our previousstudies (Staessen et al., 2020a; Staessen et al., 2020b), an NSP-richingredient mixture consisting of soy hulls and wheat bran was used inthe current study to induce faecal bile acid loss. However, unlike thoseprevious studies, the High-NSP diet did not result in enhanced faecal bileacid loss in the current study. Faecal bile acid loss is the product of faecesproduction and faecal bile acid content. The latter has been described tochange with gut transit time (Pattni and Walters, 2009). Changes infaeces production with dietary NSP level in the current study weresimilar to the previous studies. Fig. 4 shows that faeces productionincreased with dietary NSP level, which was most likely related to lowerdry matter ADC (resulting from the indigestible nature of NSP in fish)(Choct et al., 2010) and an increase in voluntary feed intake (ascompensation for the lower digestible energy content) (Lekva et al.,2010). In contrast to changes in faeces production, changes in faecal bileacid content with dietary NSP level were not comparable betweenstudies. Total faecal bile acid content was not significantly affected bydietary NSP level in previous studies (Staessen et al., 2020a, 2020c), andenhanced faecal bile acid loss of fish fed High-NSP diets was largelyascribed to higher faeces production. In contrast to those previousstudies, faecal bile acid content decreased with increasing NSP level inthe current study. The lower faecal bile acid content of fish fed the High-NSP diets most likely was related to dilution of bile acids in the intestineby a larger chyme volume due to NSP bulking compared to the Low-NSPdiets, as also observed in mammalians (Hill, 1982). Since an NSP-richingredient mixture with the same ingredients was used, it is unclearwhat exactly caused the different outcome of this study compared toprevious studies. Possibly, differences in processing conditions of theNSP-rich ingredients altered their characteristics. For example, ingre-dient particle size was shown to alter the bile acid binding potential ofwheat bran (Li et al., 2017). Perhaps, the slightly higher bile acid con-tent of the 0% BAS diets in the current study compared to our previousstudy (+10% in Staessen et al. (2020b)) nullified the effect of NSP.Biological differences between batches of fish might also partiallyexplain the different outcome of this study compared to previousstudies. Whereas faeces production almost doubled (x1.9) withincreasing NSP level, total faecal bile acid content decreased more thantwo-fold, cancelling out the effect on total faecal bile acid loss. Staessen et al. (2020a, 2020b) showed that enhanced faecal bile acidloss was inversely related to fat ADC. Furthermore, Staessen et al.(2020b) showed that this inverse relationship between faecal bile acidsloss and fat ADC disappeared when diets were supplemented with bileacids. Enhanced faecal bile acid loss was suggested to be indicative forlimited availability of bile acids needed for proper fat digestion. Theexact mechanism(s) behind this limited availability was not identified,but a reduction of the total bile acid pool size or availability of bile acidsin the intestine are suggested as possibilities. The lack of an NSP effecton faecal bile acid loss in the current study does not allow to investigatethe relationship between enhanced faecal bile acid loss, bile acid poolsize and bile acid levels in the intestine. Nevertheless, based on the Table 5 Effect of dietary non-starch polysaccharide level and bile acid supplementation on chyme and faecal content and relative absorption of taurocholic and glycocholic acidin rainbow trout 6 h after satiation feeding. T-CA G-CA Diet² SEM P-value° Diet SEM Significance Low-NSP High-NSP Low-NSP High-NSP 0% 0.3% 0% 0.3% BAS NSP NSP X 0% 0.3% 0% 0.3% NSP BAS NSP X BAS BAS BAS BAS BAS BAS BAS BAS BAS BAS Bile acid content (umol mg-yttrium) PR 1240 1942 1012 1189 200.2 # 六 NS 2.4 416.6 0.8 294.1 40.13 NS NS MI 785° 472 377 431 213.0 NS NS NS 1.6 111.8 0.3 97.8 11.54 NS NS DI 139 251 112 211 27.4 NS NS 0.3 59.2 0.1 48.0 5.14 NS NS F 8 15 6 16 1.5 NS NS 0.03 4.02 0.01 4.28 0.299 NS NS Relative bile acid absorption (%) PR→ MI 69 75 62 64 3.7 NS NS 675 73 61 67 6.0 NS NS NS MI→ DI 64 45 71 52 6.1 NS NS 61 44 78 51 7.2 NS NS DI→F 94 94 95 89 2.3 NS NS NS 89 93 59 89 14.8 NS NS NS PR: pyloric region; MI: mid intestine; DI: distal intestine. T-CA: taurocholic acid; G-CA: glycocholic acid. Total chyme/faecal bile acid content and relative total bile acid absorption are shown in Fig. 4. “Low-NSP: 0% inclusion of the NSP-rich ingredient mixture (NSP-rich ingredient mixture is shown in Table 1); High-NSP: 16% inclusion of the NSP-rich ingredientmixture; 0% BAS: 0% bile acid supplementation (bile acid mixture is shown in Table 1); 0.3% BAS: 0.3% bile acid supplementation. P-values are derived from two-way ANOVA for the effect of non-starch polysaccharide level (NSP), bile acid supplementation (BAS) and their interaction; NS, notsignificant: P ≥ 0.1; #: P<0.1; *: P<0.05; **:P<0.01;***:P<0.001; A mixed model ANOVA for the effect of intestinal section (IS; within-subject factor),NSP(between-subject factor), BAS (between-subject factor) and their interactions was also performed for T-CA content (SEM: 150.0, NSP: #, BAS: NS, NSP x BAS: NS, IS:***, IS x NSP: #, IS x BAS: # and IS x NSP xBAS: NS), relative T-CA absorption (SEM: 4.6, NSP: NS, BAS:*,NSP xBAS: NS, IS: ***, IS x NSP: #,IS xBAS: ** and IS xNSPx BAS: NS), G-CA content (SEM: 20.05, NSP: NS, BAS: ***, NSP x BAS: NS, IS: ***, IS x NSP: NS, IS x BAS: *** and IS x NSP x BAS: NS) and relative G-CA absorption (SEM: 10.1, NSP: NS, BAS: NS, NSP x BAS: NS, IS: *, IS x NSP: NS, IS x BAS: * and IS x NSP x BAS: NS). 4 Bile acid content is expressed on yttrium, and the latter was used as inert digestibility marker in the diets (Table 1). Due to an error in the analysis of yttrium content in the mid intestine for one of the replicate tanks of the Low-NSP 0% BAS diet, the average shown and statisticspertain only to the other 2 replicate tanks and the SEM for that row is a pooled SEM. outcome of those previous studies, a lack of NSP level on fat ADC in thecurrent study seems to confirm that hampered fat ADC and enhancedfaecal bile acid loss are indeed inversely related. 5. Conclusion Bile acid supplementation (BAS) is beneficial for fat digestion, butnot for digestion of protein and carbohydrates. The improvement of fatdigestion with BAS in the current study shows that bile acids can even bea limiting factor for fat digestion in rainbow trout that are fed highquality (Low-NSP) fishmeal-based diets. Total bile acid synthesis decreased a 4-fold with bile acid supplementation. This decreased bileacid synthesis was most likely related to negative feedback regulation ofbile acid synthesis by the enlarged total body bile acid pool, liver +gallbladder bile acid pool and higher content of bile acids in the intestineof fish fed diets with bile acid supplementation. Negative synthesis ratesof G-CA for the BAS diets suggest that this bile acid is partly catabolisedor converted into other bile acids in rainbow trout. Enlarged pools of T-CA, but especially of the body foreign G-CA, in both the body and liver +gallbladder of trout fed BAS diets suggests that dietary bile acids areeffectively taking part in EHC. The relative absorption of T-CA and G-CAover the different intestinal sections was comparable, suggesting thatintestinal bile acid transporters in rainbow trout do not differ in affinityfor the body’s own T-CA compared to the body's foreign G-CA. Whilerelative absorption of bile acids was highest between the distal intestineand the faeces, more than half the bile acids were absorbed between thepyloric region and the mid intestine. The latter suggests that significantbile acid absorption occurs more proximal in the intestine of rainbowtrout than previously thought. Funding This study was funded by the Netherlands Organisation for ScientificResearch (NWO) under grant number 022.004.005. The recirculatingaquaculture system used for running the experiment was cofounded bythe NWO (code 805-34.025). Additional funding for this study wasobtained from Cargill, Evonik Nutrition and Care GmbH and Saria. CRediT authorship contribution statement T.W.O. Staessen: Conceptualization, Methodology, Investigation,Formal analysis, Writing- original draft, Visualization. M.C.J. Verde-gem: Writing - review & editing, Supervision. J.W. Schrama:Conceptualization, Methodology, Formal analysis, Writing- review & editing, Supervision, Project administration, Funding acquisition. Declaration of Competing Interest My Research Project was partially sponsored by the NetherlandsOrganisation for Scientific Research (NWO) with grant number022.004.005. Additional funding for this research was obtained fromCargill, Evonik Nutrition and Care GmbH and Saria. Acknowledgment The authors thank Menno ter Veld and other staff of the aquacultureresearch facilities of Wageningen University for their technical supportwhile running the experiment. Furthermore, we acknowledge RonaldBooms, Tino Leffering, Erik van der Brink and Samara Hutting for theirsupport during the lab analyses at the aquaculture and fisheries group ofWageningen University. Appendix A. Supplementary data Supplementary data to this article can be found online at https://doi.org/10.1016/j.aquaculture.2022.738724. References ( Adam, A., Levrat-Verny, M.A., Lopez, H.W. , Leuillet, M., Demigne, C., Remesy, C., 2001 . Whole wheat and tr i ticale flours with differing viscosities stimulate cecal fermentations and lower plasma and hepatic lipids in rats. J . Nutr. 131 (6), 1770-1776. h t tp s: / / doi . or g / 10.1 0 93 / j n / 1 3 1 . 6.1 7 70 . ) ( Bakke, A.M., Glover, C., Krogdahl, A., 2010. Feeding, digestion and absorption ofnutrients. In: Grosel l , M., Farrell , A.P., Brauner, C.J. (Eds.), Fish Physiology. TheMult i functional Gut of Fish,, 1 edvol. 30. Elsevier, pp. 57 - 110. h ttps :// doi . org / 10.1016 / S1 5 46-5098( 10 )03002 -5 . ) ( Bureau, D.P., Kaushik, S.J . , Cho, C.Y., 2003. Bioenergetics. In: Halver, J.E., Hardy, R.W.(Eds.), Fish Nutrition, 3 ed. Academic Press, pp. 1-59. htt p s : / / d oi . org / 1 0.1016 / b978-012319652 - 1 /5 0002 - 1 . ) ( Cai, J.S., Chen,J.H., 2014. The mechanism of enterohepatic circulation in the formationof gallstone disease. J. Membr. Biol. 247 (11),1067 - 1082. http s : / /d oi . org / 10.1007 / s 002 3 2- 0 1 4 - 971 5- 3 . ) ( Chiang, J.Y.L. , 2011. Bile acid metabolism. In: Monga, S.P.S. (Ed.), Molecular Pathology of Liver Diseases. Molecular Pathology Library, vol . 5. Springer, Boston, MA, USA, pp. 165-179. https :// d o i . org / 10.1007 / 978- 1 - 441 9 -710 7 - 4 _ 1 . ) ( Choct, M., Dersjant-Li, Y., McLeish, J., Peisker, M., 2010. Soy oligosaccharides andsoluble non-starch polysaccharides: a review of digestion, nutr i tive and anti-nutritive effects in pigs and poultry. Asian Australas. J . Anim. Sci. 23 (10), 1386-1398. h t tps : / / doi . o rg/ 1 0.571 3 /a jas . 20 1 0.90222 . ) ( de Moura, L.B., Diogenes, A.F., Campelo, D.A.V. , de Almeida, F.L.A., Pousao-Ferreira, P.M., Furuya, W.M., Oliva-Teles, A., 2019. Nutrient digestibility, digestive enzymesactivity, bile drainage alterations and plasma metabolites of meagre (Argyrosomus regius) feed high plant protein diets supplemented with taurine and methionine. Aquaculture 511,734231 . ht tp s: / / doi . or g/ 10 . 1016/ j. a q uac ul ture . 201 9 . 7 34 2 3 1 . ) ( Deng, J.M., Bi, B.L., Kang, B., Kong, L.F., Wang, Q.J., Zhang, X., 2013. Impro O v V i I ng thegrowth performance and cholesterol metabolism of rainbow trout (Oncorhynchusmykiss) fed soyabean meal-based diets using dietary cholesterol supplementation. Br.J. Nutr. 110 (1) , 29-39. https: / / doi . org / 1 0. 1 0 1 7 / S0007114512004680 . ) ( Denton, J.E . , Yousef, M.K. , Yousef, I.M., Kuksis, A., 1974. Bile acid composi t ion of rainbow trout, Salmo gairdneri. Lipids 9 (12), 945-951 . h ttps :// d o i. o rg / 1 0. 1 007 / BF025 3 3816 . ) ( Dongowski, G . , 2007. Interactions between dietary fibre-rich preparations andglycoconjugated bile acids in vitro. Food Chem. 104 (1), 390-397. h ttps: // d o i .or g / 10.101 6/ j . foodchem.2006 . 11 . 05 3 . ) ( Gu, M., Bai, N., Kortner, T.M., 2017. Taurocholate supplementation attenuates thechanges in growth performance, feed utilization, lipid digestion, l iver abnormalityand sterol metabolism in turbot (Scophthalmus maximus) fed high level of plantprotein. Aquaculture 468, 597-604 . h t tps : / / d o i . org / 10. 1 016 /j . aq ua c u l t u re . 2 016 . 11 .0 22 . ) ( Hagey, L.R . , Moller, P.R., Hofmann , A.F., Krasowski, M.D., 2010. Diversity of bile salts infish and amphibians: evolution of a complex biochemical pathway. Physiol.Biochem. Zool. 83 (2), 308-321 . https: // d o i .o rg / 10.1086/6 4 9966 . ) ( Hill, M.J . , 1982. Colonic bacterial activity ef f ect of f iber on substrate concentration andon enzyme action. In: Vahouny, G.V., Kritchevsky, D. (Eds.), Dietary Fiber in Healthand Disease. GWUMC Department of Biochemistry Annual Spring Symposia.Springer, Boston, MA, USA, pp. 35-43. http s : // d oi . org / 10.1007/978-1 - 4615-6850 - ) 6_4. ( Hofmann, A.F . , Hagey, L.R. , 2014. Key discoveries in bile acid chemistry and biology andtheir clinical applications: history of the last eight decades. J. Lipid Res. 55(8), 1553-1595. https : / / doi . or g/ 10. 1 194 / j lr . R 0494 37 . ) ( Ide, T., Horii, M., Kawashima, K. , Yamamoto, T., 1989. Bile acid conjugation and hepatictaurine concentration in rats fed on pectin. Br. J. Nutr. 62 (3), 539-550. http s: / / doi . o r g/ 10 .107 9 / b jn 1 9890056 . ) ( Ikegami, S., Tsuchihashi, F., Harada, H., Tsuchihashi, N., Nishide, E., Innami, S., 1990.Effect of viscous indigest i ble polysaccharides on pancreatic-biliary secretion anddigestive organs in rats. J. Nutr. 120 (4), 353-360. ht t ps : // d o i . org / 10.1093 / j n / 12 0 .4 . 353 . ) ( Iwashita, Y . , Suzuki, N., Yamamoto, T . , Shibata, J.-I., Isokawa, K., Soon, A.H., Goto, T . ,2008. Supplemental effect of cholyltaurine and soybean l ecithin to a soybean meal-based fish meal-free diet on hepatic and intestinal morphology of rainbow trout Oncorhynchus mykiss. Fish. Sci. 74 (5),1083 - 1095. https ://d o i .o r g/1 0 .11 1 1 / j . 1 44 4 -29 0 6.200 8 . 0 1628.x . ) Jones, R.D., Repa, J.J., Russell, D.W., Dietschy, J.M., Turley, S.D., 2012. Delineation ofbiochemical, molecular, and physiological changes accompanying bile acid pool sizerestoration in Cyp7al(-/-) mice fed low levels of cholic acid. Am. J. Physiol.Gastrointest. Liver Physiol. 303 (2), G263-G274. https://doi.org/10.1152/ajpgi.00111.2012. ( Kaushik , S.J . , Sc hr a ma , J . W. , 202 2 . Bioenerge t ic s. I n: F i sh N u t r ition. Ac a demic Press , 1K , S pp. 17- 5 5 . ) Kim, G.-B., Brochet, M., Lee, B.H., 2005. Cloning and characterization of a bile salthydrolase (bsh) from Bifidobacterium adolescentis. Biotechnol. Lett. 27 (12), 817-822.https://doi.org/10.1007/s10529-005-6717-3. Kim, S.-K., Kim, K.-G., Kim, K.-D., Kim, K.-W., Son, M.-H., Rust, M., Johnson, R., 2015.Effect of dietary taurine levels on the conjugated bile acid composition and growth ofjuvenile Korean rockfish Sebastes schlegeli (Hilgendorf). Aquac. Res. 46 (11),2768-2775. https://doi.org/10.1111/are.12431. ( Kortner, T.M., Penn, M.H., Bjrkhem, I . , Masoval, K. , Krogdahl , A., 2016. Bile componentsand lecithin supplemented to plant based diets do not diminish diet related intestinal inflammation in Atlantic salmon. BMC Vet. Res. 12 (1), 190. http s: // doi . org / 10 . 1186 /s 1 291 7- 0 1 6 - 08 19- 0 . ) ( Kregiel, D., Berlowska, J., Witonska, I ., Antolak, H., Proestos, C., Babic, M., Zhang, B.,2017. Saponin-based, biological-active surfactants from plants. In: Najjar, R. (Ed.),Application and Characterization of Surfactants, 1 ed. InTech, pp. 183 - 205. h ttps :// doi . o rg / 10.5772 / 68062 . ) ( Kritchevsky, D., 1978. Influence of dietary fiber on bile acid metabolism. Lipids 13 (12), 982 - 985. h ttps : // doi . o rg/ 1 0 . 1 007 / BF025 3 3860 . ) Krogdahl, A., Penn, M., Thorsen, J., Refstie, S., Bakke, A.M., 2010. Important ( antinutrients in plant feedstuffs for aquaculture: an update on recent findingsregarding responses in salmonids. Aquac. Res. 41 (3), 333 - 344. https : / / do i . o rg / 10 . 1111 / j . 1 3 65-2 1 0 9.2009.0242 6 .x . ) Kurtovic, I., Marshall, S.N., Zhao, X., Simpson, B.K., 2009. Lipases from mammals andfishes. Rev. Fish. Sci. 17 (1),18-40. https://doi.org/10.1080/10641260802031322. Lanzini, A., Lanzarotto, F., 2000. Review article: the ‘mechanical pumps’and theenterohepatic circulation of bile acids - defects in coeliac disease. Aliment.Pharmacol. Ther. 14 (Suppl. 2), 58-61. https://doi.org/10.1046/j.1365-2036.2000.014s2058.x. Lekva, A., Hansen, A.-C., Rosenlund, G., Karlsen, O., Hemre, G.-I., 2010. Energy dilutionwith a-cellulose in diets for Atlantic cod (Gadus morhua L.) juveniles - effects ongrowth, feed intake, liver size and digestibility of nutrients. Aquaculture 300 (1-4),169-175. https://doi.org/10.1016/j.aquaculture.2010.01.001. Li, K., Buchinger, T.J., Bussy, U., Fissette, S.D., Johnson, N.S., Li, W., 2015.Quantification of 15 bile acids in lake charr feces by ultra-high performance liquidchromatography-tandem mass spectrometry. J. Chromatogr. B Anal. Technol. Biomed. Life Sci. 1001, 27-34. https://doi.org/10.1016/j.jchromb.2015.07.028.Li, C.-Y., Mense, A.L., Brewer, L.R., Lau, C., Shi, Y.-C., 2017. In vitro bile acid binding capacity of wheat bran with different particle sizes. Cereal Chem. J. 94(4),654-658.https://doi.org/10.1094/cchem-08-16-0211-r. Matheson, H.B., Story, J.A., 1994. Dietary psyllium hydrocolloid and pectin increase bileacid pool size and change bile acid composition in rats. J. Nutr. 124 (8),1161-1165.https://doi.org/10.1093/jn/124.8.1161. ( J n Matin, H.R.H., Shariatmadari, F. , Torshizi, M.A.K., Chiba, L.I., 2016. In vitro bile acid-binding capacity of dietary f ibre sources and their effects with bile acid on broi l erchicken performance and lipid digestibility. Br. Poult. Sci. 57 (3), 348-357. h ttps :// d o i . org / 10.1080 / 0007 1 668.20 1 6. 1 1 63522 . ) Meyer, P.D., DenBesten, L., Mason, E.E., 1979. The effects of a high-fiber diet on bile acidpool size, bile acid kinetics, and biliary lipid secretory rates in the morbidly obese.Surgery 85 (3), 311-316. https://doi.org/10.5555/uri:pii:0039606079901065. ( Moundras, C., Behr, S.R . , Remesy, C., Demigne, C., 1997. Fecal losses of sterols and bileacids induced by feeding rats guar gum are due to greater pool size and liver bileacid secretion. J. Nutr . 127 (6), 1068 - 1076. ht t p s :// doi . org / 10.1093 / j n / 1 2 7. 6 .1 0 68 . ) Murashita, K., Yoshiura, Y., Chisada, S., Furuita, H., Sugita, T., Matsunari, H.,Yamamoto, T., 2014. Homologue gene of bile acid transporters ntcp, asbt, and ost-alpha in rainbow trout OncorhynchusS Tmykiss: tissue expression, effect of fasting, andresponse to bile acid administration. Fish Physiol. Biochem. 40 (2),511-525.https://doi.org/10.1007/s10695-013-9862-y. Murashita, K., Ronnestad, I., Furuita, H., Matsunari, H., Oku, H., Yamamoto, T., 2018.Effects of dietary soybean meal on the bile physiology in rainbow trout,Oncorhynchus mykiss. Aquaculture 490, 303-310. https://doi.org/10.1016/j.aquaculture.2018.02.047. Oliva-Teles, A., Enes, P., Peres, H., 2015. Replacing fishmeal and fish oil in industrialaquafeeds for carnivorous fish. In: Davis, D.A. (Ed.), Feed and Feeding Practices inAquaculture. Woodhead Publishing Series in Food Science, Technology andNutrition, 1 ed. Woodhead Publishing, Cambridge, UK, pp. 203-233. https://doi.org/10.1016/b978-0-08-100506-4.00008-8. Pasquier, B., Armand, M., Castelain, C., Guillon, F., Borel, P., Lafont, H., Lairon, D., 1996.Emulsification and lipolysis of triacylglycerols are altered by viscous soluble dietaryfibres in acidic gastric medium in vitro. Biochem. J. 314 (Pt. 1), 269-275. https://doi.org/10.1042/bj3140269. ( Pattni, S., Walters, J.R., 2009. Recent advances in the understanding of bile acidmalabsorption. Br. Med. Bul l . 92 (1), 79-93. ht t ps : / / d o i . or g/ 10.109 3/ bmb/ld p 032 . ) Robic, S., Linscott, K.B., Aseem, M., Humphreys,E.A., McCartha, S.R., 2011. Bile acids asmodulators of enzyme activity and stability. Protein J. 30 (8), 539-545. https://doi.org/10.1007/s10930-011-9360-y. ( Romano, N., Kumar, V., Yang, G., Kajbaf, K., Rubio, M.B., Overturf, K., Hardy, R., 2020.Bile acid metabolism in f ish: disturbances caused by f ishmeal alternatives and somemitigating effects from dietary bile i nclusions. Rev. Aquac. http s : // doi . org / 1 0.1111 / r a q .124 1 0 . ) ( Romano, N., Fischer , H., Rubio-Benito, M.M., Overtuf, K., Sinha, A.K., Kumar, V., 2022.Different dietary combinations of high/low starch and fat with or without bile acidsupplementation on growth, liver histopathology, gene expression and fatty acid rO 10 composition of largemouth bass, Micropterus salmoides. Comp. Biochem. Physiol. AMol. Integr. Physiol. 266, 111157 h ttps :/ / d o i. org / 10 . 1 016 /j. c b pa . 2022.1 1 11 57 . ) Romarheim, O.H., Skrede, A., Penn, M., Mydland, L.T., Krogdahl, A., Storebakken, T.,2008. Lipid digestibility, bile drainage and development of morphological intestinalchanges in rainbow trout (Oncorhynchus mykiss) fed diets containing defattedsoybean meal. Aquaculture 274(2-4),329-338. https://doi.org/10.1016/j.aquaculture.2007.11.035. Russell, D.W., 2009. Fifty years of advances in bile acid synthesis and metabolism.J. Lipid Res. 50 (Suppl), S120-S125.https://doi.org/10.1194/jlr.R800026-JLR200. Scherer, M., Gnewuch, C., Schmitz, G., Liebisch, G., 2009. Rapid quantification of bileacids and their conjugates in serum by liquid chromatography-tandem mass spectrometry. J. Chromatogr. B Anal. Technol. Biomed. Life Sci. 877 (30),3920-3925. https://doi.org/10.1016/j.jchromb.2009.09.038. Sinha, A.K., Kumar, V., Makkar, H.P.S., De Boeck, G., Becker, K., 2011. Non-starchpolysaccharides and their role in fish nutrition-a review. Food Chem. 127 (4),1409-1426. https://doi.org/10.1016/j.foodchem.2011.02.042. Staessen, T.W.O., Verdegem, M.C.J., Koletsi, P., Schrama, J.W., 2020a. The effect ofdietary protein source (fishmeal vs. plant protein) and non-starch polysaccharidelevel on fat digestibility and faecal bile acid loss in rainbow trout (Oncorhynchusmykiss). Aquac. Res. 51 (3), 1170-1181. Staessen, T.W.O., Verdegem, M.C.J., Weththasinghe, P., Schrama, J.W., 2020b. Theeffect of dietary non-starch polysaccharide level and bile acid supplementation on fatdigestibility and the bile acid balance in rainbow trout (Oncorhynchus mykiss).Aquaculture 523,735174. https://doi.org/10.1016/j.aquaculture.2020.735174. Staessen, T.W., Verdegem, M.C., Nederlof, M.A., Eding, E.H., Schrama, J.W., 2021. Effectof type of dietary non-protein energy source (starch vs. fat) on the body bile acidpool size and composition, faecal bile acid loss and bile acid synthesis in rainbowtrout (Oncorhynchus mykiss). Aquaculture Nutrition 27 (3), 865-879. Vessey, D.A., Benfatto, A.M., Zerweck, E., Vestweber, C., 1990. Purification andcharacterization of the enzymes of bile acid conjugation from fish liver. Comp.Biochem. Physiol. Part B 95 (4), 647-652. https://doi.org/10.1016/0305-0491(90)90299-9. Yamamoto, T., Suzuki, N., Furuita, H., Sugita, T., Tanaka, N., Goto, T., 2007.Supplemental effect of bile salts to soybean meal-based diet on growth and feedutilization of rainbow trout Oncorhynchus mykiss. Fish. Sci. 73 (1), 123-131. https://doi.org/10.1111/j.1444-2906.2007.01310.x.
确定


还剩10页未读,是否继续阅读?

产品配置单


中国格哈特为您提供《虹鳟鱼肉、排泄物中总脂肪、蛋白质检测方案(抽提萃取)》,该方案主要用于渔业中营养成分检测,参考标准--,《虹鳟鱼肉、排泄物中总脂肪、蛋白质检测方案(抽提萃取)》用到的仪器有格哈特全自动超级总脂肪测定系统HT6+SOX416、格哈特维克松废气实验室废物处理系统涤气VS、格哈特凯氏消化系统KT8S、格哈特带自动进样器凯氏定氮仪VAP500C、德国移液器MM


相关方案
更多
该厂商其他方案
更多