


非洲鲶鱼对黑水虻粉和黄粉虫粉的生理反应Physiological Response of Grower African Catfish to Dietary Black Soldier Fly and Mealworm Meal
方案详情

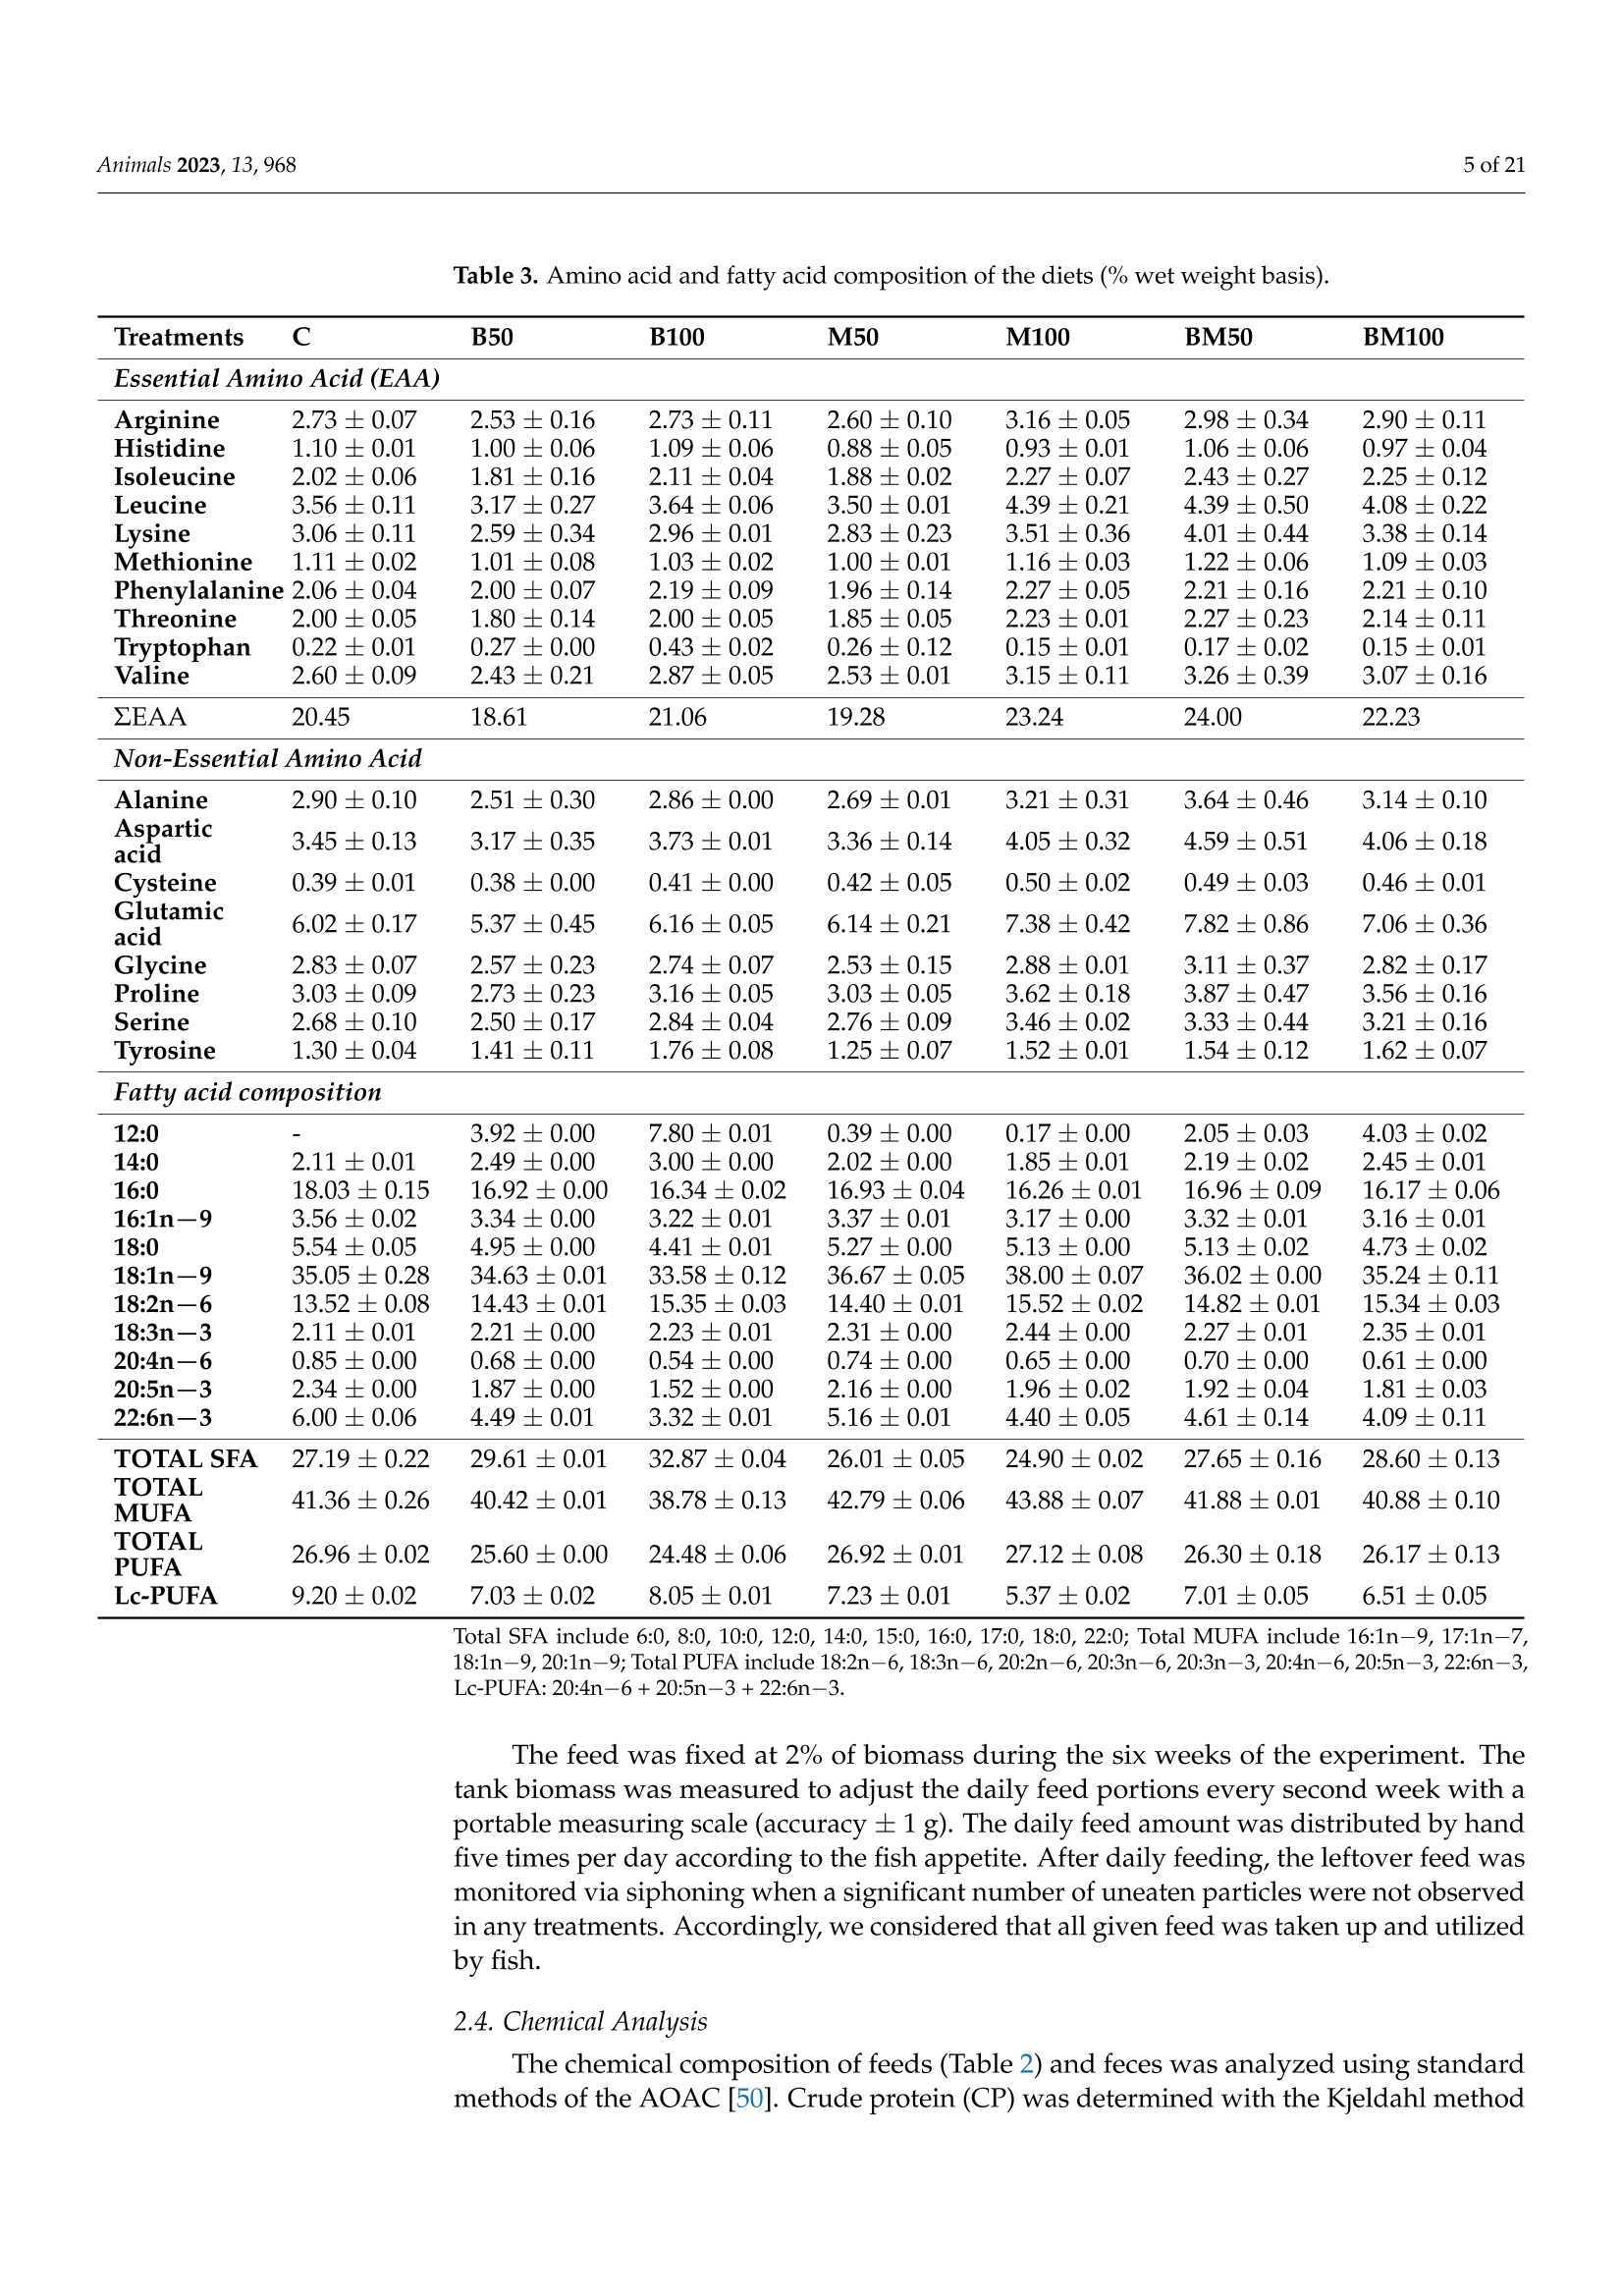
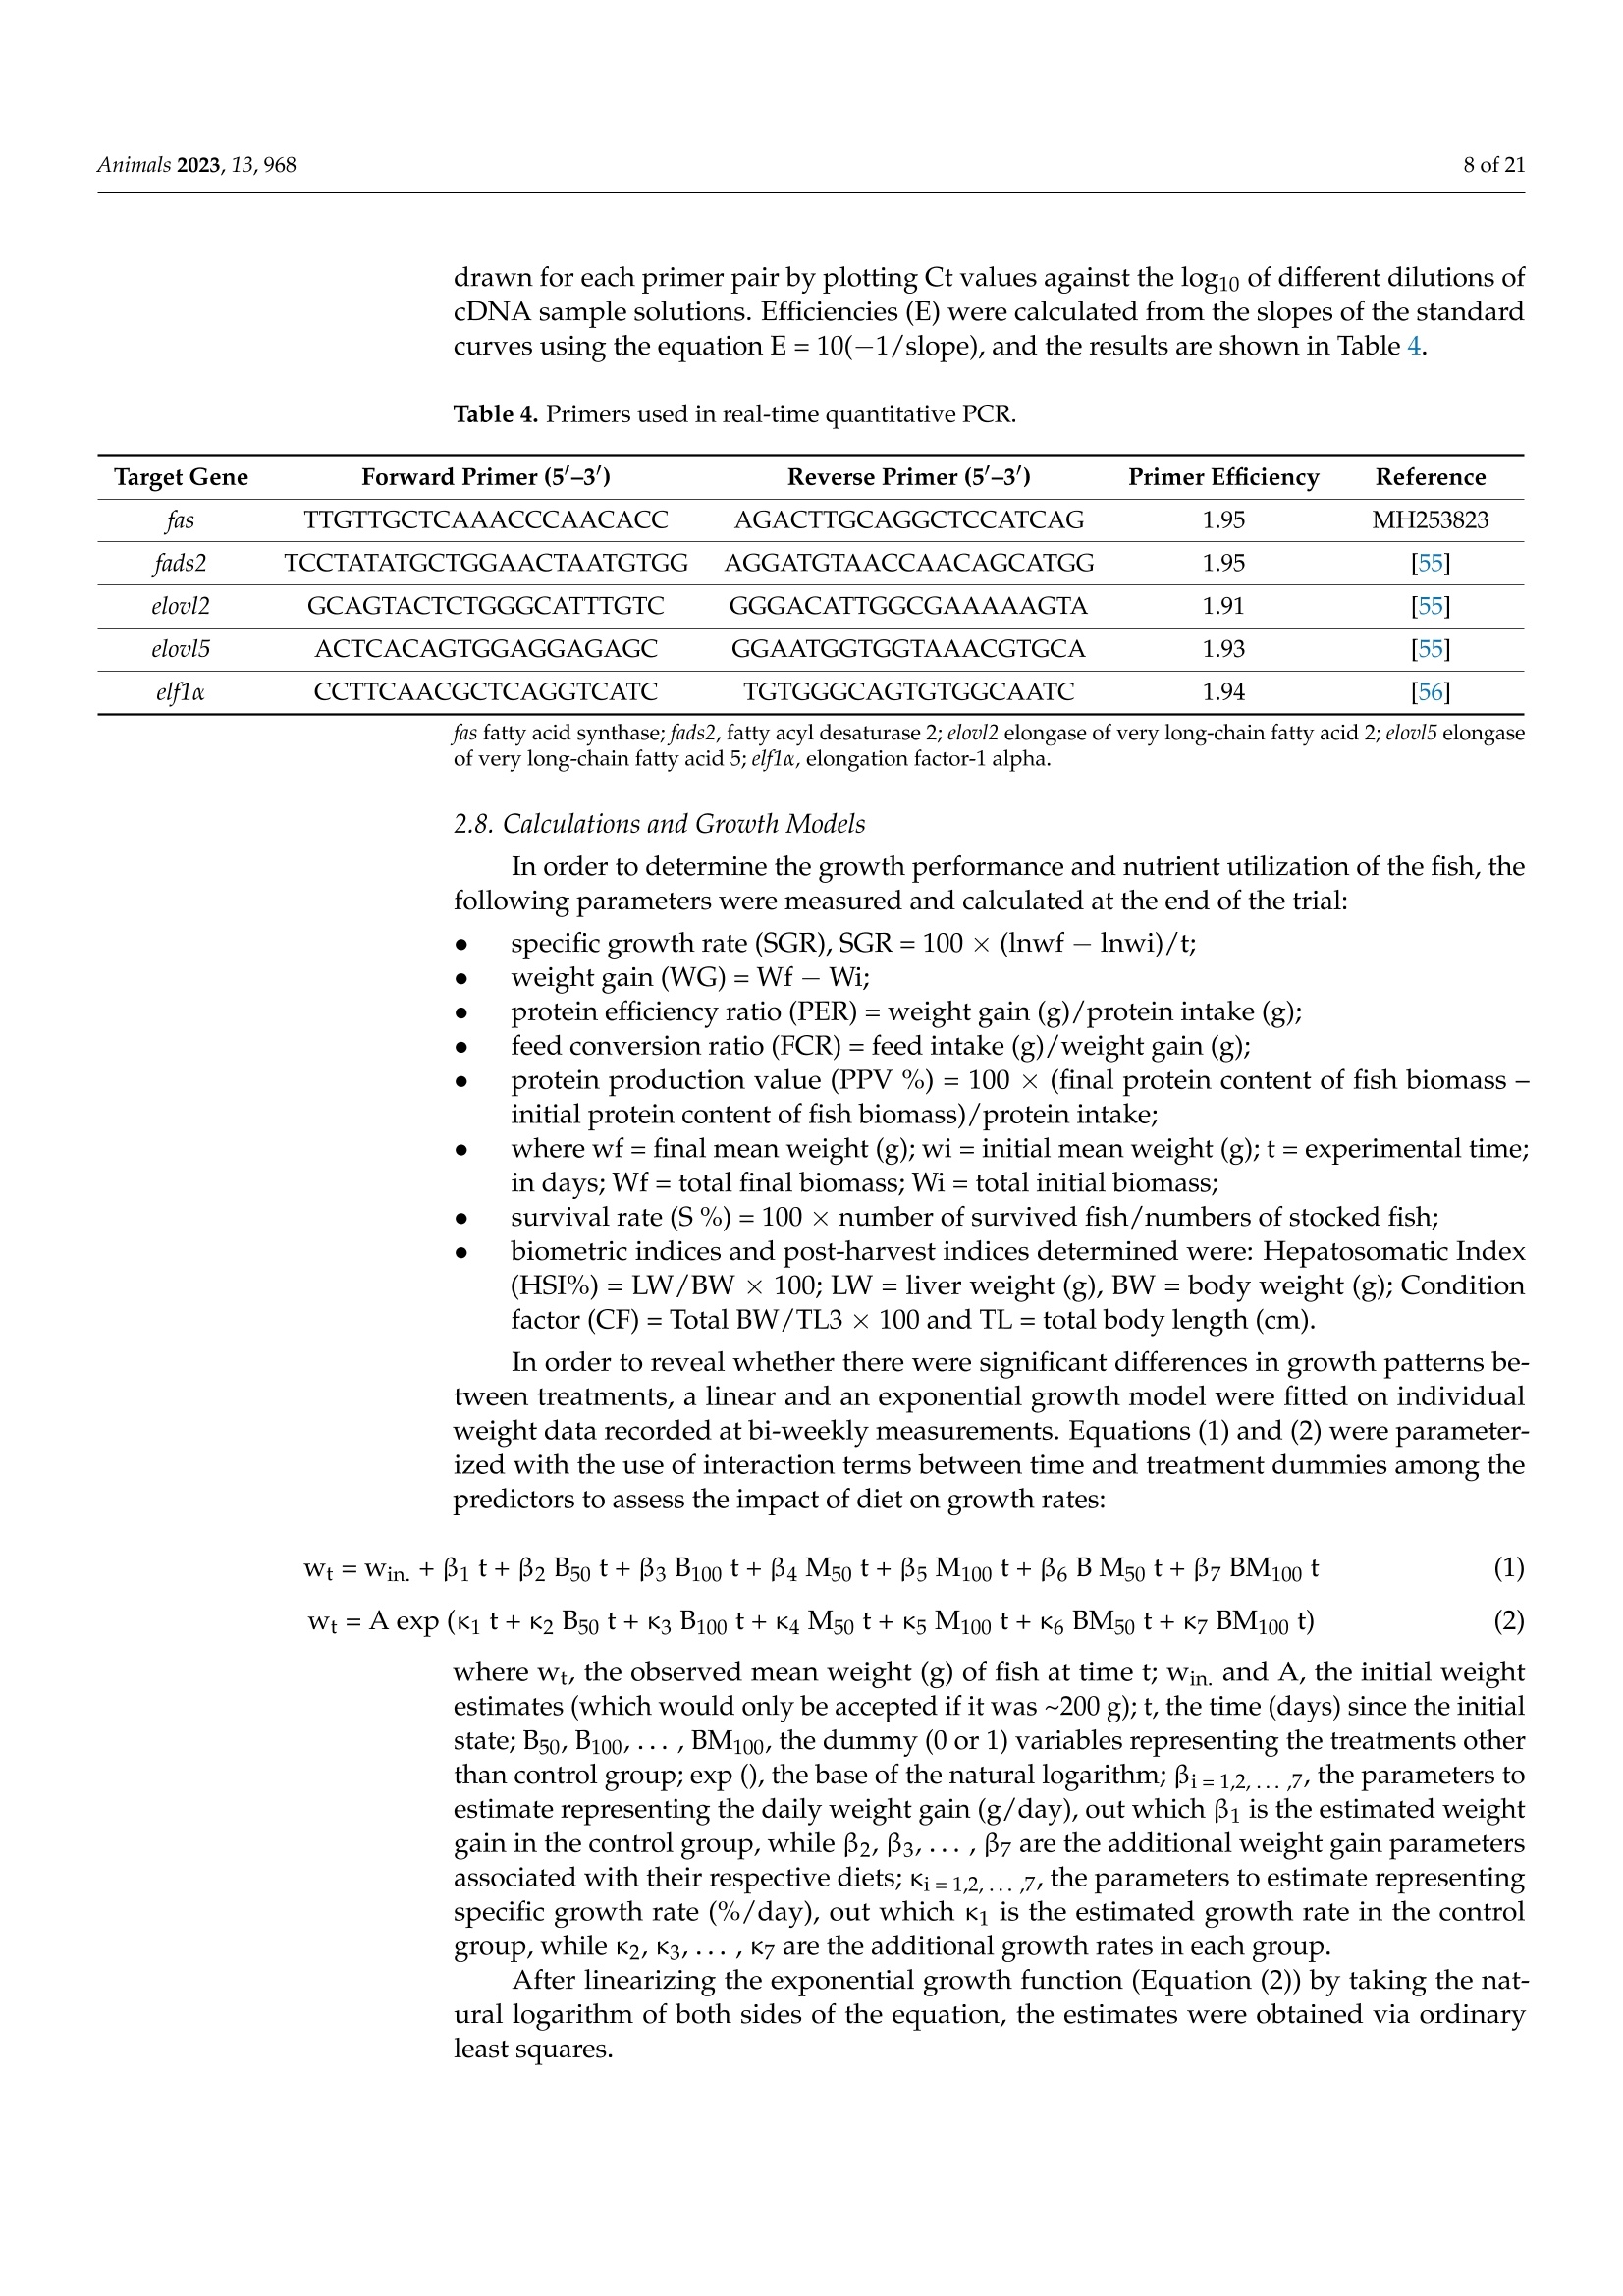
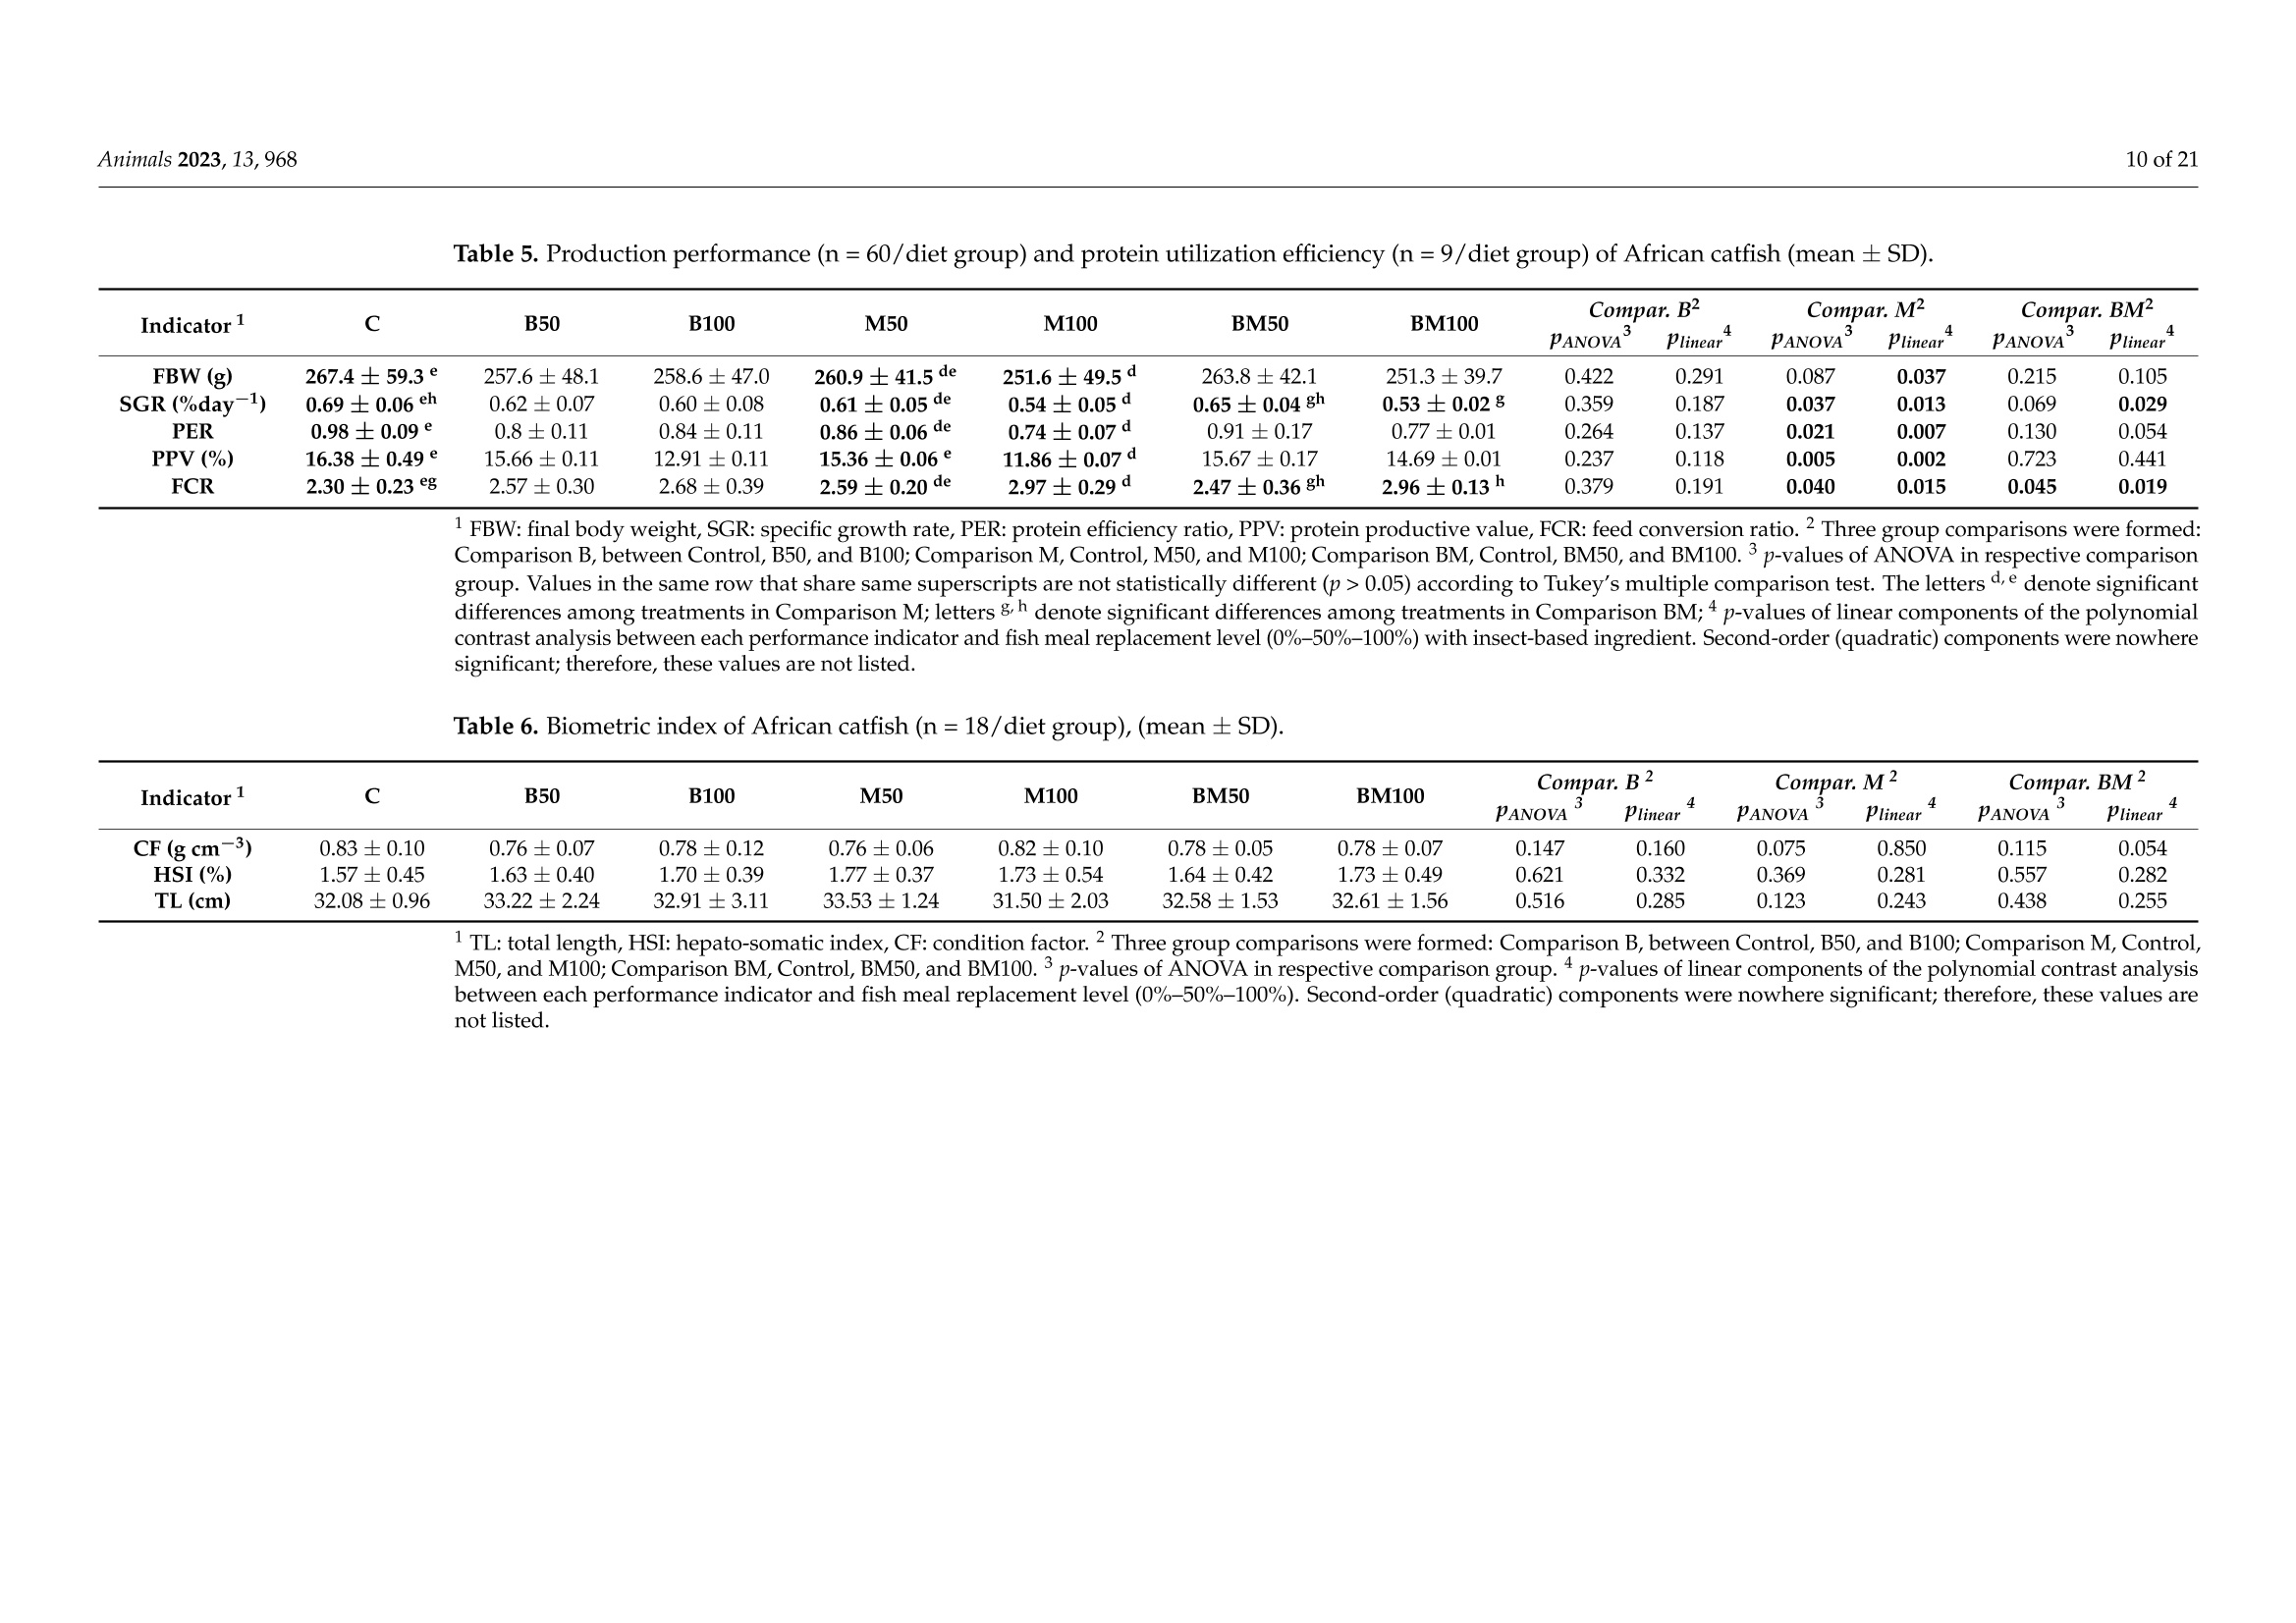
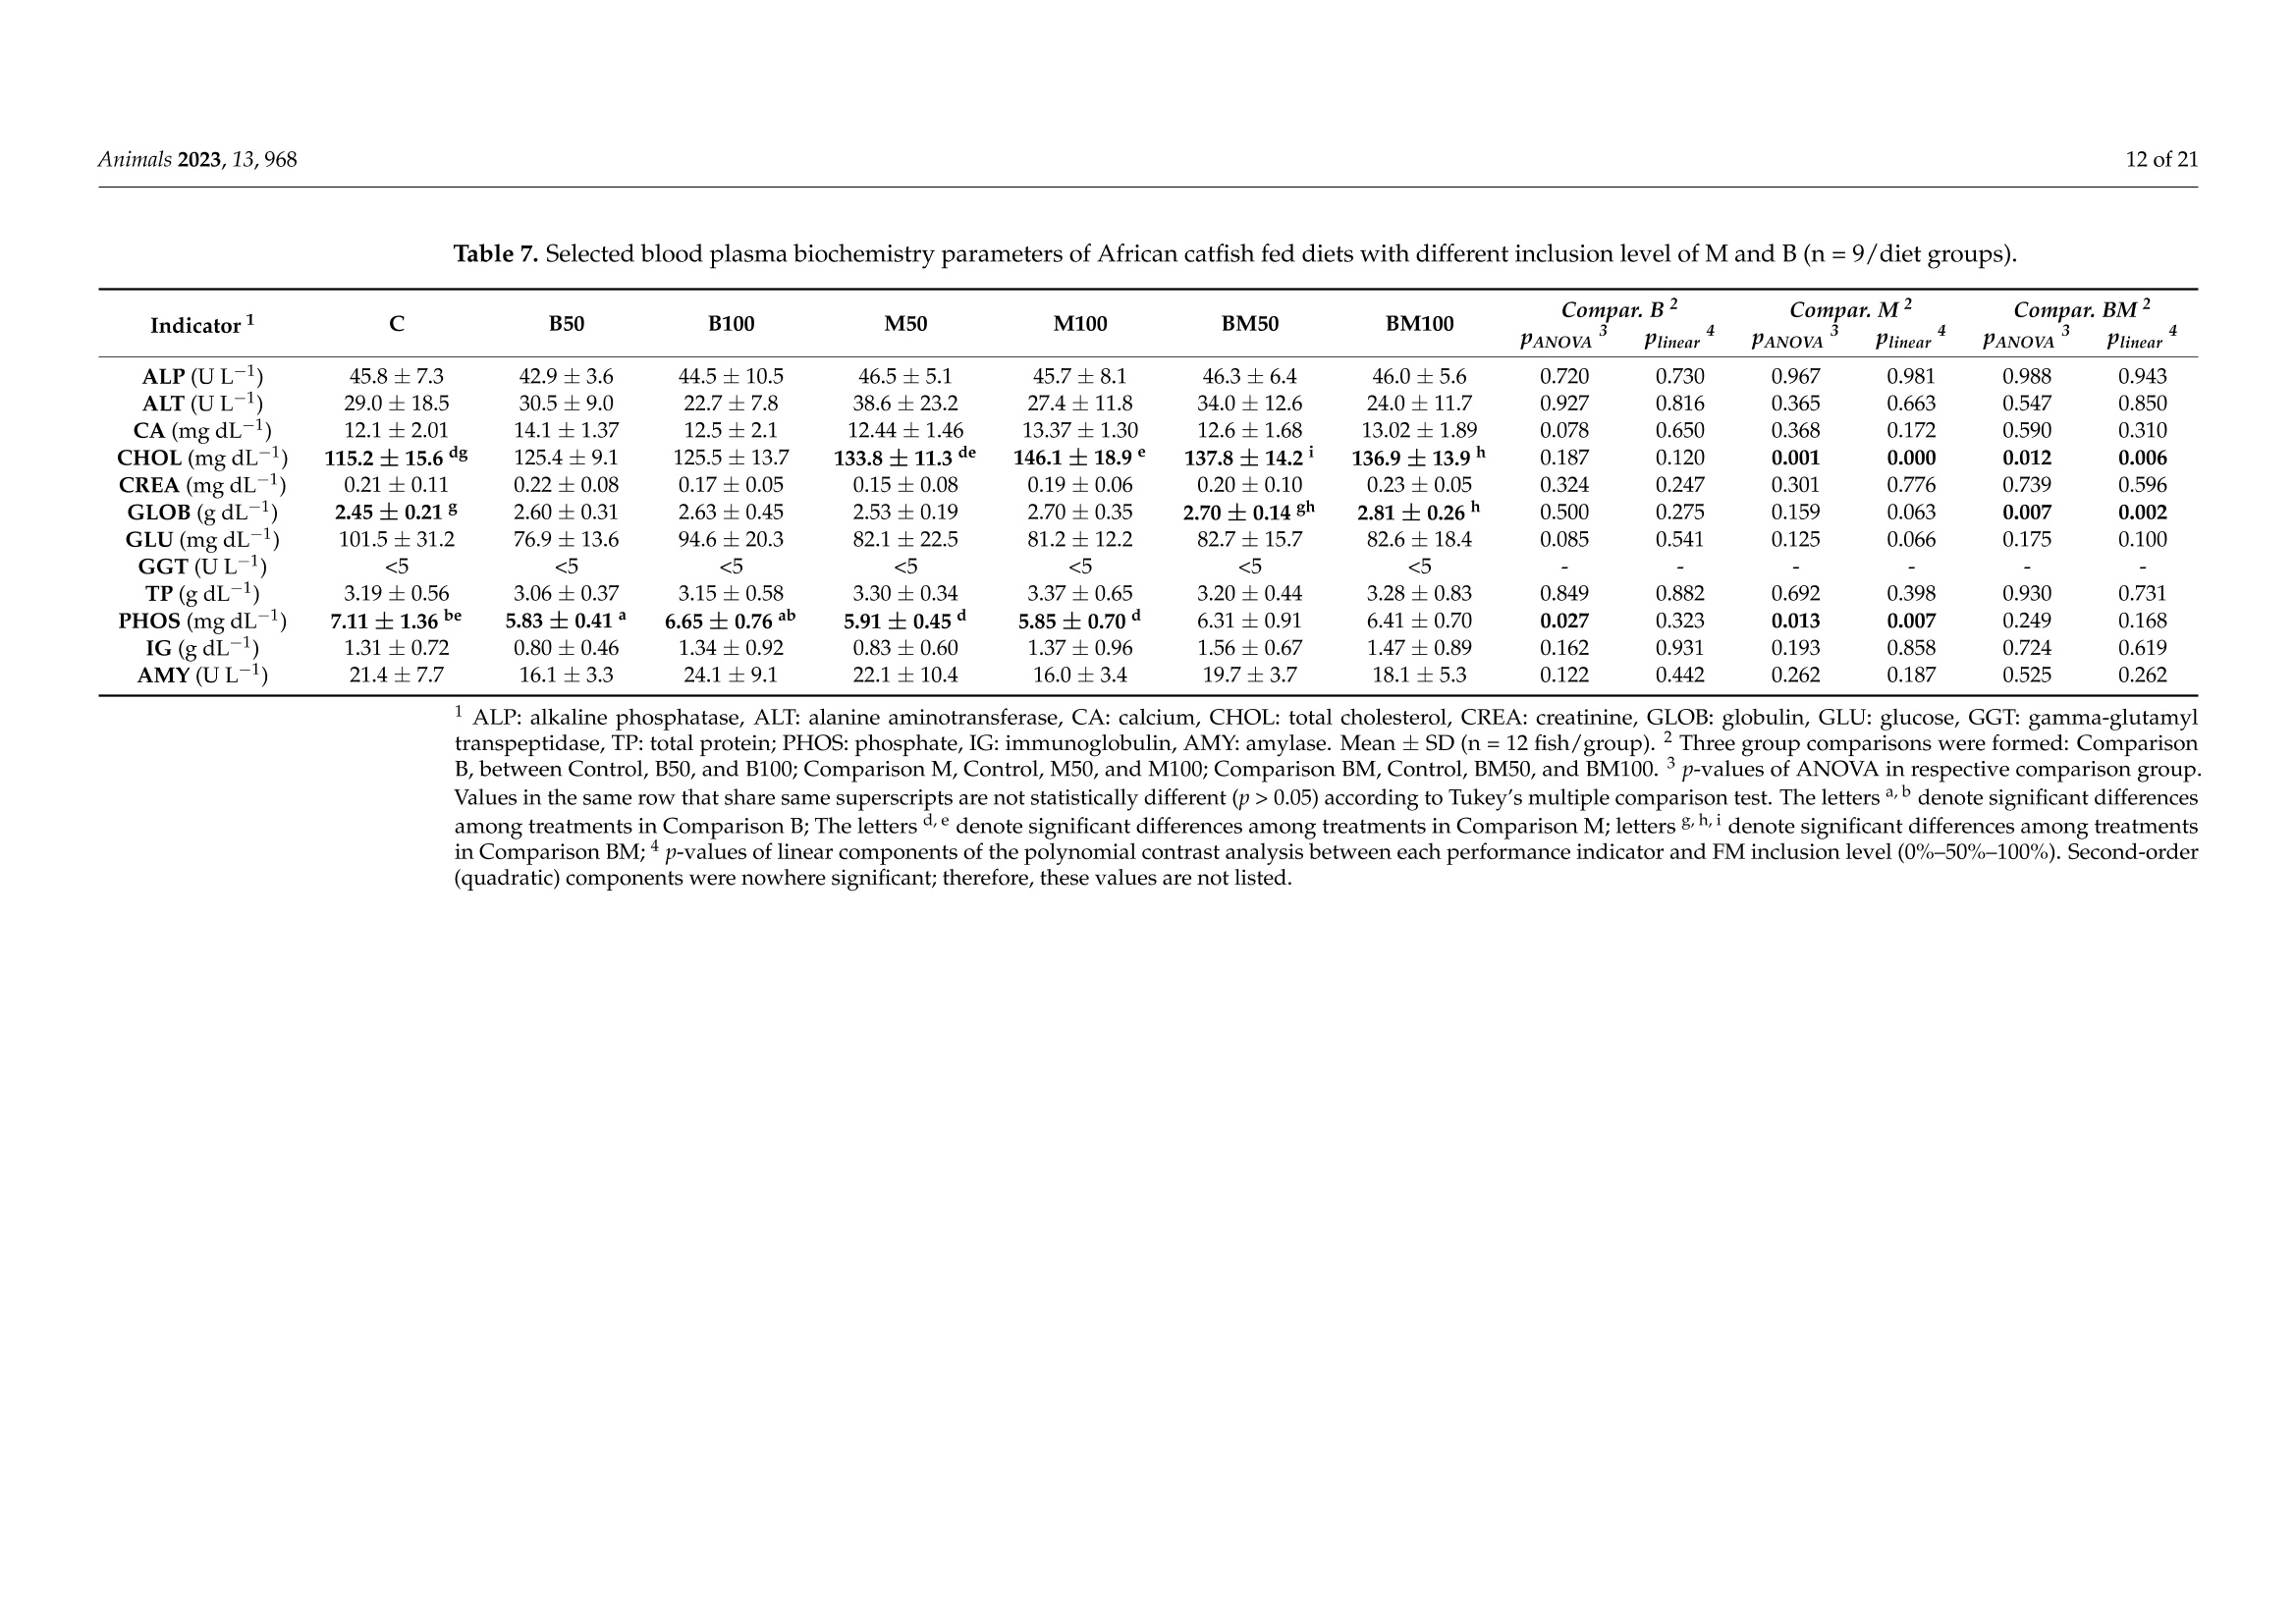
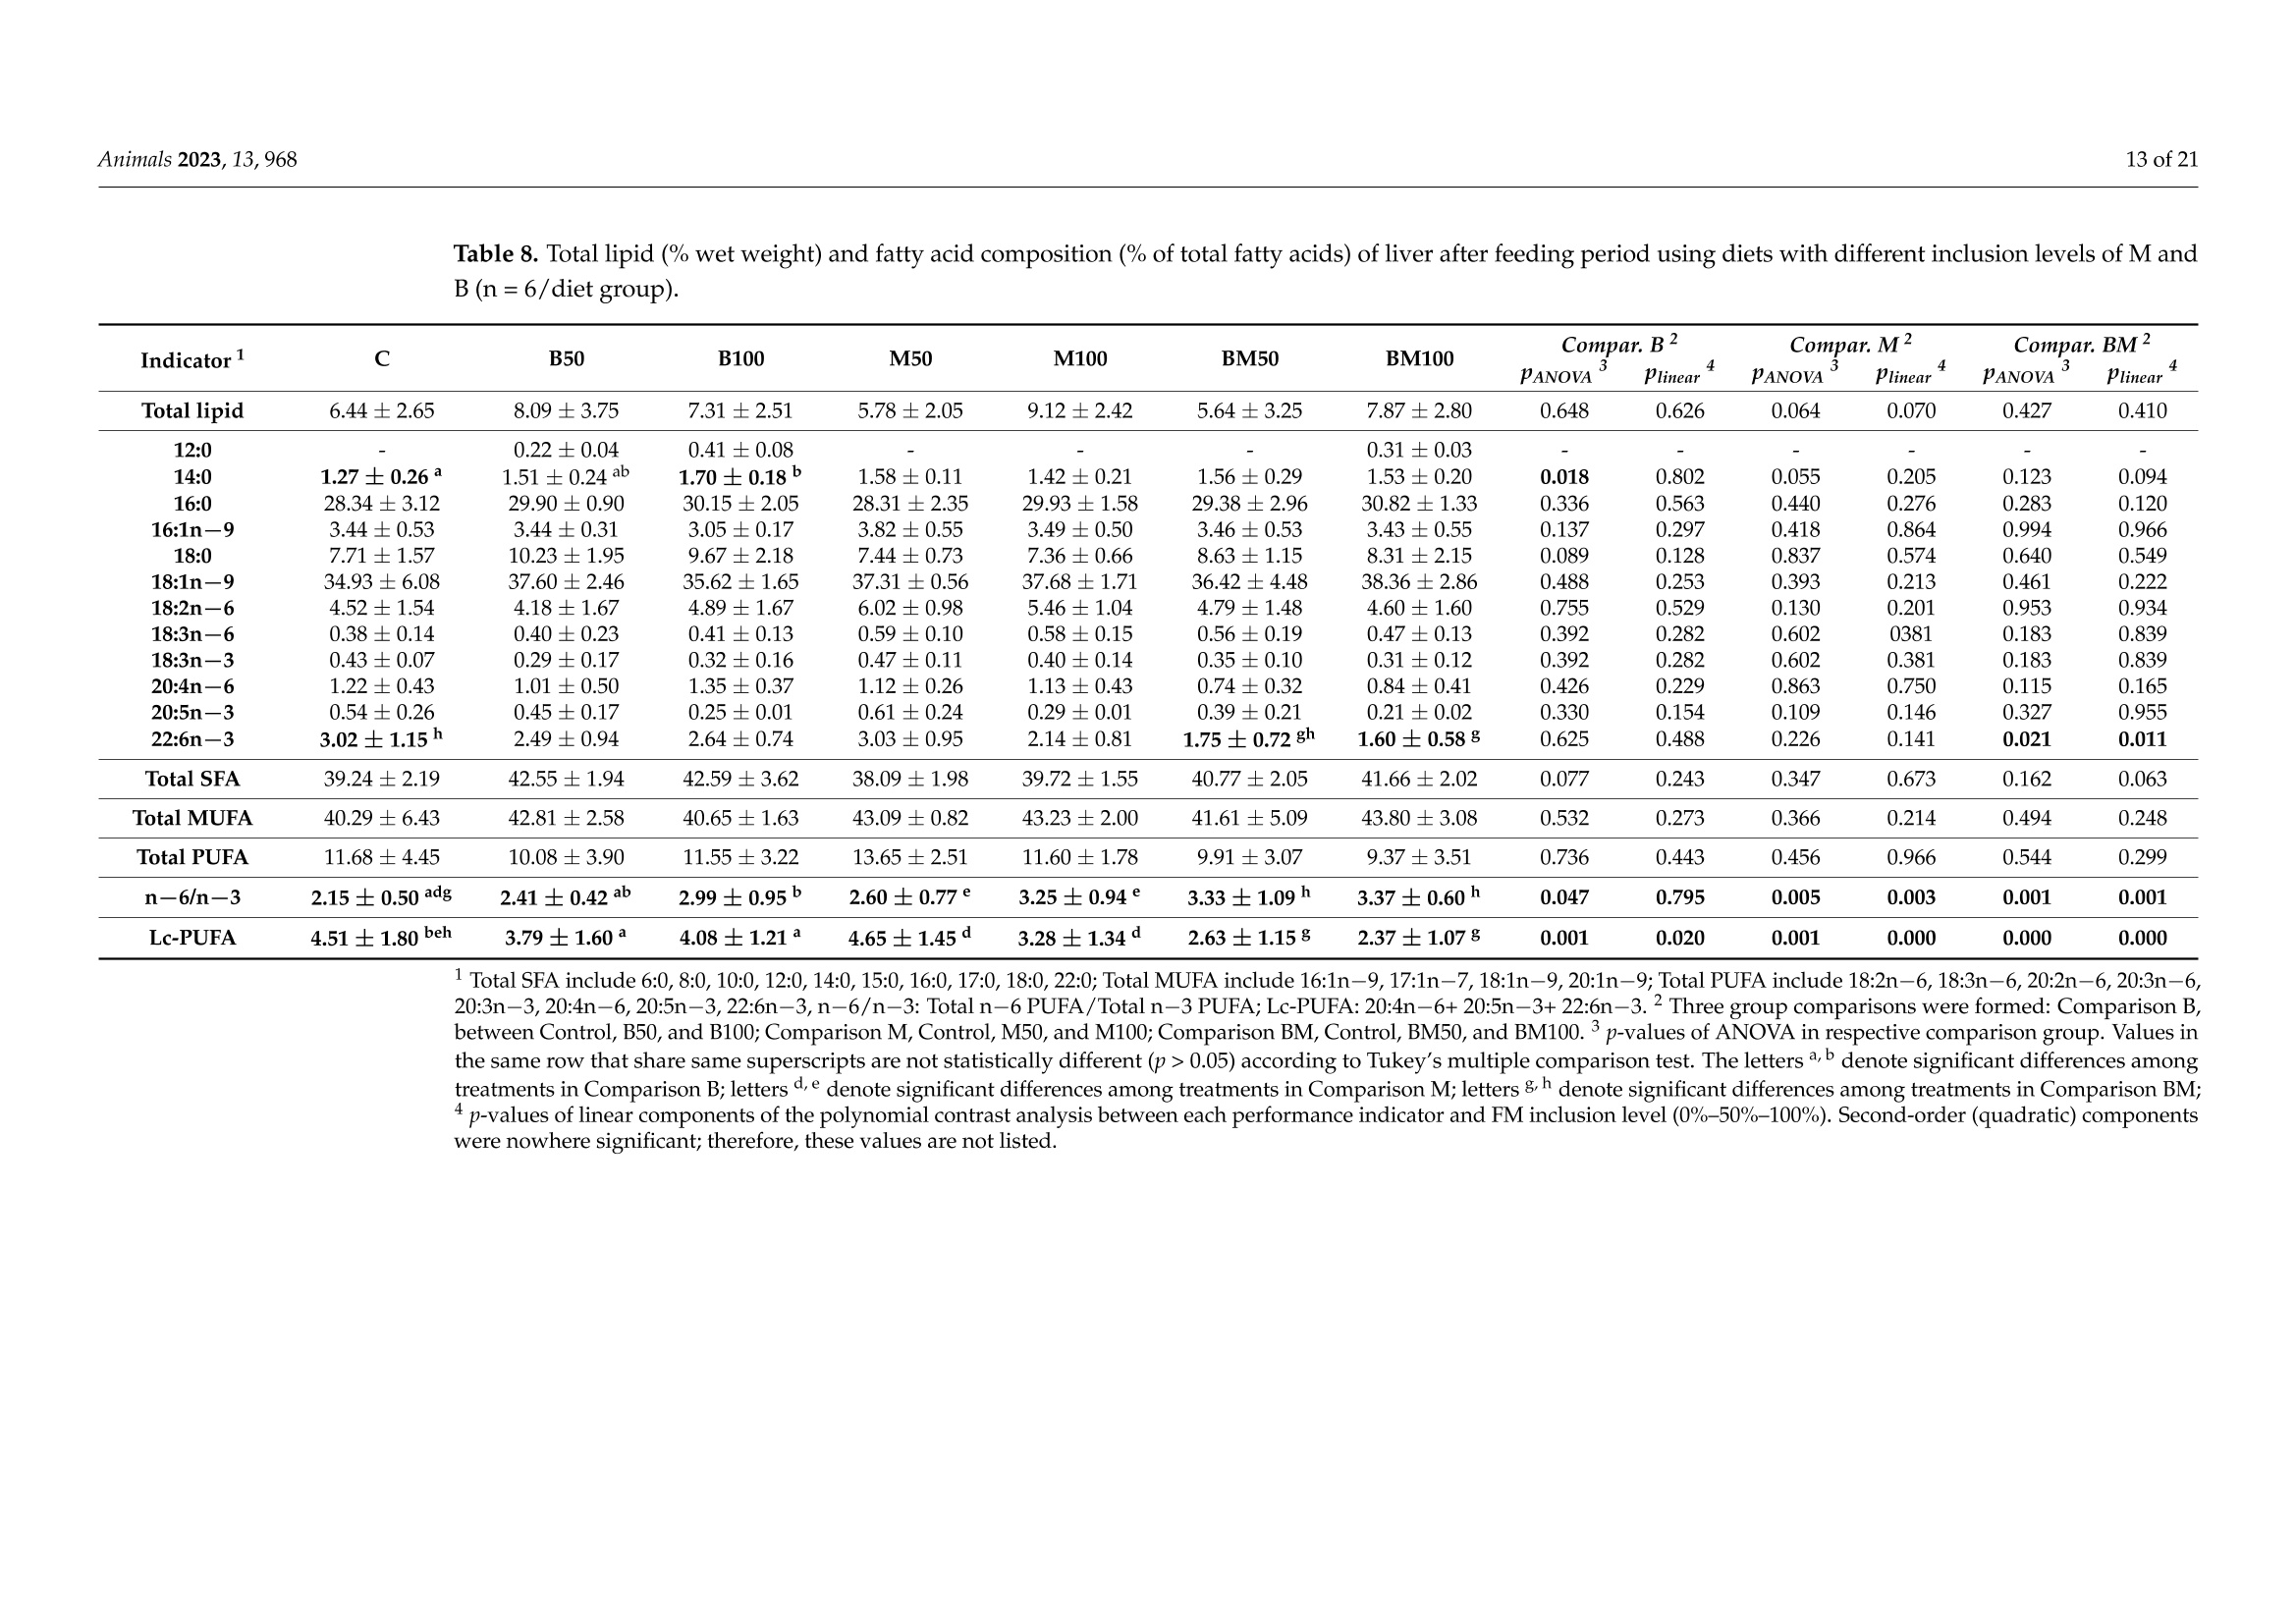
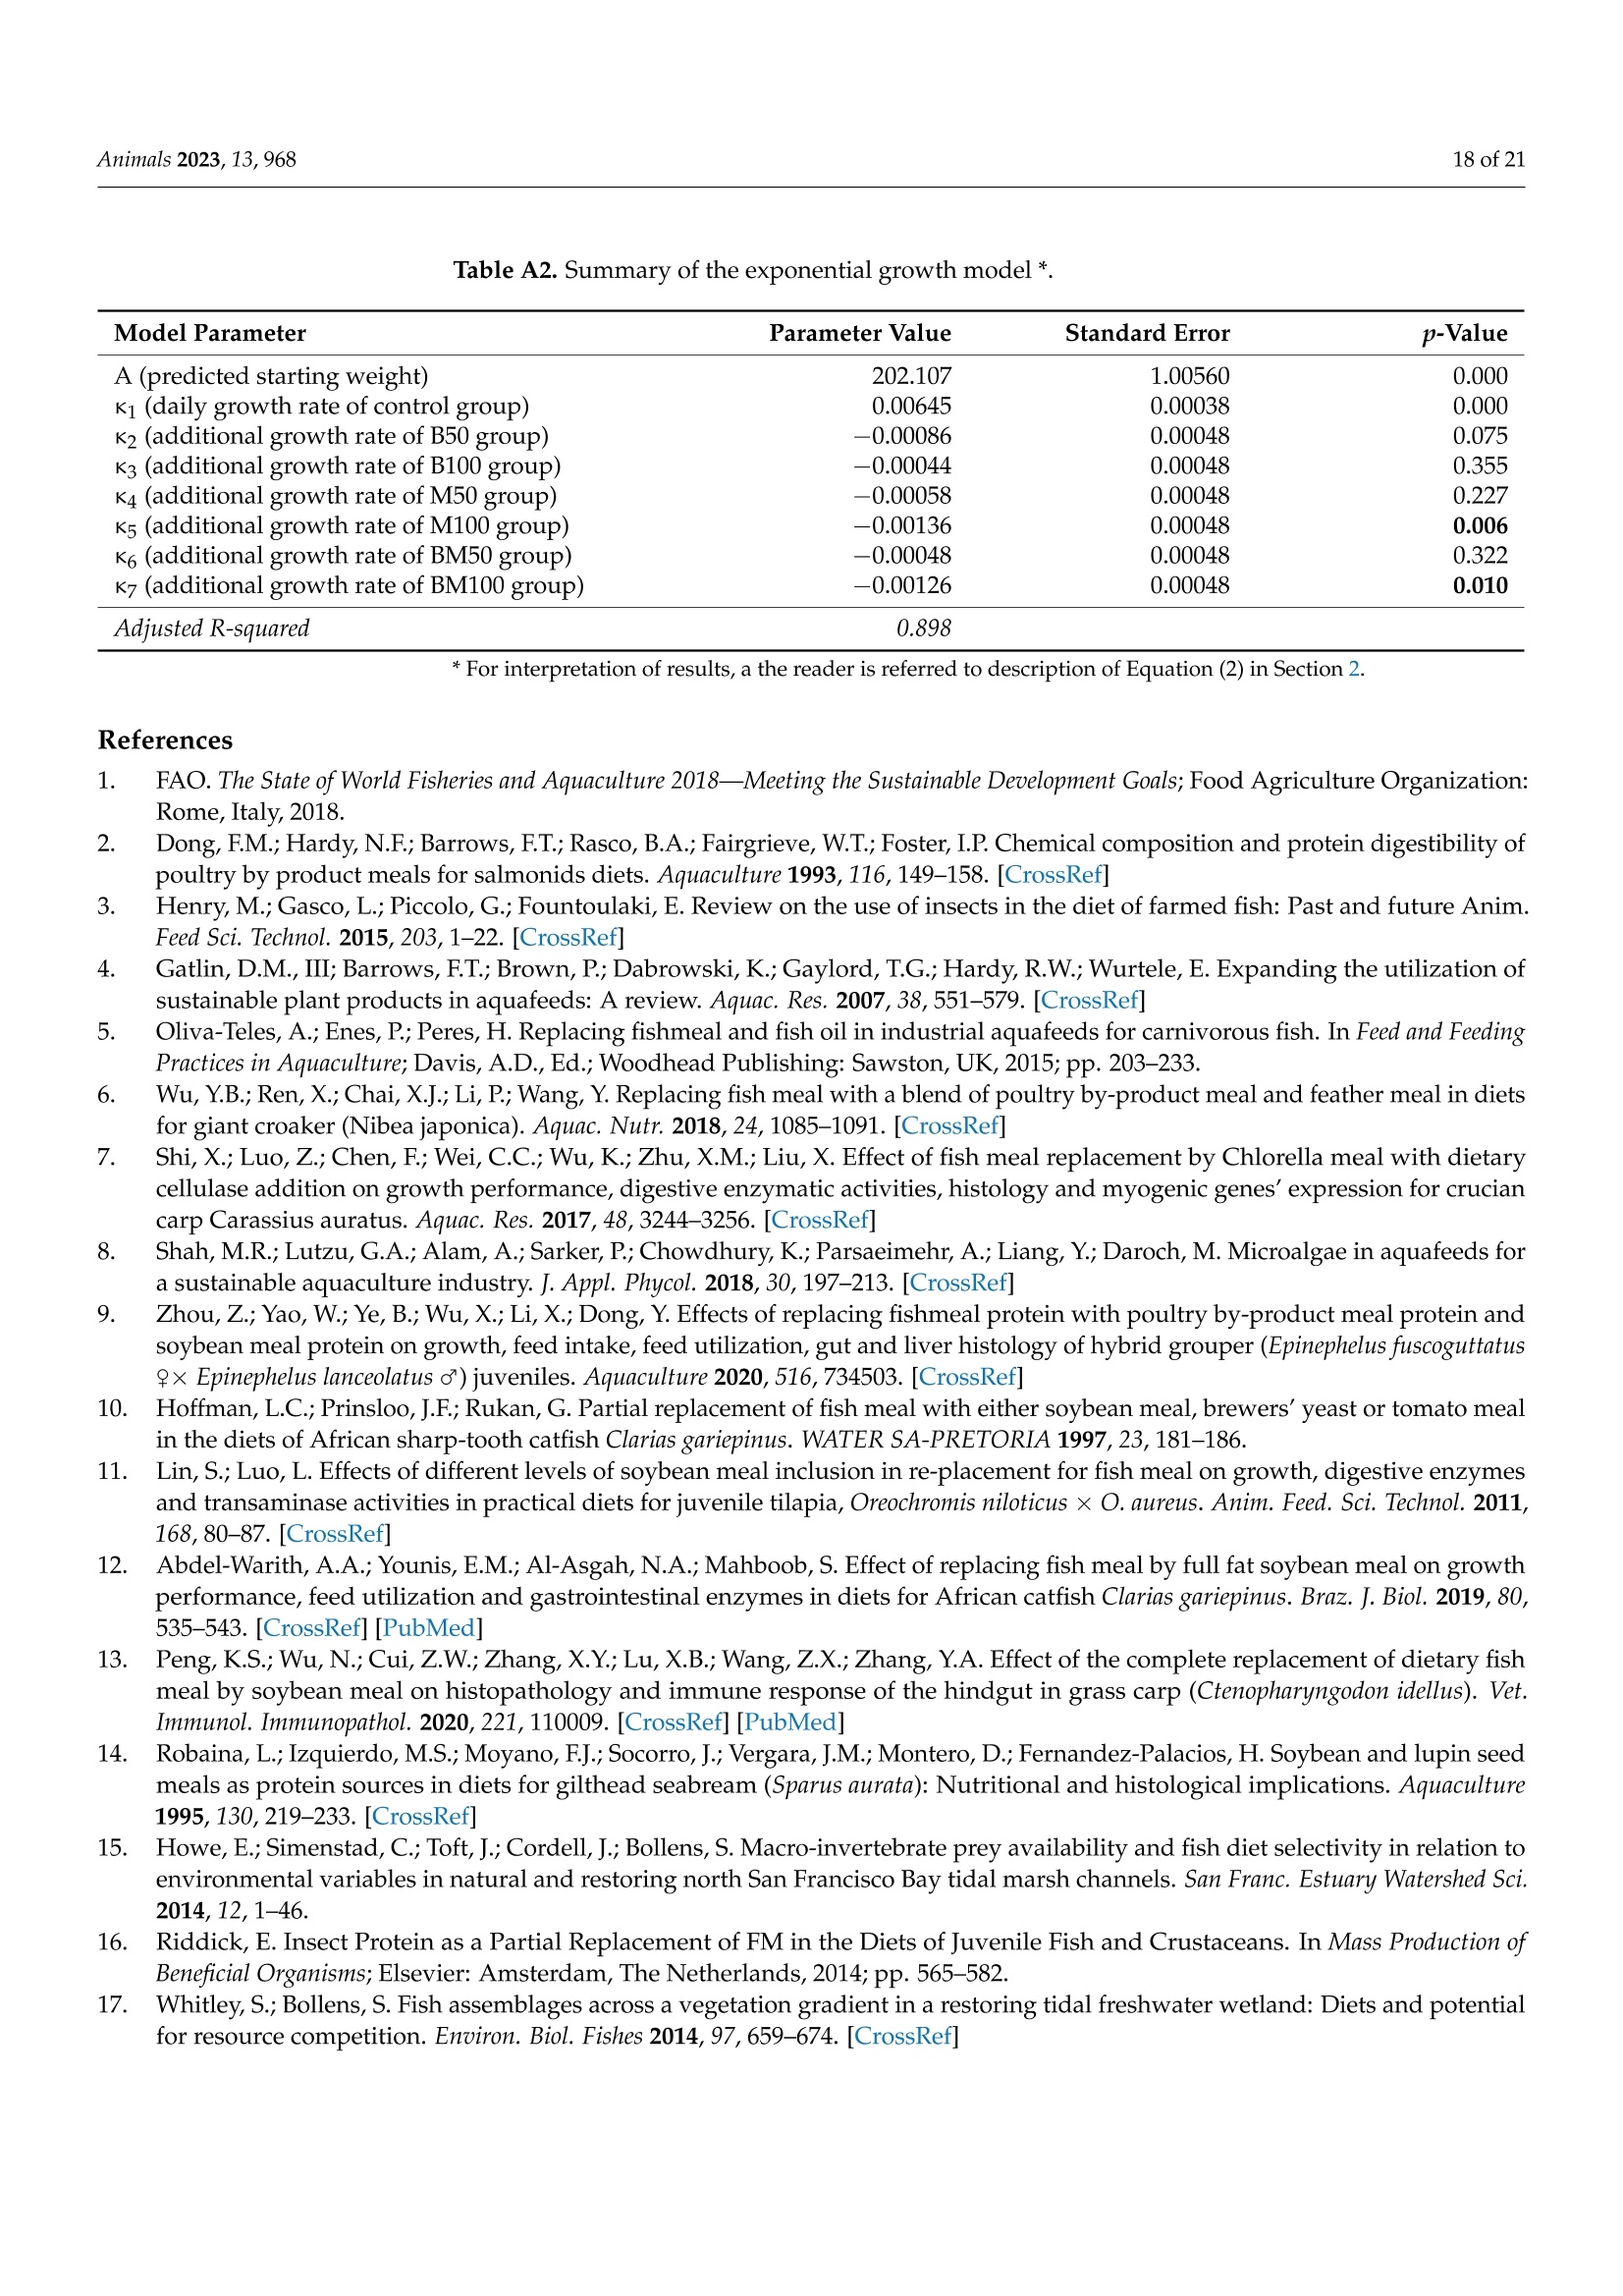
非洲鲶鱼对黑水虻粉和黄粉虫粉的生理反应Physiological Response of Grower African Catfish to Dietary Black Soldier Fly and Mealworm Mealanimals 2 of 21Animals 2023, 13,968 Academic Editor: Alessia Giannetto Received: 20 J anuary 2023 Revised: 1 March 2023 Accepted: 3 March 2023 Published:7March 2023 Copyright: @ 2023 by the authors.L i censee MDPI, Basel, Switzerland.This article is an open access article distr i buted under the terms and conditions of the Creative Commons Attribution (CC BY ) l icense (https://creativecommons.org/licenses/by/4.0/) Askale Gebremichael 1, Balázs Kucska 2*, Lászl6 Ard63, J anka Biro 3D, Mária Berki 4, Eva Lengyel-Konya “D Rita Tomoskozi-Farkas 4D, Robert Egessa D, Tamás Muller 5, Gergo Gyalog 3Dand Zsuzsanna J. Sandor 3.*D Department of Applied Fish Biology, Hungarian University of Agricultural and Life Sciences Kaposvar Campus, Guba S. u. 40, 7400 Kaposvár, Hungary 2 Department of Freshwater Fish Ecology Hungarian University of Agricultural and Life Sciences Kaposvár Campus, Guba S. u. 40, 7400 Kaposvar, Hungary 3 Research Centre of Aquaculture and Fisheries, Hungarian University of Agricultural and Life Sciences, Anna liget . u . 35, 5540 Szarvas, Hungary 4 Food Science Research Group, Institute of Food Science and Technology, Hungarian University of Agriculture and Life Sciences, Vi l lanyi ut 29-43, 1118 Budapest,Hungary 5 Department of Freshwater F i sh Ecology, Hungarian University of Agricultural and Life Sciences, Szent Istvan Campus, Pater K. u . 1, 2100 Godoll6, Hungary Correspondence: kucska.balazs@uni-mate.hu (B.K.); jakabne.sandor.zsuzsanna@uni-mate.hu (Z.J.S.) Simple Summary: Sustainabil i ty and profitability of African catfish farming depends on a sustainable and cost-effective supply of f eed. Fish meal is still used as the main dietary protein source in the practical diet of fish. However, the supply shortage and high cost are the limiting factors. Insects may represent a promising candidate for f i sh feeding due to their low footprint production and nutritionally relevant properties. This study revealed that replacement of f ish meal with black soldier fly did not negatively affect the production performance and metabolic response of African catfish growers. On the other hand, replacement with yellow mealworm may lead to the fish's growth reduction and health problems. Abstract: A six-week experiment was carried out to test the effects of total (100%) and partial (50%)replacement of fish meal in the diet of African catfish growers wi t h black soldier fly (B) meal , yellow mealworm (M) meal, and a 1:1 combination of both (BM) on the produc t ion and health of fish. A total of 420 fish with an average initial body weight of 200 ±0.5 g were randomly distributed in triplicate to seven diet groups (C, B50, B100, M50,M100, BM50, and BM100, respectively). The growth performance and feed utilization of f ish fed with partia l or tota l replacement levels of FM with B were not significantly affec t ed (p>0.05) during the 6 weeks of f eeding. In contrast, significant differences were observed between t he groups fed with a diet where FM was totally replaced with M meal and the control i n terms of final body weight , specific growth rate, feed conversion ratio, protein efficiency ratio, and protein produc t ive value. Among the blood plasma biochemistry parameters,total cholesterol exhibited a significant difference (p=0.007) between the M treatments and t he control diet . The fatty acid profile of t he liver was changed with r espect to the l ong-chain polyunsaturated fatty acid content in all experimental groups. Parallel with this, t he upregulation of elovl5 and fas genes in l iver was found in all experimental groups compared to the control. Overall, this study shows that fish meal cannot be subs t ituted with yellow mealworm meal in the practical diet of African catfish without compromising the growth, health and feed utilization parameters. Keywords: sustainable protein; insect meal; fatty acids; feeding; catf i sh 1. Introduction Fish meal (FM) plays a priceless role in the success of the fish feed industry due to its high nutritional value. However, a supply shortage i ncreases its price and leads to high feed costs [1]. It is crucial to reduce the use of FM in fish diets by replacing it with cheap and sustainable alternative protein sources because tota l dependence can i nfluence the overall operations of fish-farming sectors and consequently reduce profitability [2,3]. As a result, a number of new ingredients, i ncluding plant ingredients [4], processed animal ingredients [5,6], and ingredients from microalgae [7,8], have been investigated over the last few years. Among the plant ingredients, soybean meal (SBM) is widely used due to its favourable amino acid profile and sustainable supply [5,9]. The SBM has been used as a replacement for FM in a number of freshwater species including the African catfish [10-13]. However, the inclusion of SBM at high levels can lead to poor growth and poor protein utilization [9,12,14]. Currently, attention is being directed to the possibility of using insect meals as FM substitutes in fish feed due to their relatively high nutritional quality, sustainability and scalability, less need for arable land, privileged legal backgrounds,acceptability by many f ish species, and low environmental effects [15-20]. In addition, the use of insects for feeding fish represents a promising alternative because of high protein content, a balanced amino acid profile and high nutrient digestibility [21,22]. The average crude protein content of several insects varies between 50 and 80% (dry matter basis),which is almost simi l ar to the crude protein content of the fish meal [21], which can meet the nutrient requirement of wide varieties of fish species [23]. Insects also contain some vitamins, minerals, and bioactive substances in addition to the protein and lipid components [24,25]. However, the low content of long-chain polyunsaturated fatty acids (LC-PUFA), es-pecially eicosapentaenoic (EPA; 20:5n-3) and docosahexaenoic (DHA; 22:6n-3) acids,is one of the main nutritional limitations of including insects, especially in the diets of marine fish [26]. This is because marine fish cannot synthesize EPA and DHA from the precursor alpha-linolenic acid (18:3n -3) in their diets. While freshwater fish are capable of synthesizing EPA and DHA from dietary alpha-linolenic acid, dietary EPA and DHA are more efficiently deposited in fish meat and oil [26,27]. Fish meal i s t he main dietary source of n -3 LC-PUFA; thus, high FM replacement levels with insect meal should not compromise the recommended dietary levels of n-3 LC-PUFA for a given species [28,29].In addition, insect meals have a l imited phosphorus content when compared to FM and SBM and this low phosphorus content may affect lipid metabolism as well as the growth performance of fish [26]. However, the possibility of modifying the nutrient composition of insect meals by altering the substrate composition offers a great advantage to overcome the lack of LC-PUFA and other ingredients in i nsect meals [30,31]. Many insects have been studied in the African catfish (Clarias gariepinus) feed, for instance, black soldier fly (Hermetia illucens) [32-34], mealworm ((Tenebrio molitor) [35],common house f ly maggot (Musca domestica) [36], crickets (Gryllus bimaculatus) [37,38],butterfly (Cirina butyrospermi) caterpillars [39,40], and grasshoppers (Caelifera) [41]. Due to the i nsect species-specific differences, the optimal dietary replacement levels of FM with insect meals vary significantly between these studies, ranging from 10% to 100% (37.5 to 760 g kg-) with varying degrees of success [32-41]. The success of the replacement usually depends on the digestibility of feed ingredients. Appreciable high apparent digestibility coefficients on dry matter (72-87%) and crude protein (82-94) were demonstrated for defatted-B-meal-containing diets in the case of several aquaculture species [42-44],and a similarly high value was reported for partially defatted M meal in rainbow trout [45].The differences in digestibility of the insects might be related to the chitin content of the insect's meal , and the developmental stage of t he harvested i nsects [46], as well as to the drying process of the ingredient (spray vs. oven dry) [42]. Dietary chitin may impair the digestibility of other nutrients when i t is greater or equal to 10%[47]. According to these advantages and limitations, it is apparent t hat insect’s meal could play a role in the future diets of African catfish. The above-highlighted studies were so far carried out on small-sized (2.4 to 10 g initial weight) African catfish, and there are scarce studies on bigger-sized fish (≥200g).Additionally, the evaluation of black soldier fly meal and mealworm meal inclusion at the same time has not been studied for this f ish species. Previously, the positive effect of the si-mul t aneous i nclusion of three i nsec t oils (black soldier f ly, mealworm, and si l kworm pupae)was reported on growth performance, lipid metabolism and the i nflammatory response of juvenile mirror carp by Xu et al.[48]. Thus, the objective of this study was to investigate the effects of black soldier fly and mealworm meals on the production performance, feed utilization, lipid metabolism, and immune system of African catfish growers. 2. Materials and Methods 2.1. Experimental Design and Rearing Conditions A six-week experiment was carried out at the Hungarian University of Agriculture and Life Sciences, Kaposvári Campus, at the Department of Aquaculture, using a recirculation aquaculture system (RAS). A complete randomized design (CRD) was used to set up the experiment. A total of 420 African catfish individuals with an average initial weight of 200±0.51 g were randomly distributed in 21 tanks in t riplicate (20 fish per tank) and acclimatized for one week. Water parameters (temperature, NH4+,NO3-,NO2, dissolved oxygen, and pH) were checked regularly during the trial , and the average values were as follows: temperature: 24.5±0.2 ℃; dissolved oxygen: 4.2 ±0.5 mg L-1 measured daily;NH4+: 0.50 ±0.02 mg L -1, NO3-:28.5±0.19 mg L-1,NO2-:0.16 ±0.02 mg L -, and pH:7.1±0.2 measured on a two-weekly basis. 2.2. Ethical Issues All procedures involving fish were conducted in line with the Hungarian l egislation on experimental animals and approved by the Nationa l Scientific Ethica l Committee on Animal Experimentation (identification number of the l icense: KA-3403). Al l efforts were made to minimize the fish’s suffering. For t hat reason, the f ish were anesthetized before being sacrificed using Norcaicum-based anesthetics (50 mL 100 L-1). 2.3. Feed Preparations and Feeding Seven experimental diets were formulated as follows: The control (C) diet contained 200 g kg- of f ish meal (FM); in the experimental diets (B50, B100, M50, M100, BM50,BM100), FM was replaced partially (50%) and totally (100%) with different insect meals (Figure 1). In diet M50, 100 g of FM was replaced with mealworm meal (M); in diet M100,200 g of FM was replaced with M; in diet B50, 100 g of FM was replaced with black soldier f l y meal (B); in diet B100, 200 g of FM was replaced with B; in diet BM50, 100 g of FM was replaced with a 1:1 combination of M and B; and in diet BM100, 200 g of FM was replaced with a 1:1 combination of M and B. The chemical composition of insects used in feeds is similar to data presented by Sandor et al. [49]. The experimental diets were set to be iso-nitrogenous and iso-energetic (Table 1). The feed ingredients were thoroughly mixed to form a homogenous blend, moistened with water (200 mL kg-), and then extruded using a single screw extruder (Abrazive, Hungary) to produce 6 mm sinking pellets, which were dried in an oven at 55°C (Pol-Eko, Wodzislaw Slaski , Poland). Crude protein varied between 42.9 and 46.5% on a wet weight basis in the test and control diets (Table 2). Crude lipid and caloric contents were in the range of 8.0-9.3%,and 19.1-20.0 KJg~,respectively. Table 3 shows the main fatty acid and amino acid compositions of the experimental feeds. We hypothesized that with FM replacement, a considerable decrease in the EAA would be inevitable. Therefore, to prevent the EAA deficiency, some supplementation with premix containing lysine and methionine was used in the feed,according to the formulation. Based on the measurements, the sum of essential amino acids (ZEAA) varied between 18.61 and 24.0%. The levels of the main l imiting essential amino acids, lysine and methionine, were adequate for catfish [23], ranging from 2.59 to 4.01%and 1.00 to 1.22%, respectively. The M100, BM50, and BM100 groups had a higher lysine content compared to others, while an increase i n tryptophan content was observed with B-meal inclusion (B50 and B100 groups). In terms of the fatty acid composition, an increase in lauric acid (12:0) levels was observed when FM was replaced with B-meal. Similarly, a decrease in stearic acid (16:0) level with the addition of insect meals was detected. The B100 diet presented the highest level of total saturated f atty acids (due to the highest levels of 12:0 and 14:0, respectively). M100 diets contained the highest levels of MUFA (due to the highest levels of 18:1n-9). With regard to Lc-PUFA levels, the control diet presented the highest total l evel (9.20%) with 2.34% EPA, 6.00% DHA, and 0.85% ARA content, while the test diets showed lower total levels of 7.03% (B50), 8.05%(B100); 7.23%(M50), 5.37%(M100),7.01%(BM50), and 6.51%(BM100), respectively. >Blood biochemistry Figure 1. Schematic diagram of the experimental setup and the measured parameters at the end of the trial. Table 1. Formulation of the diets with different inclusion level of insect meal (%). Ingredients C B50 B100 M50 M100 BM50 BM100 Fish meal (FM) 20 10 0 10 0 10 0 Mealworm (M)2 0 0 0 10 20 5 10 Black soldier fly (B)’ 0 10 20 0 0 5 10 Soy protein conc.+ 14.6 14.6 14.6 14.6 14.6 14.6 14.6 Wheat 33.5 33.2 33.0 32.7 31.8 33.0 32.4 Poultry meal’ 25 25 25 25 25 25 25 Premix 6 1.5 1.5 1.5 1.5 1.5 1.5 1.5 Rapeseed oil' 4 4.3 4.5 4.8 5.7 4.5 5.1 Calcium phosphate 1 1 1 1 1 1 1 C control , B black soldier f ly, M mealworm, BM mixture of black soldier f ly and mealworm, Premix: vi t amins,minerals, lysine, methionine. Euro-protein Ltd., Veroce, Hungary. " Berg and Schmidt Pte. Ltd., Singapore.3 Agroloop Ltd., Rotterdam, The Netherlands. 4Sojaprotein, Becej , Serbia. 5 Euro-protein Ltd., Veroce, Hungary.6 Cargill Ltd., Budapest , Hungary. Bunge Hungary Co., Mart f u, Hungar y . Table 2. Proximate composition (% wet weight basis) of the diets with different inclusion level of insec t meal (%). Treatments C B50 B100 M50 M100 BM50 BM100 Dry matter 95.78 97.22 96.58 96.37 95.73 97.10 93.74 Crude protein 44.35 45.53 44.48 45.11 46.46 45.97 42.90 Crude fat 7.95 8.45 8.85 8.29 9.03 8.50 9.31 Crude fiber 1.70 3.27 4.71 2.97 2.93 2.95 2.98 Crude ash 10.63 9.38 8.00 8.97 7.36 8.99 7.22 Gross energy (KJg) 19.05 19.94 19.96 19.72 20.02 19.87 19.56 Phosphorus 1.47 1.33 1.13 1.28 1.04 1.24 0.95 Calcium 2.10 1.79 1.46 1.79 1.42 1.62 1.29 Chitin 4.96 5.98 6.32 6.42 7.24 5.91 5.55 ADF 7.69 8.62 10.14 10.25 13.43 10.31 10.62 Table 3. Amino acid and fatty acid composi t ion of the diets (% wet weight basis). Treatments C B50 B100 M50 M100 BM50 BM100 Essential Amino Acid (EAA) Arginine 2.73±0.07 2.53±0.16 2.73±0.11 2.60±0.10 3.16±0.05 2.98±0.34 2.90±0.11 Histidine 1.10±0.01 1.00±0.06 1.09±0.06 0.88±0.05 0.93±0.01 1.06±0.06 0.97±0.04 Isoleucine 2.02±0.06 1.81±0.16 2.11±0.04 1.88±0.02 2.27±0.07 2.43±0.27 2.25±0.12 Leucine 3.56±0.11 3.17±0.27 3.64±0.06 3.50±0.01 4.39±0.21 4.39±0.50 4.08±0.22 Lysine 3.06±0.11 2.59±0.34 2.96±0.01 2.83±0.23 3.51±0.36 4.01±0.44 3.38±0.14 Methionine 1.11±0.02 1.01±0.08 1.03±0.02 1.00±0.01 1.16±0.03 1.22±0.06 1.09±0.03 Phenylalanine 2.06±0.04 2.00±0.07 2.19±0.09 1.96±0.14 2.27±0.05 2.21±0.16 2.21±0.10 Threonine 2.00±0.05 1.80±0.14 2.00±0.05 1.85±0.05 2.23±0.01 2.27±0.23 2.14±0.11 Tryptophan 0.22±0.01 0.27±0.00 0.43±0.02 0.26±0.12 0.15±0.01 0.17±0.02 0.15±0.01 Valine 2.60±0.09 2.43±0.21 2.87±0.05 2.53±0.01 3.15±0.11 3.26±0.39 3.07±0.16 ZEAA 20.45 18.61 21.06 19.28 23.24 24.00 22.23 Non-Essential Amino Acid Alanine 2.90±0.10 2.51±0.30 2.86±0.00 2.69±0.01 3.21±0.31 3.64±0.46 3.14±0.10 Aspartic acid 3.45±0.13 3.17±0.35 3.73±0.01 3.36±0.14 4.05±0.32 4.59±0.51 4.06±0.18 Cysteine 0.39±0.01 0.38±0.00 0.41±0.00 0.42±0.05 0.50±0.02 0.49±0.03 0.46±0.01 Glutamic acid 6.02±0.17 5.37±0.45 6.16±0.05 6.14±0.21 7.38±0.42 7.82±0.86 7.06±0.36 Glycine 2.83±0.07 2.57±0.23 2.74±0.07 2.53±0.15 2.88±0.01 3.11±0.37 2.82±0.17 Proline 3.03±0.09 2.73±0.23 3.16±0.05 3.03±0.05 3.62±0.18 3.87±0.47 3.56±0.16 Serine 2.68±0.10 2.50±0.17 2.84±0.04 2.76±0.09 3.46±0.02 3.33±0.44 3.21±0.16 Tyrosine 1.30±0.04 1.41±0.11 1.76±0.08 1.25±0.07 1.52±0.01 1.54±0.12 1.62±0.07 Fatty acid composition 12:0 一 3.92±0.00 7.80±0.01 0.39±0.00 0.17±0.00 2.05±0.03 4.03±0.02 14:0 2.11±0.01 2.49±0.00 3.00±0.00 2.02±0.00 1.85±0.01 2.19±0.02 2.45±0.01 16:0 18.03±0.15 16.92±0.00 16.34±0.02 16.93±0.04 16.26±0.01 16.96±0.09 16.17±0.06 16:1n-9 3.56±0.02 3.34±0.00 3.22±0.01 3.37±0.01 3.17±0.00 3.32±0.01 3.16±0.01 18:0 5.54±0.05 4.95±0.00 4.41±0.01 5.27±0.00 5.13±0.00 5.13±0.02 4.73±0.02 18:1n一9 35.05±0.28 34.63±0.01 33.58±0.12 36.67±0.05 38.00±0.07 36.02±0.00 35.24±0.11 18:2n一6 13.52±0.08 14.43±0.01 15.35±0.03 14.40±0.01 15.52±0.02 14.82±0.01 15.34±0.03 18:3n-3 2.11±0.01 2.21±0.00 2.23±0.01 2.31±0.00 2.44±0.00 2.27±0.01 2.35±0.01 20:4n一6 0.85±0.00 0.68±0.00 0.54±0.00 0.74±0.00 0.65±0.00 0.70±0.00 0.61±0.00 20:5n一3 2.34±0.00 1.87±0.00 1.52±0.00 2.16±0.00 1.96±0.02 1.92±0.04 1.81±0.03 22:6n一3 6.00±0.06 4.49±0.01 3.32±0.01 5.16±0.01 4.40±0.05 4.61±0.14 4.09±0.11 TOTAL SFA 27.19±0.22 29.61±0.01 32.87±0.04 26.01±0.05 24.90±0.02 27.65±0.16 28.60±0.13 TOTAL MUFA 41.36±0.26 40.42±0.01 38.78±0.13 42.79±0.06 43.88±0.07 41.88±0.01 40.88±0.10 TOTAL 26.96±0.02 25.60±0.00 24.48±0.06 26.92±0.01 27.12±0.08 26.30±0.18 26.17±0.13 PUFA Lc-PUFA 9.20±0.02 7.03±0.02 8.05±0.01 7.23±0.01 5.37±0.02 7.01±0.05 6.51±0.05 18:1n -9,20:1n -9; Total PUFA include 18:2n -6, 18:3n -6,20:2n -6,20:3n -6,20:3n -3,20:4n -6,20:5n -3,22:6n -3,Lc -PUFA: 20:4n-6+20:5n-3+ 22:6n-3. The feed was fixed at 2% of biomass during the six weeks of the experiment. The tank biomass was measured to adjust the daily feed portions every second week with a v+10)T portable measuring scale (accuracy ±1g). The daily feed amount was distributed by hand five times per day according to the fish appetite. After daily feeding, the leftover feed was monitored via siphoning when a significant number of uneaten particles were not observed in any treatments. Accordingly, we considered that all given feed was taken up and utilized by f ish. 2.4. Chemical Analysis The chemical composition of feeds (Table 2) and feces was analyzed using standard methods of the AOAC [50]. Crude protein (CP) was determined with the Kjeldahl method (AOAC 928.08) using a digestion block (KJELDATHERM, Gerhardt, Germany) via a dis-tillation procedure (VAPODEST 450, Gerhardt, Germany). Approximately 0.5 g of dry samples was digested with 10 mL of 98% HzSO4 and 10 mL of 30%H2O2; afterwards, the generated ammonium sulphate was distilled off using 2% HBO3. The CP was calculated as N x 6.25 for diets and feces. The crude fat was determined f rom 5 g of dry diet samples according to the AOAC 945.16 Soxhlet method using an automatic system (SOXTHERM Unit SOX416, Gerhardt, Germany) and diethyl ether (boiling point, 40-60°C) as a solvent.The crude ash content of the diets was estimated according to the AOAC 942.05 method.Two grams of the samples was weighed and placed i n a furnace heated to 550 C and held for 4 h. The amount of ash that remained was recorded. Crude fiber content of the diets was determined from defatted samples (AOAC 928.08). The sample amount was 1.5-2.0 g,and the digestion procedure was carried out using 0.13 MH2SO4 and 0.31 M NaOH in a GERHARDT Fibretherm FT12 apparatus (Konigswinter, Germany). The acid-dissolved fiber (ADF) was determined with the same equipment by using an ADF solution prepared from N-acetyl-trimethyl-ammonium bromide dissolved in 0.5 M HSO4 and a few drops of antifoaming agent. The chi t in content was determined as the difference between ash-free acid dissolved fiber (ADF) and protein linked to ADF (ADIP) (chitin%=ADF%-ADIP%)according to Finke [51] and Marono et al. [52]. The gross energy of the diets was determined using a Parr 6400 Automatic Isoperibol Calorimeter (Parr Instrument Co., Moline, IL , USA)calibrated with benzoic acid. The amino acid content of the diets (Table 3) was analyzed using the UPLC-DAD method (Waters Acquity UPLC H-Class, Milford, CT, USA) after acid hydrolysis and pre-column derivatization with the 6-aminoquinolyl-N-hydroxysuccinimidyl carbamate (AQC)reagent. The analysis was performed with AccQ UPLC BEH C18 (2.1×100 mm, 1.7 um)column (Waters) and AccQ Tag Ul t ra eluents A, B and water in gradien t mode, and the flow rate was 0.7 mL min-1. The chromatograms were evaluated at 260 nm, using amino acid standards. Acid hydrolysis was carried out for amino acid analysis. Twenty-five milligrams of the samples were hydrolyzed by 6 N HCl containing 1% of phenol in a Milestone Ethos One microwave digestion system. Hydrolysates were completed to 5 mL with 1 M borate buffer (pH8.51). The calcium and phosphorus content were analyzed using the ICP method. The digestion of samples was achieved with mixtures of acids, including nitric acid (R.G. 65%)and hydrogen peroxide (R.G. 30%). The extraction was realized using microwave digestion technique under high pressure and a Milestone Ethos Plus (Sorisole, Italy) microwave apparatus. The concentrations of elements were measured using Thermo Scientific 6500ICP-OES (Waltham, MA, USA) equipment. Fatty acids were analyzed via gas chromatography (Agilent 7890A GC System) as methyl esters of fatty acids [53]. Ten milligrams of fat extracted with diethyl-ether was saponi f ied with 250 uL of 0.5 M KOH/methanol i n a 2 mL screw-cap glass via l and heated for 15 min in a block thermostat at 140 °C. The transesterification was performed with boron trifluoride in methanol (14%, Sigma, Inc., St. Louis,MO, USA) for 10 min, and then 250 uL of heptane (Merck, Darmstadt, Germany) was added, and the mixture was brought to a boil. After cooling, saturated sodium chloride solution was added up to 2 mL. After standing for 1 h, the separated upper phase was moved into a test via l containing a 1 mm layer of dry sodium-sulfate, to which 1 mL of heptane was added. The column was a Supelco SP-2560 with film dimensions of 100 m x0.25 mm x0.2 um (Supelco, Bellefonte,PA, USA). The oven temperature program was 5 min at 140 °C, which was then increased by 4°C/min unti l 240 °C, with 10 min for the final temperature. The injector temperature was 220 °C , and the detector temperature was 250 C. The carrier gas was hydrogen, with a column flow of 1 mL min-and an automatic injection amount of 1 uL. 2.5. Samples Collection Body weight, total length and liver weight of the f ish were measured individually at the end of trial. For growth parameters, all (60 fish per diet group or 20 fish per tank) were individually measured. A total of 18 fish per diet group (6 individuals per tank) were randomly taken and dissected for somatic indices. Liver samples from two individuals per tank were frozen at -80 °C for fatty acid analysis. Another three fish per tank were collected for whole-body composition analysis, and f ive fish samples were obtained before the beginning of the trial. Blood samples were collected from t he caudal veins of f ish using heparinized 1 mL syringes, needles and 1.5 mL microcentrifuge tubes (3 fish per tank or 9 f ish per treatment).Plasma was separated through centrifugation (CAPP CR-1730R, Nordhausen, Germany) at 4°C and 1700× g for 20 min and stored at -20 °C for further analysis. Liver samples were taken from three f ish per tank for gene expression analysis. For each sample, 100 mg of liver was collected and placed in 1 mL of RNA later (Invitrogen, Thermo Fisher Scienti f ic,Waltham,MA,USA) for one day at 4°C, followed by storage at -20 °C until analysis. 2.6. Blood Plasma Biochemistru The total protein (TP) concentration of plasma was determined via a colorimetric assay based on the biuret reaction using a protein diagnostical reagent kit (Fluitest TP, Analyticon Biotechnologies AG, Lichtenfels, Germany),according to the manufacturer 's instructions. T o determine the total immunoglobulin (Ig) level of plasma samples, 50 uL of plasma and 50 uL of polyethylene glycol (PEG) were added to each wel l of a 96-well microtiter plate.After two hours of incubation at room temperature, plates were centrifuged at 1000× g for 15 min. Total protein contents of the supernatants were measured using FLUITEST Total Protein Kits (Analyticon Biotechnologies AG, Lichtenfels, Germany). These values were subtracted from the total protein levels of the samples, which had been measured previously. The result was equal to the total immunoglobulin concentration of plasma. Alkaline phosphatase (ALP), alanine aminotransferase (ALT), amylase (AMY), creatine (CREA), calcium (CA), total cholesterol (CHOL), glucose (GLU), globulin (GLOB) and phosphate (PHOS) levels of plasma samples were measured using a Samsung PT10V blood analyzer and Comprehensive Plus test assays (Samsung, Seoul, Republic of Korea). 2.7. Gene Expression Expression levels of genes involved in fatty acid metabolism (fatty acid synthase (fas),fatty acid desaturase 2 (fads2) and elongases (elovl2 and elovl5) were measured in liver samples through real-time quantitative PCR (qPCR), using elongation factor-1 alpha (elflo)as an interna l reference gene. Total RNA was isolated using the SV Total RNA Isolation System (Promega,Madison, WI, USA) according to the manufacturer’s instructions. The quantity of the RNA was measured using a NanoDrop 2000 spectrophotometer (Thermo Fisher Scientific, Waltham, MA,USA). The integrity (quality) was checked by denaturing gel e l ectrophoresis (1.5% agarose gel) and the purity by measuring the OD260/OD280 ab-sorbance ratio (>1.95). The cDNA was generated from 400 ng of total RNA using a qPCR cDNA Synthesis Kit (PCR Biosystems, London, UK) following the manufacturer’s protocol.The product of the first-strand cDNA synthesis was stored at -20°C unti l the quantitative RT-PCR (qPCR) runs. The qPCR reactions were carried out using a LightCycler 96 i nstru-ment and the FastStart Essential DNA Green Master qRT-PCR kit (Roche, Switzerland). The primers used are presented in Table 4. The qPCR reaction was carried out in a final volume of 20 uL consisting of 10 uL of master mix (2×), 1 uL of each primer (10 uM), 5 uL of cDNA (reverse transcription reaction mix) and 3 uL of nuclease-free water. The thermal profile for al l reactions was 95 °C for 10 min, followed by 45 cycles at 95 ℃ for 15 s, 60 °C for 30 s and 72°C for 30 s. The specificity of the reactions was checked via melting curve analysis, and no mispriming or primer dimers were found. All reactions were carried out in triplicate.The mean t hreshold cycle (Ct) values were calculated, and t he qPCR data were analysed using the method described in [54]. The efficiencies of qPCR reactions were determined using standard curves, and serial di l utions were performed from cDNAs of a l iver sample.These cDNAs were diluted to 1×,30×,90×,270x,and 810×. Quantitative PCR reactions were carried out on these dilutions with all primer pairs in triplicates. Standard curves were drawn for each primer pair by plotting Ct values against the log1o of different dilutions of cDNA sample solutions. Efficiencies (E) were calculated from the slopes of the standard curves using the equation E=10(-1/slope),and the results are shown in Table 4. Table 4. Primers used in real-t i me quantitative PCR. Target Gene Forward Primer (5'-3) Reverse Primer (5'-3') Primer Efficiency Reference fas TTGTTGCTCAAACCCAACACC AGACTTGCAGGCTCCATCAG 1.95 MH253823 fads2 TCCTATATGCTGGAACTAATGTGG AGGATGTAACCAACAGCATGG 1.95 55 eloul2 GCAGTACTCTGGGCATTTGTC GGGACATTGGCGAAAAAGTA 1.91 55 eloul5 ACTCACAGTGGAGGAGAGC GGAATGGTGGTAAACGTGCA 1.93 [55] elfla CCTTCAACGCTCAGGTCATC TGTGGGCAGTGTGGCAATC 1.94 [56] fas fatty ac i d synthase; fads2, fatty acyl desaturase 2; elovl2 elongase of very long-chain fatty acid 2; elool 5 elongase of very long-chain fatty acid 5;elflx , elongation factor-1 alpha. 2.8. Calculations and Growth Models In order to determine the growth performance and nutrient utilization of the fish, the following parameters were measured and calculated at the end of the trial: specific growth rate (SGR), SGR=100 × (lnwf -lnwi)/t; C weight gain (WG)=Wf -Wi ; ● protein efficiency ratio (PER)= weight gain (g)/protein intake (g); ● feed conversion ratio (FCR)= feed i ntake (g)/weight gain (g); protein production value (PPV%)= 100 × (final protein content of fish biomass-initial protein content of fish biomass)/protein intake; where wf = final mean weight (g); wi= initial mean weight (g); t=experimental time;in days; Wf= total final biomass; Wi = total initial biomass; survival rate (S%)=100 × number of survived fish/numbers of stocked fish; biometric indices and pos t -harvest indices determined were: Hepatosomatic Index (HSI%)=LW/BW × 100; LW=liver weight (g), BW = body weight (g); Condition factor (CF)= Total BW/TL3 ×100 and TL = total body length (cm). In order to reveal whether there were significant differences in growth patterns be-tween treatments, a l inear and an exponential growth model were f itted on individual weight data recorded at bi-weekly measurements. Equations (1) and (2) were parameter-ized with the use of interaction terms between time and treatment dummies among the predictors to assess the impact of diet on growth rates: where wt, the observed mean weight (g) of fish at time t; Win. and A, the initial weight estimates (which would only be accepted if it was ~200 g); t, the time (days) since the initial state; B50, B100,...,BM100, the dummy (0 or 1) variables representing the treatments other than control group; exp (), the base of the natural logarithm; Bi=1,2,...7, the parameters to estimate representing the daily weight gain (g/day), out which B1 is the estimated weight gain in the control group, while B2, B3.….., B7 are the additional weight gain parameters associated with their respective diets; Ki =12....7, the parameters to estimate representing speci f ic growth rate (%/day), out which K1 is the estimated growth rate in the control group, while K2,K3.…..,K7 are the additional growth rates in each group. After linearizing the exponential growth function (Equation (2)) by taking the nat-ural logarithm of both sides of the equation, the estimates were obtained via ordinary least squares. 2.9. Statistical Analysis Data were f i rst analyzed using one-way ANOVA, except for gene expression data. The means between groups were compared using post hoc Tukey’s multiple comparison test.Signi f icant differences were considered for a p-value <0.05. The Shapiro-Wilks test was used to assess normality. The homogeneity of the variances was checked with Levene's test. Polynomial contrasts (linear and quadratic response) were used to determine if there were l inear or quadratic patterns in the relationship between main estimated indicators and FM replacement level (0,50, and 100%) with insect protein in B, M and BM diets. For these analyses, three comparison groups were formed: ● Comparison B, between control , B50, and B100; C Comparison M, between control , M50, and M100; Comparison BM, between control, BM50, and BM100. Relationship between crude fat content of liver and HSI was explored with the com-puting Pearson correlation. All the statistical analyses were performed using IBM SPSS Statistics 27 software. Gene expression data were evaluated using the Relative Expression Software Tool (REST O) [57], where each group was i ndividually compared to the control. 3. Results 3.1. Growth Performance and Feed Utilization Efficiency Replacement of fish meal with black soldier fly meal (B) did not compromise feed/protein utilization (PER, PPV,FCR) and the growth of f ish (FBW, SGR), as among the B-diet treat-ments (Comparison B), there were no significant differences in these performance i ndicators.On the other hand, inclusion of yellow mealworm into the catfish feeds (M and BM di-ets) had a negative impact on growth and feed conversion (Table 5). The results of the polynomial contrast analysis support a statistically significant linear relationship between production parameters and the level of fish meal replacement in M and BM diets (Compari-son M and BM). T hese l inear patterns are i llustrated for SGR and FCR in Figure 2. Protein intake (PER and PPV) was negatively affected only by the M100 diet (p=0.007,p=0.002,respectively). Within the biometric indices, significant differences between the control group and treatments were not found in any of the comparison groups (Table 6). High biological variations were observed in HSI wi t hin the same treatment. The survival rates for C, B50, B100, M50, M100, BM50, and BM100 treatments were 90.0, 100,90.0,91.6,90.0,91.6, and 93.3%, respectively. Since the number of fish per tank was 20 and a survival rate of 90% corresponds to a mortality of two fish per tank, we did not analyze the difference between survival rates statisticallv. Figure 2. Variation in SGR and FCR parameters according to inclusion level of insects. Table 5. Production performance (n =60/diet group) and protein utilization efficiency (n =9/diet group) of African cat f ish (mean ± SD). Compar. B2 Compar. M² Compar. BM² Indicator· C B50 B100 M50 M100 BM50 BM100 PANOVA Plinear 4 3 4 3 4 PANOVA Plinear PANOVA Plinear FBW(g) 267.4±59.3e 257.6±48.1 258.6±47.0 260.9±41.5 de 251.6±49.5d 263.8±42.1 251.3±39.7 0.422 0.291 0.087 0.037 0.215 0.105 SGR(%day-1) 0.69±0.06eh 0.62±0.07 0.60±0.08 0.61 ±0.05 de 0.54±0.05 0.65±0.04gh 0.53±0.028 0.359 0.187 0.037 0.013 0.069 0.029 PER 0.98±0.09e 0.8±0.11 0.84±0.11 0.86 ±0.06 de 0.74±0.07d 0.91±0.17 0.77±0.01 0.264 0.137 0.021 0.007 0.130 0.054 PPV(%) 16.38±0.49e 15.66±0.11 12.91±0.11 15.36±0.06e 11.86±0.07d 15.67±0.17 14.69±0.01 0.237 0.118 0.005 0.002 0.723 0.441 FCR 2.30±0.23eg 2.57±0.30 2.68±0.39 2.59± 0.20 de 2.97±0.29d 2.47±0.36gh 2.96±0.13h 0.379 0.191 0.040 0.015 0.045 0.019 1 FBW: final body weight, SGR: specific growth rate, PER: protein efficiency ratio, PPV: protein productive value, FCR: feed conversion r atio.2 Three group comparisons were formed: Comparison B, between Control , B50, and B100; Comparison M, Control , M50, and M100; Comparison BM, Control , BM50, and BM100.3 p-values of ANOVA i n r espective comparison group. Values i n t he same row t hat share same superscripts are not statistically different (p >0.05) according to Tukey’s multiple comparison test. The letters d,e denote significant differences among t reatments in Comparison M; l etters g h denote significant differences among treatments in Comparison BM; 4 p-values of linear components of the polynomial contrast analysis between each performance indicator and f ish meal replacement level (0%-50%-100%) with i nsect -based i ngredient. Second-order (quadrat i c) components were nowhere significant; therefore, these values are not listed. Table 6. Biometric index of African catfish (n = 18/diet group), (mean ±SD). Indicator C B50 B100 M50 M100 BM50 BM100 Compar. B么 3PANOVAPlinear 4 Compar.M’ 3PANOVA Plinear 4 Compar. BM 3PANOVA Plinear CF (gcm-3) 0.83±0.10 0.76±0.07 0.78±0.12 0.76±0.06 0.82±0.10 0.78±0.05 0.78±0.07 0.147 0.160 0.075 0.850 0.115 0.054 HSI(%) 1.57±0.45 1.63±0.40 1.70±0.39 1.77±0.37 1.73±0.54 1.64±0.42 1.73±0.49 0.621 0.332 0.369 0.281 0.557 0.282 TL (cm) 32.08±0.96 33.22±2.24 32.91±3.11 33.53±1.24 31.50±2.03 32.58±1.53 32.61±1.56 0.516 0.285 0.123 0.243 0.438 0.255 1 TL: total length, HSI : hepato-somatic index, CF : condition factor.2 T hree group comparisons were formed: Comparison B, between Control, B50, and B100; Comparison M, Control ,M50, and M100; Comparison BM, Control , BM50, and BM100.3 p-values of ANOVA i n respective comparison group. 4 p-values of linear components of the polynomial contrast analysis between each performance indicator and fish mea l replacement l evel (0%-50%-100%). Second-order (quadratic) components were nowhere signi f icant ; therefore, these values are not listed . Data from f itted growth models are presented i n the Appendix A (Tables A1 and A2)Parameter values and their significance levels in both the linear and exponential growth func t ions indicate that treatments M100 and BM100 would reduce the growth of catfish in comparison with the control group over a longer time horizon. Although coeffic i ents for B50, B100, M50, and BM50 dummies are also negative, contrary to M100 and BM100,these are not significant at the p <0.05 level . Figure 3 illustrates fish growth patterns under different treatments simulated beyond the timeframe of the current experiment. Figure 3. Simulation of growth of f ish fed under different treatments using the parameterized exponential growth function (Table A2). 3.2. Biochemical Parameters As shown in Table 7, most of the plasma biochemical parameters analyzed were not significantly influenced by the diet, except for cholesterol, globulin, and phosphate.The cholesterol levels increased significantly in fish fed with different inclusion l evels of M (M diets p <0.001, BM diets p=0.006). Phosphate levels decreased significantly in the B50, M50, and M100 treatments compared to the control group. Globulin level was increased in all experimental treatments, significantly so in BM groups (p=0.002).The following concentration levels were measured: ALP (27-53 UL -), ALT (10-76 U L-1), calcium (10.9-16 mg dL-1), cholesterol (80-176 mg dL-1), creatine (0.1-0.4 mg dL-1),globulin (2.1-3.6 g dL -1), glucose (57-135 mg dL -1), gamma-glutamyl t ranspeptidase (GGT) (<5), total protein (2.3-3.7 g dL-1), phosphate (4.7-9.6 mg dL-1), i mmunoglobulin (0.19-0.26 mg mL-l ) and amylase activity (10-44UL-1). 3.3. Total Lipid Content and Fatty Acid Composition of t he Liver As shown in Table 8, the total l ipid f at content presented numerical variabi li ty between the f ish belonging to different diet groups. However, the difference was not statistically proven (p >0.05). Replacement of FM with B meal caused the appearance of lauric acid (12:0) in the B50, B100, and MB100 diets. In the case of myristic acid (14:0), a significant difference was found between the B100 and control group (p=0.018). Total SFA was the highest i n groups B50 and B100, but without a significant difference compared to the control group. The level of DHA (22:6n -3) was significantly (p= 0.011) reduced when FM was replaced with BM (BM comparison). Significant di f ferences (p<0.001) in Lc-PUFA between C and the rest of the treatments were detected. The n-6/n-3 ratio was lowest in the control group and significantly different from B100, M50, M100, BM50, and BM100treatments. A negative correlation (Pearson R=-0.308,p=0.047,N= 42) was found between HSI and total lipid content of the l iver (Table 9). Table 7. Selected blood plasma biochemistry parameters of African catfish f ed diets wi t h different inclusion level of M and B (n =9/diet groups). Compar. B2 Compar. M² Compar. BM² Indicator· C B50 B100 M50 M100 BM50 BM100 PANOVA 3 Plinear4 PANOVA1 3 Plinear 4 PANOVA 3 4 Plinear ALP (UL-I) 45.8±7.3 42.9±3.6 44.5±10.5 46.5±5.1 45.7±8.1 46.3±6.4 46.0±5.6 0.720 0.730 0.967 0.981 0.988 0.943 ALT (UL-I) 29.0±18.5 30.5±9.0 22.7±7.8 38.6±23.2 27.4±11.8 34.0±12.6 24.0±11.7 0.927 0.816 0.365 0.663 0.547 0.850 CA (mg dL-I) 12.1±2.01 14.1±1.37 12.5±2.1 12.44±1.46 13.37±1.30 12.6±1.68 13.02±1.89 0.078 0.650 0.368 0.172 0.590 0.310 CHOL (mg dL-1) 115.2±15.6dg 125.4±9.1 125.5±13.7 133.8±11.3 de 146.1±18.9° 137.8±14.21 136.9±13.9h 0.187 0.120 0.001 0.000 0.012 0.006 CREA (mg dL-1) 0.21±0.11 0.22±0.08 0.17±0.05 0.15±0.08 0.19±0.06 0.20±0.10 0.23±0.05 0.324 0.247 0.301 0.776 0.739 0.596 GLOB (g dL-) 2.45±0.21g 2.60±0.31 2.63±0.45 2.53±0.19 2.70±0.35 2.70± 0.14 gh 2.81±0.26h 0.500 0.275 0.159 0.063 0.007 0.002 GLU (mg dL-) 101.5±31.2 76.9±13.6 94.6±20.3 82.1±22.5 81.2±12.2 82.7±15.7 82.6±18.4 0.085 0.541 0.125 0.066 0.175 0.100 GGT(UL-I) <5 <5 <5 <5 <5 <5 <5 一 一 - 一 TP (g dL-I) 3.19±0.56 3.06±0.37 3.15±0.58 3.30±0.34 3.37±0.65 3.20±0.44 3.28±0.83 0.849 0.882 0.692 0.398 0.930 0.731 PHOS (mg dL-1) 7.11±1.36 be 5.83±0.41a 6.65±0.76ab 5.91±0.45d 5.85±0.70d 6.31±0.91 6.41±0.70 0.027 0.323 0.013 0.007 0.249 0.168 IG (g dL-1) 1.31±0.72 0.80±0.46 1.34±0.92 0.83±0.60 1.37±0.96 1.56±0.67 1.47±0.89 0.162 0.931 0.193 0.858 0.724 0.619 AMY(UL-) 21.4±7.7 16.1±3.3 24.1±9.1 22.1±10.4 16.0±3.4 19.7±3.7 18.1±5.3 0.122 0.442 0.262 0.187 0.525 0.262 1 ALP: alkaline phosphatase, ALT: alanine aminotransferase, CA: calc i um, CHOL: total cholesterol, CREA: creatinine, GLOB: globulin, GLU: glucose, GGT: gamma-glutamyl transpeptidase, TP: total protein; PHOS: phosphate, IG: immunoglobulin, AMY: amylase. Mean ± SD (n=12 fish/group).2 Three group comparisons were formed : Comparison B, between Control, B50, and B100; Comparison M, Control , M50, and M100; Comparison BM, Control, BM50, and BM100.3 p-values of ANOVA in respective comparison group.Values in t he same row that share same superscripts are not statistically different (p >0.05) according to Tukey’s multiple comparison test . The l etters a b denote significant differences among treatments i n Comparison B; The l etters d,e denote significant differences among treatments in Comparison M; letters gh, i denote significant differences among treatments in Comparison BM;4 p-values of l i near components of the polynomial contrast analysis between each performance indicator and FM i nclusion level (0%-50%-100%). Second -order (quadratic) components were nowhere significant; therefore, these values are not l i s ted. Table 8. Total l ipid (% wet weight ) and fatty acid composition (% of total fatty acids) of l iver after feeding period using diets with different inclusion l evels of M and B (n=6/diet group). Compar. B² Compar. M² Compar. BM² Indicator1 C B50 B100 M50 M100 BM50 BM100 PANOVA 3 Plinear4 PANOVA 3 Plinear4 PANOVA 3 Plinear Total lipid 6.44±2.65 8.09±3.75 7.31±2.51 5.78±2.05 9.12±2.42 5.64±3.25 7.87±2.80 0.648 0.626 0.064 0.070 0.427 0.410 12:0 0.22±0.04 0.41±0.08 0.31±0.03 - 一 一 一 一 14:0 1.27±0.26a 1.51±0.24ab 1.70±0.18b 1.58±0.11 1.42±0.21 1.56±0.29 1.53±0.20 0.018 0.802 0.055 0.205 0.123 0.094 16:0 28.34±3.12 29.90±0.90 30.15±2.05 28.31±2.35 29.93±1.58 29.38±2.96 30.82±1.33 0.336 0.563 0.440 0.276 0.283 0.120 16:1n-9 3.44±0.53 3.44±0.31 3.05±0.17 3.82±0.55 3.49±0.50 3.46±0.53 3.43±0.55 0.137 0.297 0.418 0.864 0.994 0.966 18:0 7.71±1.57 10.23±1.95 9.67±2.18 7.44±0.73 7.36±0.66 8.63±1.15 8.31±2.15 0.089 0.128 0.837 0.574 0.640 0.549 18:1n一9 34.93±6.08 37.60±2.46 35.62±1.65 37.31±0.56 37.68±1.71 36.42±4.48 38.36±2.86 0.488 0.253 0.393 0.213 0.461 0.222 18:2n一6 4.52±1.54 4.18±1.67 4.89±1.67 6.02±0.98 5.46±1.04 4.79±1.48 4.60±1.60 0.755 0.529 0.130 0.201 0.953 0.934 18:3n一6 0.38±0.14 0.40±0.23 0.41±0.13 0.59±0.10 0.58±0.15 0.56±0.19 0.47±0.13 0.392 0.282 0.602 0381 0.183 0.839 18:3n一3 0.43±0.07 0.29±0.17 0.32±0.16 0.47±0.11 0.40±0.14 0.35±0.10 0.31±0.12 0.392 0.282 0.602 0.381 0.183 0.839 20:4n一6 1.22±0.43 1.01±0.50 1.35±0.37 1.12±0.26 1.13±0.43 0.74±0.32 0.84±0.41 0.426 0.229 0.863 0.750 0.115 0.165 20:5n一3 0.54±0.26 0.45±0.17 0.25±0.01 0.61±0.24 0.29±0.01 0.39±0.21 0.21±0.02 0.330 0.154 0.109 0.146 0.327 0.955 22:6n一3 3.02±1.15h 2.49±0.94 2.64±0.74 3.03±0.95 2.14±0.81 1.75±0.72gh 1.60±0.588 0.625 0.488 0.226 0.141 0.021 0.011 Total SFA 39.24±2.19 42.55±1.94 42.59±3.62 38.09±1.98 39.72±1.55 40.77±2.05 41.66±2.02 0.077 0.243 0.347 0.673 0.162 0.063 Total MUFA 40.29±6.43 42.81±2.58 40.65±1.63 43.09±0.82 43.23±2.00 41.61±5.09 43.80±3.08 0.532 0.273 0.366 0.214 0.494 0.248 Total PUFA 11.68±4.45 10.08±3.90 11.55±3.22 13.65±2.51 11.60±1.78 9.91±3.07 9.37±3.51 0.736 0.443 0.456 0.966 0.544 0.299 n-6/n一3 2.15±0.50adg 2.41±0.42ab 2.99±0.95b 2.60±0.77e 3.25±0.94° 3.33±1.09h 3.37±0.60h 0.047 0.795 0.005 0.003 0.001 0.001 Lc-PUFA 4.51±1.80 beh 3.79±1.60a 4.08±1.21a 4.65±1.45 3.28±1.34d 2.63±1.158 2.37±1.078 0.001 0.020 0.001 0.000 0.000 0.000 Tota l SFA include 6:0,8:0, 10:0,12:0,14:0,15:0, 16:0, 17:0, 18:0, 22:0; Total MUFA include 16:1n -9, 17:1n -7, 18:1n -9, 20:1n -9; Total PUFA include 18:2n -6,18:3n -6,20:2n -6, 20:3n -6,20:3n-3, 20:4n-6,20:5n-3, 22:6n-3,n-6/n-3: Total n-6 PUFA/Total n-3 PUFA; Lc-PUFA: 20:4n-6+20:5n-3+22:6n-3.2 Three group comparisons were formed: Comparison B,between Control , B50, and B100; Comparison M, Control , M50, and M100; Comparison BM, Control , BM50, and BM100.3p-values of ANOVA i n respec t ive comparison group. Values in the same row that share same superscripts are not statisticall y different (p> 0.05) according to Tukey’s multiple comparison test. The letters a b denote significant differences among treatments i n Comparison B; letters d,e denote significant differences among treatments in Comparison M; letters gh denote significant differences among treatments in Comparison BM;4 p-values of l inear components of the polynomial contrast analysis between each performance indicator and FM inclusion level (0%-50%-100%). Second-order (quadratic) components were nowhere signi f icant; therefore, these values are not listed. Table 9. Pearson correlation coeff i cient between total lipid (f at) and HSI. Total Lipid HSI fat Pearson Correlation 1 -0.308* Sig. (2-tailed) 0.047 N 42 42 * Correlation is significant at the 0.05 level (2-tailed ). 3.4. Gene Expression Compared to the C group, the relative expression of the elovl5 and fas genes was significantly (p<0.05) higher in the B100 and M50 groups, respectively. No significant di f ferences were found in the cases of other examined genes and groups. However, all examined genes exhibited a similar pattern with respect to the B (B50 and B100) and M (M50 and M100) diets (Figure 4). With respect to the BM meal, the expression of fas, fads2,and elovl2 was higher in fish fed with BM100 diet than in fish fed with BM50 diet, while that of elool5 showed an opposite pattern, being higher in fish fed with BM50 than in fish fed with BM100, with no significant differences. In addition, elovl5 and fas were upregulated in al l f ish fed the different experimental diets compared to the control diet , while elovl2 and fads2 indicated a downregulation in fish fed the M100 and BM50 diets, respectively. Figure 4. Nutritional regulation of f atty acyl desaturase (fads2), fatty acyl elongases 2 (elovl2) and 5 (elovl5), and fatty acid synthase (fas) in l iver of African cat f ish grower fed a control diet and six different experimental diets. Values are normalized expression ratios relative to the control (C) diet.*: significant (p<0.05) difference compared to the control (C) group. 4. Discussion In the present study, black soldier fly and yellow mealworm's different inclusion levels and their combination in the diets of African catfish grower were tested. In order to ensure the nutrient requirement of the diets following the replacement of f ish meal with different insects, essential amino acid supplements were added. Otherwise, the different AA composition of the insects would cause a defici t in the aquafeeds. As a consequence of this, the level of the l imiting AA in our diets was above the optimum recommended level.The results of the feeding trial revealed that there were no significant (p>0.05) differences between the B treatment groups in terms of growth, weight gain, and nutrient i ntake. This finding agrees with the findings reported on Siberian sturgeon (Acipenser baerii) fed with B meal [58], Nile tilapia (Oreochromis niloticus) fed with different inclusion levels of B [59], and zebrafish (Danio rerio) fed with B [60]. Similarly, Melenchon et al. [61] reported the absence of a negative effect on the growth performance of rainbow trout (Oncorhynchus mykiss) fed with fish feeds where f ish meal was partially and totally (130 and 300 g kg-) replaced with B and M meal, or in Jian carp (Cyprinus carpio var. Jian) [62] and i n common carp (Cyprinus carpio) [63], using feeds with 140 g kg- and 120 g kg-1 B protein levels, with 100% FM replacement without having a significant effect on growth. In contrast to the B meal , our diets with M replacement (M100, BM100) significantly i nhibited the growth performance and nutrient utilization of catfish growers, while partial replacement of FM (M50, B50, and BM50) exhibited approximately similar parameters to t he control diet. These findings are comparable with previous findings in the l iterature. Partial inc l usion levels of FM with B and M showed the best results in African catfish with an initial body weight of 2.7, 6.0, and 5.1 g [32,35,64]. With the application of growth models generated using data from the feeding period, total replacement of FM with BM would reduce the t ime involved in the growth of catfish compared to the control group, as was already observed in the case of M meal. The decreasing tendency observed in our case in the growth performance of African catfish as the replacement level of FM with M meals increased could be associated with the lower palatability or poor digest i bi l ity of insects compared to FM. This is in line with previous findings presented by Sandor et al. [49], when apparent digestibility coefficients (ADC) were calculated . In that study, low ADC amino acid was calculated for M meal f ed to African catfish. In spite of that, the EAA levels of our diets containing M meal (Table 3. M100, BM50, BM100) were higher compared to the rest of the diets, due to i ts low digestibility, as M meal obs t ructed the growth performance of fish and protein efficiency of diet. In contrast with our findings, no significant effect on the growth of European sea bass (Dicentrarchus labrax) fed with different inclusion levels of defatted M meal [65] W w a as s reported. The variations in the results might be associated with differences in doses (g kg -) of insect meals and the presence of other ingredients in the formulated diet, age and size of fish [45], the feeding habits of fish [3], processing (either full fat or mechanically defatted), and the high lipid content that reduces the availability of crude protein [66]. Thus, for the commercialization of insect-based f ish feeds, reliable i ngredients need to be used, with information regarding its digestibility and palatability. The condition factor (CF) of a fish reflects physical and biological situations and fluctuations caused by interactions among feeding conditions, parasitic infections, and physiological factors [67]. In the present study, the condi t ion factor of African catfish was not significantly (p>0.05) affected by dietary t reatment. This might i ndicate the situation with fish exhibiting isometric growth (presence of l ength increases in equal proportion with body weight) [68]. In the present study, 100% survival was observed in the B50 group, while some mortalities occurred in the other groups. The mortality was related more to handling stress than the feed. However, the positive impact of B50 replacement in coping with stress needs further investigation. The quality and utilization of protein in a diet is measured through the protein efficiency ratio (PER) and the protein productive value (PPV)[69]. The latter is also known as protein retention and is represented through the ratio between the protein retained in f ish tissues and the dietary protein fed [70]. In the present study, feed utilization did not significantly (p>0.05) differ between the B treatments. Nevertheless,the highest result was obtained with the control diet. In contrast , when using M meal in the diets, the protein efficiency was significantly decreased when FM was totally replaced with M or close to significant level (p<0.05) using BM meal. Higher feed utilization of the control group might be associated with the lowest dietary chitin and fiber pattern. It was confirmed that the growth performance, FCR, and SGR of Nile tilapia decreased as the dietary chitin increased [71]. Chitin content higher than 10% decreased the growth performance, and up to 5% increased the growth of Nile t ilapia [72]. The other reason might be assoc i ated with high calcium and phosphorous levels [73], which is the case in our control diet as well. Plasma glucose and total protein levels are associated with the stress response [74].Interestingly, despite the numerical differences, the values of plasma glucose (GLU) were not statistically significant (p > 0.05) between the treated and control diet groups. On this note, a previous report showed the absence of a significant difference (p > 0.05) in GLU concentration in juvenile black porgy (Acanthopagrus schlegelii) fed with M meal as FM substitution [75]. The plasma phosphate level was significantly (p<0.05) decreased with dietary insect meal inclusion, showing a lower available P in insects compared to FM. High levels of energetic metabolites such as cholesterol can be indicators of liver pathology and a high-fat diet [76]. I n the present study, the cholesterol level of blood plasma was significantly lower in the control compared to M100, BM50, and BM100. The diets were formulated to be isolipidic with an average of 10% fat content, which excludes the possibility of causing elevated plasma cholesterol levels. This result is in contrast with the findings of Tran et al. [77] and Jeong et al. [78], who reported that defatted mealworm meal did not significantly affect the serum cholesterol level of European perch (Perca fluviatilis ) and rainbow trout fed with diets containing 20.3% and 28% dietary protein (FM) replacement with defatted and fully fatted M, respectively. Our results suggest that replacing FM with defatted M meal may cause a higher cholesterol level in the blood and an increased hepatosomatic index (HSI%) in the fish (Table 6). However, the HSI did not differ significantly with FM replacement. A similar observation was found i n the fat content of the liver, which seems to increase with FM replacement level, but a significant difference could not be detected. Indeed, the level of cholesterol was below 200 mg dL-1, indicating it was within the normal range observed in the case of fish [79]. The negative correlation observed between the fat content of the liver and the HSI (Table 9) would indicate that the fish were healthy without signs of hepatosteatosis. Regarding the fatty acid composition of liver, the Lc-PUFA deficit could be observed due to the replacement of FM in the experimental diets. At the same time, the excess in SFA in B t reatments and the increase in the n-6/n-3 ratio in all experimental groups reflected dietary FA composition. Generally, when fish are fed low levels of n-3 Lc-PUFA, fads2expression i s upregulated i n the liver, the t issue of which is the most active i n t erms of lipid metabolism and Lc-PUFA biosynthesis in fish. In our study, fads2 expression in fish liver fed with diets with 100% replacement was higher compared to 50% replacement in the case of black soldier f ly meal, which are findings similar to those presented in [80]. Previous studies have shown that vertebrates possess three members of the Elovl protein family with roles i n PUFA elongation, namely Elovl2, Elovl4 and Elovl5, that differ in their fatty acid (FA) substrate specificities [81]. Elovl5 has a preference for C18 and C20 PUFA, whereas Elovl2 i s predominantly involved i n elongation of C20 and C22 PUFA. Elovl4 participates in the elongation of very long-chain (C ≥24) PUFA substrates found in the retina and testis.In the present study, the relative expression of genes encoding Elovl2 (elool2) and Elovl5(elovl5) proteins were investigated, and positive responses of elool2 in experimental groups were found. A similar trend is observed for elovl5. Based on this finding, a slight increase in endogenous Lc-PUFA biosynthesis capacity was observed in all treatments, i rrespective of the type of insect, in order to compensate for the reduction in dietary Lc-PUFA that occurred with the replacement of fish meal. 5. Conclusions In conclusion, the growth performance and feed utilization of African catfish fed with partial or total replacement levels of fish meal with B were not significantly affected (p>0.05) during 6 weeks of feeding. In contrast, inclusion of yellow mealworm in the catfish feeds (M and BM diets) had a negative impact on growth and feed conversion.Cholesterol levels i n blood serum and the hepatosomatic index of fish were negatively influenced by the inclusion of M meal, but the total lipid content of the l iver remained unchanged. The Lc-PUFA content of the liver in experimental fish was generally decreased,and a slight increase in the endogenous Lc-PUFA biosynthesis capacity was observed in all treatments, irrespective of the type of insect. Based on this f inding, B can successfully replace FM (200gkg -) partially or totally in t he practical diet of African catfish without having a significant adverse effect on health, nutrient utilization, and growth performance.As regards M dietary inclusion, this ingredient may hinder fish growth and cause health problems for this fish species when a high inclusion level is applied. Author Contributions: A.G.: data collec t ion, blood biochemistry analysis, data analysis and interpre-tation, drafting manuscript; B.K.: conception and designing of t he experiment , rev i sion of manuscript,L.A.: blood sample collection, blood biochemistry analysis, gene expression analysis, revision of manuscript, J.B.: sampling, revision of manuscript, E.L .-K.: chemical analysis, M.B.: chemical analysis,R.T.-F: chemical analysis, R.E.: gene expression analysis,T.M.: writing and revision of manuscript,G.G.: evaluation of data and statistical analysis, Z.J.S.: conception and designing of t he experiment,chemical analysis, revision of the manuscript. All authors have read and agreed to the published version of the manuscript . Funding: The work was supported by the St i pendium Hungaricum Scholarship Program of the Hungarian Government , by the Hungarian National Research, Development, and Innovation Of-fice, grant number [TKP2020-NKA-24] and by the project 'Preparation for the transition to circular economy i n the case of agricultural and green waste'of Environment and Energy Efficiency Opera-tional Programme grant scheme of Ministry of Technology and Industry Hungary under grant no.:KEHOP-3.2.1-15-2021-00037. Institutional Review Board Statement : The anima l study protocol was approved by the Insti t utional Review Board (or Ethics Committee) of the Hungarian University of Agriculture and Life Sciences (identification number of the license: KA-3403). Informed Consent Statement: Not applicable. Data Availability Statement: Data available on request due t o restric t ions, e.g., privacy or ethical reasons.Acknowledgments: Authors are t hankful to the technical staff of MATE for their support i n f ish husbandry (Gabriella Stettner) and laboratory sample analyses (Anita Szucs, Judit Molnar). Conflicts of Interest: The authors declare no conflict of i nterest, financially or personal l y, concerning this manuscript. Appendix A Table A1. Summary of t he l inear growth model *. Model Parameter Parameter Value Standard Error p-Value Win (predicted starting weight) 201.451 1.325 0.000 B1 (daily weight gain of control group) 1.494 0.090 0.000 B2 (additional daily weight gain of B50 group) -0.218 0.113 0.058 B3 (additional daily weight gain of B100 group) -0.122 0.113 0.286 B4 (additional daily weight gain of M50 group) -0.147 0.113 0.197 B5 (additional daily weight gain of M100 group) -0.343 0.113 0.003 B6 (additional daily weight gain of BM50 group) -0.114 0.113 0.316 B7 (additional daily weight gain of BM100 group) -0.319 0.113 0.006 Adjusted R-squared Adjusted R-squared Table A2. Summary of the exponential growth model*. Model Parameter Parameter Value Standard Error p-Value A (predicted starting weight) 202.107 1.00560 0.000 K1 (daily growth rate of control group) 0.00645 0.00038 0.000 K2 (additional growth rate of B50 group) -0.00086 0.00048 0.075 K3 (additional growth rate of B100 group) -0.00044 0.00048 0.355 K4 (additional growth rate of M50 group) -0.00058 0.00048 0.227 K5 (additional growth rate of M100 group) -0.00136 0.00048 0.006 K6 (additional growth rate of BM50 group) -0.00048 0.00048 0.322 K7 (additional growth rate of BM100 group) -0.00126 0.00048 0.010 Adjusted R-squared 0.898 * For interpretation of results, a t he reader is referred to description of Equation (2) in Sec t ion 2. References 1. FAO. The State of World Fisheries and Aquaculture 2018—Meeting the Sustainable Development Goals; Food Agriculture Organization:Rome, Italy, 2018. 2 Dong, F.M.; Hardy, N.F.; Barrows,F.T .;Rasco, B.A.; Fairgrieve, W.T.; Foster, I .P. Chemical composi t ion and protein digestibi l ity of poultry by product meals for salmonids diets. Aquaculture 1993, 116,149-158. [CrossRef ] 3. Henry, M.; Gasco,L.; Piccolo, G.; Fountoulaki, E. Review on the use of insects in the diet of farmed f ish: Past and future Anim.Feed Sci. Technol . 2015, 203,1-22.[CrossRef 4 Gatlin, D.M., III; Barrows, F T.; Brown, P.; Dabrowski, K.; Gaylord, T.G.;Hardy, R.W.; Wurtele, E. Expanding the utilization of sustainable plant products in aquafeeds: A review. Aquac. Res. 2007, 38,551-579. [CrossRef ] 5. Oliva-Teles, A.; Enes, P.; Peres, H. Replacing fishmea l and f ish oil in industrial aquafeeds for carnivorous fish. In Feed and Feeding Practices in Aquaculture; Davis, A.D., Ed.; Woodhead Publishing: Sawston, UK, 2015; pp. 203-233. 6. Wu, Y.B.;Ren, X.; Chai , X.J.; Li , P; Wang, Y. Replacing f ish meal with a blend of poultry by-product meal and feather meal in diets for giant croaker (Nibea japonica). Aquac. Nut r . 2018,24,1085-1091.[CrossRef ] 7. Shi, X.; Luo, Z.; Chen, F; Wei, C.C.; Wu, K.; Zhu, X.M.; Liu, X. Effect of fish meal replacement by Chlorella meal with dietary cellulase addition on growth performance, digestive enzymatic activities, histology and myogenic genes' expression for crucian carp Carassius auratus. Aquac. Res. 2017, 48,3244-3256.[CrossRef ] 8. Shah, M.R.; Lutzu, G.A.; Alam, A.; Sarker, P.; Chowdhury, K.; Parsaeimehr, A.; Liang, Y.;Daroch, M. Microalgae in aquafeeds for a sustainable aquaculture industry. J . Appl. Phycol. 2018, 30, 197-213. [CrossRef ] 9. Zhou, Z.; Yao, W.; Ye, B.; Wu, X.; Li , X.; Dong, Y. Effects of replacing fishmeal protein with poultry by-product meal protein and soybean meal protein on growth, feed intake, feed utilization, gut and liver histology of hybrid grouper (Epinephelus fuscoguttatus 9× Epinephelus lanceolatus o’) juveniles. Aquaculture 2020,516, 734503.[CrossRef ] 10. Hoffman, L.C .; Prinsloo, J .F.; Rukan, G. Partial replacement of fish meal with either soybean meal, brewers’ yeast or tomato meal in the diets of African sharp-tooth catfish Clarias gariepinus. WATER SA-PRETORIA 1997,23,181-186. 16. Riddick, E. Insect Protein as a Partial Replacement of FM in the Diets of Juvenile Fish and Crustaceans. In Mass Production of Beneficial Organisms; Elsevier: Amsterdam, The Netherlands,2014; pp. 565-582. 18. Magalhaes,R.; Sánchez-Lopez, A.; Leal, R.; Martínez-Llorens, S.; Oliva-Teles, A.; Peres, H. Black soldier f ly (Hermetia illucens)pre-pupae mea l as a f ish meal replacement i n diets for European seabass (Dicentrarchus l abrax). Aquaculture 2017,476, 79-85.I CrossRe f 19. Mohan,K.;Rajan, D.K.; Muralisankar, T.; Ganesan, A.R.; Sathishkumar, P .; Revathi , N. Use of black soldier fly (Hermetia illucens L.) larvae meal in aquafeed s for a sustainable aquaculture industry: A review of past and future needs. Aquaculture 2022, 553,738095.[CrossRef ] 20. Giovanni, S.; Mario, A.; I laria, B.; Silvana, C .; Gasco, L . The Potential Role of Insects as Feed : A Multi-Perspective Review. Animals 2019,9,119. 21. Sánchez-Muros, M.J.; Barroso,F.G.;Manzano-Agugliaro, F . Insect meal as renewable source of food for animal feeding: A review.J. Clean. Prod. 2014, 65,16-27.[CrossRef ] 22. Rumpold , B.; Schluter, O. Potent i al and challenges of insects as an innovative source for food and feed production. I nnov. Food Sci. Emerg. Technol. 2013,17,1-11. [CrossRef ] 23. National Research Council (NRC). Nutrient Requirements of Fish and Shrimp; The National Academies Press: Washington, DC,USA, 2011. 24. Koutsos, L.;McComb, A.; Finke, M.; Stull, V. I nsect composition and uses i n animal feeding applications: A brief review. Ann.Entomol. Soc . Am. 2019, 112,544-551. [CrossRe f f ] 25. Gasco, L.; Biasato, I; Enes, P.; Gai , F. Potentia l and challenges for the use of insects as feed for aquaculture. In Mass Production of Beneficial Organisms; Academic Press: Cambridge, MA, USA, 2023; pp. 465-492. 26. Alfiko, Y.; Xie, D.; Astuti, R.T.; Wong, J; Wang, L. Insects as a feed ingredient for f ish culture: Status and trends. Aquac. Fish. 2021,7,166-178. [CrossRef ] 27. Nogales-Merida, S.; Gobbi, P.; Jozefiak, D.; Mazurkiewicz, J;Dudek, K.; Rawski , M.; Kieronczyk, B.; Józef i ak, A. Insec t meals in fish nutrition. Rev. Aquac . 2019,11,1080-1103.[CrossRef ] 28. Glencross, B.D. Exploring the nutritional demand for essential fatty acids by aquaculture species. Rev. Aquac. 2009,1,71-124.[CrossRe f 29. Lall, S.P.; Dumas, A. Nutritional requirements of cultured f ish: Formulating nutritionally adequate feeds. In Feed and Feeding Practices i n Aquaculture; Woodhead Publishing: Sawston, UK, 2015;pp. 53-109. 30. Barroso, F .G.; Sánchez-Muros, M.J.; Segura, M.; Morote, E.; Torres, A.; Ramos,R.; Gui l , J .L. Insects as food: Enrichment of larvae of Hermetia illucens with omega 3 f atty acids by means of dietary modif i cations. J. Food Compos. Anal . 2017,62,8-13. [CrossRef] 31. Riekkinen, K.; Vakevainen, K.; Korhonen, J. The Effect of Substrate on the Nutrient Content and Fatty Acid Composition of Edible Insects. Insects 2022, 13,590. [CrossRef ] [PubMed ] 32. Adeoye, A.A.; Akegbejo-Samsons, Y.; Fawole, J .F .; Davies, J.S. Preliminary assessment of black soldier fly (Hermetia i llucens) larval meal in the diet of African catfish (Clarias gariepinus ): Impact on growth, body index, and hematological parameters. World Aquac.Soc. 2020,51, 1024-1033. [CrossRef ] 33. Fawole, F.J.; Adeoye, A.A.; Tiamiyu, L.O.; Ajala, K.I.; Obadara, S.O.; Ganiyu, I .O. Subst i tuting fishmeal wi t h Hermetia i llucens in the diets of African catfish (Clarias gariepinus): Effects on growth, nutrient utilization, haemato-physiological response,and oxidative stress biomarker. Aquaculture 2020,518,734849. [CrossRef ] 34. Talamuk, R. Comparisons of Growth Performance of African Catfish (Clarias gariepinus Burchell , 1882) Fingerlings Fed Different Inclusion Levels of Black Soldier Fly (Hermetia illucens) Larvae Meal Diets. Master’s Thesis, Stellenbosch University, Stellenbosch,South Africa, 69 March 2016. 35. Ng, W.K.; L i ew, F.L.; Ang, L .P.; Wong, K.W. Potential of mealworm (T enebrio Molitor) as an alternat i ve protein source i n practical diets for African catfish, Clarias gariepinus . Aquac. Res. 2001, 32,273-280. [CrossRef ] 36. Aniebo, A.O.; Erondu, E.S.; Owen, O.J . Replacement of fish meal with maggot meal in African catfish (Clarias gariepinus) diets.Rev. Cient . UDO Agric . 2009,9,666-671. Tran, G.; Heuze, V.; Makkar, H.P.S. Insects in fish diet. Anim. Front . 2015,5,37-44. 39. Anvo, M.P.M.; Aboua, B.R.D.; Compaore, I .; Sissao, R.; Zoungrana-Kabore, C.Y.; Kouamelan, E.P.; Toguyeni, A. Fish meal replacement by Cirina butyrospermi caterpillar's meal in practical diets for Clarias gariepinus fingerlings. Aquac. Res. 2017, 48,5243-5250. [CrossRef ] 40. Anvo, M.P.M.; Toguyeni, A.;Otchoumou, A.K.; Yvette Zoungrana-Kabore, C.; Paul Kouamelan, E. Evaluation of Cirina butyros-permi caterpillar's meal as an alternative protein source in Clarias gariepinus (Burchell, 1822) larvae feeding. Int. J . Fish. Aquat.Stud. 2016,4,88-94. 41. Olaleye, I.G. Effects of grasshopper meal i n the diet of Clarias gariepinus f i ngerlings. J. Aquac. Res. Dev. 2015,6,6-8. 43. Tippayadara, N.;Dawood, M.A.O.;Krutmuang, P.; Hoseinifar, S.H.; Doan, H.V.; Paolucci, M. Replacement of fish meal by black soldier fly (Hermetia illucens) larvae meal : Effects on growth, haematology, and skin mucus immunity of nile tilapia, Oreochromis niloticus. Animals 2021, 11, 193. [CrossRef ] 44. Mohamad-Zulkifli, N.F.N.; Yong, A.S.K.; Kawamura, G.; Lim, L.-S.; Senoo, S.;Devic, E.; Mustafa, S.; Shapawi,R. Apparent di-gestibil i ty coefficient of black soldier fly (Hermetia illucens) larvae in formulated diets for hybrid grouper (Epinephelus fuscoguttatus 9x Epinephelus lanceolatus o). AACL Bioflux 2019,12,513-522. 45. Chemello, G.; Renna, M.; Caimi, C.; Guerreiro, I.;Oliva-Teles, A.; Enes,P.; Biasato, I.; Schiavone, A.; Gai, F.;Gasco, L. Partially defatted Tenebrio molitor larva meal in diets for grow-out rainbow trout, Oncorhynchus mykiss (Walbaum): Effects on growth performance, diet digestibility and metabolic responses. Animals 2020,10,229. [CrossRef ] 46. Smets, R.; Verbinnen, B.; Van De, I.; Aerts, G.; Claes,J.; Der Borght, V.M. Sequential Extraction and Characterization of Lipids,proteins, and chitin from black soldier fly (Hermetia illucens) larvae, prepupae, and pupae. Waste Biomass Valor. 2020,11,6455-6466.I CrossRef l 47. Abro,R.; Sundell, K.; Sandblom, E.; Sundh, H.; Brannas, E.; Kiessling, A.; Lindberg, J.E.; Lundh, T. Evaluation of chitinolytic activities and membrane i ntegrity i n gut tissues of Arc t ic charr (Salvelinus alpinus) f ed f ish meal and zygomycete biomass. Comp.Biochem. Physiol . 2014,175,1-8. [CrossRef ] 48. Xu, X.; J i, H.; Belghit , I.; Sun, J. Black soldier f ly larvae as a better lipid source than yellow mealworm or silkworm oils for juveni l e mirror carp (Cyprinus Carpio var. specularis). Aquaculture 2020, 527, 735453.[CrossRef ] 49. Sándor, Z.J.; Banjac, V.; Vidosavljevi, S.; Kaldy, J.; Egessa, R.; Lengyel-Kónya,E.; Tomoskozi-Farkas, R.; Zalán, Z.; Adányi, N.;Libisch, B.; et al. Apparent digestibility coefficients of black soldier f ly (Hermetia i llucens), yellow mealworm (Tenebrio molitor),and blue bot t le fly (Calliphora vicina) i nsects for juvenile African catfish hybrids (Clarias gariepinus x Heterobranchus longifili s ). Aquac.Nutr. 2022, 4717014.[CrossRef ] 50. AOAC . Official Methods of Analysis of AOAC International, 17th ed.; Association of Official Analytical Chemists: Gaithersburg,MD,USA, 2000. Finke, M.D. Estimate of chitin in row whole insects . Zoo Biol. 2007,26,105-115. [CrossRef ] [PubMed ] Marono, S.; Piccolo, G.; Loponte, R.; Meo, C.D.; Attia, Y.A.; Nizza, A.; Bovera , F. In vitro crude protein digestibil i ty of Tenebrio molitor and Hermetia i llucens i nsect meals and i ts correlation with chemical composition traits. Ital. J. Anim. Sci. 2015,14,338-343. [CrossRef ] 53. Toth-Markus, M.; Sass-Kiss, A. Effect on cooking on the fatty acid composi t ion of silver carp (Hypophtalmichtis molitrix, V.). Acta Aliment. 1993,22,25-35. 54. Pfaffl,M.W. A new mathematical model for relative quantification in real-time RT-PCR. Nucleic Acids Res. 2001, 29,2002-2007.I CrossRe f 55. Oboh, A.; Betancor, M.B.; Tocher, D.R.; Monroig, O. Biosynthesis of long-chain polyunsaturated fatty acids in the African catfish Clarias gar i epinus : Molecular cloning and functional characterization of fatty acyl desaturase (fads2) and elongase (elool2)cDNAs7.Aquaculture 2016,462,70-79. [CrossRef ] 56. Reda, R.M.; Nasr, M.; Ismail, T.A.; Moustafa , A. Immunologica l Responses and the Antioxidant Status in African Catfish (Clarias gariepinus) Following replacement of dietary fish meal with plant protein. Animals 2021, 11, 1223. [CrossRef ] 57. Pfaff l , M.W.; Horgan, G.W.; Dempfle, L. Relative expression software tool (RESTO) for group-wise comparison and statistical analysis of relative expression results in real-time PCR. Nucleic Acids Res. 2002, 30, e36. [CrossRef ] 58. Józefiak, A.; Nogales-Merida, S.; Rawski, M.; Kieronczyk, B.; Mazurkiewicz, J. Effects of insect diets on the gastrointestinal tract health and growth performance of Siberian sturgeon (Acipenser baeri i Brandt, 1869). BMC Vet . Res. 2019, 15,348.[CrossRef ] 59. Devic, E.; Leschen, W.; Murray, F.; Little, D.C. Growth performance, feed utilization and body composition of advanced nursing Nile tilapia (Oreochromis niloticus) fed diets containing Black Soldier Fly (Hermetia illucens) larvae meal . Aquac . Nutr. 2018, 24,416-423.[CrossRef | 60. Vargas, A.A.; Randazzo, B.;Riolo, P.; T ruzzi , C.;Gioacchini, G.; Giorgini, E.;Loreto, N.; Ruschioni, S.; Zarantoniello, M.; Antonucc i,M. Rearing zebraf i sh on black soldier fly (Hermetia illucens): Biometric, histological , spectroscopic, biochemical , and molecular implications. Zebrafish 2018, 15, 404-419.[CrossRef ] 61. Melenchon, F;Larran, A.M.; de Mercado, E.; Hidalgo , M.C.; Cardenete, G.; Barroso, F.G.; Fabrikov, D.; Lourenco, H.M.; Pessoa,M.F; Tomas-Almenar, C. Potential use of black soldier f ly (Hermetia illucens) and mealworm (Tenebrio molitor) i nsect meals in diets for rainbow trout (Oncorhynchus mykiss). Aquac. Nutr. 2021,27,491-505.[CrossRef] 62. Zhou,J; Liu, S.; Ji,H.; Yu, H. Effect of replacing dietary f ish meal with black soldier fly l arvae meal on growth and fatty acid composi t ion of Jian carp (Cyprinus carpio var. Jian). Aguac. Nutr. 2018,24,424-433. [CrossRef ] 63. Gebremichael, A.; Hancz, C.; Kucska, B. Effect of total or partial replacing of f ishmeal with black solider fly (Hermetia illucens)meal on growth performance and body condition indices of common carp (Cyprinus carpio). AACL Bioflux 2021, 14, 2280-2286. 64. Huda, M.A.; Sunarno, M.T.D.; Nurhudah, M. Potential addition of black soldier f ly carcass meal in sangkuriang cat f ish (Clarias gariepinus) feed formulation. AACL Bioflux 2020, 13, 2567-2576. 65. Basto, A.; Calduch-Giner, J; Oliveira, B.; Pet i t, L.; Sa, T.; Maia, M.R.G.; Fonseca, S.C.; Matos, E.; Perez-Sanchez, J; Valente,L.M.P. The Use of Defatted mealworm (Tenebr i o molitor) Larvae Meal as a Main Protein Source Is Supported in European Sea Bass (Dicentrarchus labrax) by data on growth performance, lipid metabolism, and flesh quality. Front. Physiol. 2021,12,659567.[CrossRef | 66. Rema, P.; Saravanan, S.; Armenjon, B.; Motte, C .; Dias, J. Graded i ncorporation of defatted yellow mealworm (Tenebr i o molitor) in rainbow trout (Oncorhynchus mykiss) diet improves growth performance and nutrient retention. Animals 2019,9,187. [CrossRef ] 67. Le Cren, E.D. The l ength-weight relationships and seasonal cycle in gonad weight and condition in the perch (Perca fluviatilis).J .Anim. Ecol. 1951,20,201-219. [Cr ossRef ] 68. Ujjania, N.C.; Kohli, M.P.S.; Sharma, L.L. Length-weight relationship and condition factors of Indian major carps (C. catla, L.rohita and C. mrigala) in Mahi Bajaj Sagar, India. Res. J . Biol. 2012,2,30-36. 69. Albrektsen, S.;Mundheim, H.; Aksnes, A. Growth, feed efficiency, digestibility and nutrient distribution in Atlantic cod (Gadus morhua) fed two different f ish meal qualities at three dietary levels of vegetable protein sources. Aquaculture 2006, 261,626-640.I CrossRef l 70..CGerking, S.D. Influence of rate of f eeding and body weight on protein metabolism of bluegill sunfish. Physiol. Zool . 1971, 44,9-19.[CrossRef l 71. Shiau, S.-Y.; Yu , Y.-P. Dietary supplementation of chitin and chitosan depresses growth in t ilapia, Oreochromis niloticus x O. aureus.Aquaculture 1999,179,439-446.[CrossRef ] 72. Elserafy, S.S.; Abdel-Hameid, N.H.; Abdel-Salam, H.A.; Dakrouni , A.M. Effec t of shrimp waste extracted chitin on growth and some biochemical parameters of the Nile tilapia. Egypt. J. Aquat. Biol. Fish 2021, 25, 313-329. [CrossRef ] 73. Ugwu, L.L.C.;Mgbenka, B.O.; Asogwa, M.O. The effects of calcium on dietary phosphorus uptake by hybrid African catfish,Heteroclarias fry. Ife J. Sci . 2005, 7,71-77.[CrossRef ] 74. Sulaiman, M.A.; Fari, K.A.; Osho, F.E.; Ogah, S.I. Effect of partial feed deprivation on plasma total protein and glucose as stress indicators in African catfish Clarias gariepinus (Burchell 1822). ATBU J. Sci Techn. Ed. (JOSTE)2017,5,1-8 75. Jeong, S.M.; Khosravi, S.; Kim, K.W.; Lee, B.J.; Hur, S.W.; You, S.G.; Lee, S.M. Potential of mealworm, Tenebrio molitor, meal as a sustainable dietary protein source for j uvenile black porgy, Acanthopagrus schlegelii. Aquac. Rep. 2022,22,100956.[CrossRef 76. Coz-Rakovac,R.;Perovic,S.;Hacmanjek, M.; Topic, P.N.; Lipej, Z.; Sosataric, B. Blood chemistry and histological properties of wild and cultured sea bass (Dicentrarchus labrax) in the North Adriatic Sea. Vet. Res. Com. 2005, 29, 677-687. [CrossRef ] 77. Tran, H.Q.; Prokesova, M.; Zare, M.; Matouǒek, J.; Ferrocino, I .; Gasco, L.; Stejskal, V. Production performance, nutrient digestibility, serum biochemistry, fillet composition, i ntestinal microbiota and environmental impacts of European perch (Perca fluviatilis) fed defatted mealworm (Tenebrio molitor). Aquaculture 2022, 547,737499. [CrossRef ] 78. J eong, S.M.; Khosravi, S.; Mauliasari, I.R.; Lee , S.M. Dietary inclusion of mealworm (Tenebrio molitor) meal as an alternative protein source in practical diets for rainbow trout (Oncorhynchus mykiss) fry. Fish. Aqu. Sci. 2020,23,12.[CrossRef ] 79. Mori , T.A.; Vandongen, R.; Beil i n, L.J .; Burke, V.; Morris, J .;Ritchie, J. Effects of varying dietary fat , f ish, and fish oi l s on blood lipids in a randomized controlled trial in men at risk of heart disease. Am. J. Clin. Nutr. 1994, 59,1060-1068. [CrossRef ] [PubMed] 80. Hu, Y.; Huang, Y.; Tang, T .;Zhong, L .;Chu, W.; Dai, Z.; Chen, K.; Hu, Y. Effect of partial black soldier f ly (Hermetia illucens L.)larvae meal replacement of fish meal in practical diets on the growth, digestive enzyme and related gene expression for rice field eel (Monopterus albus). Aquac. Rep. 2020,17,100345. [CrossRef ] 81. Monroig, O.; T ocher, D.R.; Castro, L.F.C. Polyunsaturated fatty acid biosynthesis and metabolism in f ish. In Polyunsaturated Fatty Acid Metabolism; Burdge, G.C., Ed.; Academic Press and AOCS Press: London, UK, 2018; pp. 31-60. Disclaimer/Publisher’s Note: The statements, opinions and data contained in all publications are solely those of the individual author(s) and contributor(s) and not of MDPI and/or the editor(s). MDPI and/or the editor(s) disclaim responsibility for any injury to people or property resulting from any ideas, method s , i nstructions or products referred to in the content.
确定


还剩19页未读,是否继续阅读?

产品配置单


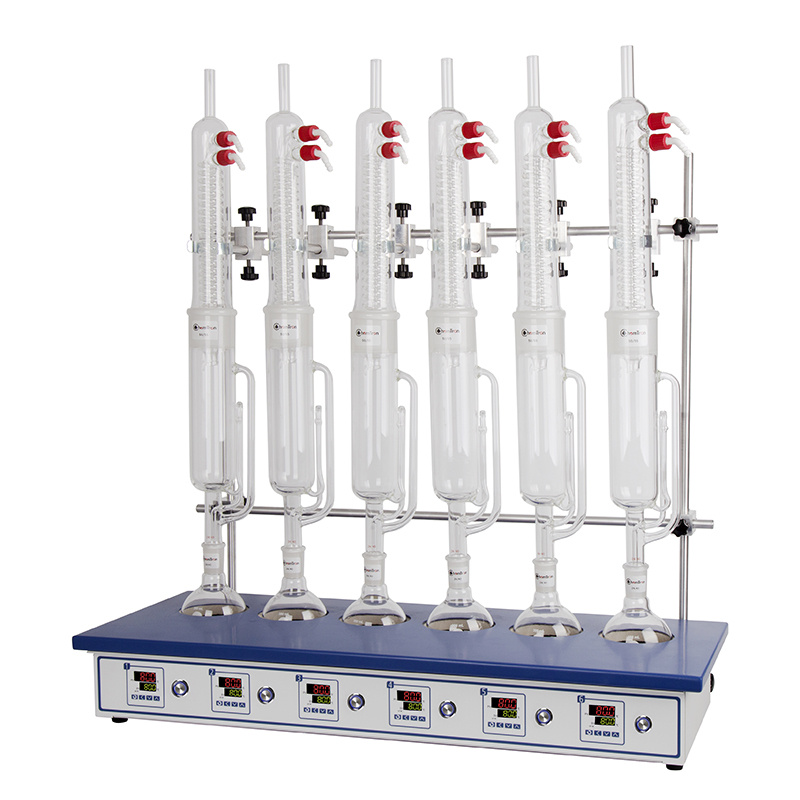
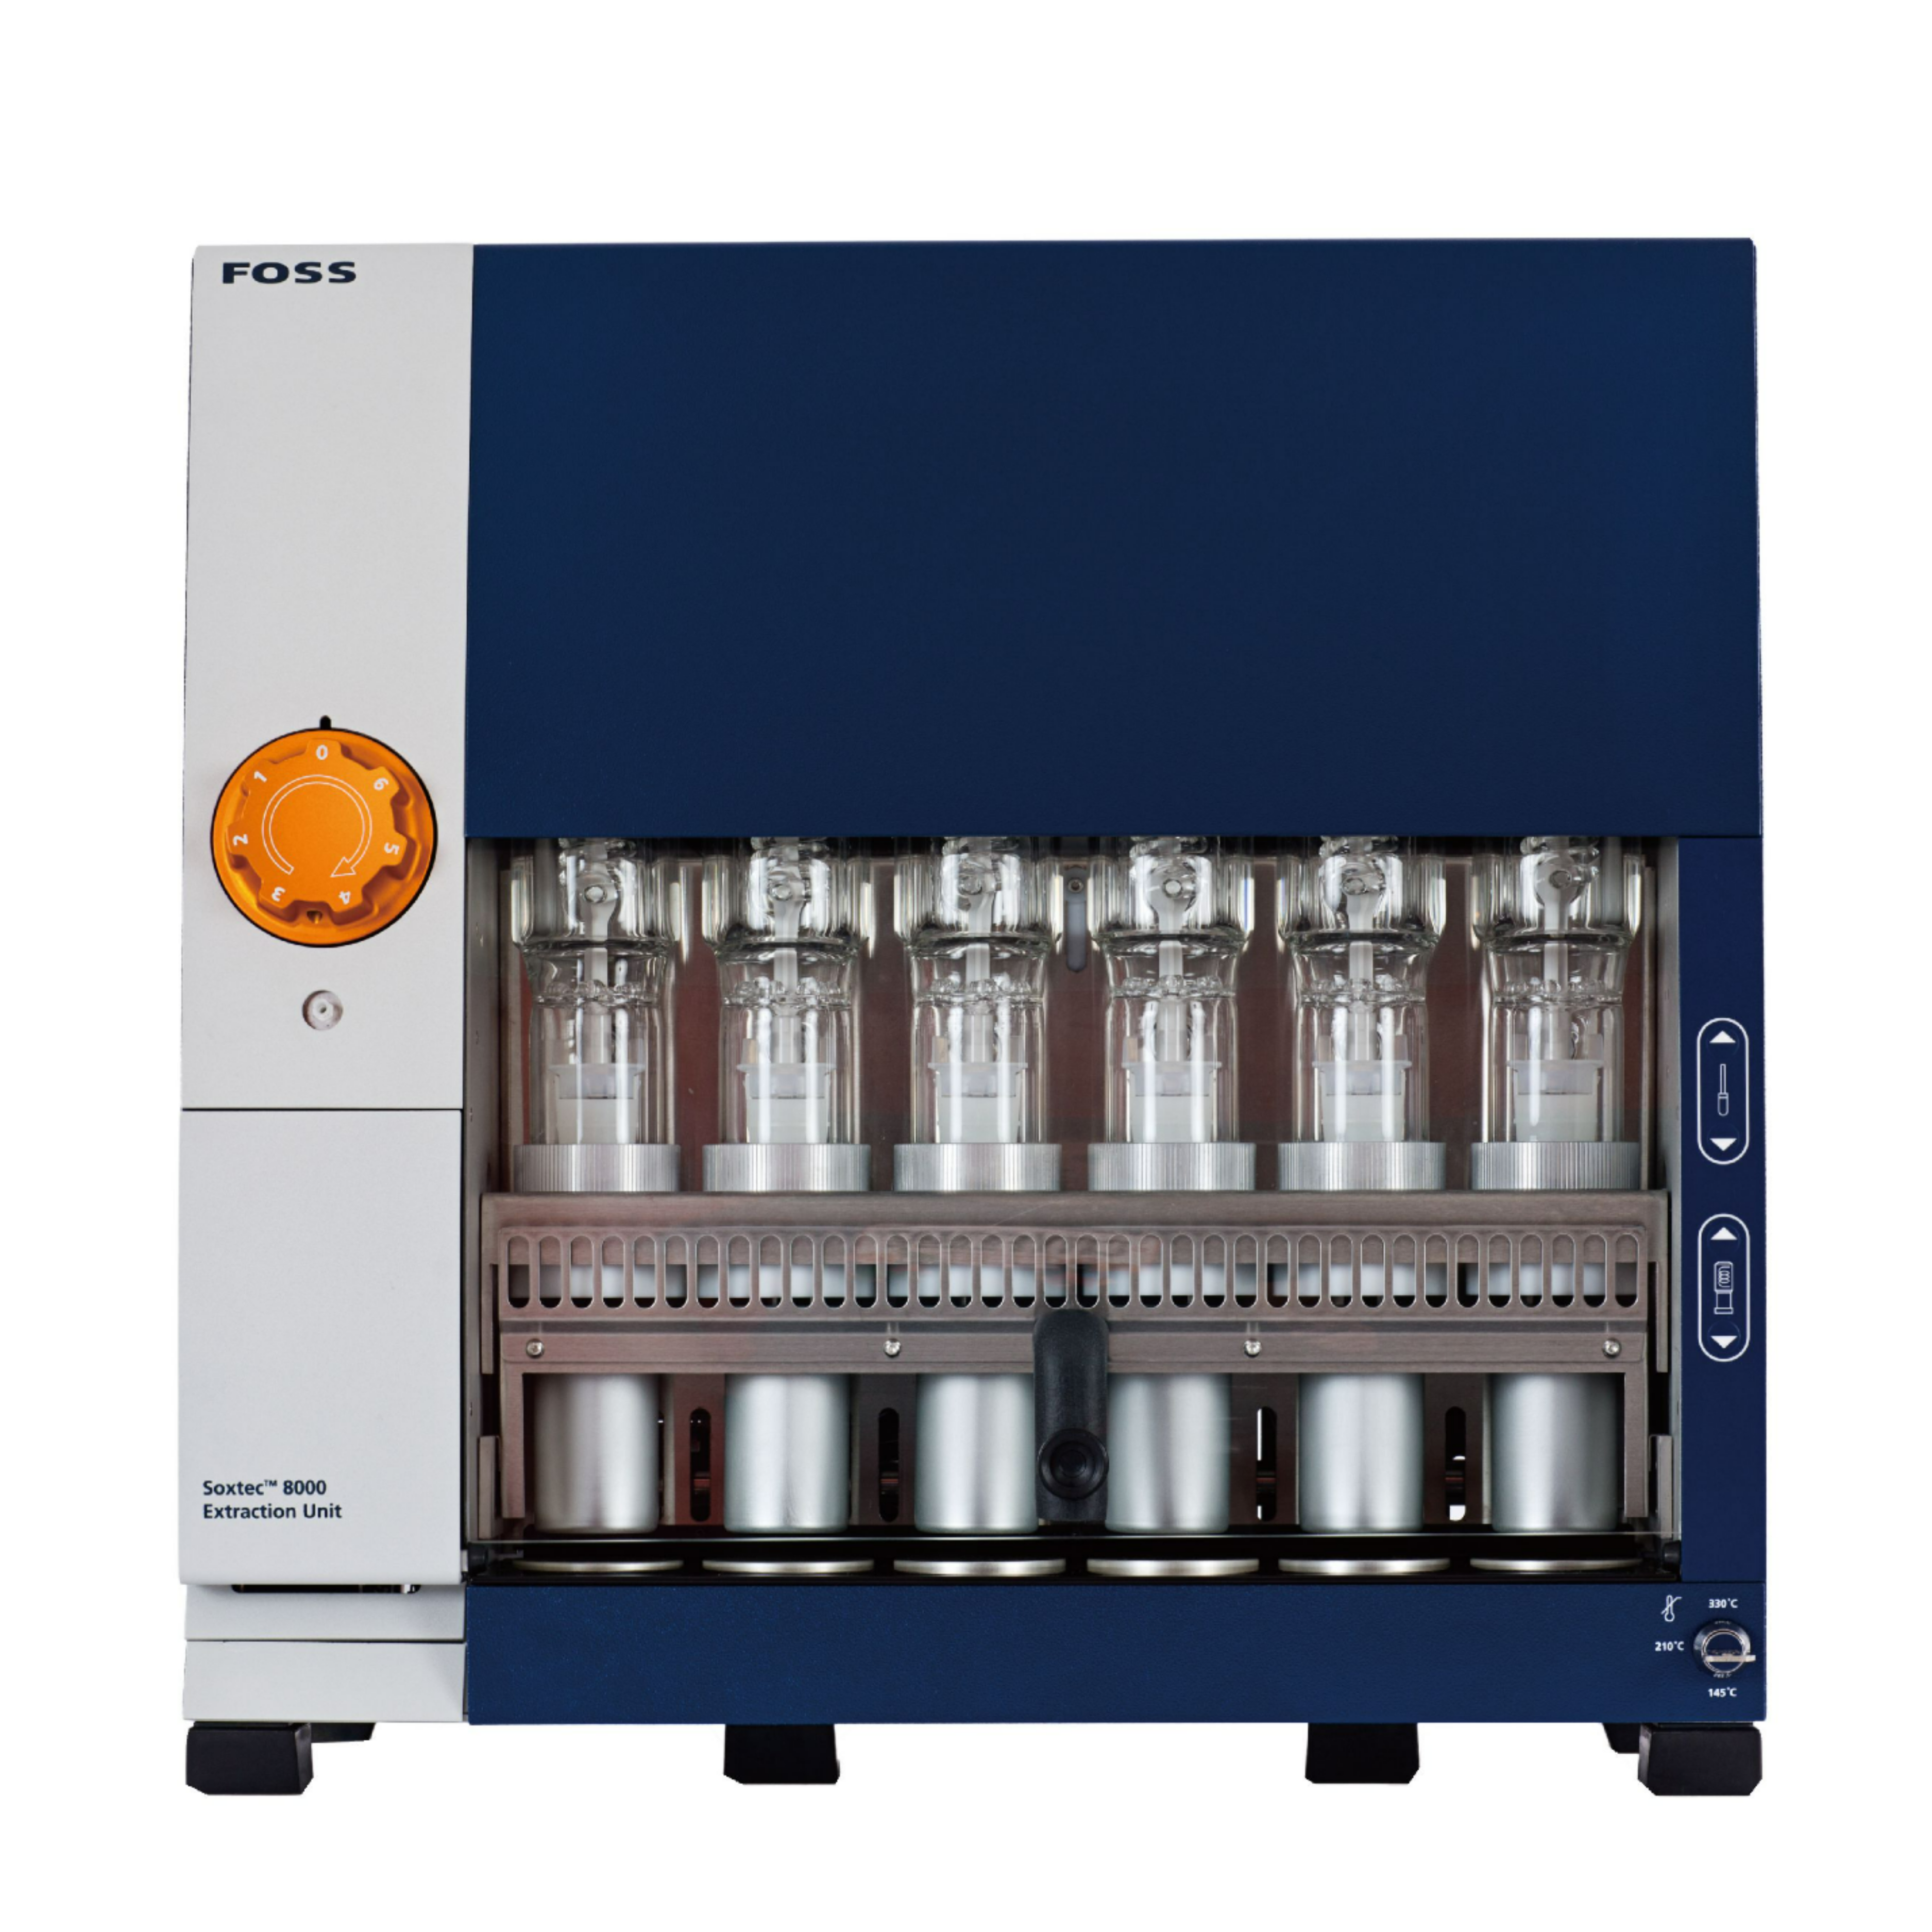
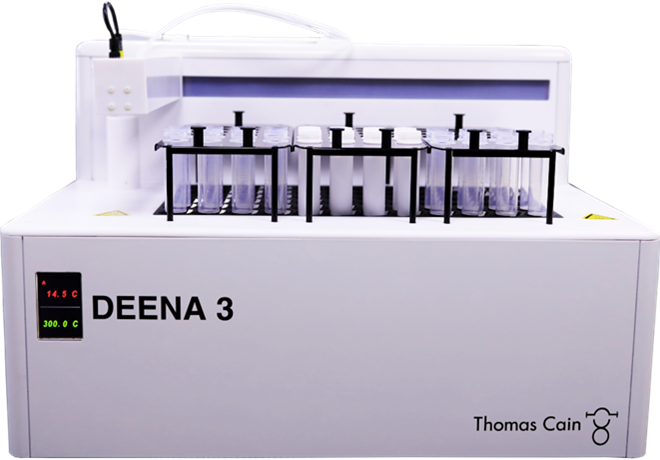
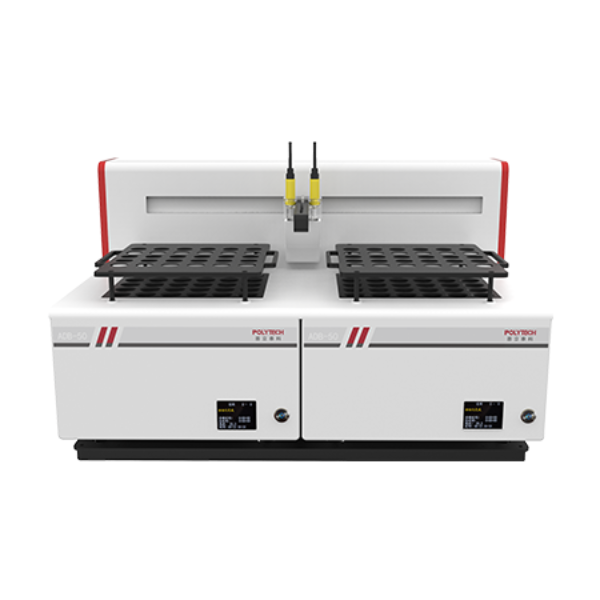
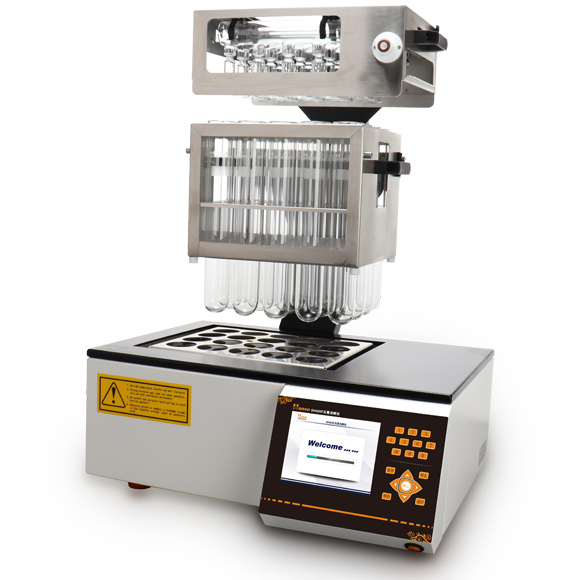
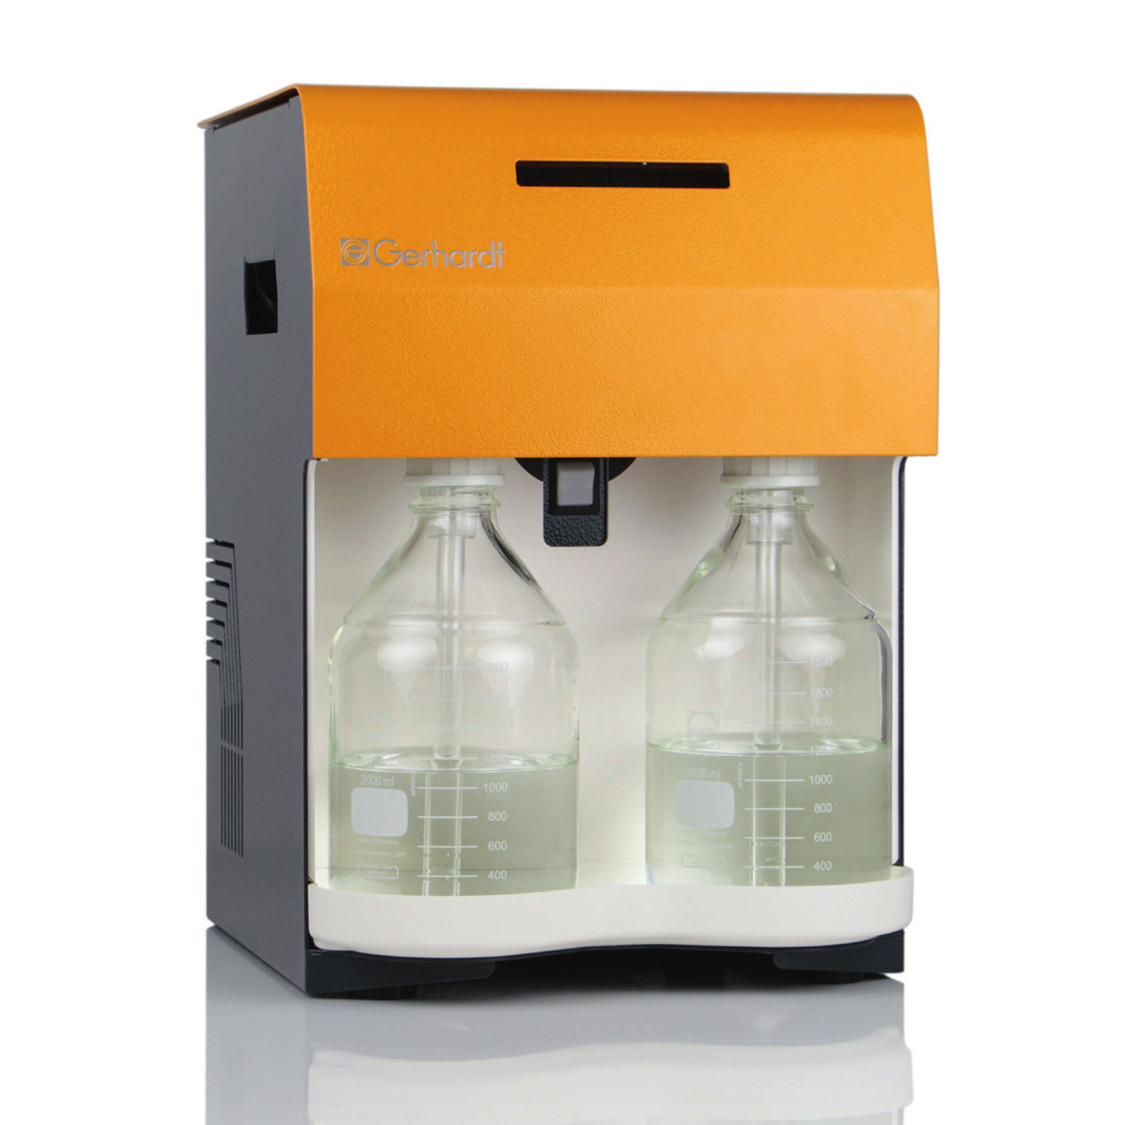
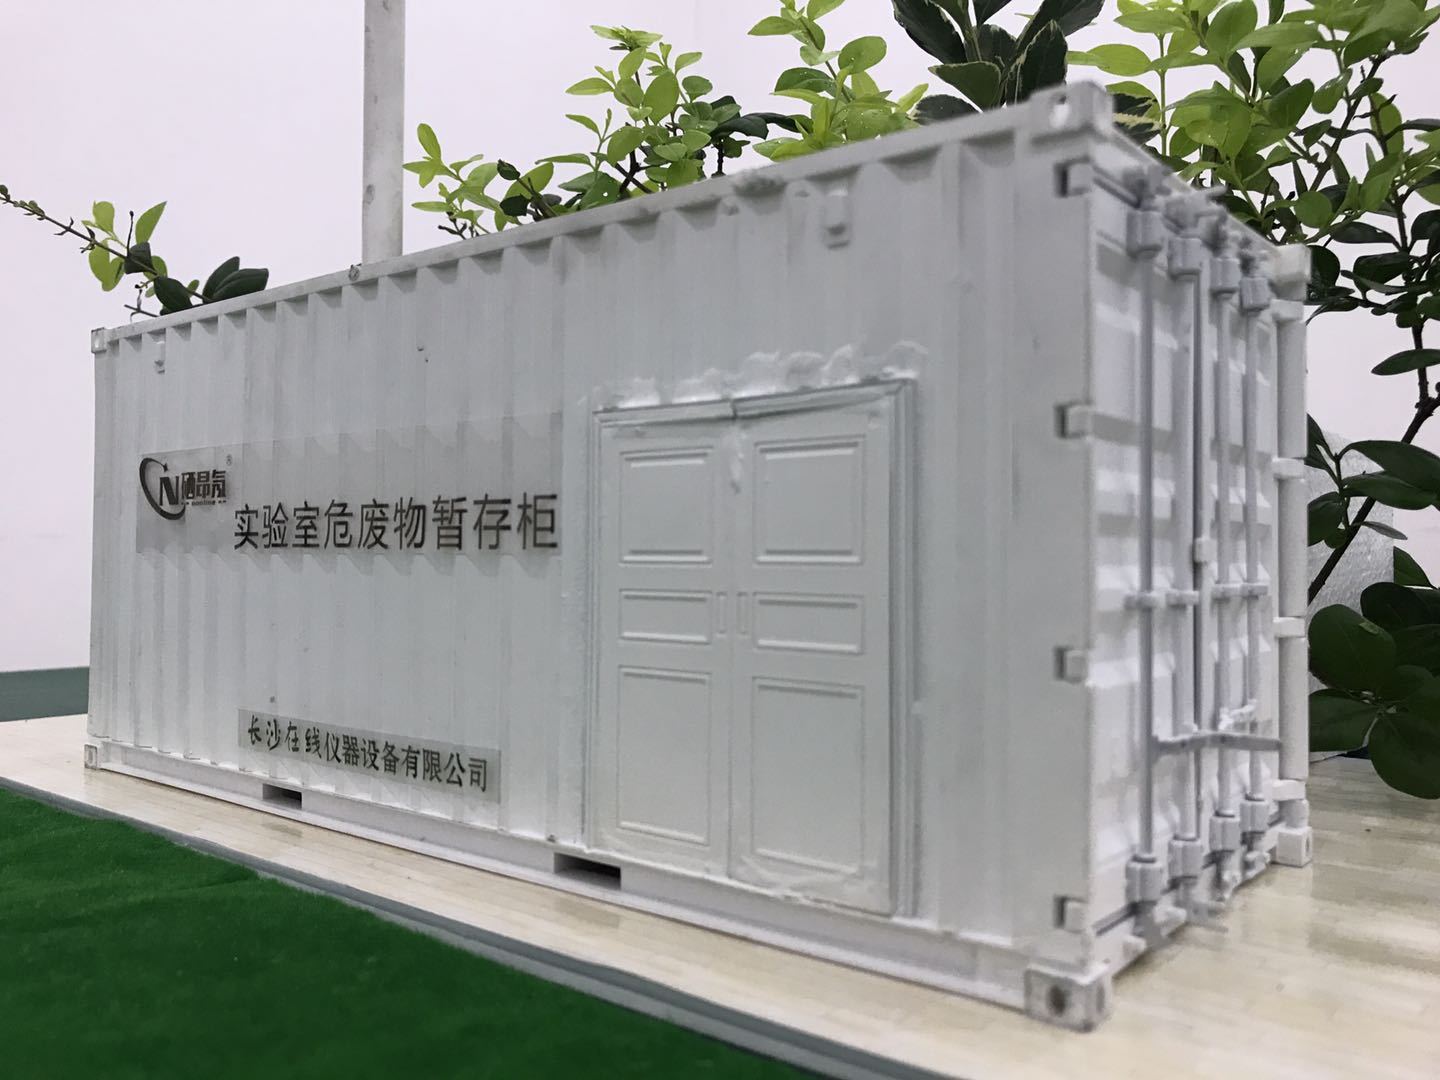
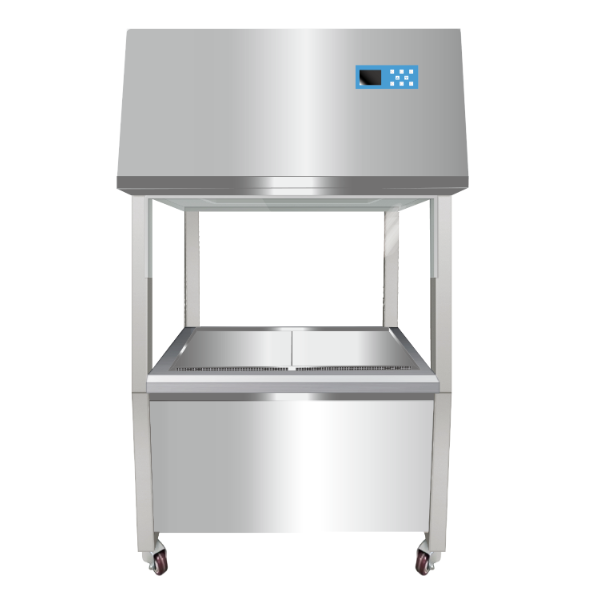
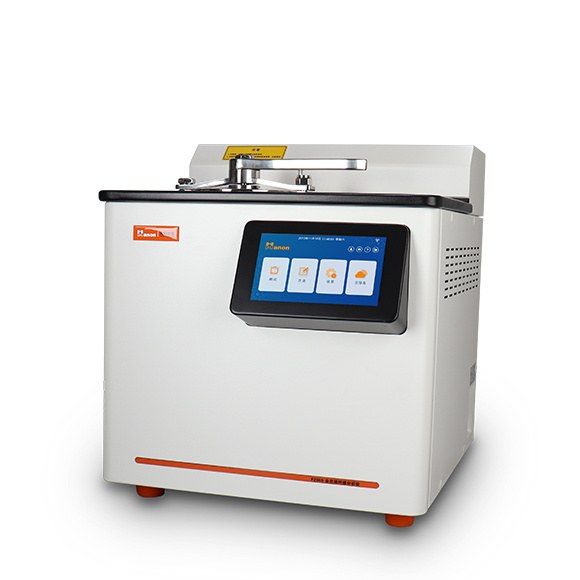
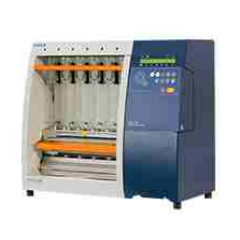
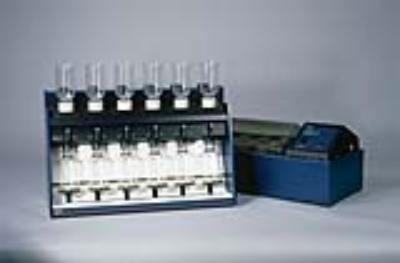
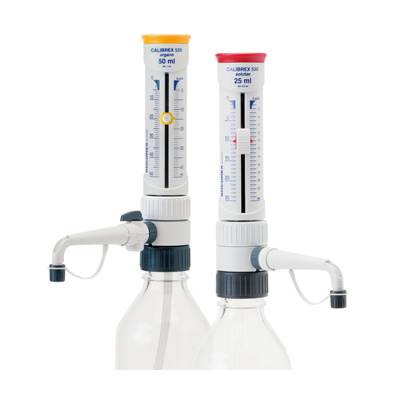
中国格哈特为您提供《黑水虻粉、黄粉虫粉以及非洲鲶鱼排泄物中蛋白质、脂肪、粗纤维、酸性洗涤纤维含量的检测》,该方案主要用于饲料中营养成分检测,参考标准--,《黑水虻粉、黄粉虫粉以及非洲鲶鱼排泄物中蛋白质、脂肪、粗纤维、酸性洗涤纤维含量的检测》用到的仪器有格哈特全自动超级总脂肪测定系统HT6+SOX416、格哈特凯氏消化系统KT8S、格哈特维克松废气实验室废物处理系统涤气VS、格哈特全自动型纤维分析仪FT12、格哈特全自动凯氏定氮仪VAPODEST 450、德国加液器MM、滤纸筒


相关方案
更多
该厂商其他方案
更多