


方案详情
文
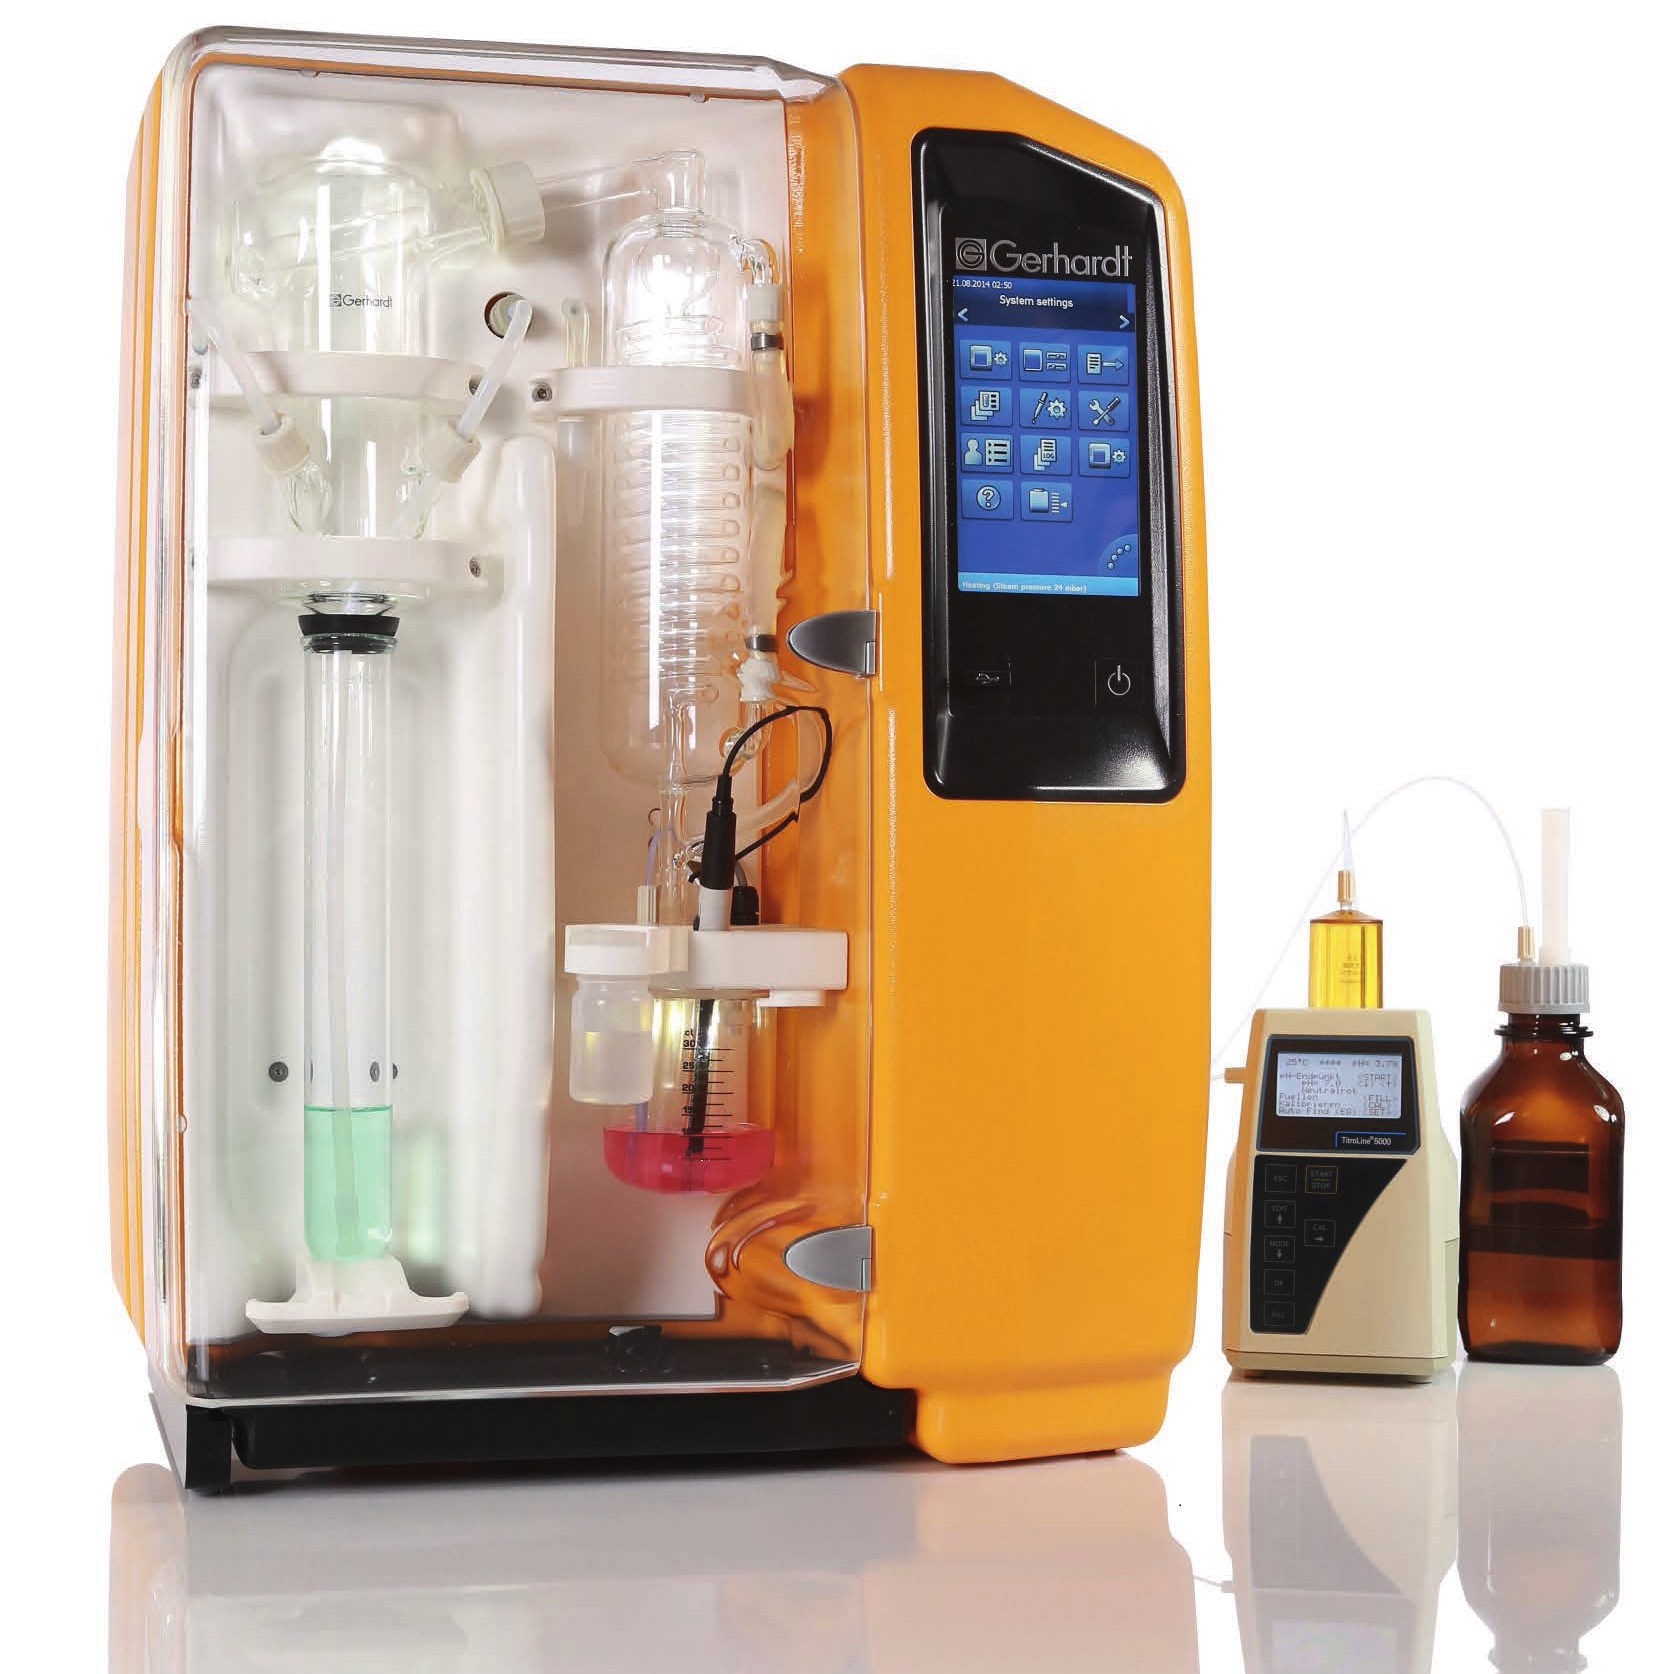
使用格哈特公司杜马斯燃烧法全自动蛋白质测定仪 杜马森DUMATHERM检测脱脂发酵浓缩乳制品的蛋白质含量
方案详情

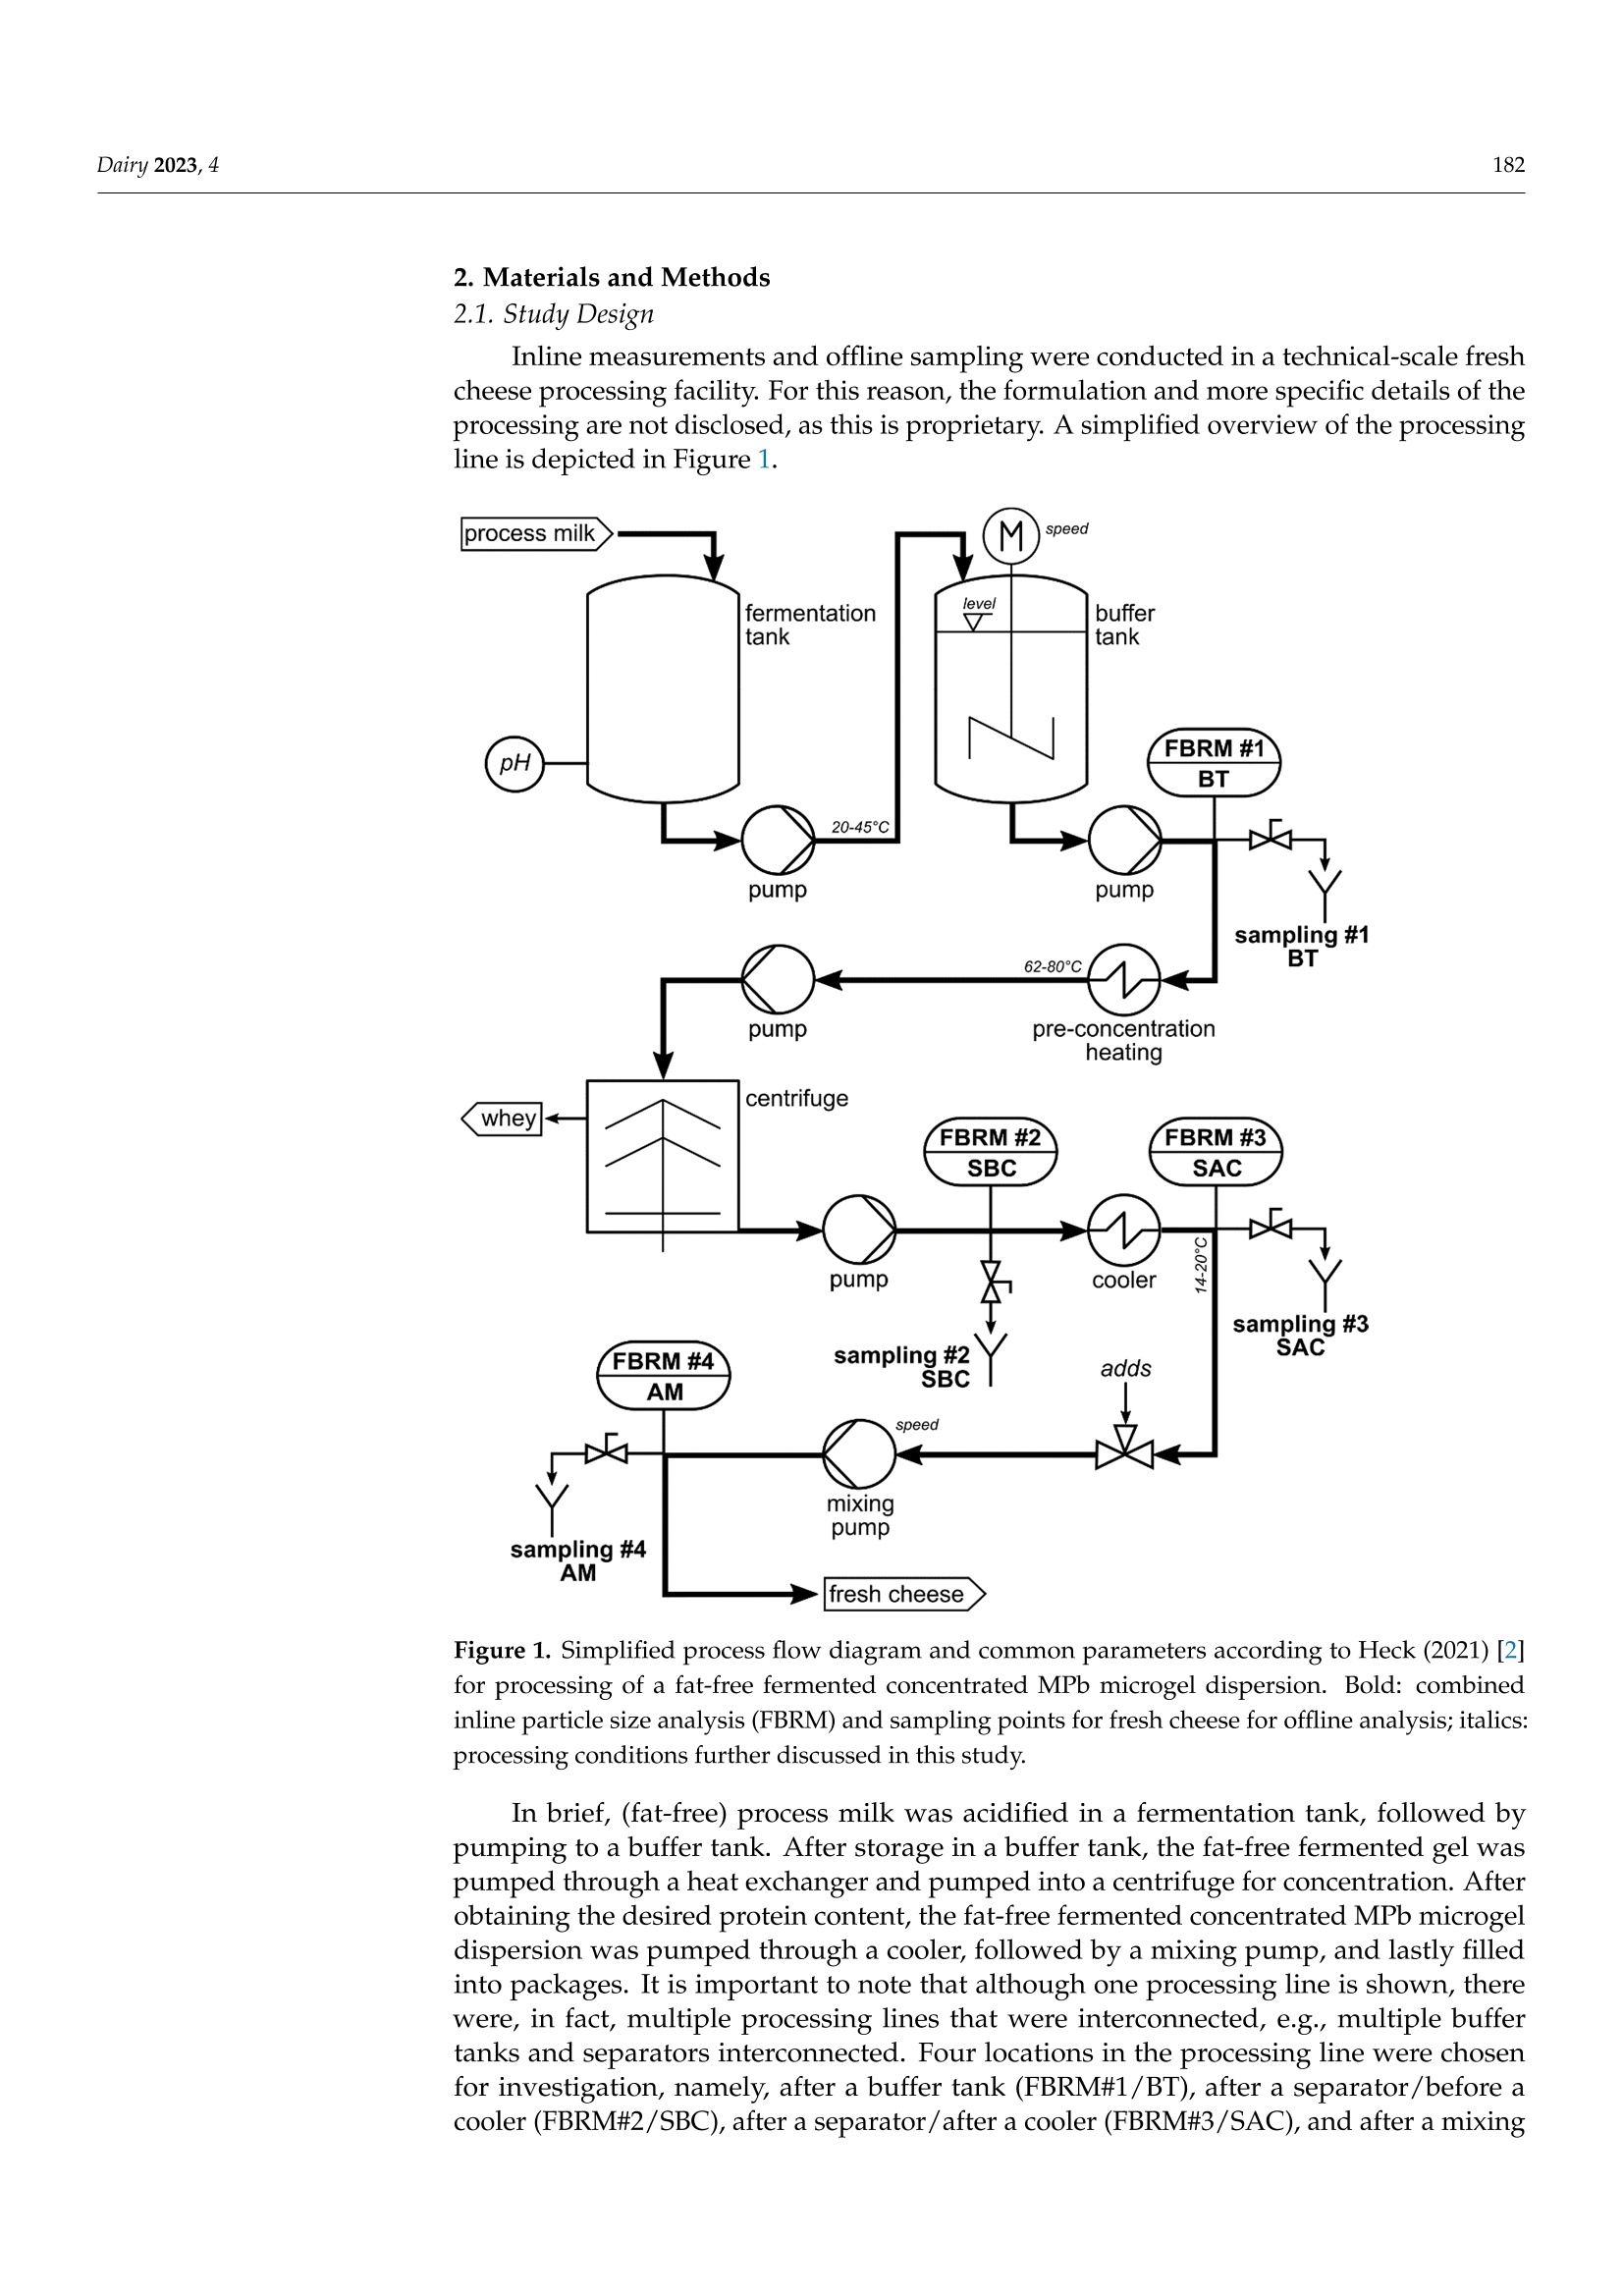
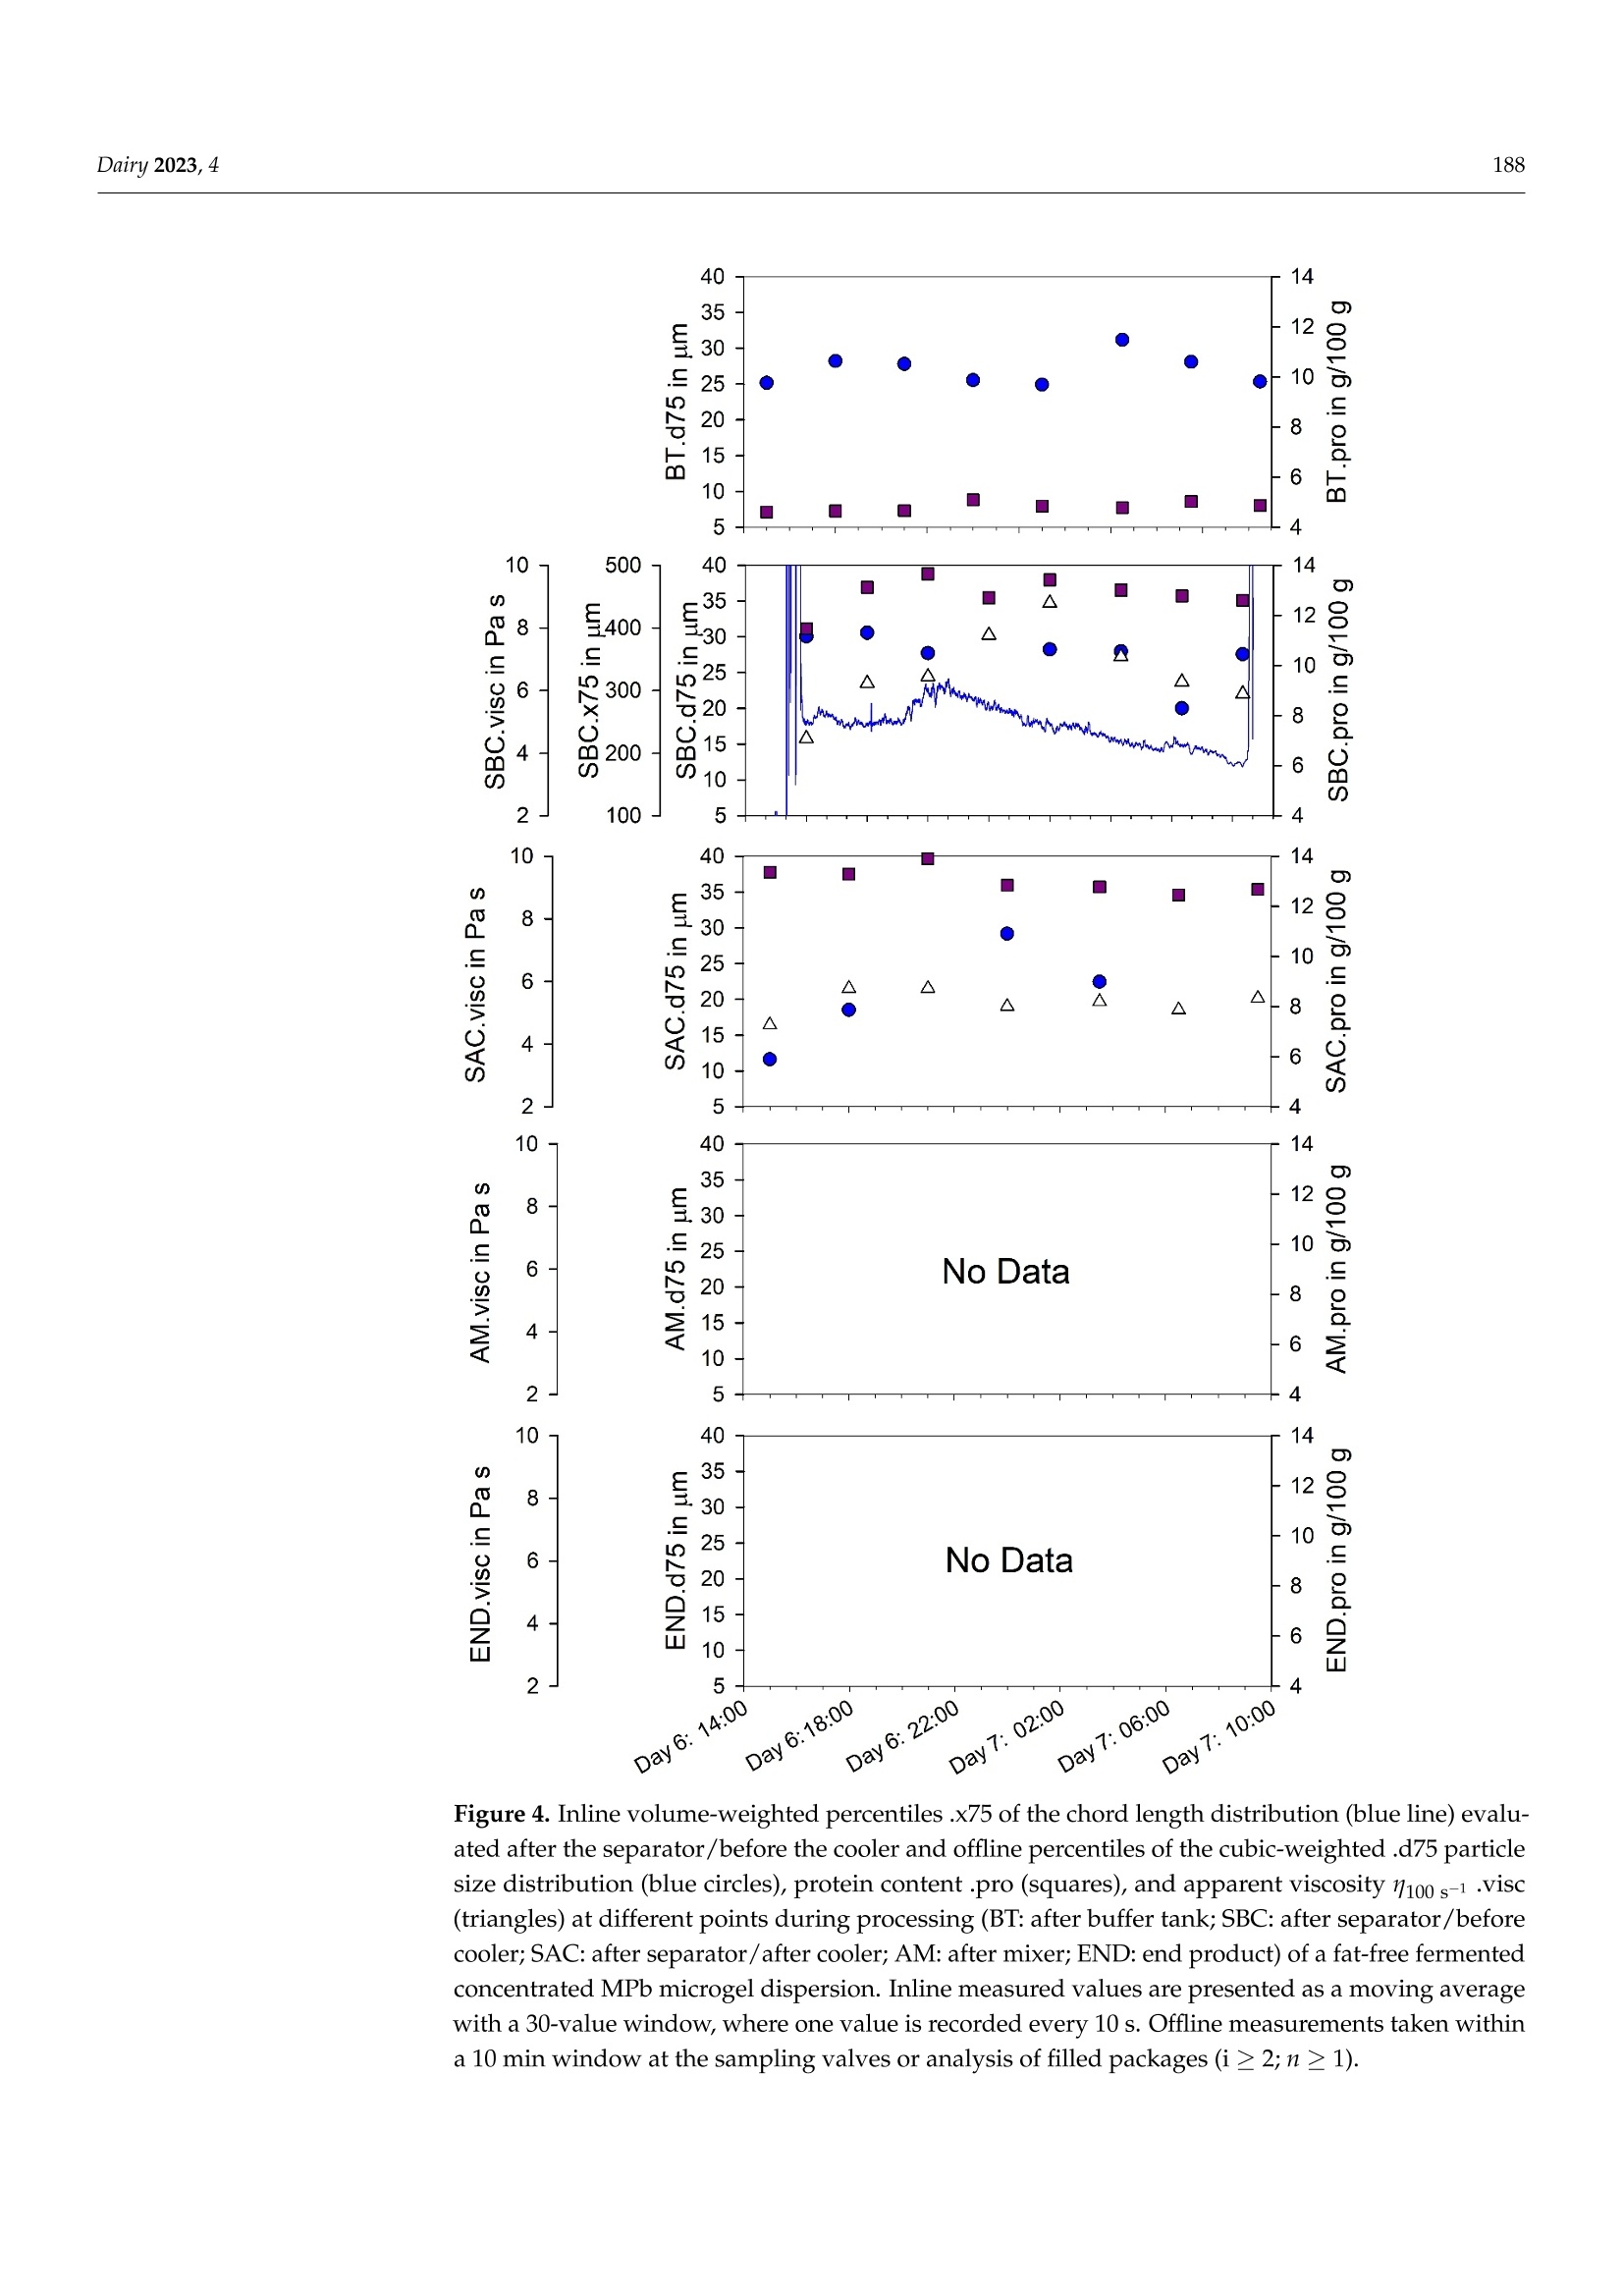
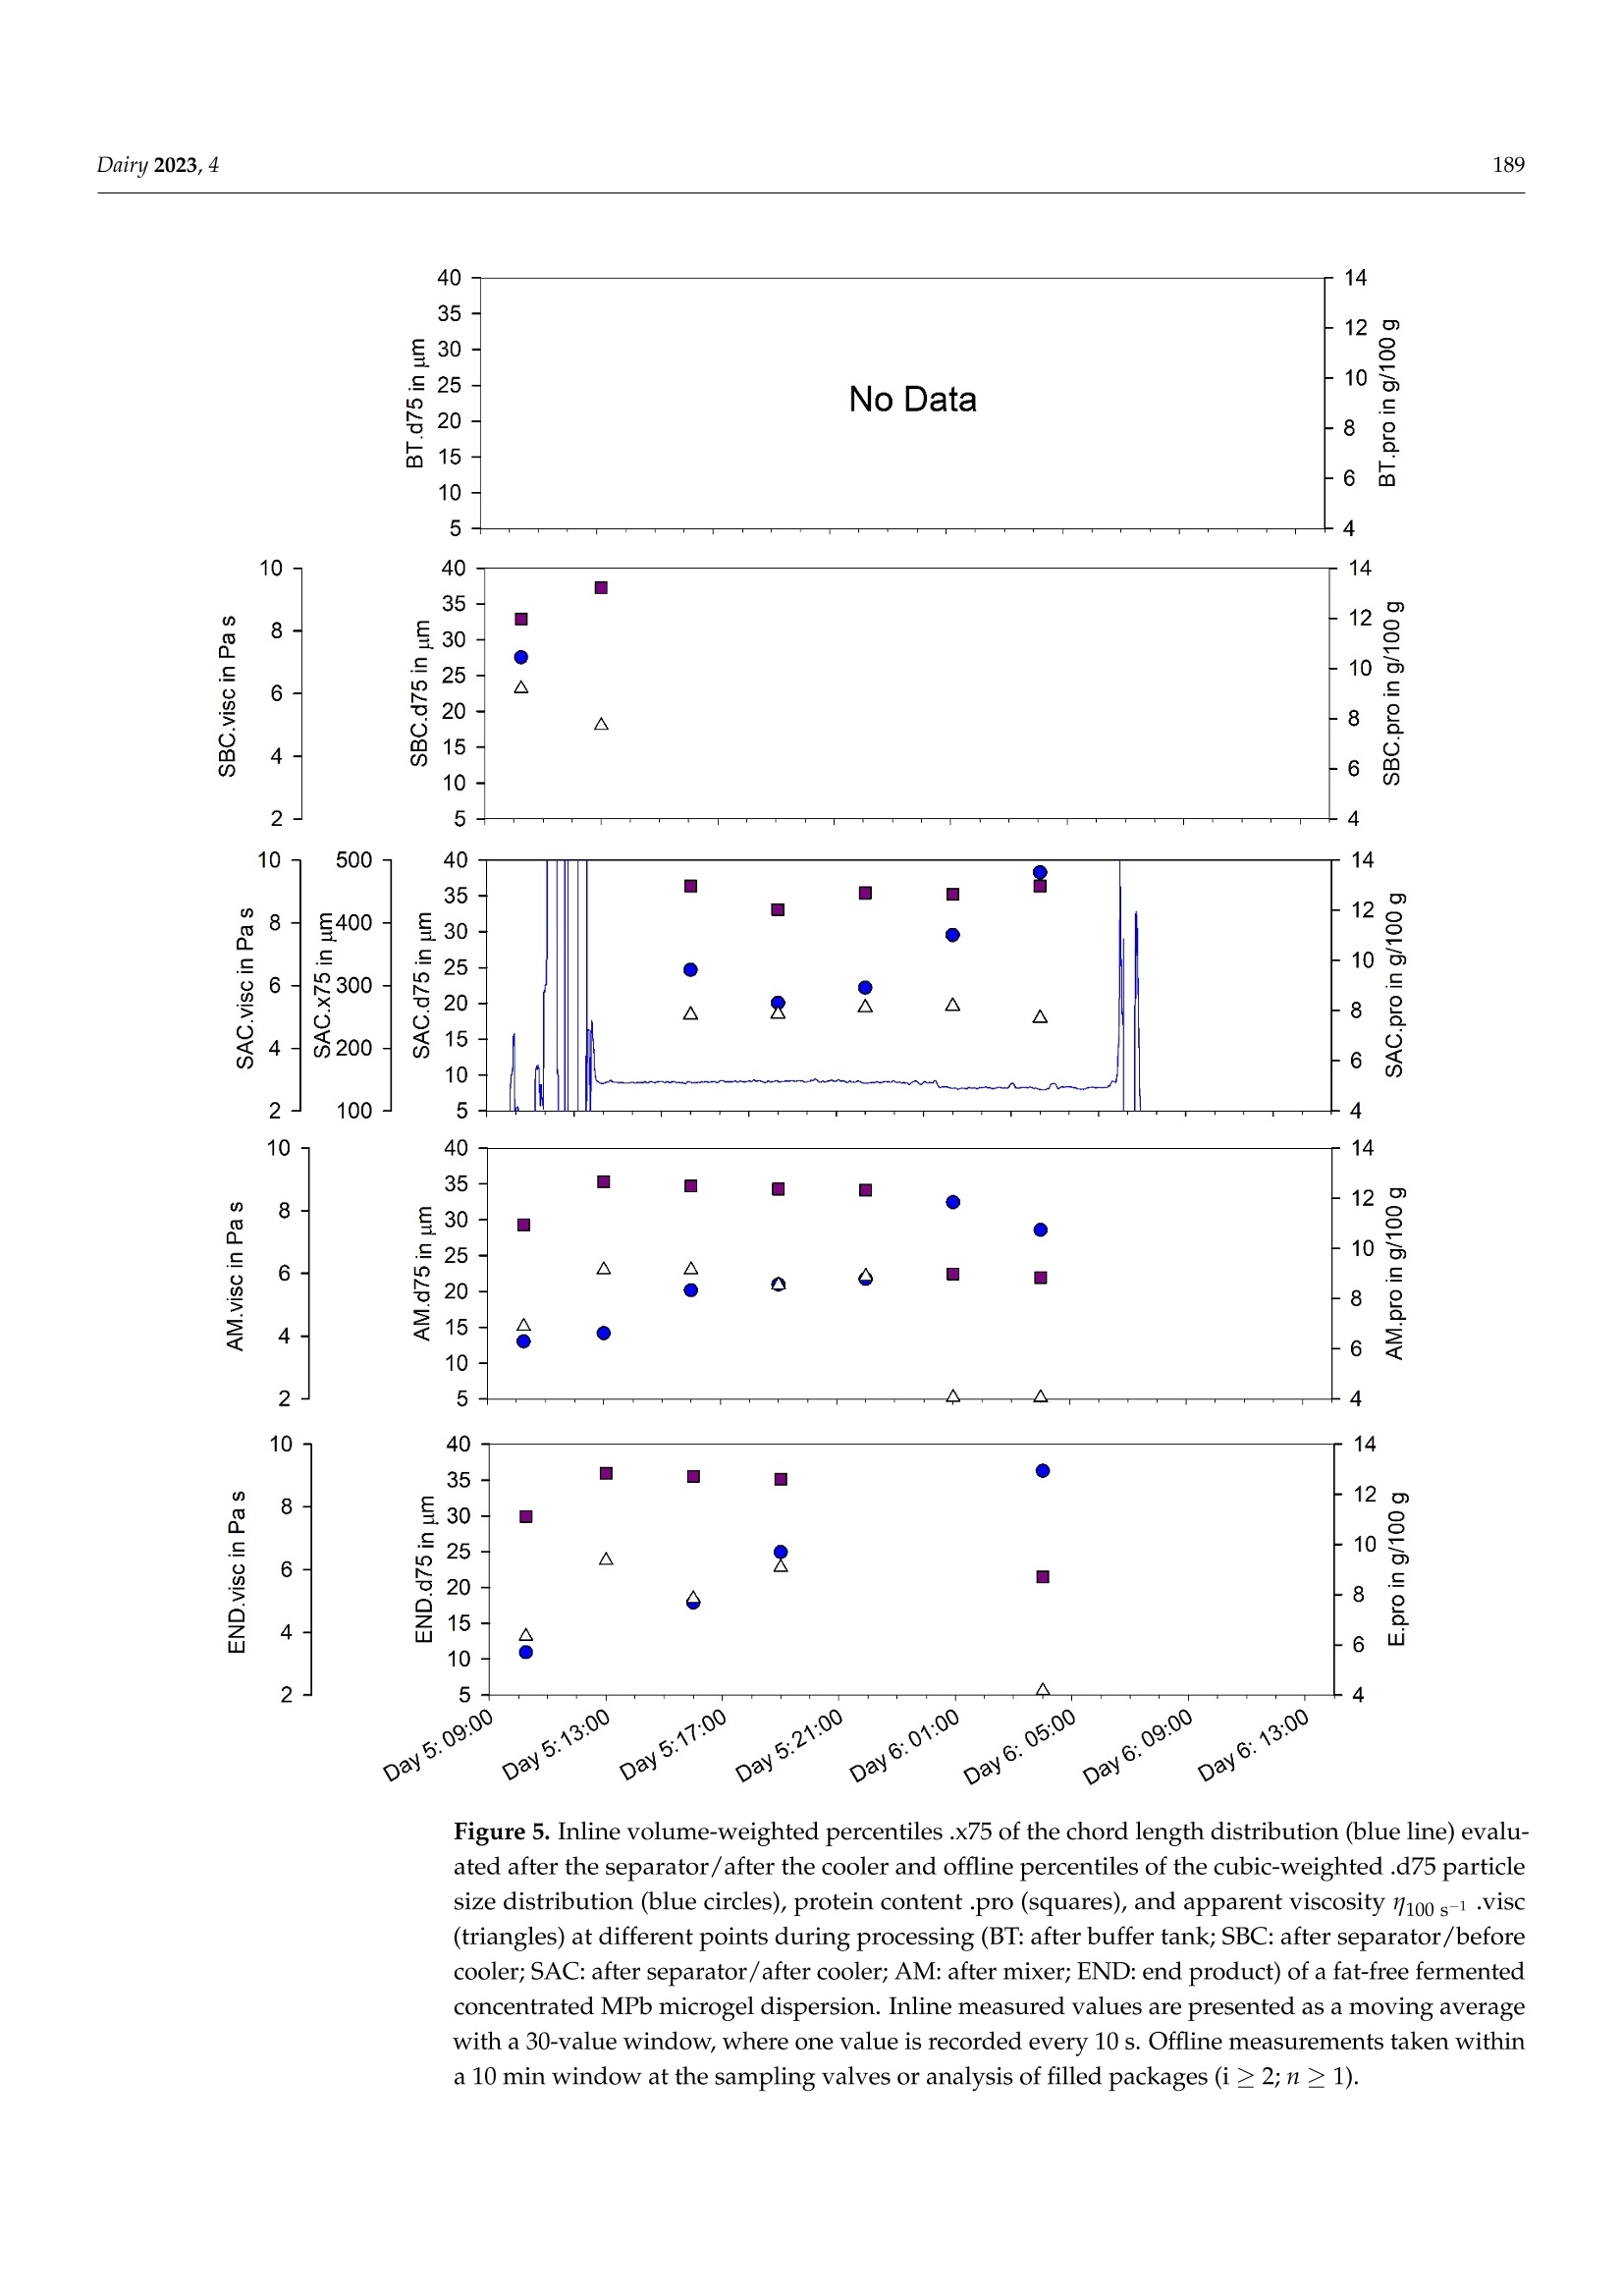
使用格哈特公司杜马斯燃烧法全自动蛋白质测定仪 杜马森DUMATHERM检测脱脂发酵浓缩乳制品的蛋白质含量dairyMDPI脱脂发酵浓缩乳制品的蛋白质含量检测 Dairy 2023, 4181 Article Inline Particle Size Analysis during Technical-Scale Processingof a Fermented Concentrated Milk Protein-Based MicrogelDispersion: Feasibility as a Process Control Anisa Heck *,tD, Stefan Nobel +D and Jorg Hinrichs Institute of Food Science and Biotechnology, University of Hohenheim, D-70593 Stuttgart, Germany * Correspondence: anisa.heck@zifornd.com; Tel.: +49-711-459-24208 + Current Address: Zifo Technologies GmbH,D-80798 Munich, Germany. 丰 Current Address: Department of Safety and Quality of Milk and Fish Products, Max Rubner-Institut,D-24103 Kiel, Germany. Abstract: Particle size is not only important for the sensory perception of fat-free fermented con-centrated milk products, but also for processing operations because of the direct relationship withapparent viscosity. The aim of this study was to apply inline particle size analysis using focusedbeam reflectance measurement (FBRM) to obtain real-time information regarding the particle size ofa fat-free fermented concentrated milk product, namely, fresh cheese. By comparing inline particlesize data to offline particle size, apparent viscosity, protein content and processing information, thepotential to use inline particle size analysis as a process monitoring and control option during freshcheese production was assessed. Evaluation of inline particle size after fermentation and beforefurther processing, e.g., after a buffering tank, shows promise as a means to control variance ofproduct entering downstream processing and, thus, improve final product consistency over time.Measurement of inline particle size directly before filling could allow for precise control of final prod-uct characteristics by the use of mechanical or mixing devices placed before the inline measurement.However, attention should be given to the requirements of the inline measurement technology foraccurate measurement, such as product flow rate and pressure. Keywords: microgel dispersion; chord length; fermented dairy; rheology; process control 1. Introduction Academic Editor: Vincenzina Fusco Received: 19 December 2022 Revised: 13 February 2023 Accepted: 18 February 2023 Fat-free fermented concentrated milk products, such as fresh cheese, quark and high-protein yoghurt, have similar structures [1]. The basic structure is composed of proteinaggregates containing large amounts of serum and can thereby be referred to as fat-freefermented concentrated milk protein-based (MPb) microgel particles [2]. Microgel particlescan swell or shrink in response to changes in environmental and serum conditions, e.g·mechanical input and temperature, which results in gain or loss of serum from the microgelparticles 3,4]. Published: 21 February 2023 The main step in the processing of fat-free fermented concentrated MPb microgeldispersions is fermentation, where a gel network is formed by the aggregation of milkproteins, mainly caseins [5]. Upon stirring and pumping, the (macro)gel network is brokendown into smaller (micro)gel particles, which are suspended in the dispersion medium.Additional steps, such as heat treatments and concentration steps, may be carried outupstream or downstream from fermentation. Modifying the parameters at each stage ofprocessing alters the micro- and macrostructure, which is directly related to the texture [2]. Copyright: @ 2023 by the authors.Licensee MDPI, Basel, Switzerland.This article is an open access articledistributed under the terms andconditions of the Creative CommonsAttribution (CC BY) license (https://creativecommons.org/licenses/by/4.0/) The texture of fat-free fermented concentrated MPb microgel dispersions should becreamy, smooth, free of lumps and grainy particles, and have no apparent syneresis [2,6].More specifically, particle size is a main factor that affects the sensory perception of fer-mented milk products [7]. Previously, a threshold of 40 um (volume-weighted diameter d(75,3) evaluated using static light scattering (SLS)) was defined for the in-mouth graini-ness of fresh cheese [8]. Furthermore, particle size is important for processing operationsbecause of the direct relationship with rheological parameters, e.g., apparent viscosity [4]. The relationships that upstream, fermentation and downstream processing parametershave with particle size in fat-free fermented concentrated MPb microgel dispersions haverecently been reviewed [2]. Downstream processing parameters are of particular interest,since microgel particle aggregation and breakdown can be tailored based on the appliedconditions, such as tempering [8,9] and mechanical treatments [10-13], in order to controlrheological properties. However, how specific processes alter particle size in technical-scaleenvironments is not well understood, since process-structure-function relationships drawnfrom lab- and pilot-scale experiments cannot easily be transferred. Thus, knowledge ofparticle size at different stages during technical-scale processing, i.e., "live" and at finalscale, would be advantageous to be able to adjust both the aggregation of microgel particlesand the breakup of aggregated particle clusters during processing and to tailor final productproperties. To obtain a more accurate representation of the particle size at different stages duringprocessing, inline particle size analysis may be a beneficial tool. Inline usually meansthat a sampler, disperser, and/or sensor are mounted in the processing line. Hence,major advantages of inline analysis are, e.g.,real-time analysis and subsequent correctiveactions, non-invasive and continuous measuring, higher product quality within narrowerspecification limits, and decreased product losses [18,19]. A number of techniques can be used to evaluate particle size inline, e.g., focused beamreflectance measurement (FBRM) and 3-fold dynamical optical reflectance measurement(3D ORM) [16,20,21]. Both techniques employ a laser that focuses on one circular path in thesample. The raw measurement signal data consists of pulse durations of reflected laser lightas the laser rotates at constant speed, after which these distances are converted to particlesize and reported as chord length. With this technique, it is possible to evaluate sampleswith high solid concentrations [17]. FBRM has been applied successfully to yoghurt in orderto evaluate particle size inline [20]. Additionally, 3D ORM has been effectively used toanalyze inline particle size of fresh cheese, where results correlated well (R2=0.8250) withoffline (SLS) particle size [16]. To our knowledge, there has been no study investigating theuse of inline particle size during the processing of fat-free fermented concentrated MPbmicrogel dispersions at the technical scale. The aim of this study was to evaluate particle size inline at different stages during theprocessing of a fat-free fermented concentrated MPb microgel dispersion, namely, freshcheese. Inline particle size analysis using FBRM was adapted to a technical-scale processingenvironment and compared with offline particle size analysis (SLS). The relationshipsbetween processes, inline and offline particle size, rheology, and protein content wereexamined to assess the potential of inline particle size analysis as a process monitoring andcontrol tool. 2. Materials and Methods 2.1. Study Design Inline measurements and offline sampling were conducted in a technical-scale freshcheese processing facility. For this reason, the formulation and more specific details of theprocessing are not disclosed, as this is proprietary. A simplified overview of the processingline is depicted in Figure 1. Figure 1. Simplified process flow diagram and common parameters according to Heck (2021) [2]for processing of a fat-free fermented concentrated MPb microgel dispersion. Bold: combinedinline particle size analysis (FBRM) and sampling points for fresh cheese for offline analysis; italics:processing conditions further discussed in this study. In brief, (fat-free) process milk was acidified in a fermentation tank, followed bypumping to a buffer tank. After storage in a buffer tank, the fat-free fermented gel waspumped through a heat exchanger and pumped into a centrifuge for concentration. Afterobtaining the desired protein content, the fat-free fermented concentrated MPb microgeldispersion was pumped through a cooler, followed by a mixing pump, and lastly filledinto packages. It is important to note that although one processing line is shown, therewere, in fact, multiple processing lines that were interconnected, e.g., multiple buffertanks and separators interconnected. Four locations in the processing line were chosenfor investigation, namely, after a buffer tank (FBRM#1/BT), after a separator/before acooler (FBRM#2/SBC), after a separator/after a cooler (FBRM#3/SAC),and after a mixing pump/before a filler (FBRM#4/AM). These are referred to in the text as: (1) after the buffertank (BT); (2) after the separator/before the cooler (SBC); (3) after the separator/ after thecooler (SAC); and (4) after the mixer (AM). Offline samples were taken from the productstream via sampling valves built into the processing line at the same locations. Sampleswere cooled (6°C) until further analysis. Preliminary work showed that storage timesbetween 6 days and 7 weeks did not impact results. Therefore, all analyses were conductedbetween 6 and 18 days of storage. An additional offline sample type was defined as the endproduct (END), where two packages of the final product were stored at 6°C until furtheranalysis. Sampling for offline evaluation was performed at intervals between 3 and 6 h.Since the offline sampling valves were at various physical locations within the processingfacility, a tolerance of +10 min was given for manual sample collection. For example, ifoffline sampling was conducted at 4:00, all offline samples were collected between 4:00 and4:10. Protein content (Section 2.5), offline particle size (Section 2.3), and apparent viscosity(Section 2.4) were determined for the offline samples. Since only one FBRM probe wasavailable for this study, inline measurements at each location were collected at differentabsolute times. Therefore, the inline particle size data cannot be directly compared betweeninline measurement locations. Furthermore, since this study was conducted during realprocessing in a technical-scale environment, several factors were out of our control. Forexample, offline samples at all four sampling valves could not always be taken at eachsampling time, since cleaning at that sample valve location or processing at a differentprocessing line was being carried out. Information on the processing conditions listed below was kindly provided by thefresh cheese processor from the production protocol in order to facilitate drawing conclu-sions between processing, inline and offline particle size, protein content, and apparentviscosity. For the time frame of the experiment, details regarding fermentation (time andfinal pH), buffer tank (batch numbers, fill level in the buffer tank, whether the materialin the buffer tank was being stirred quickly, slowly, or not at all), separator (bowl speed),and mixing pump (when material was being mixed in at this pump and the speed of themixing) were shared by the fresh cheese producer. 2.2. Inline Particle Size Measurement 2.2.1. Measuring System The particle size distributions of fresh cheese were measured inline using FBRMtechnology. A detailed explanation of the measuring principle, data acquisition, andnumerical calculation of microgel particles is found in the literature [20]. In short, a laserfocuses on the sample in a circular path a few micrometers in front of the measurementwindow at the end of the FBRM probe. When the focal point encounters a particle, thelaser light is reflected back and collected in the probe. Hence, the measurement raw signalconsists of pulse length distributions caused by different sized reflectors. Unlike laserscattering and diffraction, reflectance intensity or angle will not be considered. Since thefocal point of the laser rotates through the measurement window in a circle at 2 m/s, muchfaster than the speed of the particles passing by the measurement window, particles areregarded as stationary in relation to the focal point. From the time of reflection on theparticle and the speed of the rotating laser, the chord length is obtained as a measure ofparticle size, and each measured particle is counted. With a sufficient number of particles,the so-called chord length distribution is obtained. The chord length distribution is initiallynumber-weighted. The distribution can be converted to other weighting, e.g., volume, byassuming a spherical particle shape [20]. It should be noted that the evaluated length is notnecessarily the particle diameter, a spherical shape is assumed, and all reflective particlesare measured, independent of particle properties, e.g., refractive index [16]. 2.2.2. Adaptation for Technical-Scale Process Line Since the FBRM probe of the measuring instrument (ParticleTrack G600B, 19 mmdiameter sensor; Mettler Toledo, Columbus, OH, USA) is typically used for laboratory- scale experiments, where it is immersed in beakers or tanks, it was necessary to design:(i) a mobile measurement setup; and (ii) an adapter in order to install the probe into thepipelines of the technical-scale processing line (Figure 2). In addition to the FBRM probe(cable length = 15 m), the mobile measurement setup consists of a mobile trolley with alaptop tray. When designing the probe adapter, it was important to install the probe at anangle of 15-60° to avoid product accumulation and fouling at the measurement window(communication with Mettler Toledo). Clean-in-place and sterilize-in-place-compliant,pressure-resistant Ingold weld-in adapters (bbi/biotech GmbH, Berlin, Germany) wereprocured and modified for use in the processing line. These adapters can be used toinstall the FBRM probe in processing lines with flowing media at pressures of up to1 MPa (corresponding to the maximum permissible pressure of the probe). Adapters, withaccompanying sampling valves kindly provided by the fresh cheese producer, were builtinto the processing line at each measuring location before the start of the experiment. Figure 2. Mobile measurement setup for (a) the ParticleTrack G600B FBRM measuring device and acable length/distance from the control box of ≤15 m;(b) an Ingold weld-in spigot with a mountingangle of 15° (relative to the pipe); and (c) an adapter set consisting of an Ingold insert (DN 25) madeup of a spacer with screw fitting and seals. Before each set of inline particle size measurements, the probe was cleaned thoroughlywith ethanol and distilled water until the total counts (total measured number of particles)in air measured less than 300 counts per 10 s. The probe was built into the processing linevia the adapter during a cleaning and sanitizing cycle at the inline measurement location.Inline measurements were initiated and continued until the next cleaning and sanitizingcycle at that inline measurement location, at which point the probe was removed andinserted at the next measurement location. 2.2.3. Data Acquisition The iC FBRM Software V3 (Mettler Toledo, Columbus, OH, USA) was used to collect allFBRM data. Data were collected at 10 s intervals with the stuck particle correction functionturned on. This function removes the data being collected from particles that appear withthe same size at the same position on the lens in two consecutive measurements, with amaximum of 10% of the total particles. The particle sizes were calculated in MACRO mode,meaning that there was low sensitivity to slight disturbances in the detected signal (asopposed to PRIMARY mode, where there is high sensitivity to signal disturbances). Forexample, loosely aggregated particles would be observed as one larger particle in MACROmode, whereas in PRIMARY mode, the loose aggregates would instead be observed asmany smaller particles very close together. The collected particle sizes were converted tocube-weighted size distributions. Data smoothing was performed by calculating a movingaverage with a window of 30 data points as outlined in Section 3. Representative cube-weighted inline particle sizes (chord lengths) of .x10, .x50, .x75, and .x90 were collected,representing the cube-weighted percentiles, e.g.,x10 is the 10th percentile of the cube-weighted chord length. The span (xspan) was calculated as .x90 minus .x10. For the purposeof comparison, inline particle size values at the same time points as offline sampling wereevaluated, e.g., at 1 h. Since inline measurements are relatively fast (1 data point every10 s) compared to taking offline samples (hourly), the recorded data was averaged for twoseparate minutes for comparison with offline data. A first data point was calculated byaveraging the data points collected during the first minute that offline data were collected.A second data point was calculated for the fifth minute, also averaging the data recordedfor a complete minute. For example, for an offline particle size sample collected at hour 5,inline data points for 5:01 and 5:05 were calculated. 2.3. Offline Particle Size Measurement SLS was used to evaluate the particle size of the offline samples. In this technique, alaser beam is directed through the sample. As the laser beam passes through the sample,the angular change of the scattered laser beam is used to calculate the size of the parti-cles responsible for generating the scattering pattern. The particle sizes are given as thevolume-equivalent sphere diameter, from which the particle size distribution is calculated.Representative particle sizes of .d10,.d50,.d75, and .d90 were evaluated, representingthe volume-weighted percentiles containing 10%,50%, 75% and 90%, respectively, of allparticles being smaller than this size. The span (dspan) was calculated as .d90 minus .d10. A Beckman Coulter LS 13 320, connected to a Universal Liquid Module and controlsoftware v6.01 (Beckman Coulter Inc., Miami, FL, USA) was used to analyze the particlesize as described by Heck et al.[15]. The imaginary refractive indices (RI) for particles andwater were fixed at 0.00, since they are white or transparent materials [22]. The real RI ofthe particles and water were set at 1.57 and 1.33, respectively. Particle size analysis was conducted in duplicate for each offline sample. 2.4. Rheological Characterization A stress-controlled rheometer AR 2000 (minimum torque: 9.1 nMm; TA InstrumentsInc., Eschborn, Germany) with a concentric cylinder cup and bob system (stator innerradius = 15.0 mm, rotor outer radius = 14.0 mm) was used to evaluate flow curves of thesamples using the procedure described by Fysun et al. [23]. In brief,each sample was stirredgently for 15 to 20 s with a plastic spoon before the measurement. A sample weighing 16 to17 g was added to the cup, followed by equilibration at 10 ℃ for 7 min. Then, the shearrate was increased from y=0.001 to 1000 1/s over a period of 8 min with ten points perdecade. The apparent viscosity at a shear rate of 100 s-(1100s-1), found to correlate within-mouth viscosity [24], was extracted from the flow curve. Each sample was measured induplicate. 2.5. Protein Analysis The protein content of each offline sample was evaluated using the method of Dumas(IDF 185) using a nitrogen analyzer (Dumatherm DT; C. Gerhardt GmbH & Co. KG,Konigswinter, Germany). The total nitrogen content was multiplied by a conversion factorof 6.38 to calculate the protein content. Samples were analyzed in triplicate. 2.6. Statistical Analysis For inline and offline particle size, viscosity, and protein content, the statistics aregiven in combination with a measurement location abbreviation and the measurementabbreviation, e.g., for the buffer tank, the abbreviations would be BT.x75, BT.d75, BT.viscand BT.pro, respectively. Arithmetic means and standard deviations for the evaluatedparameters are presented in Section 3. To investigate the relationships between inline particle size, offline particle size, proteincontent, and apparent viscosity, Pearson correlation coefficients were calculated. p-valuesof ≤0.10 indicate significant correlations. All statistical analyses were performed usingSigmaPlot 12.5 (Systat Software Inc., San Jose, CA, USA). 3. Results and Discussion 3.1. Technical Considerations Figures 3-6 show the inline .x75 and offline .d75 particle size, protein, and apparentviscosity 1100 s-1 data collected at all measurement locations. Inline .x75 and offline .d75particle size were selected as representative particle size statistics, since Pearson correlationcoefficients between the x(chord length) and d(particle diameter) for the 10th, 50th, 75thand 90th percentiles and span at each measurement location were the highest for inline .x75and offline .d75 (BT: R=0.78, p<0.001; SBC: R= 0.41,p=0.12; SAC:R=-0.88,p=0.001;AM R= 0.54, p=0.003). It is noted that no correlation coefficients for the measurementlocation SBC were significant (p >0.10). Figures 3-6 display the inline .x75 particle size data collected at a specific inlinemeasurement location, along with the offline data collected at the same time for all offlinesampling locations. As mentioned in Section 2, data for each offline sampling time arenot available for all the time ranges for which inline data were collected. For example, inFigure 4, no samples are shown for AM or END, because this part of the processing linewas not in use at this time. Collection of inline particle size data began after insertion of theprobe into the processing line during the cleaning process. Data collection proceeded untilremoval of the probe during the next cleaning cycle. As such, some cleaning cycles can beobserved in Figures 3-6, where particle sizes appear to increase dramatically. In fact, theselarge and fast increases of inline particle size are artifacts and do not represent real"product"inline particle sizes (Figure 3: Day 5, 5:00-9:00; Figure 4: Day 6, 15:30-16:00 and Day 7,08:00-10:00; Figure 5: Day 5, 09:00-12:45 and Day 6, 05:30-06:30). There are two things toconsider about the material flowing past the FBRM measurement window from the startof the cleaning and sanitization cycle until the next product flows through the processingline. First, the material is of a different composition, e.g., decreasing protein content asproduct is removed from the pipeline; second, the speed of flow past the measurementwindow of the FBRM probe is variable and is even set at zero at some points in time. Thesefactors result in high variability between the collected inline particle size data points. Mostimportantly, (very) low flow rates result in apparent particle sizes far larger than presentin the processing line, since multiple particles are evaluated as one larger particle by therotating FBRM laser and could not be omitted by digital signal processing. Those artifactsshould be excluded from further data processing for control purposes. Figure 3. Inline volume-weighted percentiles .x75 of the chord length distribution (blue line) evalu-ated after the buffer tank and offline percentiles of the cubic-weighted .d75 particle size distribution(blue circles), protein content .pro (squares), and apparent viscosity 1100 s-1.visc (triangles) at differ-ent points during processing (BT: after buffer tank; SBC: after separator/before cooler; SAC: afterseparator/after cooler; AM: after mixer; END: end product) of a fat-free fermented concentratedMPb microgel dispersion. Inline measured values are presented as a moving average with a 30-valuewindow, where one value is recorded every 10 s. Offline measurements taken within a 10 min windowat the sampling valves or analysis of filled packages (i ≥ 2; n ≥ 1). Figure 4. Inline volume-weighted percentiles .x75 of the chord length distribution (blue line) evalu-ated after the separator/before the cooler and offline percentiles of the cubic-weighted .d75 particlesize distribution (blue circles), protein content .pro (squares), and apparent viscosity 1100 s-1 .visc(triangles) at different points during processing (BT: after buffer tank; SBC: after separator/beforecooler; SAC: after separator/after cooler; AM: after mixer; END: end product) of a fat-free fermentedconcentrated MPb microgel dispersion. Inline measured values are presented as a moving averagewith a 30-value window, where one value is recorded every 10 s. Offline measurements taken withina 10 min window at the sampling valves or analysis of filled packages (i ≥ 2; n之1). Figure 5. Inline volume-weighted percentiles .x75 of the chord length distribution (blue line) evalu-ated after the separator/after the cooler and offline percentiles of the cubic-weighted .d75 particlesize distribution (blue circles), protein content .pro (squares), and apparent viscosity 1100 s-1 .visc(triangles) at different points during processing (BT: after buffer tank; SBC: after separator/beforecooler; SAC: after separator/after cooler; AM: after mixer; END: end product) of a fat-free fermentedconcentrated MPb microgel dispersion. Inline measured values are presented as a moving averagewith a 30-value window, where one value is recorded every 10 s. Offline measurements taken withina 10 min window at the sampling valves or analysis of filled packages (i 22; n> 1). Figure 6. Inline volume-weighted percentiles .x75 of the chord length distribution (blue line) evalu-ated after the mixer and offline percentiles of the cubic-weighted .d75 particle size distribution (bluecircles), protein content .pro (squares), and apparent viscosity 1100 s-1.visc (triangles) at differentpoints during processing (BT: after buffer tank; SBC: after separator/before cooler; SAC: after sepa-rator/after cooler; AM: after mixer; END: end product) of a fat-free fermented concentrated MPbmicrogel dispersion. Inline measured values are presented as a moving average with a 30-valuewindow, where one value is recorded every 10 s. Offline measurements taken within a 10 min windowat the sampling valves or analysis of filled packages (i ≥ 2; n ≥ 1). There are both advantages and disadvantages of the individual measuring locationswith respect to the relationships between inline and offline data, as well as the relationshipbetween the analytical result and actual product characteristics. Both aspects must beconsidered when evaluating the measuring locations and the potential of inline particlesize analysis as a process monitoring tool during the production of fresh cheese. 3.2. Evaluating Measurement Locations in the Processing Line 3.2.1. After Fermentation, before Concentration: After Buffer Tank (BT) The first location in the processing line where we evaluated inline and offline prod-uct characteristics was the point after fermentation and before separation, namely, aftera BT and before further processing, e.g., heating and concentration via separator. Theparticle size at this stage of processing is largely dependent on the upstream and fer-mentation parameters [2]. For example, the particle size directly after fermentation isinfluenced by any added components (e.g., increased protein content), upstream milk heat-ing time/temperature, and the fermentation time/temperature. Additionally, downstreammechanical energy input such as the unavoidable/inevitable pipe flow or any intendedshearing is a significant factor affecting particle size and rheological characteristics of stirredfermented milk products [13],e.g., breaking up the gel after fermentation. Properties ofthe raw material tend to be measurable in the final product, while the influences of theprocessing parameters can be reduced or eliminated by further downstream processingof the fat-free fermented concentrated MPb microgel dispersion. This could be a suitableplace for inline measurement of particle size and process control when different productsare made or when fermentation and successive agitation (i.e., stirring after fermentation)times vary during and between productions (feed forward control). In Figure 3, the BT.x75 values are displayed. The offline particle size, protein content,and apparent viscosity are also shown for the same absolute time frame at all measurementlocations. BT.x75 values ranged between 175 and 250 um before cleaning began at 20 h,while BT.d75 values ranged between 17 and 30 um (Figure 3). The particle size was slightlylarger directly after concentration when evaluated inline (SBC.x75=175-320 um), whereasoffline particle size (SBC.d75=20-31 um) was comparable to measurements after the buffertank (Figures 3 and 4). After concentration, particle size tended to reduce with addedprocessing steps (Figures 3-6). This is in line with previous observations on the impact ofmechanical input during downstream processing on the characteristics of fermented milkproducts [13]. n.s. 一 n.s. n.s. n.s. 一 n.s. n.s. n.s. 一 0.78 n.s. n.s. n.s. n.s. n.s. 一 n.s. n.s. n.s. n.s. n.s. n.s. 0.05 0.15 一 n.s. n.s. n.s. 一 n.s. n.s. n.s. n.s. n.s. n.s. n.s. n.s. n.s. 一 -0.06 -一 n.s. n.s. n.s. 一 n.s. n.s. 一 一 一 一 一 一 一 0.22 0.06 0.28 0.41 n.s. n.s. n.s. n.s. n.s. n.s. n.s. n.s. n.s. n.s. 0.47 0.20 0.04 0.17 0.15 一 n.s. n.s. n.s. n.s. n.s. n.s. n.s. n.s. n.s. n.s. 0.49 0.20 0.33 0.34 0.28 0.57 一 n.s. n.s. n.s. n.s. n.s. n.s. n.s. n.s. n.s. 一 一 一 一 一 一 一 n.s. 一 n.s. 0.25 -0.18 -0.01 -0.49 -0.01 0.16 0.21 -0.88 n.s. n.s. -0.29 0.26 0.00 0.32 -0.09 0.14 -0.10 0.07 0.09 n.s. n.s. n.s. n.s. n.s. n.s. n.s. 0.07 0.44 0.39 0.70 0.38 0.27 0.39 -0.22 -0.06 0.24 n.s. n.s. n.s. n.s. n.s. n.s. n.s. 一 0.04 -0.49 一 -0.31 0.38 0.25 0.69 0.11 0.11 n.s. n.s. n.s. 一 一 一 -0.57 -0.34 0.00 一 0.27 0.03 -0.14 -0.87 0.40 -0.01 0.12 0.54 n.s. n.s. n.s. -0.78 -0.23 0.19 一 0.18 0.02 -0.11 0.95 -0.23 0.21 -0.08 0.32 -0.11 n.s. -0.84 -0.37 0.07 一 0.05 -0.10 -0.18 0.98 -0.38 0.14 -0.08 -0.25 -0.34 0.85 -0.78 -0.49 0.63 一 0.18 0.07 0.19 -0.74 0.60 -0.29 0.08 一 0.72 -0.31 -0.45 n.s. -0.85 -0.78 0.13 一 0.04 -0.11 0.07 0.99 -0.83 0.22 -0.36 一 0.01 0.83 0.83 -0.26 -0.79 -0.63 -0.15 一 0.10 -0.44 -0.15 0.96 -0.84 0.22 -0.18 一 -0.25 0.86 0.92 -0.53 0.82 Figure 7. Correlation matrix of all measurement locations (BT, SBC, SAC, END) and variables’inline particle size (.x75), offline particle size (.d75), viscosity (.visc), and protein content (.pro);right-hand side: circle plot of correlations after striking insignificant values (n.s.; p > 0.05), areaof circles corresponds to the value of the coefficient with either negative (red) or positive impact(blue); left-hand side: complete set of Pearson coefficients of correlation determined by pairwiselinear regression; dash: no correlation and significance calculated from less than four complete datapairs; bold face: correlations with inline measured volume-weighted percentiles (.x75) of the chordlength distribution. During the time frame shown in Figure 3, the BT.x75 values initially decreased until 8 h,followed by an increase until 12 h, then a slight decrease until 16 h, after which there was anincrease. It was found that BT.x75 was negatively correlated with AM.d75 (R=-0.57) andEND.d75 (R=-0.83). Furthermore, BT.d75 correlated negatively with AM.d75(R=-0.34;Figure 7). It is hypothesized that the larger the particles are in the buffer tank, the moreunstable they are to mechanical treatment; as such, the larger particles are broken downand are even smaller later in processing. BT.x75 correlated negatively with AM.pro (R=-0.86) and AM.visc (R=-0.78).Similarly, BT.d75 correlated negatively with AM.pro (R=-0.37), though the correlationwas weaker than that for inline particle size (Figure 7). In addition, BT.x75 correlated negatively with END.pro (R=-0.84) and END.visc (R=-0.86). Likewise, BT.d75 correlatednegatively with END.pro (R=-0.63) and END.visc (R= -0.78; Figure 7). A potentialexplanation for these correlations is the relationship between particle size and centrifugationduring the separation process: Larger particles at the same protein content are moredifficult to separate than smaller particles because the density difference is smaller. Thisindicates that inline particle size information could be used to set the separator parameters(e.g.,bowl speed) in order to achieve desired protein contents (feed forward process control).Another explanation relates to the mechanical stability of the particles, which depends on avariety of factors, including fermentation time and temperature [2]. The formation of large“soft" protein aggregates can be induced by vibrations during fermentation, which aretransferred to the fermentation tanks via pipelines, e.g., those from pumps, homogenizersand switching valves [25]. These aggregates are easily broken down by mechanical input,such as that during the separation process [26]. In addition to this, longer separation times,resulting in higher protein contents, lead to smaller particle sizes [26]. There were moderate positive correlations between BT.d75 and SAC.d75 (R=0.44),as well as between BT.pro and SBC.pro (R=0.33), and BT.pro and SAC.pro (R=0.39;Figure 7). Considering that there were no significant correlations between BT.pro andAM.pro or END.pro, the results suggest that both BT.x75 and BT.d75 are potential in-dicators of apparent viscosity of the fat-free fermented MPb microgel dispersion afterconcentration. However, further information concerning the volume fraction, which pro-vides more information about the microstructure and serum-binding, is necessary to makefurther conclusions, as this is an essential piece of information to describe the texturalproperties of fat-free fermented concentrated milk products [22]. 3.2.2. After Concentration: After Separator and before Cooler (SBC) or after Cooler (SAC) Concentration via separation is accompanied by high mechanical energy input, whichwould be expected to reduce particle size in comparison to the particle size directly afterthe buffer tank. Any change in size at this stage in processing would be dependent onupstream parameters, e.g., milk heating and fermentation parameters, since these willdefine the response of the microgel particles to further downstream parameters. Down-stream parameters affecting the microgel dispersion between the buffer tank and after theseparator include the separator and separator settings. It is also noted that the processingline includes a heat exchanger between the buffer tank and the separator (Figure 1) andthat pre-concentration heating results in larger particle sizes in the final product when com-pared without pre-concentration heating [27]. Thus, this would be a suitable measurementlocation for inline particle size in order to map the influences of pre-concentration heatingand the separation process on product characteristics, and to implement a strategy to takethese into account to achieve the desired final product characteristics. Some examplesbased on the following correlations are given in Section 3.2.2. fewer fines left in the separated whey, resulting in a relationship between higher proteincontent and larger particles. No significant correlations were found between productcharacteristics after the separator/before the cooler and later stages of processing, i.e., afterthe mixer and the final product. The SAC.x75 values ranged from 140 to 150 um for times when product was beingprocessed (values during cleaning procedure omitted), whereas SAC.d75 in the samemeasurement time ranged from 20 to 38 um (Figure 5). The range of SAC.x75 values wassmaller than for BT.x75 (Figure 3) and SBC.x75 (Figure 4). The inline particle size is smallerafter the cooler than previous measurement locations; however, the offline particle size issimilar to previous measurement locations (Figures 3-5). It was found that SAC.x75 wasstrongly negatively correlated with SAC.d75 (R=-0.88) and strongly positively correlatedwith AM.d75, AM.pro and AM.visc, with correlation coefficients of R=0.87 R=0.98 andR =0.96, respectively (Figure 7). There is no clear explanation for the inverse relationshipbetween inline and offline particle sizes at this measuring location. However, the offlineprocedure via a sampling valve and handling until evaluation are important to mention atthis point. Sampling after a separator could have an influence on the state of the sample, whichwould explain the higher variability of the offline results. Possible influencing factorsinclude storage and sampling temperatures, as well as mechanical stress from the samplingvalve. The sampling valve acts in a similar way to a needle valve [28] because of thehigh pressures in the product pipeline during sampling. Since the sampling procedurechanges the state of the sample, offline product characteristics after the separator may notrepresent actual product characteristics. Despite this, a number of significant correlationswere found between SBC.d75 and other data, namely, with values after the mixer (AM.x75:R=0.69;AM.d75:R=0.40;and AM.pro: R=-0.38) and with the end product (END.d75:R=0.60; END.pro: R=-0.85; and END.visc: R = -0.83; Figure 7). Since SAC.x75 andSAC.d75 are strongly negatively correlated (R=-0.88; Figure 7), these findings indicatethat, with higher inline particle size after the separator, product after the mixer and in thefinal packages could be expected to have higher protein content, higher apparent viscositiesand smaller particles. Further data is required to confirm this theory. 3.2.3. After Post-Processing: After Mixer (AM) A number of downstream processing options can be carried out for fat-free fermentedconcentrated MPb microgel dispersions, e.g., mechanical treatments, thermal treatmentsand standardization by adding different components [2]. In the processing line in thisstudy, inline and offline sampling were conducted after a mixing pump, referred to as amixer (Figure 1). The particle size after mixing will depend on the previous treatmentsduring upstream, fermentation, and downstream processing and mixing conditions,e.g·added/dosed ingredients and mixing rate. This would be a suitable place to measure theinline particle size to monitor the particle size of the final (near) packaged product or toderive a prediction on the product properties. To interpret the inline measurement results after the mixer, it was ascertained thatthe product volume flow (pump speed) must be considered. For example, extremely largeparticles were evaluated during the times when the pump speed was set at zero. Sinceproduct flow is required for accurate particle sizing by way of FBRM, such data must beeliminated to avoid erroneous conclusions. A statistic referred to in the FBRM software as“fouling" indicates the similarity between two successive measurements and the degree towhich the result has not changed. High values mean that: 1) material is adhering to themeasurement window; and/or 2) the particles are optically the same or very similar. Fromobserving the complete data set of inline particle size measurements, fouling values of≤80% were determined to be acceptable for the range of flow velocities in this processingline. Values of >80% fouling were observed when the mixing pump speed was set to zero.Therefore, the large particles recorded at times of high fouling are likely to be false readings, as particles will accumulate on the measurement window when product flow is reduced.Thus, the data was processed to eliminate "artificially erroneously" detected large particles. Figure 6 shows such pre-processed data where AM.x75 values at times with fouling≥80% have been removed. The data points for the subsequent 1 min after fouling returnedto <80% were also removed to ensure that the product was flowing at sufficiently highrates before data was included in analysis. The AM.x75 values ranged between 145 and210 um, though the largest particles (around Day 2, 5:00) are hypothesized to be artifactsbased on the very short time over which large particles were detected (Figure 6). Omittingthe particles at around 9 h, the size range for AM.x75 is reduced to 15 um, ranging between145 and 160 um. The AM.d75 values ranged between 15 and 26 um during the same timeperiod (Figure 6). Similar to the sampling valves after the separator, high pressures inthe product pipeline result in high shear as the sample is taken [28], causing a change inthe state of the sample. Therefore, offline product characteristics after the mixing pumpmay not represent actual product characteristics. On the other hand, AM.d75 correlatedpositively with END.d75 (R= 0.72; Figure 7), suggesting that offline particle size afterthe mixing pump is able to predict final product particle size. Sampling bias might applyin the same fashion at both sampling valves. Furthermore, strong positive correlationswere found between AM.pro and AM.visc (R=0.85), AM.pro and END.pro (R=0.92),AM.pro and END.visc (R=0.83), AM.visc and END.visc (R =0.83), and END.pro andEND.visc (R=0.82; Figure 7), indicating not only the expected conclusion that apparentviscosity is higher for higher protein contents, but also that the offline product characteristicof apparent viscosity after the mixer is a good indicator of the apparent viscosity in thefinal packaged product. Furthermore, END.d75 and END.pro were negatively correlated(R= -0.53; Figure 7), signifying that the processing and/or composition of higher proteinproducts in this processing line is related to smaller particle sizes in the final packagedproduct. 3.3. Relationships with Process Conditions 3.3.1. Processing before Concentration While the fat-free fermented milk gel is in the buffer tank, it is either not stirred, orstirred at one of two different set speeds, representing fast and slow stirring. The freshcheese producer indicated that the stirrer is typically fixed to stir quickly when the tank isfull, whereas the speed is reduced to "slow" when the tank is being emptied and, finally,stirring is stopped when the tank is almost empty, mainly to avoid bringing air into theproduct. This was also confirmed by a positive correlation of the buffer tank fill level andthe stirring speed (R=0.82, p≤0.001). There was a very weak negative correlation between BT.x75 and the fill level in thebuffer tank (R=-0.20,p<0.05). These changes are likely due to the mechanical energyinput caused by agitation in the buffer tank [13] such that faster stirring would causeparticles to break down more than slower stirring and therefore have smaller particle sizes.In the future, a larger data set should be collected where time is evaluated in relation to thefill level and material composition, e.g., fermentation tank and pH, since the mechanicalstability of fat-free fermented MPb microgel particles is related to the physico-chemicalcomposition [2]. That being said, it is hypothesized that the larger particle sizes observedafter the buffer tank when the fill level is low and the stir speed is slow or zero are alsoa result of temperature-driven aggregation that is related to the holding time [8,29] andthe omission of mechanical input to break down these aggregates. Since BT.x75 wasstrongly negatively correlated with AM.visc and END.visc (Section 3.2), it is theorized thatthe stirring intensity in the buffer tank can be used to control the final viscosity and bemonitored via evaluation of BT.x75 during processing. To support this theory, a pilot-scaleexperiment could be carried out in which the stirring of the fat-free fermented MPb gel isvaried in time and intensity. In contrast to inline particle size after the buffer tank, AM.x75 correlated significantlywith the fill level of the buffer tank (R=0.54, p≤0.001) and the stir speed of the buffer tank (R=0.28,p≤ 0.001). However, since we were unable to find any correlations betweenAM.x75 and product characteristics other than AM.d75 (negative correlation) (Section 3.2.3),links with processes cannot be defined. Correlations were also found between the pH of the fermentation material enteringthe buffer tank and BT.x75 (R=0.26, p≤ 0.001) and SAC.x75 (R=0.13, p≤0.001). Incontrast, Korzendorfer & Hinrichs [30] concluded that higher final fermentation pH (pH 4.8or 5.0) of concentrated yoghurt gels resulted in less grainy gels compared to a lowerfinal pH of 4.6. The differing conclusions are likely due to the different ranges of pHvalues, with the pH ranging from 4.39 to 4.59 in the current study. It is also noted thatthe current study was conducted on gels containing approximately 4.5% protein thatwere concentrated downstream, in contrast to the high protein (10% protein) gels withoutdownstream concentration in the previous study [25]. These authors also found that gelsfermented to a higher final pH were softer and had lower apparent viscosities than whenfermented to a lower final pH of 4.6, which is the isoelectric point of caseins [7]. 3.3.2. Processing during and after Concentration No correlation could be identified between when material was being mixed into theprocessing line at the mixing pump and any product characteristic after the mixer or inthe end product. This has two likely explanations. First, FBRM measurements may notbe sensitive enough to quantify the differences attributed to small amount of componentsdiffering in particle size. Second, the materials may have similar particle sizes to theproduct particle size and therefore show no apparent difference when evaluated usingthis technique. Furthermore, it is likely that not one constant material is mixed in at thispoint. A number of different ingredients can be added to fat-free fermented concentratedMPb microgel dispersions during downstream standardization, e.g., acidified skim milk,concentrated acidified skim milk, and re-work [2]. Depending on the microgel particle characteristics of the added ingredient, there can bedifferent outcomes. For example, different size ratios can increase or decrease the apparentviscosity of concentrated systems, based on the Farris effect [32]. The standardization stepin the processing of fat-free fermented concentrated MPb microgel dispersions has thepotential to be used to maximize viscosity with minimal protein content or vice versa, e.g.,by selectively adjusting particle size distributions and volume ratios by mixing differentproduct streams [33]. It is proposed that an inline particle size measurement, optionallysupplemented by process elements for mixing and shearing/mechanical treatment atthe end of the line, could be used for defined control of product characteristics. Furtherinvestigations should be conducted to explore this aspect. Since inline measurements allowfor time-accurate monitoring, this inline measurement is the ideal addition to the data thatcould be collected during the processing of fresh cheese and, with the help of artificialintelligence (AI), could be used to control the process with regard to the optimal texture.This optimized processing line with inline sensors, and an integrated approach to datacollection and use, would minimize quality deviations and the production of defectiveproducts, ultimately reducing food waste. 4. Conclusions Measuring particle size inline has the advantage that changes are already visibleduring processing, making it possible to monitor the manufacturing process and adjust thedesired product properties in situ. For the processing line in this study, measuring inlineparticle size directly after the buffer tank and after the mixing pump (after concentrationand before filling) show potential for use as process controls. The impact of stirring procedures in the buffer tank were observable in the inlineparticle size evaluated after the buffer tank. As such, inline data collected after the buffertank could allow for adjustment of the product before it enters further processing, such astailored stirring procedures resulting in precise control of the product characteristics whenexiting the buffer tank (feed forward control). Thus, the variance of product entering theremaining downstream processing would be reduced, also minimizing the variance in thefinal product. Inline particle size after the mixer was related to final product particle sizeand viscosity. Therefore, this measurement location should be investigated further to definethe potential to control final product properties by adjusting the particle size distributiondirectly before filling, e.g., using added material or mechanical treatment. Inline particlesize measurement after the mixing pump would allow for precise control of these processesat the end of the processing line (closed loop control). Proper selection of locations in theprocessing line for inline measurement is required for collection of quality data; consistentproduct flow rate and pressure are essential. The inline measurement proved to be a suitable tool to reveal processing-dependentdifferences in particle sizes, which would not have been detected using an offline measure-ment. To further clarify whether the FBRM technology has potential as a tool for processcontrol, it is recommended to include an analysis of final product syneresis and sensoryproperties in future studies. Author Contributions: A.H.: conceptualization, methodology, formal analysis, visualization,writing-original draft, writing-review and editing. S.N.: conceptualization, methodology, formalanalysis, visualization, writing一review and editing. J.H.: conceptualization, resources, writing一review and editing, supervision, project administration, funding acquisition. All authors have readand agreed to the published version of the manuscript. Funding: This IGF Project of the FEI was supported via AiF within the program for promoting theIndustrial Collective Research (IGF) of the German Ministry of Economic Affairs and Energy (BMWi),based on a resolution of the German Parliament; Project AiF 21545 N. Institutional Review Board Statement: Not applicable. Informed Consent Statement: Not applicable. Data Availability Statement: Not applicable. Acknowledgments: The authors thank Lena Butz for performing parts of the rheological and particlesize measurements, as well as Birgit Greif for conducting the protein analyses. We also thank ThomasSchubert and Darius Hummel for carrying out the inline particle size measurements and for fruitfuldiscussions regarding the collection of data from the fresh cheese processing line. Conflicts of Interest: This study was conducted in collaboration with a fresh cheese producer. Arepresentative of the company has read and approved of this manuscript. References 1. Schulz-Collins, D.; Senge, B. Acid-and Acid/Rennet-Curd Cheeses Part A: Quark, Cream Cheese and Related Varieties. CheeseChem. Phys. Microbiol. 2004, 2, 301-328. [CrossRef] 3. Fernandez-Nieves, A.; Wyss, H.; Mattsson, J.; Weitz, D. (Eds.) Microgel Suspensions: Fundamentals and Applications; Wiley-VCH:Weiheim, Germany, 2011; ISBN 9783527321582. 4 Loewen, A.; Nobel, S.; Hinrichs, J. Microgel Particles and Their Effect on the Textural Properties of Foods. In Reference Module inFood Science; Elsevier: Amsterdam, The Netherlands, 2017; pp. 1-9, ISBN 978-0-08-100596-5. 5. Lucey, J.A.; van Vliet, T.; Grolle, K.; Geurts, T.; Walstra, P. Properties of Acid Casein Gels Made by Acidification with Glucono-Delta-Lactone. 1. Rheological Properties. Int. Dairy J. 1997, 7, 381-388. [CrossRef] 6Lucey, J.A.; Singh, H. Formation and Physical Properties of Ac id Milk Gels: A Review. Food Res. Int. 1997,30,529-542. [CrossRef]7Lucey, J.A. Formation, Structural Properties and Rheology of Acid-Coagulated Milk Gels. In Cheese: Chemistry, Physics and Microbiology; Academic Press: Cambridge, MA, USA, 2004; Volume 1, pp. 105-122, ISBN 9780122636523. 8. Hahn, C.; Wachter, T.; Nobel, S.; Weiss, J.; Eibel, H.; Hinrichs, J. Graininess in Fresh Cheese as Affected by Post-Processing:Influence of Tempering and Mechanical Treatment. Int. Dairy J. 2012,26,73-77.[CrossRef] 9. Hahn, C.; Sramek, M.;Nobel, S.; Hinrichs, J. Post-Processing of Concentrated Fermented Milk: Influence of Temperature andHolding Time on the Formation of Particle Clusters. Dairy Sci. Technol.2012,92,91-107.[CrossRef] 10. Weidendorfer, K.; Bienias, A.; Hinrichs, J. Investigation of the Effects of Mechanical Post-Processing with a Colloid Mill on theTexture Properties of Stirred Yogurt. Int. J. Dairy Technol. 2008,61,379-384. [CrossRef] 11. Cayot, P.; Schenker, F; Houze, G.; Sulmont-Rosse, C.; Colas, B. Creaminess in Relation to Consistency and Particle Size in StirredFat-Free Yogurt. Int. Dairy J. 2008,18,303-311.[CrossRef] 12. Rasmussen, M.A.; Janhoj, T.; Ipsen, R. Effect of Fat, Protein and Shear on Graininess, Viscosity and Syneresis in Low-Fat StirredYoghurt. Milchwissenschaft 2007,62,54-58. 13. Mokoonlall, A.; Nobel, S.; Hinrichs,J. Post-Processing of Fermented Milk to Stirred Products: Reviewing the Effects on GelStructure. Trends Food Sci. Technol. 2016, 54,26-36. [CrossRef] 14. Shekunov, B.Y.; Chattopadhyay, P.;Tong, H.H.Y.; Chow, A.H.L. Particle Size Analysis in Pharmaceutics: Principles, Methods andApplications. Pharm. Res. 2007, 24,203-227. [CrossRef] [PubMed] 15. Heck, A.; Schafer, J.; Hitzmann, B.; Hinrichs, J. Fat-Free Fermented Concentrated Milk Protein-Based Microgel DispersionsManufactured at Technical Scale: Production Parameters as Drivers of Textural Properties. Int. Dairy J. 2021, 127,1-10. [CrossRef] 16. Hahn, C.; Wachter, T.; Weiss, J.; Hinrichs, J. Application of an Inline Particle Size Device to Microgel Particles during Post-Processing of Fresh Cheese. Int. Dairy J. 2013, 29,75-81. [CrossRef] 17. Li, M.; Wilkinson, D.; Patchigolla, K. Comparison of Particle Size Distributions Measured Using Different Techniques. Part. Sci.Technol. 2005, 23,265-284. [CrossRef] 18. Bijnen, F.G.C.; Van Aalst, H.; Baillif, P.Y.; Blonk, J.C.G.; Kersten, D.; Kleinherenbrink, F; Lenke, R.; Vander Stappen, M.L.MIn-Line Structure Measurement of Food Products. Powder Technol. 2002,124,188-194. [CrossRef] 19. Heuer, M.; Schwechten, D.; Faraday, P. Advances in In-Line Particle Size Analysis in the Fines Outlet of an Air Classifier. Part. Sci.Technol. 1997, 15,144. [CrossRef] 20. Weidendorfer, K.; Hinrichs, J. Online Particle Size Measurement in Microgel Particle Suspensions: Principles and Data AnalysisChem. Ing. Tech. 2010,82,1685-1691.[CrossRef] 21. Weidendorfer, K.; Hinrichs, J. On-Line Microgel Particle Size Measurement in Stirred Skim Milk Yoghurt. Milchwissenschaft 2011,66,152-155. 22. Heck, A.; Nobel, S.; Hitzmann, B.; Hinrichs, J. Volume Fraction Measurement of Soft (Dairy) Microgels by Standard Addition andStatic Light Scattering. Food Biophys. 2021,16,237-253. [CrossRef] 23. Fysun,O.;Nobel, S.; Loewen, A.; Hinrichs, J. Tailoring Yield Stress and Viscosity of Concentrated Microgel Suspensions by Meansof Adding Immiscible Liquids. LWT-Food Sci. Technol. 2018,93,51-57.[CrossRef] 24. Krzeminski, A.; Tomaschunas, M.; Kohn, E.; Busch-Stockfisch, M.; Weiss, J.;Hinrichs, J. Relating Creamy Perception of WheyProtein Enriched Yogurt Systems to Instrumental Data by Means of Multivariate Data Analysis. J. Food Sci. 2013, 78, S314-S319.[CrossRef] [PubMed] 25. Korzendorfer, A.; Temme, P.; Nobel, S.; Schlucker, E.; Hinrichs, J. Vibration-Induced Particle Formation during YogurtFermentation-Industrial Vibration Measurements and Development of an Experimental Setup. Food Res. Int. 2016, 85,44-50. [CrossRef] [PubMed] 26. Hahn, C.; Sramek, M.; Nobel, S.; Hinrichs, J. Reduction of the particle size in fresh cheese by mechanical post-processing. Dtsch.Molk. Ztg. 2010, 131,16-18. 27. Heck, A.; Nobel, S.; Hitzmann, B.; Hinrichs, J. Tailoring the Textural Characteristics of Fat-Free Fermented Concentrated Milk-Protein Based Microgel Dispersions by Way of Upstream, Downstream and Post-Production Thermal Inputs. Foods 2022, 11,635.[CrossRef][PubMed] 28. Weidendorfer, K. Die Gelpartikelsuspension Ruhrjoghurt: Mechanisch-Dynamische Eigenschaften, Inline-PartikelgrofenmessungUnd Apparate Zum Glatten Der Textur. Ph.D. Thesis, Universitat Hohenheim, Stuttgart, Germany, 2008. 29. Hahn, C.; Muller, E.; Wille, S.; Weiss, J.; Atamer, Z.; Hinrichs, J. Control of Microgel Particle Growth in Fresh Cheese (ConcentratedFermented Milk) with an Exopolysaccharide-Producing Starter Culture. Int. Dairy J. 2014, 36,46-54.[CrossRef] 30. Korzendorfer, A.; Hinrichs, J. Manufacture of High-Protein Yogurt without Generating Acid Whey-Impact of the Final PH andthe Application of Power Ultrasound on Texture Properties. Int. Dairy J. 2019,99,1-10. [CrossRef] Disclaimer/Publisher's Note: The statements, opinions and data contained in all publications are solely those of the individualauthor(s) and contributor(s) and not of MDPI and/or the editor(s). MDPI and/or the editor(s) disclaim responsibility for any injury topeople or property resulting from any ideas, methods, instructions or products referred to in the content.
确定


还剩18页未读,是否继续阅读?

产品配置单

中国格哈特为您提供《脱脂发酵浓缩乳制品的蛋白质含量检测》,该方案主要用于乳粉中营养成分检测,参考标准--,《脱脂发酵浓缩乳制品的蛋白质含量检测》用到的仪器有格哈特杜马斯定氮仪DT N Pro
推荐专场


相关方案
更多
该厂商其他方案
更多