


方案详情
文
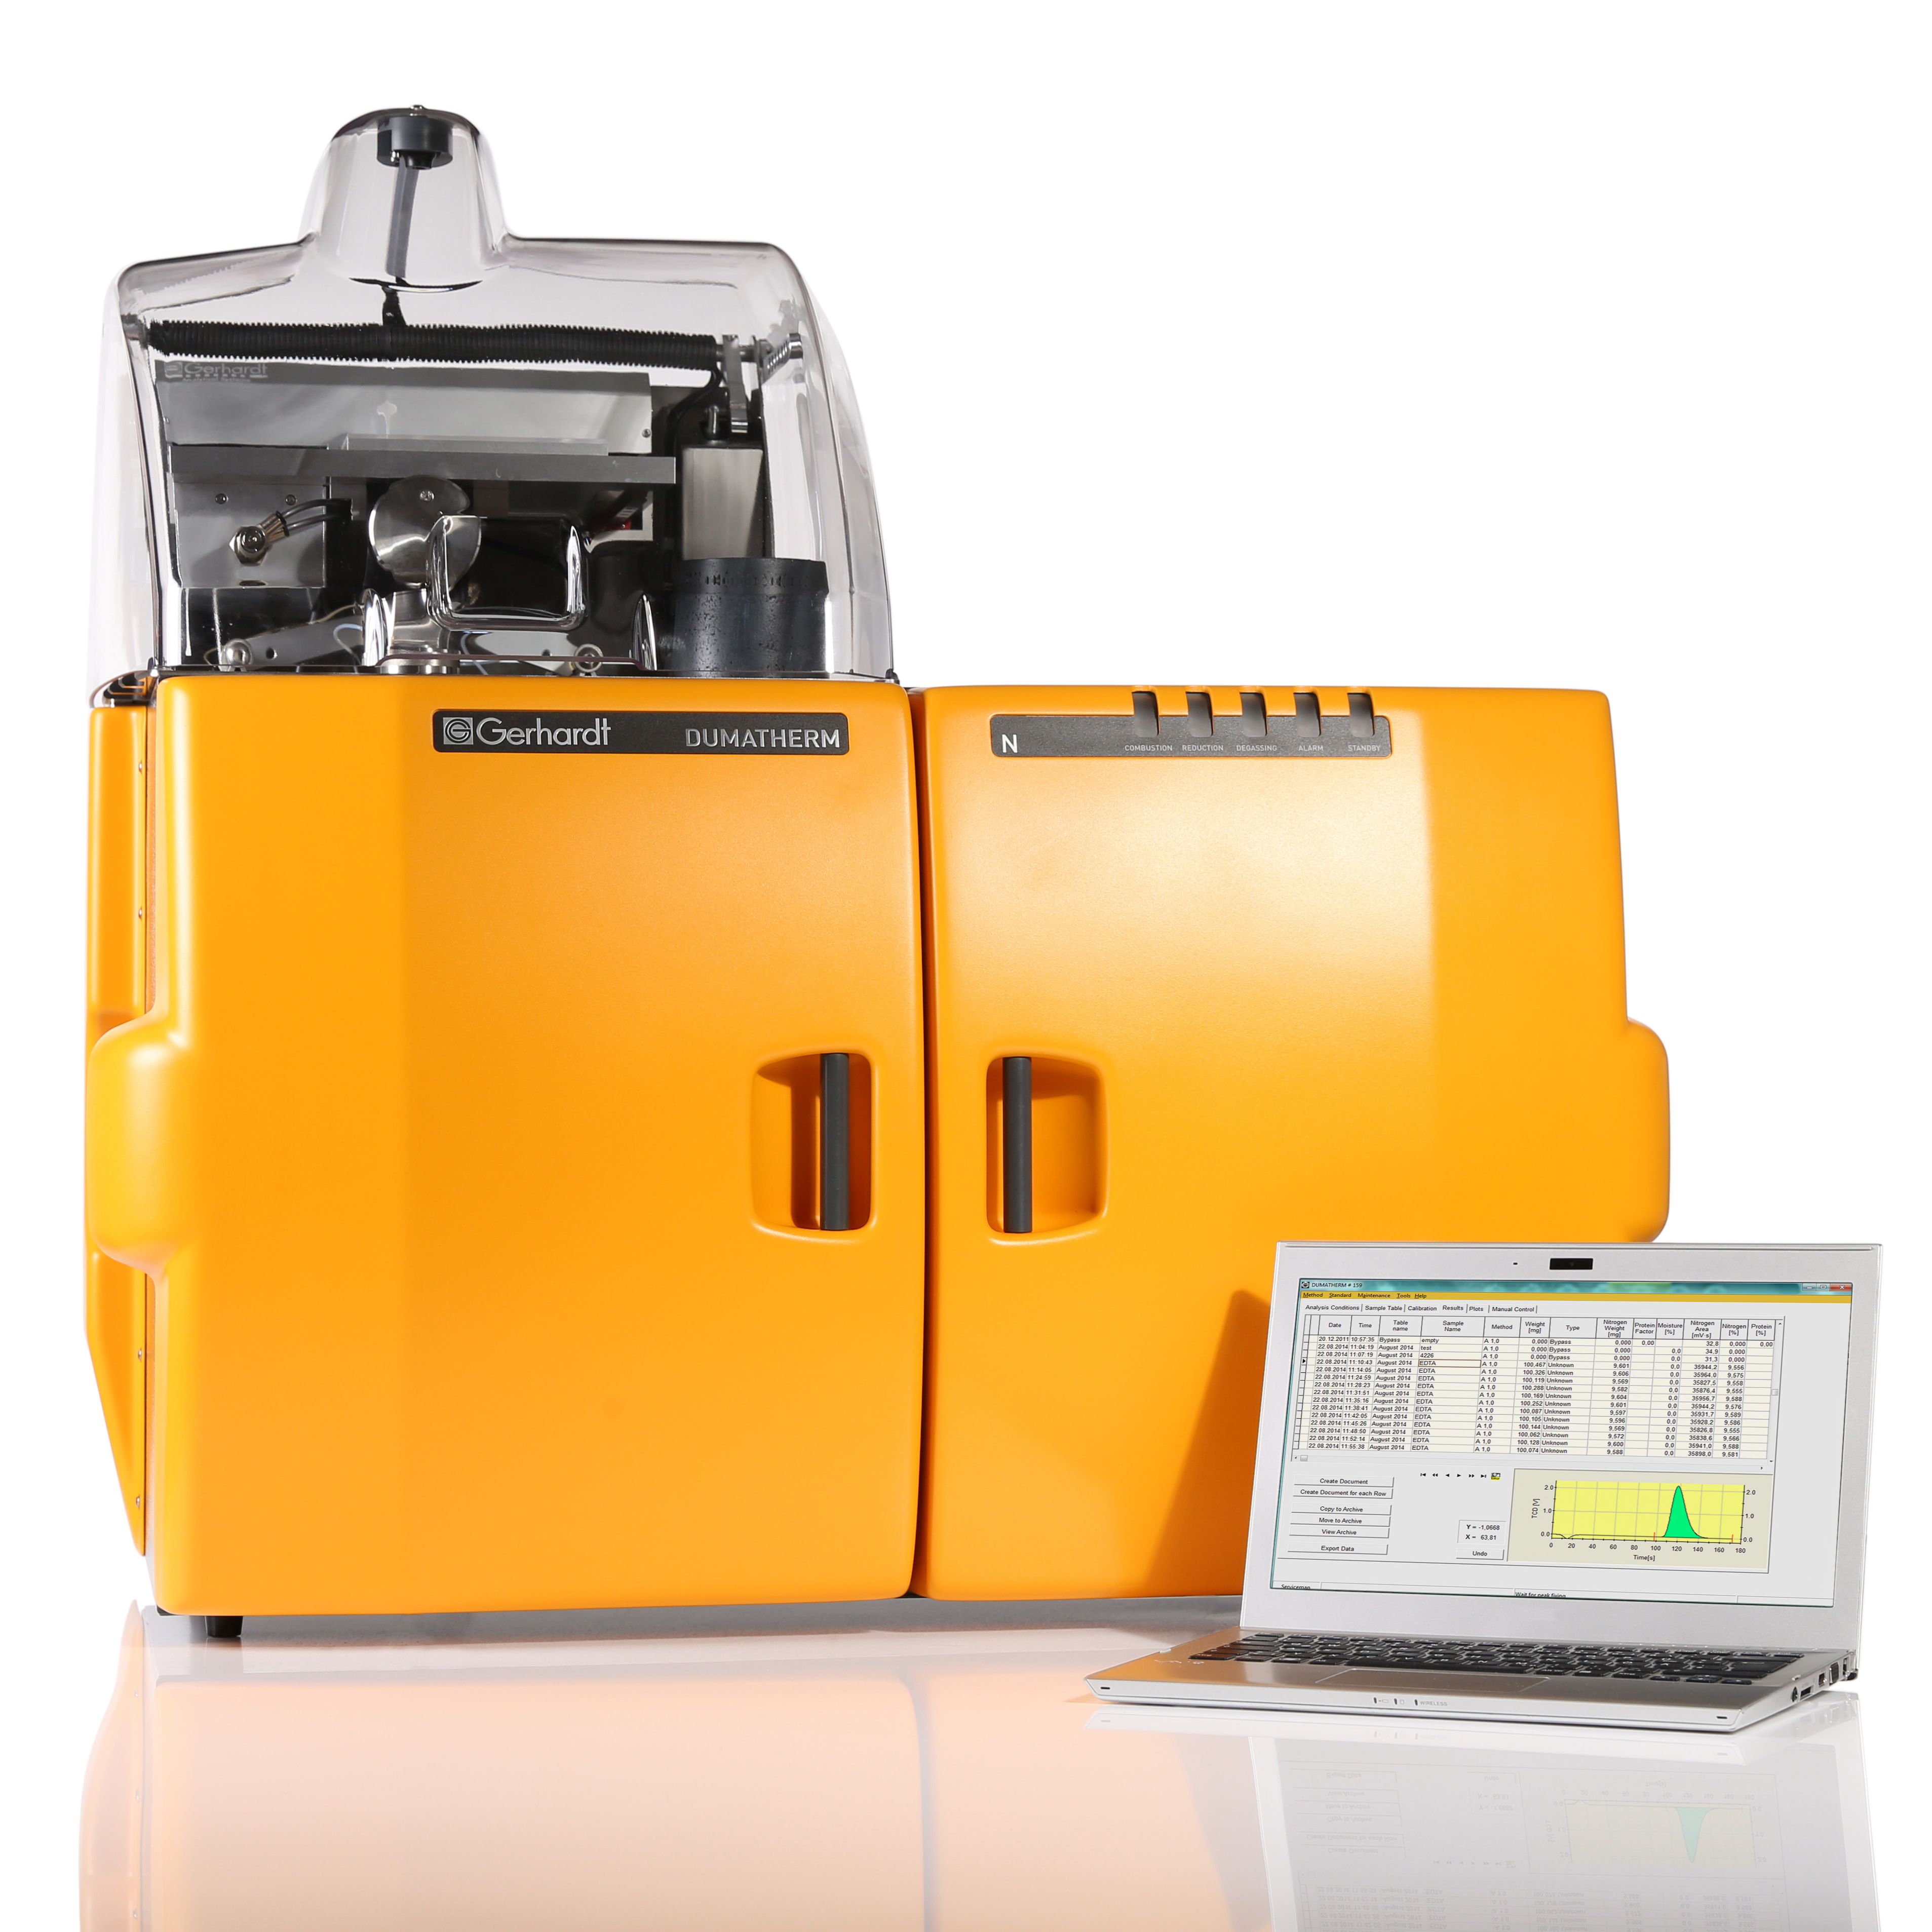
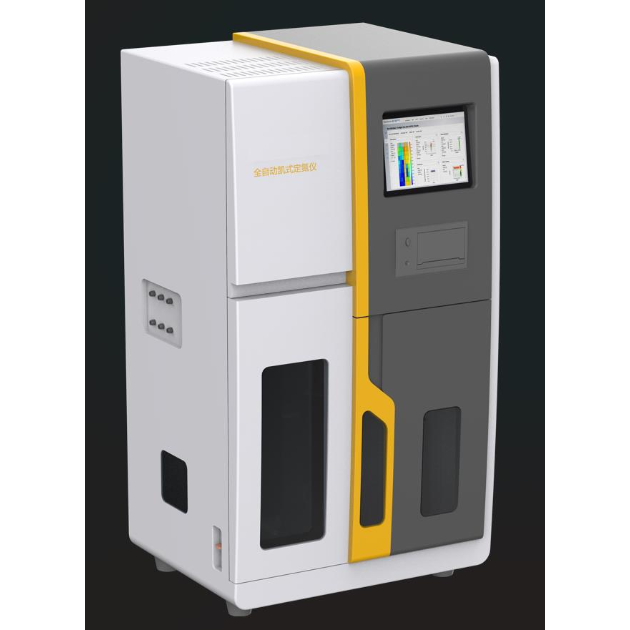
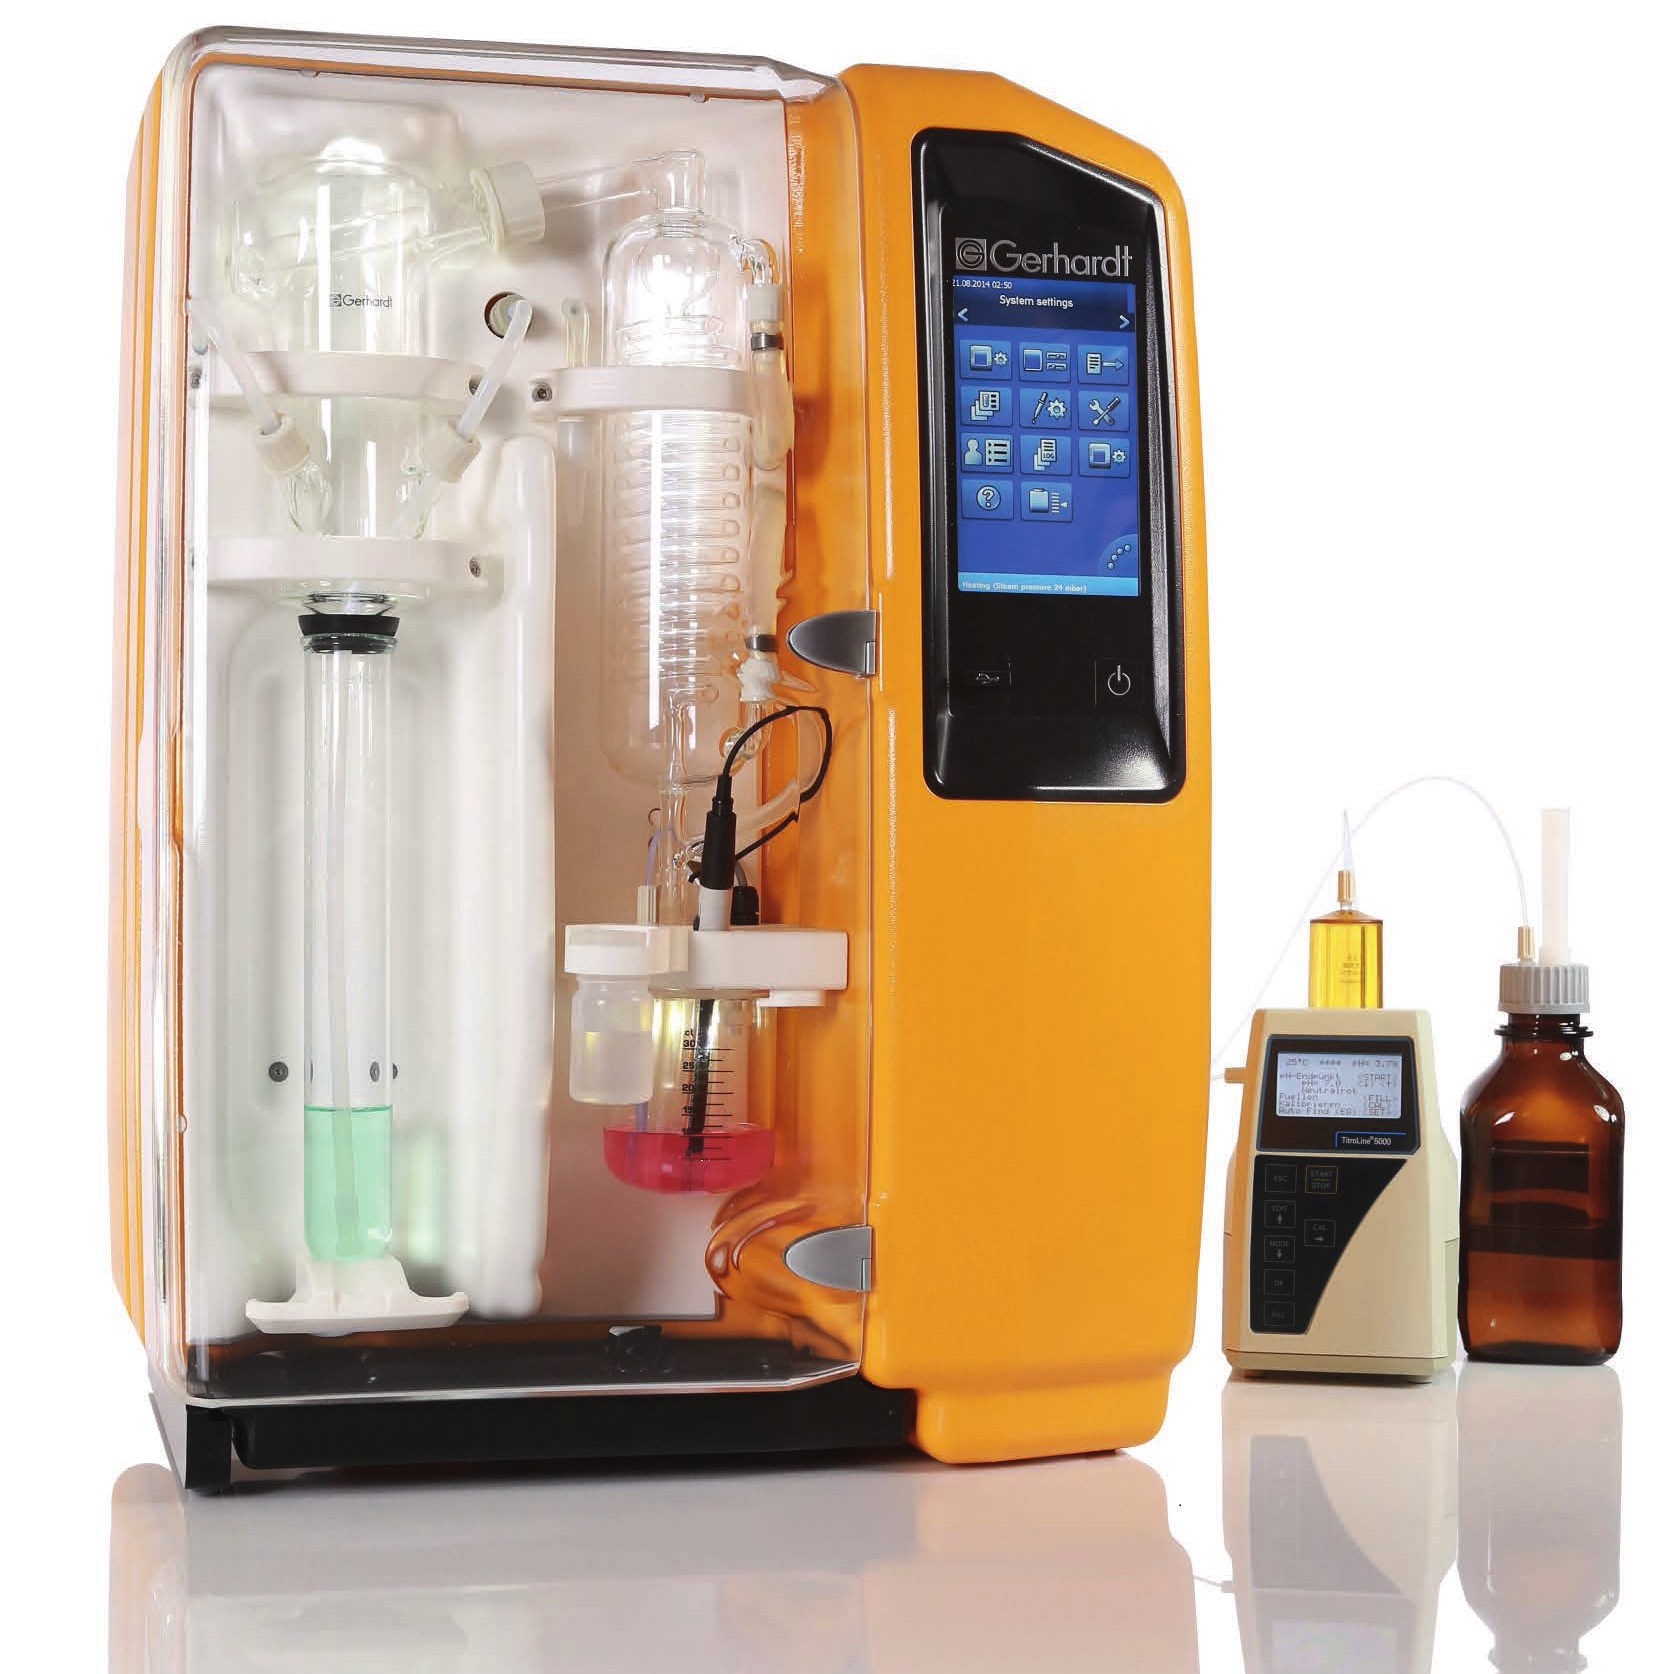
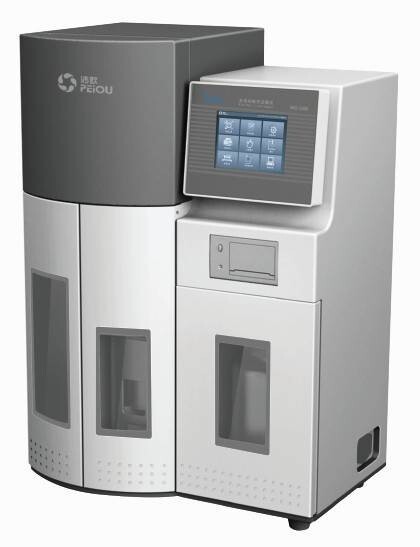
使用格哈特公司杜马斯燃烧法全自动蛋白质测定仪 杜马森DUMATHERM 检测酸乳清蛋白的蛋白质含量
方案详情

使用格哈特公司杜马斯燃烧法全自动蛋白质测定仪 杜马森DUMATHERM 检测酸乳清蛋白的蛋白质含量如何设计一种低成本的中试规模的磁性生物分离工艺使用在线过程分析从复杂的混合物中分离出蛋白质 828 How to design a low-cost pilot scale magnetic bioseparation process forprotein separation from complex mixtures using in-line processanalytics Eva Krolitzki a,b, Sabrina Steck , Andja Nazifi, Michael Abt a, Sebastian Schwaminger *c,d,2 Sonja Berensmeier *a, b 3 a Chair of Bioseparation Engineering, TUM School of Engineering and Design, Technical University4 of Munich, BoltzmannstraBe 15, 85748 Garching, Germany 5 b Munich Institute of Integrated Materials, Energy and Process Engineering, Technical University of6 Munich, LichtenbergstraBe 4a, 85748 Garching, Germany 7 c Division of Medicinal Chemistry, Otto Loewi Research Center, Medical University of Graz, Neue8 StiftingtalstraBe 6, 8010 Graz, Austria 9 dBioTechMed-Graz, Mozartgasse 12/II, 8010 Graz, Austria 10 E-mail: 11 Eva Krolitzki: e.krolitzki@tum.de 12 Sebastian Schwaminger (*corresponding author): sebastian.schwaminger@medunigraz.at 13 Sonja Berensmeier (*corresponding author): s.berensmeier@tum.de 14 Keywords: magnetic separation, bioseparation, protein purification, capture, iron oxide 15 nanoparticles,lactoferrin, in-line process analytics. 16 Abstract 17 Magnetic separation is a useful tool for the integrated direct capture and purification of biomolecules 18 and cells. One of the main advantages of magnetic separation is that the target can be directly captured 19 from crude, viscous feed media without prior clarification and without the risk of blocking the 20 equipment. To emphasize the suitability of magnetic separation for this purpose, we equipped a 21 commercially available rotor-stator high-gradient magnetic separator (RS-HGMS) with in-line 22 analytics of hygienic design (absorbance, conductivity, pH, and flow) and performed a systematic 23 characterization of the equipment. We combined particle agglomeration and separation studies for bare 24 iron oxide nanoparticles (BIONs) with residence time analysis, magnetic filter capacity, and particle 25 retention experiments to design a generic RS-HGMS operation protocol optimized for minimal particle 26 carry-over and efficient buffer exchange. As a proof-of-concept, we customized the operation protocol 27 for the industrial use case of lactoferrin separation from crude acid whey through simple adaptions of 28 pump speed, step duration, and cycle repetition. The in-line sensors allow for the continuous 29 monitoring and documentation of the automatically run process, and the BIONs carry-over in the 30 elution fractions is less than 0.037 g L·. The RS-HGMS process described in this paper serves as a 31 guideline for the design of magnetic separation processes for other challenging bioseparation tasks 32 from crude, viscous feed media. Implementing continuous process monitoring and data logging 333435 1 Introduction36373839404142434445464748495051525354555657585960 throughout the process is an essential step toward the acceptance, safety, and implementation ofmagnetic bioseparation processes in the industry. Magnetic separation is a versatile tool for bioseparation tasks. The general concept is the selective binding of a target substance to a magnetizable carrier, whereafter the target substance-carrier- aggregation is magnetically removed from the mixture and can be set free from the magnetic carrier ina suitable buffer [1],[2]. This “magnetic fishing” can be directly applied to unclarified and viscousfeedstock. This is a huge advantage over established bioseparation operations where solids in untreatedfeedstock may easily lead to clogging, e.g., of chromatographic columns or filter membranes [3]. Thischaracteristic, combined with the vast choice of available magnetic particles [4] with surfacefunctionalization reaching from simple ion-exchanger [5] to highly specific affinity ligands [6], [7],has made magnetic separation become a popular analytical tool for direct and selective separation of biological targets from complex solutions [8]. Surprisingly, magnetic bioseparation has not yet been established as an integrated standard operation procedure for the industrial-scale production of biological target substances. In academic research, numerous promising approaches for the separation of all kinds of biological targets (e.g., whey proteins, antibodies, whole cells) from crude feedstocks on a liter scale using different device designs have been demonstrated and are reviewed elsewhere [4], [9]. The most recently published processes [10]-[14] use a rotor-stator high-gradient magnetic separator (RS-HGMS) with perforated discs, which can be magnetized within an electric magnet coil or be used for resuspensionof magnetic particles [15]. Therein Ebeler et al. were the first to use a commercially available RS-HGMS [12] with a proven hygienic design [10]. However, few of these liter-scale processes had in-line instrumentation installed to ensure and document the quality of their process: Shaik et al. used aUV/VIS 600 nm detector to determine particle drag [14], Meyer et al. had a UV-1 detector installed to monitor buffer mixing [16], Fraga-Garcia et al. determined residence times in the separator through in- line conductivity measurement [17] and Shaik et al. used an ultrasonic flowmeter to measure and control volume flow [18]. In these processes, the process development, calculation of balances, and optimization solely relied on time-consuming offline analysis, e.g., gravimetrical dry mass 61 determination of magnetic particles or assay-based protein quantification subsequent to the process. 62 The experiment's success could only be evaluated after completion without the option to continuously63 monitor or influence the ongoing process. Three advancements are necessary to establish magnetic bioseparation as an industrial-scale platform process: (1) the cost of the magnetic particles has to be reduced to an adequate bulk price, (2) advantageous processing conditions have to be investigated [4] and put into a basic processingprotocol, which can be easily adapted to various bioseparation tasks, and (3) the magnetic separationprocess must become more traceable and documentable to meet the documentation criteria of GMPguidelines for the production of food or pharmaceuticals (for details see [19]). The presented workaims to advance the RS-HGMS process towards an industrially deployable platform for cost-efficientbioseparation processes with improvements in these three categories. We use low-cost bare iron oxidenanoparticles (BIONs) with no surface functionalization for the development of a basic separationprotocol and for the determination of suitable processing conditions to establish improvements incategories (1) and (2). With the installation of in-line analytics (pH, conductivity, UV absorbance,flow) and data recording to the RS-HGMS, we address the requirements in category (3): we provide adeeper insight into the bioseparation process and offer uninterrupted process documentation. In doingso, we also embrace the recommendations of the FDA’s Process Analytical Technology (PAT)initiative. The PAT initiative aims to increase innovation and efficiency in pharmaceutical development, manufacturing, and quality assurance through the definition of critical process parameters and their timely monitoring [20]. The direct separation of lactoferrin (LF) from crude acid bovine whey with BIONs is the goal for the proof-of-concept demonstration in this paper. LF is an industrially relevant protein [21], and acid whey (~pH 4.3) is considered a complex, challenging feedstock [22] because of its high lactic acid, solids, and mineral content [23], and its low concentration of the target protein LF (<0.07gL[24]). We start the systematic process development with the evaluation of the impact of media characteristics (viscosity, salt content) on the magnetic separability of superparamagnetic BIONs from the surrounding liquid media in milliliter-scale experiments since these factors can influence BIONs agglomeration and separation behavior [25], [26]. In the next step, we characterize the RS-HGMS system response for typical bioseparation scenarios (i.e., filter capacity, buffer exchange, BIONs capture) and validate the separability of BIONs from viscous media in the RS-HGMS using the readings of the in-line UV detector. 92 Finally, we translate the findings of the systematic device characterization into suitable settings for pump speed, step duration, and the number of cycle repetitions and present an optimized generic RS- HGMS operation protocol. The successful proof-of-concept run, where we separate LF from crude acid whey with non-functionalized BIONs as magnetic adsorbent material in a fully automatically executedsalt elution process, is continuously monitored and shows minimal particle loss. The generic operation protocol can serve as a template for all kinds of future bioseparation tasks with the RS-HGMS. 2 Materials and Methods 2.1 Materials Schwarzwaldmilch GmbH provided the acid whey (pH 4.6, conductivity K= 10.3 mS cml), whichcontains no lactoferrin (LF). We received LF (vivinal@, FrieslandCampina GmbH) with a specifiedprotein purity of > 95% and whey ultra-filtrate from the University of Hohenheim (Institute of FoodScience and Biotechnology, Department of Soft Matter Science and Dairy Technology). Iron (III)-chloride hexahydrate, LF reference protein, bovine serum albumin (BSA), oxalic acid, and sodiumacetate were purchased from Sigma-Aldrich. Iron (II) chloride tetrahydrate extra pure was obtainedfrom Merck KGaA, Germany; a-lactose. H2O, citric acid, (D+)-sucrose, sodium chloride, and sodiumhydroxide, tri-potassium citrate monohydrate, tri-magnesium citrate nonahydrate, tri-sodium citratedehydrate, potassium sulfate from Carl Roth GmbH &Co. KG; di-potassium hydrogen phosphate,acetonitrile (HPLC grade) and trifluoroacetic acid (TFA, HPLC grade) from VWR InternationalGmbH; calcium chloride dihydrate from AppliChem GmbH; potassium chloride and potassium dihydrogen phosphate from Grissing GmbH and acetic acid from Honeywell Fluka. 2.1.1 Process buffers We used a 10 mM sodium acetate solution (pH 4.3, K=0.241 mS cm-l) as a wash buffer. We used the same buffer system with 0.1 M NaCl as a low-salt elution buffer (pH 4.3, K=9.86 mS cm) and with 2 M NaCl as a high-salt elution buffer (K= 143.2 mS cm). We chose a 0.1 M NaOH, 2 M NaCl solution as BIONs regeneration buffer (pH 12.9, K= 147.3 mS cm-l). 2.1.2 Simulated Milk Ultra Filtrate Whey, as a natural material, comprises a complex mixture of components whose composition can vary dramatically based on the production process where it descends and many other factors, such as season or cow breed [27]. To provide invariant experimental conditions, we utilized simulated milk ultra- filtrate (SMUF) as a model system for acid whey. It was prepared according to the optimized recipe 122 simulating milk ultrafiltration permeate at 10 C as described by Dumpler et al. [28], and we added 123 49.5-200 g L-lactose to increase viscosity. To produce a model feed with even higher viscosity, we124 dissolved (D+)-sucrose in water. We measured the dynamic viscosity in 2.5 mL samples at 23 °C using125 a Modular Compact Rheometer (MCR 302, Anton Paar GmbH, Austria) with a plate-plate geometry126 (d=50 mm, 1 mm spacing) at a constant share rate of 20 s-l for 420 s. 127 2.1.3 Rotor-Stator High-Gradient Magnetic Separator 128 For the process characterization and design, we used a commercially available rotor-stator high- 129 gradient magnetic separator (RS-HGMS, MES-25 RS, Andritz KMPT GmbH, Germany). A detailed 130 system description [12] and proof of the RS-HGMS's cGMP readiness [10] have previously been 131 published for its precursor (MES-100 RS). In contrast to the therein described 1.0 L magnetic 132 separation chamber, our system has a 0.25 L magnetic separation chamber installed, comprising 13 133 rotor- and 12 stator-discs (high-grade steel 1.4016, Ra 0.4 um, electro-polished), perforated with holes 134 (d=3 mm, grid pattern 4 mm> 1mm minimum web width) (Figure 1 b, c). The disc stack is fitted into135 the opening of the magnet with the help of a chamber sleeve and a drive shaft adapter (Figure 1a). The136 drive shaft adapter narrows the radial disc space, whereas sleeve centers the 0.25 L chamber axially in 137 the middle of the magnet opening. Furthermore, we equipped the RS-HGMS with a customized in-line138 process analytics set-up (Figure 1) purchased from Endress+Hauser GmbH+Co.KG (Germany) to139 monitor flow (Coriolis flowmeter, Promass F 100 3/8"), conductivity and temperature (Memosens 140 CLS82D), pH (ISFET, Tophit CPS471D) and absorbance (UV sensor OUSAF44, flow assembly 141 OUA260, sapphire glass, 10 mm path, A= 280 nm). A data manager (Memograph RSG45, 142 Endress+Hauser GmbH+Co.KG, Germany) acquires and stores the measured data points, and we used 143 the associated field data manager software (FDM MS20) for data monitoring and export. All wetted 144 parts of the RS-HGMS and instrumentation are made from materials that comply with current 145 pharmaceutical and food industry regulations and are of hygienic design according to the 146 manufacturer's data. eprrP dve 147 148 Figure 1: Rotor-stator high-gradient magnetic separator (RS-HGMS) (1) with in-line process analytic149 set-up: monitoring of (2) flow, (3) pH, conductivity,absorbance (280 nm), and temperature. Data from150 the sensors and the RS-HGMS are collected in the (4) data manager and forwarded to a (5) computer151 for data monitoring and processing. External vessels (6) provide process media. (a) shows the top viewof the magnet housing with an open 0.25 L separation disc stack inserted into the center. The separationchamber is fitted into the opening of the magnet with a chamber sleeve and a drive shaft adapter. The154 separation matrix consists of perforated magnetizable rotor (b) and stator (c) discs and their respective155 PEEK sealings. 156 2.2 Methods 2.2.1 Preparation of magnetic iron oxide nanoparticles We synthesized bare iron oxide nanoparticles (BIONs) via co-precipitation of Fe+ and Fe3+ in an alkaline aqueous solution adapted to the procedure described by Roth et al. (Roth et al. 2015). We 160 dissolved 172.8 g of FeClg6 H2O and 70.0 g of FeCl ·4 H2O in each 400 mL of deionized, degassed 161 water and added the iron chloride solution dropwise to 1 L of a degassed 1 M NaOH solution under 162 constant stirring at 400 rpm in a 3 L reaction vessel at 25 ℃. After 30 minutes, we separated the 163 164 synthesized BIONs from the fluid with a handheld NdFeB permanent magnet and washed the BIONswith deionized, degassed water until the conductivity was less than 200 uS cm. 165 2.2.2 Characterization of BIONs ⑦ 166 167 168 169 170 171 172 173 174 175 For offline BIONs quantification in water above concentrations of 0.5 g L, we dried 1 mL BIONssuspension in dry reaction tubes (1.5 mL) for at least 24 h and determined the BIONs massgravimetrically. For BION concentrations in the range of 0.0 - 0.5 g L and in more complex media,where, e.g., salts or lactose would falsify the gravimetrically measured BIONs quantity, we used aphenanthroline assay [29]. BIONs are dissolved in HCl to produce Fe+ ions, forming an orange-colored chelate complex in 1-10-phenanthroline in an aqueous acetate buffer solution (pH 4.5). Wecalculate the iron oxide concentration from the absorbance measurement at 510 nm in a plate reader(Tecan Infinite M200 PRO Series). During the RS-HGMS system characterization, we used a linearcorrelation of the 280 nm in-line absorbance signal of BIONs suspensions with a known concentrationof 0-0.5 g L- for BIONs quantification at the separation chamber’s upper exit. 176 Directly after synthesis, we determined the BION’s specific surface area through Brunauer-Emmet- 177 Teller (BET) nitrogen adsorption isotherms at 77 K (p/po= 0.05-0.25; Gemini VII, Micromeritics 178 Instrument Corporation, USA) in duplicate with lyophilized BIONs. For the analysis of the magnetic179 susceptibility, we glued lyophilized BIONs samples into a small tube and varied the magnetic field180 from -40 kOe to +40 kOe at 300 K in a superconducting quantum interference device (SQUID, 181 Quantum Design MPMS XL-7). We used the same batch of lyophilized BIONs for the powder X-ray 182 diffraction (XRD) in a STOE Stadi-P diffractometer with a molybdenum source (A=0.7093 A). 183 We identified the hydrodynamic diameter, which is the diameter of a theoretical sphere that behaves 184 in the same way as the respective agglomerate, through dynamic light scattering (DLS) in triplicates 185 in 1 mL of 0.7g L- BIONs suspensions at 25℃ (Zetasizer Ultra, Malvern Pananalytical GmbH, 186 Kassel, Germany). Subsequently, we recorded space- and time-resolved extinction profiles in a 187 magnetic field using the same BIONs samples and determined the magnetophoretic velocity as the 188 harmonic mean value [30] (A=870 nm, 25°℃, STEP-MAG, LumiReader PSA, LUM GmbH, Berlin, Germany). To evaluate the behavior of BIONs during separation from viscous biological feed, we took measurements in solutions modeling potential process feed such as whey and concentrates thereof modeled by SMUF with added lactose (49.5, 100,150, and 200 g L-) or higher viscous fermentation broth modeled by sucrose solutions (10, 30 and 50 wt%). In addition, we studied the behavior of BIONs in the anticipated process buffer system. 194 2.2.3 RS-HGMS system characterization 195 199 200 201 202 203 Before each experiment, we programmed the respective sequence via the integrated control panel andconnected all required process media to the RS-HGMS. If BIONs were used in the process, the slurrywas continuously homogenized with a paddle mixer at 600 rpm (Witeg HS-120A, Witeg LabortechnikGmbH, Germany) in an external batch reservoir. We executed all sequences as automatized proceduresat room temperature and always de-aerated the RS-HGMS (Supplement 1) in the first step to avoid airbubbles in the process. Throughout the experiment, we monitored and recorded in-line readings formass or volume flow, pH, conductivity, UV absorbance (280 nm), and temperature in one-secondintervals. We used the UV signal to detect BIONs and protein breakthroughs in the liquid that exitedthe filter chamber. 204 Correlation of pump speed to volumetric flow 205 In the RS-HGMS, the volume flow rate is regulated by setting a value for the pump speed (PS) as a 206 percentage of the maximum possible revolutions per minute, which is 220 rpm (max. flow rate 207 2700 mL min-) for the installed peristaltic pump (Verderflex R3S, Verder Deutschland GmbH & Co. 208 KG). For the acquisition of the PS to volumetric flow correlation, we pumped water through the RS- 209 HGMS from the bottom to the top valve and raised the PS in 5% steps from 0- 100% in 40 s time 210 intervals with an automated pump-performance program. The resulting flow is recorded through the 211 flowmeter and correlated to the PS using Matlab (R2021b, Mathworks). 212 213 Magnetic filter capacity and BIONs recovery 214 We determined the maximum filter capacity of the separator chamber in breakthrough studies for 215 BIONs at a concentration of 20 g L in water. The slurry was pumped through the magnetized filter 216 chamber from bottom to top, and we used the in-line absorbance signal for breakthrough detection. 217 Since feed media for bioseparation tasks are usually viscous (e.g., the apparent viscosity of clarified 218 cell culture supernatant: n<5 mPas,E. coli broth: n<20 mPa's [31]), we captured BIONs from SMUF 219 solutions containing 49.5 -200 g L-l lactose or sucrose solutions (10 - 50% wt) in the same 220 experimental setup. In lactose-containing feed, we quantified BIONs drag in offline measurements 221 since lactose has an absorbance maximum at 280 nm (Supplement 2). For BIONs recovery from the 222 RS-HGMS, we used an automated multistep routine where the particles are drained from top to bottom 223 in five cycles (Supplement 3). 224 225 226 BIONs retention during buffer exchange 227 In retention experiments, we assessed how well the 0.25 L filter matrix could magnetically retain BIONs at different flow rates to determine a suitable flow rate during buffer exchange in the BIONs- loaded filter chamber. As suggested by Ebeler et al., we loaded the filter chamber to approximately 80% capacity to simulate the conditions in a realistic protein purification process [12]. Subsequently,we pumped water through the partially loaded, magnetized filter chamber, again from bottom to top, while increasing the flow stepwise from a PS of 15% to 100% every 40 s in an automated program. Potential BIONs drag out was monitored in the UV 280 nm signal at the upper exit of the filter matrix. BIONs resuspension and capture in the closed loop After each buffer exchange, BIONs are released into the fresh buffer by turning the magnet off andresuspending them in the filter chamber by mixing at 80% rotor power for 90 seconds, followed by theadditional circulation of the suspension through the closed loop for 90 seconds (50% PS). For thedetermination of a suitable duration and PS setting for the subsequent complete collection of free-floating BIONs from the loop circulation to the again magnetized filter matrix, we captured the BIONsfrom water at different PS for each five minutes and monitored the BIONs concentration in the loop through the absorbance signal. Residence time distribution function With the aim of determining suitable durations for complete media exchange during the magnetic bioseparation process, we evaluated system responses after uniform pulse injections (1 s, 20% PS) of BSA. We injected the pulse from bottom to top, let the tracer pulse travel through the system at different PS with water, and measured the absorbance at the upper exit of the separation chamber. To assess the pulse response for different process situations, we performed tests without and with BIONs present in the filter chamber (~80% filter capacity). We calculated the theoretical t (Equation 1) and actual t (Equation 2) mean residence time for discrete measurement points [32] and the experimentally determined distribution function F(t) (Equation 3) [33] using Matlab. Furthermore, we compared the resulting residence time distribution functions to an ideal plug-flow reactor (IP, Equation 4) through the dimensionless time 0 (Equation 5) [34] for the identification of deviations from ideal flow behavior [32]. In the given equations, Vr is the system volume, V the volumetric flow, t the time, s(t) the measured signal at time t, So the signal of the tracer-free fluid, and s.. the signal of the tracer at the inlet. 256 In addition, we set up a fluid simulation of the isolated separation chamber (COMSOL Multiphysics257 5.5) to back up the results. Equation 1 deweiF(8)=8781 Equation 4ve 258 259 2.2.4 RS-HGMS operation protocol 260 We based the operation protocol on previously published HGMS processes with BIONs [17], which261 consist of the following steps: 262 263 a)Preparation: contacting of BIONs with feed media, attachment of all process media to the RS-HGMS, and automatic de-aeration. 264 265 266 267 b) Filter loading: The feed suspension is pumped through the magnetized filter matrix until 80%BIONs loading capacity is reached [12]. Protein-loaded BIONs are magnetically retained bythe filter matrix, whereas the remaining fluid exits the RS-HGMS and is collected as flowthrough. 260 270 271 272 273 274 c)Washing and elution cycles: the respective wash or elution buffer replaces the previous processliquid while the BIONs remain attached to the filter matrix. The liquid fraction exiting the RS-HGMS is collected in flasks for further analysis. The magnet is switched off, and the BIONsare first resuspended in the filter chamber by switching the mixer on and then additionallycirculated through the RS-HGMS internal loop. The BIONs are thereafter captured to the filtermatrix from the circulating slurry by switching the magnet on. In the wash steps, we removefeed residua, and in the elution step target proteins are desorbed from the BIONs surface. 275 276 277 d)BIONs regeneration: after a completed process, we desorb the remaining proteins from theBIONs surface with a regeneration buffer and transfer the cleaned BIONs to water in a similarprocessing manner as the wash and elution cycles. 278 279 e)BIONs recovery: the cleaned particles are drained from top to bottom with water in five stepswhile the magnet is switched off, and the mixer is at 80% output. 280 281 282 f)(Cleaning in place: potential BIONs remnants are dissolved with oxalic acid (10 g L-l) forapproximately 2 hours and then rinsed from the RS-HGMS with DI water. A cleaning protocolwith alkaline and acid cleaning agents can be applied, as described by Ebeler et al. [10]. 283 The human-machine interface was used to control, program, and run the RS-HGMS. All fluids are fed284 into the separator gas-bubble-free to avoid an accumulation of particles at gas-liquid interfaces, and all285 filling operations were executed from the bottom to the top valve block. We optimized the process for286 a proof-of-concept process (separation of lactoferrin from whey) by adjusting the equipment settings287 PS, filter matrix loading, cycle- and step duration times according to the findings from the system288 characterization experiments. The necessary number of cycle repetitions is determined during the289 proof-of-concept run according to in-line readings and matching to target values (e.g., conductivity and290 absorbance). 291 2.2.5 Protein identification and quantification 292 The total protein content was calculated from a total nitrogen measurement with a protein calculation 293 factor of 6.38 through a Dumas method (Dumatherm, C. Gerhardt GmbH & Co. KG, Germany) at the 294 University of Hohenheim. We established a reversed-phase high-performance liquid chromatographymethod(RP-HPLC), adapted from Ostertag et al., to identify and quantify lactoferrin in whey solutions[24]. The method uses an RP-HPLC column (Waters BioResolve RP mAb Polyphenyl, 4.6 x 150 mm, 2.7 pum, 450 A) in our HPLC equipment (Agilent 1260 Infinity II) at 40°℃ and a flow of 0.8 mL min-. 298 The eluents consisted of water, acetonitrile, and trifluoroacetic acid. Detection was by absorbance at 299 205 nm and measured against a reference of 360 nm. 300erp 301 3 Results and Discussion 302 3.1 Magnetic particles and separation behavior 303 For a successful separation in an HGMS, magnetic particles have to display specific characteristics, 304 such as superparamagnetic behavior with no remanence, a saturation magnetization of more than305 35 emu g and a size between 500-2000 nm to provide an optimal proportion between available surface306 area for target binding and efficient separation in the magnetic field [1]. To confirm the suitability of307 the freshly synthesized BIONs for the RS-HGMS process, we identified the iron oxide type and the308 primary particle size through XRD, the surface area through BET isotherms, and the magnetization309 behavior in a SQUID measurement. In addition, we studied the BIONs agglomeration and separation310 behavior in media with increased salt content or viscosity through DLS and magnetophoretic velocity 311 measurements to evaluate which influence the surrounding media will have in the RS-HGMS process. 312 3.1.1 Particle characterization 313 The X-ray diffractogram of the synthesized particles in Figure 2 (A) shows the designated reflections 314 for magnetite at 220,311,400,511, and 440 [35], whereas the calculated lattice constant of 8.383 A 315 lies slightly below the value of magnetite (8.399 A), indicating a mild oxidation of the sample [36]. 316 Through the Scherrer equation (Supplement 4), we determined the mean particle diameter of the 317 particles to 8.52±0.26 nm, which is in good agreement with the average values in the literature [37] 318 but substantially smaller than the particle size recommended for HGMS processes by [1]. We 319 calculated the particles'specific surface area with BET-isotherms to 98.4±0.2 m² g-. This is a typical 320 value in the range of magnetite previously synthesized in our group (99 m²g-) [38]. The SQUID 321 measurement (Figure 2 B) displays the typical curve progression of superparamagnetic iron oxide, with 322 a saturation magnetization of 53.88 emu g and no significant remanence or hysteresis at 0 Oe. The 323 BIONs fulfill magnetization requirements for successful separability in an HGMS process [1]. eprrP A B Figure 2: X-ray diffractogram (A) and SQUID magnetization measurement (B) of the synthesizediron oxide nanoparticles. XRD was measured at room temperature in transmission geometry with aMoKa source.SSQUID was conducted at 300 K between -40000 to +40000 Oe and fitted with amodified Langevin function. 324 325 3.1.2 Influence of surrounding media on BIONs separability 326 Since the surrounding medium directly influences the separation behavior of BIONs [39], we327 investigated the average hydrodynamic diameter and corresponding magnetophoretic sedimentation328 velocity for the BIONs agglomerates at native acid whey acidity (pH 4.3-4.6) in the sodium acetate 329 buffer system, acid whey ultra-filtrate and SMUF with added lactose to increase viscosity. int reprrP deewive 331 Figure 3: The hydrodynamic diameter (columns) of BIONs agglomerates and the magnetophoretic332 sedimentation velocity (triangles) in acid whey ultra-filtrate (pH 4.6), SMUF without and with added333 lactose (pH 4.5) and in a 10 mM sodium acetate buffer system (pH 4.3) with addition 0 M, 0.1 M, and334 2.0 M NaCl. All measurements were taken in triplicate at 25℃ and a BIONs concentration of0.7gL. 335 Figure 3 illustrates how the average hydrodynamic diameter of BION agglomerates increases from 336 1276±31nm to 1605±132 nm and to 3034±589 nm with the addition of 0.1 M and 2.0 M NaCl to 337 a 10 mM sodium acetate buffer (pH 4.3), respectively. With increasing hydrodynamic diameter, the338 magnetophoretic velocity of the BION agglomerates increased from 167 to 292 um s-, hinting that the339 magnetic separation of BIONs from the washing or elution buffers will become faster throughout the340 processing sequence in the RS-HGMS. The measured effects of ionic strength on BIONs341 agglomeration and magnetophoretic velocity agree with previously published findings at pH 5 [25].342 The similarity of BION separation behavior from the acid whey model system“SMUF with 49.5 g L-343 added lactose”(u=1.26±0.33mPas) to acid whey ultra-filtrate (u=1.15±0.09 mPas) in Figure 3344 demonstrates the validity of the model system for BIONs separation experiments, since almost identical345 agglomeration (2768.7±59.1 nm vs. 2799.5±91.5 nm) and only minor deviations in average346 magnetophoretic sedimentationVvelocity (254.2±5.4 um s-vs.275.75±13.55 ums-)were347 measured. The addition of 100 gL(u=1.51±0.31 mPas) and 150 gL(u=1.70±0.31 mPas)348 lactose to SMUF slowed the BION agglomerates down to a magnetophoretic sedimentation velocity349 of 201.2±17.1 ums- and 217.9±2.8 ums, whereas the hydrodynamic diameter of the BION 350 agglomerates did not change significantly. Even though the triplicate measurement of the BION351 agglomerates average hydrodynamic diameter shows standard deviations of less than 5% in whey ultra- 352 filtrate and SMUF with added lactose, the actual agglomerates are present in a size distribution within353 a range from approximately 900 to 6000 nm as shown in Figure 4. aeweiv354 e 355 Figure 4: Particle size distribution of BIONs (0.7 gL) in whey ultra-filtrate (UF), simulated milk356 ultra-filtrate (SMUF) with added lactose (49.5 g L, and 100.0 g L) measured at pH 4.3. Bigger agglomerates may be present but are not quantifiable in the DLS device (max. 10 um) according to the manufacturer’s specifications. Whereas larger BION agglomerates rather facilitate magnetic separation, smaller agglomerates will have a lower magnetophoretic velocity in the same medium [39], 360 [40] and will rather complicate complete separation. When working with BIONs in RS-HGMS 361 processes, we recommend being aware of the particles’distinct agglomeration and separation behavior 362 in the anticipated process buffers and feed media. 363 3.2 Characterization of the RS-HGMS system 364 In addition to the BIONs agglomeration and separation behavior on a milliliter scale, we investigated 365 the RS-HGMS system responses for typical scenarios occurring throughout a magnetic bioseparation 366 process. In our RS-HGMS general operation protocol (see 2.2.4), the basic operation blocks of all 367 washing and elution cycles in step “c” follow the same sequence: (1) buffer exchange with BIONs 368 retained in the separation chamber, (2) resuspension within the separation chamber, (3) resuspension 369 through the loop, BIONs capture in the separation chamber (4) and from the loop volume (5). 370 The systematic RS-HGMS characterization aims to find optimal settings for PS and step duration371 within the basic operation blocks (1) and (5), and the preceding BIONs loading from differently viscous 372 feed media, which allow for an efficient process with minimized BIONs loss. Furthermore, we studied how many cycle repetitions of washing or elution sequences are necessary to strip BIONs from feed residua or to reach elution conditions. 3.2.1 Correlation of pump speed to volumetric flow To investigate which volumetric flow is achieved with a particular PS setting in the RS-HGMS, we measured the resulting flow to the respective PS setting in an automated program. The correlation of PS to volumetric flow is linear up to 70% PS (2144±2 mL min-l) for new tubing and up to 60% PS(1874±2mL minl) for old tubing with a slightly different slope (Supplement 5). Above the linearrange, a higher PS does not lead to substantially higher volumetric flow. The maximum output of theperistaltic pump (2700mL min) at higher delivery rates is apparently limited by the backpressure caused by the installed equipment (separation chamber, in-line analytical panel, valve blocks) [41]. Our experiments suggest that recording a performance curve prior to each experiment is advisable to ensure the determined settings for PS and step duration match the required volume turnover for media exchange in the respective process step. 3.2.2 Particle retention during buffer exchange In the course of a complete process cycle, different media are introduced into the RS-HGMS process,e.g., to fulfill washing, elution, or regeneration tasks. During the fluid exchange, the BIONsmagnetically adhere to the magnetized discs in the separation chamber. For bioseparation processes,Ebeler et al. recommended a separation chamber loading of approximately 80% of the filter capacity[12]. With the aim of balancing process time and minimized particle loss caused by the drag of thefluid, we performed the pump performance program in a partially loaded separation chamber (30.5 gBIONs ≈ 73 % filter capacity) and investigated for the maximum possible flow which can be appliedwithout BIONs carry-over. The observed BIONs concentrations, calculated from the in-lineabsorbance signal, are shown in Figure 5. After a negligible initial carry-over at 10% PS, the particlecarry-over remained stable below 0.01 gL up to 50% PS. Interestingly, the highest carry-over(0.021±0.017gL-) occurs at 60% PS, where increasing PS does not lead to a higher flow rate. Thehigh standard deviation is due to a sharp, brief rise in BIONs concentration shortly after the switch to60% PS. Nevertheless, the total BIONs loss was less than 0.8% of the BIONs initially retained in theprocess chamber. A setting between 25 - 50% PS seems favorable. Since we aimed to tailor a processwith minimum particle loss, we compromised between process speed and particle retention and chose40% PS for media exchange in the proof of concept run, corresponding to 1120±37 mL minl in thegiven setup. deiewv 405 406 Figure 5: BIONs carry-over as measured by the 280 nm absorbance signal during a pump performancecheck in the partially loaded (30.5 g BIONs) process chamber. 407 3.2.3 System characterization and duration of media exchange 408 409 We measured the RS-HGMS system response for tracer pulse injections at different PS settings in theempty and partially loaded separation chamber to find suitable settings for PS and step duration for 410 efficient media exchange events. The empty system volume Ve from the point of tracer injection 411 (bottom valve block) to absorbance measurement is 510 mL. The residence time distributions F(0) for 412 uniformly introduced tracer (BSA) pulses in Figure 6 were calculated from RS-HGMS system response 413 absorbance measurements (Equation 3) and show similar deviations from the ideal plug flow response 414 (Equation 4) behavior, almost independent of the volumetric flow when compared over the 415 dimensionless time 0. The premature detection of the tracer in the system response indicates the416 presence of bypass flow, whereas a delayed tracer suggests the presence of zones with reduced flow or417 back mixing within the RS-HGMS [32]. The flow simulation for water at 40% PS in the empty418 separator chamber in Figure 7 confirms the presence of reduced-flow zones (dark blue) and zones with419 accelerated flow (yellow to red) within the rotor and stator disc stack. When the separation chamber is 420 loaded with BIONs, bypass flow may be intensified by inhomogeneous BIONs deposition and further 421 blocking of reduced-flow zones. Previously published data from a comparable HGMS system suggest 422 that most particle mass is accumulated close to the filter inlet and less towards the outlet during 423 magnetic separation [14]. The existence of bypass flow is also reflected in the deviation between the 424 theoretical (t) and measured (t) residence times in the range of the desired PS setting for media 425 exchange (30% to 50% PS) in Table 1. The measured residence times fall below the theoretically 426 calculated, mean residence time in the empty system. For the partially loaded separation chamber (33 g 427 BIONs ~ 78% filter capacity), the effect is strengthened, as the solid BIONs in the chamber take up at 428 least 6.8 mL (全 1.3%) of the empty system volume, based on magnetite’s density of 5.18 g cm3[35], 429 and thereby decrease the free filter volume [14]. However, when calculating back to the theoretical 430 reactor volume VR (Equation 1) for the partially loaded separation chamber based on the measured 431 mean residence times t and averaged over the PS settings, the solid BIONs mass seems to reduce VR 432 by about 37 ± 8%, compared to the empty system volume. We could confirm this finding in a 433 proportional scale-down approach where we analyzed the volumes of free liquid after magnetic 434 separation of different BIONs masses with a handheld magnet in a constant total volume (Supplement 435 6). There as well, the respective solid BION’s mass reduced the free liquid volume by approximately 436 43%, meaning less buffer volume would be necessary for a complete buffer exchange in the loaded 437 separation chamber compared to the empty system. 438 Table 1: Calculated and measured mean residence times from tracer (BSA) pulse responses in the439 empty and partially loaded (33g BIONs) RS-HGMS system. The empty system volume from the440 injection point to absorbance measurement is 510 mL. Theoretical residence time t, s Measured residence time t, S Mean flow, mL min 30% PS, empty chamber 39.1 29.9 783 30% PS, loaded chamber 38.8 20.1 788 40% PS, empty chamber 29.5 22.8 1037 40% PS, loaded chamber 28.1 15.5 1090 50% PS, empty chamber 22.5 28.0 1360 50% PS, loaded chamber 21.7 13.7 1409 Figure 7: Flow simulation for water pumpedthrough the 0.25 L separation chamber discstackat40%PS ((1110 mL min-l) frombottom to top. The separator chamber isshown as a vertical bisection of the discstack, without the drive shaft adapter. Thezoom (yellow circle) shows the flow profilethrough the perforated discs in detail. Flowis colored by velocity. 443 During a media exchange in the RS-HGMS, we want to completely replace the previous with the new444 liquid to diminish the mixing of the buffers or the risk of product contamination. Since the BSA tracer445 always leaves the system as broadened peak (Supplement 7), we chose the filling duration for every446 wash, elution, and regeneration step according to the end of the response peak runout of the empty447 separation chamber. For the 40% PS setting in the proof-of-concept process, this is achieved after 52 s,448 equaling a buffer volume of about 982 mL. 449 3.2.4 Maximum magnetic filter capacity and separation of BIONs from viscous media 450 To determine the maximum filter capacity of the 0.25 L separation chamber for BIONs, we conducted 451 loading experiments with the magnetized chamber and determined the particle breakthrough based on 452 in-line absorbance or offline measurements. Since BIONs can be detected at low concentrations in-line 453 [14] (Supplement 8), we were able to define the threshold for a BIONs breakthrough to 0.1% of the 454 initial concentration (Co), which corresponds to a threshold concentration of 0.02 g L BIONs in our 455 setup. Compared to previously published studies with offline particle quantification in a similar device 456 [12], the in-line absorbance measurement allows for a tenfold lower breakthrough threshold and 457 thereby enhances the design of high-quality RS-HGMS processes with reduced particle loss in the458 loading step. oeweiveTime,Sr 460 Figure 8: Absorbance readings (280 nm) for magnetic filter capacity determination for BIONs in water461 at 25%, 30%, and 50% pump speed (PS). The indicated threshold for breakthrough detection is set to462 the absorbance corresponding to 0.1% of the BIONs concentration in the feed slurry (Co). 463 The absorbance readings during the breakthrough experiments for 30% PS and 50% PS in Figure 8464 show a rising signal shortly after introducing BIONs into the magnetized filter chamber. This indicates465 a premature BIONs breakthrough during the filter loading. For 30% PS, the threshold is reached after466 151 s at a filter loading of 40.6±0.5 g BIONs, and for 50% PS, the threshold is already surpassed after467 22 s, which corresponds to a loaded BIONs mass of only 8.7±0.1 g. The filter loading at 25% PS468 shows no significant increase in the absorbance signal, hence no particle drag, before a sharp469 breakthrough occurs after 211 s. Consequently, we used the 25% PS (640±2 mL min-) setting and470 determined the magnetic filter capacity to 42.3±0.5 g BIONs. 471 In the next step, we verified the suitability of this 25% PS setting for the loading step for higher viscous 472 feed material in our model feed medium SMUF with added lactose and quantified the BIONs 473 concentration in the collected flowthrough fractions. Figure 9 illustrates the BIONs concentrations in474 the discharge and shows that the BIONs drag increases by trend with higher viscosity, which is in475 accordance with the findings from the above-described magnetic separability in the respective viscous 476 media. Nevertheless, the detected particle drag maximum of 0.003 gL(n=1.26 mPas) to 477 0.013gL(n=2.06 mPa's) BIONs during loading of the separation chamber corresponds to less than478 0.07% of the BIONs co, which is a value well below the BIONs drag threshold of 0.1% co. Hence, appropriate separation of BIONs from acid whey and acid whey concentrates can be expected for a25% PS setting until the filter capacity is reached. We used 10 wt%, 30 wt%, and 50 wt% sucrosesolutions (n=1.26 mPa's,n=3.21 mPas andn= 15.04 mPas, respectively at 20℃ [42]) to simulatethe separation of BIONs from higher viscous feed media [43]. During the separation of BIONs, thedrag could be directly observed through the readings of the in-line absorbance signal (Figure 10). Inthis example, the selected 25% PS setting is only suitable for the 10%wt and 30%wt sucrose solution,whereas separating BIONs from the 50%wt sucrose solution would need an adaption of the PS settingto keep BIONs drag below the threshold. In the process development, when selecting a viscosity-increasing component, it should always be considered that i.e., sugars not only increase the viscosityof a liquid but can also have a stabilizing effect on BION agglomerates, leading to smaller and sloweragglomerates [26], hence making a complete magnetic separation in the RS-HGMS more difficult. Time,s Figure 9 BIONs concentration in the flowthrough of magnetic filter loadings at 25% PSfrom SMUF with 49.5, 100, 150, and 200 g L-added lactose. The threshold for breakthroughdetection11issett to 0.1%6 of theBIONsconcentration in the feed slurry (co=20gL). Figure 10: In-line absorbance readings (280 nm)at the outlet of the magnetic separation chamberduring the separation of BIONs from sucrosesolutions (10, 30, and 50%wt, pH 6.3-6.8) at25%PSThe thresholddfor breakthroughdetection isto an absorbancessignalSetcorrespondingto0.1%oftheBIONsconcentration in the feed slurry (co=20gL). 3.2.5 Particle capture in the loop 491 To determine suitable parameter settings for PS and time in the BIONs capture steps, we circulated492 29.8 g (~ 70% filter capacity) BIONs through the RS-HGMS system loop at different PS settings and493 captured them in the magnetized separation chamber. The initial BIONs concentration in the loop was494 38.5 gL(VLoop=0.773 L). After switching the magnet on, we monitored the gradual reduction of 495 BIONs concentration in the loop through the in-line absorbance measurement. We chose PS between 496 25% to 60% to cover the range between the maximum possible flow during the loading procedure (see 497 section 3.2.4) and the upper limit of the linear region of the PS-to-flow correlation (see section 3.2.1).498 The absorbance measurements in Table 2 show an onset, indicating the BIONs concentration in the499 loop diminishes to below 0.5 g L, within a 10-second time frame for all applied PS settings. In any500 case, an absorbance steady-state with a low remaining BIONs concentration of maximum 0.017 g L1501 was reached after approximately three to four minutes, showing a successful separation of BIONs,502 even at the highest flow (1367 mL min). The in-line steady-state absorbance was always slightly503 higher than baseline and persisted after thoroughly purging the analytical panel with water. Since the504 baseline could be reset through cleaning with oxalic acid (data not shown), a hazing with BIONs on505 the flow cells sapphire window must have occurred for the BIONs in water system. Hence, the actual506 BIONs concentration in the loop at the end of the capture steps is presumably lower than the measured,507 apparent concentration. From the in-line data, we identified 30% PS as the most beneficial setting for508 our setup: BIONs capture was complete after the circulation of 0.803 L, which is only 4% more than509 one complete loop volume turnover. The comparably quick BIONs capture at the 60% PS setting510 required a threefold higher volume turnover to reach steady-state, which would mean higher511 mechanical stress on circulating components in a bioseparation process. Since mechanical stress can 512 harm proteins [44], choosing a lower turnover may lower the risk of product quality loss. 513 Table 2: Overview of BIONs capture in the RS-HGMS loop at different pump speed settings. Pump speed,% 25 30 35 40 45 60 Flow, mL min- 581±8 676±12 799±11 923±11 1055±13 1367±16 Time to measurement onset 24 23 28 29 26 33 (CBIONs, loop,<0.5gL-),s Volume turnover until 261±4 259±5 373±5 446±5 457±6 752±9 measurement onset, mL 186 217 220 209 199 Time to steady state, s 244 1636±19 1592±20 2494±29 Volume turnover until steady state,mL 1063±15 803±14 1349±19 0.004 0.007 0.008 Apparent CBIONs in steady state, gL-I 0.007 0.017 0.011 515 Although the current in-line absorbance measurement is well suited for defining parameters for loop 516 capture, monitoring the initial progression of the magnetic BIONs capture is beyond the limits of the517 optical sensor. Given that water (0.998 g cm³ at 20°℃ [45]) and magnetite differ considerably in their518 density, the embedding of the in-line density measurement from the Coriolis flow meter [41] into the519 collectible data stream may close this gap in a future analytics setup and allow to monitor the BIONs520 capture progression outside of the optical detection limits. 521 3.3 Proof-of-concept process 522 To test the optimized RS-HGMS protocol for the separation of LF from acid whey (n=1.34 mPa's) 523 in a salt elution process, we chose the settings for the basic operation blocks “BIONs load”(0),“buffer524 exchange (1)”,“BIONs capture (loop) (5)” in the BIONs loading, wash and elution steps according to525 the RS-HGMS characterization experiments in section 3.2. The parameter settings are summarized in526 Table 3. In the elution steps, the duration of resuspension in the chamber and through the loop was潮extended from 60 s (wash) to 90 s to enhance the desorption of LF. In preliminary tests (data not潮shown), we found LF desorbs from BIONs at 1 M NaCl in 10 mM sodium acetate buffer (pH 4.3,沙K= 85.1 mS cm), but due to dilution with wash buffer from the loop volume, elution conditions are530 not reached in the first elution cycle. To achieve elution in the first high-salt elution step despite 531 dilution, we doubled the NaCl molarity in the high-salt elution buffer. 532 Table 3: Summary of parameter settings for basic operation blocks in the RS-HGMS proof of concept533 process cycles. BIONs Buffer Resuspensio Resuspens BIONs BIONs Total cycle load * exchange n within the ion capture capture time separation through (separatio loop) chamber the loop n chamber) Step number 0 1 2 3 4 5 Pump speed,% PS 25 40 0 80 0 30 一一 Mixer speed 0% 0% 80% 80% 0% 0% -- Magnet on off off Duration, S 150 52 60/90** 60/90** 60 180 412/472** 534 * to achieve a ~80% capacity loading of the chamber for cBIONs,0=20 g L-l, **for elution, incubation time was extended to535 90s During magnetic filter loading with BIONs from whey, 32 g BIONs (~76% max. filter capacity) were537introduced into the RS-HGMS. The discharge fractions were each collected through displacement with a new buffer in the buffer228exchange step (step 1) of the subsequent cycle (Figure 11, A-C). The favored completion of 540 displacement in the separation chamber is visible in the plateauing of the absorbance signal at the end 541 of step 1. In step 2, the BIONs are resuspended only within the separation chamber; in step 3, the 542 suspension is additionally circulated through the loop, which leads to an abrupt rise of the absorbance 543 signal. The absorbance exceeds the sensor's limit, leading to an invalid signal output through step 4. 544 Once the BIONs concentration in the loop drops below 0.5 g L, the signal finally plateaus in the 545 capture step (5). The decreasing signal plateauing in step 5 of the two washing cycles indicates the 546 flushing out of unbound (Figure 11,A) contaminants and during the low-salt elution (Figure 11, B) of 547 slightly bound contaminants. The sudden signal surge during the first cycle of the high-salt elution 548 (Figure 11, C) suggests the successful elution of LF at a high concentration with a gradual reduction549 concentration in the subsequent elution cycles. 550reet pot nrinperP Figure 11: Overview of the monitored in-line signals during the proof-of-concept process: Therespective absorbance (280 nm) readings are shown in (A) for the washing steps, in (B) for thecontaminant elution steps (Elu I) and in (C) for the three main high-salt elution steps (Elu II). Eachcycle follows the steps buffer exchange (1), resuspension within the separation chamber (2) andthrough the system bypass loop (3), magnetic capture of BIONs in the separation chamber (4) andfrom the bypass loop (5). During step (3) and (4) absorbance detection maximum is exceeded by highBIONs concentration leading to an invalid measurement. (D) shows the conductivity as comparisonbetween initial filling and after mixing within the RS-HGMS loop, and the target values for Elu I(K=9.66 mS cm), Elu II (K=143.2 mS cm-l) and regeneration (K=147.3 mS cm-) media. 551 The summarized conductivity measurements in Figure 11 (D) show that after the filling with the new 552 buffer from the bottom to the top valve, target conductivity is not reached and drops during circulation 553 within the loop due to mixing with the preceding buffer. Two filling cycles were necessary to reach 554 the buffer's initial conductivity after buffer exchange from wash buffer to elution buffer I, and three 555 cycles to reach the target conductivity of the high-salt elution II buffer. However, the target 556 conductivity for LF elution (85.1 mS cml) in the first high-salt elution (Elu Ⅱ.1) was reached as 557 planned because of the doubled salt concentration in the high-salt elution buffer. A different filling 558 technique would need to be established to achieve complete buffer replacement in one cycle. 559 Exchanging buffer from the top to the bottom valve block allows the simultaneous buffer replacement 560 in the loop and the separation chamber but leads to the introduction of air bubbles into the process (data 561 not shown), which would severely disturb the process (e.g., foam formation, product, and particle loss) 562 [46]. Installing another automatic valve that allows for the separate draining of the loop volume could563 be a suitable corrective but would also require reprogramming the RS-HGMS proprietary control564 system.Offline measurements in Figure 12 (A) reveal a BIONs carry-over (0.069 g Ll) in the flow565 through, which is substantially higher than expected from the SMUF+lactose model system (0.003 gL-566 1, section 3.2.4), whereas the BIONs concentration of 0.027 -0.037 g L-l found in LF elution fractions 567 (Elu II 1-3) was in the expected magnitude. A total of 0.38 g BIONs left the process in the discharge 568 fractions, corresponding to 1.2% of the BIONs mass initially present in the process. Unbound whey 569 proteins were successfully reduced without desorption of LF in the wash and low-salt elution (Elu I) 570 cycles. Partial elution of bound LF was achieved at a concentration of 0.95 g L in the first high-salt elution fraction with a purity of 40% and at 0.47 g Lwith a purity of 67% in the second fraction. The elution fractions II.1 and II.2 in Figure 12 (B) show the typical salmon color of dissolved LF [47]. B A 573 Figure 12 Proof of concept process overview. (A) offline measurements for total protein, lactoferrin,574 and BIONs concentration in discharge fractions of the process. (B) lactoferrin elution fractions Elu II.1, 575 Elu II.2 as discharged from the RS-HGMS. 577 The offline measurements for total protein shown in Figure 12 (A) agree with the trend of the in-line 578 measured absorbance signal after capturing BIONs in the loop (Figure 11 A-C). However, direct quantification of protein concentration from the in-line absorbance data is impaired by the residual BIONs, which already superimpose the proteins’ absorbance signal at very low concentrations (Supplement 8). In the future, the installation of advanced process analytical technology such as in- line Raman may open the possibility of providing simultaneous quantification and identification of BIONs [36], proteins, and other compounds [48] and thereby allow for more precise process regulation. In total, this proof-of-concept process with BIONs showed an LF yield of 41%, making it able tocompete with yields in previously published magnetic separation processes with functionalizedmicroparticles, e.g., a yield of 47.4% in three cycles with purities of 12%, 35%, and 61% [49] or ayield of 49% in three cycles with purities of 66%, 83%, and 97%[50]. Further optimization of elutionconditions and fine-tuning of the processing sequence will further improve the process. The previouslydescribed problems with foam formation [46] were not observed in the current RS-HGMS. Thepotential formation of air bubbles is easily detectable as sharp spikes (see example in Supplement 9)in the absorbance readings, allowing the operator to intervene before the whole process fails. 4 Conclusion 607 The need for new efficient, economical, and selective separation methods in downstream processingwas identified over a decade ago [51]. In this study, we took a further step to advance magneticbioseparation towards an industrially deployable platform: We equipped a commercially available RS-HGMS with in-line sensors (pH, conductivity, absorbance, flow) of hygienic design and used the in-line readings to generate a generic operation protocol for bioseparation processes with inexpensiveBIONs. This operation protocol is optimized for minimized BIONs loss and can be easily adapted todifferent bioseparation tasks and feed media by adapting the settings for PS, step duration, and cyclerepetition in the basic operation blocks. After initiation, the protocol runs automatically, and in-linesignals and RS-HGMS status are continuously monitored and documented. With the guidance weprovide on how this adaption can be accelerated through continuous in-line analysis, it will becomemore convenient to develop customized, efficient RS-HGMS processes in the future. This guidancemay be of particular interest to the increasing number of companies that aim to turn side- and wastestreams into new, non-conventional feedstocks for biotechnological processes [52] and the productionof sustainable bulk chemicals [53]. With the selective magnetic separation of LF from crude acid wheywith BIONs, we delivered a proof-of-concept for a complex separation task with the optimized RS- 608 HGMS operation protocol. However, the exact in-line quantification of protein concentration based on 609 the absorbance signal remains challenging because BIONssuperimpose the signal. Further 610 improvement of the in-line analytics instrumentation will be necessary to distinguish between BIONs 611 and protein. Possible solutions could be the integration of the density measurement data of the already 612 installed Coriolis flow meter into the sample data stream for the quantification of BIONs, or the 613 addition of an in-line Raman sensor, which may encompass the simultaneous quantification of several 614 proteins, sugars, and BIONs. Nevertheless, integrating in-line PAT into the RS-HGMS process is a 615 further step towards competitiveness with current chromatography workstations. The generated data 616 sets are a first step towards building a database for implementing an artificial intelligence-assisted process design. In conclusion, we believe magnetic separation combined with in-line analytics and efficient process control is a promising technique to meet the upcoming demands for innovative 619 separation methods in industrial-scale downstream processing. 620 5 Conflict of Interest 621 The authors declare that the research was conducted in the absence ofany commercial or financial622 relationships that could be construed as a potential conflict of interest. 623 6 Funding 624 This work was supported by the German Federal Office for Agriculture and Food, Germany (BLE 625 281A104116). We appreciate the support from the German Research Foundation (DFG) (Project626 Number: 441672360). 627 7 Acknowledgments We would like to thank Daniel Amrein (Chair of Carbon Composites, Technical University of Munich)0for the support with the viscosity measurements, Chiara Turrina for the SQUID measurement, and 630 Leonie Wittmann for supporting with the COMSOL simulation. In addition, we would like to thank 631 our project partners, the University of Hohenheim and Schwarzwaldmilch GmbH, for providing632 lactoferrin and acid whey and Endress+Hauser GmbH+Co. KG for the photographs of the RS-HGMS 633 setup. 634er口 635 8 References 636 [1]M. Franzreb, N. Ebner, M. Siemann-Herzberg, T.J. Hobley, und O. R. T. Thomas,,,Productrecovery by high-gradient magnetic fishing", in Process scale bioseparations for thebiopharmaceutical industry, 1st edition., CRC Press, 2006, S. 83-121. [2]S. S. Leong, Z. Ahmad, S. C. Low, J. Camacho, J. Faraudo, und J. Lim, ,,Unified view ofmagnetic nanoparticle separation under magnetophoresis", Langmuir, Bd. 36,Nr. 28, S. 8033-8055, Juli 2020, doi: 10.1021/acs.langmuir.0c00839. [31]J. J. Hubbuch, D. B. Matthiesen, T. J. Hobley, und O. R. Thomas,,,High gradient magneticseparation versus expanded bed adsorption: a first principle comparison", Bioseparation, Bd.10, Nr. 1-3, S. 99-112,2001, doi: 10.1023/a:1012034923621. [4] S. P. Schwaminger, P. Fraga-Garcia, M. Eigenfeld, T. M. Becker, und S. Berensmeier,,,Magnetic separation in bioprocessing beyond the analytical scale: from biotechnology to thefood industry“, Front. Bioeng. Biotechnol., Bd. 7, S. 233, Sep. 2019, doi:10.3389/fbioe.2019.00233. A. Heeboll-Nielsen, S. F. L. Justesen, T. J. Hobley, und O. R. T. Thomas,,,Superparamagneticcation-exchange adsorbents for bioproduct recovery from crude process liquors byhigh-gradient magnetic fishing", Separation Science and Technology, Bd. 39, Nr. 12, S. 2891-2914, Dez. 2004, doi: 10.1081/SS-200028791. [6]L. Chen, C. Guo, Y. Guan, und H. Liu,,,Isolation of lactoferrin from acid whey by magneticaffinity separation", Separation and Purification Technology, Bd. 56, Nr. 2,S. 168-174, Aug.2007, doi: 10.1016/j.seppur.2007.01.019. [7]I. Safarik, L. Ptackova, und M. Safarikova,,,Large-scale separation of magnetic bioaffinityadsorbents", Biotechnology Letters, Bd. 23, S. 1953-1956,2001. [8]C. T. Yavuz, A. Prakash, J. T. Mayo, und V. L. Colvin, ,,Magnetic separations: From steelplants to biotechnology“, Chemical Engineering Science, Bd. 64, Nr. 10, S. 2510-2521,Mai2009, doi: 10.1016/j.ces.2008.11.018. [9]P. Nicolas, M. Luján Ferreira, und V. Lassalle,,,A review of magnetic separation of wheyproteins and potential application to whey proteins recovery, isolation and utilisation“, JournalofFood Engineering, Okt. 2018, doi: 10.1016/j.foodeng.2018.10.021. [10] M. Ebeler, F. Pilgram, T. Wellhofer, K. Frankenfeld, und M. Franzreb, ,,First comprehensiveview on a magnetic separation based protein purification processes: from process developmentto cleaning validation of a GMP-ready magnetic separator", Eng. Life Sci.,S. elsc.201800183,Juli 2019, doi: 10.1002/elsc.201800183. [11] M. Ebeler, O. Lind, N. Norrman, R. Palmgren, und M. Franzreb,,,One-step integratedclarification and purification of a monoclonal antibody using Protein A Mag Sepharose beadsand a cGMP-compliant high-gradient magnetic separator", New Biotechnology, Bd. 42, S. 48-55, Mai 2018, doi: 10.1016/j.nbt.2018.02.007. 674 675 [12] M. Ebeler, F. Pilgram, K. Wolz, G. Grim, und M. Franzreb,,,Magnetic separation on a newlevel: Characterization and performance prediction of a cGMP compliant“Rotor-Stator”high-gradient magnetic separator", Biotechnology Journal, Bd. 13, Nr. 2,S. 1700448, Feb. 2018, doi:10.1002/biot.201700448. 676 677 [13] P. Fraga-Garcia, P. Kubbutat, M. Brammen, S. Schwaminger, und S. Berensmeier,,,Bare ironoxide nanoparticles for magnetic harvesting of microalgae: From interaction behavior to processrealization“, Nanomaterials, Bd. 8, Nr. 5, S. 292,Mai 2018, doi: 10.3390/nano8050292. [14] Y. S. Shaikh, C. Seibert, C. Schumann, M. J. Ferner, H. Raddatz, und P. Kampeis,,,Optimizinga rotor-stator filter matrix for high-gradient magnetic separation of functionalized magneticparticles", Eng. Life Sci., Bd. 16, Nr. 5, S. 465-473, Juli 2016, doi: 10.1002/elsc.201500115. [15] M. Franzreb und C. Reichert,,,High gradient magnetic separator", US 7,506,765 B2, Januar2009 [16] A. Meyer, D. B. Hansen, C. S. G. Gomes, T. J. Hobley, O. R. T. Thomas, und M. Franzreb,,,Demonstration of a strategy for product purification by high-gradient magnetic fishing:Recovery of superoxide dismutase from unconditioned whey", Biotechnol Progress, Bd. 21, Nr.1, S. 244-254, 2005, doi: 10.1021/bp049656c. [17] P. Fraga-Garcia, M. Brammen, M. Wolf, S. Reinlein, M. Freiherr von Roman, und S.Berensmeier,,,High-gradient magnetic separation for technical scale protein recovery using lowcost magnetic nanoparticles“, Separation and Purification Technology, Bd. 150, S. 29-36, Aug.2015, doi: 10.1016/j.seppur.2015.06.024. [18] Y. S. Shaikh,S. Schussmann, M. Lieblang, und P. Kampeis,,,Einsatz eines Ultraschall-Durchflussmessgerates zur Regelung des Volumenstroms in der Hochgradienten-Magnetseparation", Chemie Ingenieur Technik, Bd. 87, Nr. 5, S. 618-625, Mai 2015, doi:10.1002/cite.201400048. [19] European Commission, ,,EudraLex - Volume 4 - Good Manufacturing Practice (GMP)guidelines“, 1. November 2022. https://health.ec.europa.eu/medicinal-products/eudralex/eudralex-volume-4_en (zugegriffen 1. November 2022). [20] Food and Drug Administration (FDA),,,Guidance for industry PAT-A framework forinnovative pharmaceutical development, manufacturing, and quality assurance", Okt. 2004,[Online]. Verfugbar unter: https://www.fda.gov/regulatory-information/search-fda-guidance-documents/pat-framework-innovative-pharmaceutical-development-manufacturing-and-quality-assurance [21] E. Krolitzki, S. P. Schwaminger, M. Pagel, F. Ostertag, J. Hinrichs, und S. Berensmeier,,,Current practices with commercial scale bovine lactoferrin production and alternativeapproaches“, International Dairy Journal, Bd. 126, S. 105263, Marz 2022, doi:10.1016/j.idairyj.2021.105263. [22] N. Bansal und B. Bhandari, ,,Functional milk proteins: production and utilization-Whey-basedingredients“, in Advanced Dairy Chemistry, P. L. H. McSweeney und J. A. O’Mahony, Hrsg.New York, NY: Springer New York, 2016, S. 67-98. doi: 10.1007/978-1-4939-2800-2_3. [23] J. Chandrapala u. a.,,,Properties of acid whey as a function of pH and temperature“, Journal ofDairy Science, Bd. 98,Nr. 7, S. 4352-4363, Juli 2015, doi: 10.3168/jds.2015-9435. [24] F. Ostertag, C. M. Schmidt, S. Berensmeier, und J. Hinrichs,,,Development and validation of anRP-HPLC DAD method for the simultaneous quantification of minor and major whey proteins",Food Chemistry, S. 128176, Sep. 2020, doi: 10.1016/j.foodchem.2020.128176. 717 718 [25] S. P. Schwaminger, H. Werner, M. Wengler, und S. Srinivasan,,,Magnetic extraction ofcalcium oxalate crystals with iron oxide nanoparticles", Current Directions in BiomedicalEngineering, Bd. 8, Nr. 2,S. 612-615, Sep. 2022, doi: 10.1515/cdbme-2022-1156. 719 [26] L. Wittmann, C. Turrina, und S. P. Schwaminger,,,The effect of pH and viscosity onmagnetophoretic separation of iron oxide nanoparticles",Magnetochemistry, Bd. 7, Nr. 6, S. 80,Juni 2021, doi: 10.3390/magnetochemistry7060080. [27] P. F. Fox, T. Uniacke-Lowe, P. L. H. McSweeney, und J. A. O'Mahony, Dairy chemistry andbiochemistry. Cham: Springer International Publishing, 2015. doi: 10.1007/978-3-319-14892-2. [28] J. Dumpler, I. Kieferle, H. Wohlschlager, und U. Kulozik,,,Milk ultrafiltrate analysis by ionchromatography and calcium activity for SMUF preparation for different scientific purposes andprediction of its supersaturation", International Dairy Journal, Bd. 68, S. 60-69, Mai 2017, doi:10.1016/j.idairyj.2016.12.009. [29] H.-C. Roth, S. P. Schwaminger, F. Peng, und S. Berensmeier, ,,Immobilization of cellulase onmagnetic nanocarriers", ChemistryOpen, Bd. 5,Nr. 3, S. 183-187, Juni 2016, doi:10.1002/open.201600028. [30] O. Mykhaylyk u. a.,,,Magnetophoretic velocity determined by space- and time-resolvedextinction profiles", IEEE Magn. Lett., Bd. 6, S. 1-4,2015, doi: 10.1109/LMAG.2015.2474306. [31] G. Carta und A. Jungbauer, Protein chromatography: Process development and scale-up.Weinheim: Wiley-VCH, 2010. [32] J. Hagen, Chemiereaktoren: Auslegung und Simulation, 1. Aufl. Wiley, 2004. doi:10.1002/352760359X. [33] T. Salmi, J.-P. Mikkola, und J. Warna, Chemical reaction engineering and reactor technology,2. Aufl. Boca Raton, FL : CRC Press, Taylor & Francis Group, 2019.: Chapman and Hall/CRC,2019. doi: 10.1201/9781315200118. [34] G. Emig, E. Klemm, E. Fitzer, und W. Fritz, Technische Chemie: Einfiihrung in die chemischeReaktionstechnik, 5., Aktualisierte und erg. Aufl. Berlin Heidelberg: Springer, 2005. [35] R. M. Cornell und U. Schwertmann, The iron oxides: structure, properties, reactions,occurrences, and uses, 2nd, completely rev. and extended ed Aufl. Weinheim: Wiley-VCH,2003. [36] S. P. Schwaminger, D. Bauer, P. Fraga-Garcia, F. E. Wagner, und S. Berensmeier,,,Oxidationof magnetite nanoparticles: impact on surface and crystal properties", CrystEngComm, Bd. 19,Nr. 2, S. 246-255,2017, doi: 10.1039/C6CE02421A. [37] S. Laurent u. a.,,,Magnetic iron oxide nanoparticles: synthesis, stabilization, vectorization,physicochemical characterizations, and biological applications", Chem. Rev., Bd. 108, Nr. 6,S.2064-2110, Juni 2008, doi: 10.1021/cr068445e. [38] S. P. Schwaminger u. a.,,,Bio-nano interactions: cellulase on iron oxide nanoparticle surfaces",Adsorption, Bd. 23,Nr. 2-3, S. 281-292,Apr. 2017, doi: 10.1007/s10450-016-9849-y. [39] S. P. Schwaminger, K. Schwarzenberger,J. Gatzemeier, Z. Lei, und K. Eckert,,,Magneticallyinduced aggregation of iron oxide nanoparticles for carrier flotation strategies", ACS Appl.Mater. Interfaces, Bd. 13, Nr. 17, S. 20830-20844, Mai 2021, doi: 10.1021/acsami.1c02919. [40] M. Franzreb,,,Magnettechnologie in der Verfahrenstechnik wassriger Medien FZKA6915“,2003. 759 [41] E. Ignatowitz, Chemietechnik, 13. Auflage. Haan: Europa-Lehrmittel Nourney, Vollmer GmbH& Co. KG, 2022. 760 [42] V. R. N. Telis, J. Telis-Romero, H. B. Mazzotti, und A. L. Gabas,,,Viscosity of aqueouscarbohydrate solutions at different temperatures and concentrations", International Journal ofFood Properties, Bd. 10, Nr. 1, S. 185-195,Jan. 2007, doi: 10.1080/10942910600673636. [43] H.-C. Roth, A. Prams, M. Lutz, J. Ritscher, M. Raab, und S. Berensmeier,,,A high-gradientmagnetic separator for highly viscous process liquors in industrial biotechnology“, Chem. Eng.Technol., Bd. 39, Nr. 3, S. 469-476, Marz 2016, doi: 10.1002/ceat.201500398. [44] N. Deiringer und W. Friess,,,Proteins on the rack: Mechanistic studies on protein particleformation during peristaltic pumping", Journal of Pharmaceutical Sciences, Bd. 111,Nr. 5, S.1370-1378, Mai 2022, doi: 10.1016/j.xphs.2022.01.035. [45] J. R. Rumble, Hrsg., CRC handbook of chemistry and physics, 102nd edition 2021-2022. BocaRaton London New York: CRC Press. 2021. [46] S. P. Schwaminger u. a.,,,Magnetic one-Step purification of his-tagged protein by bare ironoxide nanoparticles“, ACS Omega, Bd. 4, Nr. 2, S. 3790-3799, Feb. 2019, doi:10.1021/acsomega.8b03348. [47] Food and Drug Administration (FDA), ,,GRAS Notice No. 464. Generally recognized as safedetermination for cow’s milk derived lactoferrin as a component of cow’s milk products andchewing gum". 21. Februar 2013. [48] Y. K. Lin, H. Y. Leong, T. C. Ling, D.-Q. Lin, und S.-J. Yao,,,Raman spectroscopy as processanalytical tool in downstream processing of biotechnology“, Chinese Journal of ChemicalEngineering, Bd. 30, S. 204-211, Feb. 2021, doi: 10.1016/j.cjche.2020.12.008. [49] A. Meyer, S. Berensmeier, und M. Franzreb,,,Direct capture of lactoferrin from whey usingmagnetic micro-ion exchangers in combination with high-gradient magnetic separation",Reactive and Functional Polymers, Bd. 67,Nr. 12, S. 1577-1588, Dez. 2007, doi:10.1016/j.reactfunctpolym.2007.07.038. [50] G. N. Brown, C. Miller, E. Theodosiou, M. Franzreb, und O. R. T. Thomas,,,Multi-cyclerecovery of lactoferrin and lactoperoxidase from crude whey using fimbriated high-capacitymagnetic cation exchangers and a novel“rotor-stator”high-gradient magnetic separator",Biotechnology and Bioengineering, Bd. 110, Nr. 6, S. 1714-1725,2013, doi: 10.1002/bit.24842. [51] K. Keller, T. Friedmann, und A. Boxman,,,The bioseparation needs for tomorrow", Trends inBiotechnology, Bd. 19, Nr. 11, S. 438-441, Nov. 2001, doi: 10.1016/S0167-7799(01)01803-0. [52] L. M. Blank, T. Narancic, J. Mampel, T. Tiso, und K. O’Connor,,,Biotechnological upcyclingof plastic waste and other non-conventional feedstocks in a circular economy“, Current Opinionin Biotechnology, Bd. 62, S. 212-219, Apr. 2020, doi: 10.1016/j.copbio.2019.11.011. [53] J.M. Woodley,,,Towards the sustainable production of bulk-chemicals using biotechnology“,New Biotechnology, Bd. 59, S. 59-64, Nov.2020, doi: 10.1016/j.nbt.2020.07.002. 797 9 Supplementary Material 798 Supplement 1: Settings for the de-aeration of the RS-HGMS system. The table showsthe799 corresponding duration, percentage of pump performance (PP), percentage of mixing performance800 (MP), and valve settings (Valve V1 to V13) for each sub-step of the routine. The “x"indicates an open801 valve. The Magnet (M) is switched off during the de-aeration procedure. 802 Sub-step Time,S PP.% MP.% V1 V2 V3 V4 V5 V6 V8 V9 V10 VV11 V12 V13 M VentFill 60 70 0 X X off VentFillLoop 10 -80 0 X X X X off VentFill2 20 70 0 X X off VentFillHose1 10 25 0 X X off VentFillHose2 6 25 0 X X off VentFlush1 60 60 0 X X off VentFillHose5 8 -70 0 X X off VentMix30 60 70 30 X X off VentMix80 30 70 80 X X off VentPause 15 0 0 off VentFlush2 45 70 0 X X off 803 804 805 Supplement 2: Absorbance spectra of SMUF and SMUF with lactose. Wavelength,nm Supplement 3: Settings for the BIONs recovery from the RS-HGMS system. The table shows the 809 corresponding duration, percentage of pump performance (PP), percentage of mixing performance 810 (MP), and valve settings (Valve V1 to V13) for each sub-step of the routine. After resuspension of 811 the particles (RecRes), the particles are drained, while new DI water enters the system from the top 812 (RecEmpty). The“x”indicates an open valve. The Magnet (M) is switched off during the recoveryprocedure. Sub-step Time,S PP,% MP,% V1 V2 V33 V4 V5 V6 V8 V9 V10 V11 V12 V13 M RecRes 60 0 80 off RecEmpty 45 -50 0 X X off 814 815816 Supplement 4: Scherrer and Bragg Equation817 Scherrer equation for spherically-shaped particles measured with Mo Ko radiation:8180.89·0.07039nm819 L=A(20)· cos 0o 820821 Bragg equation for cubic system: 822 823 824 825 Supplement 5: Correlation of volumetric flow to pump speed recorded through an automated protocol826 with a new and an old pump hose (four months used). 827erp 三 A Supplement 6: (A) Correlation of available liquid volume depending on the BIONs concentrationafter magnetic separation and the experimental set-up (B), where sample 1 corresponds to the highestBIONs concentration (58.2g L-), and sample 8 corresponds to the lowest tested concentration(6.5 g L). BIONs are magnetically separated to the reaction tube’s bottom by a handheld magnet. 829 830 831 Supplement 7: Exemplary system responses for BSA (a) and BIONs (b) pulses as measured via832 absorbance (280 nm). Each pulse was conveyed through the RS-HGMS from bottom to top at 30% PS833 (815 mL min-l), 40% PS (1110 mL min), and 50% PS (1475 mL min), respectively. 834 835 dew836 e 837 Supplement 8: Exemplary calibration of the in-line optical sensor (280 nm) at the RS-HGMS with838 BIONs in water. 839 840 841 842 Supplement 9: Sharp spikes in the in-line absorbance signal indicate the presence of air bubbles in843 the process. rineprP
确定


还剩34页未读,是否继续阅读?

产品配置单

中国格哈特为您提供《使用杜马斯燃烧法全自动蛋白质测定仪检测酸乳清蛋白的蛋白质含量》,该方案主要用于其他乳制品中营养成分检测,参考标准--,《使用杜马斯燃烧法全自动蛋白质测定仪检测酸乳清蛋白的蛋白质含量》用到的仪器有格哈特杜马斯定氮仪DT N Pro
推荐专场


相关方案
更多
该厂商其他方案
更多