


在乳品工业中,氮/蛋白质的测定是食品质量控制和研发的重要手段。食品市场全球化要求对产品特性进行准确的质量控制,以保护商业价值,维护消费者健康和制造商声誉。官方法规制定了蛋白质含量和标签要求,使消费者能够比较这些乳制品的价格和质量。因此,需要使用准确的仪器分析技术,避免使用传统步骤繁琐的以及有毒化学品分析的凯氏方法,目前已经大规模的使用Dumas杜马斯燃烧法进行分析,杜马斯方法已经得到各种协会如AOAC,ISO等官方机构批准使用。
方案详情

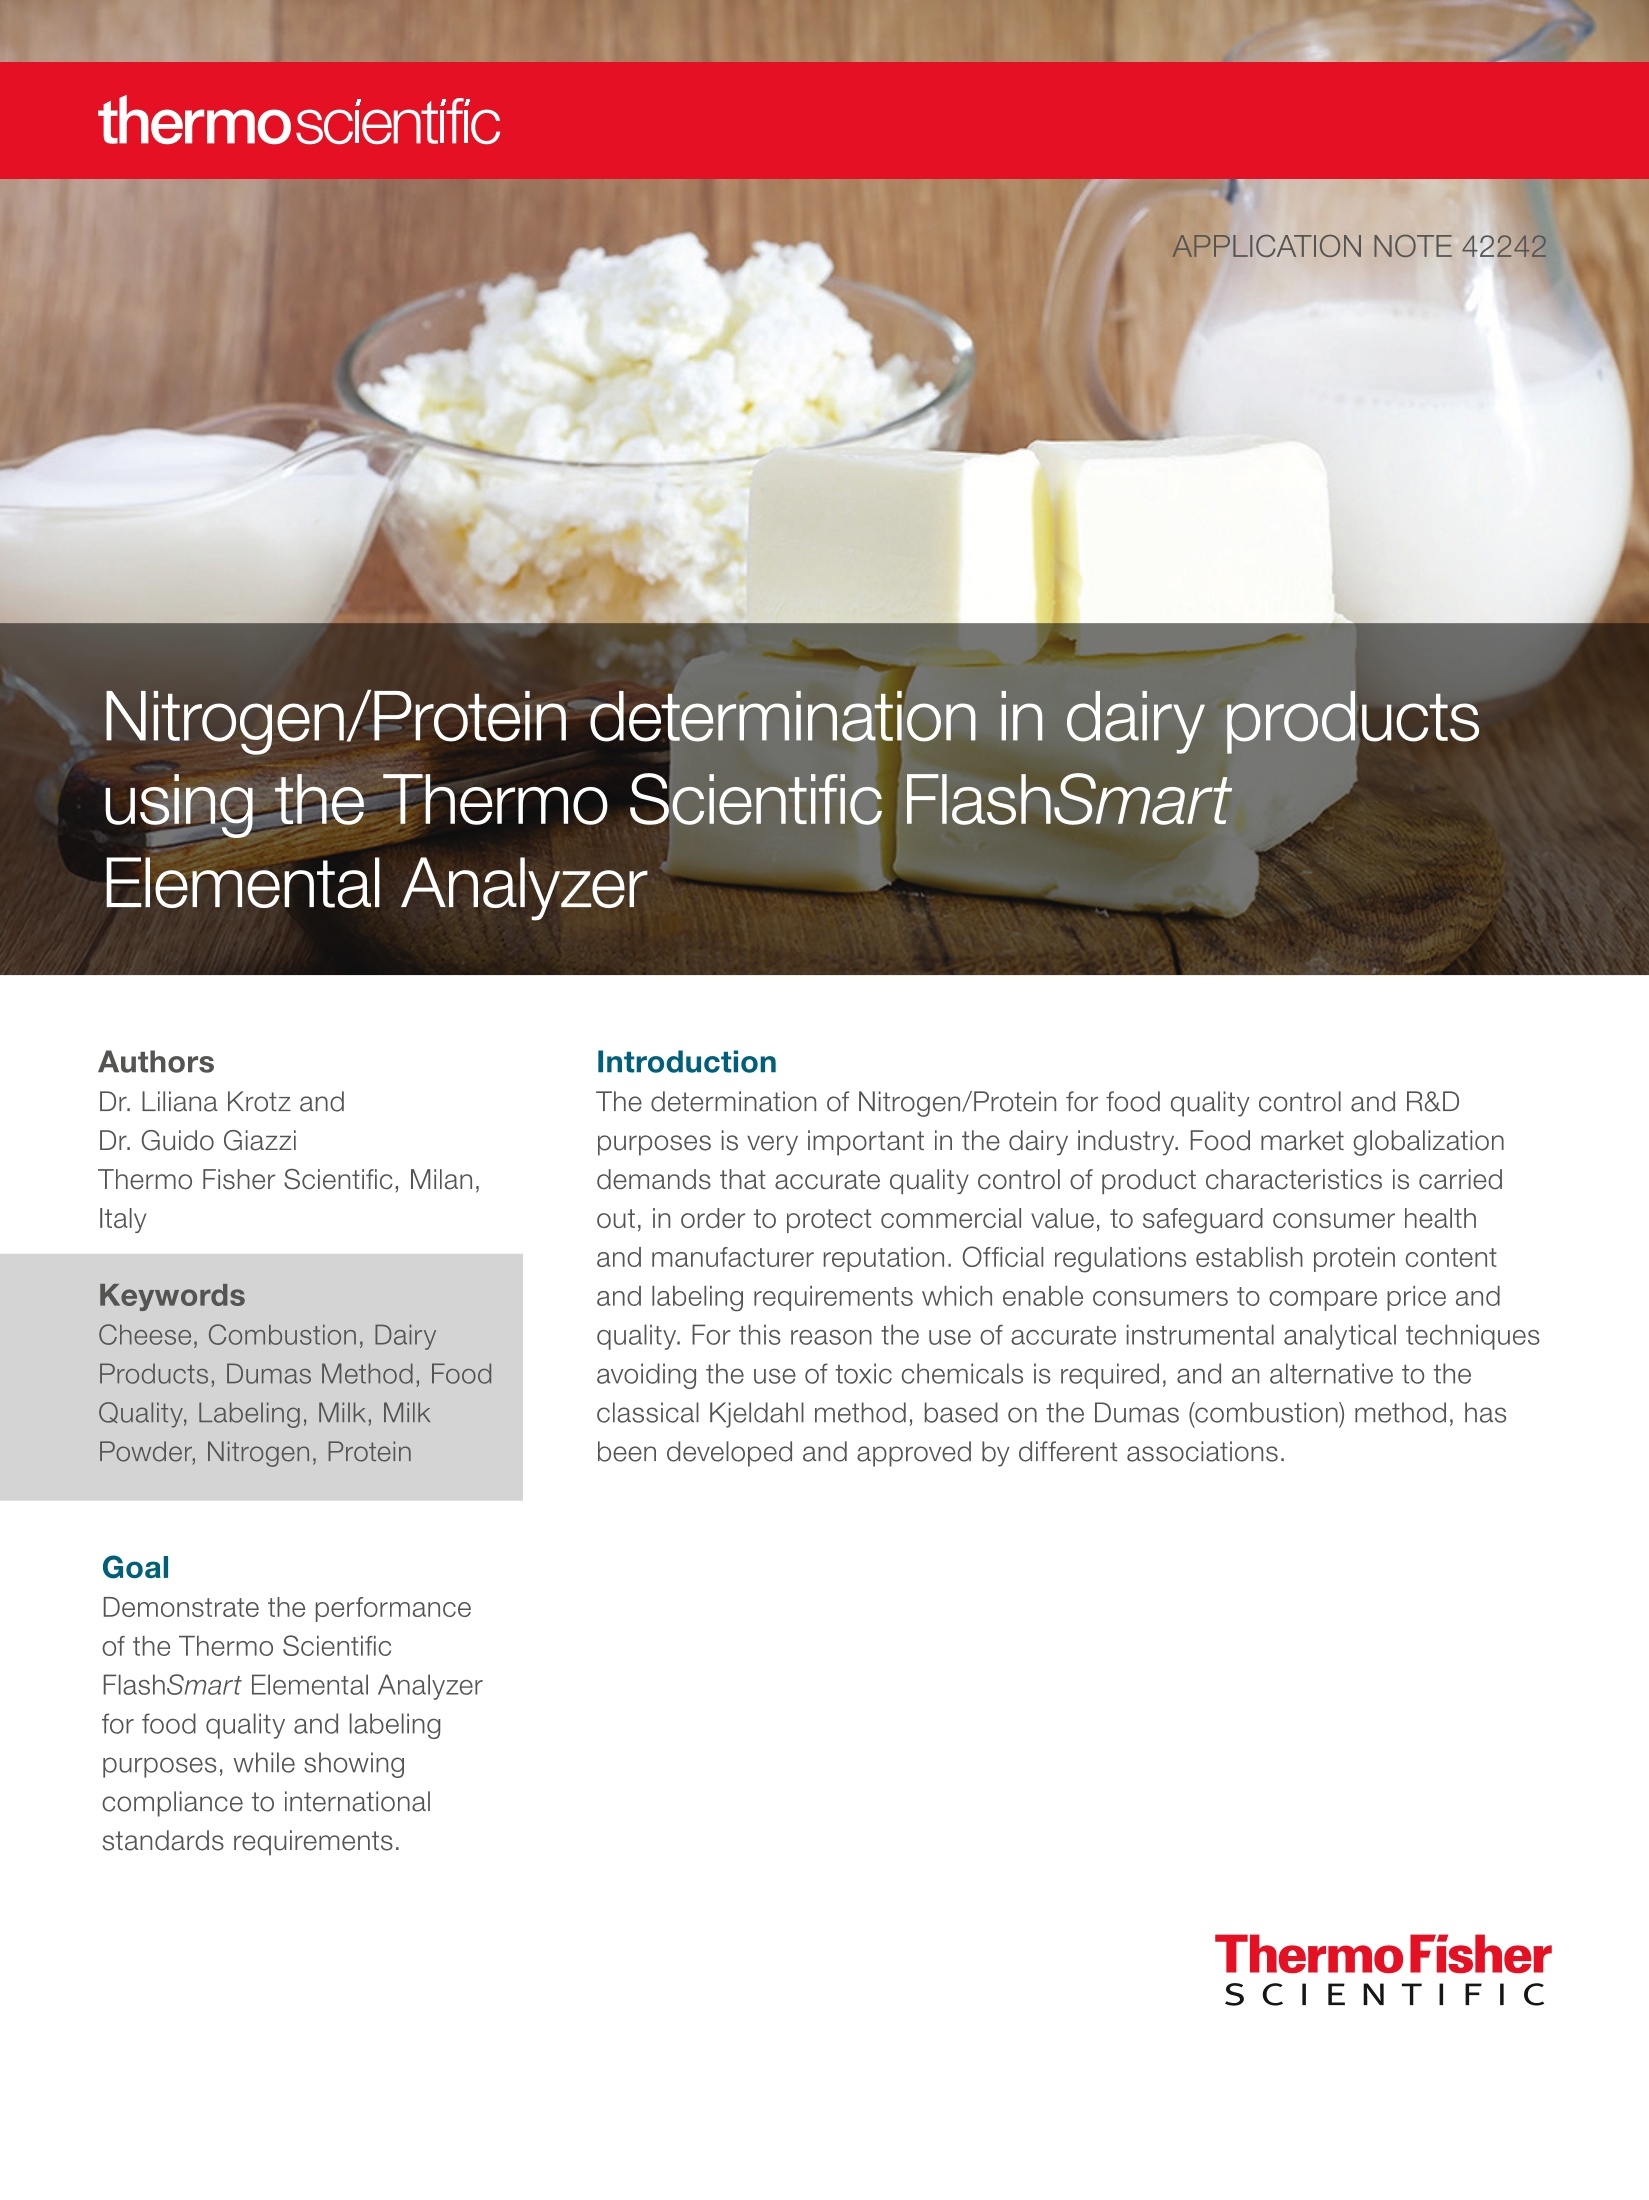
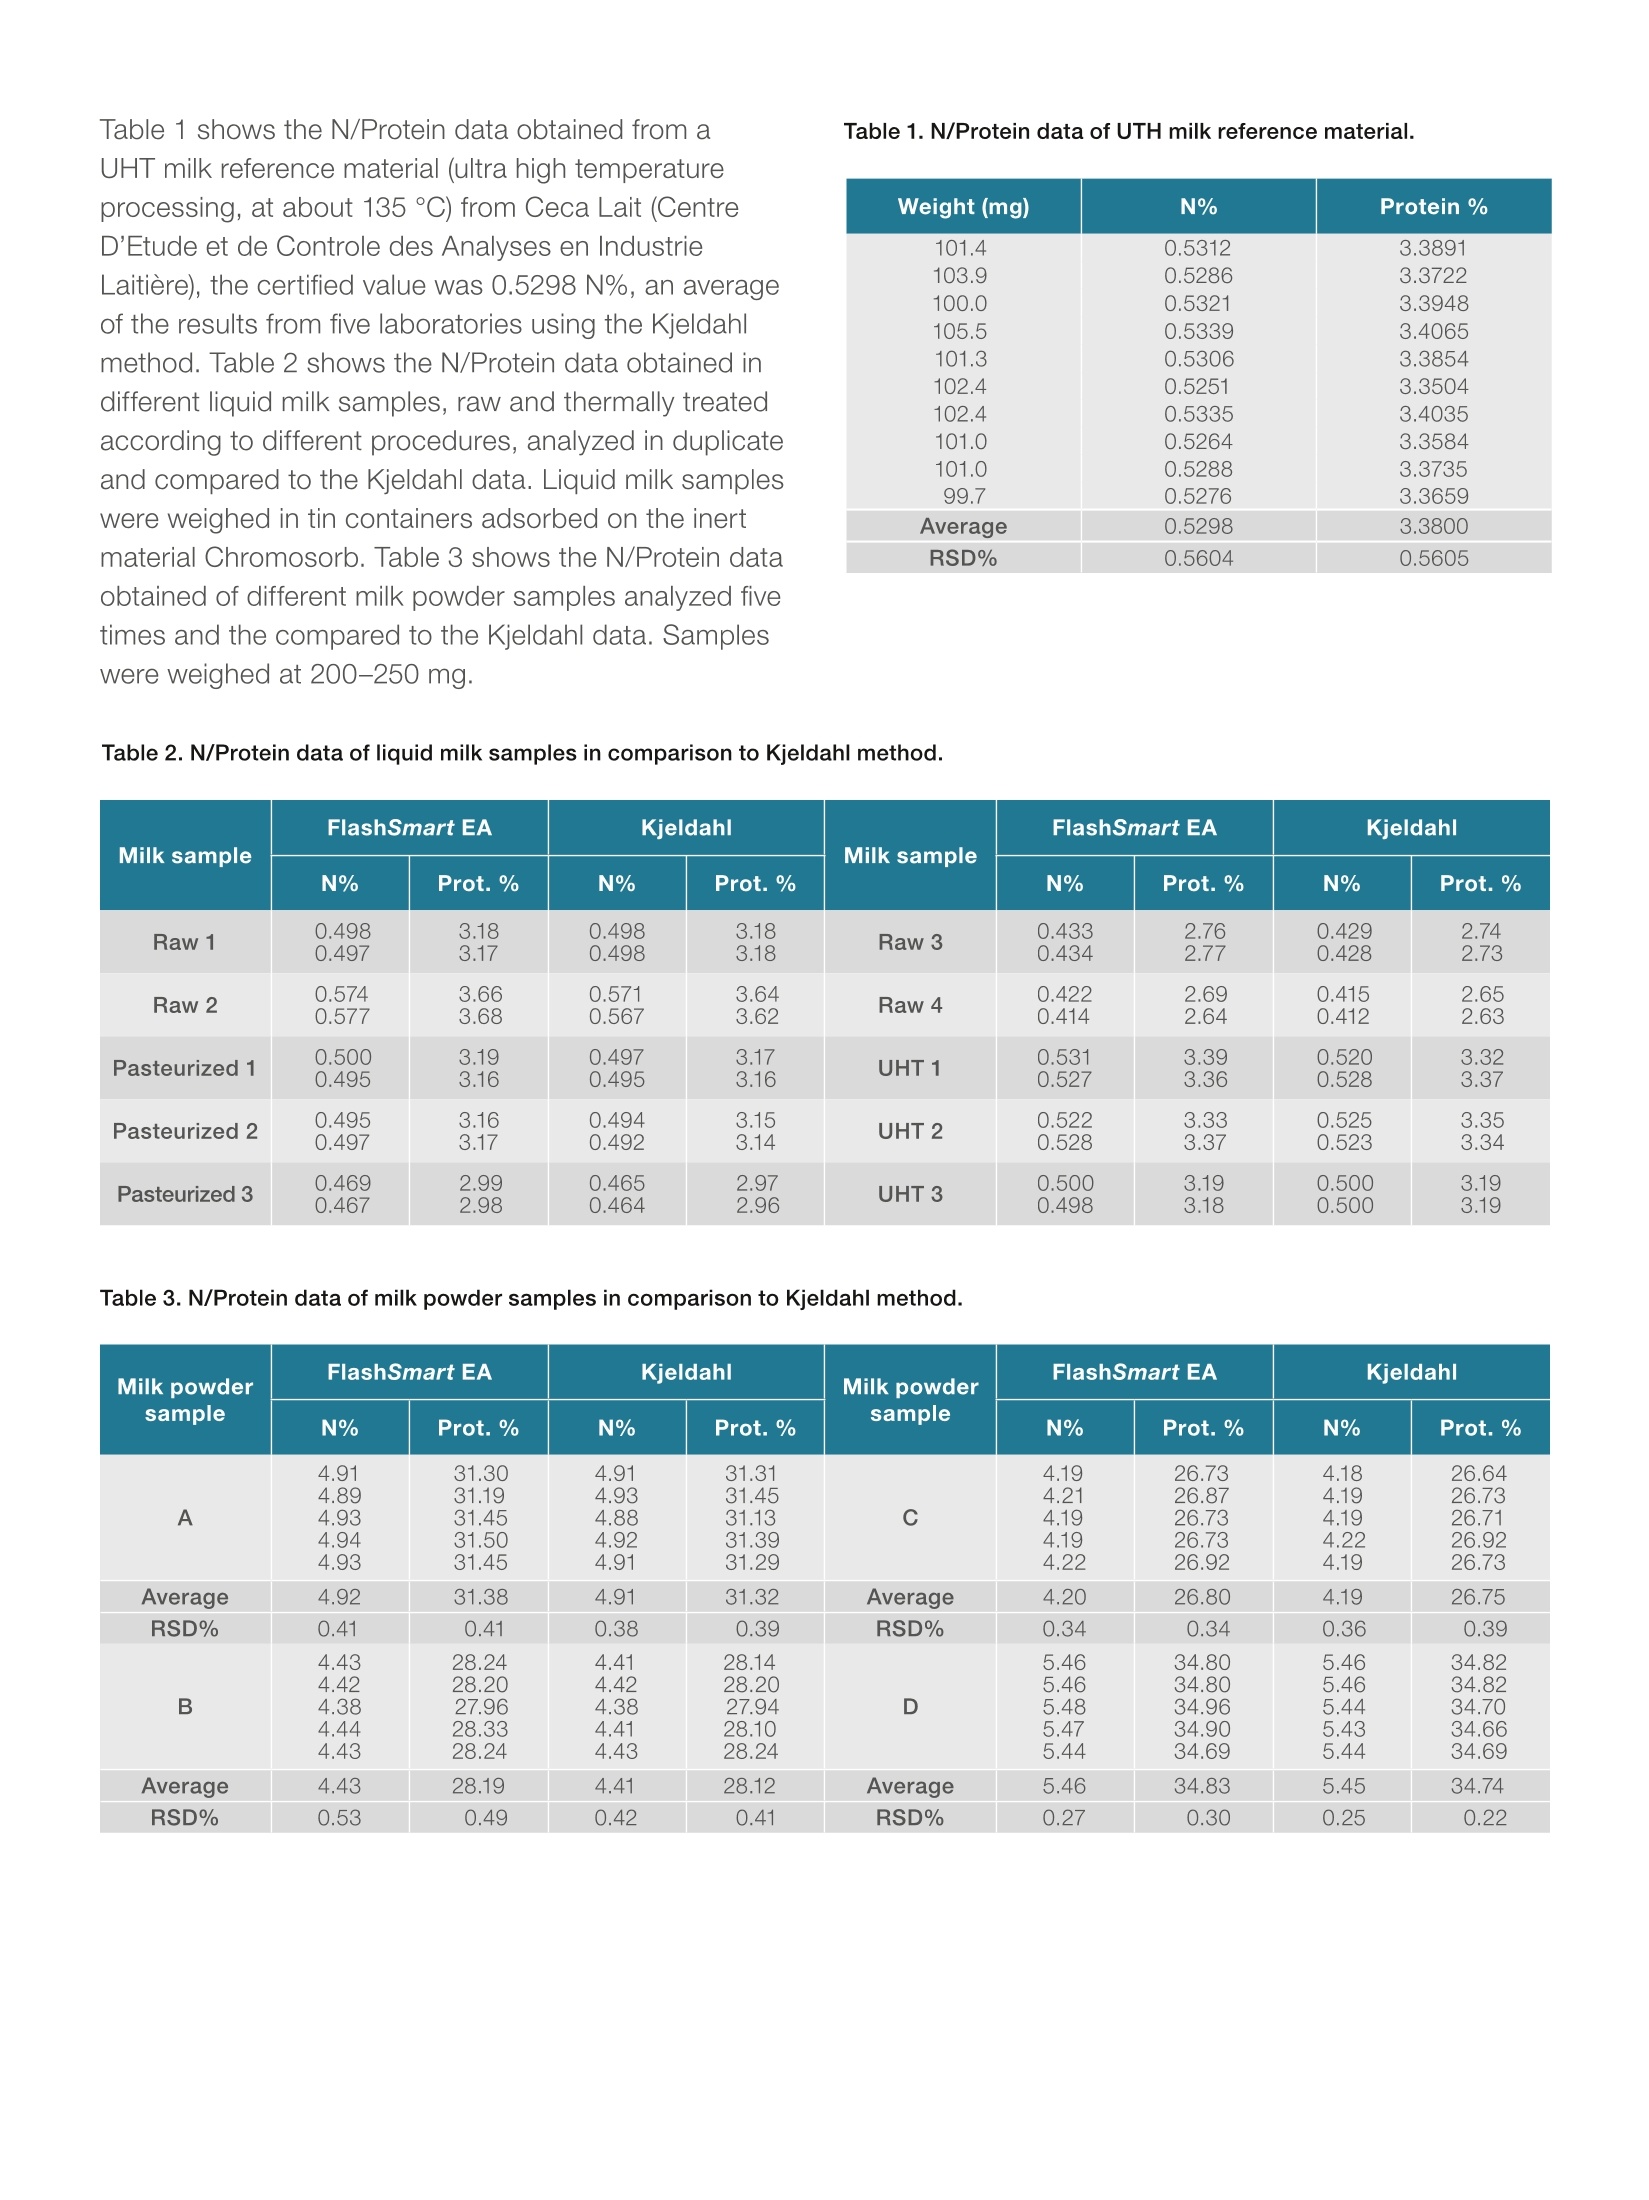
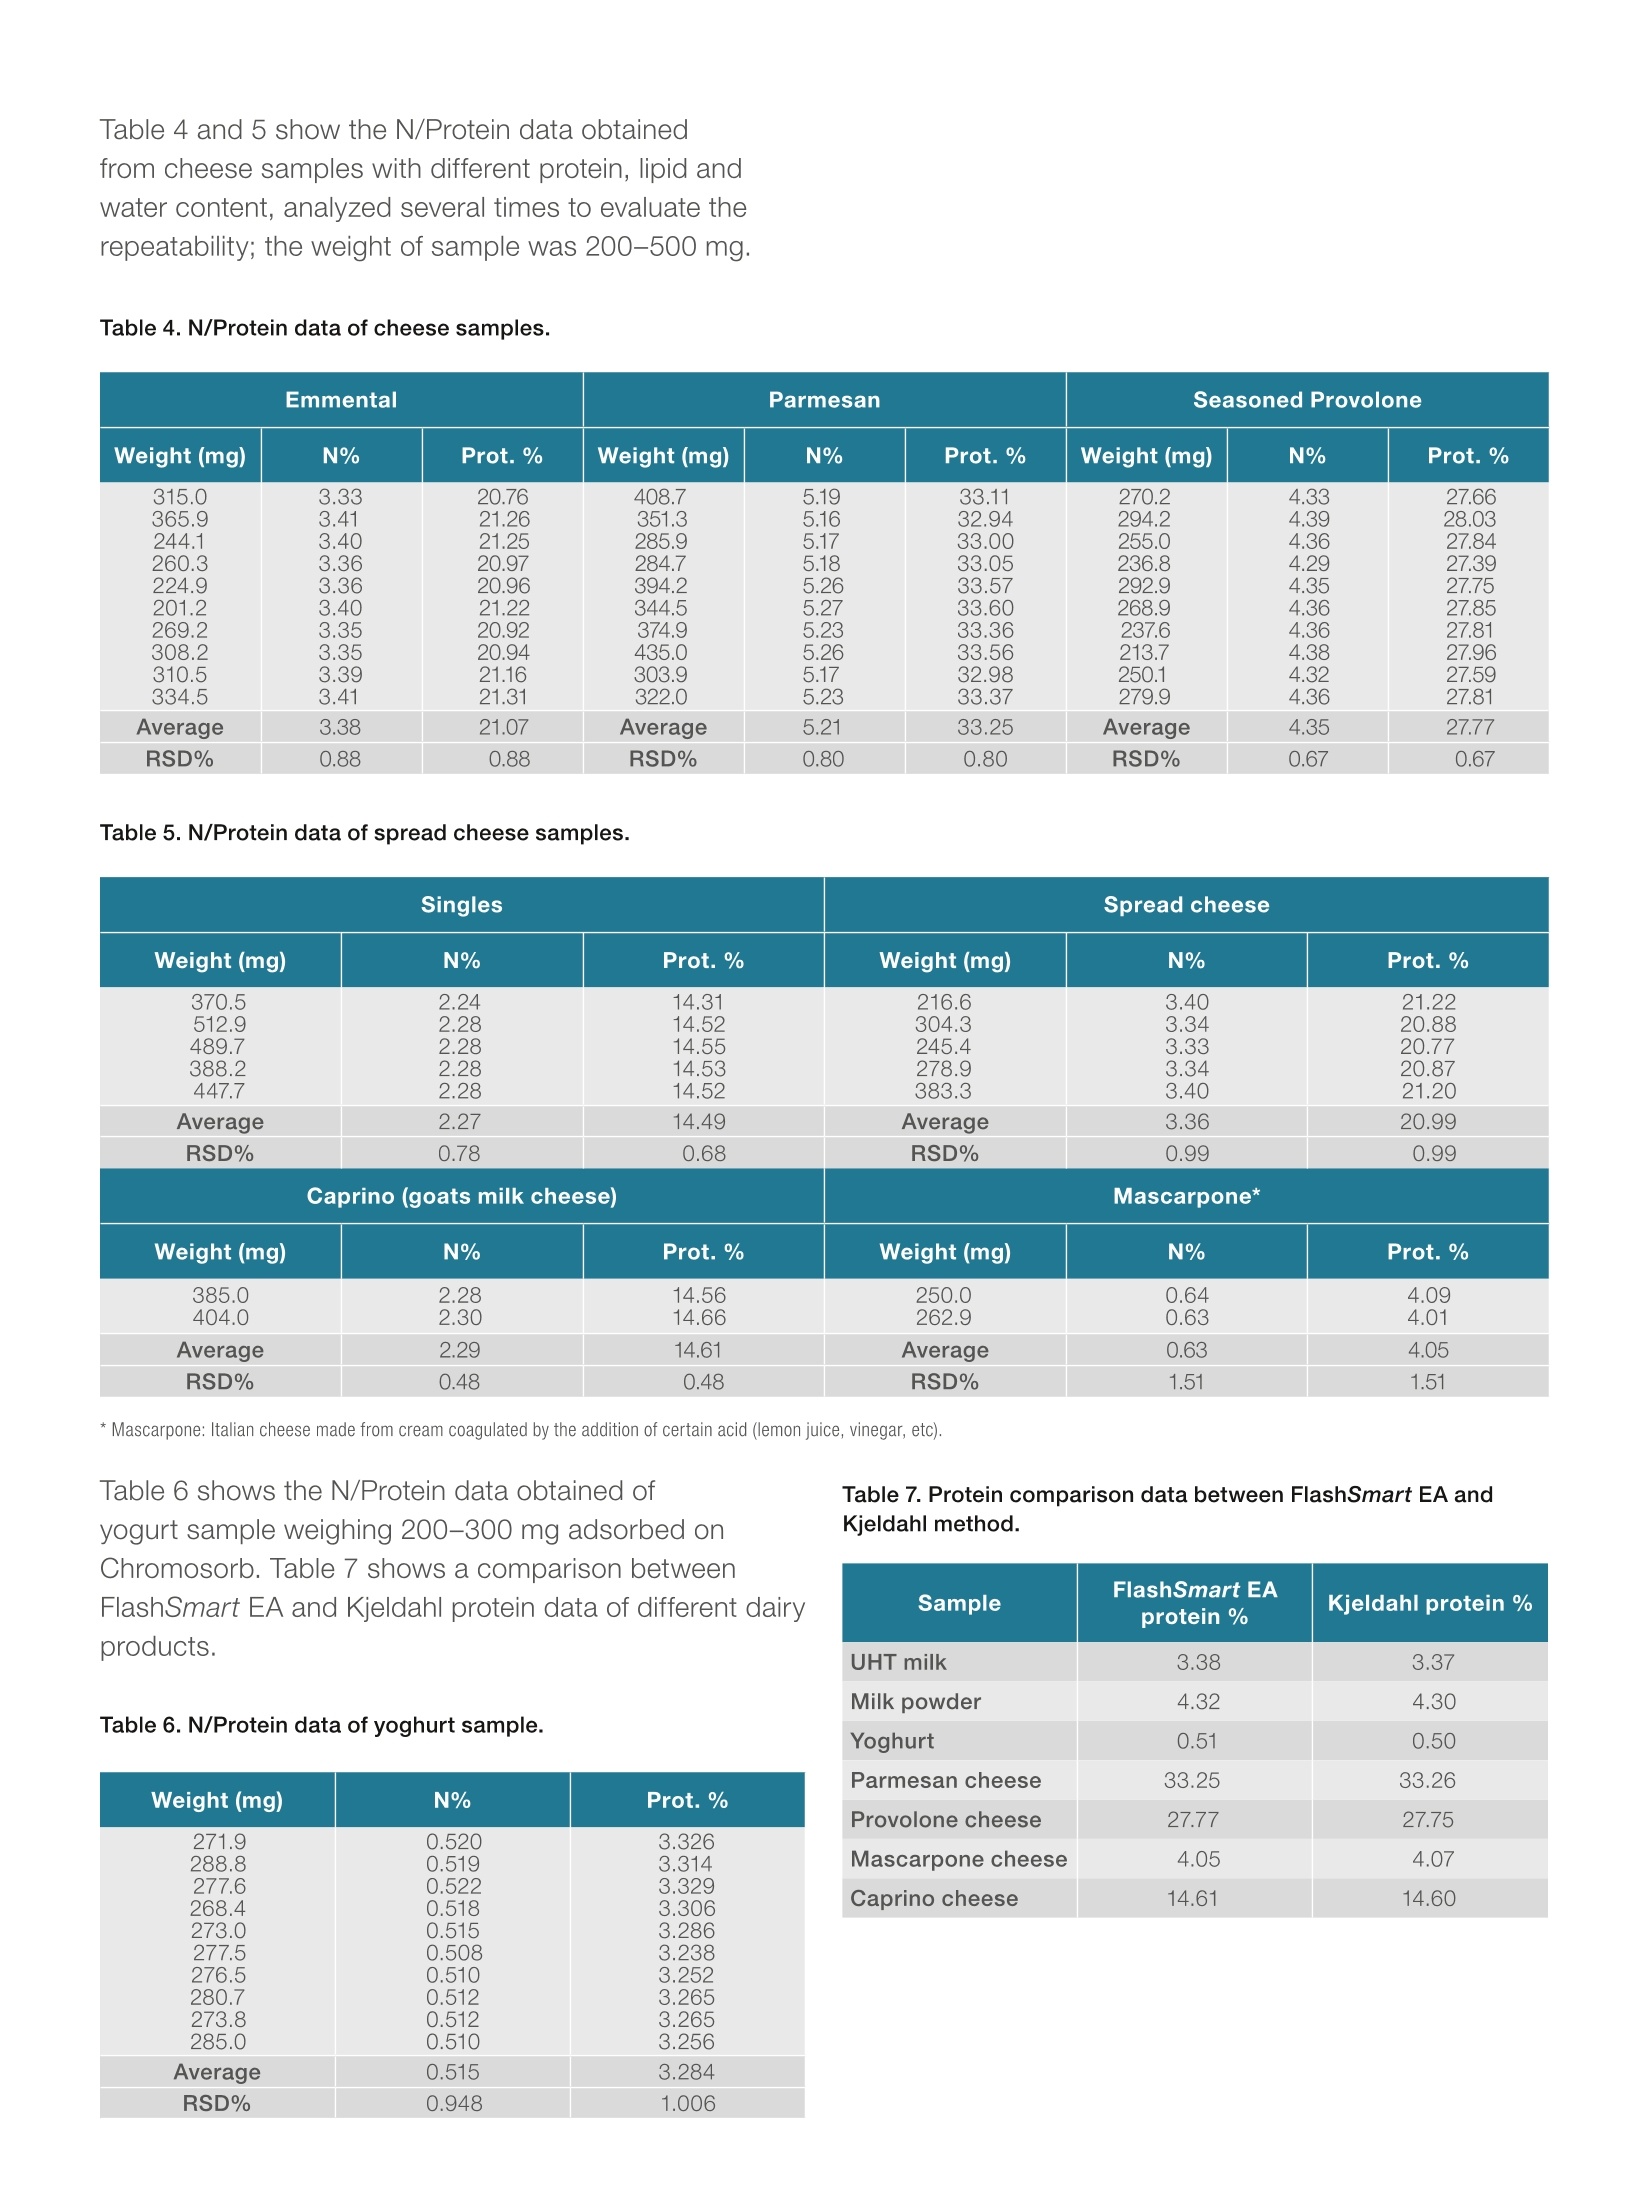
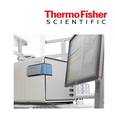
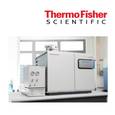
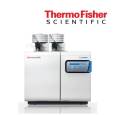
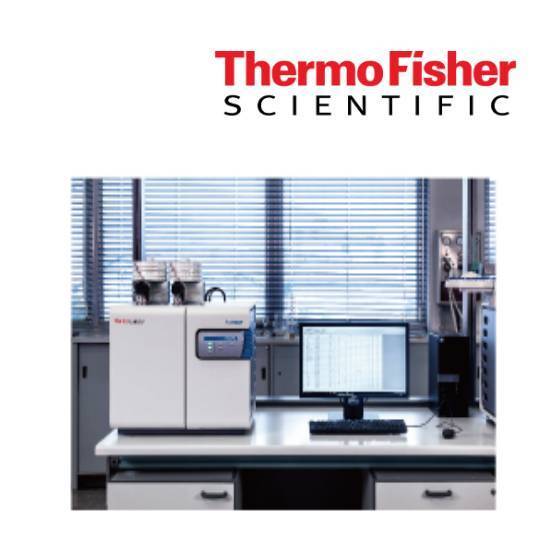
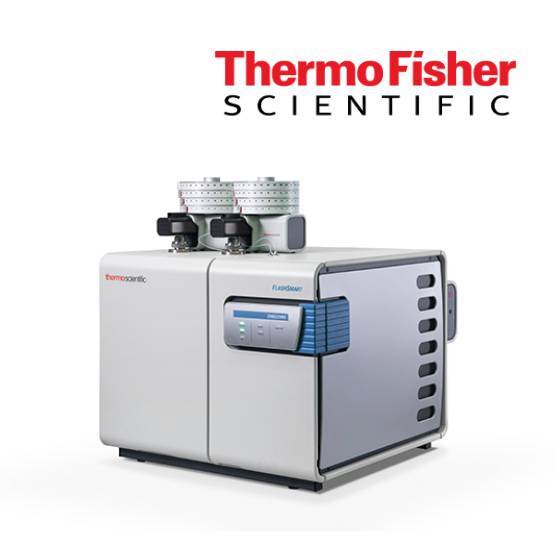
thermoscientificAPPLICATION NOTE 42242 Nitrogen/Protein determination in dairy productsusing the Thermo Scientific FlashSmartElemental Analyzer Authors Dr. Liliana Krotz andDr. Guido GiazziThermo Fisher Scientific, Milan,Italy Keywords Cheese, Combustion, Dairy Products, Dumas Method, Food Quality, Labeling, Milk, Milk Powder, Nitrogen, Protein Goal Demonstrate the performanceof the Thermo ScientificFlashSmart Elemental Analyzerfor food quality and labelingpurposes, while showingcompliance to internationalstandards requirements. The determination of Nitrogen/Protein for food quality control and R&Dpurposes is very important in the dairy industry. Food market globalizationdemands that accurate quality control of product characteristics is carriedout, in order to protect commercial value, to safeguard consumer healthand manufacturer reputation. Official regulations establish protein contentand labeling requirements which enable consumers to compare price andquality. For this reason the use of accurate instrumental analytical techniquesavoiding the use of toxic chemicals is required, and an alternative to theclassical Kjeldahl method, based on the Dumas (combustion) method, hasbeen developed and approved by different associations. The Thermo Scientific FlashSmart"Elemental Analzyer(Figure 1) requires no sample digestion or toxicchemicals, while providing important advantages in termsof time, automation and quantitative determination ofnitrogen in a large range of concentrations. Figure 1. Thermo Scientific FlashSmart N/Protein Analyzer. Method The Elemental Analyzer operates according to thedynamic flash combustion of the sample. Samplesare weighed in tin containers and introduced into thecombustion reactor via the Thermo ScientificMASPlus Autosampler with oxygen. After combustion, theproduced gases are carried by a helium flow to a secondreactor filled with copper, then swept through Co, andH,O traps, a GC column and finally detected by a thermalconductivity detector (Figure 2). A complete report is generated by the Thermo ScientificTMEagerSmart Data Handling Software and displayed atthe end of the analysis. From the nitrogen data obtained,the dedicated software allows the automatic calculationof the protein content. Figure 2. FlashSmart N/Protein configuration. Analytical Conditions Left Furnace Temperature 950°C Right Furnace Temperature 840°C Oven Temperature 50°C Carrier Flow 140 mL/min Reference Flow 100 mL/min Standard Aspartic acid (10.52N%) Note: The oxygen amount necessary for the completecombustion of samples is calculatedautomatically by the OxyTune function present in the Thermo Scientific EagerSmart Data HandlingSoftware. Results Dairy samples were selected representing different typeand nitrogen content. The data obtained demonstratesno-matrix effect in the determination of nitrogen,indicating complete combustion for all types of samples.The calibration was performed with 50-100 mg ofaspartic acid (10.52 N%); and K factor was used as thecalibration method. The protein factor used to calculatethe protein content through the nitrogen value was 6.38. Table 1 shows the N/Protein data obtained from aUHT milk reference material (ultra high temperatureprocessing, at about 135℃) from Ceca Lait (CentreD'Etude et de Controle des Analyses en IndustrieLaitiere), the certified value was 0.5298 N%, an averageof the results from five laboratories using the Kjeldahlmethod. Table 2 shows the N/Protein data obtained indifferent liquid milk samples, raw and thermally treatedaccording to different procedures, analyzed in duplicateand compared to the Kjeldahl data. Liquid milk sampleswere weighed in tin containers adsorbed on the inertmaterial Chromosorb. Table 3 shows the N/Protein dataobtained of different milk powder samples analyzed fivetimes and the compared to the Kjeldahl data. Sampleswere weighed at 200-250 mg. Weight (mg) N% Protein% 101.4 0.5312 3.3891 103.9 0.5286 3.3722 100.0 0.5321 3.3948 105.5 0.5339 3.4065 101.3 0.5306 3.3854 102.4 0.5251 3.3504 102.4 0.5335 3.4035 101.0 0.5264 3.3584 101.0 0.5288 3.3735 99.7 0.5276 3.3659 Average 0.5298 3.3800 RSD% 0.5604 0.5605 Table 2. N/Protein data of liquid milk samples in comparison to Kjeldahl method. Milk sample FlashSmart EA Kjeldahl Milk sample FlashSmart EA Kjeldahl N% Prot.% N% Prot.% N% Prot.% N% Prot.% Raw1 0.4980.497 3.183.17 0.4980.498 3.183.18 Raw 3 0.4330.434 2.762.77 0.4290.428 2.742.73 Raw 2 0.5740.577 3.663.68 0.5710.567 3.643.62 Raw 4 0.4220.414 2.692.64 0.4150.412 2.652.63 Pasteurized 1 0.5000.495 3.193.16 0.4970.495 3.173.16 UHT1 0.5310.527 3.393.36 0.5200.528 3.323.37 Pasteurized 2 0.4950.497 3.163.17 0.4940.492 3.153.14 UHT 2 0.5220.528 3.333.37 0.5250.523 3.353.34 Pasteurized 3 0.4690.467 2.992.98 0.4650.464 2.972.96 UHT 3 0.5000.498 3.193.18 0.500 0.500 3.19 3.19 Table 3.N/Protein data of milk powder samples in comparison to Kjeldahl method. Emmental Parmesan Seasoned Provolone Weight (mg) N% Prot.% Weight (mg) N% Prot.% Weight (mg) N% Prot.% 315.0 3.33 20.76 408.7 5.19 33.11 270.2 4.33 27.66 365.9 3.41 21.26 351.3 5.16 32.94 294.2 4.39 28.03 244.1 3.40 21.25 285.9 5.17 33.00 255.0 4.36 27.84 260.3 3.36 20.97 284.7 5.18 33.05 236.8 4.29 27.39 224.9 3.36 20.96 394.2 5.26 33.57 292.9 4.35 27.75 201.2 3.40 21.22 344.5 5.27 33.60 268.9 4.36 27.85 269.2 3.35 20.92 374.9 5.23 33.36 237.6 4.36 27.81 308.2 3.35 20.94 435.0 5.26 33.56 213.7 4.38 27.96 310.5 3.39 21.16 303.9 5.17 32.98 250.1 4.32 27.59 334.5 3.41 21.31 322.0 5.23 33.37 279.9 4.36 27.81 Average 3.38 21.07 Average 5.21 33.25 Average 4.35 27.77 RSD% 0.88 0.88 RSD% 0.80 0.80 RSD% 0.67 0.67 Table 5. N/Protein data of spread cheese samples. Singles Spread cheese Weight (mg) N% Prot.% Weight (mg) N% Prot.% 370.5 512.9 2.24 14.3114.5214.55 216.6 3.40 304.3 3.34245.4 3.33 21.22 20.88 2.282.28 3.343.33 489.7388.2 447.7 2.28 14.5314.52 278.9383.3 3.34 20.77 20.8721.20 2.28 3.40 Average 2.27 14.49 Average 3.36 20.99 RSD% 0.78 0.68 RSD% 0.99 0.99 Caprino (goats milk cheese) Mascarpone* Weight (mg) N% Prot.% Weight (mg) N% Prot.% 385.0404.0 2.28 14.5614.66 250.0262.9 0.640.63 4.094.01 2.30 Average 2.29 14.61 Average 0.63 4.05 RSD% 0.48 0.48 RSD% 1.51 1.51 *Mascarpone: Italian cheese made from cream coagulated by the addition of certain acid (lemon juice, vinegar, etc). Table 6 shows the N/Protein data obtained ofyogurt sample weighing 200-300 mg adsorbed onChromosorb. Table 7 shows a comparison betweenFlashSmart EA and Kjeldahl protein data of different dairyproducts. Table 6. N/Protein data of yoghurt sample. Weight (mg) N% Prot.% 271.9 0.520 3.326 288.8 0.519 3.314 277.6 0.522 3.329 268.4 0.518 3.306 273.0 0.515 3.286 277.5 0.508 3.238 276.5 0.510 3.252 280.7 0.512 3.265 273.8 0.512 3.265 285.0 0.510 3.256 Average 0.515 3.284 RSD% 0.948 1.006 Table 7. Protein comparison data between FlashSmart EA andKjeldahl method. Sample FlashSmart EA Kjeldahl protein% protein% UHT milk 3.38 3.37 Milk powder 4.32 4.30 Yoghurt 0.51 0.50 Parmesan cheese 33.25 33.26 Provolone cheese 27.77 27.75 Mascarpone cheese 4.05 4.07 Caprino cheese 14.61 14.60 The FlashSmart EA can analyze the fractions ofmilk and dairy products by liquid injection using theThermo Scientific AS 1310 Liquid Autosampler. Thevolume injected was 80-125 ul. As a standard glycinewater solution was prepared, and K factor was thecalibration method. The formula used for the calculationof the fractions is: Determination of Non Proteic Nitrogen (NPN): Theacidification of the sample with trichloroacetic acid(60% conc.) produces the complete precipitationof both the serum and the caseinic fractions. Aftercentrifugation, the analysis of the liquid fraction permitsthe determination of the contribution of the non proteicfraction. Determination of Non Caseine Nitrogen (NCN): Theacidification of another aliquote of the same sampleproduces the complete precipitation of the caseinefraction, after centrifugation, the determination ofNitrogen permits the measurement ot the sum of theNPN and the Serum protein contributions. Finally, the concentration of Nitrogen in the Serumfraction is calculated by substraction of the two results: Table 8 shows the nitrogen data in soluble protein ofdairy products while Table 9 shows the nitrogen data ofdifferent cheese and the related fractions. Table 8. Nitrogen data in soluble protein of dairy products. Sample N% RSD% Sample N% RSD% Soluble proteinfrom cheese 1 0.01320.01400.0139 3.182 Soluble proteinfrom cheese 2 0.01210.0124 0.0120 1.711 Soluble wheyprotein 1 0.15120.15190.1516 0.232 Soluble wheyprotein 3 0.14160.14410.1437 0.938 Soluble wheyprotein 2 0.16100.16090.1600 0.343 Soluble wheyprotein 4 0.14980.14970.1483 0.562 Table 9. Nitrogen data of different cheese and the related fractions. Sample Total N NCN NPN % RSD% % RSD% % RSD% Crescenza 2.432.472.422.432.46 0.889 0.4070.4110.400 0.347 0.1320.1280.136 2.985 Ricotta 1.391.361.381.371.37 0.826 0.2120.211620.212 1.089 0.07990.07640.0721 5.141 Mascarpone 0.6140.6350.6270.6110.600 2.267 0.1380.1300.136 3.039 0.04310.04860.0486 6.925 The Thermo Scientific FlashSmart Elemental Analyzeris a valuable solution for nitrogen/protein determinationfor dairy products analysis, thanks to excellentreproducibility and no memory effects observed whenchanging the type of dairy sample. This indicates thecomplete and accurate detection of the nitrogen present. As a complete automatic system, the FlashSmart EAis able to analyze nitrogen in a wide range from low tohigh content, solid and liquid samples without the useof sample digestion or the toxic chemicals applied intraditional methods. The Dumas Combustion method has been approvedand adopted by Official Organizations as ASBC,AOAC, AACC, AOCS, ISO and IDF (International DairyFederation) Standard. Find out more at thermofisher.com/OEA ( C2017 Th er mo Fis h e r S ci entific I n c . A ll rig hts rese r ved. AOAC is a t r adem a r k of The A s s o c ia t ion of Offi ci al A nal ytical C h e m ist s; AOCS is a tr a de m a rk of T h e A mer i ca n Oil Ch em ist s ’ Society; AACC is a t rademark o f Th e American A ssoci a tion o f C ereal Chemist s ;ASBC is a t rademark of Th e Ame r ic an So c iety of Brewing Ch e m is ts ; I FF O i s a tr a demar k o f The Interna t iona l Fishm e al an d Fi s h Oi l Organi z ati o n. I SO is a t r adema r k of the In te rnati on al St a ndar d s Org a nizatio n . A ll ot h er tradem a rk s a r e the p r ope rty o f Thermo Fisher S cientific. Th i s in for mat i on is p r e s ented as a n e x am ple o f the ca p a b i l iti es o f The r mo Fish e r S c ientif i c products. I t i s n o t i n t e n d ed t o e ncourage us e of th e se pro d uct s in a n y mann e r t h at migh t i n f r in g e th e i nt el l e ctu a l pr o p e r t y r ig h ts o f o t he r s . Sp eci f icati o n s, t e rm s a nd p r icing a r e subj e c t to ch a n ge . N o t all pro d u ct s a r e a v a i la bl e in a l l coun t rie s. P l ease c o nsult y our l oca l s a l e s re p resent a ti ve f o r d etail s. AN42242-EN 0217 ) 在乳品工业中,氮/蛋白质的测定是食品质量控制和研发的重要手段。食品市场全球化要求对产品特性进行准确的质量控制,以保护商业价值,维护消费者健康和制造商声誉。官方法规制定了蛋白质含量和标签要求,使消费者能够比较这些乳制品的价格和质量。因此,需要使用准确的仪器分析技术,避免使用传统步骤繁琐的以及有毒化学品分析的凯氏方法,目前已经大规模的使用Dumas杜马斯燃烧法进行分析,杜马斯方法已经得到各种协会如AOAC,ISO等官方机构批准使用。
确定


还剩4页未读,是否继续阅读?

产品配置单

大昌华嘉科学仪器为您提供《乳制品中氮/蛋白质含量检测方案(定氮仪)》,该方案主要用于液体乳中营养成分检测,参考标准--,《乳制品中氮/蛋白质含量检测方案(定氮仪)》用到的仪器有杜马斯蛋白质分析仪(定氮仪)、总氮分析仪(杜马斯燃烧法)、元素分析仪(CN/CNS)、全自动元素分析仪(CHN)、有机元素分析仪(碳氢氧氮硫)
推荐专场
定氮仪、凯氏定氮仪、Dumas定氮仪
更多


相关方案
更多
该厂商其他方案
更多