


LA-ICP-MS是地质环境样品原位分析最有前途的技术之一。然而,在使用非矩阵匹配校准时,测量精度有一些限制,特别是对挥发性和亲铁/亲铜元素。因此,我们研究了一个新的200nm飞秒(fs)激光消融系统(NWRFemto200)测量基质相关效应,该系统使用不同基质和不同光斑尺寸(10到55μm)的参考材料。我们还用两个纳秒(ns)激光器、193nm准分子(ESI NWR 193)和213nm Nd:YAG (NWR UP-213)激光器进行了类似的实验。200nm激光烧蚀的离子强度远低于213nm Nd: YAG激光,因为烧蚀率降低了约30倍。我们的实验并没有显示出与200nm fs激光器有显著的矩阵相关性。因此,可以对不同矩阵的多元素分析进行非矩阵匹配标定。22种国际合成硅酸盐玻璃、地质玻璃、矿物、磷酸盐和碳酸盐参考材料的分析结果证明了这一点。校准仅使用认证的NIST SRM 610玻璃进行。在整体分析不确定因素下,200nm fs LA-ICP-MS数据与现有参考值一致。
方案详情

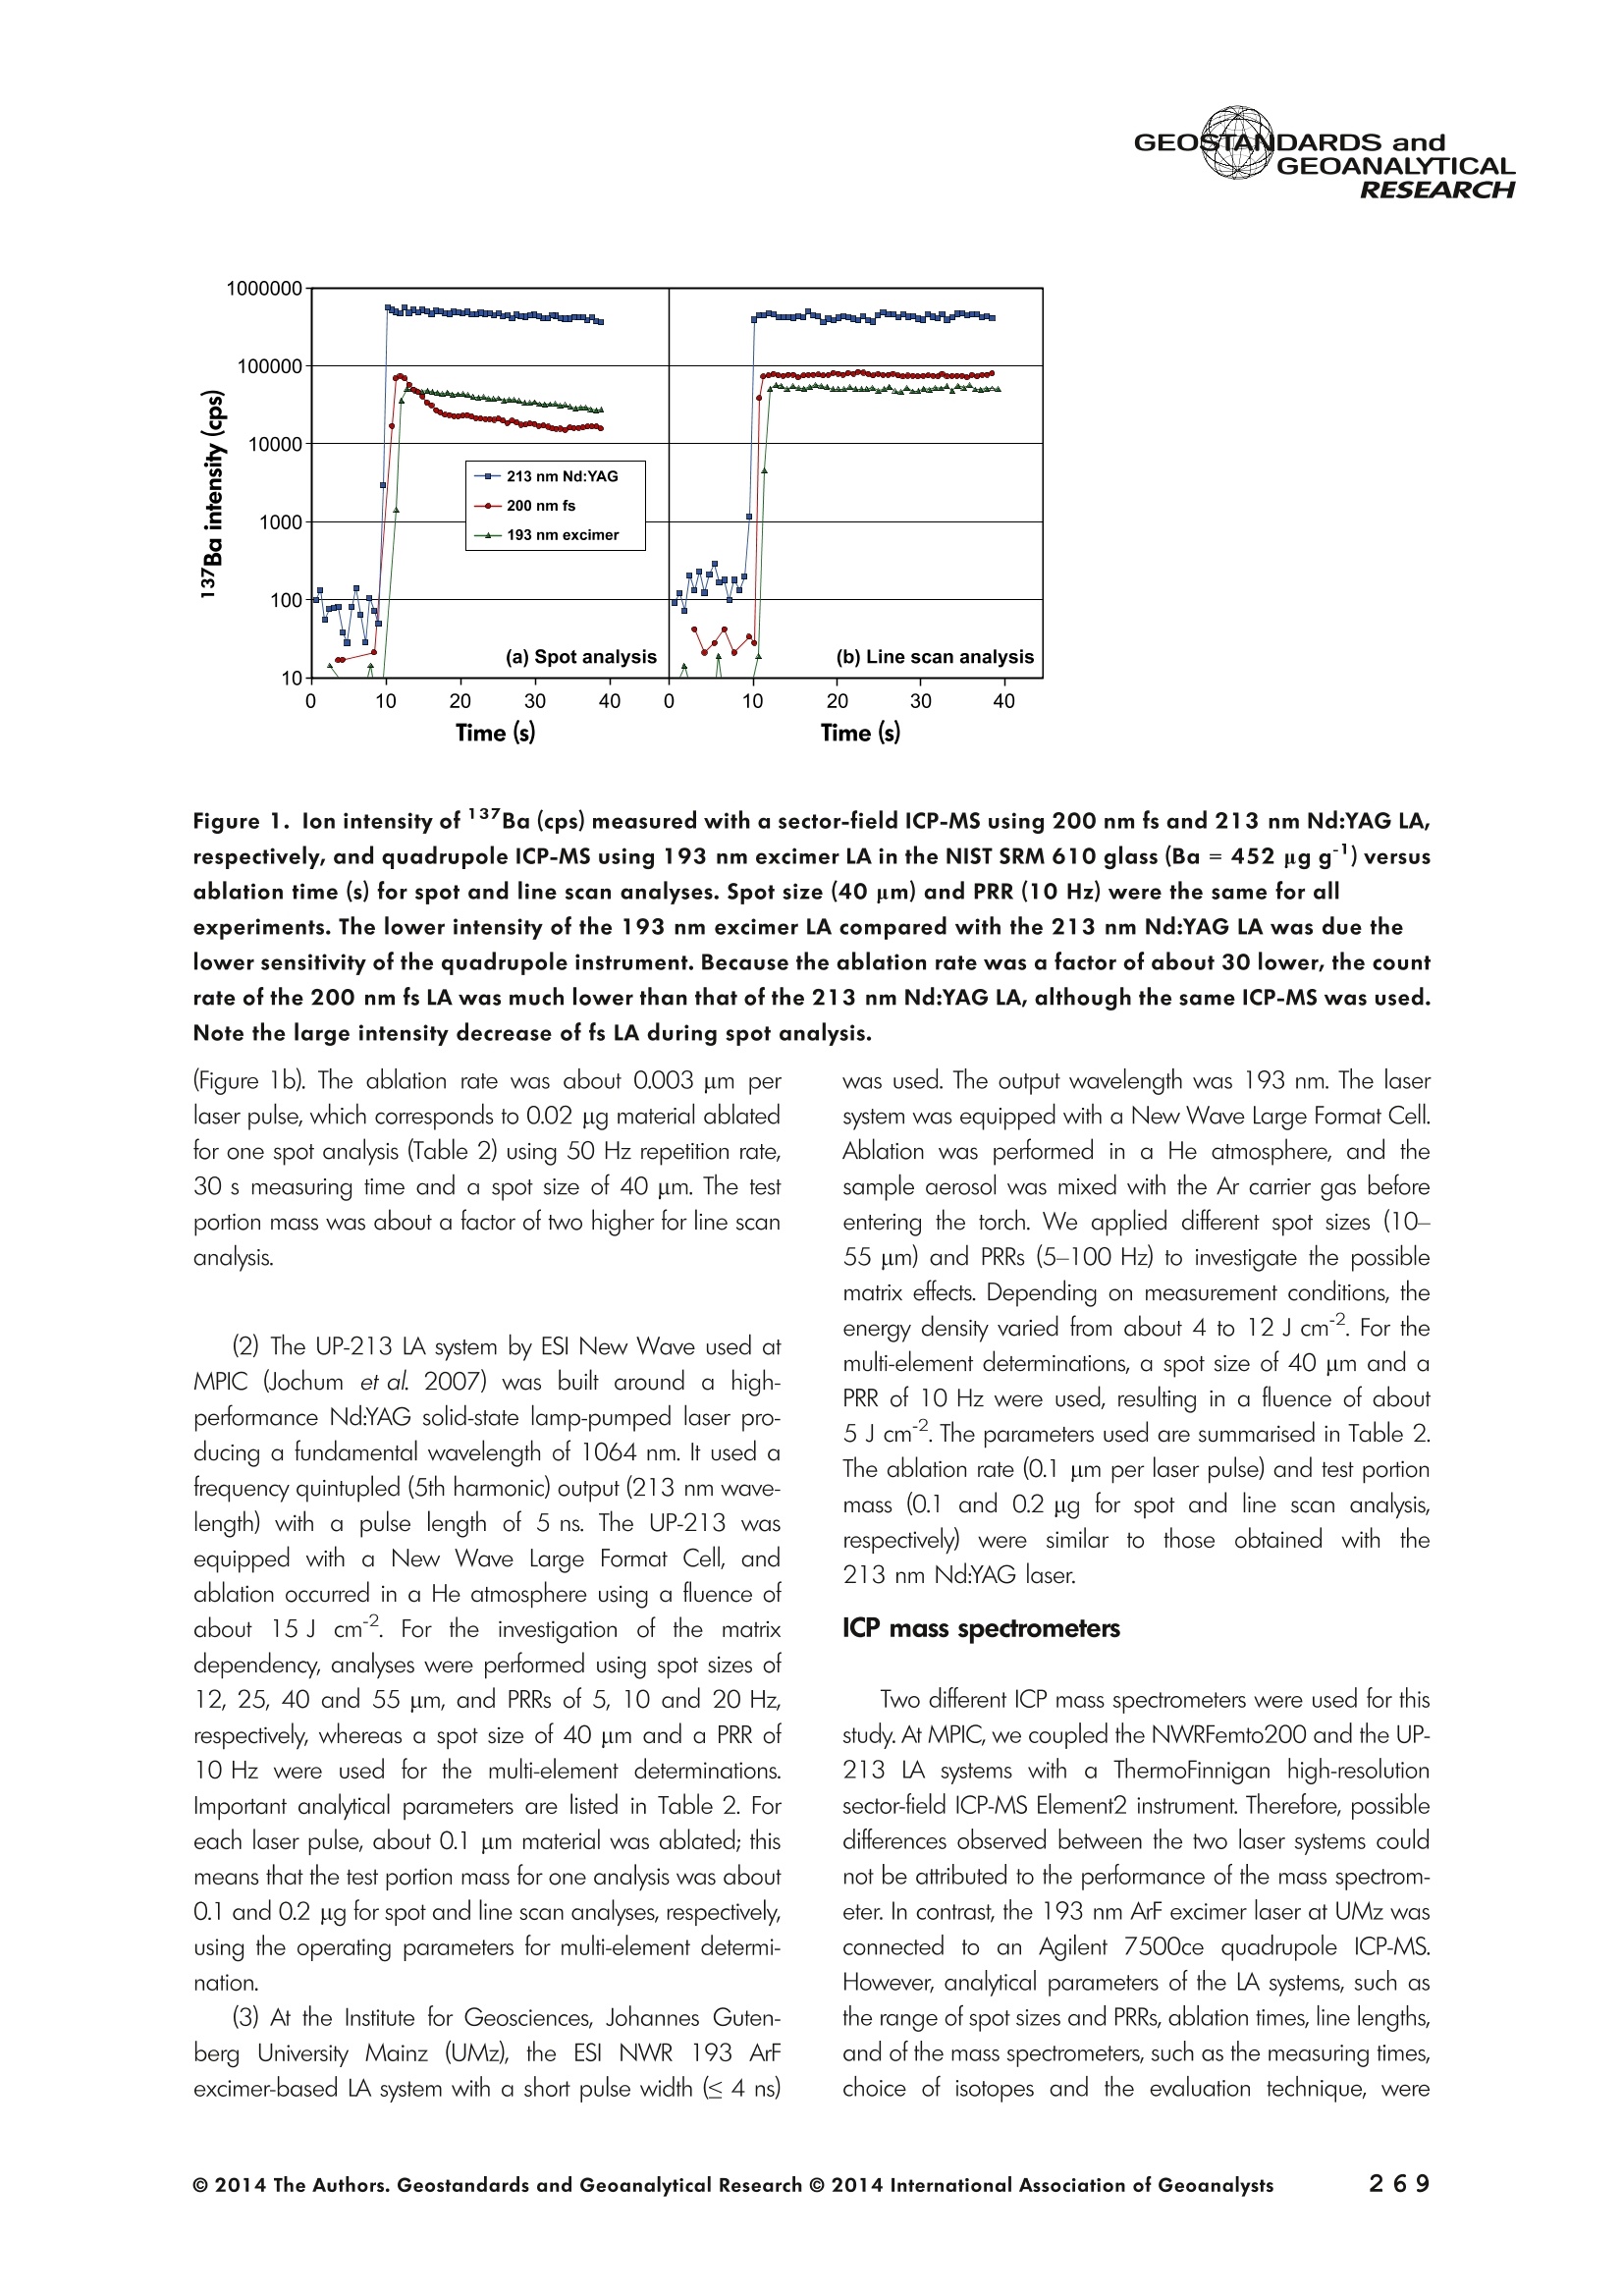
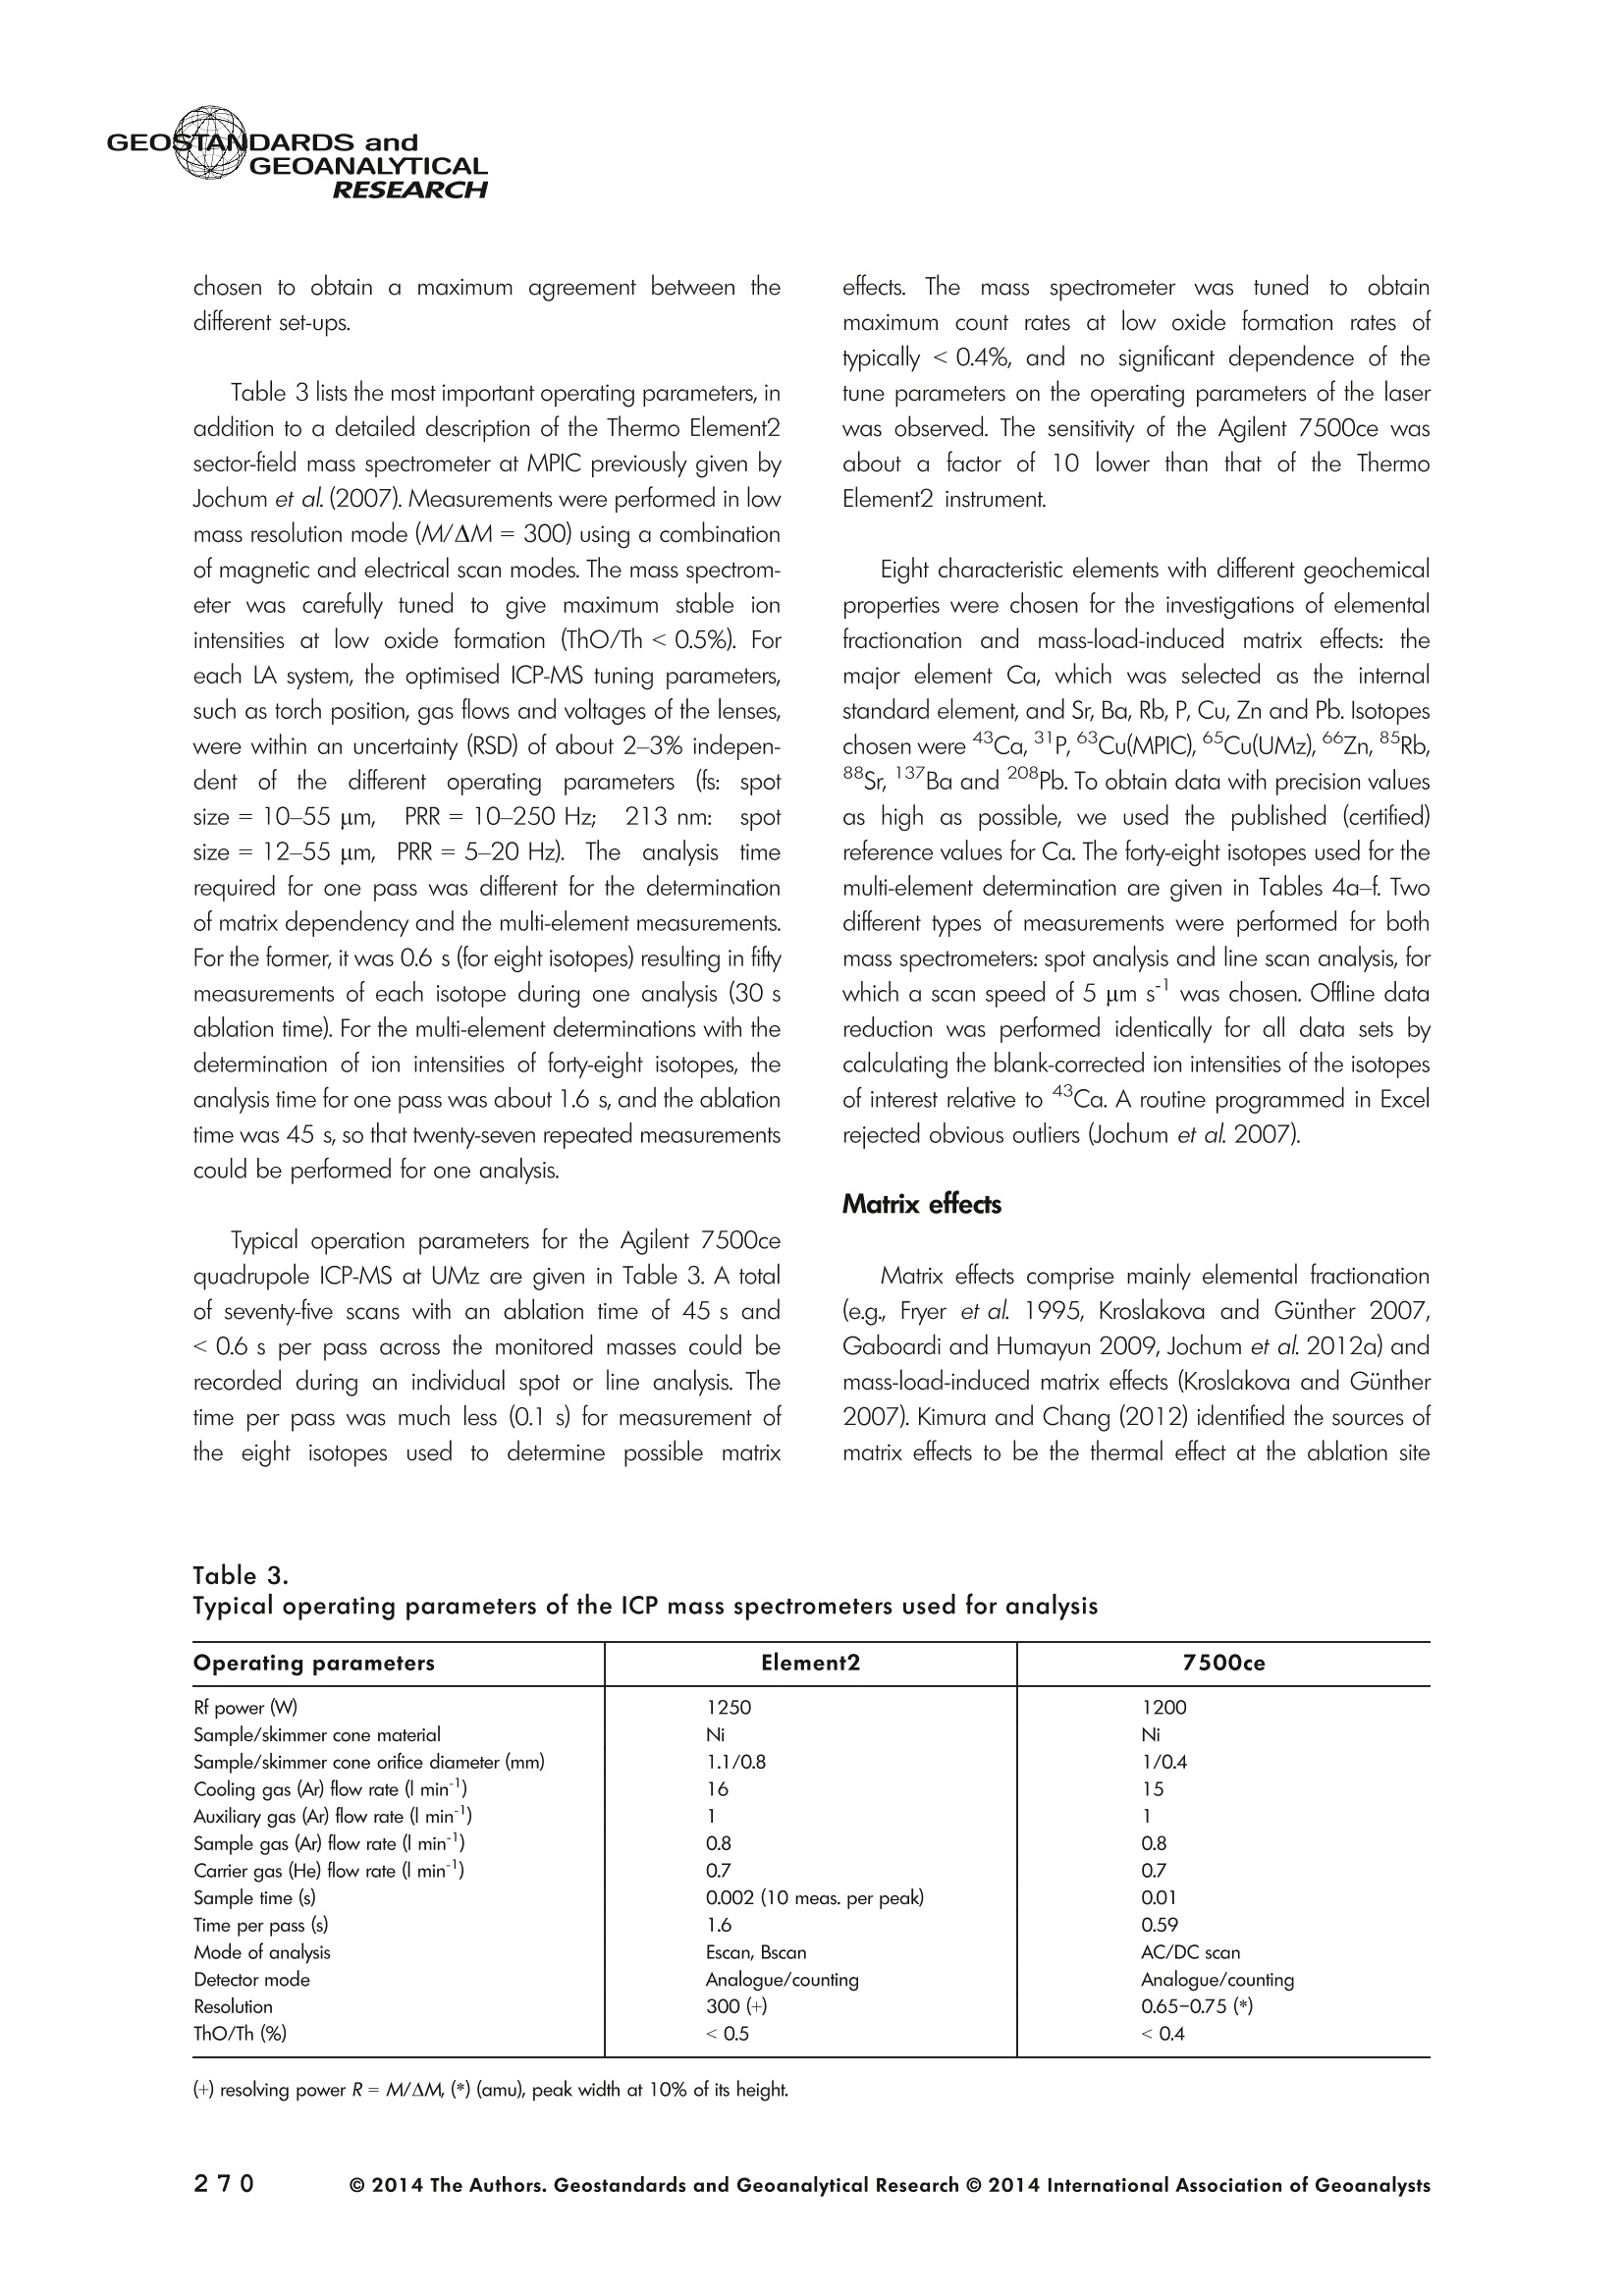
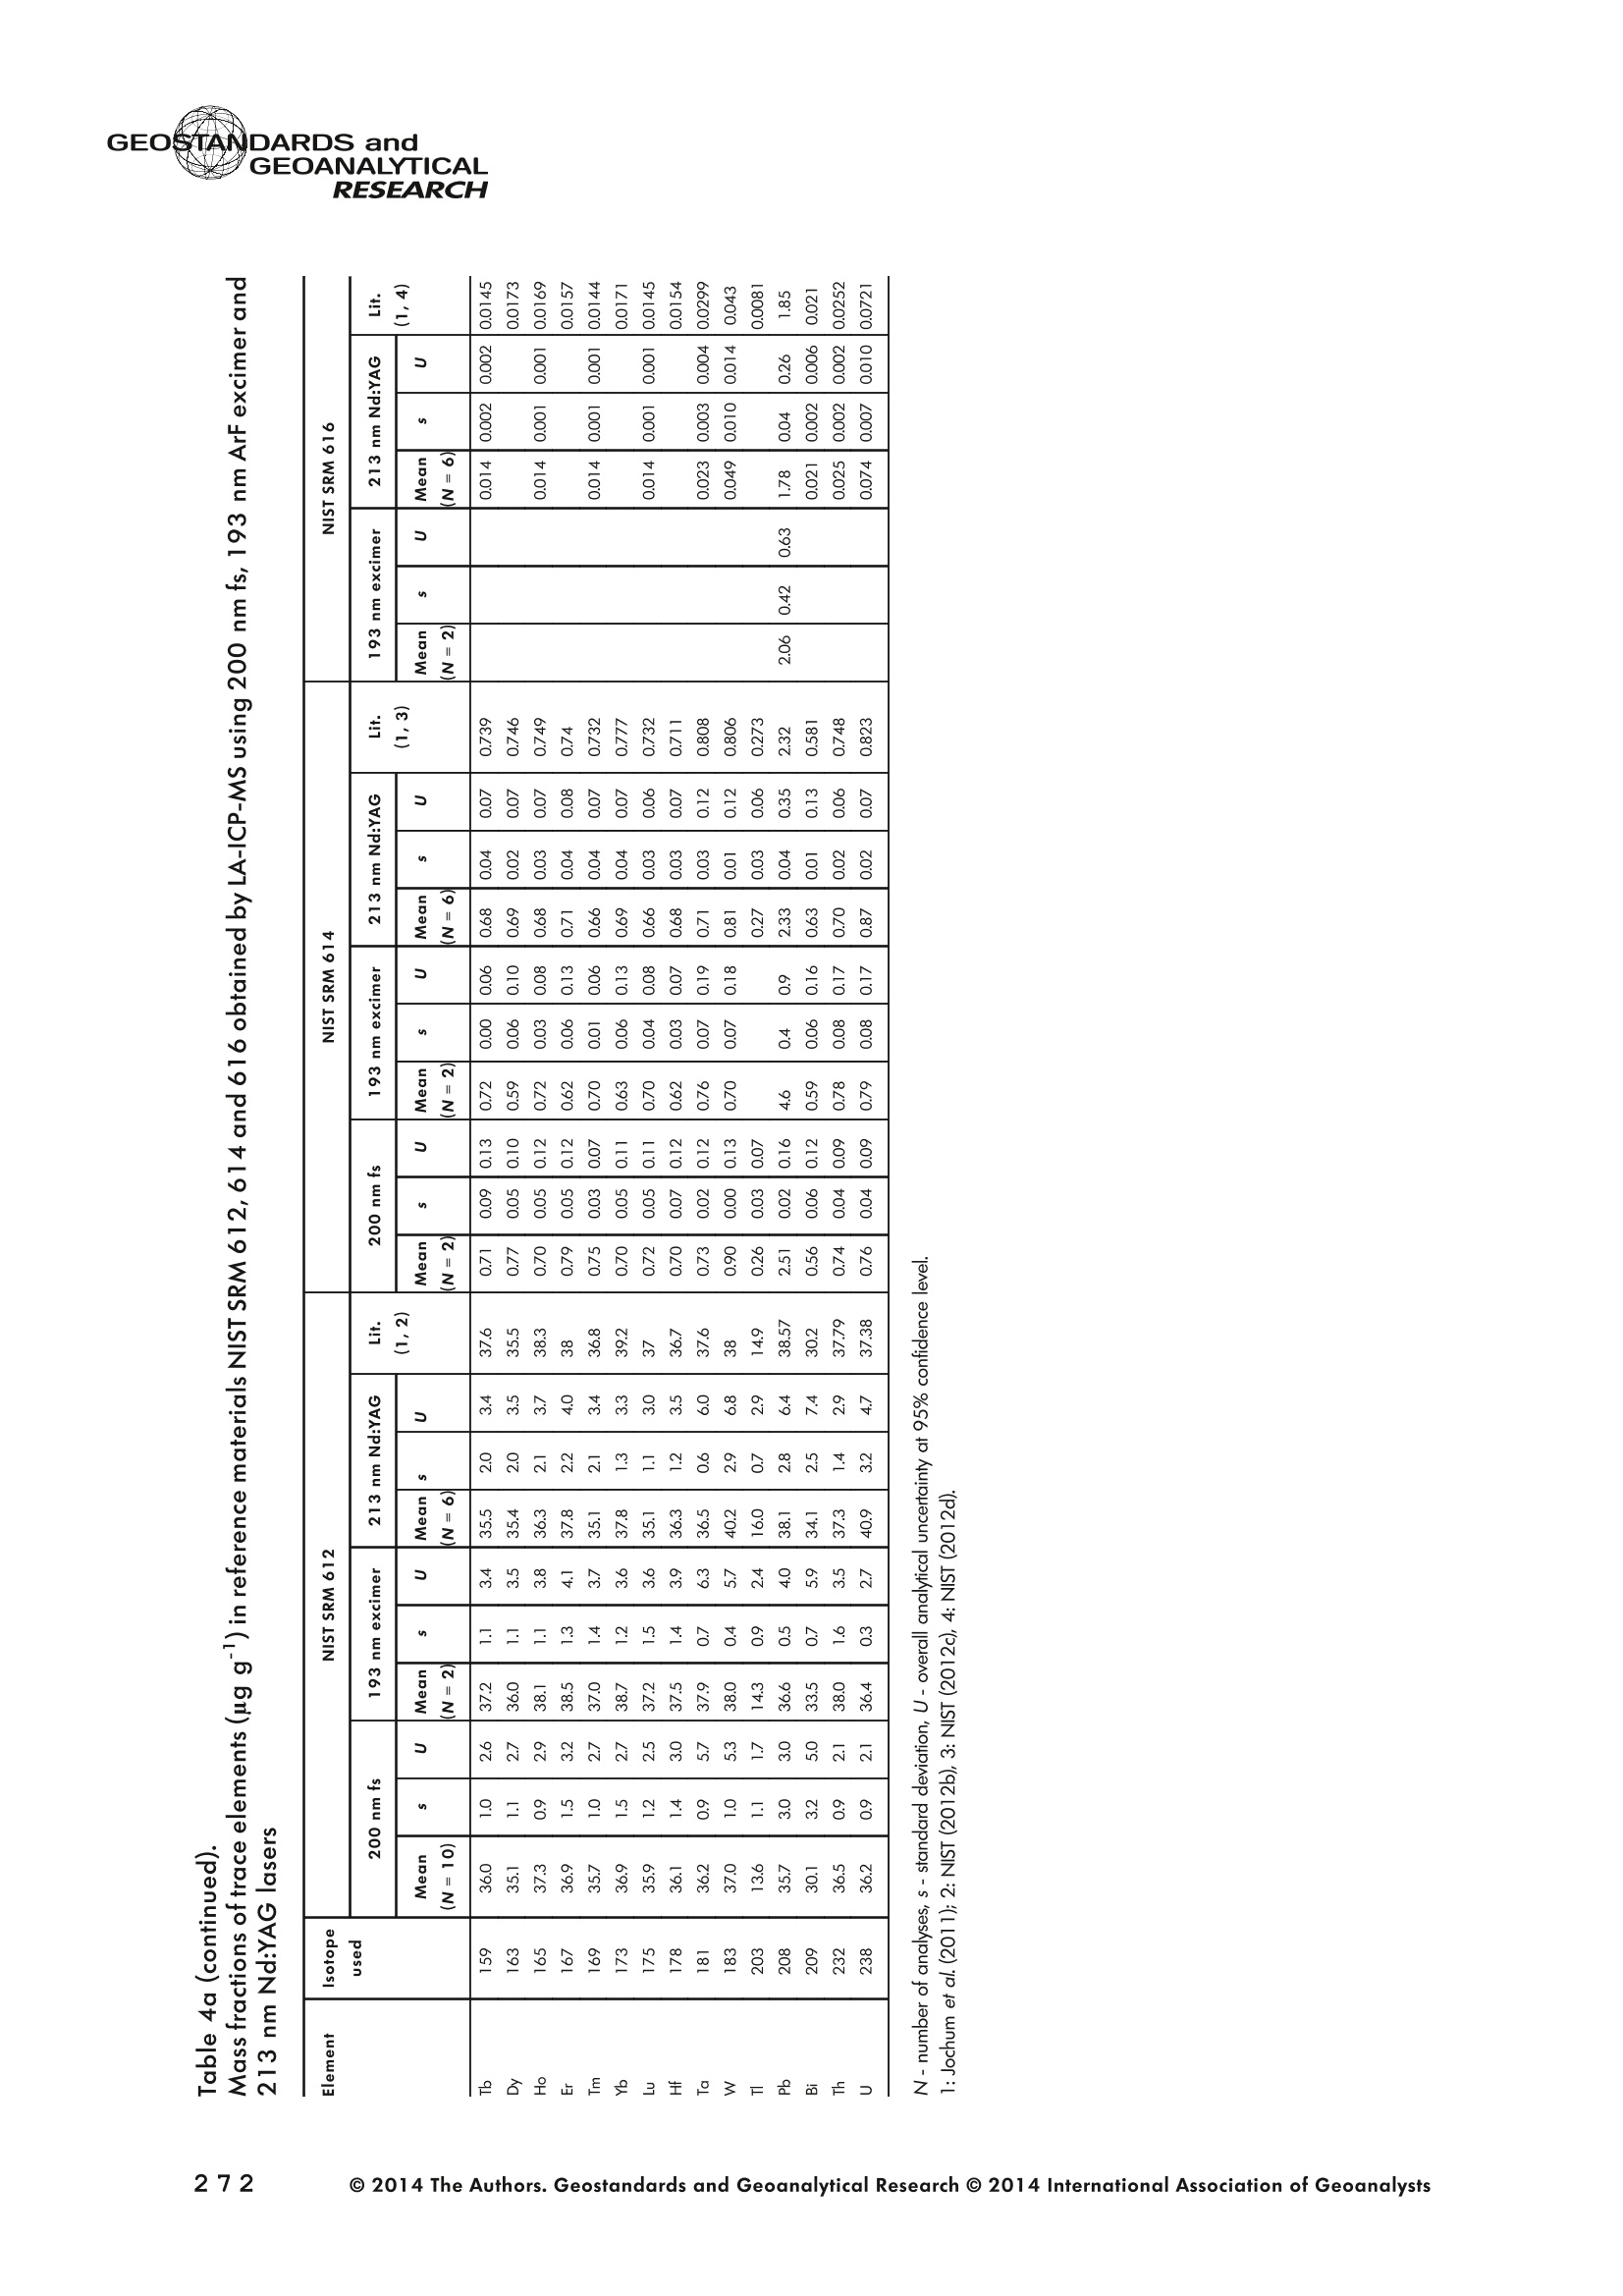
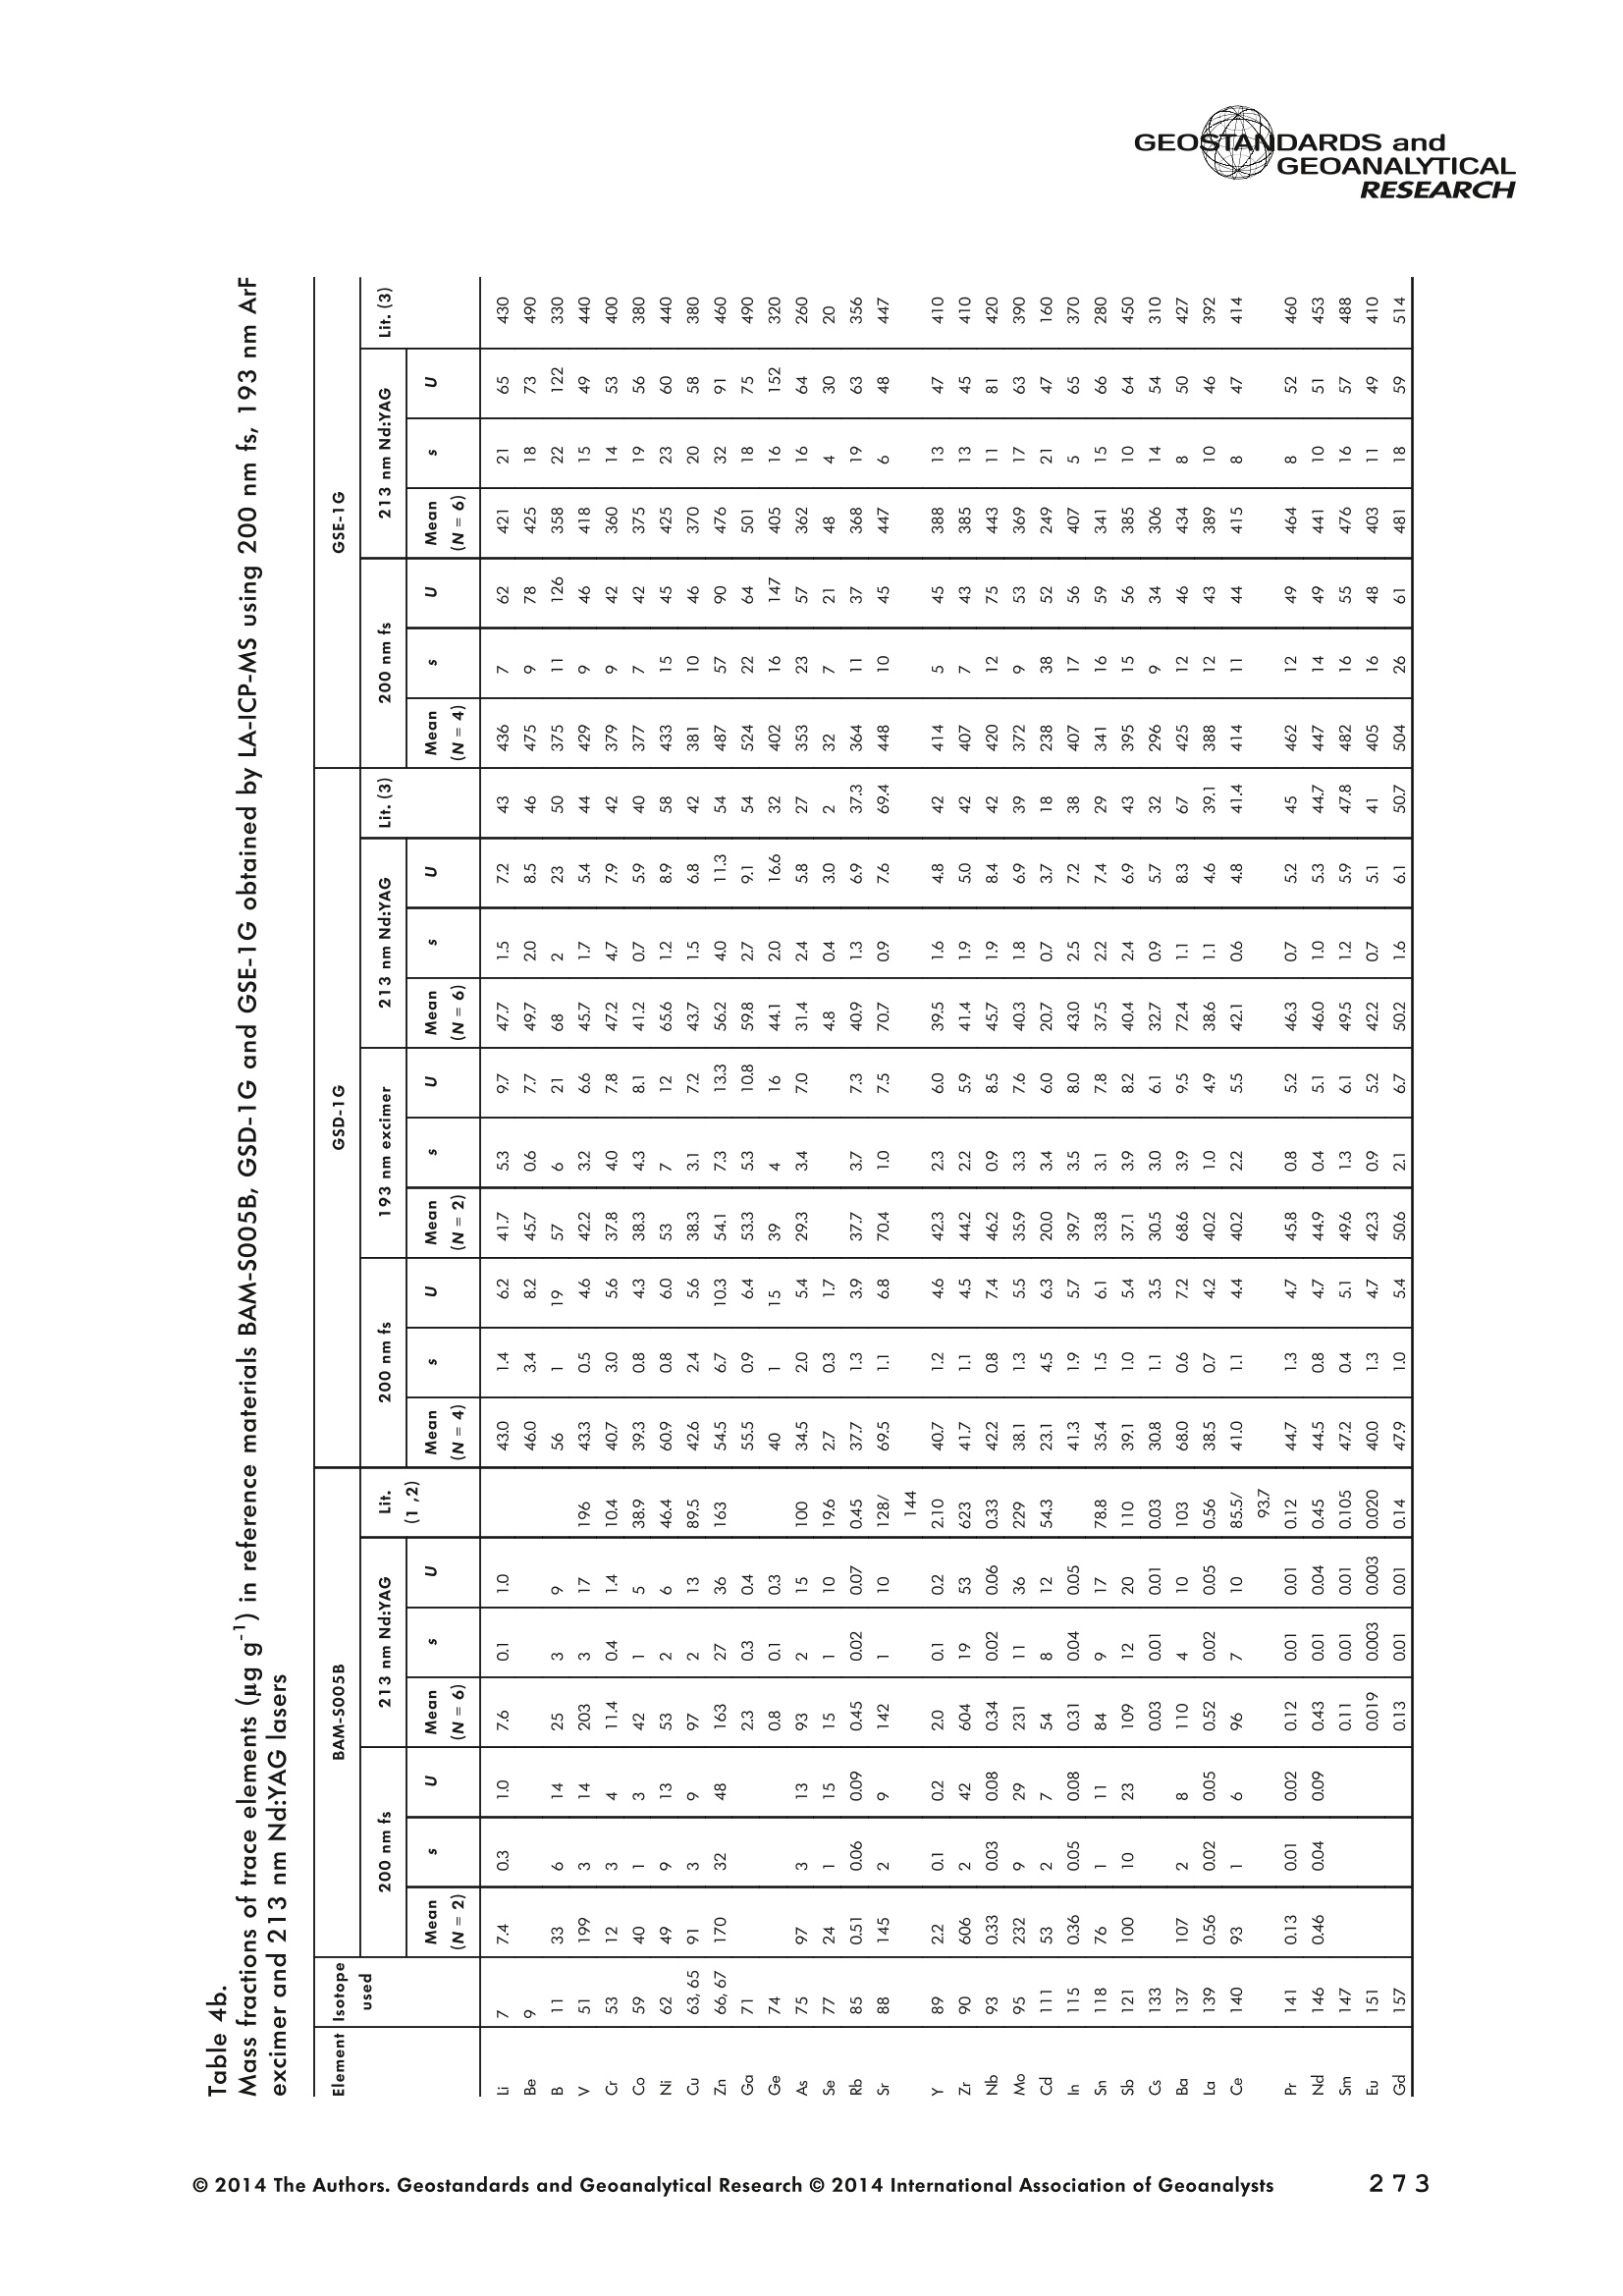
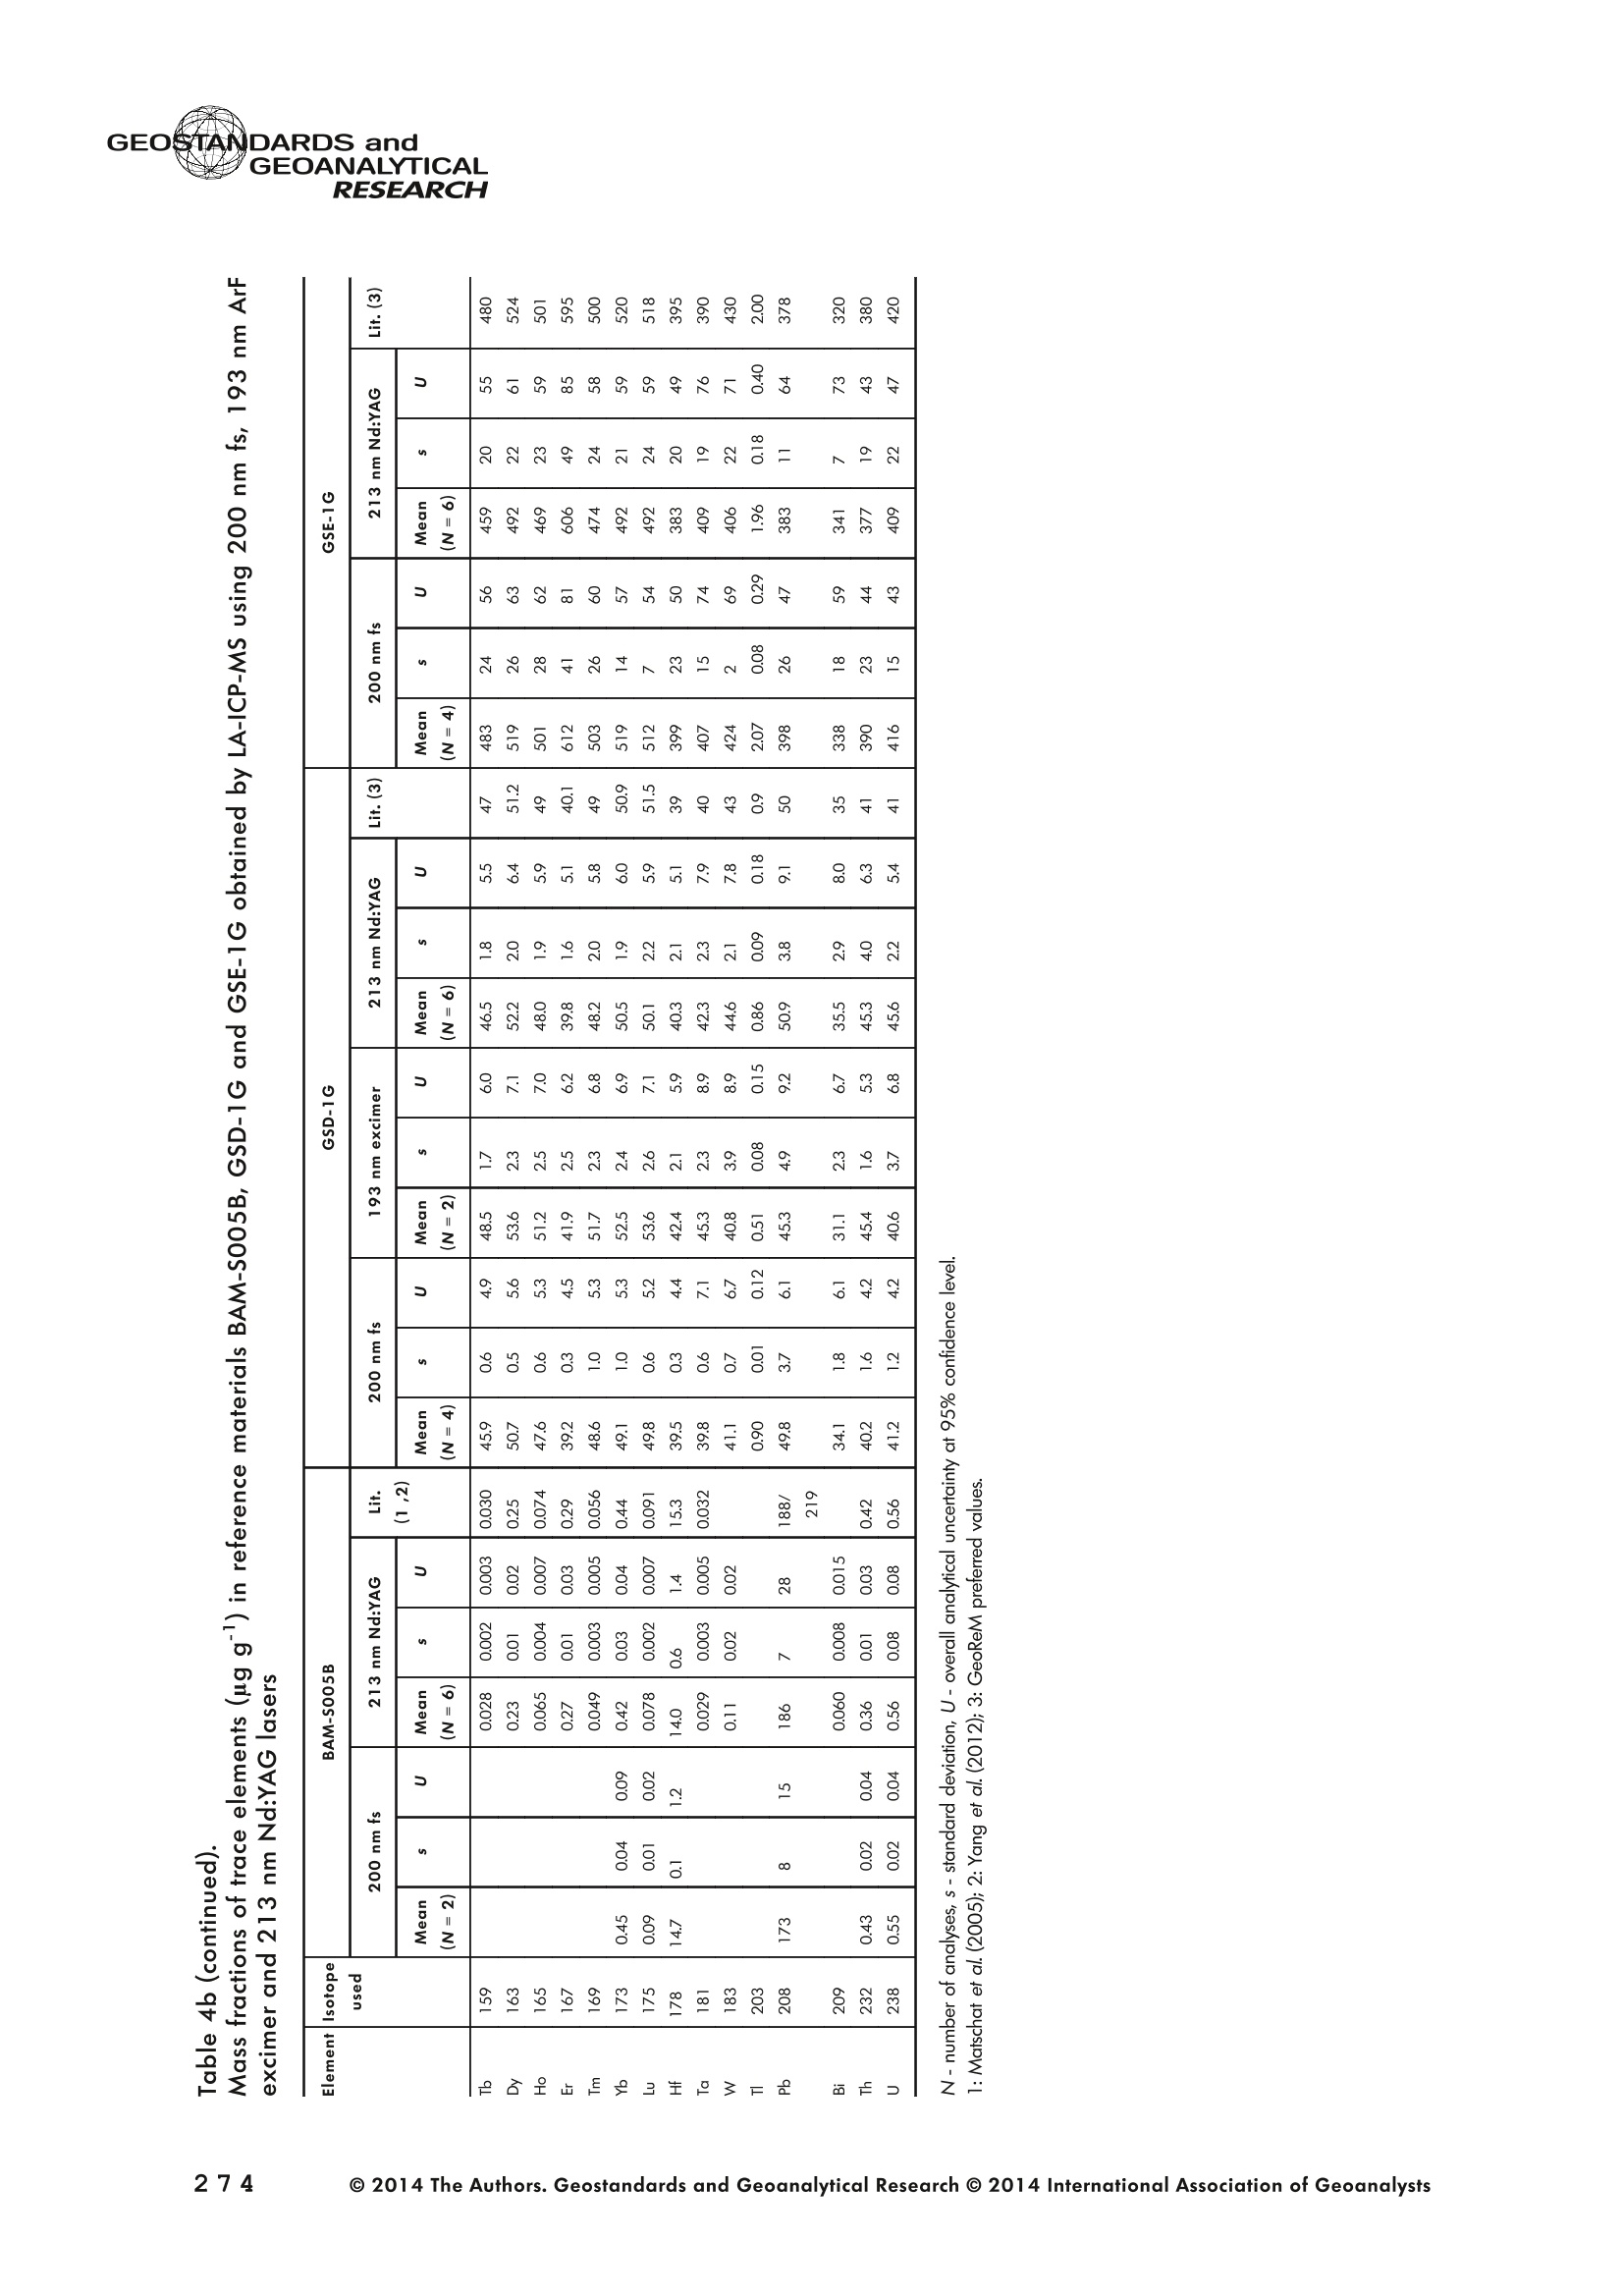
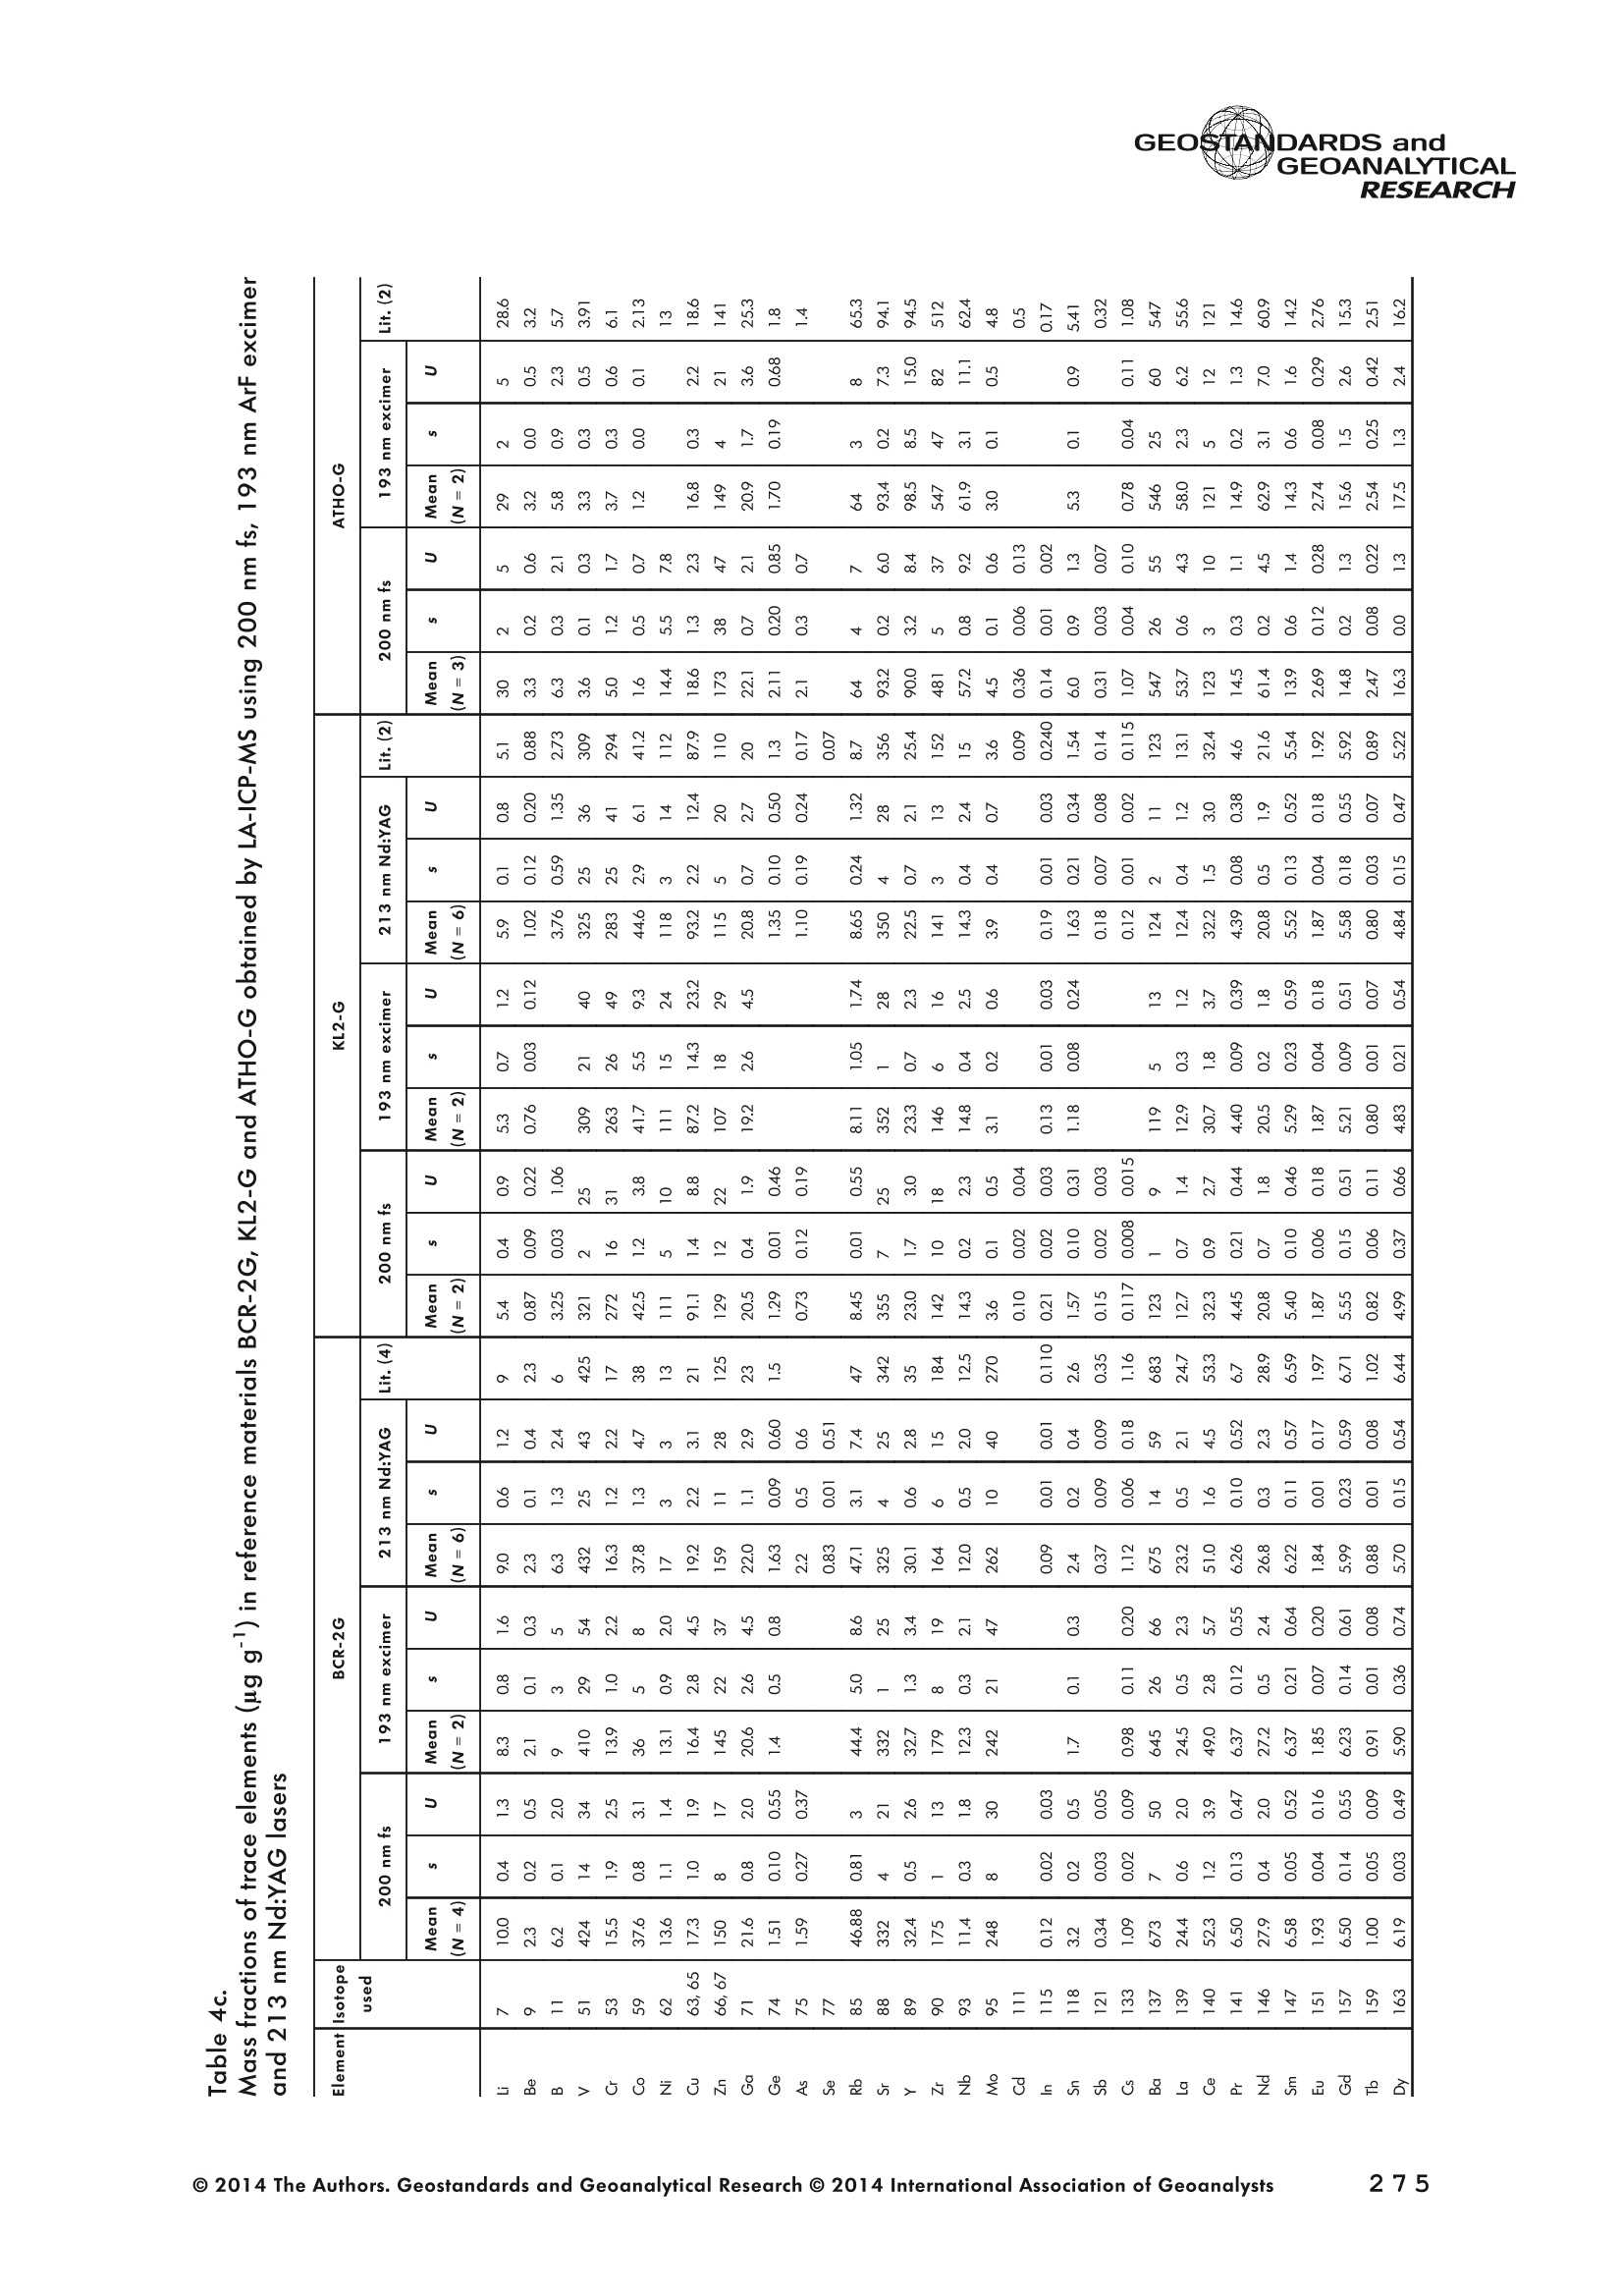
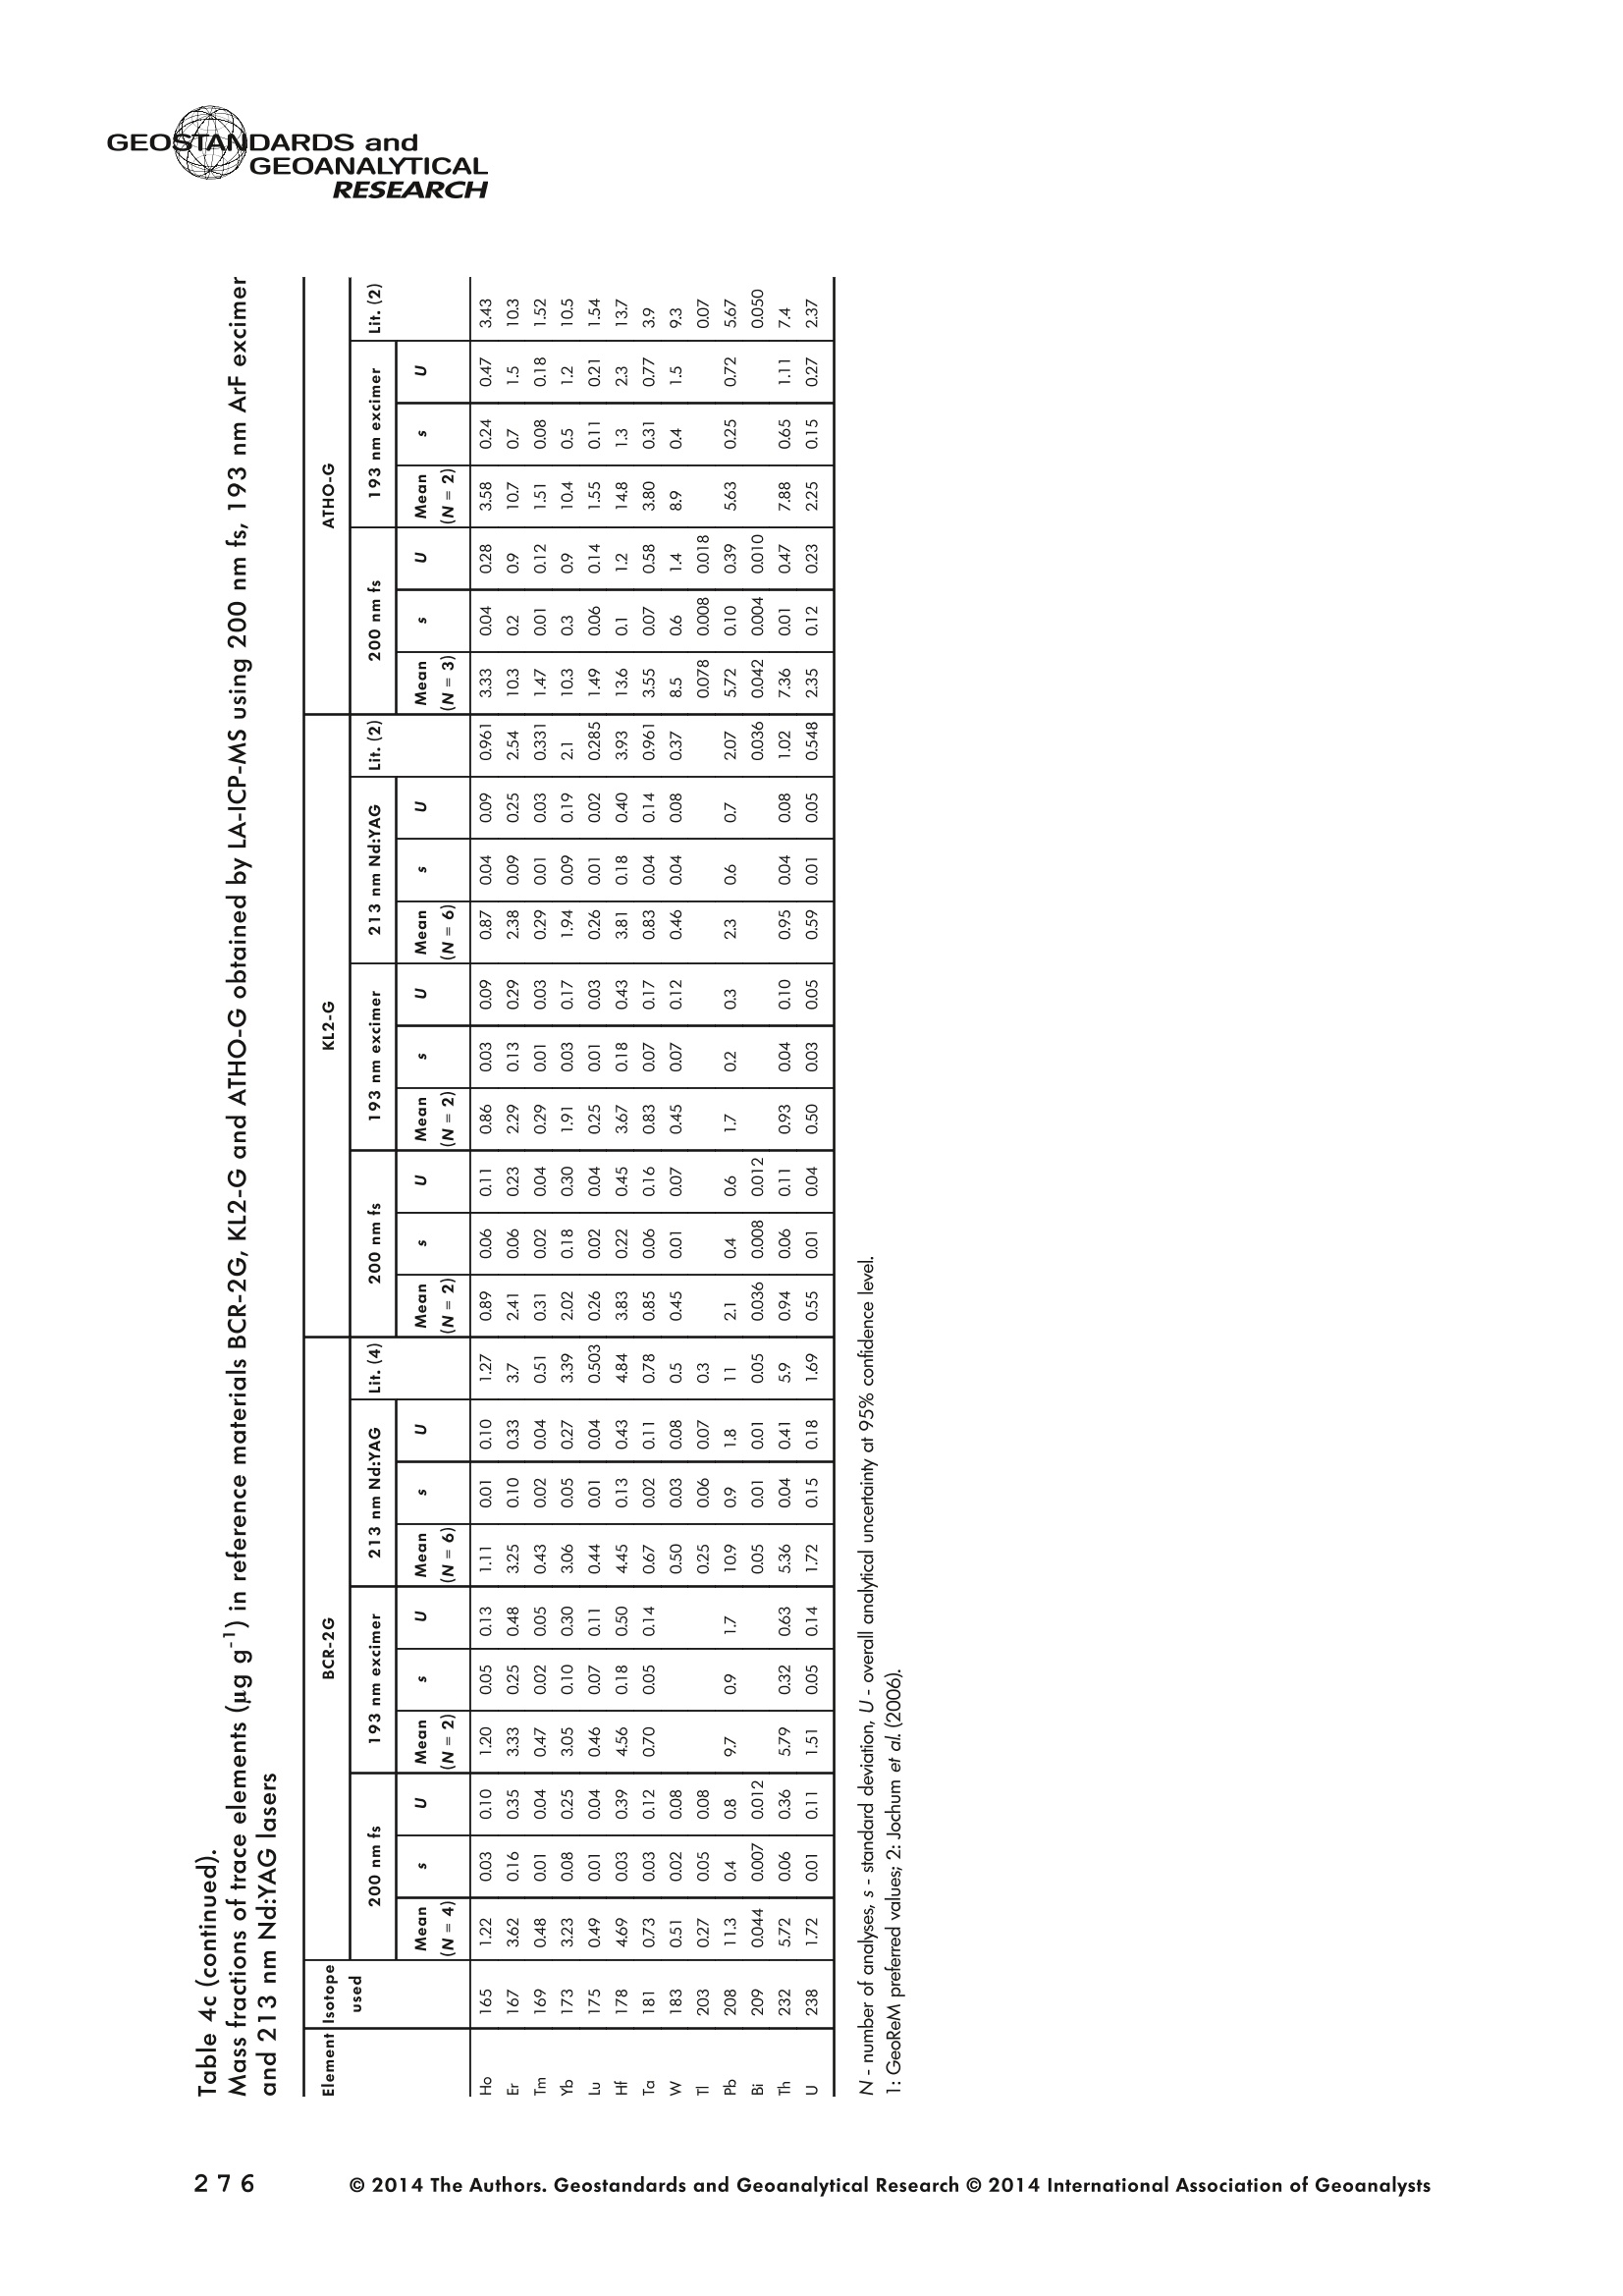
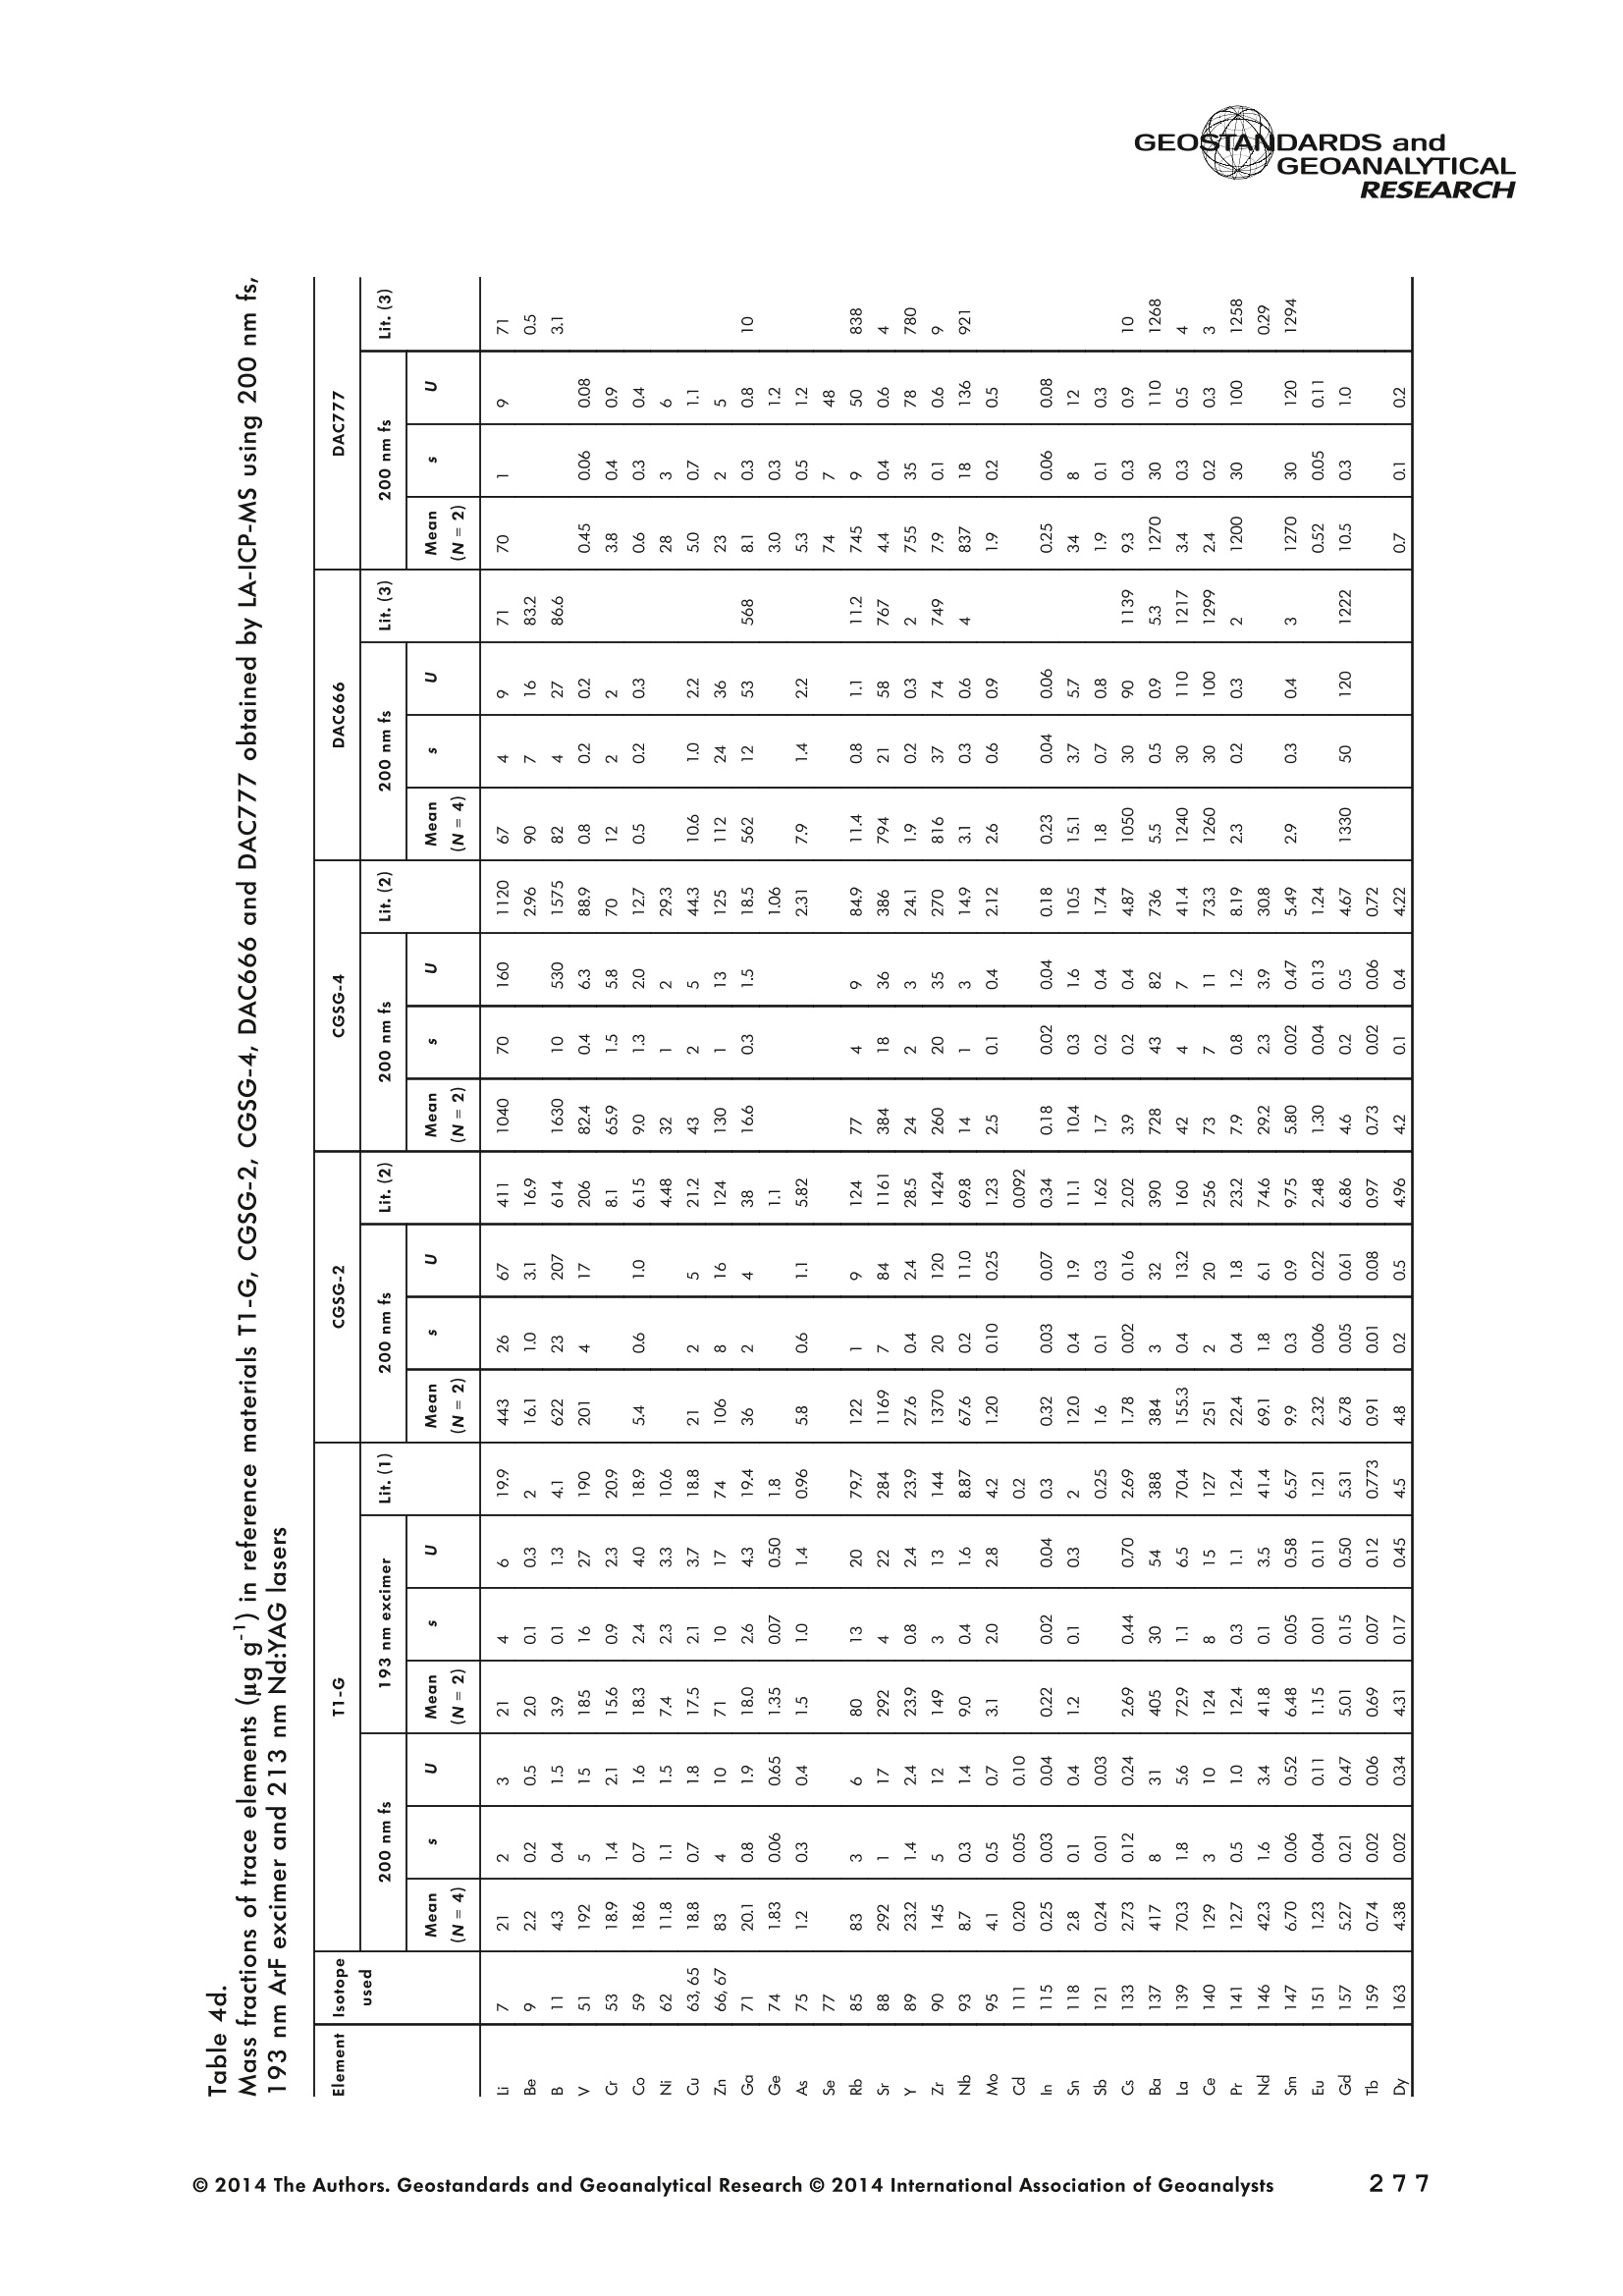
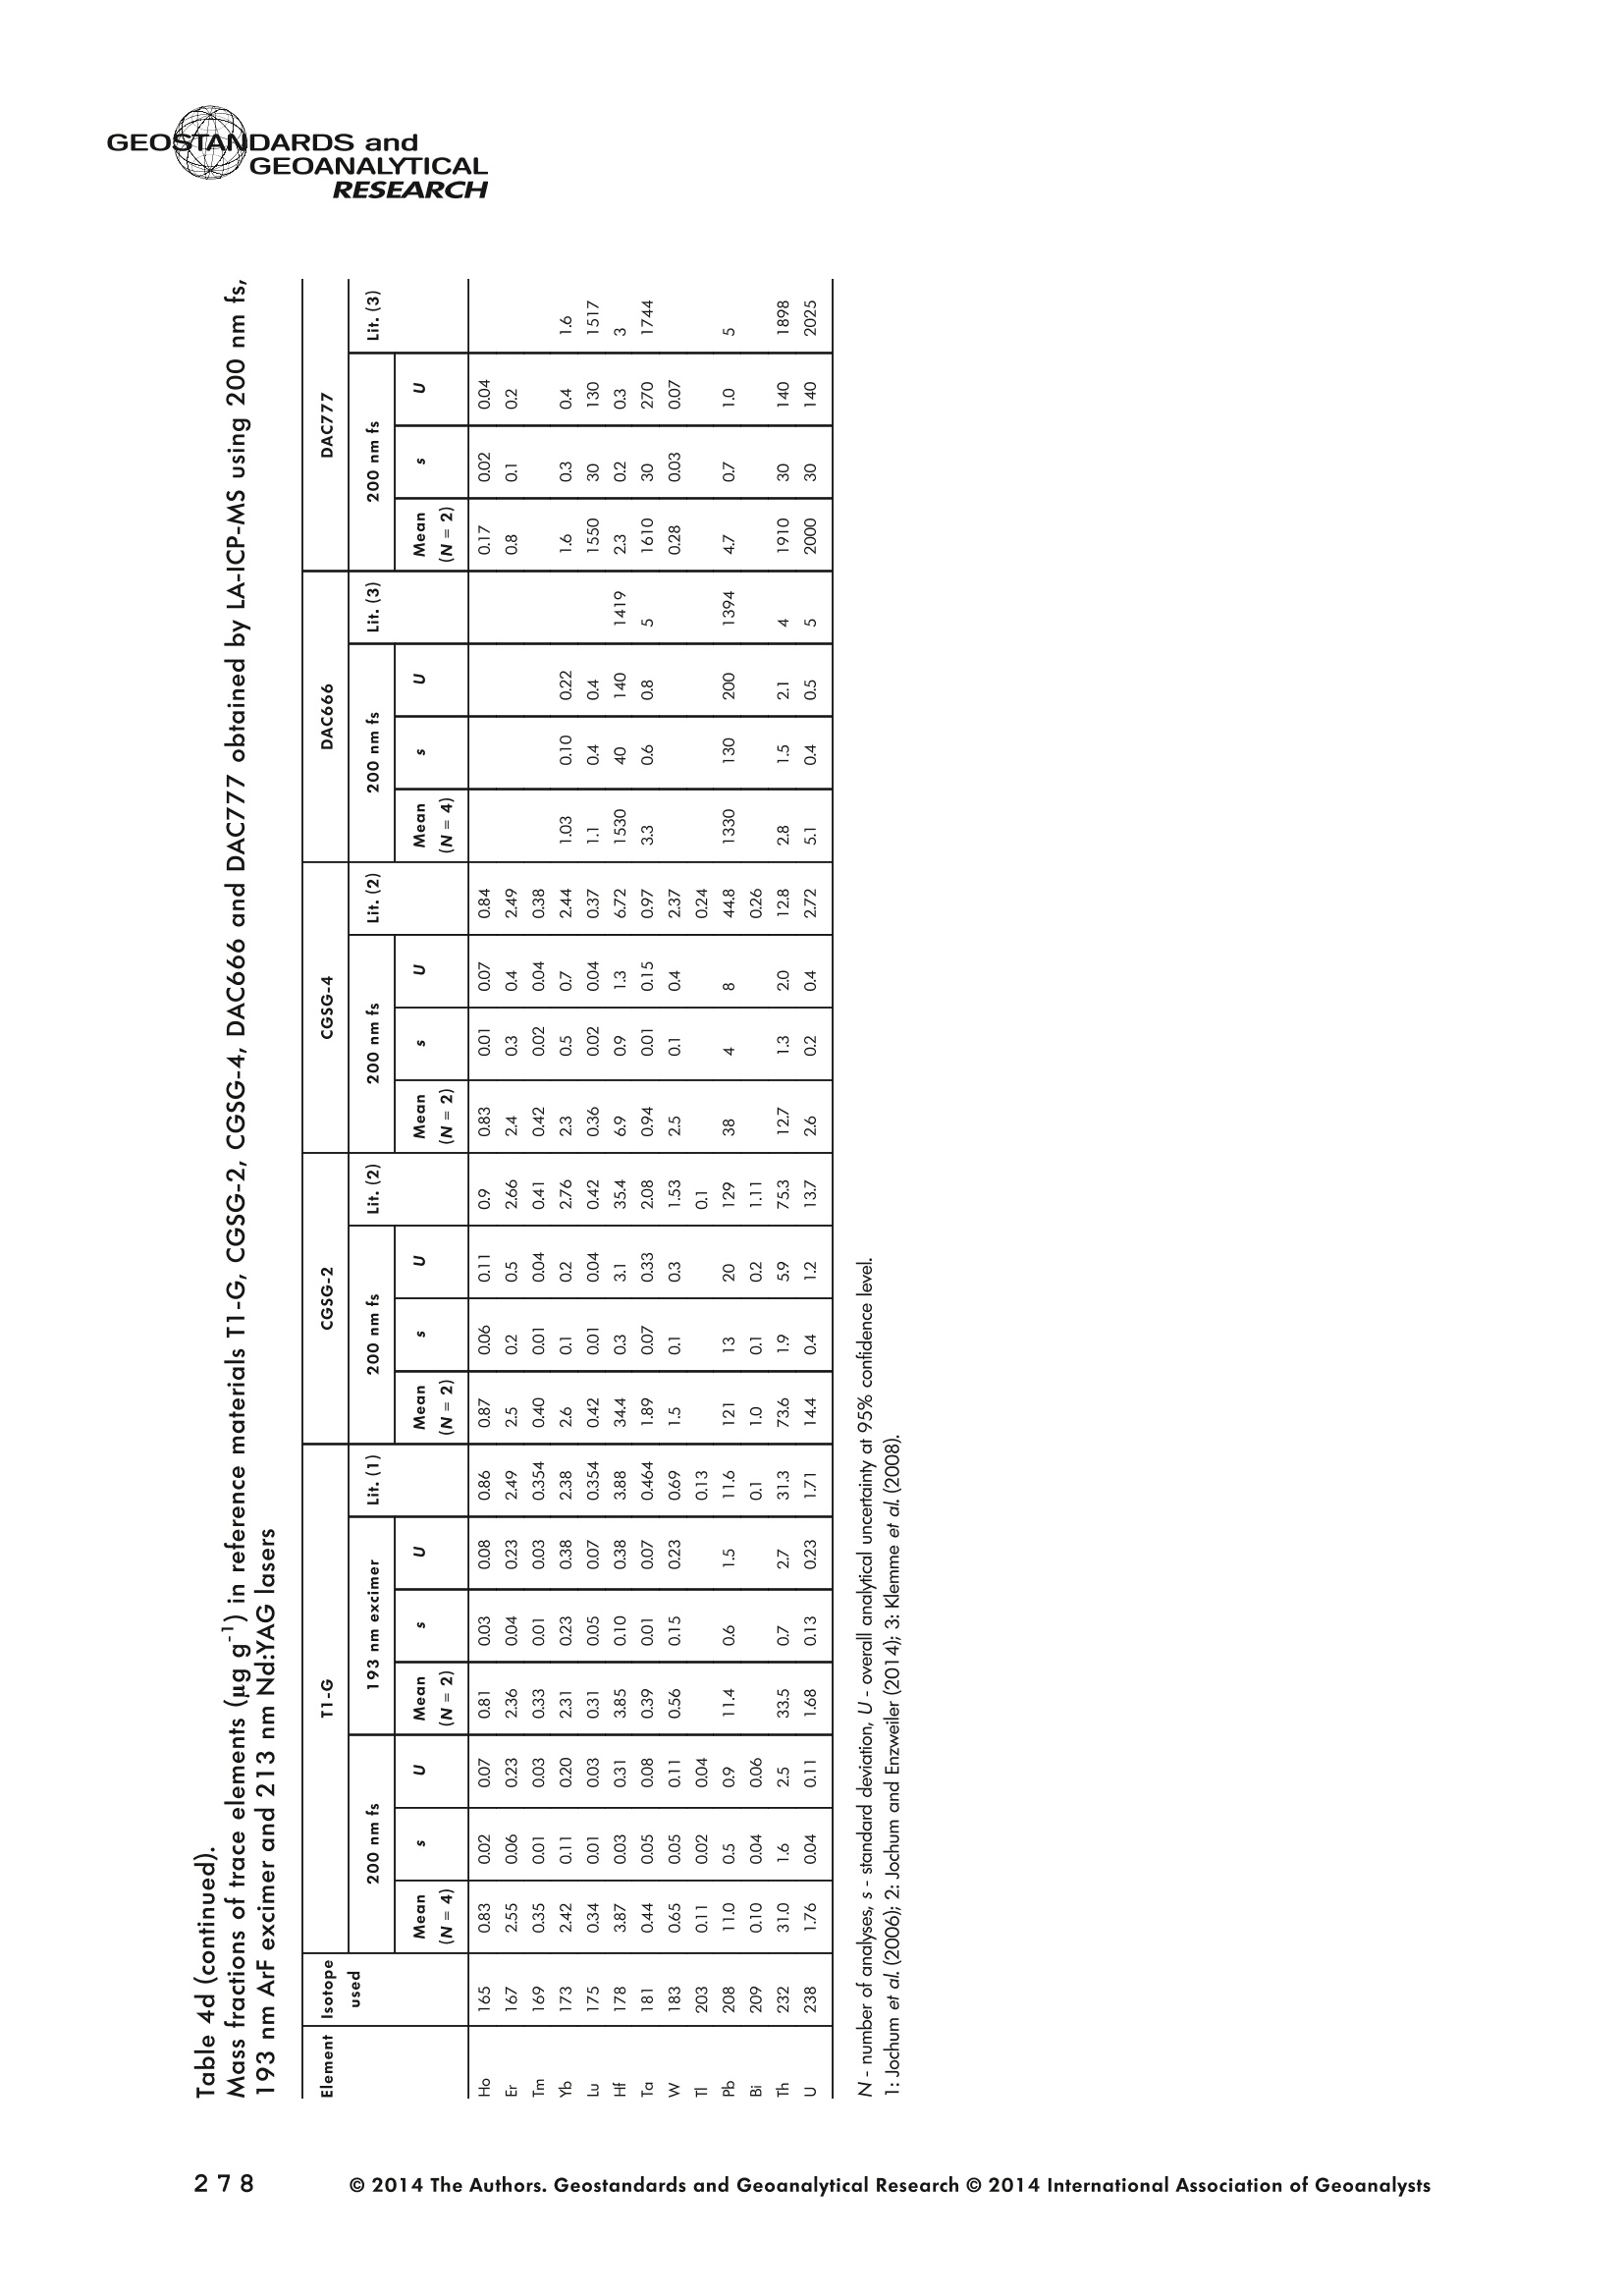
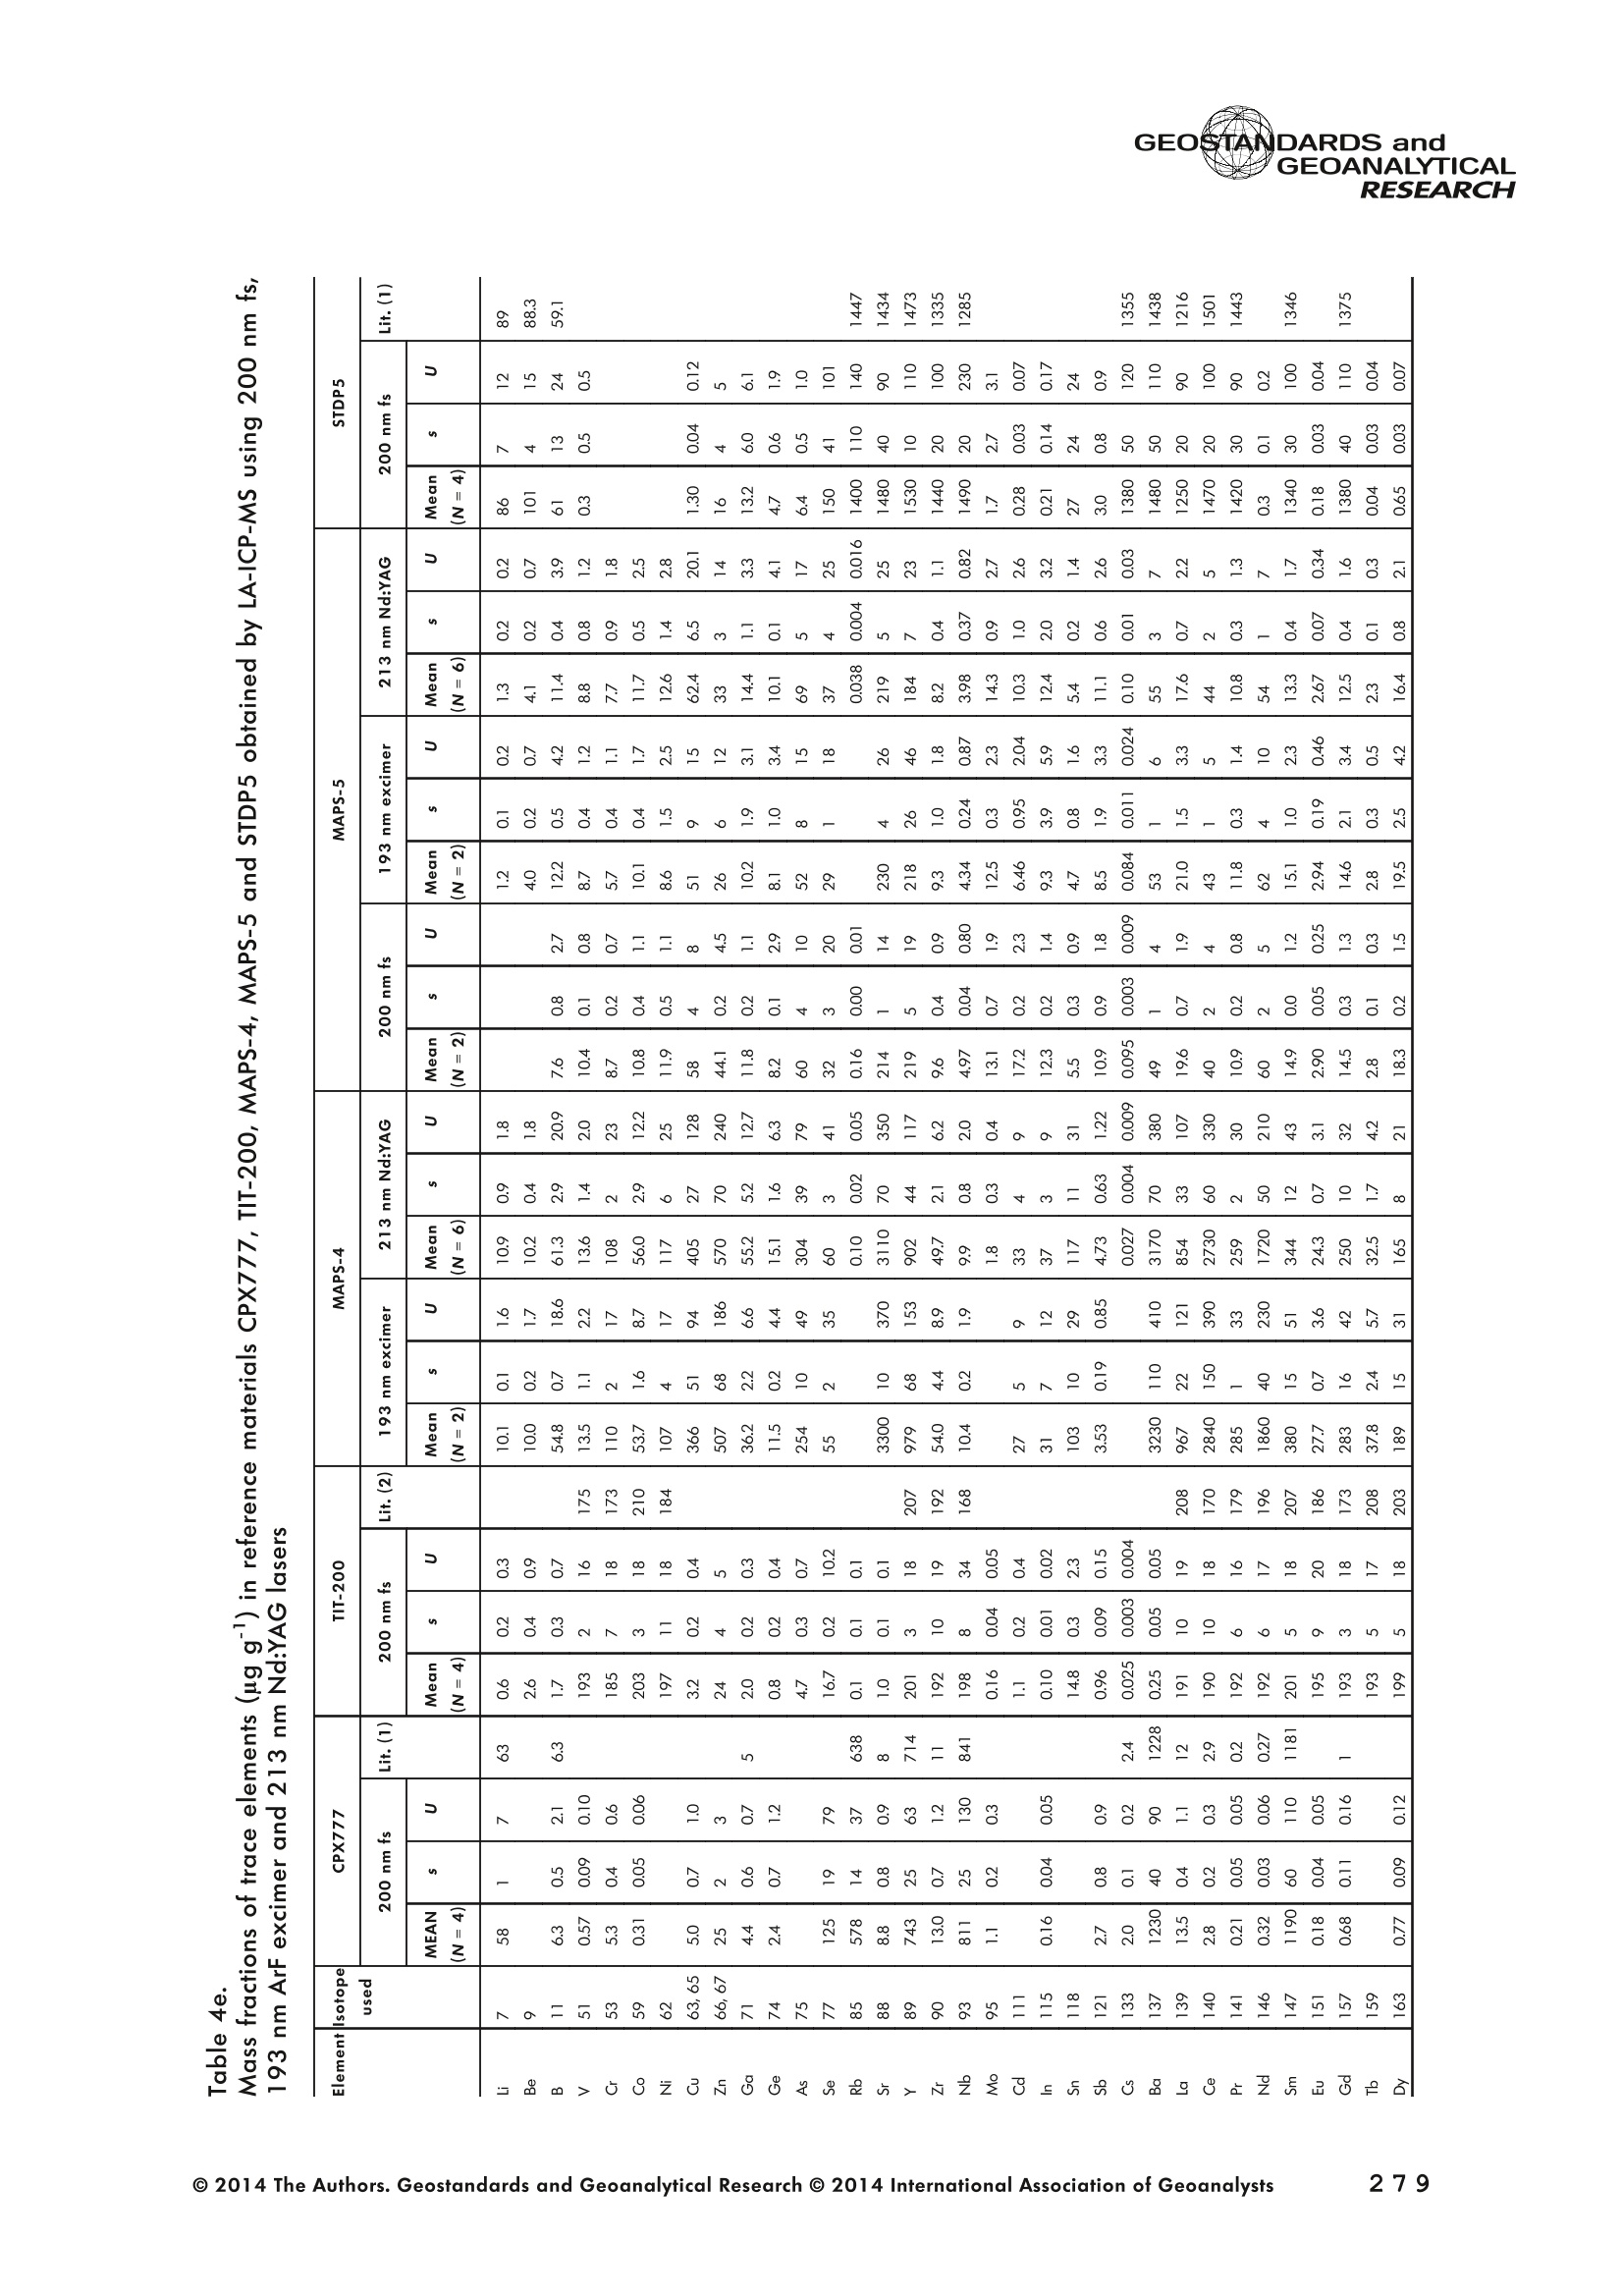
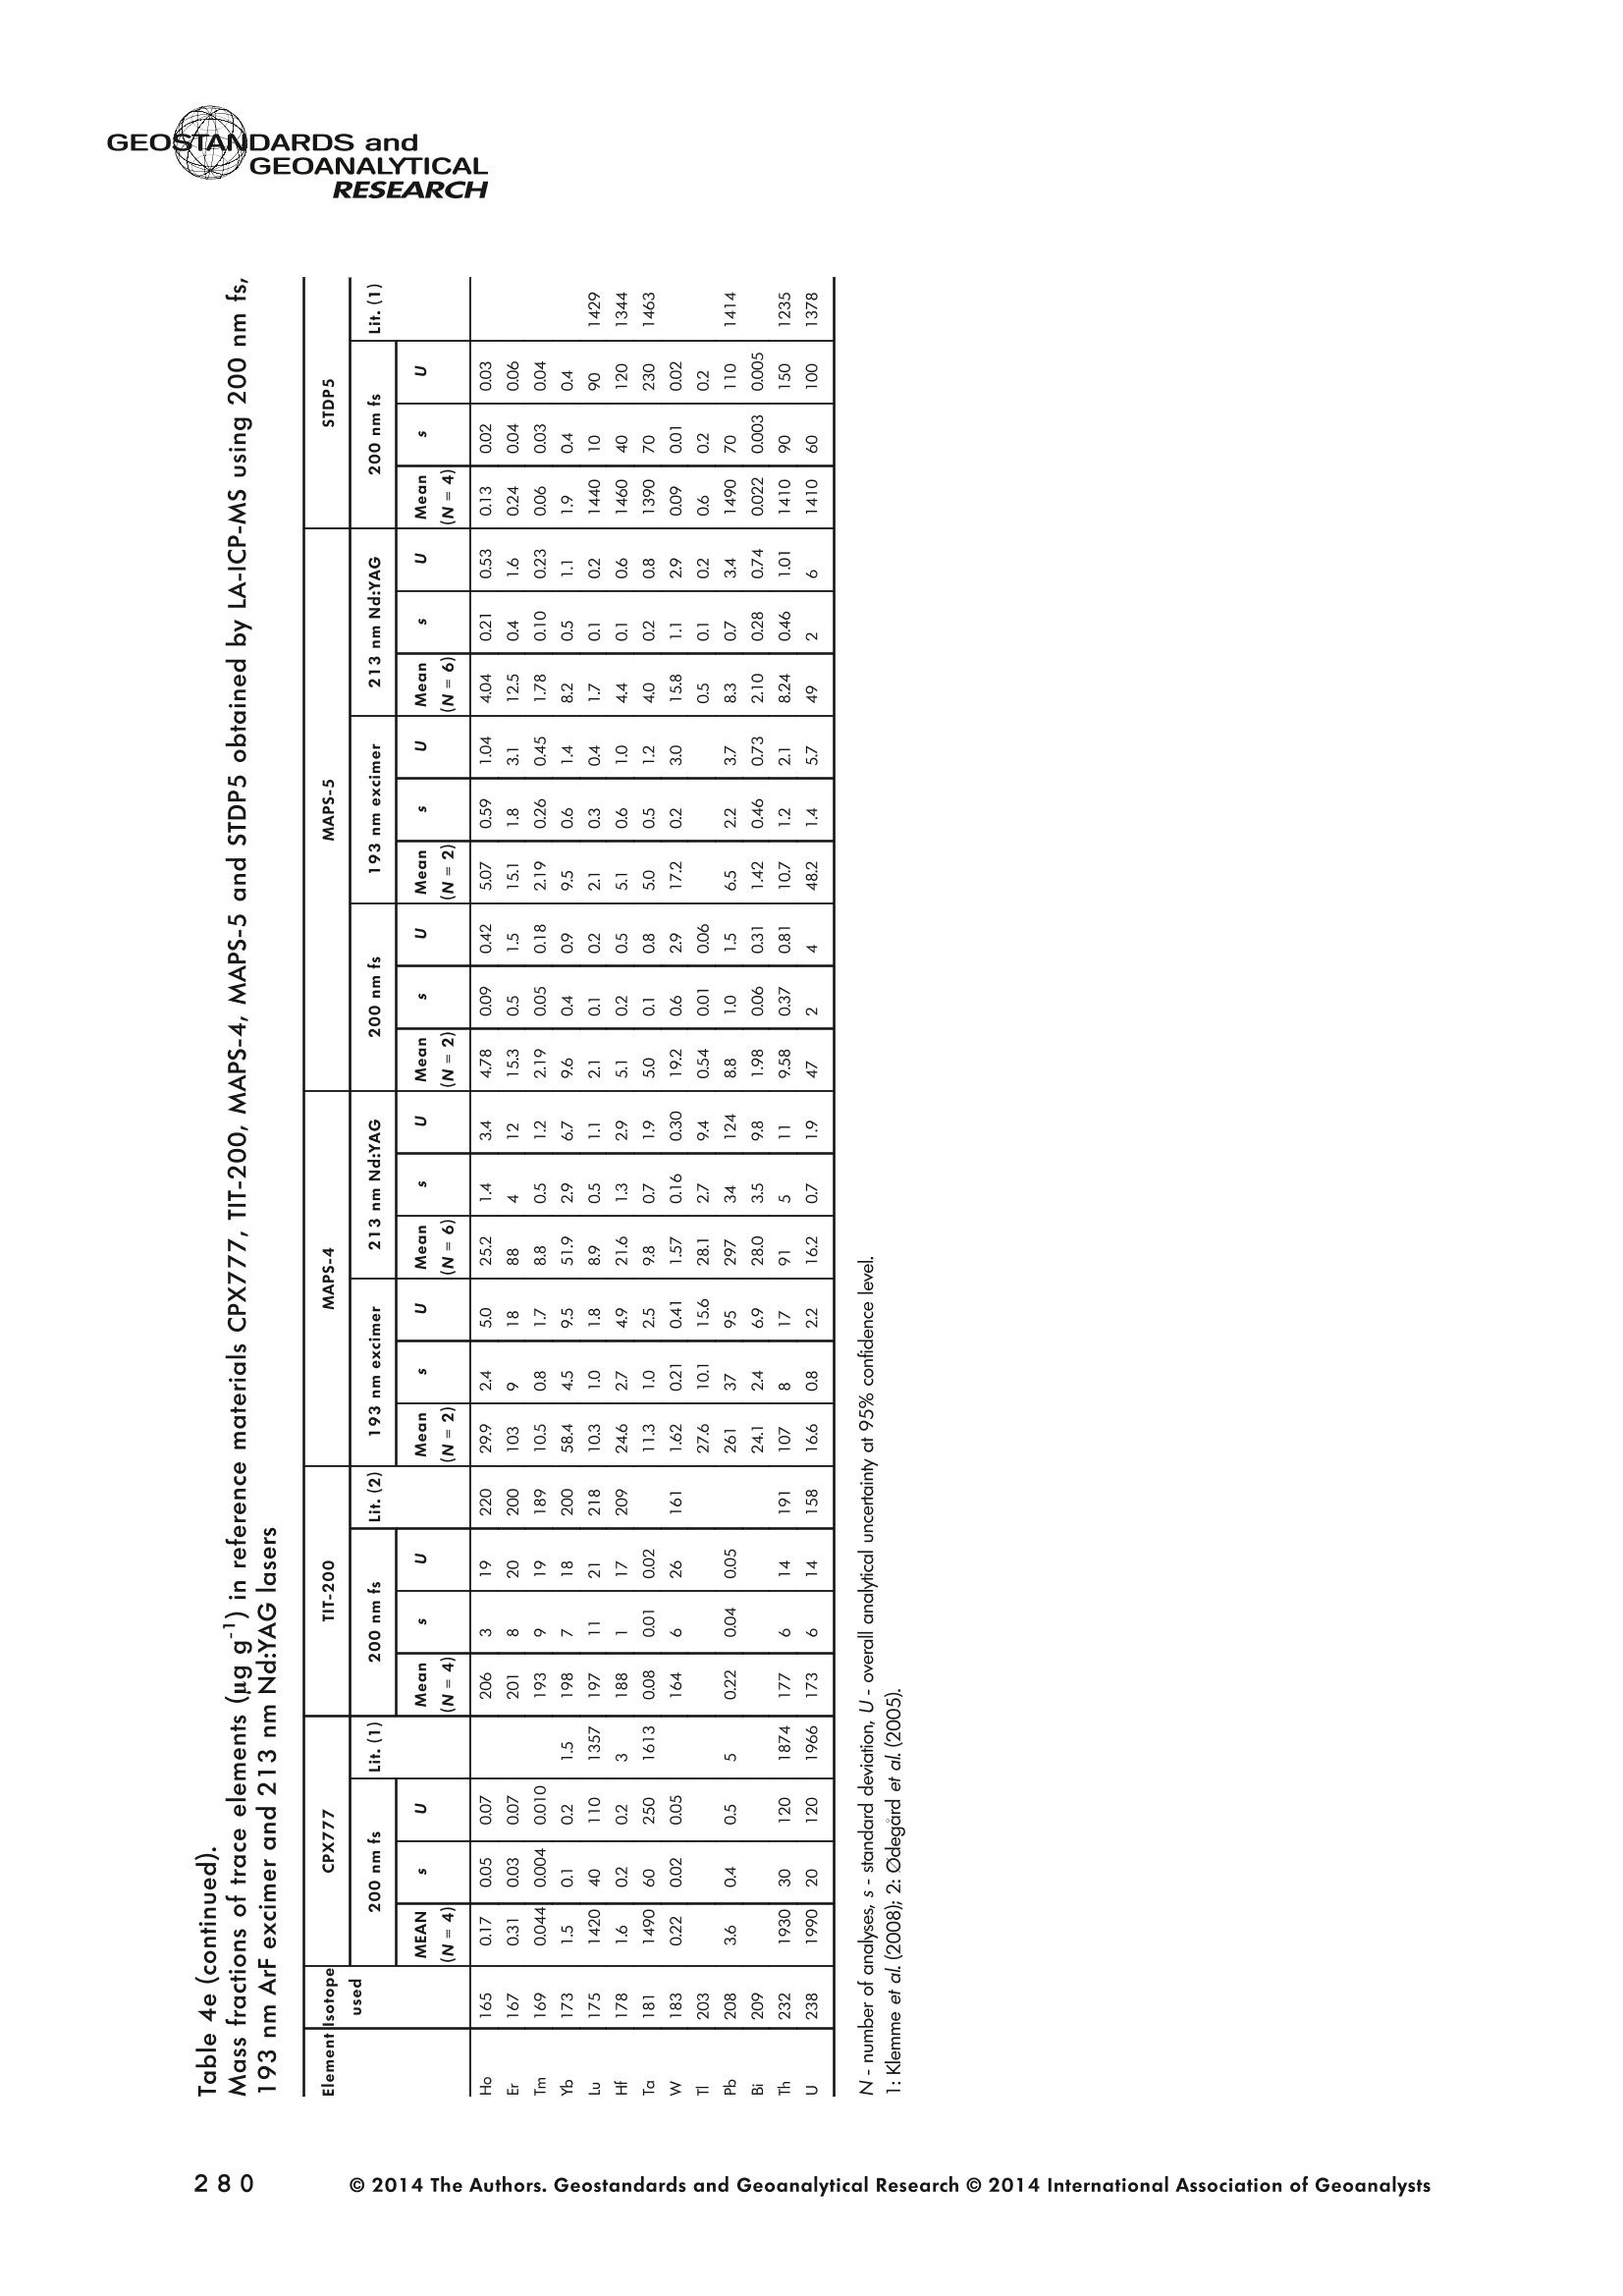
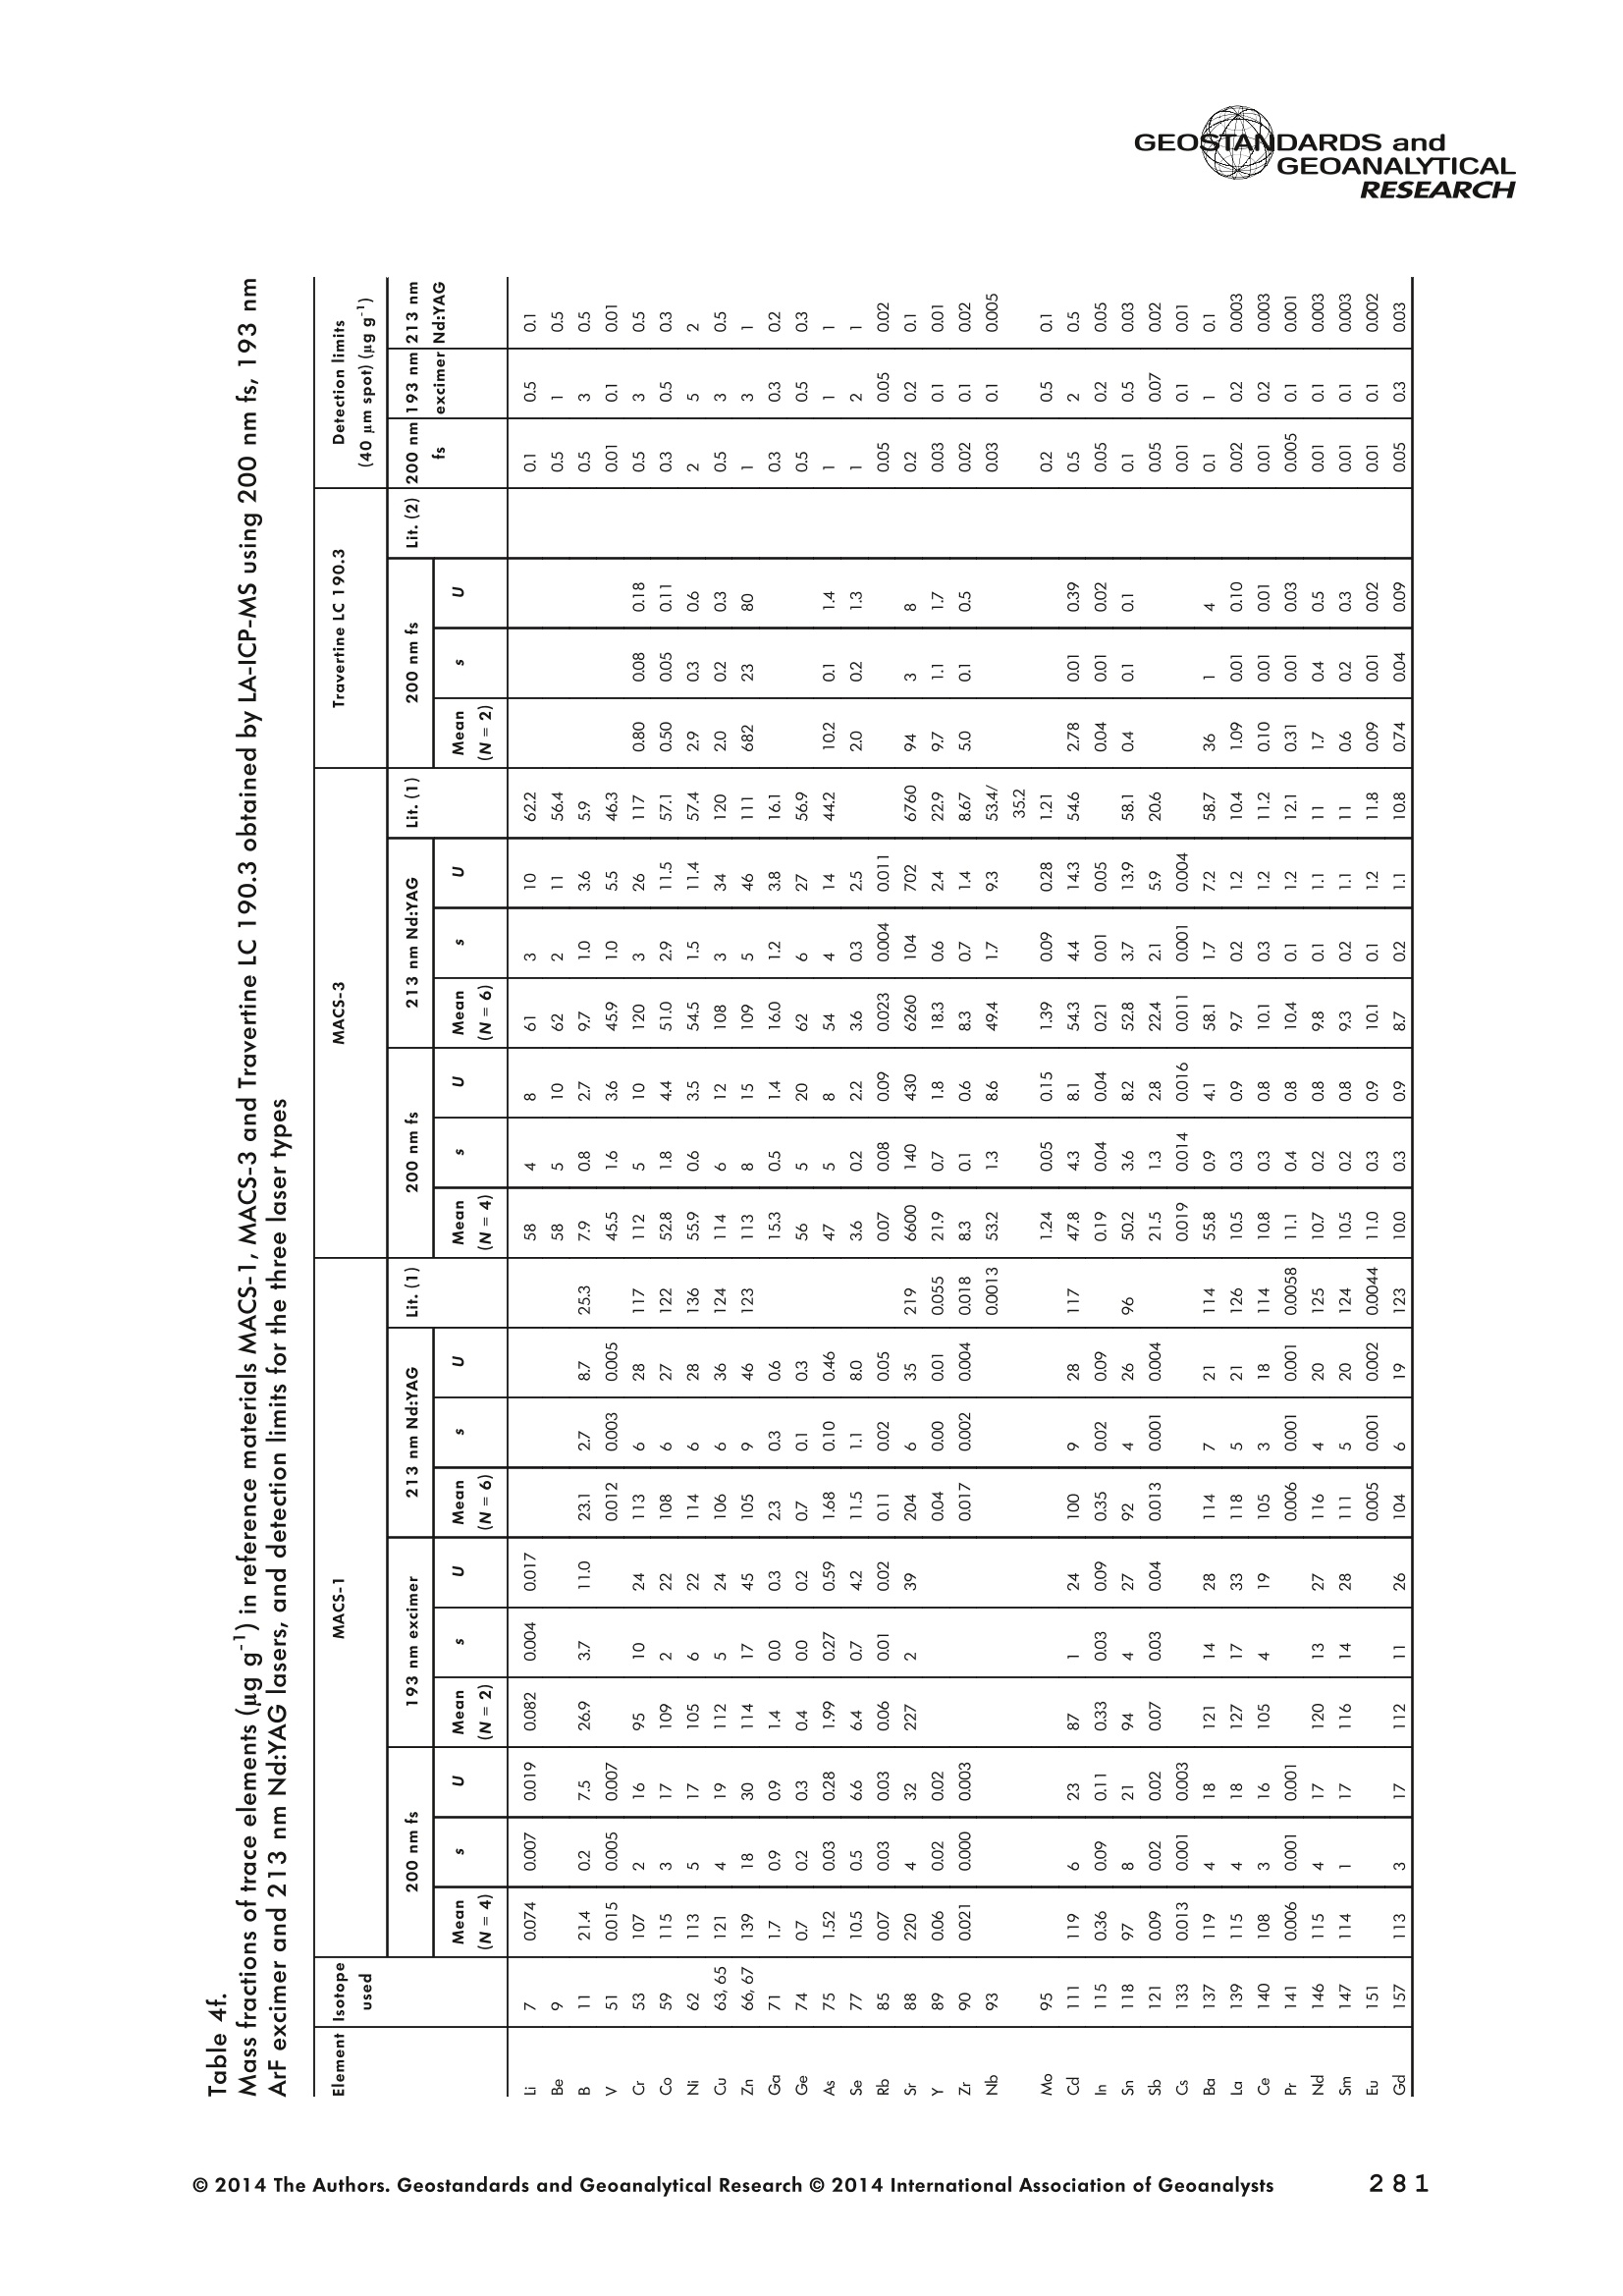
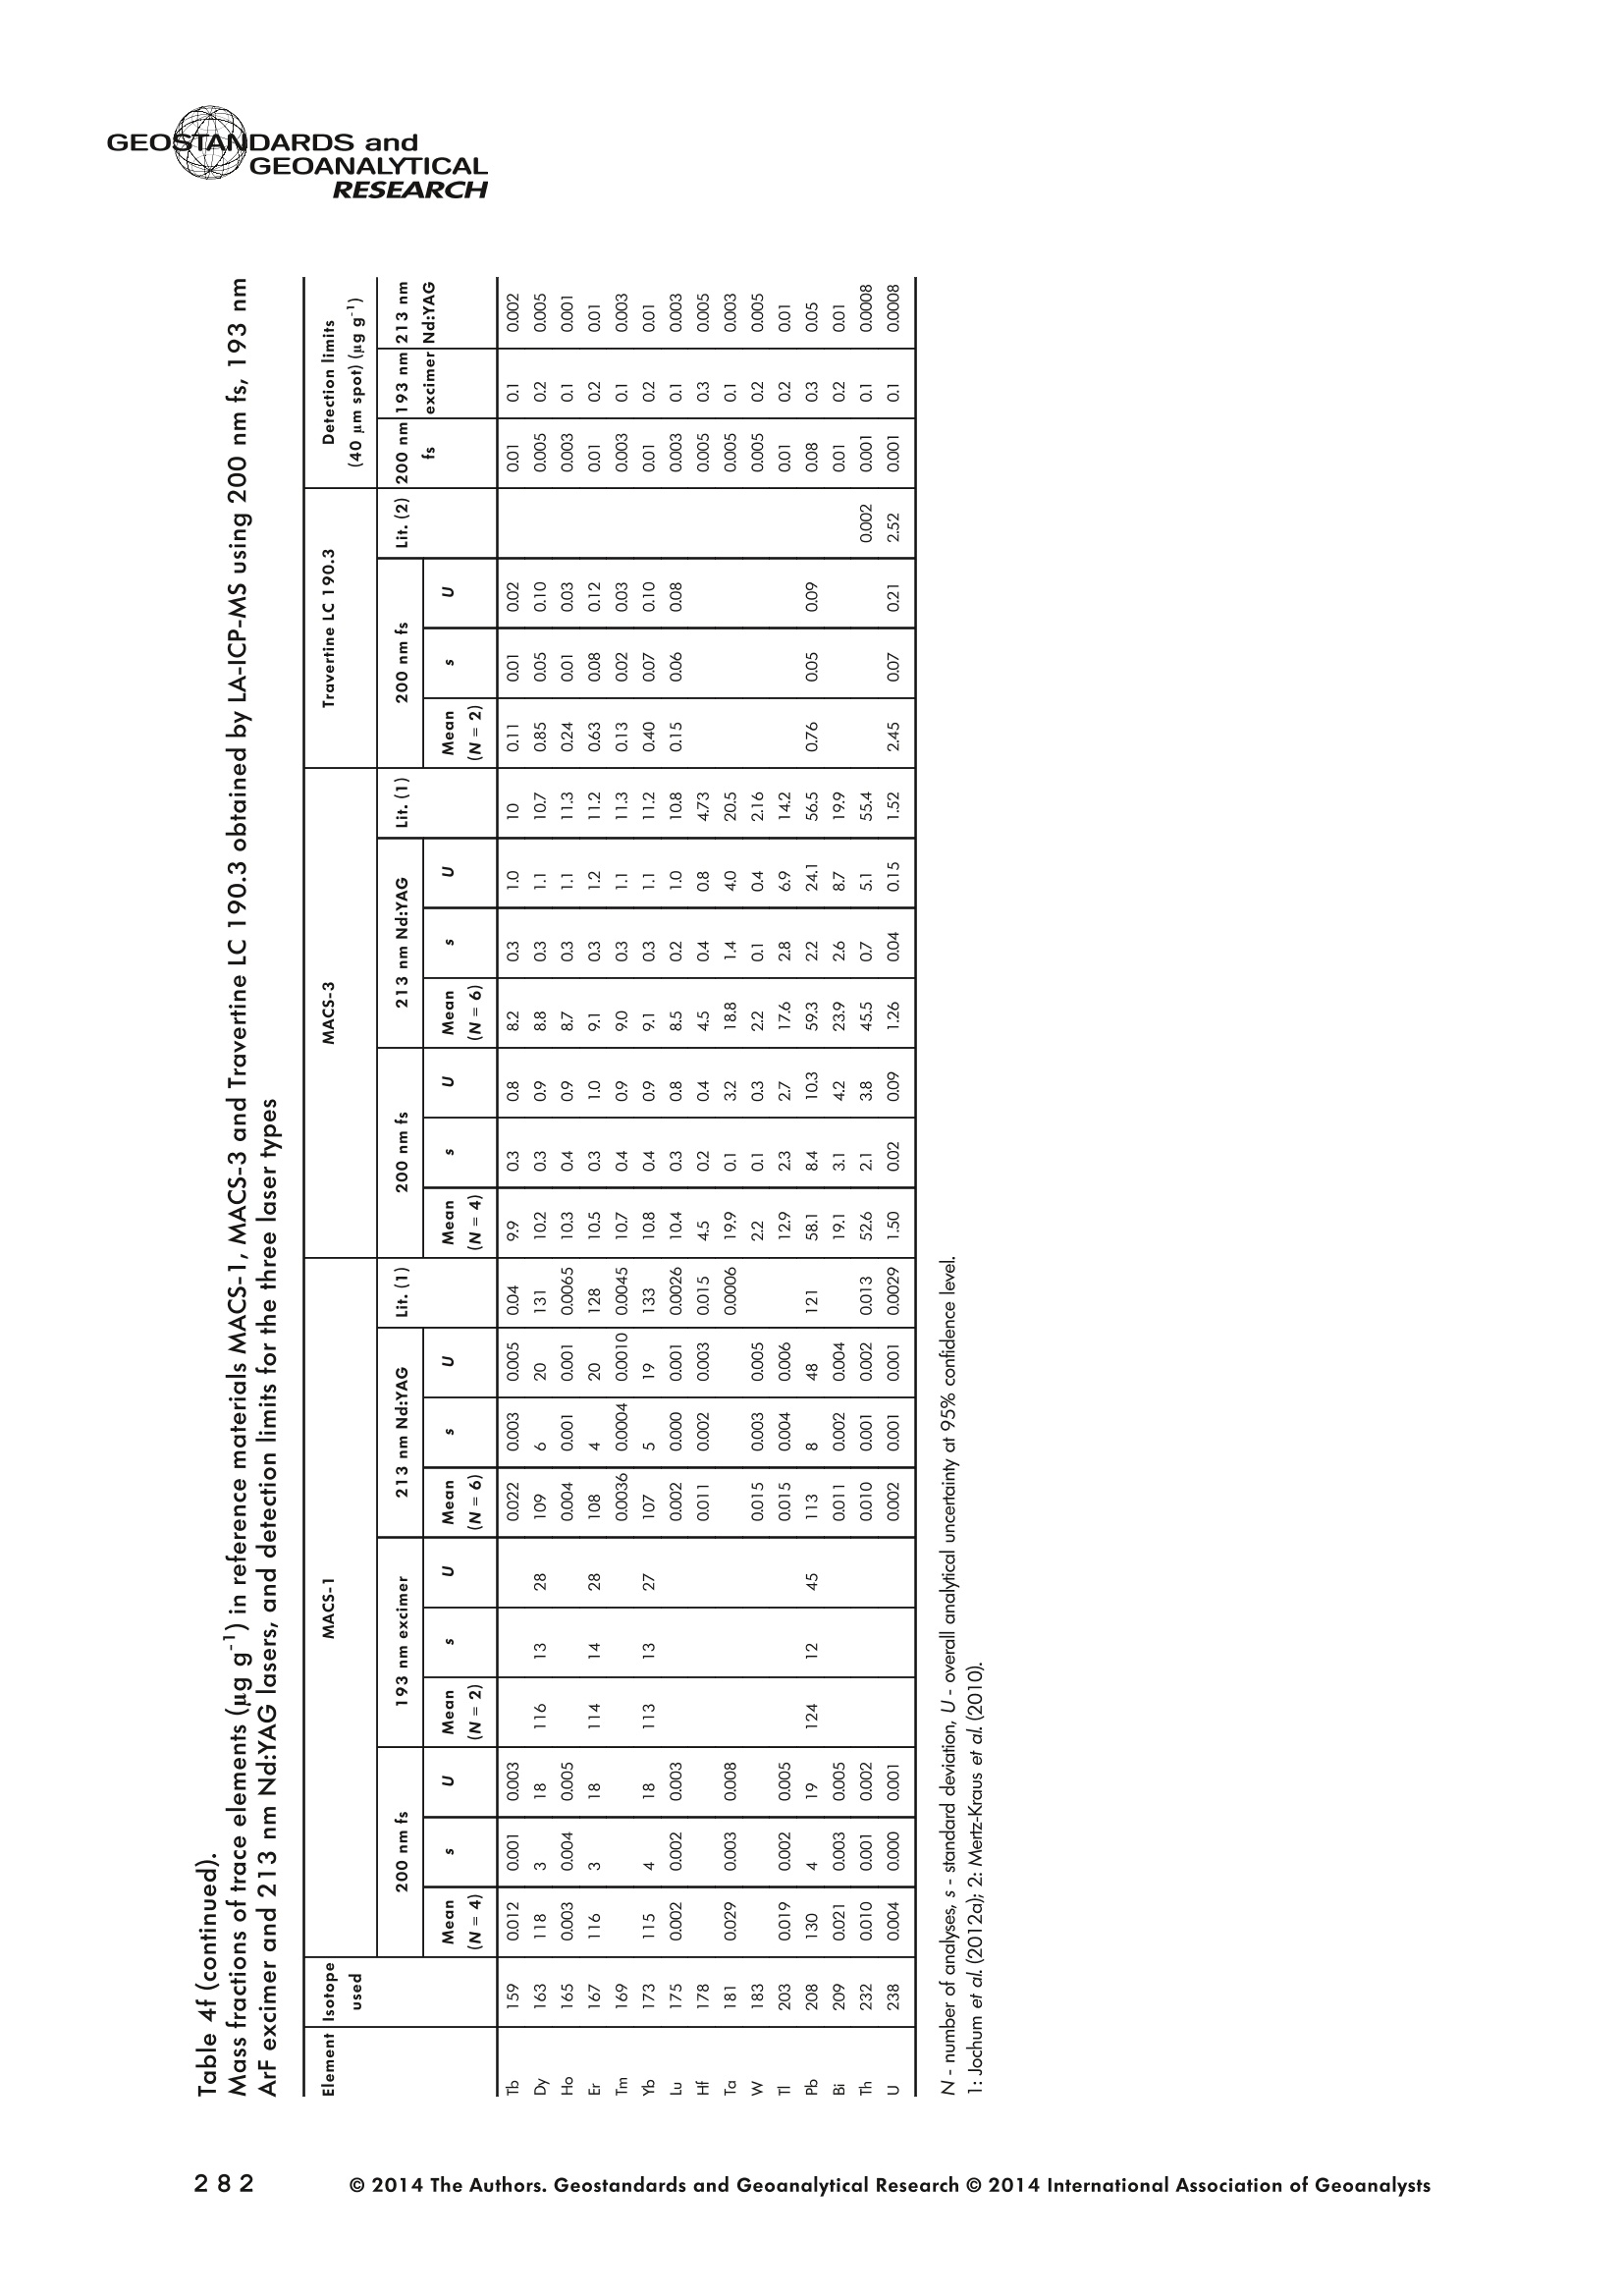
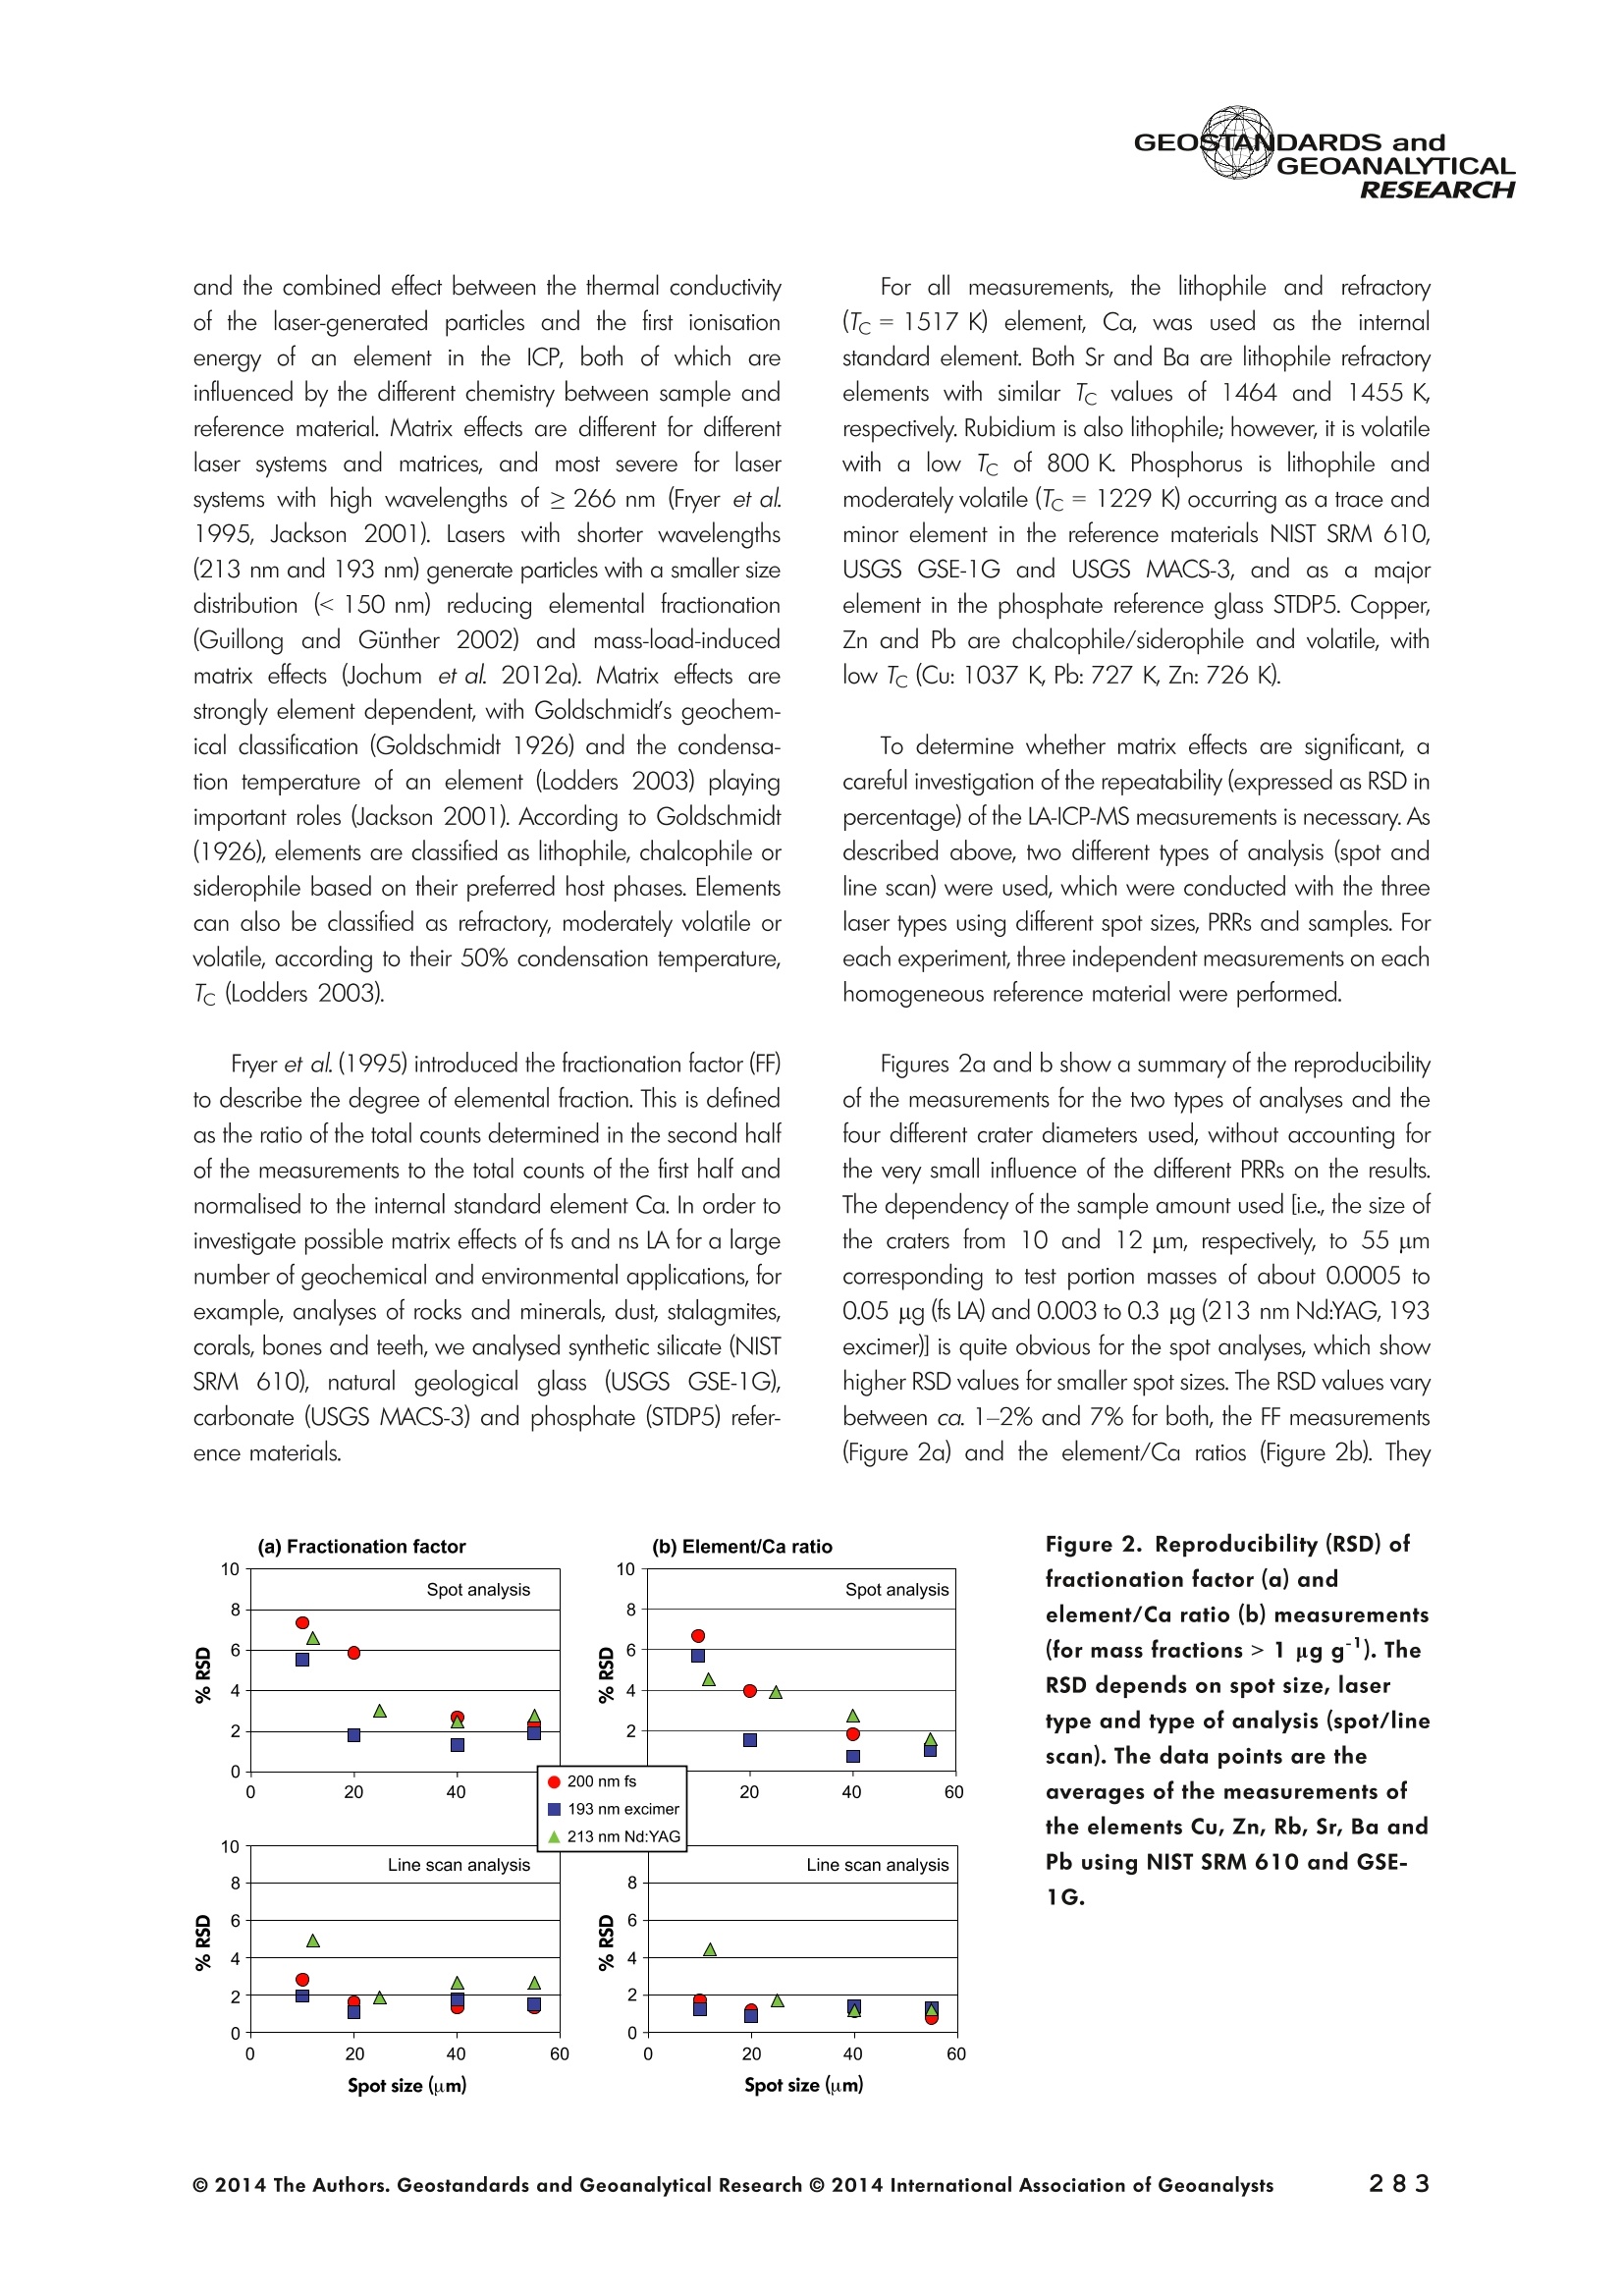
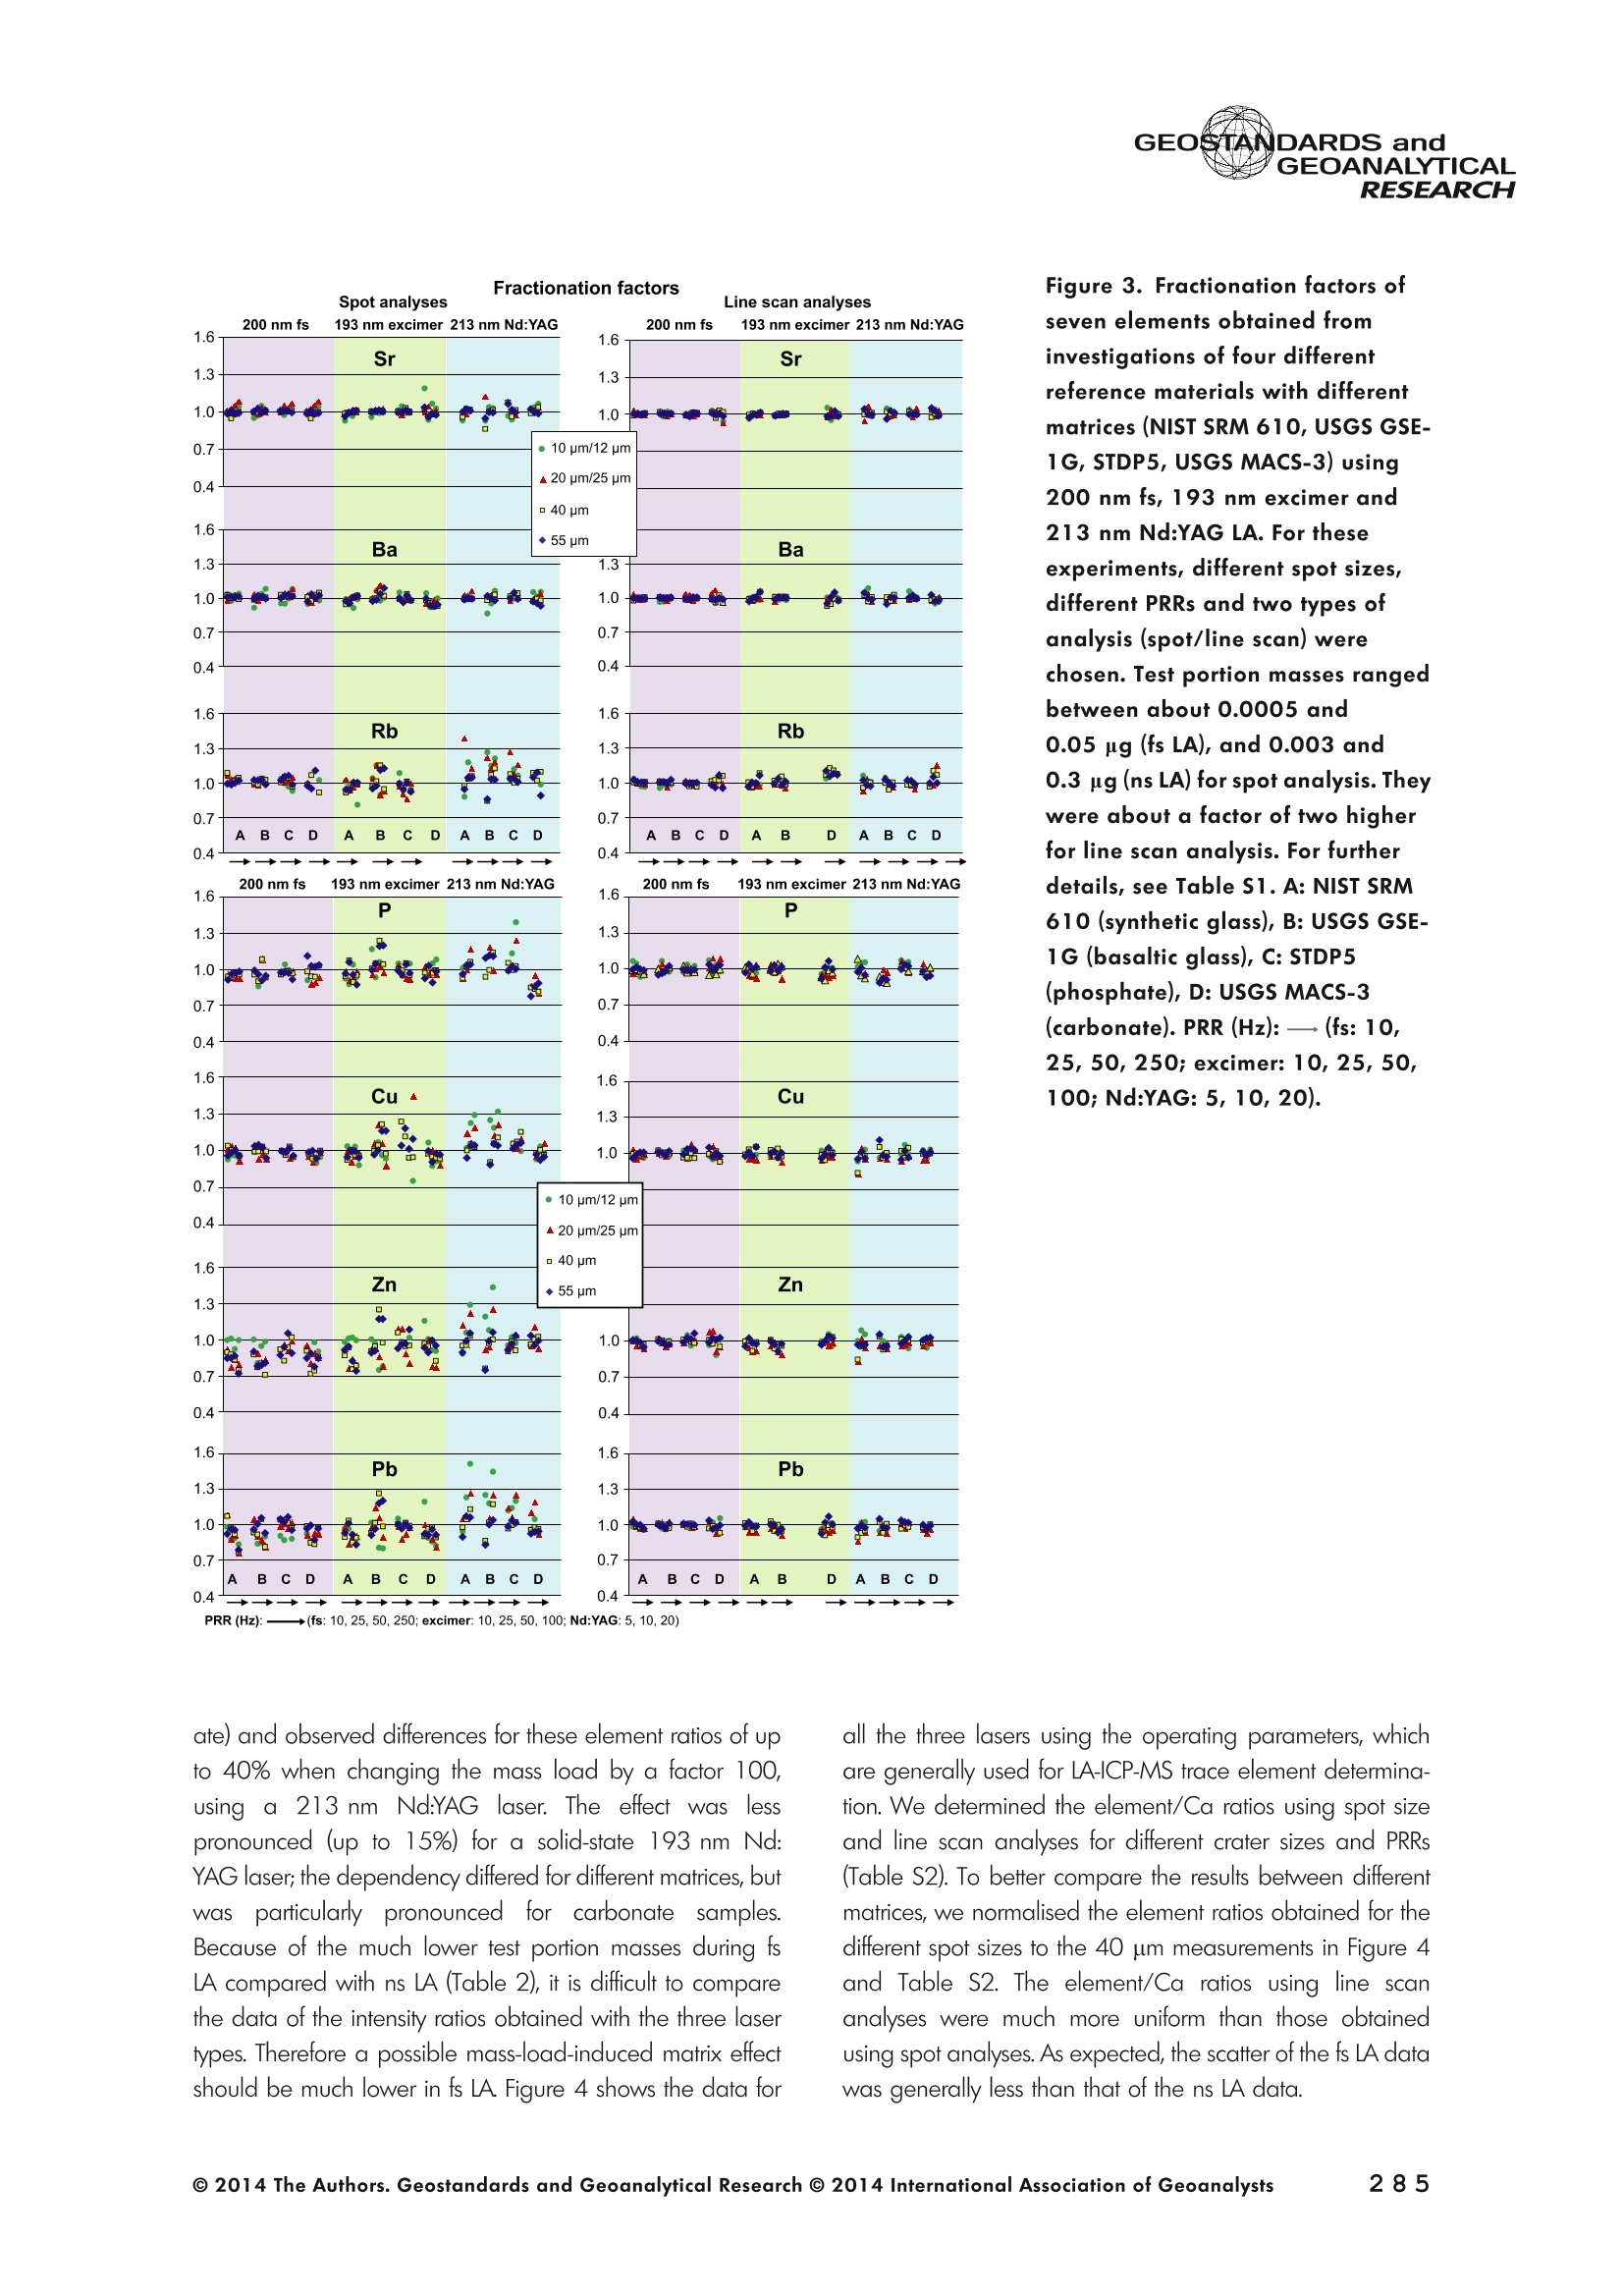
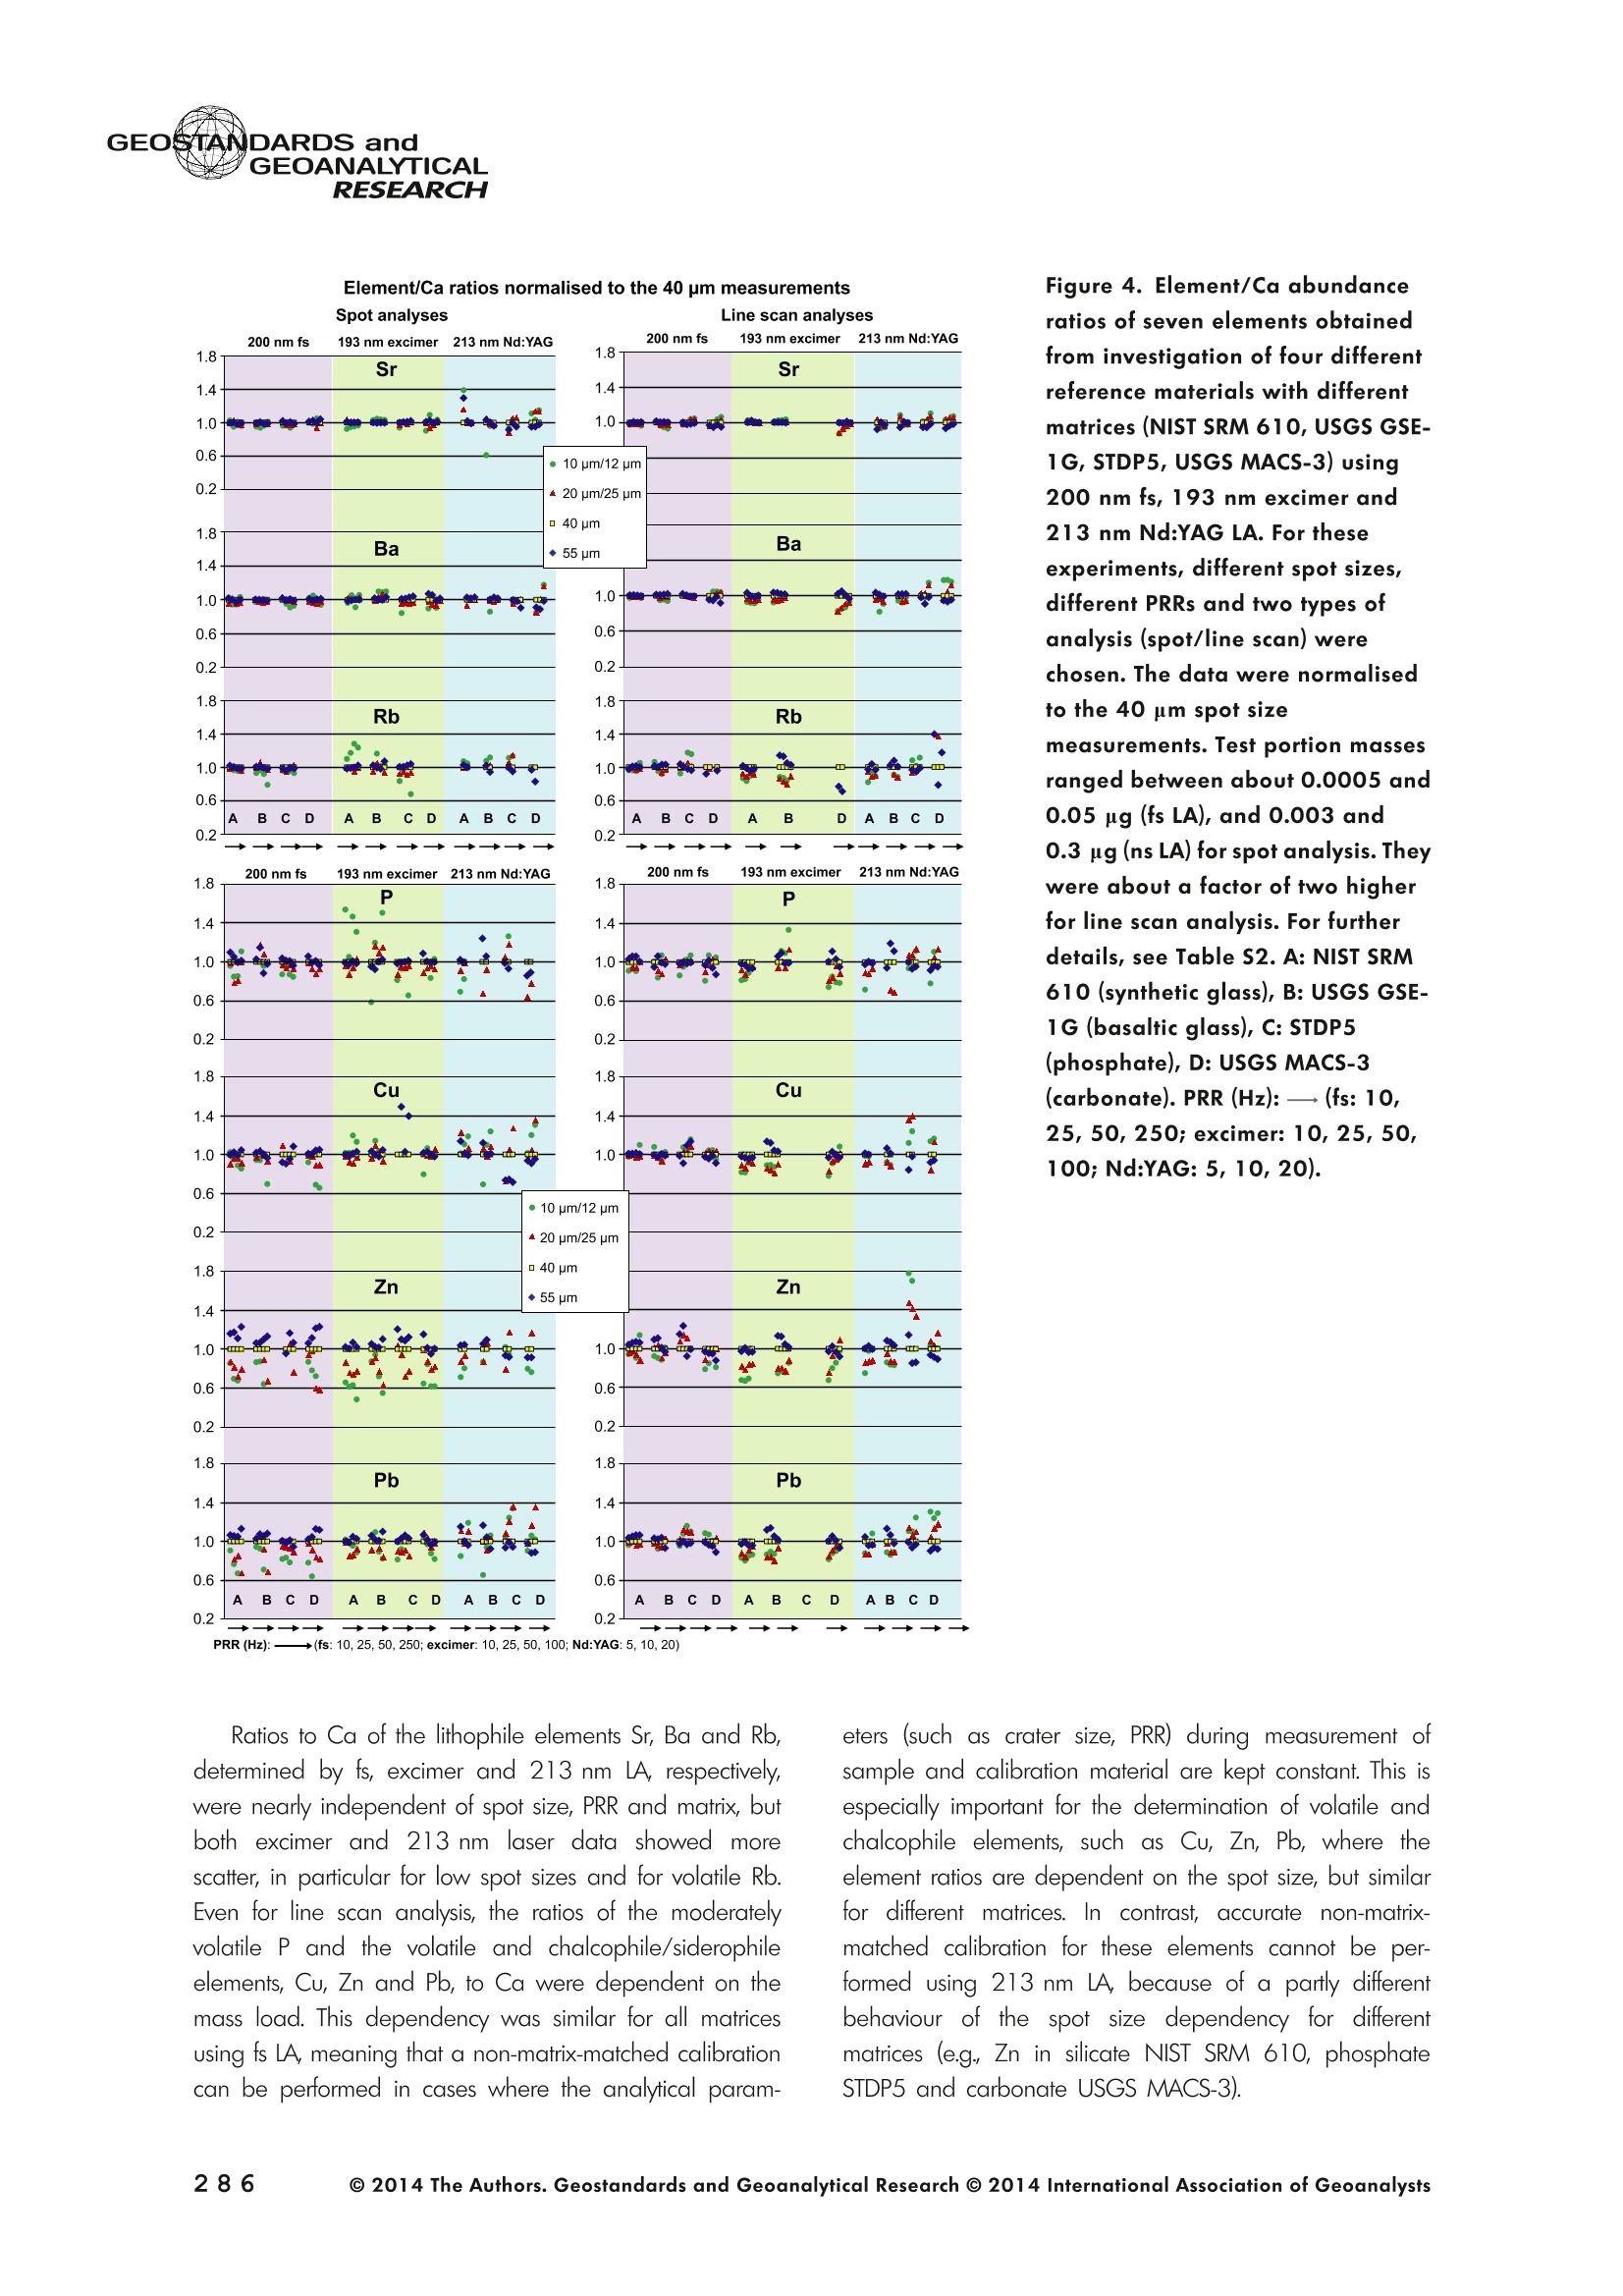
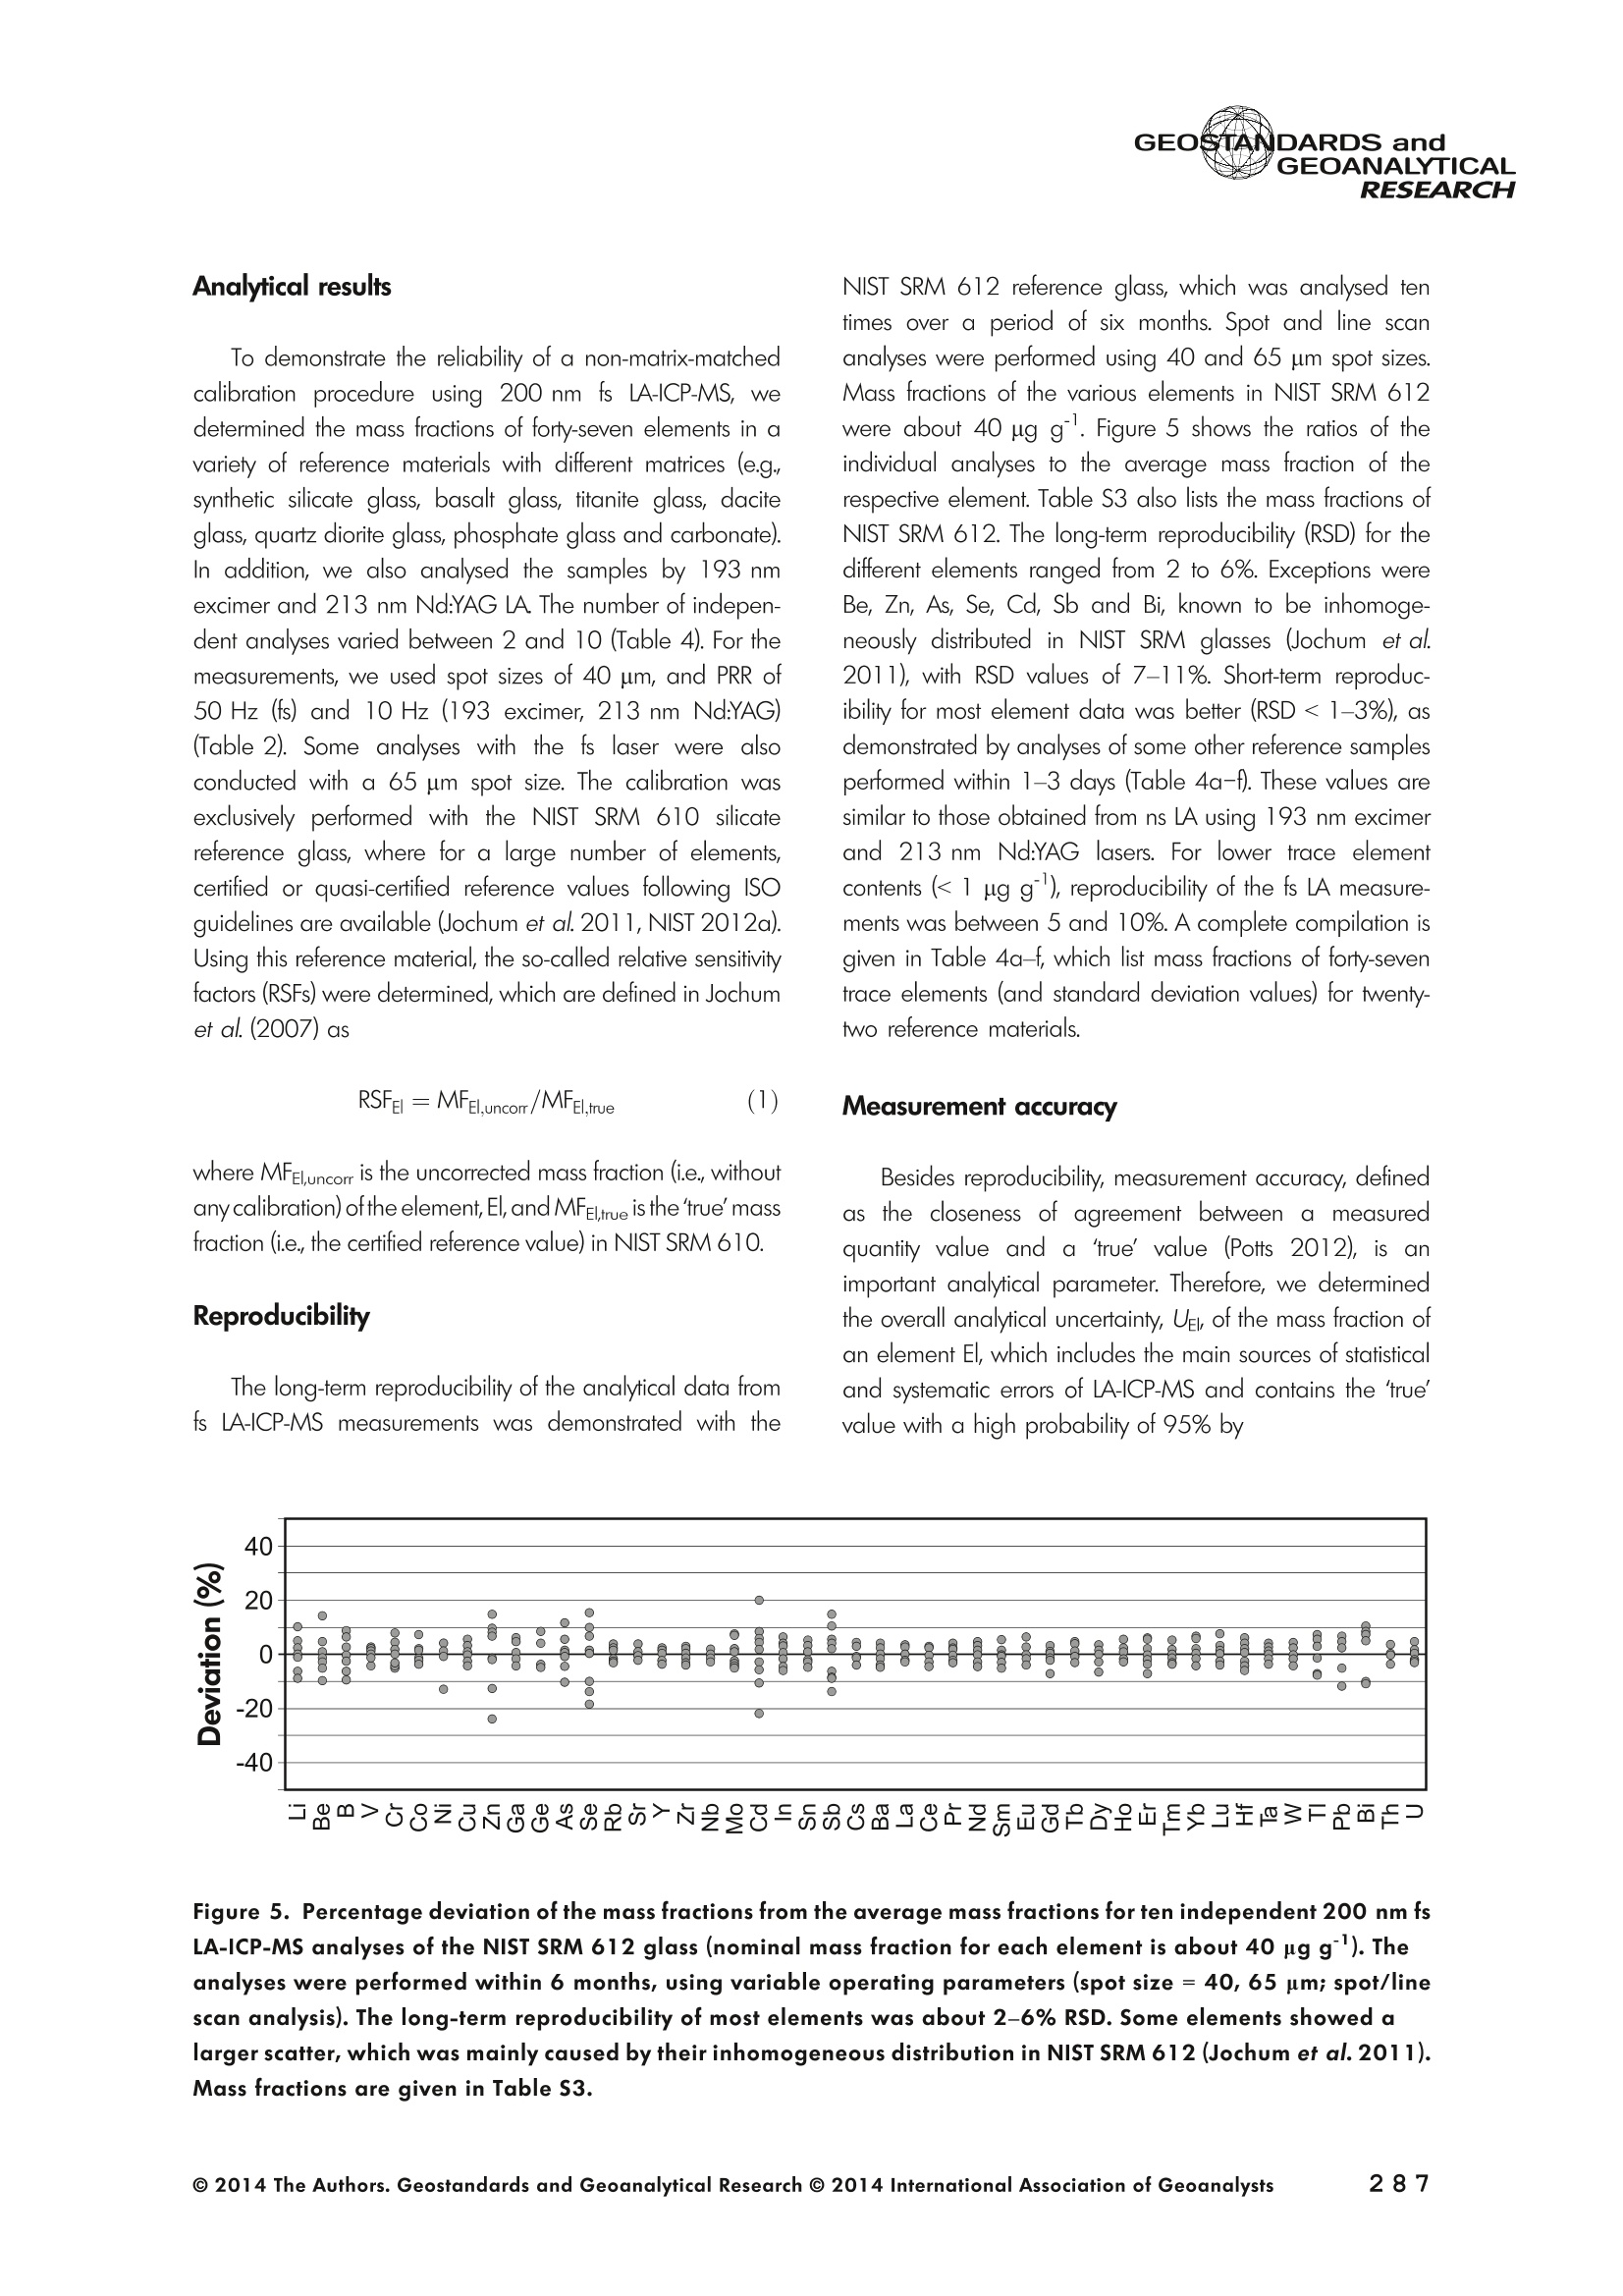
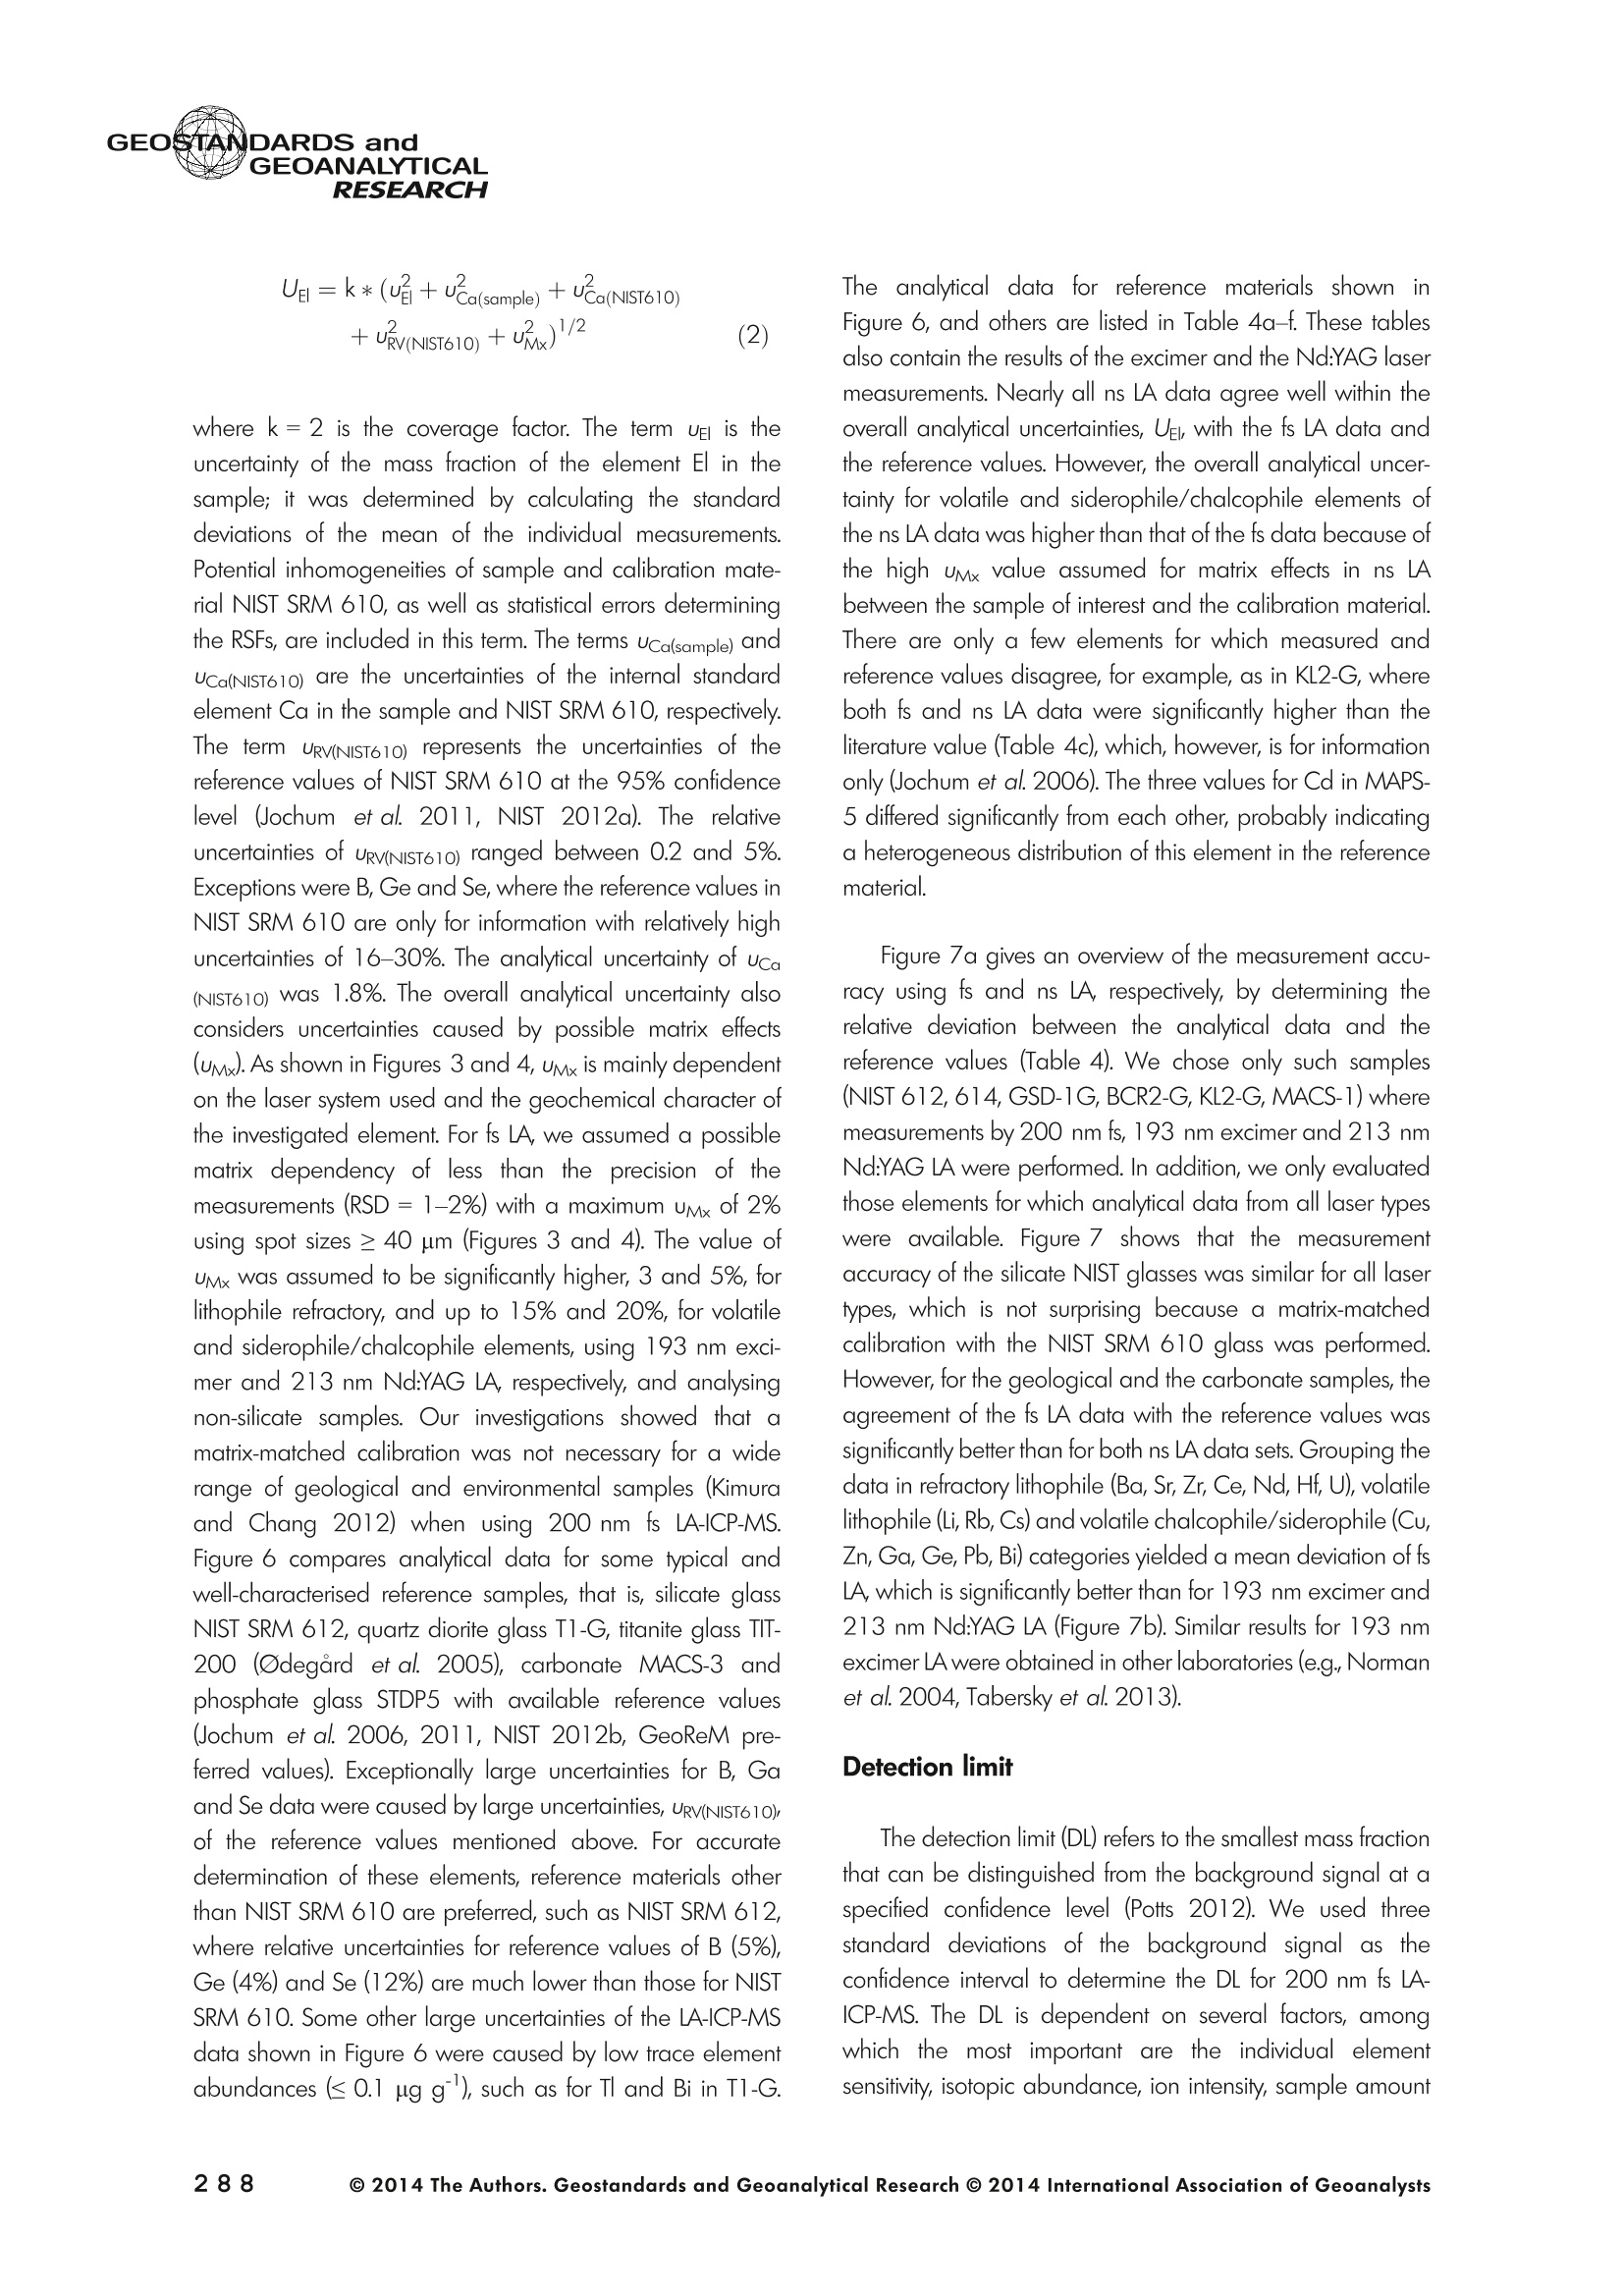
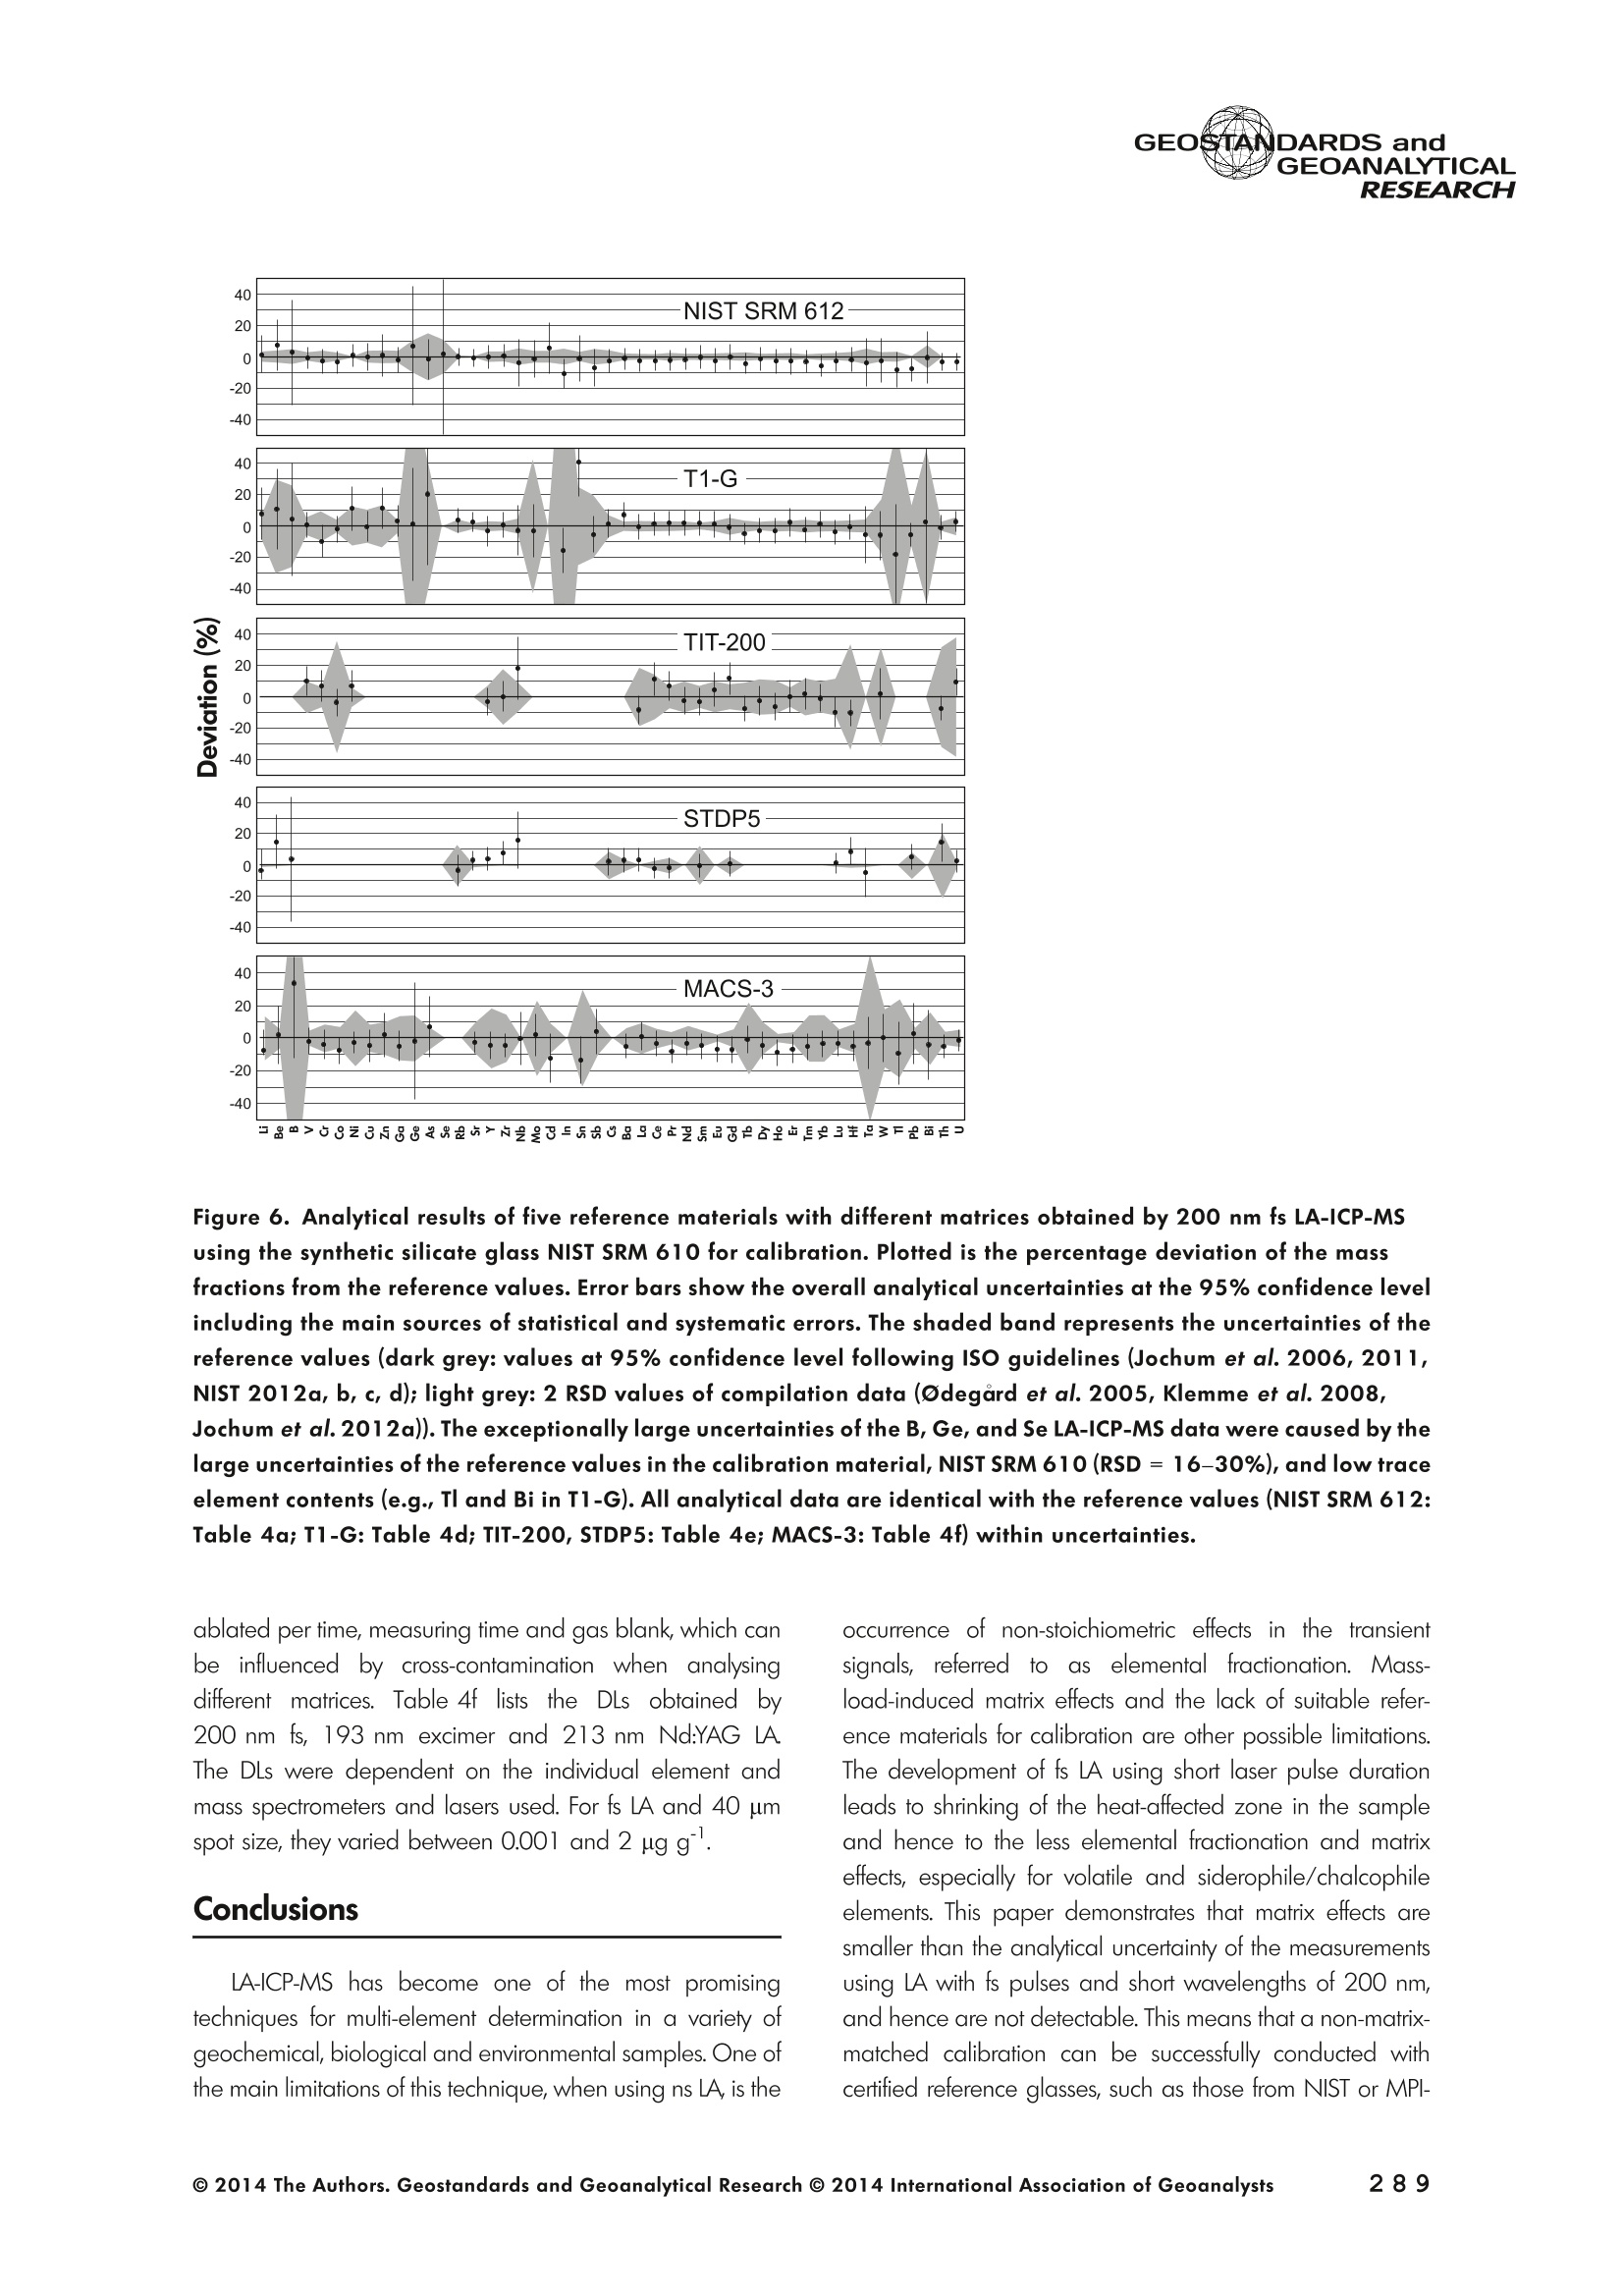
GEOSTANDARDS andGEOANALYTICALRESEARCHP.265-292Vol. 38 - N°3 SNgeonSandicAlRESEARCH Non-Matrix-Matched Calibration for the Multi-ElementAnalysis of Geological and Environmental SamplesUsing 200 nm FemtosecondLA-ICP-MS: A Comparisonwith Nanosecond Lasers Klaus Peter Jochum (1)*, Brigitte Stoll (1), Ulrike Weis (1), Dorrit E. Jacob (2, 3), Regina Mertz-Kraus(2) and Meinrat O. Andreae (1) (1) Biogeochemistry Department, Max Planck Institute for Chemistry, P.O. Box 3060, 55020, Mainz, Germany (2) Institute for Geosciences, Johannes Gutenberg University, 55099, Mainz, Germany (3) Department of Earth and Planetary Sciences, Macquarie University, North Ryde, 2109, Australia *Corresponding author. e-mail: k.jochum@mpic.de LA-ICP-MS is one of the most promising techniques forin situ analysis of geological and environmental samples.However, there are some limitations with respect tomeasurement accuracy, in particular for volatile andsiderophile/chalcophile elements, when usingnon-matrix-matched calibration. We therefore investi-aated matrix-related effects with a new 200 nmfemtosecond (fs) laser ablation system (NWRFemto200)using reference materials with different matrices and spotsizes from 10 to 55 m. We also performed similarexperiments with two nanosecond (ns) lasers, a 193 nmexcimer (ESI NWR 193) and a 213 nm Nd:YAG (NWRUP-213) laser. The ion intensity of the 200 nm fs laserablation was much lower than that of the 213 nm Nd:YAG laser, because the ablation rate was a factor ofabout 30 lower. Our experiments did not show significantmatrix dependency with the 200 nm fs laser. Therefore, anon-matrix-matched calibration for the multi-elementanalysis of quite different matrices could be performed.This is demonstrated with analytical results from twenty-twointemational synthetic silicate glass, geological glass,mineral, phosphate and carbonate reference materials.Calibration was performed with the certified NIST SRM610 glass, exclusively. Within overall analytical uncer-tainties, the 200 nm fs LA-ICP-MS data agreed withavailable reference values. Keywords: femtosecond laser, reference material, LA-ICP-MS,laser ablation. La technique LA-ICP-MS est une des techniques les plusprometteuses pour l'analyse in situ d'echantillons geolog-iques et environnementaux. Cependant, il existe certaineslimitations en ce qui conceme Vexactitude des mesures, enparticulier pour les elements volatils, siderophiles et chal-cophiles, lors de Yutilisation de calibrations sans correspon-dance de matrice.Nous avons donc etudie les effets lies à lamatrice avec un nouveau systeme d'ablation laser fem-toseconde (fs) 200 nm (NWRFemto200) en utilisant desmateriaux de reference avec differentes matrices et destailles de spot variant de 10 à 55 um.Nous avonsegalement effectué des experiences similaires avec deuxlasers nanosecondes (ns), un laser excimer 193 nm (ESINWR 193) et un laser 213 nm Nd:YAG (NWR UP-213).L'intensite ionique de Iablation laser fs 200 nm est beau-coup plus faible que celle du laser 213 nm Nd: YAG, parceque le taux d'ablation est inferieurd'un facteurd'environ 30.Nos expériences ne montrent pas une importante depen-dance de la matrice avecle laserfs 200nm. Parconsequent,une calibration sans correspondance de matrice pourlanalyse multi-elementaire de matrices tres differentes peutetre envisagee. Ceciest demontre par les resultats danalysede vingt-deux materiaux de reference intemationaux detype verres de silicate synthetique, verres geologiques,mineraux, phosphates et carbonates. L'etalonnage a eterealise exclusivement avec le verre certifie NIST SRM 610. Entenant compte de Iensemble des incertitudes analytiques,les donnees LA-ICP-MS fs 200 nm sont en accord avec lesvaleurs de reference disponibles. Mots-cles : laser femtoseconde, materiaux de reference, LA-ICP-MS, ablation laser The most commonly used microanalytical method for theinvestigation of trace elements in solid geochemical andenvironmental samples is laser ablation inductively coupledplasma mass spectrometry (LA-ICP-MS), which combines theadvantages of low detection limits (in the ng grange) withhigh spatial resolution (1-100 um) (Sylvester 2008). Arange of different ICP-MS types, such as quadrupole orsector-field ICP-MS, and various LA systems are used for suchpurposes. However, there are some limitations to thistechnique, mainly with respect to analytical repeatabilityand measurement accuracy, which may be affected bymatrix effects. These effects are mainly elemental fraction-ation (Fryer et al. 1995), that is, the time-dependent increaseor decrease of intensity ratios of an element to the internalstandard element (e.g., Ca), and the so-called mass-load-induced matrix effects (Kroslakova and Gunther 2007,Jochum et al. 2012a), that is, the dependency of element/Ca ratios on mass load and matrix. The matrix-related effectscan originate during laser ablation, aerosol transport orvaporisation, atomisation and ionisation within the ICP(Kroslakova and Gunther 2007). Three different types oflaser-induced fractionation have been described (Fernandezet al.2007, Horn and von Blanckenburg 2007): 1 Fractionation through preferential evaporation ofvolatile elements due to a thermal mechanismcontrolling removal from the sample. This type offractionation mainly affects chalcophile/siderophilevolatile elements, such as Zn or Pb. 2 Particle-size-related elemental fractionation, which isstrongly dependent on the wavelength of the lasersand the ablation conditions used (Guillong andGunther 2002). 3 Laser-induced isotopic fractionation. Jackson andGunther (2003) investigated Cu isotopes and sug-gested that the isotopic fractionation is probably due topreferential volatilisation of the light Cu isotope at theablation site. Hom and von Blanckenburg (2007)proposed a model that is based on the preferentialrelease of the light isotope due to kinetic fractionation.Compared with the other types, the isotopic fraction-ation is small and introduces effects in the per mil range. Reducing the wavelength of the laser from infrared toultraviolet led to the generation of smaller and more uniformaerosol particles, which improves the analytical results withrespect to reproducibility and measurement accuracy (Kuhnand Gunther 2004). For this reason, Nd:YAG lasers withshort wavelengths of 213 and 193 nm, and ArF excimerlasers operating at 193 nm wavelength are currently usedto obtain precise and accurate data. However, these lasershave pulse durations between about 3 and 15 ns, therefore matrix-related problems still remain, especially for volatileelements, such as Rb,Pb and Zn (Jochum et al.2012a). Thereason for this is that heat diffusion in the sample producesmelting effects (Glaus et al. 2010). These can only berestrained when the laser pulse duration is shorter than thethermal relaxation time of a few hundred femtoseconds(Koch and Gunther 2007). A matrix-matched calibration istherefore needed for accurate analysis of volatile elements(Jochum et al. 2012a). Unfortunately, for many matrices,such as for carbonates, phosphates and minerals, nosuitable reference materials exist. In addition, there are onlyfew reference materials where reference values and theiruncertainties at the 95%confidence level comply with theISO guidelines for certification. Currently, these comprise onlythe synthetic silicate NIST reference glasses (Jochum et al.2011, NIST 2012a, b, c, d),the geological MPI-DING glasses(Jochum et al. 2006) and the new geological CGSG glasses(Hu et al. 2011), with the latter now undergoing certificationtesting (X. Zhan, pers. comm.). However, when using thesecertified reference materials, a matrix-matched calibration isonly possible for rock samples, silicate minerals, glasses andbiogenic silicates, such as glass sponges. As shown by several publications, the advent of fs lasers(Poitrasson et al. 2003, Fernandez et al. 2007,Kimura andChang 2012, Shaheen et al. 2012) has helped to avoidsample heating and enabled ablation in a more controlledway (Koch and Gunther 2007, Vanhaecke et al. 2010).Glaus et al. (2010) investigated the morphology of aerosolsfrom ns LAand fs LA using different matrices and laserfluencies.They observed different ablation and particle formationmechanisms for both laser types, but similar morphologiesfor all analysed matrices using fs LA. Different kinds offs lasershave been used for elemental analysis, distinguished mainlyby wavelength (196-1030 nm), pulse repetition rate (PRR)(5-1000 Hz) and output energy (0.001-12 mJ) (Ferandezet al.2007). Elemental and isotopic fractionation effects areminimised in fs LA-ICP-MS and therefore matrix-matchingcalibration materials appear to be less important (Poitrassonet al. 2003, Vanhaecke et al. 2010). There are only a few publications on fs LA-ICP-MS multi-element analyses of geochemical and environmental sam-ples, in particular using 200 nm laser sources. Most studiesdeal with the fractionation behaviour and the analysis of fewelements (e.g., Gonzalez et al. 2008) in conducting or semi-conducting samples (e.g., brass; Koch et al.2005, Garciaet al. 2008), which are not appropriate in most fields offundamental geochemical research. To study how importantmatrix efects are for 200 nm fs LA-ICP-MS in geochemistryand environmental research, we systematically investigatedelementalfractionationandmass-load-induceddmatrix effects by changing spot sizes from 10 to 55 um and PRRsfrom 10 to 250 Hz in four different types of matrices(synthetic silicate, geological, carbonate and phosphate).The use of small spot sizes is essential for many microan-alytical applications, such as analyses of melt inclusions, dustaerosols and minerals, as well as the determination of high-resolution climate records. For comparison, we conductedsimilar experiments with two commonly used ns lasers(213 nm Nd:YAG, 193 nm Arf excimer). Furthermore, wedetermined the mass fractions of forty-seven trace elementsin twenty-two reference materials using the three laser typesand compared the results of these analyses with publishedvalues (GeoReM database, http://georem.mpch-mainz.gwdg.de, Jochum et al. 2005, Jochum and Nohl 2008). Material and analytical techniques Samples For this study, we used twenty-three international micro-analytical reference materials, which have the advantagethat they are well characterised and that potential inhomo- geneity has been previously investigated (Table 1). Theseare more than 50% of the currently available microanalyticalreterence samples, of which 80% are glasses, mainlybecause of homogeneity reasons (Jochum and Enzweiler2014). The following four samples were analysed in detail tostudy possible matrix-related effects. NIST SRM 610: This is a synthetic silicate reference glassfrom theNational Institute ofStandards and Technology(NIST),mostly used as a calibration material in LA-ICP-MS. Thisreference material has been shown to behomogeneousfortheeight elements investigated using test portion masses (definedasthe amount oftest sample taken foranalysis) ≥ 0.02 ug (Zn:≥1ug)and avoiding the rim regions ofthe glass wafers, whichare known to be inhomogeneous (Jochum et al. 2011).Certified reference values and ‘quasi-certified’referencevalues following ISO guidelines are available for many traceelements (Jochum et al.2011, NIST 2012a). GSE-1G: This is a synthetic glass prepared by theUnited States Geological Survey (USGS) with a basalticmajor element composition. Microanalytical investigations Table 1. Samples (CRM: certified reference material, RM: reference material, QCM: quality control material)investigated in this study Sample Provider Category Matrix Material type Source of reference values SRM 610 NIST CRM° Synthetic silicate (1) Glass Jochum et al. (2011), NIST (2012a) SRM 612 NIST CRM Synthetic silicate (1) Glass Jochum et al. (2011), NIST (2012b) SRM 614 NIST CRM Synthetic silicate (1) Glass Jochum et al.(2011), NIST (2012c) SRM 616 NIST CRM Synthetic silicate (1) Glass Jochum et al.(2011), NIST (2012d) BAM-S-005B BAM CRM Synthetic silicate (1) Glass Yang et al.(2012) GSD-1G USGS RM Synthetic basalt (2) Glass Jochum et al. (2005) GSE-1G USGS RM Synthetic basalt (2) Glass Jochum et al.(2005) BCR-2G USGS RM Natural basalt (2) Glass Jochum and Nohl (2008) MACS-1 USGS RM Synthetic carbonate (3) Pressed powder Jochum et al. (2012a) MACS-3 USGS RM Synthetic carbonate (3) Pressed powder Jochum et al. (2012a) MAPS-4 USGS RM Synthetic phosphate (4) Pressed powder Jochum et al. (2012b) MAPS-5 USGS RM Synthetic phosphate (4) Pressed powder Jochum et al. (2012b) KL2-G MPI-DING CRM Natural basalt(2) Glass Jochum et al.(2006) T1-G MPI-DING CRM Natural quartz diorite (2) Glass Jochum et al.(2006) ATHO-G MPI-DING CRM Natural rhyolite (2) Glass Jochum et al. (2006) CGSG-2 NRCG CRM Natural syenite (2) Glass Hu et al. (2011), Jochum and Enzweiler (2014) CGSG-4 NRCG CRM Natural soil (2) Glass Hu et al. (2011), Jochum and Enzweiler (2014) TIT-200 NGU RM Synthetic titanite (2) Glass Odegard et al.(2005) DAC666 UM RM Synthetic dacite (2) Glass Klemme et al. (2008) DAC777 UM RM Synthetic dacite (2) Glass Klemme et al.(2008) CPX777 UM RM Synthetic clinopyroxene (2) Glass Klemme et al.(2008) STDP5 UM RM Synthetic phosphate (4) Glass Klemme et al.(2008) Travertine LC 190.3 BGC QCM Natural travertine (3) Rock Mertz-Kraus et al. (2010) NIST: National Institute of Standards and Technology, USA; BAM: The Federal Institute for Materials Research and Testing, Germany; USGS: United StatesGeological Survey, USA; MPI-DING: Max Planck Institute for Chemistry, Germany; NRCG: National Research Center for Geoanalysis, China; NGU: GeologicalSurvey of Norway, Norway; UM: University of Munster, Germany; BGC: Berkeley Geochronology Center, USA. (1): silicate matrix; (2): geological matrix; (3): carbonate matrix; (4): phosphate matrix. demonstrate that the glass is homogeneous at the jim to mmscale for most trace elements (Jochum et al. 2005). Refer-ence values are available as GeoReM preferred values inthe GeoReM database (Jochum et al. 2005). MACS-3: This material is a synthetic calcium carbonatepowder available from the USGS as a pressed pellet to beused as microanalytical reference material. A compilation ofpreliminary reference values for MACS-3 has been recentlypublished by Jochum et al. (2012a). STDP5: This is a synthetic phosphate glass, which wasprepared and preliminarily characterised by Klemme et al.(2008) as reference material for in situ microanalysis. Thisglass is homogeneous in major and trace elements down tothe micrometre scale, and has high mass fractions of manytrace elements. Recommended reference values for Sr, Ba,Rb and Pb are about 1400 ug g(Klemme et al.2008). In addition to the reference materials described aboveand used to investigate elemental fractionation and mass-load-induced matrix effects, we also performed multi-element analyses on these materials and eighteen addi-tional materials of different compositions to demonstrate anddiscuss the performance of LA-ICP-MS using the differentlaser systems. Table 1 lists the important characteristics ofthese samples. For these materials, reference values formajor and trace elements have been published and arealso listed in the GeoReM database. Laser ablation systems (1) The NWRFemto200 (Electro Scientific Industries,New Wave Research Division, Portland, USA) LA systemwas utilised for the experimental fs LA-ICP-MS work at Max Planck Institute for Chemistry (MPIC). This LA systememployed a high energy, Ti-Sapphire-based, ultra-fastamplifier delivering laser pulses shorter than 150 fs. Theamplifier produced a laser output wavelength of < 200 nmvia high-efficiency harmonic generation of the fundamentalwavelength. It was fully integrated into a purged beamdelivery system designed to minimise the detrimental effectof pulse stretching. The laser beam was introduced into ahigh-performance, New Wave Large Format cell, a two-volume ablation cell capable of generating washout times<1s and accommodating multiple samples and referencematerials. The important features of the system are listed irTable 2. Ablation occurred in a He atmosphere. To test foroptimum measuring conditions with respect to spot size,crater shape and ion intensity, we carried out experiments bychanging the position of the laser focus point relative to thesurface. Best results were achieved at a distance of about300 um above the sample surface. Spot sizes and PRRs used for the investigation of matrixeffects were 10, 20, 40 and 55 um, and 10, 25, 50 and250 Hz, respectively. The fluence varied between about 0.5and 0.8 J cmfor the different measurement conditions. Formulti-element determinations, we used spot sizes of 40 and65 um, and a PRR of 50 Hz. Our investigations showed that for fs LA, line scananalysis is much more appropriate than spot analysis. Incontrast to the ns lasers, the 200 nm fs laser spot analysiswas characterised by low crater depths of several microme-tres and a strong decrease in ion intensities with depth(Figure 1a), presumably caused by the relatively low fluence(Table 2) and the generation of colour centres by fs laserpulses (Avanesyan et al. 2004). In contrast, line scananalyses yielded uniform and relatively high ion intensities Table 2. Typical operating parameters of the laser ablation systems used for analysis Operating parameters NWRFemto200 UP213 NWR193 Wavelength (nm) 200 213 193 Pulse length (ns) <0.00015 5 4 Laser energy (mJ) at sample surface 0.01 0.19 0.07 Fluence (J cm²) at sample surface 0.8 15 5 Laser spot size (um) 40 40 40 Laser line length (um) 225 225 225 Scan speed (um s) 5 5 5 Pulse repetition rate (Hz) 50 10 10 Ablation rate (um per laser pulse) 0.003 0.1 0.1 Test portion mass (ug) spot/line scan 0.02/0.05 0.1/ 0.2 0.1/0.2 Warm-up(s) 9 11 10 Dwell time (s) 45 45 45 Washout 30 30 17 Figure 1. Ion intensity of 137Ba (cps) measured with a sector-field ICP-MS using 200 nm fs and 213 nm Nd:YAG LA,respectively, and quadrupole ICP-MS using 193 nm excimer LA in the NIST SRM 610 glass (Ba= 452 ugg)versusablation time (s) for spot and line scan analyses. Spot size (40 um) and PRR (10 Hz) were the same for allexperiments. The lower intensity of the 193 nm excimer LA compared with the 213 nm Nd:YAG LA was due thelower sensitivity of the quadrupole instrument. Because the ablation rate was a factor of about 30 lower, the countrate of the 200 nm fs LA was much lower than that of the 213 nm Nd:YAG LA, although the same ICP-MS was used.Note the large intensity decrease of fs LA during spot analysis. (Figure 1b). The ablation rate was about 0.003 um perlaser pulse, which corresponds to 0.02 ug material ablatedfor one spot analysis (Table 2) using 50 Hz repetition rate,30 s measuring time and a spot size of 40 um. The testportion mass was about a factor of two higher for line scananalysis. (2) The UP-213 LA system by ESl New Wave used atMPIC (Jochum et al. 2007) was built around a high-performance Nd:YAG solid-state lamp-pumped laser pro-ducing a fundamental wavelength of 1064 nm. It used afrequency quintupled (5th harmonic) output (213 nm wave-length) with a pulse length of 5 ns. The UP-213 wasequipped with a New Wave Large Format Cell, andablation occurred in a He atmosphere using a fluence ofabout 15J cm2. For the investigation of the matrixdependency, analyses were performed using spot sizes of12, 25, 40 and 55 um, and PRRs of 5, 10 and 20 Hz,respectively, whereas a spot size of 40 um and a PRR of10 Hz were used for the multi-element determinations.Important analytical parameters are listed in Table 2. Foreach laser pulse, about 0.1 um material was ablated; thismeans that the test portion mass for one analysis was about0.1 and 0.2 ug for spot and line scan analyses, respectively,using the operating parameters for multi-element determi-nation. (3) At the Institute for Geosciences, Johannes Guten-berg University Mainz (UMz), the ESI NWR193 ArFexcimer-based LA system with a short pulse width (≤ 4 ns) was used. The output wavelength was 193 nm. The lasersystem was equipped with a New Wave Large Format Cell.Ablation was performed in a He atmosphere, and thesample aerosol was mixed with the Ar carrer gas beforeentering the torch. We applied different spot sizes (10-55 um) and PRRs (5-100 Hz) to investigate the possiblematrix effects. Depending on measurement conditions, theenergy density varied from about 4 to 12J cm?. For themulti-element determinations, a spot size of 40 pm and aPRR of 10 Hz were used, resulting in a fluence of about5 J cm. The parameters used are summarised in Table 2.The ablation rate (0.1 um per laser pulse) and test portionmass (0.1 and 0.2 ug for spot and line scan analysis,respectively) were similar to those obtained with1 Tthe213 nm Nd:YAG laser. ICP mass spectrometers Two different ICP mass spectrometers were used for thisstudy. At MPIC, we coupled the NWRFemto200 and the UP-213 LA systems with a ThermoFinnigan high-resolutionsector-field ICP-MS Element2 instrument. Therefore, possibledifferences observed between the two laser systems couldnot be attributed to the performance of the mass spectrom-eter. In contrast, the 193 nm ArF excimer laser at UMz wasconnected to an Agilent 7500ce quadrupole ICP-MS.However, analytical parameters of the LA systems, such asthe range of spot sizes and PRRs, ablation times, line lengthsand of the mass spectrometers, such as the measuring times,choice of isotopes and the evaluation technique, were chosen to obtain a maximum agreement between thedifferent set-ups. Table 3 lists the most important operating parameters, inaddition to a detailed description of the Thermo Element2sector-field mass spectrometer at MPIC previously given byJochum et al. (2007). Measurements were performed in lowmass resolution mode (M/△M=300) using a combinationof magnetic and electrical scan modes. The mass spectrom-eter was carefully tuned to give maximum stable ionintensities at low oxide formation (ThO/Th <0.5%). Foreach LA system, the optimised ICP-MS tuning parameters,such as torch position, gas flows and voltages of the lenses,were within an uncertainty (RSD) of about 2-3% indepen-dent of the different operating parameters (fs:S: s:potsize =10-55 um, PRR=10-250 Hz; 213 nm: spotsize =12-55 um,PRR=5-20 Hz). The analysisStimerequired for one pass was different for the determinationof matrix dependency and the multi-element measurements.For the former, it was 0.6 s (for eight isotopes) resulting in fifymeasurements of each isotope during one analysis (30 sablation time). For the multi-element determinations with thedetermination of ion intensities of forty-eight isotopes, theanalysis time for one pass was about 1.6 s, and the ablationtime was 45 s, so that twenty-seven repeated measurementscould be performed for one analysis. Typical operation parameters for the Agilent 7500cequadrupole ICP-MS at UMz are given in Table 3. A totalof seventy-five scans with an ablation time of 45 s and< 0.6 s per pass across the monitored masses could berecorded during an individual spot or line analysis. Thetime per pass was much less (0.1 s) for measurement ofthe eight isotopes used to determine possible matrix effects. The mass spectrometer was tuned3 to obtainmaximum count rates at low oxide formation rates oftypically <0.4%, and no significant dependence of thetune parameters on the operating parameters of the laserwas observed. The sensitivity of the Agilent 7500ce wasabout a factor of 10 lower than that of the ThermoElement2 instrument. Eight characteristic elements with different geochemicalproperties were chosen for the investigations of elementalfractionation and mass-load-induced matrix effects: themajor element Ca, which was selected as the internalstandard element, and Sr, Ba, Rb, P, Cu, Zn and Pb. Isotopeschosen were 43Ca, 31p, 63Cu(MPIC),65Cu(UMz),66Zn, 85Rb,88sr,137Ba and 208Pb. To obtain data with precision valuesas high as possible, we used the published (certified)reference values for Ca. The forty-eight isotopes used for themulti-element determination are given in Tables 4a-f. Twodifferent types of measurements were performed for bothmass spectrometers: spot analysis and line scan analysis, forwhich a scan speed of 5 um swas chosen. Ofline datareduction was performed identically for all data sets bycalculating the blank-corrected ion intensities of the isotopesof interest relative to 43Ca. A routine programmed in Excelrejected obvious outliers (Jochum et al.2007). Matrix effects Matrix effects comprise mainly elemental fractionation(e.g., Fryer et al. 1995, Kroslakova and Gunther 2007,Gaboardi and Humayun 2009, Jochum et al. 2012a) andmass-load-induced matrix effects (Kroslakova and Gunther2007). Kimura and Chang (2012) identified the sources ofmatrix effects to be the thermal effect at the ablation site Table 3. Typical operating parameters of the ICP mass spectrometers used for analysis 7500ce Operating parameters Element2 Rf power (W) 1200 1250 Sample/skimmer cone material Ni Ni Sample/skimmer cone orifice diameter (mm) 1/0.4 1.1/0.8 Cooling gas (Ar) flow rate (lmin) 15 16 Auxiliary gas (Ar) flow rate (I min") 1 1 Sample gas (Ar) flow rate (l min") 0.8 0.8 Carrier gas (He) flow rate (l min") 0.7 0.7 Sample time (s) 0.01 0.002(10 meas. per peak) Time per pass (s) 0.59 1.6 Mode of analysisAC/DC scan Escan, Bscan Detector modeAnalogue/counting Analogue/counting Resolution 0.65-0.75(*) 300 (+) ThO/Th (%) <0.4 <0.5 (+) resolving power R= M/AM, (*) (amu), peak width at 10% of its height. ¥86898958齐子 m3 I二98 coo 88 888888888 (N=10) 3 8 c 88 8888 ::88 2 9w3x3 56二888688=885=888688-85858-88 c 888 8888888 p3ZQ i5 浏 c 5 88 8..点 一 8888888888 8888 3 Z 8888888888 88888 : ONO 8 :888888: 88 8 一4 888888888-8 8838 8 93xn3 88988888888 83吕8 88 88:88 38 8 c 8888888888888888 司 3ZQ 888888888888888 8888 888 88 88 888888888883 8888 888 88: c w 648688 88858.558 3xn3 Zs 8 8 8 8 8 8 c 00..0888883w01249 9 3Z 0.000.08000209 0 8838 6 8 881000 9 8 c OO0OO0o 0459 O 8888 9 3 一3330一一当66'sc3、93x3 一nc aaq336、cNO39w3x3 N53Z一 m3 c i88 8 w9 03 8555 6 18 930xn3 二 8 8g 8888 26 3Z 88851888 88888688 c www o 8 .5 888 888 3 Z 888888888888888 二 88 :888888883 93xn3 888 81888 8 公 品 8868 3ZQ 88888888 8888 88888888 0O.88OOww w 9w33 Z一6 8 0044440 N3ZQ 0.800.0080070w|2 88O0 80458 'occ33o一sN'ZsTawZTCZc8 82¥子 85808958~ 89 9 8 8868:888oN三8886.9687 —coo 889g888888 8 8 200 nm fs OO5 8 8 6 - 88 8 ~ 夕 o一(WGo o8=88838 8唱66 品 8888888888 888898 w3Za :8888 吕880=8 -N88-8 88 :8885888888 4 :员8: 888 8 言: (N=4) 200nm fs 二88二865云品二 8288 8588888 c 338 s351 w3xn3 888828888 88 88 9885 c NS营点 88交 w33Z 85 8二E8856 22888 c 8888 lit.(3) 点书 (N=4) 200 nm fs m 品8 88888 88 c 专 贫 -3ZQ 品二5 58288858 品988883888 S:::合言 88g言吉: o方乏 (8)1 c(9=8八99488899) 8888688884 EOO 8888282、8 8988 o0 8 (9=N3) 8: Z 8 5 EOO 888888888688 83 (b=N) 生 OOOO MO OOOO :8 O O 8OO O OO OO 8 EOON 5 2 00 : o 38885888 合33=8 ◎ 2014 The Authors. Geostandards and Geoanalytical Research @ 2014 International Association of Geoanalysts 一U>ZZEEccxxo 89 c 9 88 4 6.8 8 88..88 3 NQ 8888 58~8888 888 8:品品5888 8888888888888688O 8.68 88 c 8 N=2)/ w3x3 888888888 858 88N8688品 88888888 品85 c 888 N3ZQ 8888988688888 88+2888二588 88888 882 c 888 3888 03 天rNQ 8 8 8 508888888 8S 4w 8E :3 w30x3 .8 8 888-6 8 08812 c 88 8588 3 8:88858~8888 8888 88 8888883=888 888322868 3 3 5 38 88. 8 88 8888888 :33/ NOO3 工O'Q 8889888888888888888885885888 888::~ 8828 w3x3 ;8828888 88888 8 8E85 88888 c GI O 88 ExE ...83.2 三: : 3 58398: : EOO 5 : oo83 : :8::.8::888 :38883 98寸O0OO ZE :::..: c3 :: ExE :... 8 : 8 : co 98:0 EOO 三 ::::::: OO 寸 OO8::8=: ZEM 5 8:::::::: : 8S ExE 5 : 8寸一 :::.::: : EOO :::::::::88 :::::::::.: 守 寸23O ooo 3 E93生93产品品5 LLZ 9< 9乙89< c 8 (N=::4) 3 88868“。8888:88- 88 88888:8 88 c 8标8 285 8 8889 (N=2) 933 988:888888=88 88 886 68 88二688 88 .5云8 器合80 c 8~88器玉 .8 8 Lit.(1) 55.688 O 去 3 888888.8~:~888 :2888~ 8 N00N +868 8 1828689858 5828 88888838 二888 Lit.(2) 吉88 8*888O (N=2) 3 888~+8888 8-8。 8 夕 888 8 888 8888 c :商品 O 658 825三 838 8S品888 (N=4) c 03 8 8 8888888 8888品 S6 88ANh :888 8888E 886 只8° N85 8 O 8588 (N=2) c 3 Lit .(3) 88 888888°8 8.888~888~8888 一 8 68 8888838 888888655888 88WA 8°8 28 HDV3S3 GI (8)11 O E 5 88 8888 88 O08 33一O OO一 99 6171 寸ln EOO 8..: 8 78 5898 28 m 86 寸 EO : 00 88 8:::::8. 寸 28 c 8.....: EcOO 5 .:8::.:: 8889 8:8.8::.2628 .:.. 598 :.85 ExE :::::::: 8:8:8: 8 : 338 E :8888:8:3 88.888 38.38 oo Eooaco乏aoEwc一>EcEwExcotEo 寸 ¥EOO : u .+28 :5.8 .8.8 8 >ZE的 5 9816823888803088 u 寸寸O 880880 EE 869522高2 .8..83.89 u 寸O EO .86===8988 282 MO86888+885寸8O6~88858 3 .883888: 60 8 寸 >ZEM 5 60 寸888N。A8888$.880=8888680 c OO 883383 ExE 83.2 98 858885866 686=2寸58888~ 9838 : c乏 O5: 888 : 88 O 889 888888888 EOO ........3 8.8~卜=8+888866.8..88888 899。八 588888888 Xa LO 8.0= - EOO N 8688928 88888:8 o u 厂 :8:: 6~88 86988 : Z乏w 88导 8:8 : 8 oo .=588888R888888=E=22 E s8>08z358848方>内艺8588982品88 s8>08z358848方>内艺8588982品88 ( 一oc33、Dpo'c3 ) 93x33a 一二 m3oto 8 8 00 8 65un 2 3 8 888 8 88 8 88 8 一 85 53838888 OO3 OO 00o 8 二 No 000 8 00 588: Lit.(2) 8 N 93xn3 8 m co8 0 8500 59 夕 3Za 899 9 3 3点8 888888 888888.8 8 53 p 93n30 888 O 9 8 45 O 26 3ZQ 8 8888 8 ON8 214 03 T口 8 8 88 T8Z sishjpupoag jo uouppossy pouoypwauitlozo yupasey |ojpupoag pup spappupsoag"sioyiny ey1tlozo 8:88998Q8= Un 688888.8-88-- 18O68 OOO 儿861 88656 8.888 : 8.: 海 8: 00 688888.8-88--88: 88 :5888 EOON ::883 68 0=8 88. 3 。:::88 吕 0)1 39 5 88 000 8=88==88 838 88 >E 8:8- O 3 's N 8吕:8:888888009 O 5 9100 OOO 0 O :..2 OON 6 889 (b=0八884=88)三3848.:0 818 8888 O 8 8 8 5 O888888::88 8 寸 O.....8..=8.8 888383 8 8 08 883888988 882 882 寸 .8 8 8.。.卜88 68. 8(7=3N ) 8.88 888888888 OOO 08.m8888880 EOO 18838 :..:O 28 8988 O寸O OO =8.8 83 o .=二 6 8 8 8 38KR卜88888 HD儿V3S3 pue sCVONVISO39 一n5c 5oano 动王。 一58 3 o0 4 000m000.O8 193xn3 c 0 16 N3Z 000000044 8 88 0 c .0004 品 in 8 NOO3 8888888888 885888 扩 3Z 588888888 28 m h1 in NOO3 9 8 00 8 8 8 088 0050 8w 口n3 一3o 上 8888 8 8 00008880 sishppupoag jo uouippossy jpuoypurajui tloz o yupasay j/jpupoeg pun spappupsoag soyiny e41tlozo oc3c and the combined effect between the thermal conductivityof the laser-generated particles and the first ionisationenergy of an element in the ICP, both of which areinfluenced by the different chemistry between sample andreference material. Matrix effects are different for differentlaser systems and matrices, and most severe for lasersystems with high wavelengths of ≥266 nm (Fryer et al.1995, Jackson 2001). Lasers with shorter wavelengths(213 nm and 193 nm) generate particles with a smaller sizedistribution (< 150 nm) reducing elemental fractionation(Guillong and Gunther 2002) and mass-load-inducedmatrix effects (Jochum et al. 2012a). Matrix effects arestrongly element dependent, with Goldschmidf's geochem-ical classification (Goldschmidt 1926) and the condensa-tion temperature of an element (Lodders 2003) playingimportant roles (Jackson 2001). According to Goldschmidt(1926), elements are classified as lithophile, chalcophile orsiderophile based on their preferred host phases. Elements1CMcan also be classified as refractory, moderately volatile orvolatile, according to their 50% condensation temperature,Tc (Lodders 2003). Fryer et al. (1995) introduced the fractionation factor (FF)to describe the degree of elemental fraction. This is definedas the ratio of the total counts determined in the second halfof the measurements to the total counts of the first half andnormalised to the internal standard element Ca. In order toinvestigate possible matrix effects of fs and ns LA for a largenumber of geochemical and environmental applications, forexample, analyses of rocks and minerals, dust, stalagmites,corals, bones and teeth, we analysed synthetic silicate (NISTSRM 610), natural geological glass (USGS GSE-1G),carbonate (USGS MACS-3) and phosphate (STDP5) refer-ence materials. For all measurements, the lithophile and refractory(Tc=1517 K) element, Ca, was used as the internalstandard element. Both Sr and Ba are lithophile refractoryelements with similar Te values of 1464 and 1455 K,respectively. Rubidium is also lithophile; however, it is volatilewith a low Tc of 800 K. Phosphorus is lithophile andmoderately volatile (Tc = 1229 K) occurring as a trace andminor element in the reference materials NIST SRM 610,USGS GSE-1G and USGS MACS-3, and as a majorelement in the phosphate reference glass STDP5. Copper,Zn and Pb are chalcophile/siderophile and volatile, withlow Tc (Cu: 1037 K, Pb: 727 K, Zn: 726 K). To determine whether matrix effects are significant, acareful investigation of the repeatability (expressed as RSD irpercentage) of the LA-ICP-MS measurements is necessary. Asdescribed above, two different types of analysis (spot andline scan) were used, which were conducted with the threelaser types using different spot sizes, PRRs and samples. Foreach experiment, three independent measurements on eachhomogeneous reference material were performed. Figures 2a and b show a summary of the reproducibilityof the measurements for the two types of analyses and thefour different crater diameters used, without accounting forthe very small influence of the different PRRs on the resultsThe dependency of the sample amount used li.e., the size ofthe craters from 10 and 12 um, respectively, to 55 umcorresponding to test portion masses of about 0.0005 to0.05 ug (fs LA) and 0.003 to 0.3 ug (213 nm Nd:YAG, 193excimer)l is quite obvious for the spot analyses, which showhigher RSD values for smaller spot sizes. The RSD values varybetween ca. 1-2% and 7% for both, the FF measurements(Figure 2a) and the element/Ca ratios (Figure 2b). They fractionation factor (a) andelement/Ca ratio (b) measurements(for mass fractions>1 pgg). TheRSD depends on spot size, lasertype and type of analysis (spot/linescan). The data points are theaverages of the measurements ofthe elements Cu, Zn, Rb, Sr, Ba andPb using NIST SRM 610 and GSE-1G. closely agree for all laser types, with somewhat higher valuesfor the fs LA system because of the large decrease of the ionintensity during ablation (Figure 1). Line scan analysesyielded more uniform and lower RSD values (except forsmall spot sizes using the 213 nm laser) of about 1-2%(Figures 2a and b). In summary, matrix effects are onlysignificant, when uncertainties on FFs and element/Ca ratiosexceed the RSD values specified above. Elemental fractionation As mentioned above, elemental fractionation expressedas FF is one of the most significant limitations in LA-ICP-MSmeasurement accuracy, in particular when non-matrix-matched calibration is performed. Even for a 193 nm Nd:YAG LA and short pulse lengths of 2.8 ns, FFs for chalcophile/siderophile and volatile elements, such as Pb and Zn, aredifferent when analysing different matrices, such as silicatesand carbonates (Jochum et al. 2012a). As demonstrated byseveral publications, fs LA reduces elemental fractionation andmatrix effects (Poitrasson et al. 2003), mainly due to adecreased thermal effect (Kimura and Chang 2012). To testthis for the four different matrices, we determined the FFs withour 200 nm fs LA system using spot and line scan analyses atdifferent spot sizes and PRRs. These data are compared withthe FFs determined with a 193 nm excimer laser and a213 nm Nd:YAG laser and similar operating parameters(Tables 2 and 3). Figure 3 andTable S1 show the results. In allcases, the FFs obtained from line scan analyses were nearlyunity and were much more uniform than those obtained fromspot analysis. Furthermore, the 200 nm fs spot analysis datawere more uniform than the 193 nm excimer and much moreuniform than the 213 nm Nd:YAG data (Figure 3). As shown by many publications (e.g., Jackson 2001,Jochum et al. 2012a), elemental fractionation betweenlithophile refractory elements, such as Sr and Ba, and theinternal standard element, Ca, which is also lithophileand refractory, is small or not detectable in variousmatrices, even forlaserswithlongwavelengths≥266 nm. Figure 3 shows that this is also true for ourfs LA measurements. The FFs obtained by both, fs spotand line scan analyses, agree and were unity for allinvestigated matrices within the uncertainty limits of fs LA-ICP-MS of 1-7% (depending on the spot size). Similarresults were obtained for the ns laser systems althoughthe scatter of the FFs was higher, in particular for the213 nm Nd:YAG laser spot analyses. The LA process using fs lasers is significantly less thermalanldeads to a shrinking of the heat-affected zone(Fernandez et al. 2007). Using fs LA, selective fractionation between volatile Rb and refractory Ca should therefore beminimal. This is demonstrated in Figure 3, where all FF valueswere unity within uncertainty limits. The larger scatter of theFFs for carbonate sample MACS-3 was caused by higheruncertainties of the fs LA measurements because of the verylow Rb abundance in this sample (< 0.1 ng g, Table 4f).The low Rb abundance is the reason that spot analysis couldnot be performed precisely by quadrupole ICP-MS using the193 nm excimer laser. However, significant differences, upto 10% and 25%, between spot sizes and matrices weredetected for the 193 nm excimer and the 213 nm Nd:YAGlaser Rb spot analyses on the other samples. A possiblereason is that- in contrast to fs LA -the morphology of ns-LA-generated aerosols is significantly different for differentmatrices (Glaus et al. 2010) and this difference is especiallypronounced for non-silicate samples. In all cases, the scatterof the FF was much lower using line scan analysesUnfortunately, because of lack of sample, we have no datafor line scan analyses of the phosphate glass STDP5 using193 nm excimer LA. There were no differences detectable for FF values of thelithophile and moderately volatile Pobtained by fs LA, exceptfor a possibly small (< 10%) spot size dependency in thecarbonate MACS-3 (Figure 3). Similarly, with respect to theresults obtained for volatile Rb, the spot size and matrixdependency was obvious for the ns laser ablation; partic-ularly apparent were differences between FFs of thephosphate and the carbonate samples using spot analysisand the 213 nm Nd:YAG laser. The very low Te values of Pb and Zn and their differentgeochemical behaviour compared with Ca may be themain reasons that the Pb/Ca and Zn/Ca intensity ratiosshow a severe fractionation in LA-ICP-MS (Jackson 2001,Jochum et al.2012a). Our fs LA results demonstrate that- incontrast to other elements- the FFs for Zn and Pb weredifferent for different spot sizes.However, compared with nsLA, this dependency seems not to be matrix dependent for fsLA. Lastly, the Cu values showed nearly identical FFs using fsLA, and highly variable values using ns LA. Mass-load-induced matrix effect The mass-load-induced matrix effect has been describedby Kroslakova and Gunther (2007), who showed that anincrease of the mass load of the ICP by a factor of 16(achieved by different crater diameters for analysis) leads toan up to 25% decrease in certain intensity ratios, forexample, Cu/Ca,Zn/Ca, Pb/Ca using a 193 nm LA system.Jochum et al. (2012a) investigated this effect using differentmatrices (synthetic and natural silicate glasses, and carbon- Fractionation factors PRR (Hz):—→(fs: 10, 25, 50,250; excimer: 10, 25, 50, 100; Nd:YAG: 5, 10, 20) Figure 3. Fractionation factors ofseven elements obtained frominvestigations of four differentreference materials with differentmatrices (NIST SRM 610, USGS GSE-1G,STDP5, USGS MACS-3) using200 nm fs, 193 nm excimer and213 nm Nd:YAG LA. For theseexperiments, different spot sizes,different PRRs and two types ofanalysis (spot/line scan) werechosen. Test portion masses rangedbetween about 0.0005 and0.05 ug (fs LA), and 0.003 and0.3 pg (ns LA) for spot analysis. Theywere about a factor of two higherfor line scan analysis. For furtherdetails, see Table S1. A: NIST SRM610 (synthetic glass), B: USGS GSE-1G (basaltic glass), C: STDP5(phosphate), D: USGS MACS-3(carbonate). PRR (Hz):(fs: 10,25, 50,250; excimer: 10, 25, 50,100; Nd:YAG: 5, 10, 20). ate) and observed differences for these element ratios of upto 40% when changing the mass load by a factor 100,using a 213 nm Nd:YAG laser. The effect was lepronounced (up to 15%) for a solid-state 193 nm Nd:YAG laser; the dependency differed for different matrices, butwass particularly pronouncedfor carbonate samplesBecause of the much lower test portion masses during fsLA compared with ns LA (Table 2), it is difficult to comparethe data of the intensity ratios obtained with the three lasertypes. Therefore a possible mass-load-induced matrix effectshould be much lower in fs LA. Figure 4 shows the data for all the three lasers using the operating parameters, whichare generally used for LA-ICP-MS trace element determina-tion. We determined the element/Ca ratios using spot sizeand line scan analyses for different crater sizes and PRRs(Table S2). To better compare the results between differentmatrices, we normalised the element ratios obtained for thedifferent spot sizes to the 40 um measurements in Figure 4and Table S2. The element/Ca ratios using line scananalyses were much more uniform than those obtainedusing spot analyses. As expected, the scatter of the fs LA datawas generally less than that of the ns LA data. Element/Ca ratios normalised to the 40 pm measurements Figure 4. Element/Ca abundanceratios of seven elements obtainedfrom investigation of four differentreference materials with differentmatrices (NIST SRM 610, USGS GSE-1G, STDP5, USGS MACS-3) using200 nm fs, 193 nm excimer and213 nm Nd:YAG LA. For theseexperiments, different spot sizes,different PRRs and two types ofanalysis (spot/line scan) werechosen. The data were normalisedto the 40 um spot sizemeasurements. Test portion massesranged between about 0.0005 and0.05 ug (fs LA), and 0.003 and0.3 pg (ns LA) for spot analysis. Theywere about a factor of two higherfor line scan analysis. For furtherdetails, see Table S2. A: NIST SRM610 (synthetic glass), B: USGS GSE-1G (basaltic glass), C: STDP5(phosphate), D: USGS MACS-3(carbonate). PRR(Hz):(fs: 10,25, 50,250; excimer: 10, 25, 50,100; Nd:YAG: 5, 10, 20). Ratios to Ca of the lithophile elements Sr, Ba and Rb,determined by fs, excimer and 213 nm LA, respectively,were nearly independent of spot size, PRR and matrix, butboth excimer and 213 nm laser data showed morescatter, in particular for low spot sizes and for volatile Rb.Even for line scan analysis, the ratios of the moderatelyvolatile P and the volatile and chalcophile/siderophileelements, Cu, Zn and Pb, to Ca were dependent on themass load. This dependency was similar for all matricesusing fs LA, meaning that a non-matrix-matched calibrationcan be performed in cases where the analytical param- eters (such as crater size, PRR) during measurement ofsample and calibration material are kept constant. This isespecially important for the determination of volatile andchalcophile elements, such as Cu, Zn, Pb, where theelement ratios are dependent on the spot size, but similarfor different matrices. In contrast, accurate non-matrix-matched calibration for these elements cannot be per-formed using 213 nm LA, because of a partly differentbehaviour of the spot size dependency for differentmatrices (e.g., Zn in silicate NIST SRM 610, phosphateSTDP5 and carbonate USGS MACS-3). To demonstrate the reliability of a non-matrix-matchedcalibration procedure using 200 nm fs LA-ICP-MS, wedetermined the mass fractions of forty-seven elements in avariety of reference materials with different matrices (e.g.,synthetic silicate glass, basalt glass, titanite glass, daciteglass, quartz diorite glass, phosphate glass and carbonate).In addition, we also analysed the samples by 193 nmexcimer and 213 nm Nd:YAG LA. The number of indepen-dent analyses varied between 2 and 10 (Table 4). For themeasurements, we used spot sizes of 40 um, and PRR of50 Hz (fs) and 10 Hz (193 excimer, 213 nm Nd:YAG)(Table 2). Some analyses with the fs laser were alsoconducted with a 65 um spot size. The calibration wasexclusively performed with the NIST SRM 610 silicatereference glass, where for a large number of elements,certified or quasi-certified reference values following ISOguidelines are available (Jochum et al. 2011, NIST 2012a).Using this reference material, the so-called relative sensitivityfactors (RSFs) were determined, which are defined in Jochumet al.(2007) as where MFeluncor is the uncorrected mass fraction (i.e., withoutany calibration) of the element, El,and MFEl,true is the 'true'massfraction (i.e., the certified reference value) in NIST SRM 610. Reproducibility The long-term reproducibility of the analytical data fromfs LA-ICP-MS measurements was demonstrated with the NIST SRM 612 reference glass, which was analysed tentimes over a period of six months. Spot and line scananalyses were performed using 40 and 65 um spot sizes.Mass fractions of the various elements in NIST SRM 612were about 40 ug g. Figure 5 shows the ratios of theindividual analyses to the average mass fraction of therespective element. Table S3 also lists the mass fractions ofNIST SRM 612. The long-term reproducibility (RSD) for thedifferent elements ranged from 2 to 6%. Exceptions wereBe, Zn, As, Se, Cd, Sb and Bi, known to be inhomoge-neously distributed in NIST SRM glasses (Jochum et al.2011), with RSD values of 7-11%. Short-term reproduc-ibility for most element data was better (RSD<1-3%), asdemonstrated by analyses of some other reference samplesperformed within 1-3 days (Table 4a-f). These values aresimilar to those obtained from ns LA using 193 nm excimerand 213 nm Nd:YAG lasers. For lower trace elementcontents (<1 ugg), reproducibility of the fs LA measure-9ments was between 5 and 10%. A complete compilation isgiven in Table 4a-f, which list mass fractions of forty-seventrace elements (and standard deviation values) for twenty-two reference materials. Measurement accuracy Besides reproducibility, measurement accuracy, definedas the closeness of agreement between a measuredquantity value and a true’ value (Potts 2012), is animportant analytical parameter. Therefore, we determinedthe overall analytical uncertainty, Uel, of the mass fraction ofan element El, which includes the main sources of statisticaland systematic errors of LA-ICP-MS and contains the true’value with a high probability of 95% by Figure 5. Percentage deviation of the mass fractions from the average mass fractions for ten independent 200 nm fsLA-ICP-MS analyses of the NIST SRM 612 glass (nominal mass fraction for each element is about 40 ng g). Theanalyses were performed within 6 months, using variable operating parameters (spot size = 40, 65 pm; spot/linescan analysis). The long-term reproducibility of most elements was about 2-6% RSD. Some elements showed alarger scatter, which was mainly caused by their inhomogeneous distribution in NIST SRM 612 (Jochum et al.2011).Mass fractions are given in Table S3. where k=2 is the coverage factor. The term ue is theuncertainty of the mass fraction of the element El in thesample; it was determined by calculating the standarddeviations of the mean of the individual measurements.Potential inhomogeneities of sample and calibration mate-rial NIST SRM 610, as well as statistical errors determiningthe RSFs, are included in this term. The terms Uca(sample) andUCa(NIST610) are the uncertainties of the internal standardelement Ca in the sample and NIST SRM 610, respectively.The term URV(NIST610) represents the uncertainties of thereference values of NIST SRM 610 at the 95% confidencelevell((Jochum et al.2011, NIST 2012a). The relativeuncertainties of URV(NIST610) ranged between 0.2 and 5%.Exceptions were B, Ge and Se, where the reference values inNIST SRM 610 are only for information with relatively highuncertainties of 16-30%. The analytical uncertainty of uca(NIST610) was 1.8%. The overall analytical uncertainty alsoconsiders uncertainties caused by possible matrix effects(uMw). As shown in Figures 3 and 4, UMx is mainly dependenton the laser system used and the geochemical character ofthe investigated element. For fs LA, we assumed a possiblematrix dependency of less than the precision of themeasurements (RSD=1-2%) with a maximum UMx of 2%using spot sizes ≥40 um (Figures 3 and 4). The value ofuMx was assumed to be significantly higher, 3 and 5%, forlithophile refractory, and up to 15% and 20%, for volatileand siderophile/chalcophile elements, using 193 nm exci-mer and 213 nm Nd:YAG LA, respectively, and analysingnon-silicate samples. Our investigations showed that amatrix-matched calibration was not necessary for a widerange of geological and environmental samples (Kimuraand Chang 2012) when using 200 nm fs LA-ICP-MS.Figure 6 compares analytical data for some typical andwell-characterised reference samples, that is, silicate glassNIST SRM 612, quartz diorite glass T1-G, titanite glass TIT-200 (Odegard et al. 2005), carbonate MACS-3 andphosphate glass STDP5 with available reference values(Jochum et al. 2006, 2011, NIST 2012b, GeoReM pre-ferred values). Exceptionally large uncertainties for B, Gaand Se data were caused by large uncertainties, URV(NIST610)of the reference values mentioned above. For accuratedetermination of these elements, reference materials otherthan NIST SRM 610 are preferred, such as NIST SRM 612,where relative uncertainties for reference values of B (5%),Ge (4%) and Se (12%) are much lower than those for NISTSRM 610. Some other large uncertainties of the LA-ICP-MSdata shown in Figure 6 were caused by low trace elementabundances (≤ 0.1 ngg), such as for Tl and Bi in T1-G. The analytical data for reference materials shown inFigure 6, and others are listed in Table 4a-f. These tablesalso contain the results of the excimer and the Nd:YAG lasermeasurements. Nearly all ns LA data agree well within theoverall analytical uncertainties, Uel, with the fs LA data andthe reference values. However, the overall analytical uncer-tainty for volatile and siderophile/chalcophile elements ofthe ns LA data was higher than that of the fs data because ofthe high uMx value assumed for matrix effects in ns LAbetween the sample of interest and the calibration material.There are only a few elements for which measured andreference values disagree, for example, as in KL2-G, whereboth fs and ns LA data were significantly higher than theliterature value (Table 4c), which, however, is for informationonly (Jochum et al. 2006). The three values for Cd in MAPS-5 differed significantly from each other, probably indicatinga heterogeneous distribution of this element in the referencematerial. Figure 7a gives an overview of the measurement accu-racy using fs and ns LA, respectively, by determining therelative deviation between the analytical data and thereference values (Table 4). We chose only such samples(NIST 612, 614, GSD-1G,BCR2-G, KL2-G,MACS-1) wheremeasurements by 200 nm fs, 193 nm excimer and 213 nmNd:YAG LA were performed. In addition, we only evaluatedthose elements for which analytical data from all laser typeswere available. Figure 7 shows that the measurementaccuracy of the silicate NIST glasses was similar for all lasertypes, which is not surprising because a matrix-matchedcalibration with the NIST SRM 610 glass was performed.However, for the geological and the carbonate samples, theagreement of the fs LA data with the reference values wassignificantly better than for both ns LA data sets. Grouping thedata in refractory lithophile (Ba, Sr, Zr, Ce, Nd, Hf, U), volatilelithophile (Li, Rb, Cs) and volatile chalcophile/siderophile (Cu,Zn, Ga, Ge, Pb, Bi) categories yielded a mean deviation of fsLA, which is significantly better than for 193 nm excimer and213 nm Nd:YAG LA(Figure 7b). Similar results for 193 nmexcimer LA were obtained in other laboratories (e.g., Normanet al.2004, Tabersky et al.2013). Detection limit The detection limit (DL) refers to the smallest mass fractionthat can be distinguished from the background signal at aspecified confidence level (Potts 2012). We used threestandard deviations of the background signal as theconfidence interval to determine the DL for 200 nm fs LA-ICP-MS. The DL is dependent on several factors, amongwhich the most important are the individual elementsensitivity, isotopic abundance, ion intensity, sample amount Figure 6. Analytical results of five reference materials with different matrices obtained by 200 nm fs LA-ICP-MSusing the synthetic silicate glass NIST SRM 610 for calibration. Plotted is the percentage deviation of the massfractions from the reference values. Error bars show the overall analytical uncertainties at the 95% confidence levelincluding the main sources of statistical and systematic errors. The shaded band represents the uncertainties of thereference values (dark grey: values at 95% confidence level following ISO guidelines (Jochum et al. 2006,2011,NIST 2012a, b, c, d); light grey: 2 RSD values of compilation data (@degard et al. 2005, Klemme et al. 2008,Jochum et al.2012a)). The exceptionally large uncertainties of the B, Ge, and Se LA-ICP-MS data were caused by thelarge uncertainties of the reference values in the calibration material, NIST SRM 610 (RSD=16-30%), and low traceelement contents (e.g., Tl and Bi in T1-G). All analytical data are identical with the reference values (NIST SRM 612: Table 4a; T1-G: Table 4d; TIT-200, STDP5: Table 4e; MACS-3: Table 4f) within uncertainties. ablated per time, measuring time and gas blank, which canbe influenced by cross-contamination when analysingdifferent matrices. Table 4f lists the DLs obtained by200 nm fs, 193 nm excimer and 213 nm Nd:YAG LA.The DLs were dependent on the individual element andmass spectrometers and lasers used. For fs LA and 40 umspot size, they varied between 0.001 and 2 ugg Conclusions LA-ICP-MS has become one of the most promisingtechniques for multi-element determination in a variety ofgeochemical, biological and environmental samples. One ofthe main limitations of this technique, when using ns LA, is the occurrence of non-stoichiometric effects in the transientsignals, referred to as elemental fractionation. Mass-load-induced matrix effects and the lack of suitable refer-ence materials for calibration are other possible limitations.The development of fs LA using short laser pulse durationleads to shrinking of the heat-affected zone in the sampleand hence to the less elemental fractionation and matrixeffects, especially for volatile and siderophile/chalcophileelements. This paper demonstrates that matrix effects aresmaller than the analytical uncertainty of the measurementsusing LA with fs pulses and short wavelengths of 200 nm,and hence are not detectable. This means that a non-matrix-matched calibration can be successfully conducted withcertified reference glasses, such as those from NIST or MPI- silicate geological carbonate Figure 7. (a) Mean percentage of analytical data(Table 4) obtained by fs, 193 nm excimer and 213 nmNd:YAG LA, which agree best with the referencevalues. Only samples (NIST SRM 612, SRM 614, GSD-1G, BCR-2G, KL2-G,MACS-1) and elements wereconsidered, for which data from all laser types wereavailable.Whereas for silicate samples (here: NIST SRM612, 614), the percentage was nearly the same for alllasers (because of matrix-matched calibration withNIST SRM 610), it was significantly higher for othermatrices using fs LA demonstrating better measure-ment accuracy. (b) Mean deviation of analytical data(Table 4) from reference values. Elements investigatedare grouped in refractory lithophile (Ba, Sr, Zr, Ce, Nd,Hf, U),volatile lithophile (Li, Rb, Cs) and volatilechalcophile (Cu, Zn, Ga, Ge, Pb, Bi) categoriesaccording to their geochemical behaviour. In all cases,the fs LA measurements showed the lowest deviations. DING, for many different elements. Therefore, precise (about1-3%) and accurate (Uelrel<10%) microanalysis of sam-ples with different matrices, for which no or only fewcalibration materials are available, such as single non-silicate minerals, stalagmites, dust, bones and teeth, ispossible, even for small spot sizes of 40 um. Although theprecision of ns LA-ICP-MS is comparable with fs LA-ICP-MS,the relative overall analytical uncertainty can increase up toabout 15% and 30% for volatile, chalcophile and sidero-phile elements, for example, Pb, Zn, in 193 nm excimer and 213 nm Nd:YAG ns LA-ICP-MS, respectively, because ofmatrix effects. Acknowledgements S. Wilson, S. Klemme and X. Zhan are thanked forproviding us with some microanalytical reterence materials.We also thank P.J. Sylvester and two anonymous reviewersfor their helpful comments. This research was funded by theMax Planck Society of Germany and the Johannes Guten-berg University of Mainz. References Avanesyan S.M., Orlando S., Langford S.C. and Dickinson J.T. (2004)Generation of color centers by femtosecond laser pulses inwide band gap materials. Proceedings of SPIE- TheInternational Society for Optical Engineering, 5352,169-179. Fernandez B., Claverie F., Pecheyran C. and DonardO.F.X. (2007)Direct analysis of solid samples by fs-LA-ICP-MS. Trends inAnalytical Chemistry, 26, 951-966. Fryer B.J., Jackson S.E. and Longerich H.P. (1995)The design, operation and role of laser-ablation micro-probe coupled with an inductively coupled plasma-massspectrometer (LAM-ICP-MS) in the Earth sciences. TheCanadian Mineralogist, 33, 303-312. Gaboardi M. and Humayun M. (2009)Elemental fractionation during LA-ICP-MS analysis ofsilicate glasses: Implications for matrix-independent stan-dardization.Journal of Analytical Atomic Spectrometry, 24,1188-1197 Garcia C.C., Lindner H., von Bohlen A., Vadla C. andNiemax K.(2008)Elemental fractionation and stoichiometric sampling infemtosecond laser ablation. Journal of Analytical AtomicSpectrometry, 23, 470-478. Glaus R., Kaegi R., Krumeich F. and Gunther D. (2010)Phenomenological studies on structure and elementalcomposition of nanosecond and femtosecond laser-gen-erated aerosols with implications on laser ablation induc-tively coupled plasma-mass spectrometry. SpectrochimicaActa Part B, 65,812-822. Goldschmidt V.M. (1926)Geochemische Verteilungsgesetze der Elemente. SkrifterNorske Videnskaps-Akad. (Oslo), (1) Mat. Natur. Gonzalez J.J., Oropeza D., Mao X. and Russo R.E.(2008) Assessment of the precision and accuracy of thorium(232Th) and uranium (238u) measured by quadrupolebased inductively coupled plasma-mass spectrometryusing liquid nebulization, nanosecond and femtosecondlaser ablation. Journal of Analytical Atomic Spectrometry,23,229-234. Guillong M. and Gunther D. (2002)Effect of particle size distribution on ICP-induced elementalfractionation in laser ablation-inductively coupled plasma-mass spectrometry. Journal of Analytical Atomic Spec-. trometry, 17, 831-837. Horn I. and von Blanckenburg F.(2007)Investigation on elemental and isotopic fractionationduring 196 nm femtosecond laser ablation multiplecollector inductively coupled plasma-mass spectrometry.Spectrochimica Acta Part B, 62, 410-422. Hu M.-Y., Fan X.-T., Stoll B., Kuzmin D., Liu Y., Liu Y.-S., SunW., Wang G., Zhan X.-C. and Jochum K.P. (2011)Preliminary characterisation of new reference materials formicroanalysis: Chinese geological standard glasses CGSG-1, CGSG-2, CGSG-4 and CGSG-5. Geostandards andGeoanalytical Research, 35, 235-251. Jackson S.E. (2001) The application of Nd:YAG lasers in LA-ICP-MS. In:Sylvester P. (ed.), Laser ablation-ICP-MS in the Earthsciences - Principles and applications. MineralogicalAssociation of Canada (Ottawa, Ontario), Short CourseSeries, 29, 29-45. Jackson S. and Gunther D. (2003) The nature and sources of laser induced isotopic fraction-ation in laser ablation-multicollector-inductively coupledplasma-mass spectrometry. Joumnal of Analytical AtomicSpectrometry, 18, 205-212. Jochum K.P. and Enzweiler J. (2014)Reference materials in geochemical and environmentalresearch. In: Holland H.D. and Turekian K.K. (eds), Treatiseon Geochemistry (2nd Edition), Volume 15, Elsevier(Oxford), 43-70. Jochum K.P. and Nohl U. (2008)Reference materials in geochemistry and environmentalresearch and the GeoReM database. Chemical Geology,253,50-53. Jochum K.P., Willbold M., Raczek l., Stoll B. and HerwigK. (2005) Chemical characterisation of the USGS reference glassesGSA-1G, GSC-1G, GSD-1G, BCR-2G,BHVO-2G and BIR-1G using EPMA, ID-TIMS, ID-ICP-MS and LA-ICP-MS.Geostandards and Geoanalytical Research, 29,285-302. ( Jochum K. P ., S t oll B ., Herwig K., W illbold M., Hofmann A.W., Amini M., Aarburg S., Abouchami W., Hellebrand E., Mocek B . , Raczek l., Stracke A., Alard O ., Bouman C., B ecker S t ., Ducking M., Bratz H. , Klemd R., de Bruin D.,Canil D., Comnell D., de Hoog C.-J., Dalpe C., Danyu-shevsky L., Eisenhauer A., Gao Y., Snow J.E., G roschopf N ., Gunther D., Latkoczy C. , Guillong M., Hau r i E., Hofer H.E., Lahaye Y., Horz K., Jacob D.E. , Kasemann S.A., Kent A.J.R., Ludwig T ., Zack T., Mason P.R.D., Meixner A., Rosner M., Misawa K., Nash B.P., Pfander J., Premo W.R . , Sun W.D., Tiepolo M., V annucci R., Vennemann T., Wayne D. and Woodhead J.D. (2006) ) ( MPI-DING reference glasses for i n -situ microanalysis: New r eference values for e lement concentrations a n d isotope ratios . Geochemistry Geophysics Geosystems, 7 ,Q02008, doi: 10.1029/2005GC001060. ) Jochum K.P., Stoll B., Herwig K. and Willbold M. (2007)Validation of LA-ICP-MS trace element analysis of geo-logical glasses using a new solid-state 193 nm Nd:YAGlaser and matrix-matched calibration. Journal of AnalyticalAtomic Spectrometry, 22,112-121. Jochum K.P., Weis U., Stoll B., Kuzmin D., Yang Q.,Raczek l., Jacob D.E., Stracke A., Birbaum K., Frick D.A.,Gunther D. and Enzweiler J.(2011)Determination of reference values for NIST SRM 610-617glasses following ISO guidelines. Geostandards andGeoanalytical Research, 35, 397-429. ( Jochum K.P., Scholz D., Stoll B., Weis U., Wilson S.A.,YangQ., Schwalb A., Bomner N., Jacob D.E. and Andreae M.O. (2012a) Accurate trace element analysis of speleothems and biogenic calcium carbonates by LA-ICP-MS. Chemical Geology, 318-319, 31-44 ) Jochum K.P., Wilson S., Stoll B., Weis U. and Andreae ( M.O. (2012b) The importance of Ca carbonate a nd Ca p h osphate m icroanalytical r eference materials for environmental research. In: Abstra c t Volume, Geoanalysis 2012. The International Association o f Geoanalysts (Bu z ios, Bra z il), 38. ) ( Kimura J.-I. and Chang Q.(2012) O rigin of the s uppressed ma t rix ef f ect f o r improved analytical performance in determination of major and trace elements in anhydrous silicate samples using 200 nm f emtosecond la s er ablation sector-field inductively coupled p lasma-mass spectrometry. Journal of Analytical Atomic Spectrometry, 2 7 ,1549 - 1559. ) ( Klemme S . , P rowatke S., Munker C., Magee C.W., Lahaye Y., Zack T., Kasemann S.A., Cabato E.J.A. a ndKaeser B. (2008) S ynthesis a nd p r eliminary characterisation of n e w silicate, phosphate and titanite reference glasses. Geostandards and Geoanalytical R esearch, 32, 39-54. ) Koch J. and Gunther D. (2007) Femtosecond laser ablation inductively coupled plasma- mass spectrometry: Achievements and remaining problems. Analytical and Bioanalytical Chemistry, 387,149-153. Koch J., Lindner H., von Bohlen A., Hergenroder R. and Niemax K. (2005) Elemental fractionation of dielectric aerosols produced by near-infrared femtosecond laser ablation of silicate glasses. Journal of Analytical Atomic Spectrometry, 20, 901-906. Kroslakova l. and Gunther D. (2007) Elemental fractionation in laser ablation-inductively cou-pled plasma-mass spectrometry: Evidence for mass loadinduced matrix effects in the ICP during ablation of asilicate glass. Journal of Analytical Atomic Spectrometry,22, 51-62. Kuhn H.R. and Gunther D.(2004)Laser ablation-ICP-MS: Particle size dependent elementalcomposition studies on filter-collected and online mea-sured aerosol from glass. Journal of Analytical AtomicSpectrometry, 19,1158-1164. Lodders K. (2003) Solarsystem abundances and condensation temperatures ofthe elements. The Astrophysical Journal, 591, 1220-1247. Matschat R., Dette A. and Guadagnino E. (2005) The certification of the mass fraction of arsenic (IIl) oxide,barium oxide, cadmium oxide, cerium (MV) oxide, chloride,cobalt oxide, chromium (Il) oxide, copper (ll) oxide, iron ()oxide, manganese (1l) oxide, molybdenum (M) oxide, nickel() oxide, lead (ll) oxide, antimony (ll) oxide, selenium, tin(IV) oxide, sulfur trioxide, strontium oxide, titanium (M)oxide,vanadium (V) oxide, zinc oxide,and zirconium (IV) oxide insoda lime glass BAM-S005A and BAM-S005B.http://www.rm-certificates.bam.de/en/certificates/ special_materials/ Mertz-Kraus R., Jochum K.P., Sharp W.D., Stoll B., Weis U.and Andreae M.O. (2010) In situ 230Th-232Th-234U_238U analysis of silicate glassesand carbonates using laser ablation single-collector sector-field ICP-MS. Journal of Analytical Atomic Spectrometry,25,1895-1904. NIST (2012a) Certificate of Analysis - Standard Reference Material 610.National Institute of Standards and Technology (Gaithersburg, MD, USA). NIST (2012b) Certificate of Analysis - Standard Reference Material 612.National Institute of Standards and Technology (Gaithersburg, MD, USA). NIST (2012c) Certificate of Analysis - Standard Reference Material 614National Institute of Standards and Technology(Gaithersburg, MD, USA). NIST (2012d)Certificate of Analysis-Standard Reterence Material 616.National Institute of Standards and Technology(Gaithersburg, MD, USA). Norman M.D., Garcia M.O. and Bennett V.C.(2004)Rhenium and chalcophile elements in basaltic glasses fromKo’olau and Moloka'l volcanoes: Magmatic outgassingand composition of the Hawaiian plume. Geochimica etCosmochimica Acta,68,3761-3777. Odegard M., Skar O., Schiellerup H. and Pearson N.J.(2005) Preparation of a synthetic titanite glass calibration materialfor in situ microanalysis by direct fusion in graphiteelectrodes: A preliminary characterisation by EPMA and LA-. ICP-MS. Geostandards and Geoanalytical Research, 29,197-209. Poitrasson F., Mao X., Mao S.S., Freydier R. and RussoR.E.(2003) Comparison of ultraviolet femtosecond and nanosecondlaser ablation inductively coupled plasma-mass spectrom- etry analysis in glass, monazite and zircon. AnalyticalChemistry, 75,6184-6190. Potts P.J. (2012) Glossary of analytical and metrological terms from theInternational Vocabulary of Metrology (2008). Geostan-dards and Geoanalytical Research, 35, 397-429. Shaheen M.E., Gagnon J.E. and Fryer B.J. (2012)Femtosecond (fs) lasers coupled with modern ICP-MSinstruments provide new and improved potential for in situelemental and isotopic analyses in the geosciences.Chemical Geology, 330-331, 260-273. Sylvester P. (editor) (2008)Laser ablation ICP-MS in the Earth sciences: Currentpractices and outstanding issues. Short Course Series, 40,Mineralogical Association of Canada (Vancouver),348pp. ( T abersky D., N ishiguchi K., Utani K., Ohata M., D i etiker R ., Fricker M.B., de Maddalena I . M., K och J. a ndGunther D. (2013) Aerosol entrainment and a large-capacity gas exchange d evice (Q-GED) for laser ablation inductively coupledplasma-mass spectrometry in a t mospheric pressure air. Journal of Analytical Atomic Spectrometry, 28, 831-8 4 2. ) Vanhaecke F., Resano M., Koch J.,Mclntosh K. and Gunther D. (2010)Femtosecond laser ablation-ICP-mass spectrometry analy-sis of a heavy metallic matrix: Determination of platinum-group metals and gold in lead fire-assay buttons in a casestudy. Journal of Analytical Atomic Spectrometry, 25,1259-1267. Yang Q.-C., Jochum K.P., Stoll B., Weis U., Kuzmin D.,Wiedenbeck M., Traub H. and Andreae M.O. (2012)BAM-S005 Type A and B: New silicate reference glassesfor microanalysis. Geostandards and GeoanalyticalResearch, 36, 301-313. Supporting information Additional Supporting information may be found in theonline version of this article: TableeS1. Fractionation factors ofseven1Eelements obtainedl from investigation of four different reterence materials. Table S2. Element/Ca abundance ratios of seven elements obtained from investigation of four different refer- ence materials. Table S3. Mass fractions of NIST SRM 612 obtained by 200 nm fs LA-ICP-MS using spot and line scan analysis. This material is available as part of the online article from: http://onlinelibrary.wiley.com/doi/10.1111/j.1751- 908X.2014.12028.x/abstract (This link will take you to the article abstract). doi:j..x The Authors. Geostandards and Geoanalytical Research International Association of Geoanalysts The Authors. Geostandards and Geoanalytical Research International Association of Geoanalysts LA-ICP-MS是地质环境样品原位分析最有前途的技术之一。然而,在使用非矩阵匹配校准时,测量精度有一些限制,特别是对挥发性和亲铁/亲铜元素。因此,我们研究了一个新的200nm飞秒(fs)激光消融系统(NWRFemto200)测量基质相关效应,该系统使用不同基质和不同光斑尺寸(10到55μm)的参考材料。我们还用两个纳秒(ns)激光器、193nm准分子(ESI NWR 193)和213nm Nd:YAG (NWR UP-213)激光器进行了类似的实验。200nm激光烧蚀的离子强度远低于213nm Nd: YAG激光,因为烧蚀率降低了约30倍。我们的实验并没有显示出与200nm fs激光器有显著的矩阵相关性。因此,可以对不同矩阵的多元素分析进行非矩阵匹配标定。22种国际合成硅酸盐玻璃、地质玻璃、矿物、磷酸盐和碳酸盐参考材料的分析结果证明了这一点。校准仅使用认证的NIST SRM 610玻璃进行。在整体分析不确定因素下,200nm fs LA-ICP-MS数据与现有参考值一致。
确定
还剩26页未读,是否继续阅读?

产品配置单
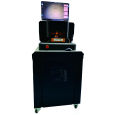
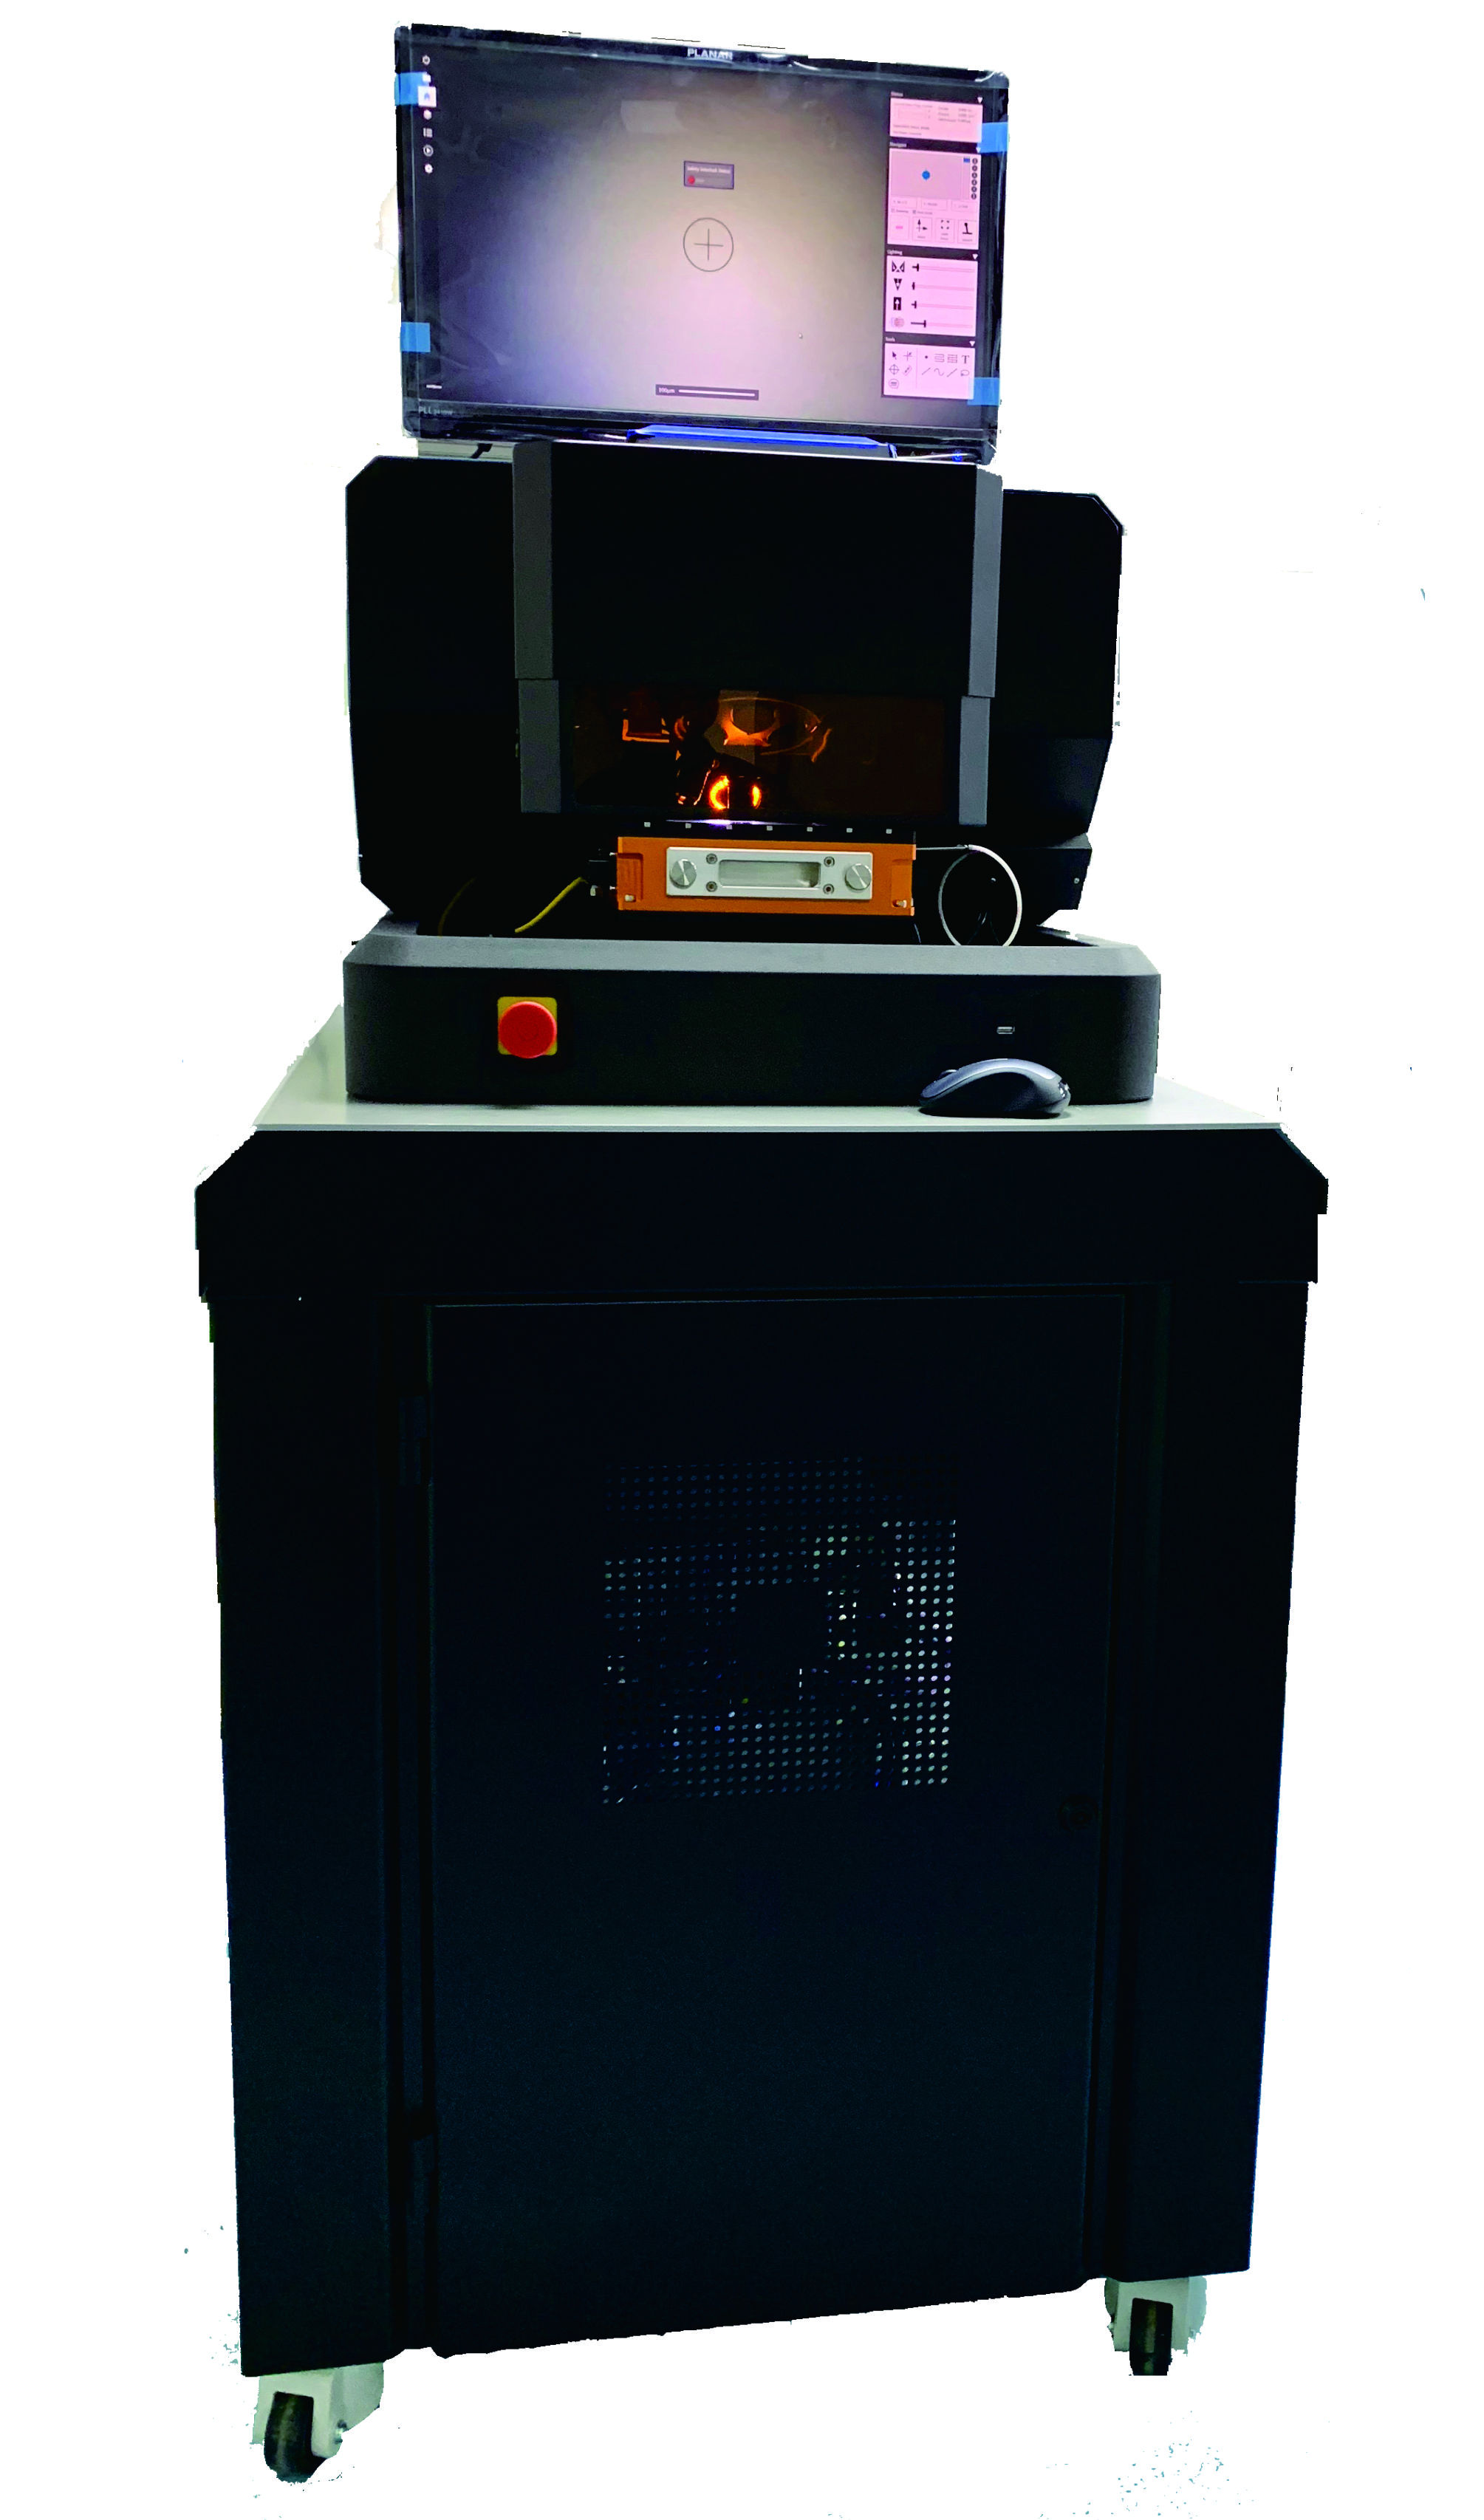
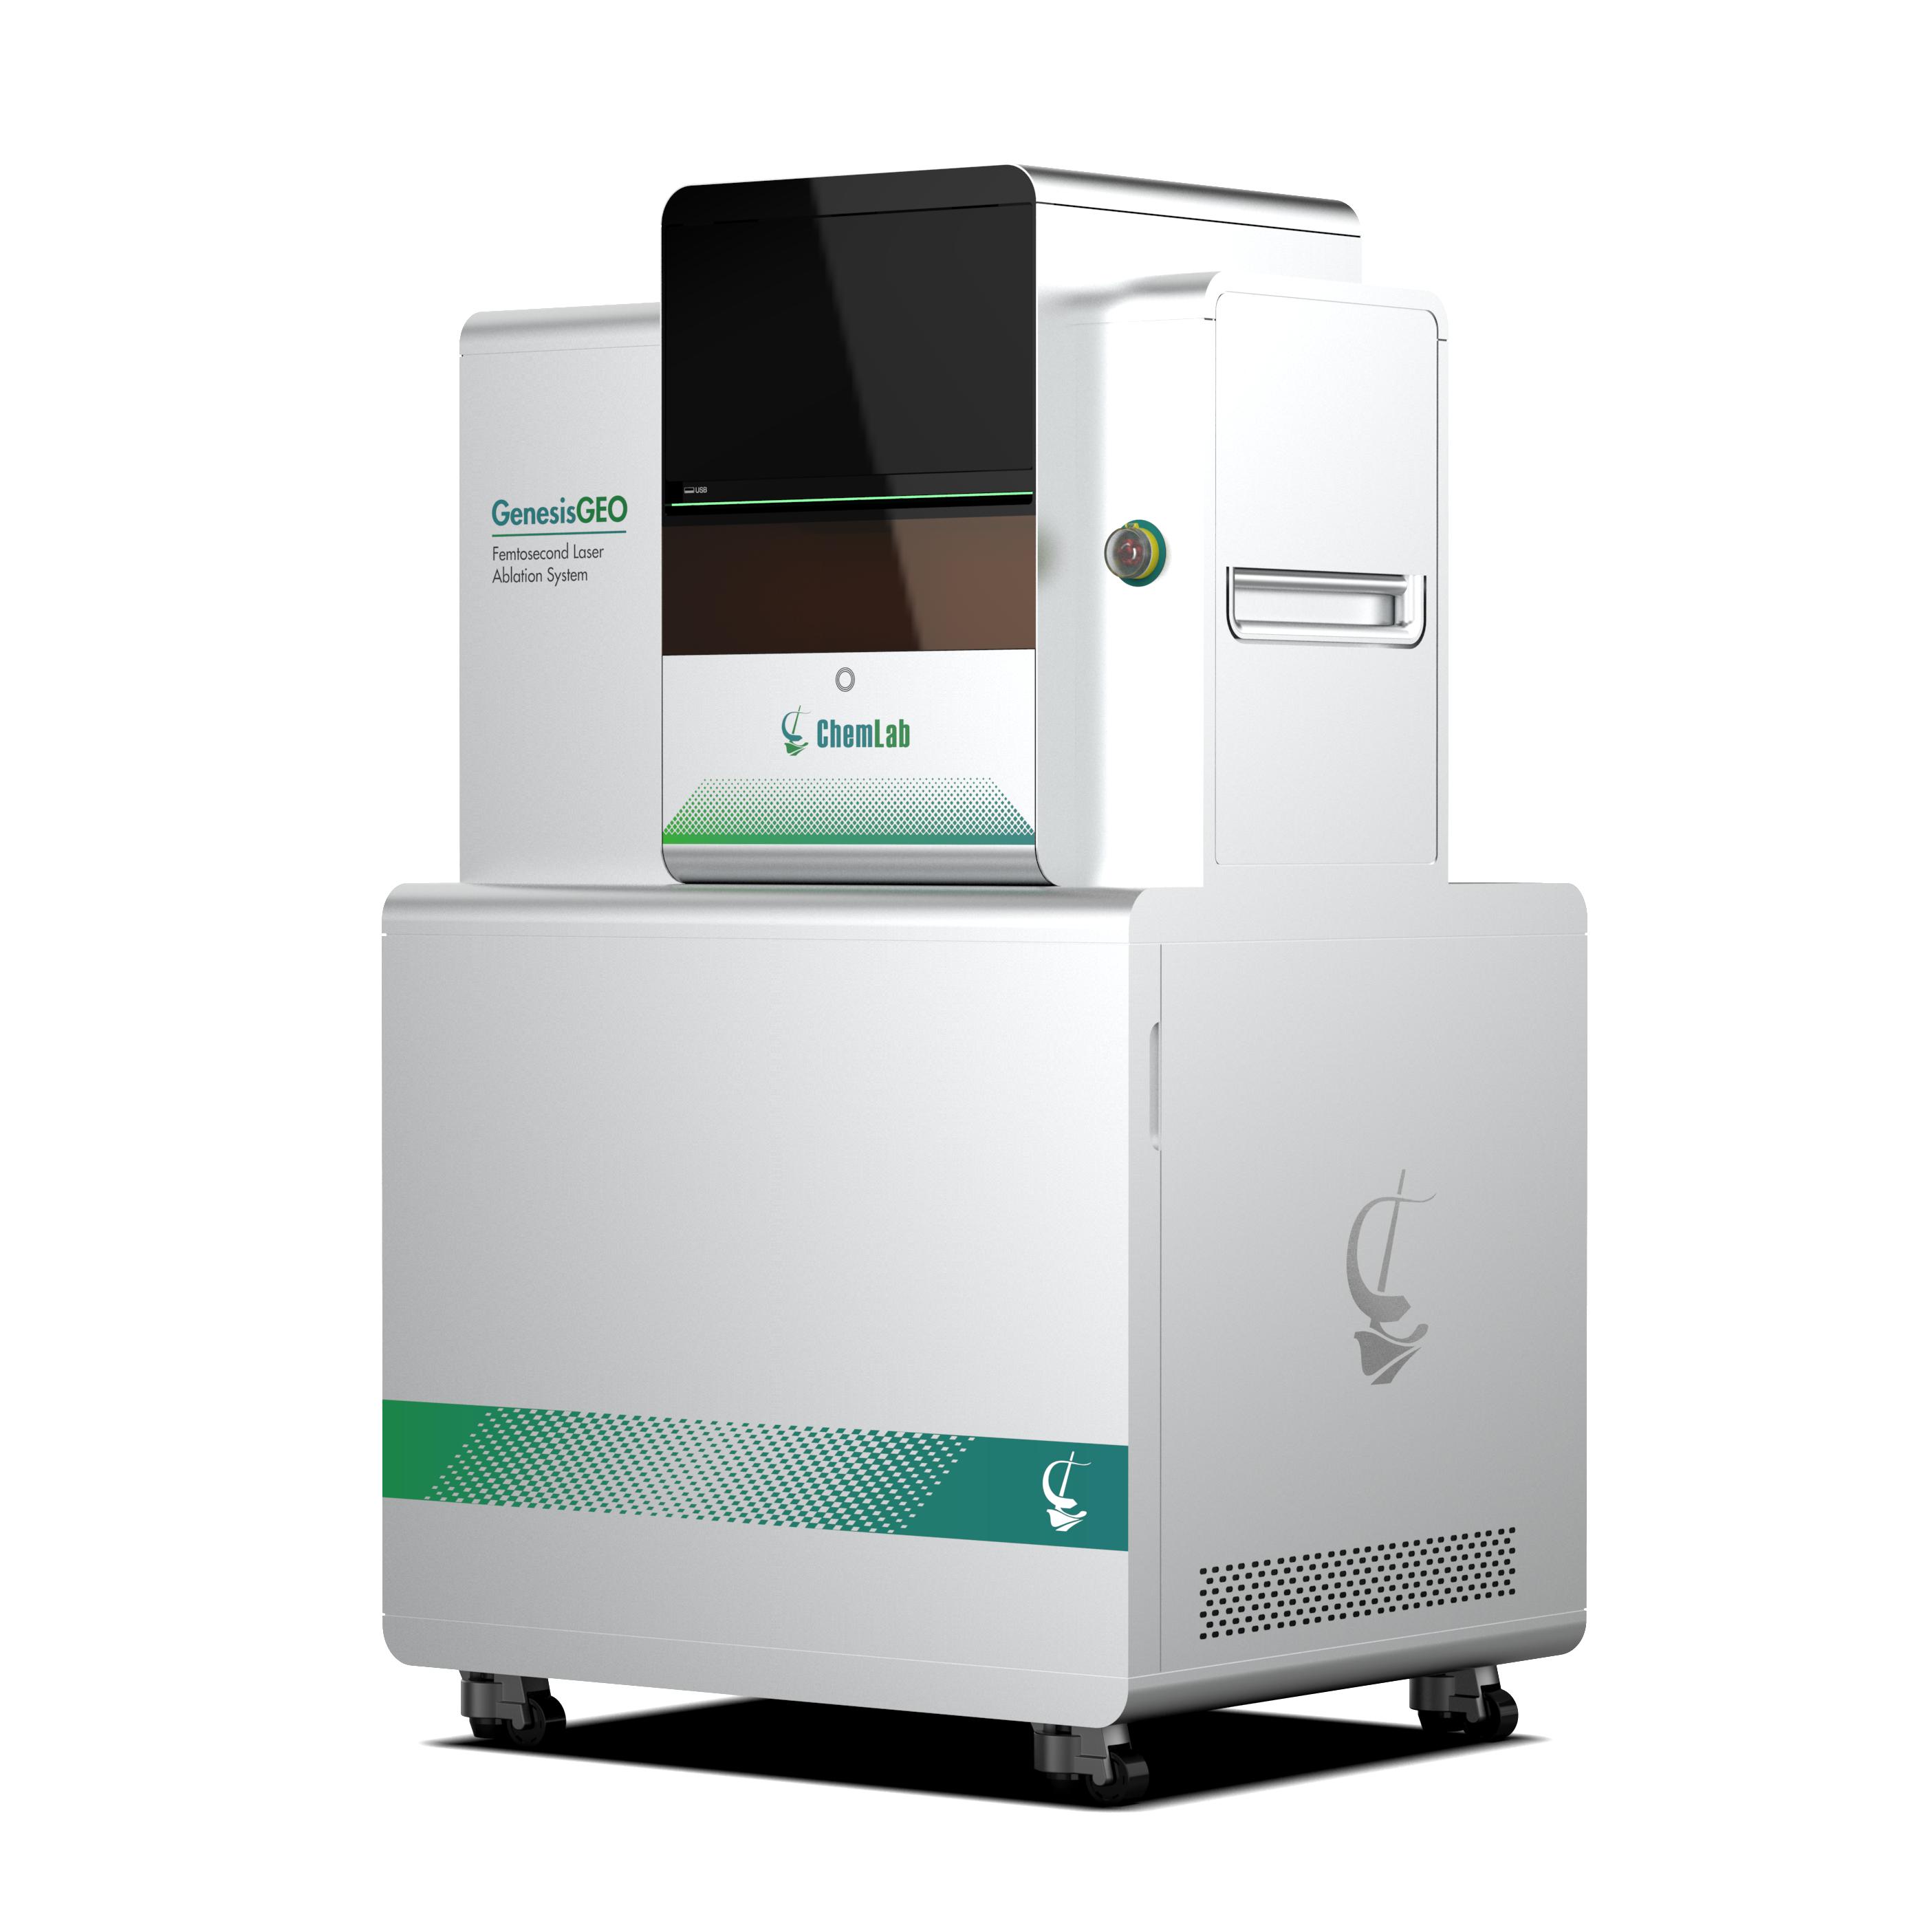
上海凯来仪器有限公司为您提供《地质和环境样品中无机元素检测方案(激光剥蚀进样)》,该方案主要用于其他中无机元素检测,参考标准--,《地质和环境样品中无机元素检测方案(激光剥蚀进样)》用到的仪器有ESLfemto 飞秒激光剥蚀系统
推荐专场
相关方案
更多
该厂商其他方案
更多