


在岩浆岩中,将单晶微晶化以得到微量的固体样品进行同位素分析,可以从晶体(尤其是长石)中获得重要的成岩信息。由于可以在钻前充分评估样品区域的纹理背景,因此可以获得特殊的细节。在大块岩石尺度上进行分析时,这些信息是未知的或丢失的。在此,我们提出了一种综合的方法来*分析从矿物中提取的微量固体样品中纯化的铷和锶的钠含量。物理采样技术是基于计算机数控(CNC)钻样机(Micromill™),新设计的专门针对复杂增生的采样和增长结构。物理采样技术是基于计算机数控(CNC)钻样机(Micromill分别介绍了用于TIMS和MC-ICPMS分析的Sr和Rb分离的化学方法,并在微钻产生的样品尺寸较小的情况下评估了这些分析技术的性能。物理采样技术是基于计算机数控(CNC)钻样机Micromill机械取样、常规溶出和化学分离,再经TIMS分析,虽然费时,但仍是测定大多数地质材料中Sr同位素组成的最准确和最*的方法,其范围广泛,包括Sr浓度、Rb/Sr比值和基体类型。使用这些技术,可以实现长期的2 S.D.外部精度50ppm的负载尺寸小至3ng Sr。物理采样技术是基于计算机数控(CNC)钻样机Micromill我们用两个例子证明了这些技术的有效性。首先从< 50 ka单一长石晶体Parinacota火山(智利)显示,87 Sr / 86锶同位素范围可达0.00006,微量的放射锶可以忽略不计。第二种是来自科罗拉多28.4Ma鱼峡谷凝灰岩,用于演示同位素稀释测量Rb和Sr含量计算87Rb/86Sr的效用,从而对87Sr/86Sr比值进行定年校正,以建立单晶或区域之间87Sr/86Sr的变化。我们证明了鱼峡谷凝灰岩中的黑云母晶体的sr同位素变化远远超过了分析误差,因此所涉及的晶体并不处于同位素平衡状态,不能用来建立等时年份。另一方面,我们同位素稀释测量的精度可以用来测量铷、锶。
方案详情

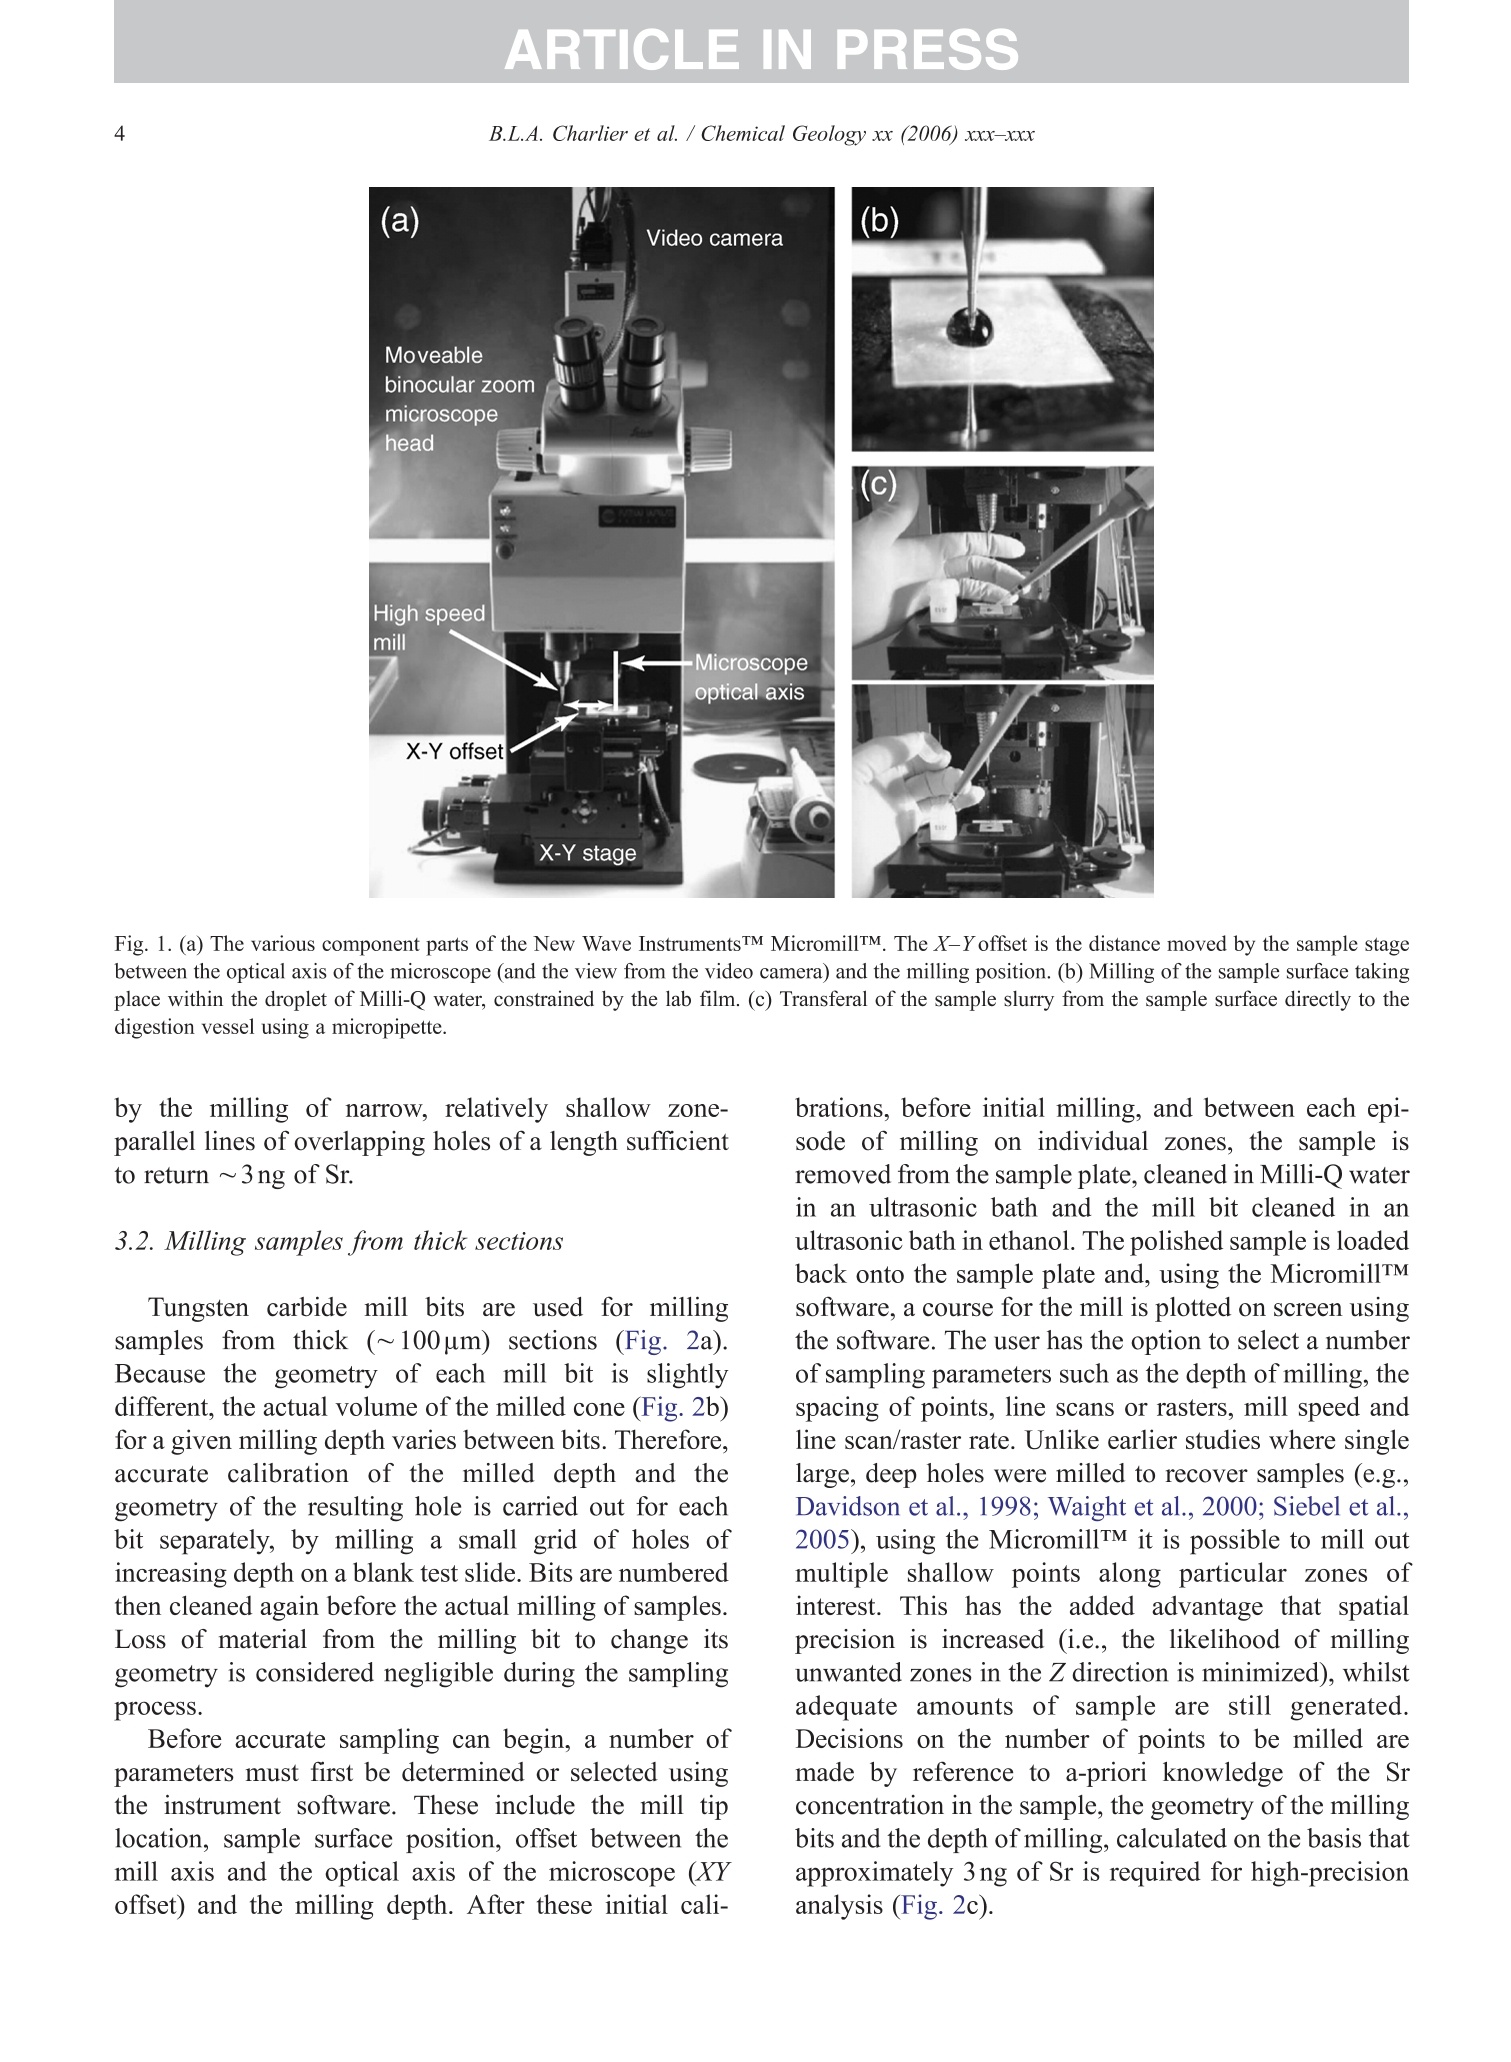
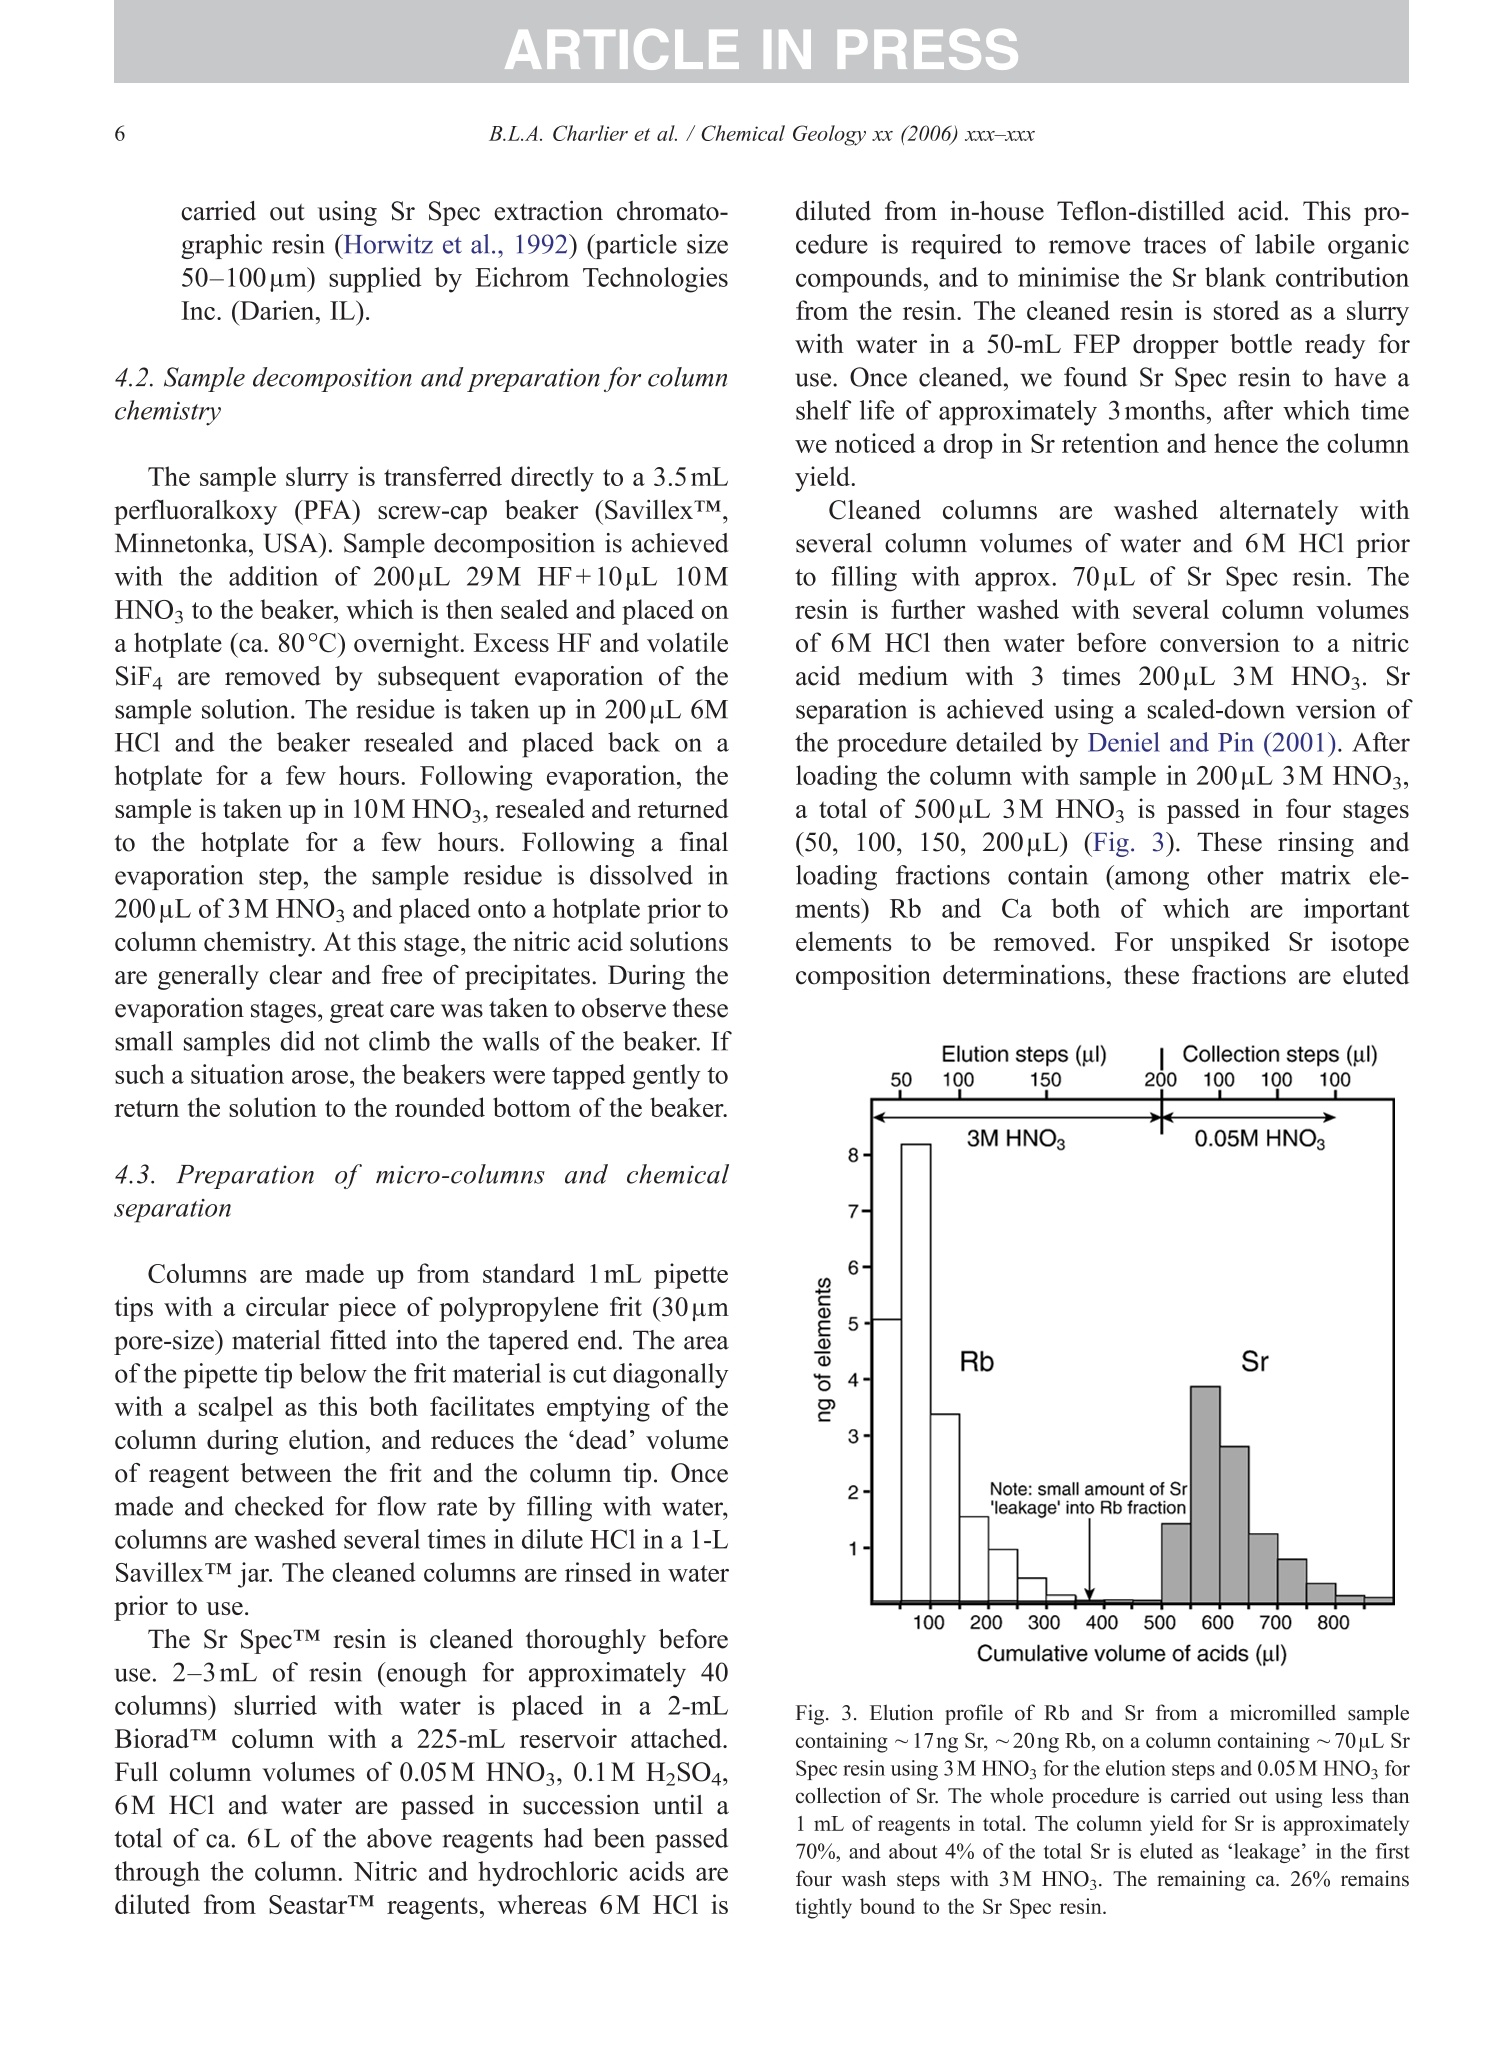
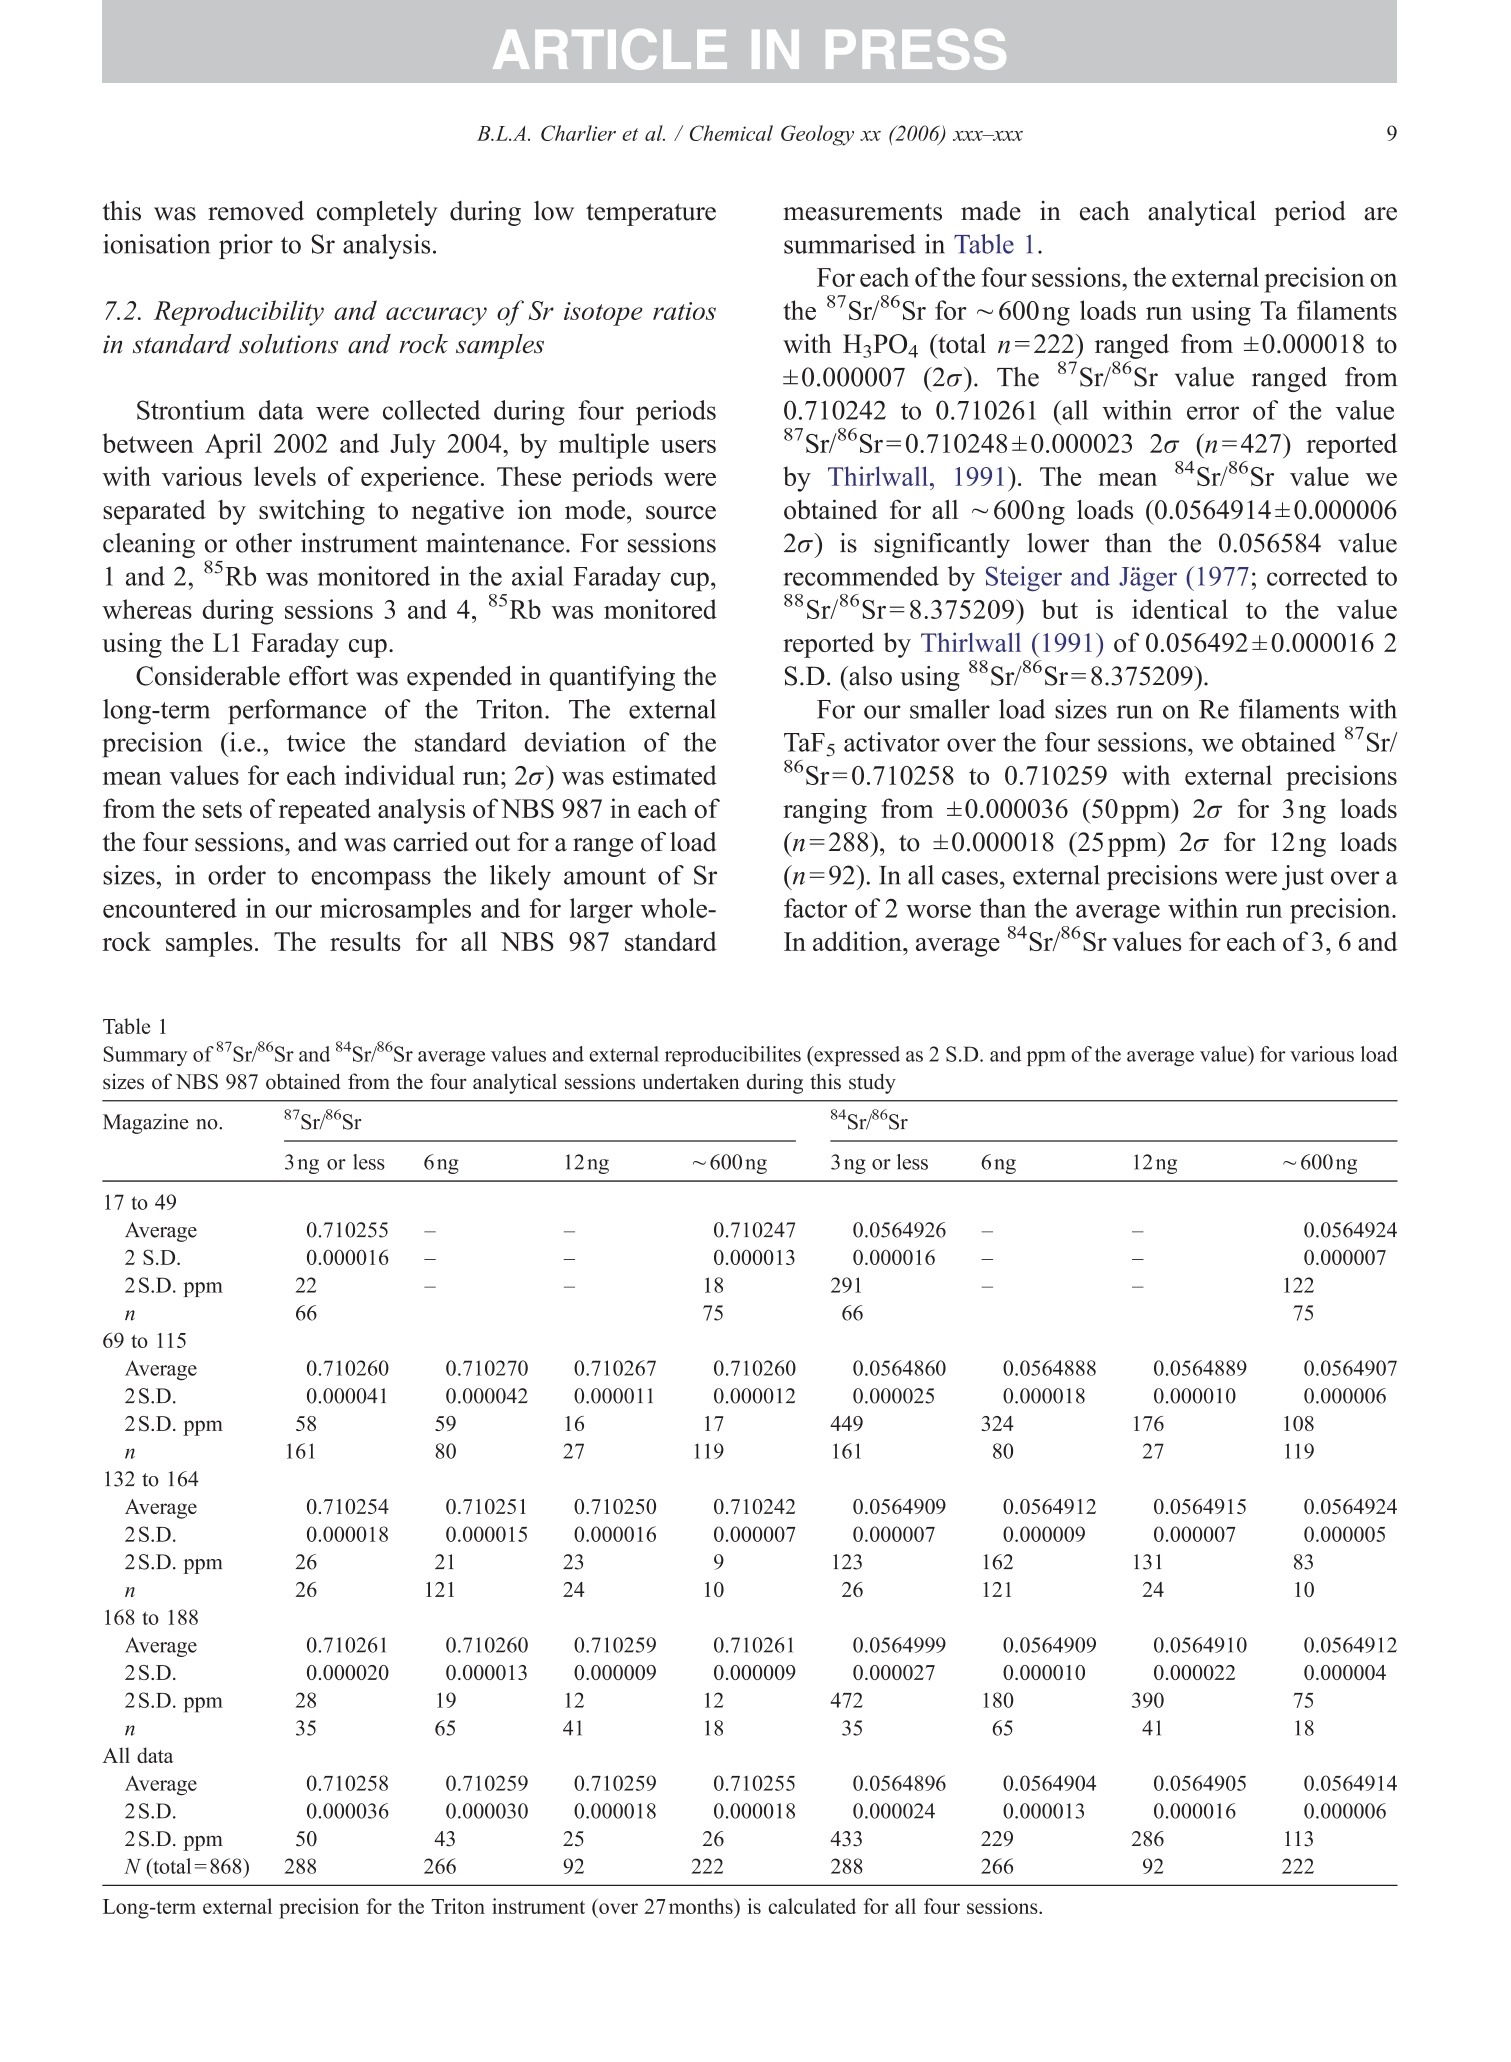
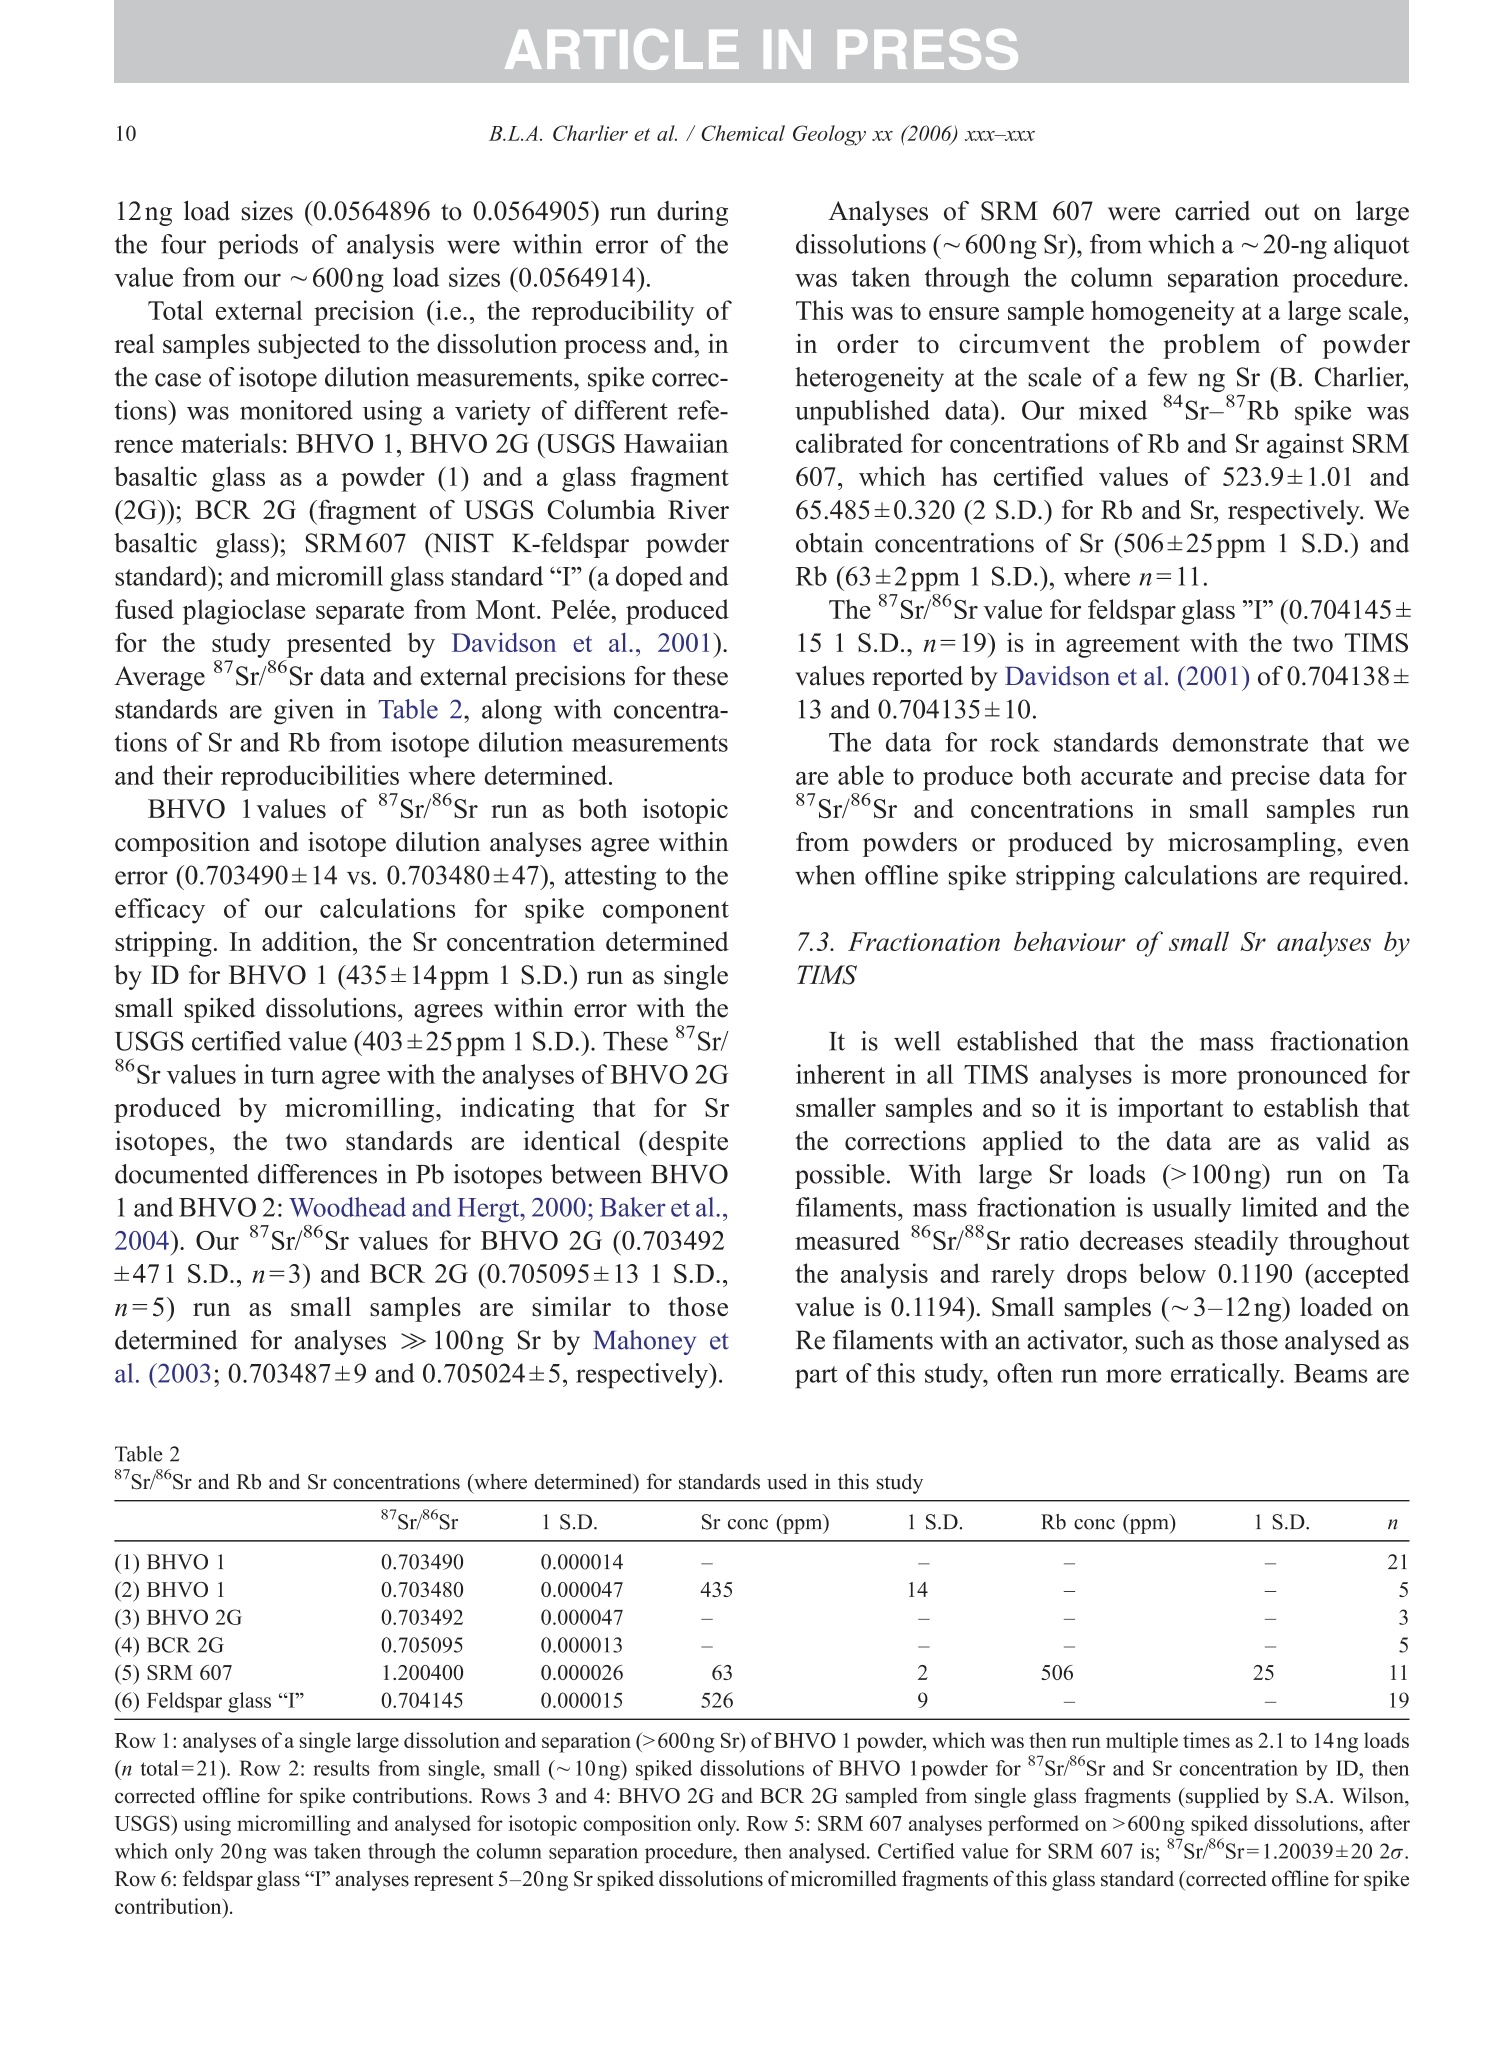
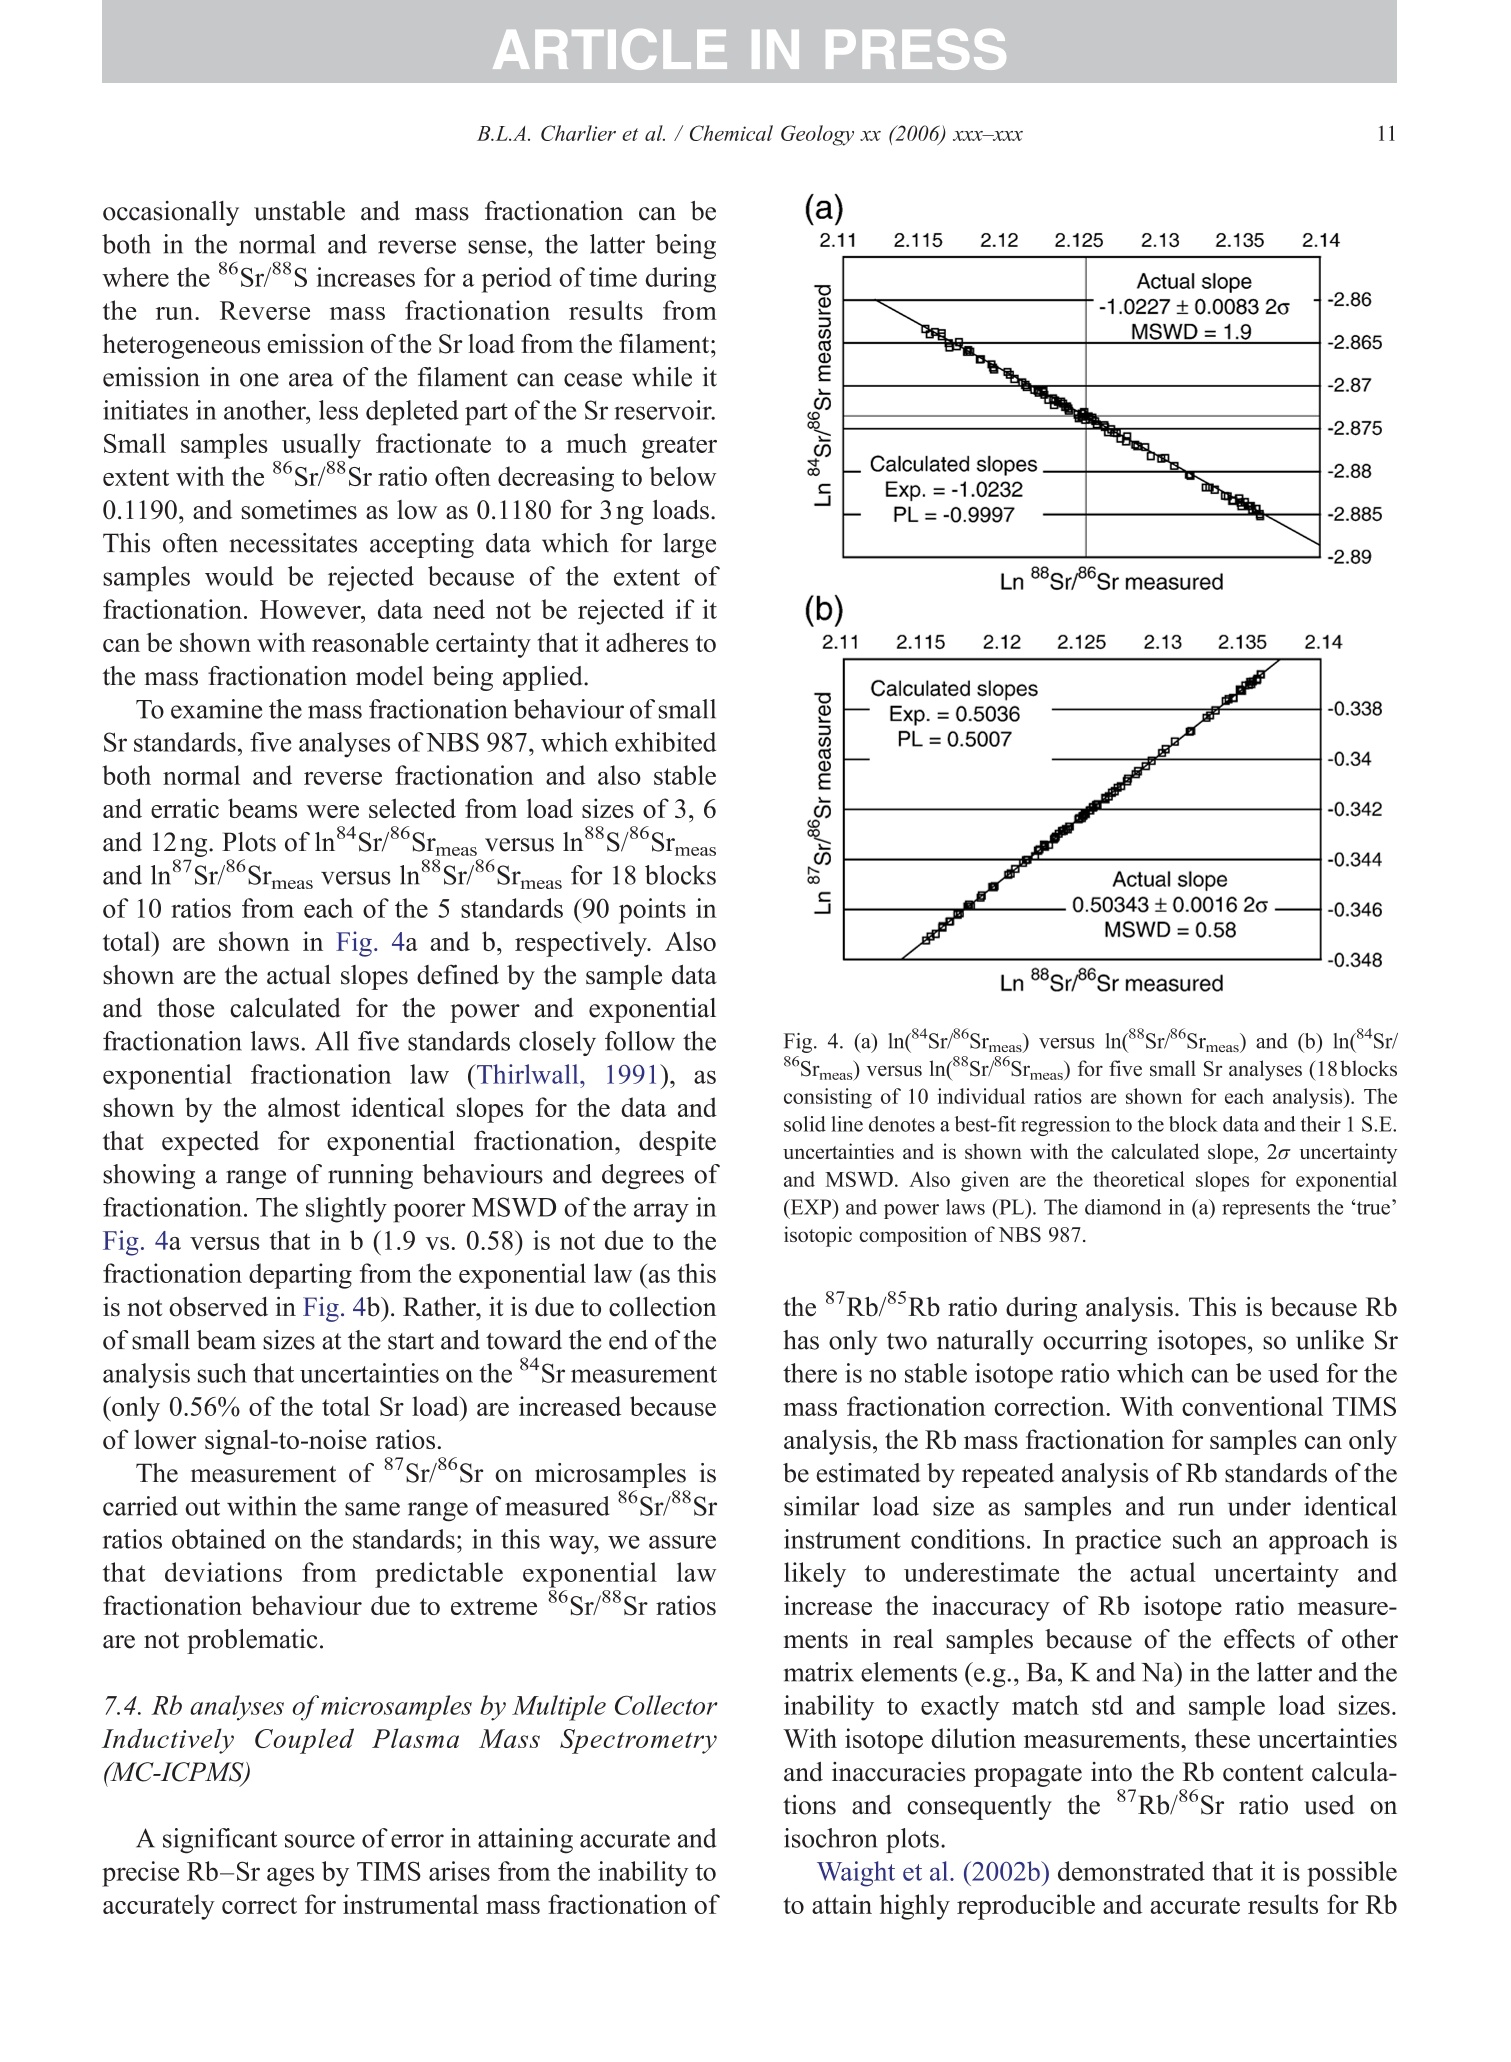
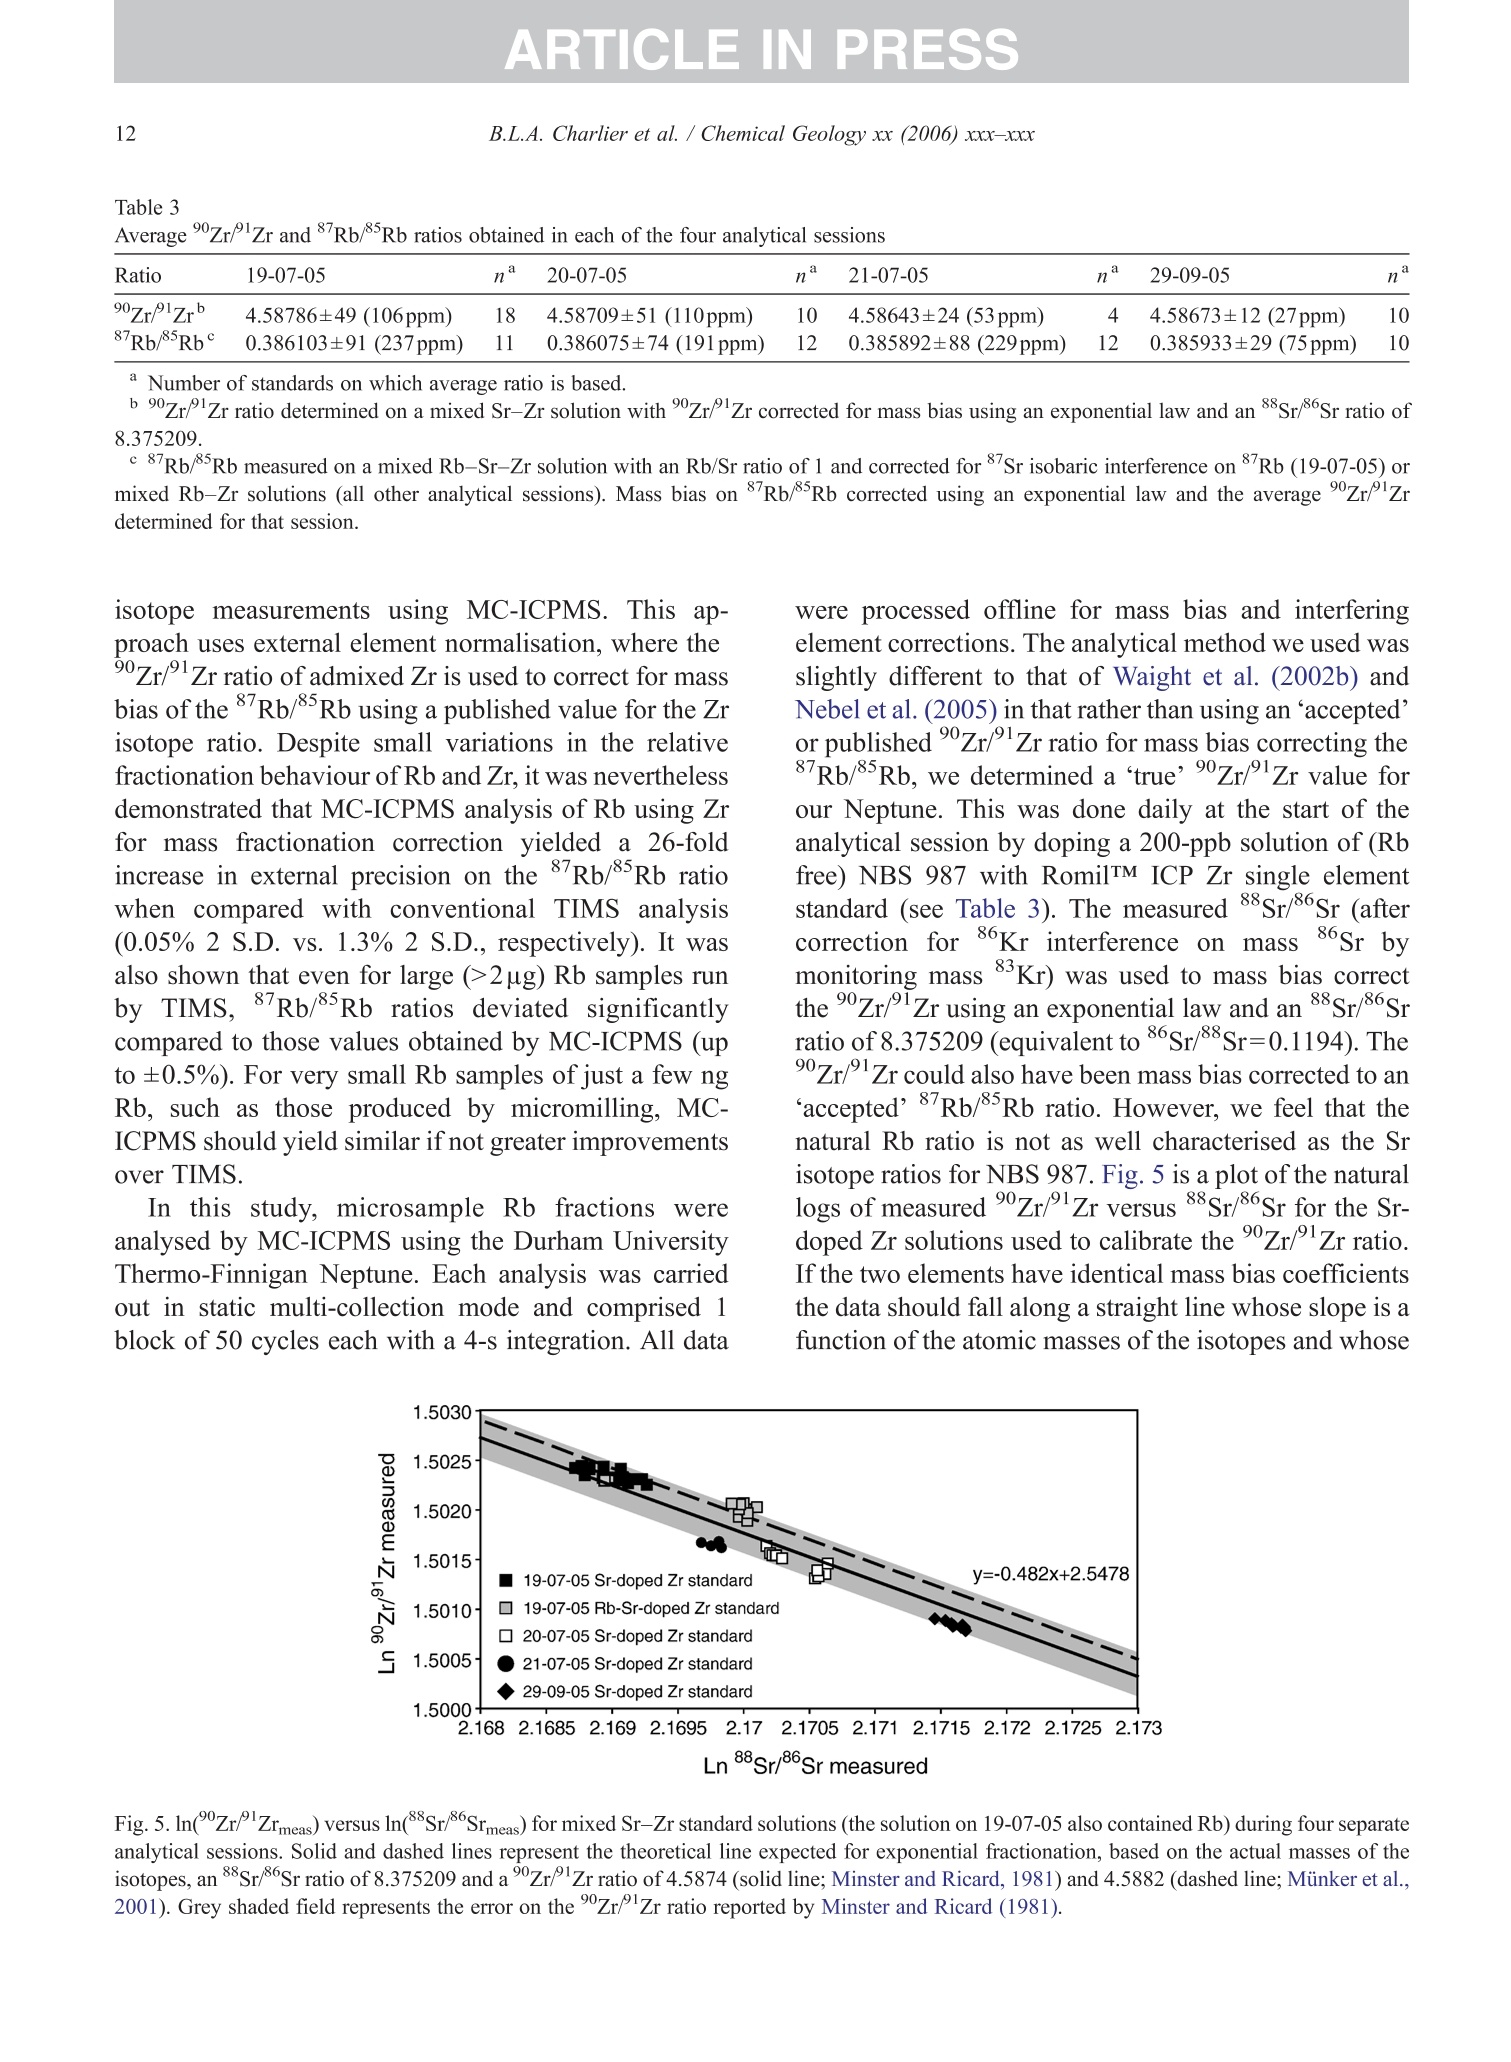
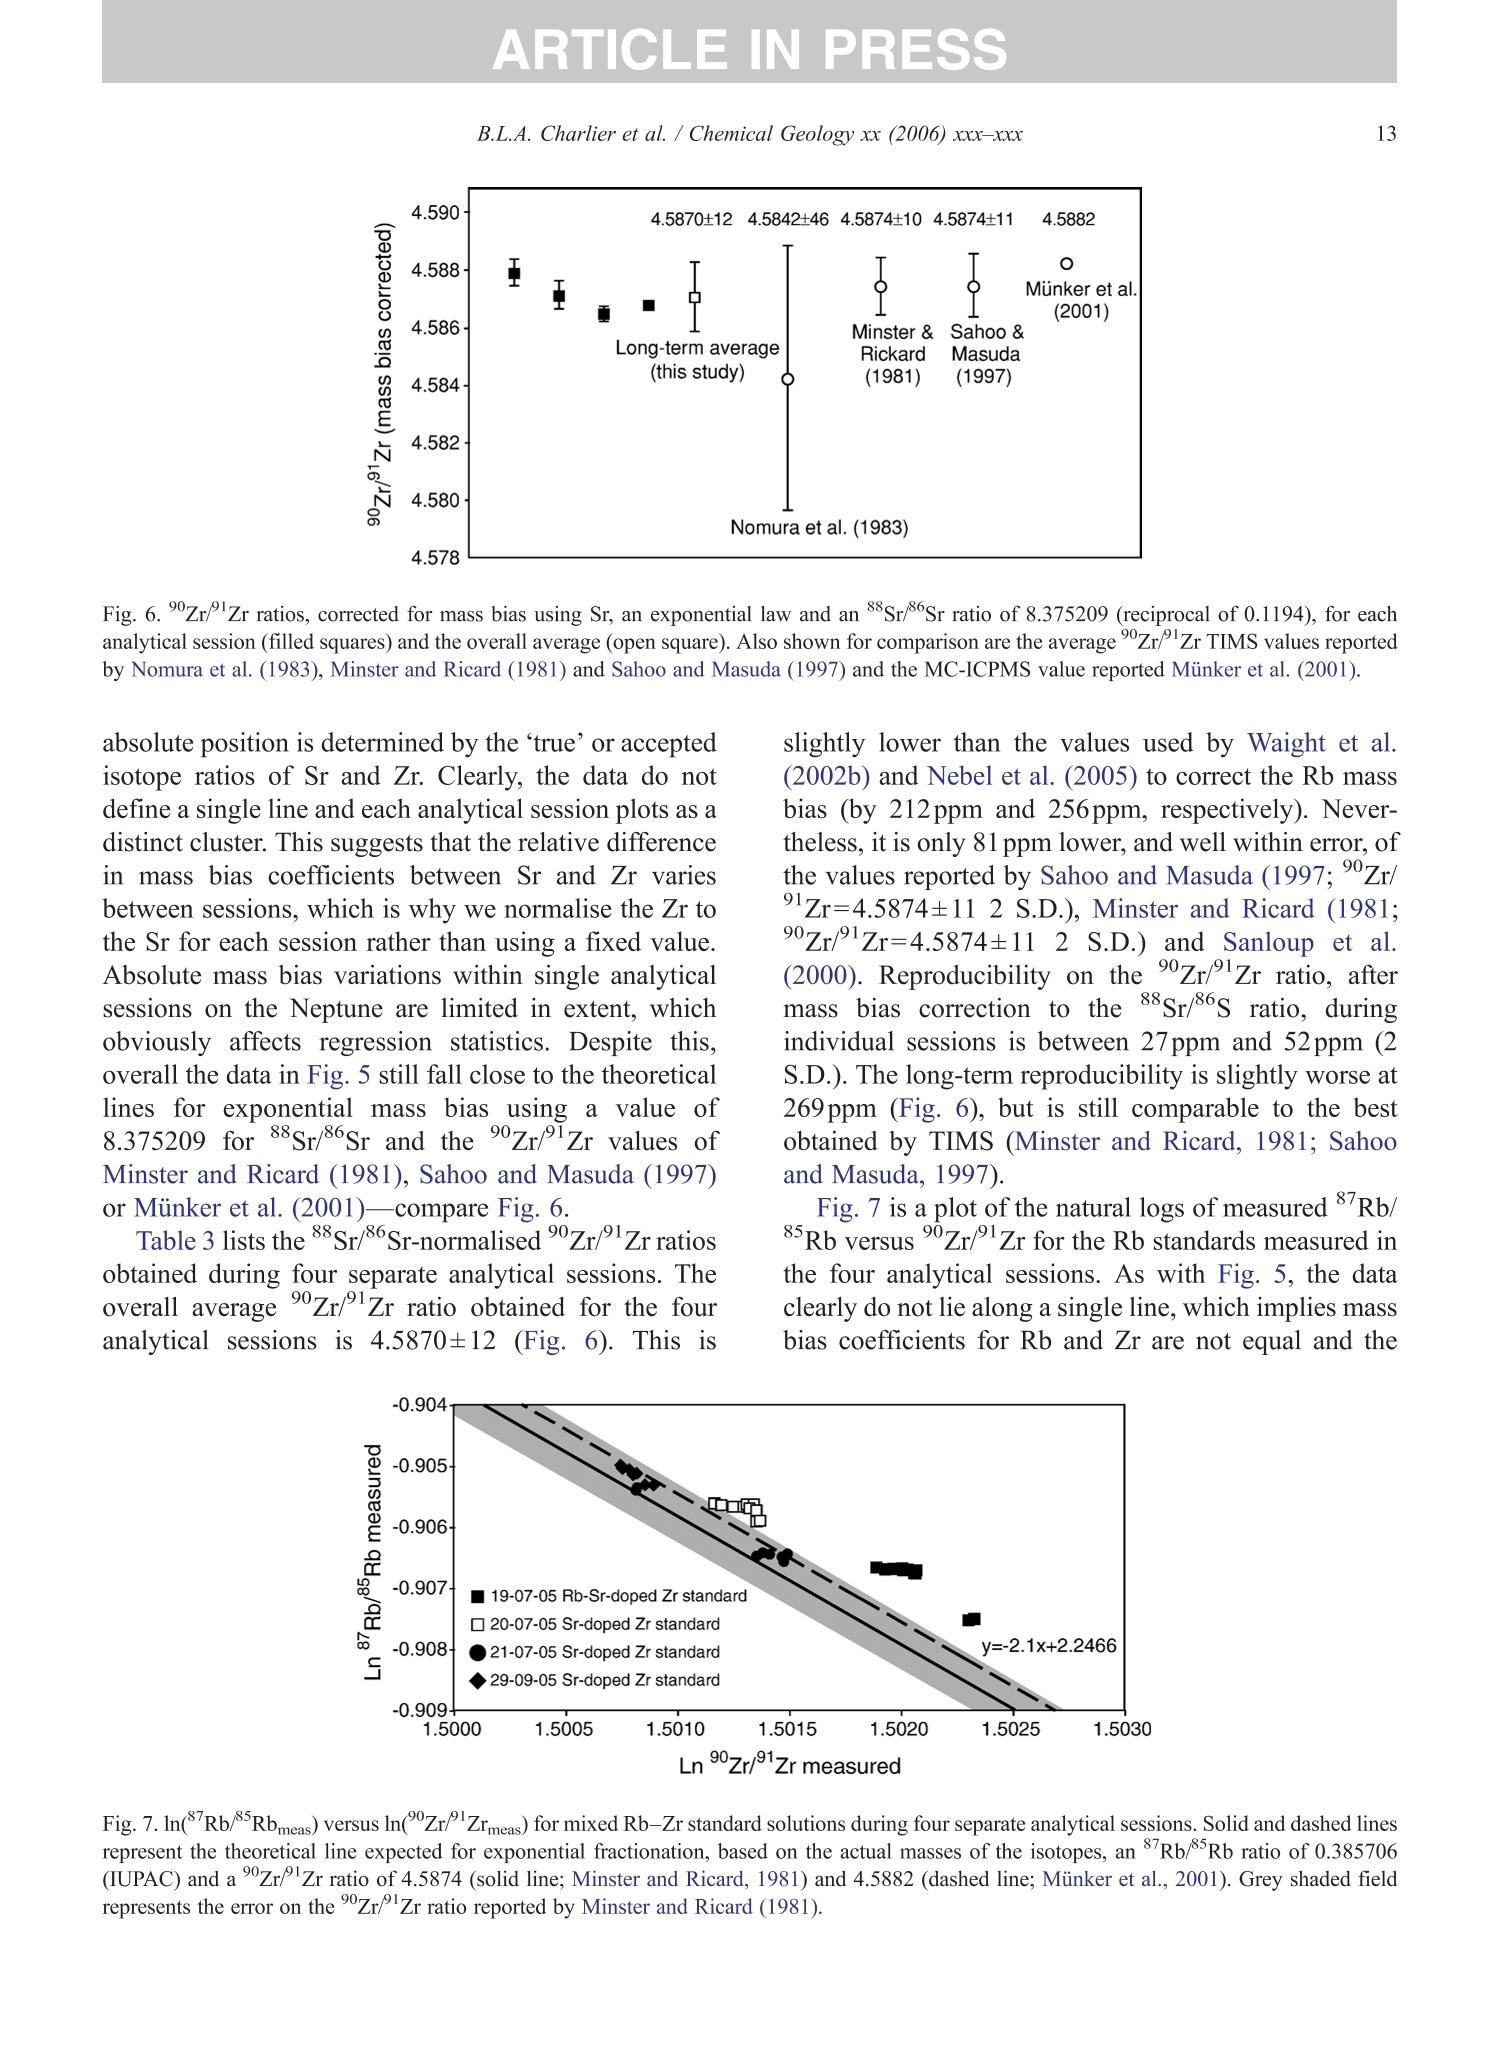
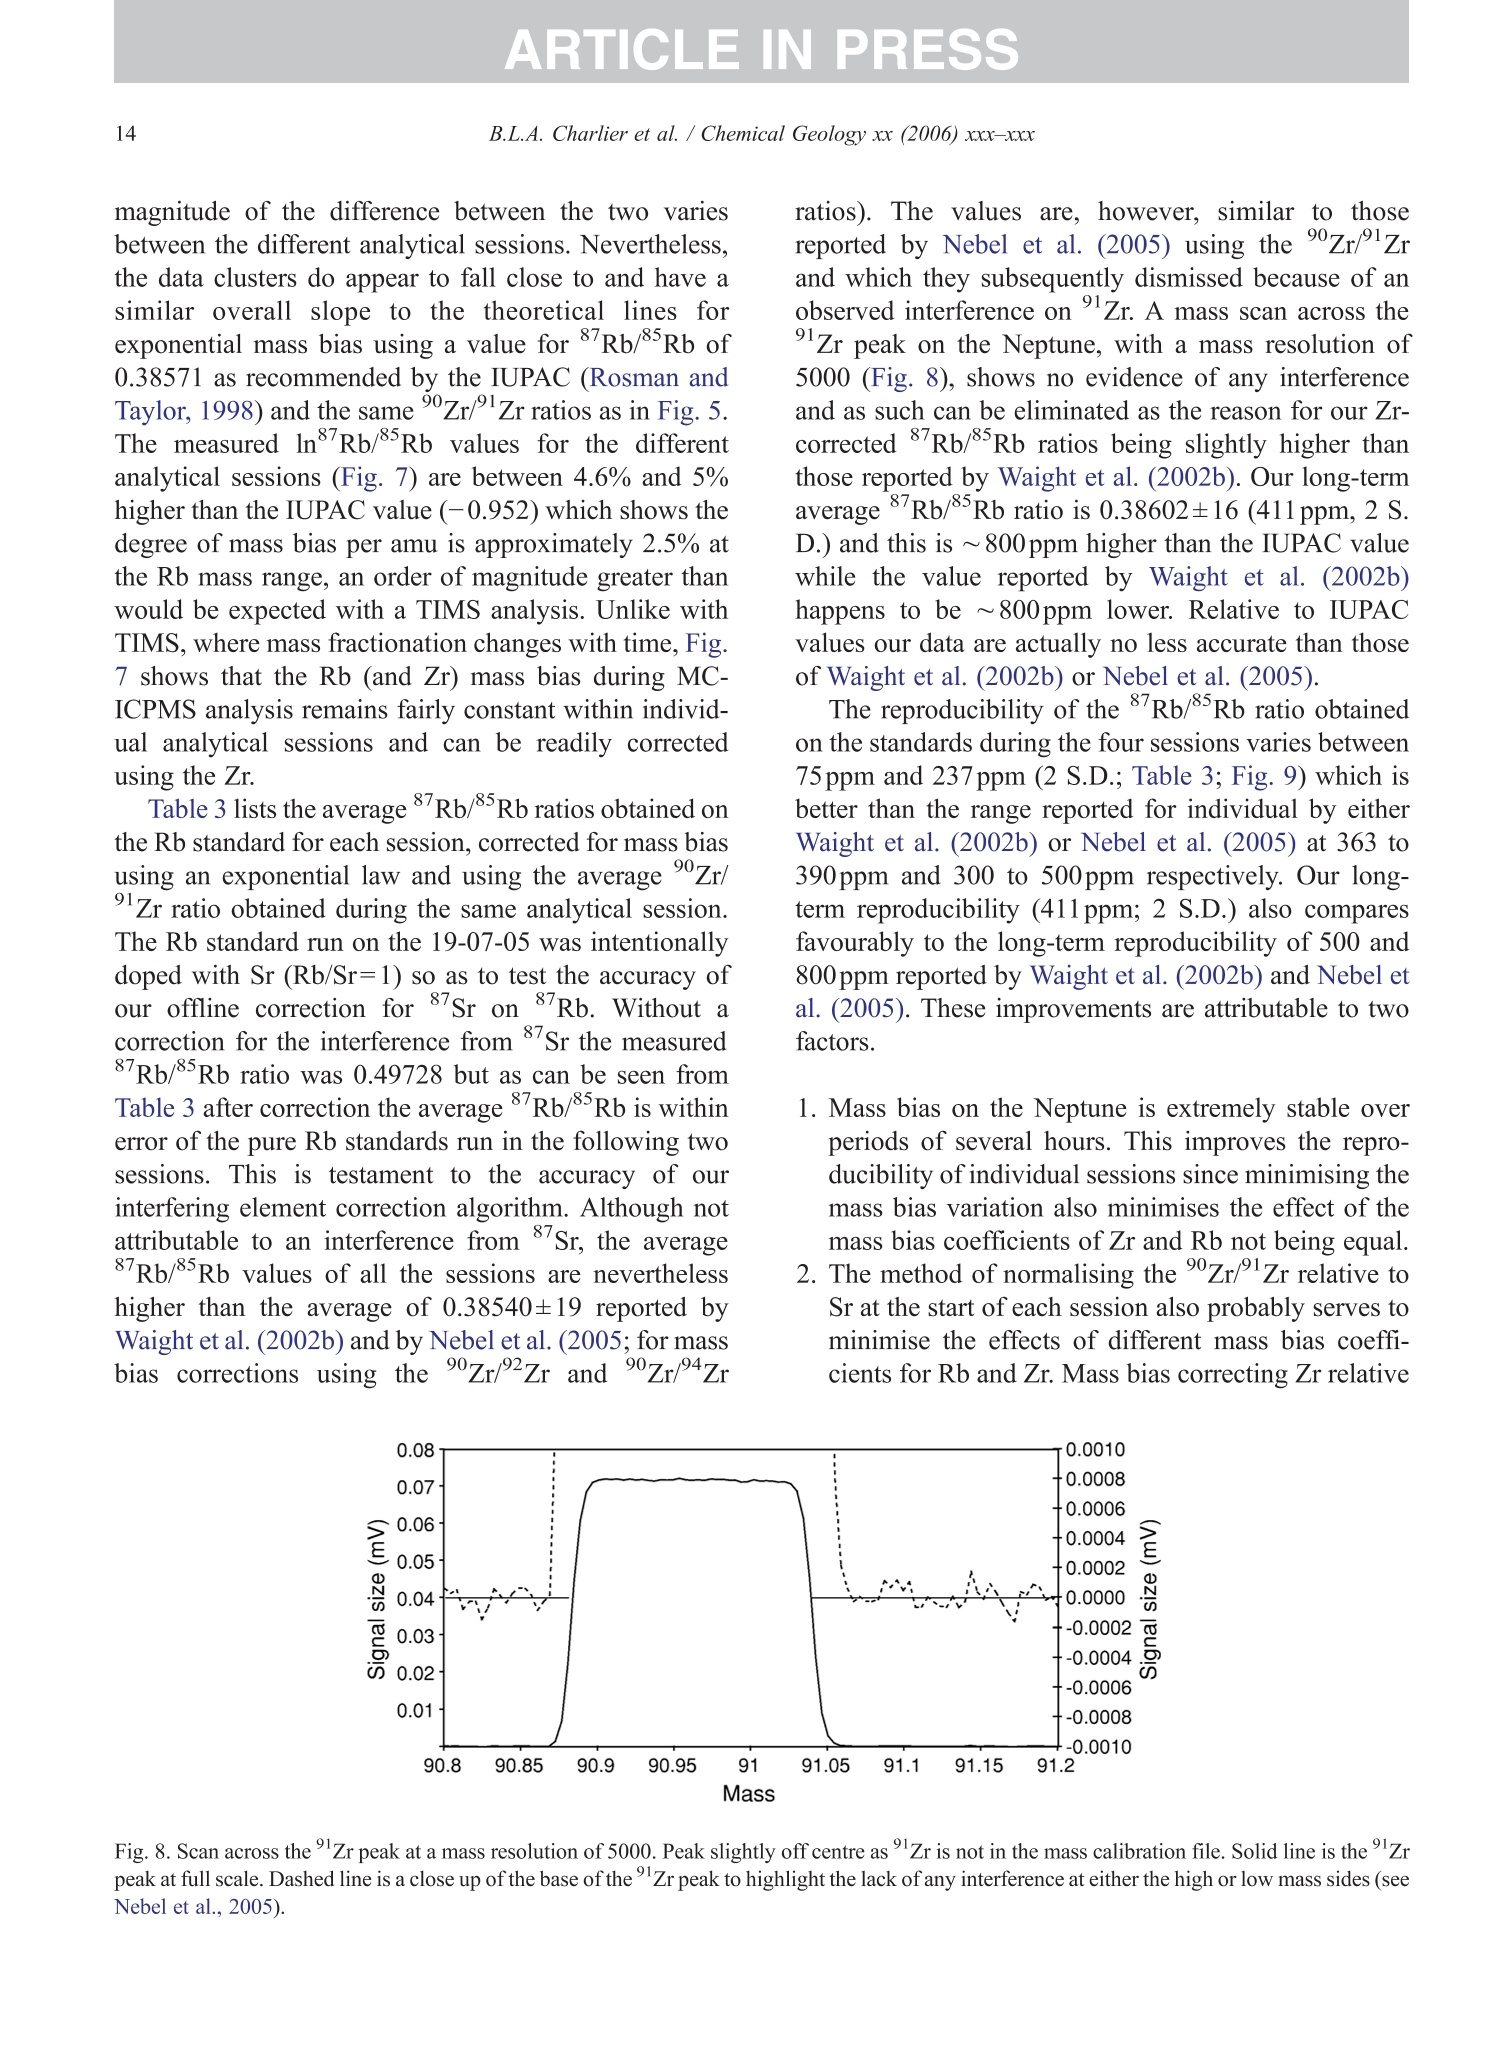
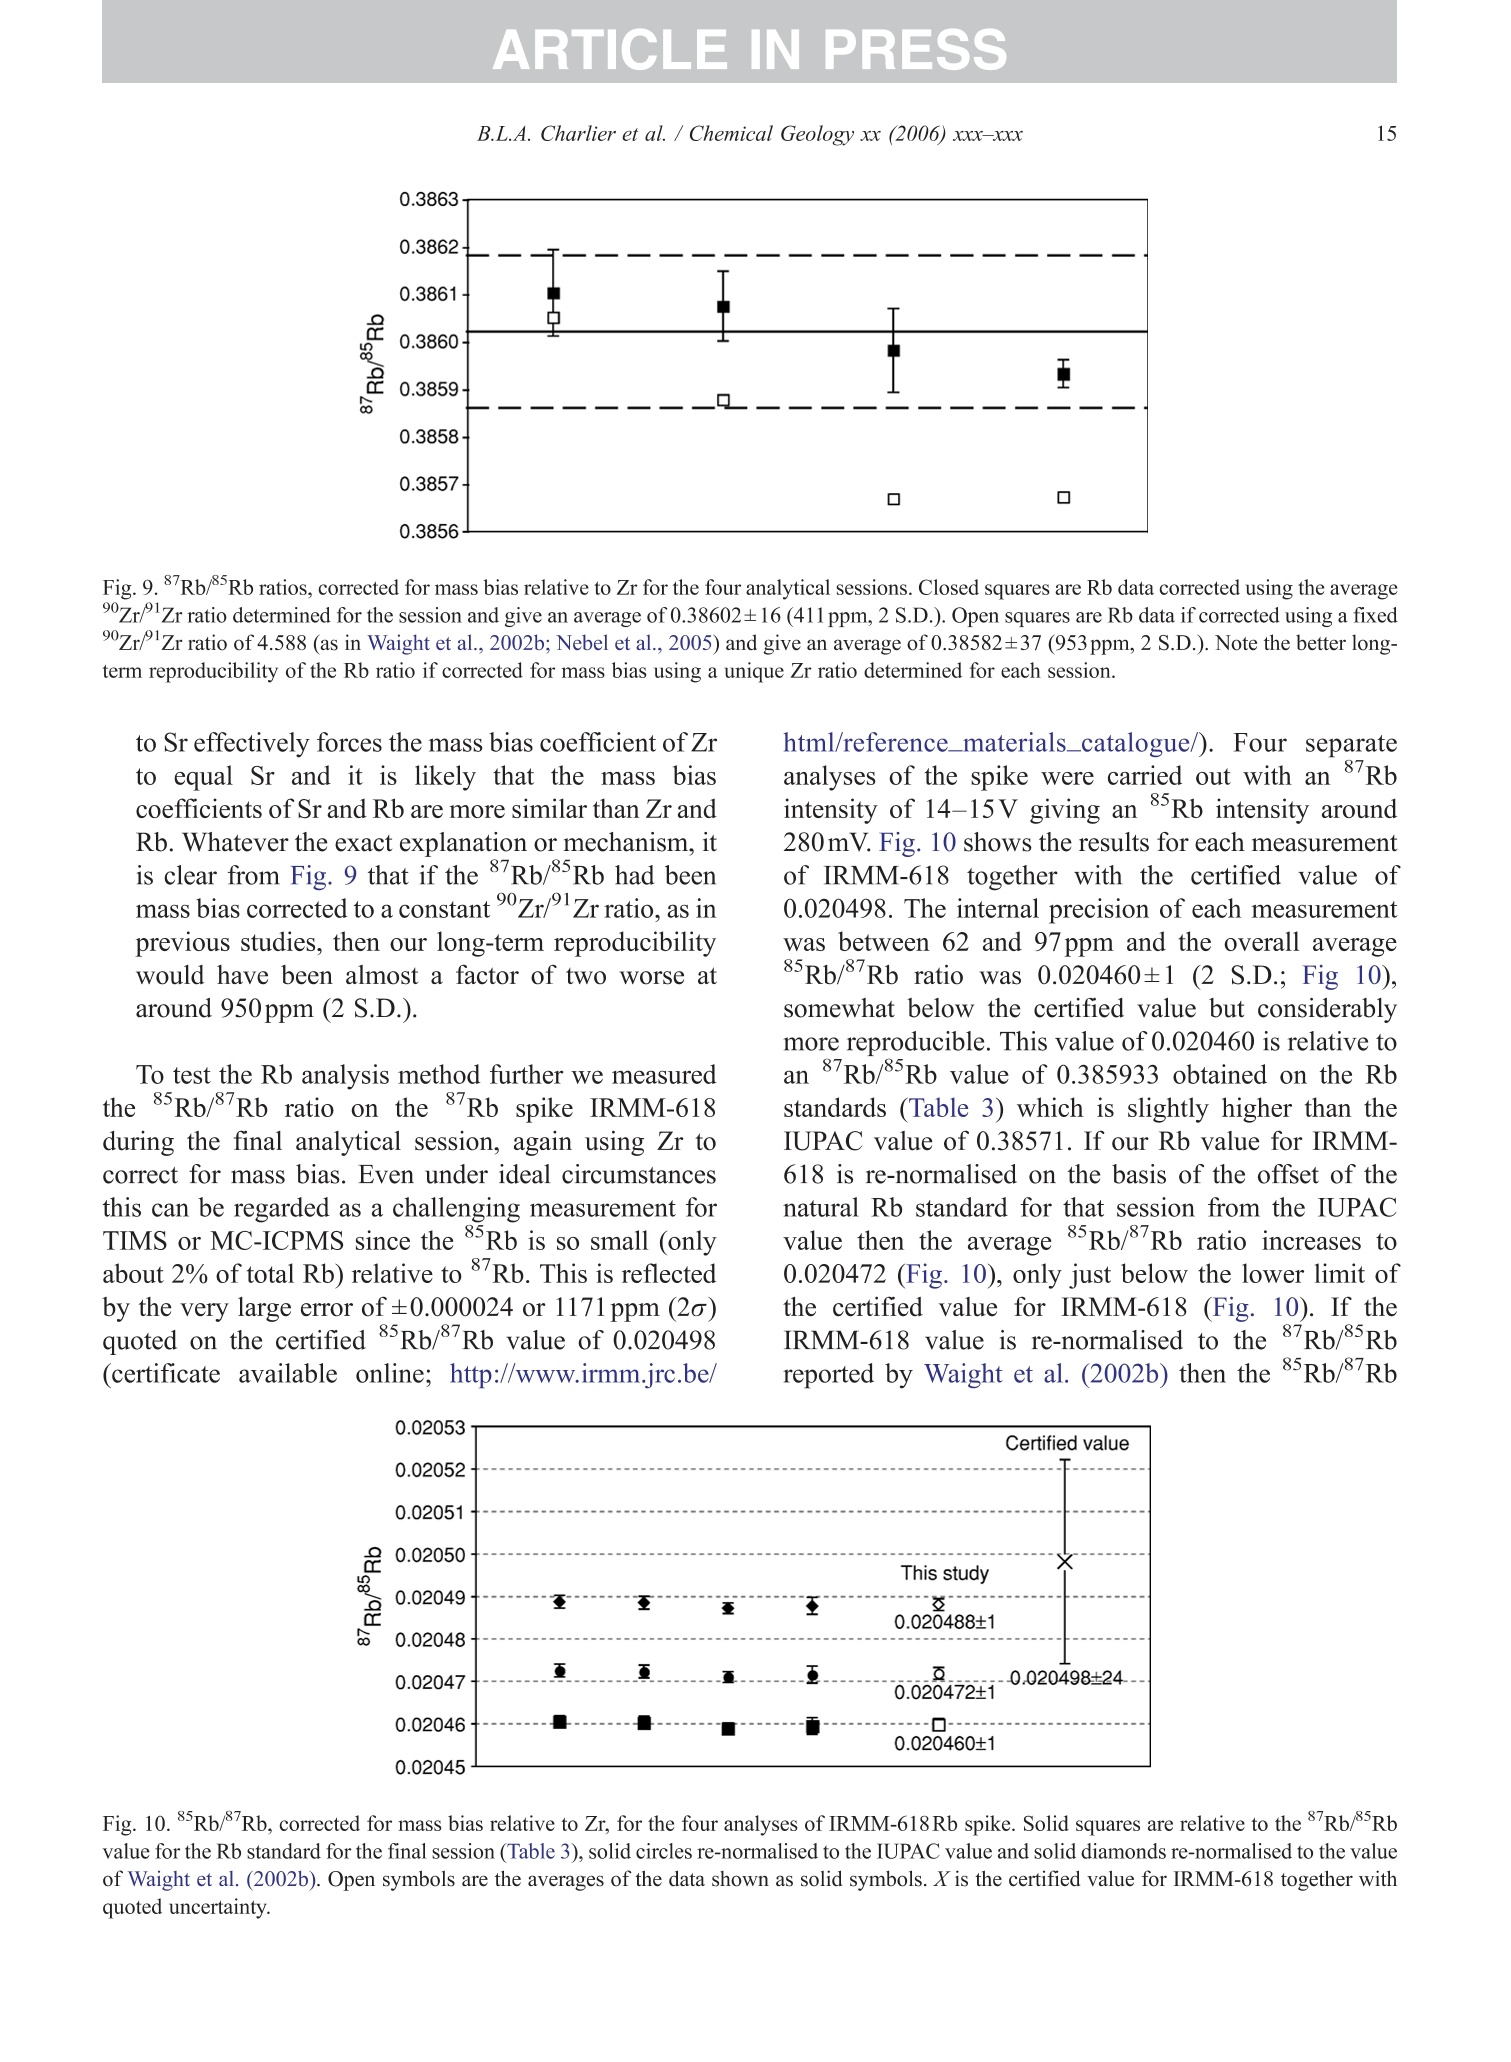
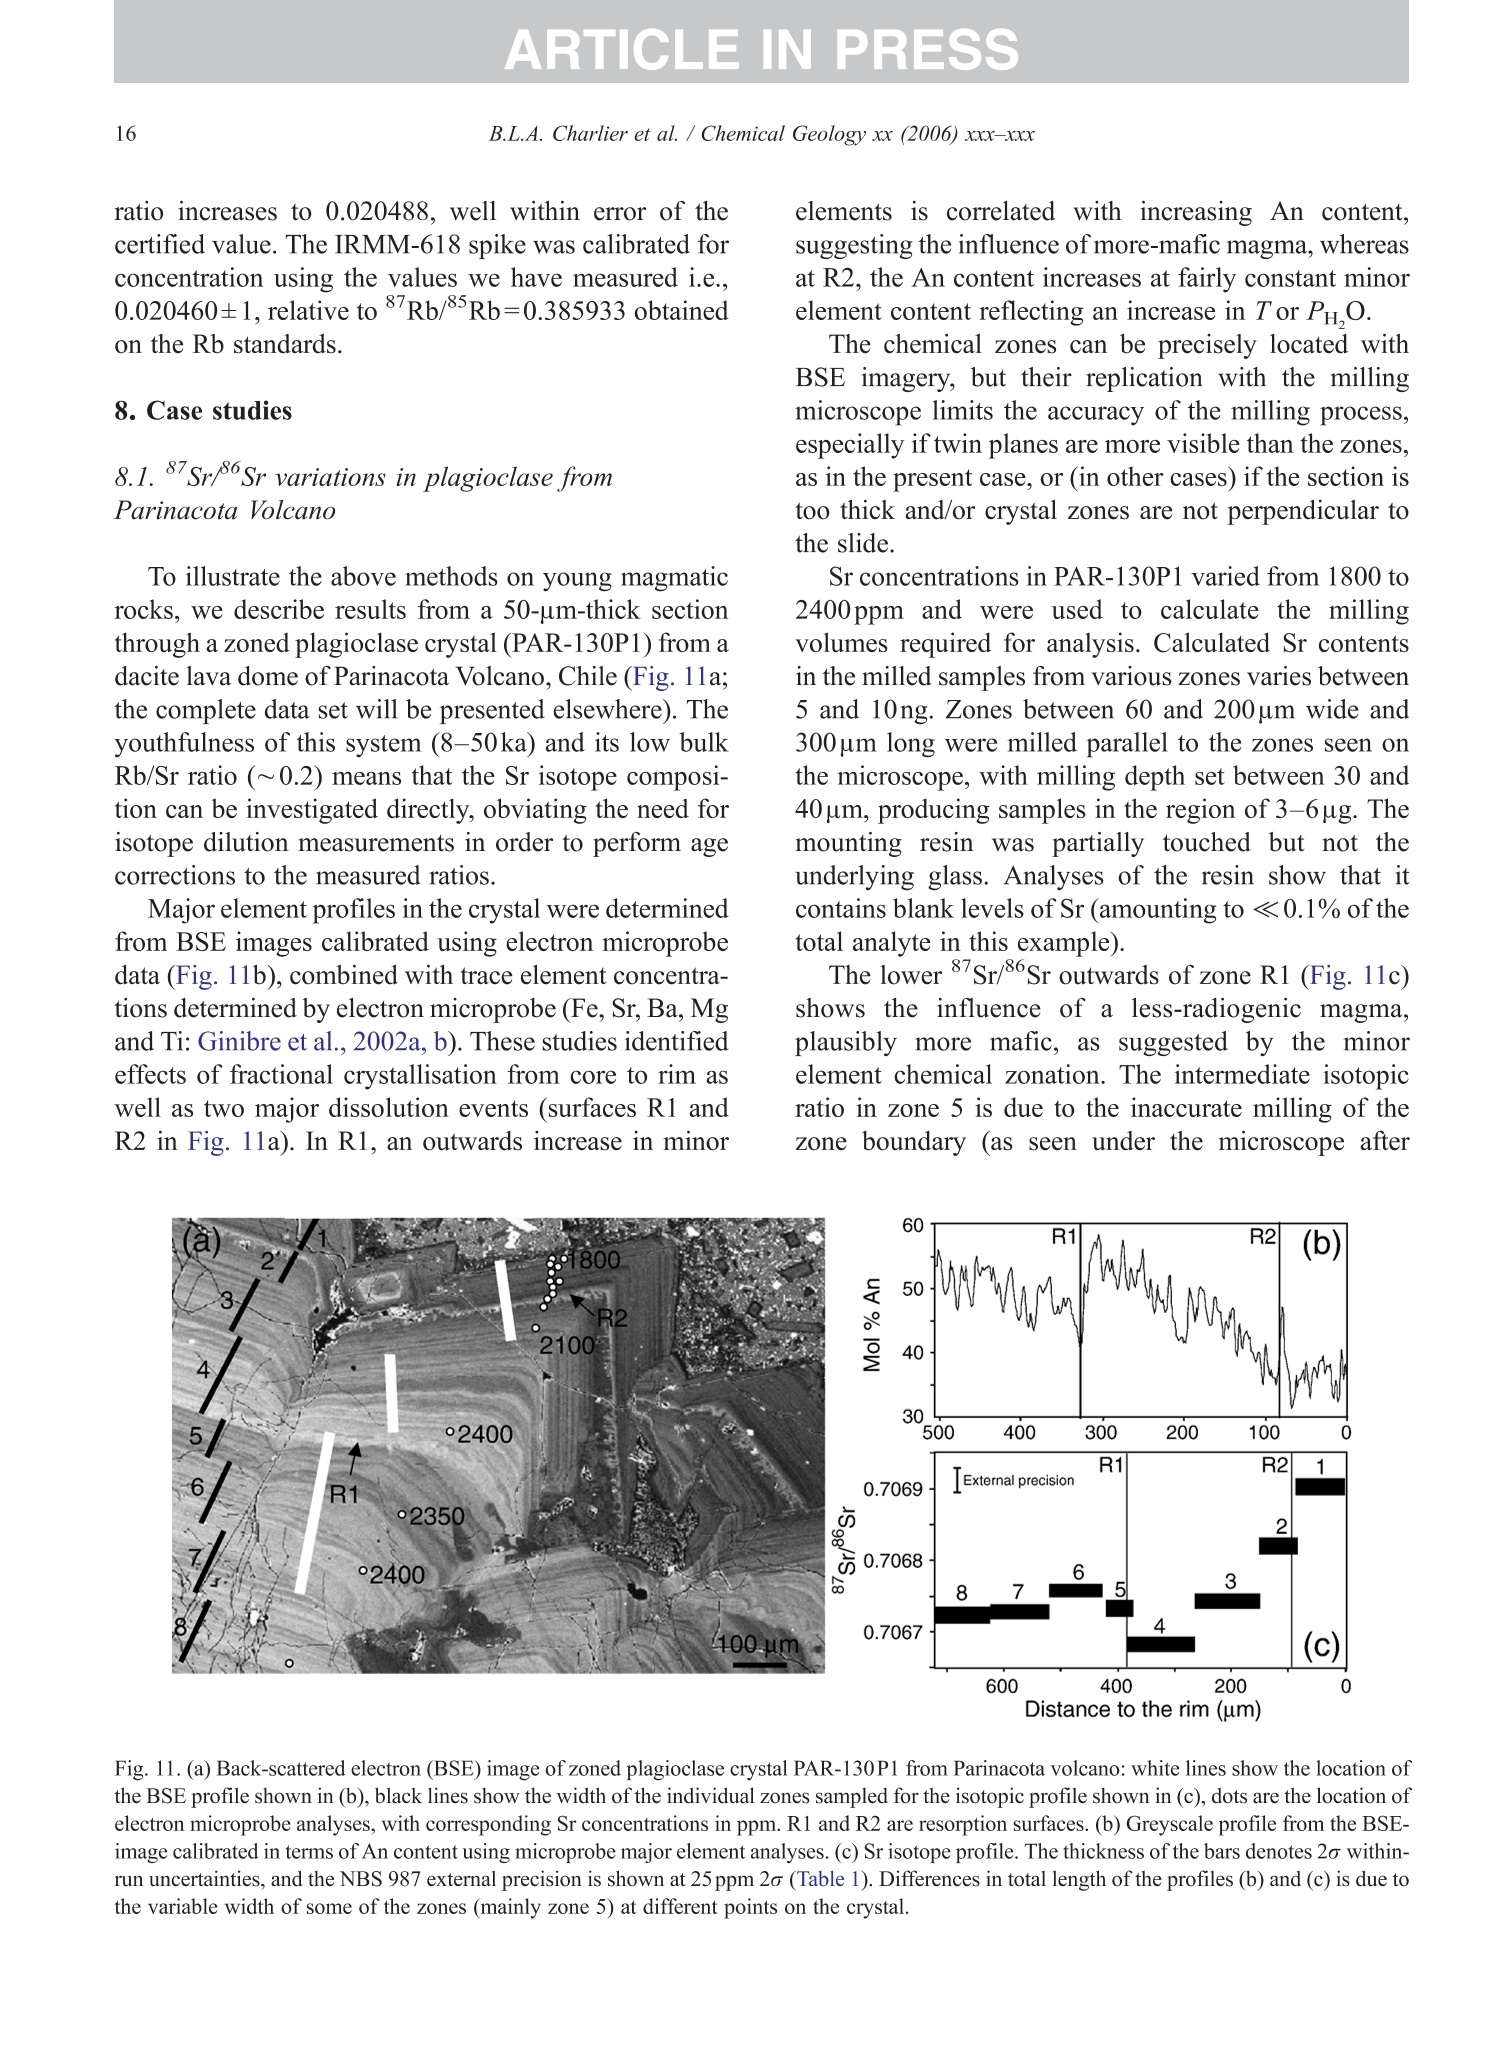
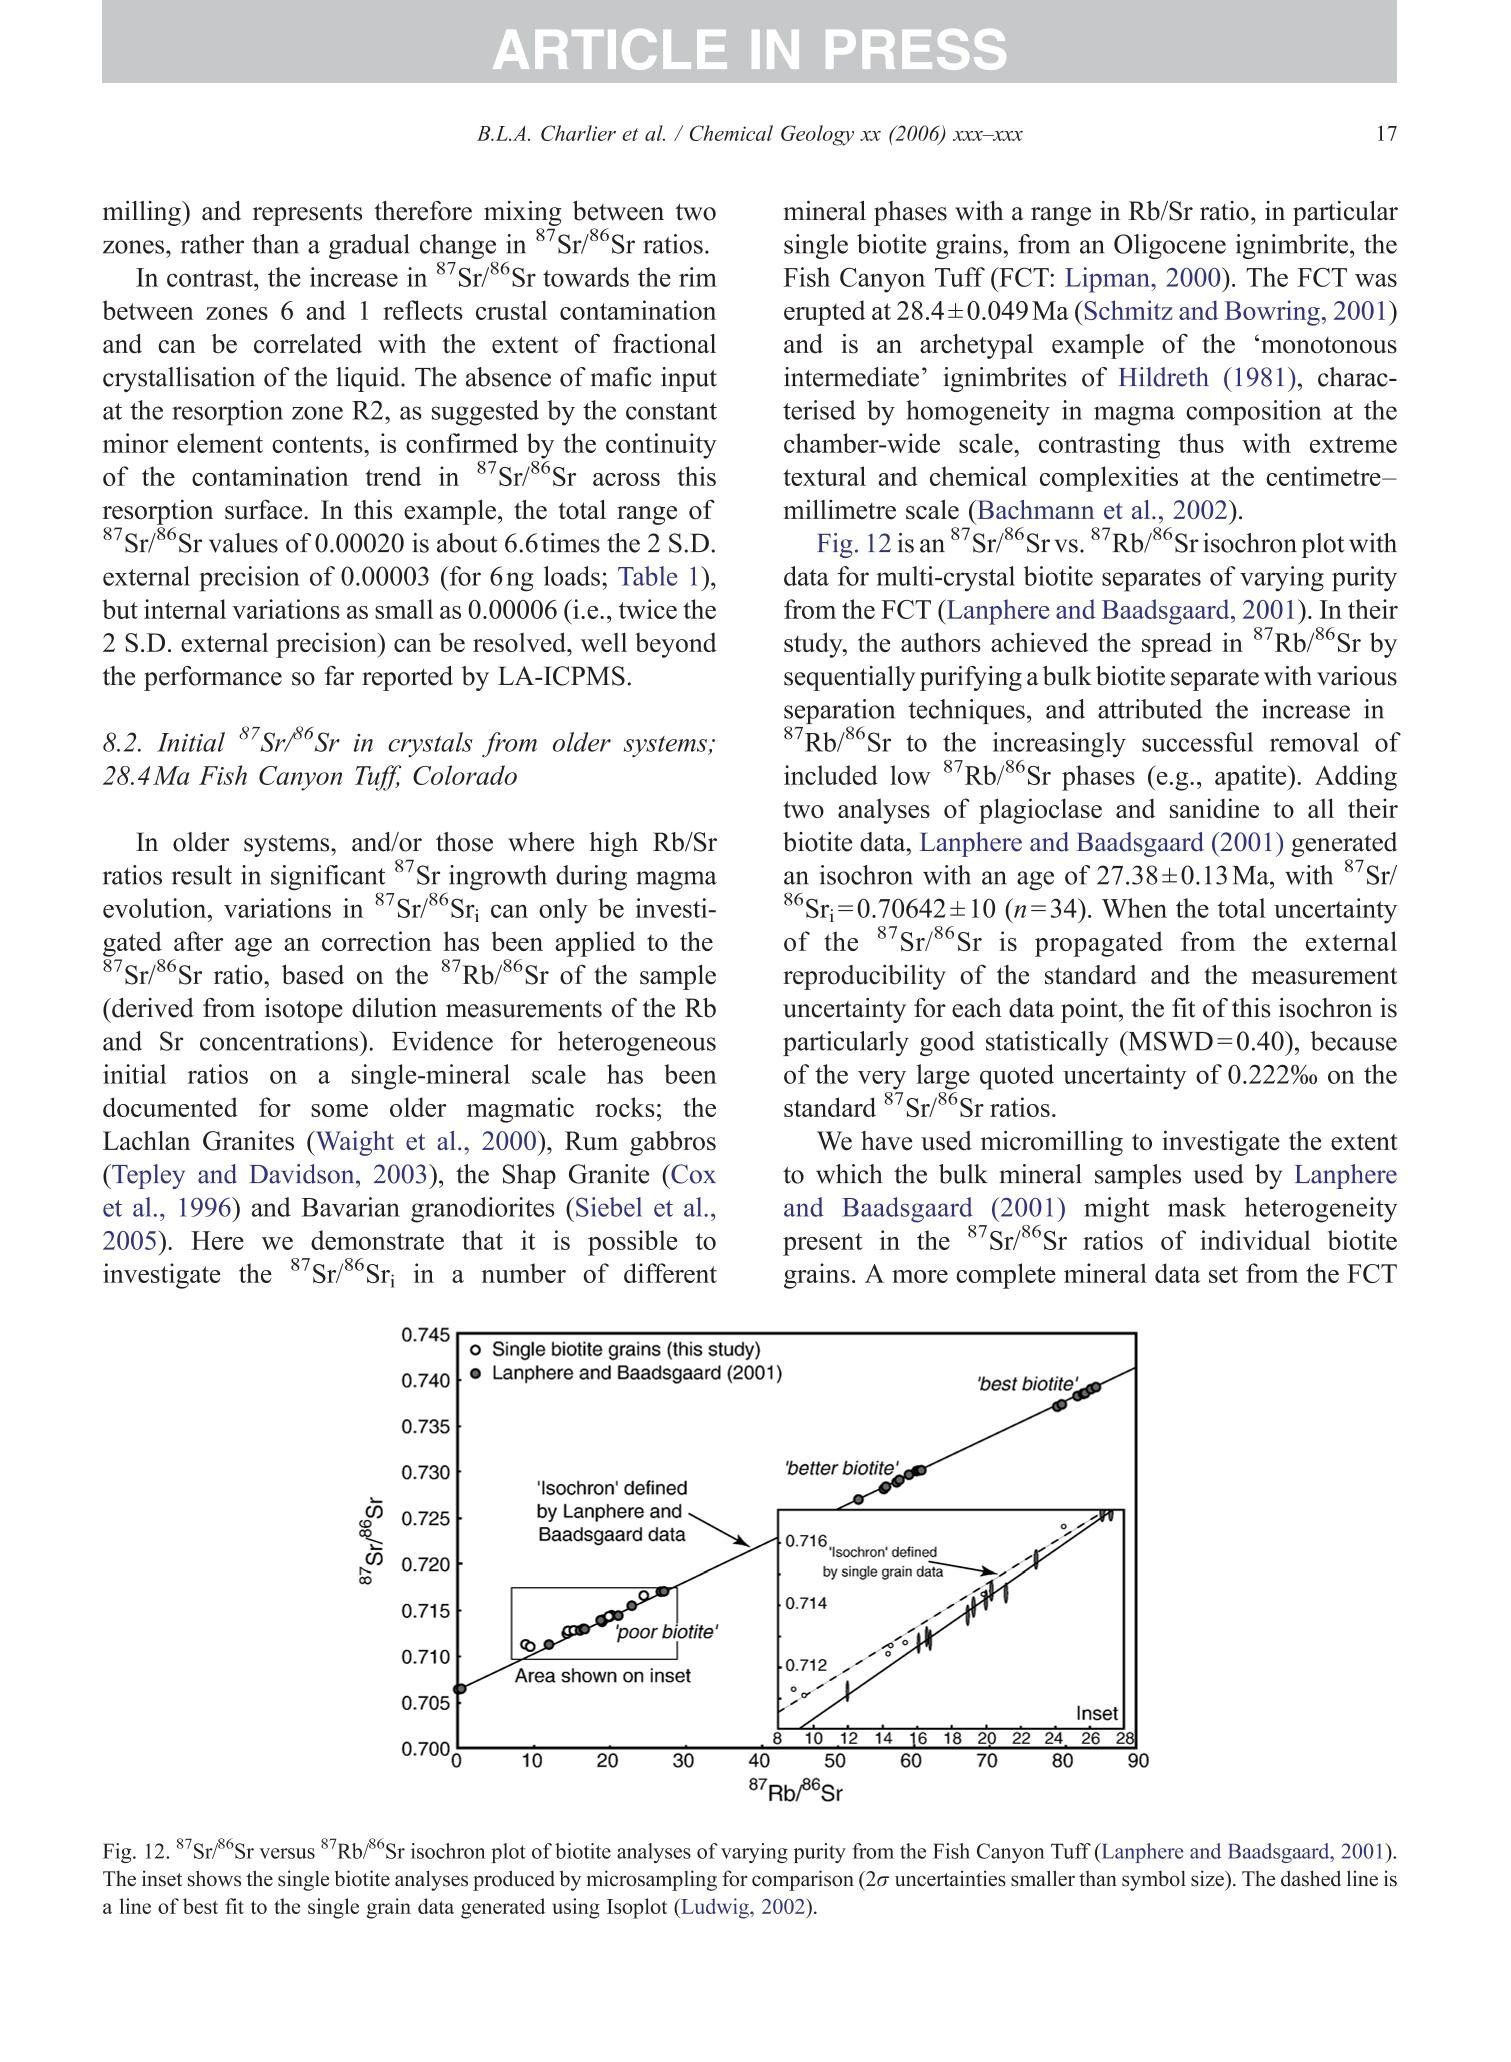
+MODELARTICLE IN PRESSChemical Geology xx (2006) xxx-xxx 2 ISOTOPE GEOSCIENCE www.elsevier.com/locate/chemgeo Methods for the microsampling and high-precision analysis ofstrontium and rubidium isotopes at single crystal scale forpetrological and geochronological applications B.L.A. Charlier a,b,*, C. Ginibre a,c, D. Morgan, G.M. Nowell, D.G. Pearson ,J.P. Davidson, C.J. Ottleye Department of Earth Sciences, University of Durham, South Road, Durham DH1 3LE, United Kingdom °Department of Earth Sciences, The Open University, Walton Hall, Milton Keynes MK7 6AA, United Kingdom° Section des Sciences de la Terre, Universite de Geneve, Rue des Maraichers 13, CH-1205 Geneve, Suisse, Switzerland Received 27 October 2005; received in revised form 13 January 2006; accepted 14 February 2006 Abstract Micromilling of single crystals to yield microgram-sized solid samples for subsequent isotopic analysis can yield importantpetrogenetic information from crystals (especially feldspars) in magmatic rocks. Exceptional detail can be gained because thetextural context of the sample area can be fully evaluated before milling. Such information is otherwise unknown or lost whenperforming analysis at the bulk rock scale. Here we present a comprehensive methodology for the precise analysis of ng-levelsof Rb and Sr purified from microgram-sized solid samples extracted from minerals in thin sections. Physical samplingtechniques are based around a computer numerical control (CNC) milling machine (MicromillTM), newly designed specificallyfor the sampling of complex accretionary and growth structures in crystalline materials. Chemical procedures for the isolation ofSr and Rb for TIMS and MC-ICPMS analysis, respectively, are presented, and the performance of these analytical techniques isassessed in the context of the small sample sizes produced by micromilling. Despite being time consuming, mechanicalsampling, conventional dissolution and chemical separation followed by analysis by TIMS remain the best methods for bothhighly accurate and precise determinations of Sr isotopic compositions in most geological materials over a wide range of Srconcentrations, Rb/Sr ratios and matrix types. Using these techniques, it is possible to achieve long-term 2 S.D. externalprecisions of 50ppm for load sizes as small as 3ng Sr. We demonstrate the validity of these techniques using two examples. Thefirst is from a <50ka single feldspar crystal from Parinacota volcano (Chile) to show that 87Sr/86Sr isotope ranges as small as0.00006 (2×2 S.D. external) can be resolved under conditions where radiogenic-Sr ingrowth can be neglected. The second isfrom the 28.4Ma Fish Canyon Tuff (Colorado) to demonstrate the utility of isotope dilution measurements of Rb and Srcontents to calculate Rb/86Sr and thus perform age corrections to the Sr/86Sr ratios in order to establish Sr/86Sr; variationsbetween single crystals or zones. We demonstrate that biotite crystals in the Fish Canyon Tuff show Sr-isotopic vvariations wellbeyond analytical errors and hence that the crystals involved were not in isotopic equilibrium and cannot be used to establish anisochron age. On the other hand, the precision of our isotope dilution measurements may be used to obtain Rb-Sr ( *Corresponding author. Department of Earth Sciences, T he Open U n iversity, Walton Hall, Milton Keynes MK7 6AA, United Kingdom. Tel.: +44 1908 652558; f ax: + 44 1908 655151. ) ( E- m ail address: b .l. a .charlier@o p en.ac.uk (B .L.A. Charlier). ) ( 0009-2541/$- s ee front matter O 20 06 Elsevier B.V. A l l r i ghts reserved. ) ( doi: 10.1016/j.chem ge o . 2006.02.015 ) ARTICLE IN PRESS B.L.A. Charlier et al./ Chemical Geology xx (2006) xxx-xxx geochronological information at the single crystal scale, provided that homogeneity in 87Sr/86Sr at the time of crystallisation canbe demonstrated. C2006 Elsevier B.V. All rights reserved. Keywords: Microsampling; Micromill; Sr isotopes; TIMS; Rb-Sr; Isotopic equilibrium As radiogenic isotope studies of igneous rocksbecome increasingly detailed, and the precision andaccuracy of analytical methods improve, it is becom-ing clear that isotopic heterogeneity is the rule ratherthan the exception among crystal components imagmatic rocks (e.g. Simonetti and Bell, 1993; Geistet al., 1988; Davidson and Tepley, 1997; Dav200idson etal., 2005a). Crystals act as recorders of the environ-ment in which they grow, and by accepting that crystalgrowth occurs over a finite period or periods, it ispossible to use the core-to-rim changes in crystalcomposition to determine environmental changes thatoccurred during crystal growth (e.g., Davidson et al.,1998). Processes such as crustal contamination andmagma recharge can, in principle, be identified in theisotopic composition of core-rim traverses of singlecrystals, provided the componentsinvolvedareisotopically distinct and tthe end-members canbeadequately characterised. Intra-crystal isotopic studies to date have focussedlargely on Sr in plagioclase and this contribution willemphasize this application, although the general meth-ods we describe here can be applied to other isotopesand other minerals. Plagioclase is a particularly obvioustarget for microsampling studies as it (1) is common inmany igneous rocks, (2) crystallises over a largetemperature range and will therefore have experienceda large proportion of the cooling/crystallisation historyof the magma(s) from which it grew, (3) has texturalfeatures such as zoning and resorption/overgrowth thatare easily identified and serve to guide microsamplingstrategies and (4) has high Sr abundances. In addition topetrogenetic information, Sr isotope variations at thesingle-grain scale can be used to extract usefulgeochronological information and this enables thelinking of ages with the textural or P-T evolution of asample (e.g., Muller et al.,2000). The decay ofRb toSr (half-life: 48.8Ga) can be utilized for the dating ofRb-bearing phases such as micas or potassium feldspars.The preferential uptake of Rb fractionates it from Sr,producing a range in the parent-daughter ratio andproviding the necessary variable amounts of ingrownSr necessary to construct isochrons. 2. Existing techniques for grain-specific Sr isotopes:laser ablation or micromill? et al., 2004), which also serves to maximise the intensityof the Sr beam. These issues have so far prevented theimplementation of an in situ Rb-Sr dating technique forminerals with high Rb/Sr ratios, such as micas in oldand/or highly evolved rocks. Thus, a successful methodology for in situ isotopicmicrosampling demands three important criteria: 1. Accurate, high-resolution spatially constrained re-covery of small sample volumes (this can, inprinciple be achieved by either laser ablation ormechanical extraction using a small high-precisionmill), 2. Accurately accounting for interferences and fractio-nations, and 3.Maximisation of the signal to noise ratio for Sr in themass spectrometer. When compared to LA-MC-ICPMS, Thermal Ioni-sation Mass Spectrometry (TIMS) remains the moresensitive analytical technique for small samples (~1 ngSr). Chemical separation and purification of the elementof interest enhances the flux of pure analyte ions into themass spectrometer and removes isobaric interferences,both of which help to ensure accuracy and precision ofthe measurements. However, this improvement can onlybe achieved by performing column chemistry onextracted samples, prior to using TIMS to measure theisotope ratio. Therefore, a combination of carefulmechanical microsampling, achievement of low blanks(in low pg range;<1% total Sr in the sample) andchemical isolation of Sr, followed by analysis by TIMS,although time-consuming, remains the best method forhighly accurate and precise determinations of Srisotopic compositions for small samples. In principle,these techniques can also be applied to a variety ofmineral species, not just feldspar, with a wide range in.Rb/Sr ratio. In this paper, we describe methods used in Sr isotopedeterminations for geochronological and petrologicalapplications within and among the crystals of magmaticrocks using the microsampling and TIMS techniques.We describe in Section 3 the use of the MerchantekMicromillTM for the precise extraction of small samplesfrom texturally controlled sample locations. We thendetail in Section 4 the low-blank chemical separation ofSr and Rb. Section 5 details the extra steps necessary forisotope dilution measurements in small samples, andSection 6 describes the production of a high-purity TaFsactivator necessary for analysis of small Sr samples byTIMS. Section 7 deals with the TIMS and MC-ICPMSanalytical techniques necessary for the determination of Sr and Rb isotopic compositions, respectively, and theperformance of the Thermo-Finnigan Triton TIMS andNeptune MC-ICPMS instruments for the analysis ofsmall samples is evaluated. Finally, in Section 8, wepresent microsampling data for two case studies. 3. Sampling techniques 3.1. Microsampling Although mechanical devices for the extraction ofsmall samples from petrographic thin sections forchemical and/or isotopic analysis have been in existencefor a number of years (e.g., Rickwood, 1977), theMicromillTM manufactured by New WaveTM representsa significant technical advance in this area. It consists offour main components (Fig. 1a): 1. A binocular zoom microscope. 2. A high torque DC milling chuck with adjustablespeed using tungsten carbide or diamond-tippedmilling bits. 3. An X-Y stage, with movements reproducible tc±1 um. Movement in the Z (vertical) direction isaccommodated via movement in the microscopehead/mill assembly, also reproducible to ±1 um. 4. A computer workstation running custom designedsoftware which integrates the stage, mill andmicroscope optics. Crystals chosen for analysis are either mounted withappropriate orientation in epoxy blocks which are thencut andpolished, or a favourably oriented crystal in a ca.100 um polished thick section is chosen. Ideally, crystalsare oriented with their long axes parallel to the plane ofsectioning, providing a large-area section through thecore of the crystal..1. Prior to microsampling, any electron probe or SEMimaging of the sample must be carried out since themicromilling technique is destructive. Such preparationis important for making decisions on sample localities(e.g., such that inclusions or cracks can be avoided, orzones of particular interest can be sampled). If possible,information on the Sr content at the sample sites,obtained by LA-ICPMS or electron microprobe, allowsthe user to predetermine the sample volume needed foreach zone to be milled. In the case of plagioclasefeldspar it has been shown that Sr isotopic variationoccurs across major dissolution surfaces (Tepley et al.,1999; Davidson et al., 2001), and it is therefore possibleto design a sampling strategy which targets individualclearly defined zones. This commonly is accomplished Fig. 1. (a) The various component parts of the New Wave InstrumentsTM MicromillTM. The X-Y offset is the distance moved by the sample stagebetween the optical axis of the microscope (and the view from the video camera) and the milling position. (b) Milling of the sample surface takingplace within the droplet of Milli-Q water, constrained by the lab film. (c) Transferal of the sample slurry from the sample surface directly to thedigestion vessel using a micropipette. by the milling of narrow, relatively shallow zone-parallel lines of overlapping holes of a length sufficientto return ~3ng of Sr. 3.2. Milling samples from thick sections Tungsten carbide mill bits are used for millingsamples from thick (~100um) sections (Fig. 2a).Because the geometry of each mill bit is slightlydifferent, the actual volume of the milled cone (Fig. 2b)for a given milling depth varies between bits. Therefore,accurate calibration of the milled depth and thegeometry of the resulting hole is carried out for eachbit separately, by milling a small grid of holes ofincreasing depth on a blank test slide. Bits are numberedthen cleaned again before the actual milling of samples.Loss of material from the milling bit to change itsgeometry is considered negligible during the samplingprocess. Before accurate sampling can begin, a number ofparameters must first be determined or selected usingthe instrument software. These include the mill tiplocation, sample surface position, offset between themill axis and the optical axis of the microscope (XYoffset) and the milling depth. After these initial cali- brations, before initial milling, and between each epi-sode of milling on individual zones, the sample isremoved from the sample plate, cleaned in Milli-Q waterin an ultrasonic bath and the mill bit cleaned in anultrasonic bath in ethanol. The polished sample is loadedback onto the sample plate and, using the MicromillTMsoftware, a course for the mill is plotted on screen usingthe software. The user has the option to select a numberof sampling parameters such as the depth of milling, thespacing of points, line scans or rasters, mill speed andline scan/raster rate. Unlike earlier studies where singlelarge, deep holes were milled to recover samples (e.g.,Davidson et al., 1998; Waight et al., 2000; Siebel et al.,2005), using the MicromillTM it is possible to mill outmultiple shallow points along particular zones ofinterest. This has the added advantage that spatialprecision is increased (i.e., the likelihood of millingunwanted zones in the Z direction is minimized), whilstadequate amounts of sample are still generated.Decisions on the number of points to be milled aremade by reference to a-priori knowledge of the Srconcentration in the sample, the geometry of the millingbits and the depth of milling, calculated on the basis thatapproximately 3ng of Sr is required for high-precisionanalysis (Fig. 2c). (a) (c) Fig.2. (a) The geometry of the bits used by the MicromillTM to produceconical holes. The angle of the conical tip is 30°.(b) The volume of thecone of material that is produced by micromilling is calculated usingnrh. (c) Lognormal plot relating the mass of Sr retrieved from thesample (in ng) (assuming 80% sample recovery), to the number ofconical holes milled from crystals with a range of Sr concentrationsfrom 250ppm to 2000ppm. The milling depth is set to 75 um and adensity for plagioclase of 2600kg/m’is assumed. The milling is carried out under a single drop ofMilli-Q water, which cools and lubricates the bit, andprevents the fine sample dust from being dispersed overthe sample surface making recovery more difficult.(Hereafter all references to ‘water’assume a Milli-Ostandard purity with a final resistivity of>18.4MQ.) Inorder to confine the droplet, a warmed square ofParafilmTM with a ca. 4-mm hole cut at the centre isfirmly pressed to the polished sample surface, such thatonly the area immediately around the sampling point isexposed. This creates a shallow depression that can beflooded with the water, which is confined by surface tension against the Parafilm. As the height of the millingbit above the sample surface between scans/points canbe user defined in the software, the tip of the rotating bitcan be kept within the droplet, acting to clean it andfurther reducing the chance of sample loss (Fig.1b). 3.3. Recovery of samples Once milling is completed, the sample slurryispipetted from the polished sample surface using a 0.5-10-uL micropipette with the tip cut at a 45° angle (Fig.1c).. A gentle circular motion of the pipette tip whils1sucking up the slurry is used to stir the particulates intosuspension. To obtain good sample recovery, it may benecessary to refill the depression with water and repeatthis process.The recovery (based on comparingcalculated sample mass from the excavation geometryto the actual mass of sample) is in the range 80-85%.For isotope composition work, the sample is transferreddirectly to the digestion vessel, but for isotope dilutionwork (where sample weights have to be known) thesample is transferred to a gold weighing boat (seeSection 5). Procedural blanks are monitored by millingwithin a water droplet on the sample, but with the bit afew tens of microns above the surface such that nogrinding occurs. The droplet is then pipetted up andtreated in identical fashion to the samples. 4. Analytical techniques for Sr analysis 4.1. Reagents and materials Three main requirements must be met for analysis ofvery small samples for Sr by TIMS: (1) Sr must be isolated to high purity from Rb and Ca,since Rb produces a mass interference on 87Sr,and Caseverely impairs Sr ionisationl ancproduces ion beam instability. (2) Yields from the chemical procedures must be ashigh as possible. (3) Procedural blanks must be small compared to theamount of Sr in the sample (<1% of the sampleSr). Since the volumes of reagents used in ourprocedures are small, we purchased ultra-purereagents manufactured by Seastar ChemicalsTMrather than distil our own. Rubidium and Srconcentrations in all the reagents used were foundto be well below 1ppt. Water blank contributionsare consistently <1ppt for both Rb and Sr. Allmanipulations were carried out inside class100laminar flow hoods. Separation of Sr was carried out using Sr Spec extraction chromato-graphic resin (Horwitz et al., 1992) (particle size50-100um) supplied by Eichrom TechnologiesInc.(Darien, IL). 4.2. Sample decomposition and preparation for columnchemistry The sample slurry is transferred directly to a 3.5 mLperfluoralkoxy (PFA) screw-cap beaker (SavillexTM,Minnetonka,USA). Sample decomposition is achievedwith the addition of 200uL 29M HF+10uL 10MHNOs to the beaker, which is then sealed and placed ona hotplate (ca. 80C) overnight. Excess HF and volatileSiF4 are removed by subsequent evaporation of thesample solution. The residue is taken up in 200uL 6MHCl and the beaker resealed and placed back on ahotplate for a few hours. Following evaporation, thesample is taken up in 10M HNO3, resealed and returnedto the hotplate for a few hours. Following a finalevaporation step, the sample residue is dissolved in200uL of 3M HNOs and placed onto a hotplate prior tocolumn chemistry. At this stage, the nitric acid solutionsare generally clear and free of precipitates. During theevaporation stages, great care was taken to observe thesesmall samples did not climb the walls of the beaker. Ifsuch a situation arose, the beakers were tapped gently toreturn the solution to the rounded bottom of the beaker. 4.3. I paration of micro-columns and chemicaseparation Columns are made up from standard 1mL pipettetips with a circular piece of polypropylene frit (30umpore-size) material fitted into the tapered end. The areaof the pipette tip below the frit material is cut diagonallywith a scalpel as this both facilitates emptying of thecolumn during elution, and reduces the ‘dead’volumeof reagent between the frit and the column tip. Oncemade and checked for flow rate by filling with water,columns are washed several times in dilute HCl in a 1-LSavillexTM jar. The cleaned columns are rinsed in waterprior to use. The Sr SpecTM resin is cleaned thoroughly beforeuse. 2-3 mL of resin (enough for approximately 40columns) slurried with water is placed in a 2-mLBioradTM column with a 225-mL reservoir attached.Full column volumes of 0.05M HNO3, 0.1M H2SO4,6M HCl and water are passed in succession until atotal of ca. 6L of the above reagents had been passedthrough the column. Nitric and hydrochloric acids arediluted from SeastarTM reagents, whereas 6M HCl is diluted from in-house Teflon-distilled acid. This pro-cedure is required to remove traces of labile organiccompounds, and to minimise the Sr blank contributionfrom the resin. The cleaned resin is stored as a slurrywith water in a 50-mL FEP dropper bottle ready foruse. Once cleaned, we found Sr Spec resin to have ashelf life of approximately 3months, after which timewe noticed a drop in Sr retention and hence the columnyield. Cleaned columns.Sarewashed alternatelyywithseveral column volumes of water and 6M HCl priorto filling with approx. 70uL of Sr Spec resin. Theresin is further washed with several column volumesof 6M HCl then water before conversion to a nitricacid medium with 3 times 200uL 3M HNO3. Srseparation is achieved using a scaled-down version ofthe procedure detailed by Deniel and Pin (2001). Afterloading the column with sample in 200uL 3M HNO3,a total of 500uL 3M HNOs is passed in four stages(50, 100,150,200uL) (Fig. 3). These rinsing andloading fractions contain (among other matrix ele-ments) Rb and Caa lboth of which are importantelements to be removed. For unspiked Sr isotopecomposition determinations, these fractions are eluted Cumulative volume of acids (ul) Fig. 3. Elution profile of Rb and Sr from a micromilled samplecontaining ~ 17ng Sr, ~20ng Rb, on a column containing ~70uL SrSpec resin using 3M HNO3 for the elution steps and 0.05M HNO forcollection of Sr. The whole procedure is carried out using less than1 mL of reagents in total. The column yield for Sr is approximately70%, and about 4% of the total Sr is eluted as ‘leakage’ in the firstfour wash steps with 3M HNO3. The remaining ca. 26% remainstightly bound to the Sr Spec resin. to waste, but are collected for Rb separation fromspiked samples for isotope dilution analyses. Follow-ing this, pre-cleaned collection beakers are placedunder the columns and Sr is eluted from the column in300uL 0.05M HNO3 in three 100-uL stages. The Srfraction is then dried ready for TIMS analysis. Oncethe columns are cleaned and ready for loading, theseparation procedure occupies about 2h. In order tomaintain low blank levels, we discard both columnsand resin after each use to avoid possible memoryeffects. 4.4. Blank contamination levels Because the samples produced by micromilling arevery small (typically 3-12ng Sr), blank contaminationis of critical concern and is monitored regularly. Thereagents used are certified to be <1ppt for mostelements (including Sr and Rb), which was verified byus using both preconcentration followed by ICPMSanalysis as well as by ID TIMS. Total procedural blanks (TPB; including milling,drying down on a gold weighing boat (Section 5),dissolution and separation and filament loading) weremonitored by processing a water droplet within whichthe mill bit had been run (Section 3.3) through thecomplete sample preparation procedure. The Sr TPBs(n=16) determined in this fashion averaged 12±8pg (2S.D.) over a 14-month period, excluding two measure-ments of 832 and 115pg. When such high blanksoccurred, all sample processing was halted and blankdeterminations were repeated in order to try to identifythe source. The largest blank component in the work wedescribe here (apart from possibly the two very highmeasurements) was derived from the cleaned Sr Specresin itself. Two separate batches of Sr Spec resin wereanalysed for their blank 87Sr/86Sr, yielding 0.70986±2and 0.70989±2. Two TPB determinations for Rbyielded 19 and 23 pg. In addition to TPBs, possiblecontamination from the mill bits was checked at theoutset of this work by leaching a cleaned mill tip inconcentrated HCl for several hours, followed by ICPMSanalysis of the solution. No Sr or Rb above the level ofthe blank in the reagents used was detected in theleachate. Considering an example of a sample contain-ing 3ng Sr and an average blank of ~12pg, contam-ination levels were thus<0.5% of the total Sr present.Such small blank contributions obviate the need forblank corrections to the sample sizes and the range ofSr/86Sr analysed in this study. However, it may benecessary to correct data for blank contributions whenextending these procedures to samples with <1ng Sr and/or 87Sr/86Sr ratios significantly different to theblank value (~0.7099). 5. Specific procedure for isotope dilution analysis For isotope dilution analysis of Rb and Sr, severalextra steps in the dissolution and analysis procedure arenecessary: 1. Sample weighing: After milling, the slurry contain-ing the sample is transferred into a pre-weighedgold weighing boat (instead of a beaker), drieddown on a hotplate and reweighed once cooled.The difference in weight is taken as the sampleweight, and any drift between measurements ismonitored by routinely weighing a similar emptygold weighing boat. The weighing boat and sampleare then transferred directly to the beaker. Sampleweights can vary from <10ug to >100 ug depend-ing on the Sr concentration in the sample and theamount required for analysis. Samples are weighedusing a Mettler Toldeo UMT 2 balance with anuncertainty oFfi ±0.1 pg. For the example ofa 3.75-ug sample (Fig. 2c), the weighing uncertainty isca. 2.6%. 2. Spiking: The requisite amount of a mixed 8Rb84Srspike (made up from IRMM-635 (99.89%84Sr) andIRMM-618 (97.99%Rb); calibrated against SRM607 and gravimetric solutions of NBS 987 and NBS984 for concentration) is added to the vial which isreweighed at this stage. After decomposition of thesample in 200puL 29M HF+10uL 10M HNOs andfull sample-spike equilibration, the solution istemporarily transferred to a pipette whilst theempty weighing boat is removed to another containerfor cleaning and reuse. 3. Rb separation and analysis: During Sr separation onSr Spec resin, the matrix element fraction eluted fromthe first four wash stages of the Sr Spec procedure arecollected (Fig.3), dried and taken up again in 100 uL2.5M HCl. Rb is then separated from the matrixelements and any Sr leakage by loading onto highaspect ratio columns (~30) containing ca. 700uLDowex AG 50 WX8 (50-100mesh) cation exchangeresin. After elution of 950uL 2.5M HCl, the Rtfraction is collected in 400 uL of the same acid. Thisfraction is dried down and taken up in ca. 1 mL 3%HNOs for Rb ratio analysis by MC-ICPMS using atechnique similar to that detailed by Waight et al.(2002b) (Section 7.4). 4. TIMS analysis: Spiked samples are run in the samefashion as unspiked samples, however the data are corrected off-line for spike contribution usingstandard techniques. 6. Preparation of a high purity TaFs activator for Sranalysis by TIMS In order to analyse small Sr samples for isotopecomposition or isotope dilution by TIMS, a Ta emittersolution is used to enhance Sr ionisation efficiency(modified after Birck, 1986). Since we found unaccept-ably high levels ofRb and Sr in the Ta2Os powder used tomake the activator, we devised a method of productionwhich achieved very low loading blanks (low pg range). To produce~20mL of activator, 250mg of Ta2O5powder is dissolved in 10mL of concentrated HF at80℃ for 7days. After dissolution is complete, thesolution is evaporated to dryness and taken up in 1 mL ofHF. This solution is transferred to a cleaned centrifugetube and 6mL of water is added. To this solution.ammonia solution is added dropwise, shaking after eachaddition. White crystals of Ta(OH)s are precipitatedfrom the solution. For the purposes of this precipitation,ordinary reagent grade ammonia is adequate; impureammonia has a smaller effect on the final blank levelthan impure acid since the impurities do not complexwith tantalum. When adding more ammonia causes nofurther precipitation to occur, the solution is centrifuged,and the supernatant liquid, which contains any Rb andSr contaminants, poured off. The pellet is then resus-pended and centrifuged in water twice, and the supe-rnatant discarded. The pellet is resuspended once morein water and dried down. The Ta(OH)s powder is thentaken up once again in 1mL of HF and the precipita-tion-centrifuge cycle repeated. The remaining crystalsare then weighed. Accounting for the conversion of theTa2Os to Ta(OH)s, the amounts used of the followingreagents should be appropriately scaled. The reagentvolumes below correspond to a weight in the region of300mg of Ta(OH)s. To finally prepare the activator, tothe dried Ta(OH)s crystals, the following reagents areadded: e 370uL HF (this re-dissolves the crystals on contact)·270uL concentrated HPO4 e 22125uL 3M HNOs ● 16.55mL water. The resulting solution is then re-sealed and placed ona hotplate to equilibrate. Minor crystallisation of thesolution may be observed during usage at roomtemperatures; however, re-sealing and heating on ahotplate causes it to re-dissolve. 7.1. Loading Sr and analysis conditions for TIMS For TIMS analysis, Sr is loaded on single Refilaments outgassed at 4.2 A for 20min. A current of~ 1 A is passed through the filament and ParafilmTM ismelted onto its surface, leaving a gap of ca. 1.5mm atthe centre of the filament. The current is then turned offand 0.7uL TaF5 activator is loaded into the gap. To this,the sample which has been taken up in 1uL of 16MHNO3 is added. A current of ~1.5 A is then passedthrough the filament, and the ParafilmTM on either sideof the droplet helps to constrain the droplet to the centreof the filament as it dries, and convection within thedroplet causes the sample to mix efficiently with theactivator. Once the sample is dry, the current is thenslowly increased to ~2.0A to burn off the ParafilmTM,then increased further until a dull red glow is achievedfor a few seconds. The current is then turned off and thefilament loaded directly onto the magazine for loadinginto the mass spectrometer. For larger load sizes(<100ng Sr), samples were loaded onto Ta filamentssimilarly out gassed and using 1M HPO4 as the loadingsolution. Sr isotope ratios were measured on the DurhamUniversity Thermo-Finnigan Triton TIMS instrument instatic collection mode. Amplifier gains were calibratedat the start of each day and baselines were measured fortwo minutes before the start of each analysis. 85Rb orSr were aligned in the axial cup and the data collectedin 18 blocks of 10 cycles with each cycle having anintegration time of 4s. The amplifier rotation optionavailable on the ‘virtual amplifier’of the Triton wasused during the analysis to eliminate all gain calibrationerrors. Sr isotope ratios for unspiked samples werecorrected for within-run fractionation using an expo-nential law correction and 88Sr/86Sr=8.375209 (equiv-alent ttoo 86Sr/88Sr=0.1194), whereas that for spikedsamples was carried out using an offline spike-strippingcorrection routine (Section 5). In general, Rb was‘burned off’ the filament during the filament heatingstep, but occasionally some Rb was present during theSr analysis and required a correction for 87Rb on 8Sr bymonitoring 8Rb and using an 8’Rb/85Rb of 0.385041.Sr isotope measurements were usually performed onbeam intensities of 2-4V88Sr, with 85Rb intensities of<1mV. For samples spiked with a mixed 84Sr-87Rbtracer, the Rb isotope composition was monitoredclosely before Sr analysis to ensure that any Rb presentwas of natural composition. If non-natural Rb wasdetected (resulting from imperfect chemical separation), this was removed completely during low temperatureionisation prior to Sr analysis. 7.2. Reproducibility and accuracy of Sr isotope ratiosin standard solutions and rock samples Strontium data were collected during four periodsbetween April 2002 and July 2004, by multiple userswith various levels of experience. These periods wereseparated by switching to negative ion mode, sourcecleaning or other instrument maintenance. For sessions1 and 2,85Rb was monitored in the axial Faraday cup,whereas during sessions 3 and 4, 8Rb was monitoredusing the L1 Faraday cup. Considerable effort was expended in quantifying thelong-term performance of the Triton. The externalprecision (i.e., twice the standard deviation of themean values for each individual run; 2o) was estimatedfrom the sets of repeated analysis ofNBS 987 in each ofthe four sessions, and was carried out for a range of loadsizes, in order to encompass the likely amount of Srencountered in our microsamples and for larger whole-rock samples. The results for all NBS 987 standard measurements made in each analytical period aresummarised in Table 1. For each of the four sessions, the external precision onthe 87Sr/86Sr for ~600ng loads run using Ta filamentswith H3PO4 (total n=222) ranged from ±0.000018 to±0.000007 (2a). Thele87Sr/8oSr value ranged from0.710242 to 0.710261 (all within error of the value87Sr/86Sr=0.710248±0.000023 2o (n=427) reportedby Thirlwall, 1991). The mean 848S4rS/r8/68S6Sr value weobtained for all ~600ng loads (0.0564914±0.0000062o) is significantly lower than the 0.056584 valuerecommended by Steiger and Jager (1977;corrected to88Sr/86Sr=8.375209) but is identical to the valuereported by Thirlwall (1991) of 0.056492±0.000016 288cS.D. (also using 88Sr/86Sr=8.375209). For our smaller load sizes run on Re filaments withTaFs activator over the four sessions, we obtained &Sr/8Sr=0.710258 to 0.710259 with external precisionsranging from ±0.000036 (50ppm) 2o for 3ng loads(n=288), to ±0.000018 (25ppm) 2o for 12ng loads(n=92). In all cases, external precisions were just over afactor of 2 worse than the average within run precision.In addition, average 84Sr/86Sr values for each of 3, 6 and Summary of87Sr/86Sr and 84Sr/86Sr average values and external reproducibilites (expressed as2 S.D. and ppm of the average value) for various loadsizes of NBS 987 obtained from the four analytical sessions undertaken during this study Magazine no. Sr/86Sr 84Sr/86Sr 3 ng or less 6ng 12ng ~600ng 3ng or less 6ng 12ng ~600ng 17 to 49 Average 0.710255 一 0.710247 0.0564926 0.0564924 2 S.D. 0.000016 0.000013 0.000016 — 0.000007 2S.D. ppm 22 18 291 122 n 66 75 66 75 69 to 115 Average 0.710260 0.710270 0.710267 0.710260 0.0564860 0.0564888 0.0564889 0.0564907 2S.D. 0.000041 0.000042 0.000011 0.000012 0.000025 0.000018 0.000010 0.000006 2S.D. ppm 58 59 16 17 449 324 176 108 n 161 80 27 119 161 80 27 119 132 to 164 Average 0.710254 0.710251 0.710250 0.710242 0.0564909 0.0564912 0.0564915 0.0564924 2S.D. 0.000018 0.000015 0.000016 0.000007 0.000007 0.000009 0.000007 0.000005 2S.D. ppm 26 21 23 9 123 162 131 83 n 26 121 24 10 26 121 24 10 168 to 188 Average 0.710261 0.710260 0.710259 0.710261 0.0564999 0.0564909 0.0564910 0.0564912 2S.D. 0.000020 0.000013 0.000009 0.000009 0.000027 0.000010 0.000022 0.000004 2S.D. ppm 28 19 12 12 472 180 390 75 n 35 65 41 18 35 65 41 18 All data Average 0.710258 0.710259 0.710259 0.710255 0.0564896 0.0564904 0.0564905 0.0564914 2S.D. 0.000036 0.000030 0.000018 0.000018 0.000024 0.000013 0.000016 0.000006 2S.D. ppm 50 43 25 26 433 229 286 113 N(total=868) 288 266 92 222 288 266 92 222 Long-term external precision for the Triton instrument (over 27 months) is calculated for all four sessions. 12ng load sizes (0.0564896 to 0.0564905) run duringthe four periods of analysis were within error of thevalue from our ~600ng load sizes (0.0564914). Total external precision (i.e., the reproducibility ofreal samples subjected to the dissolution process and, inthe case of isotope dilution measurements, spike correc-tions) was monitored using a variety of different refe-rence materials: BHVO 1, BHVO 2G (USGS Hawaiianbasaltic glass as a powder (1) and a glass fragment(2G)); BCR 2G (fragment of USGS Columbia Riverbasaltic glass); SRM607 (NIST K-feldspar powderstandard); and micromill glass standard"T”(a doped andfused plagioclase separate from Mont. Pelee, producedfor the study presented by Davidson et al., 2001).Average 87Sr/86Sr data and external precisions for thesestandards are given in Table 2, along with concentra-tions of Sr and Rb from isotope dilution measurementsand their reproducibilities where determined. BHVO 1values of 87Sr/86Sr run as both isotopiccomposition and isotope dilution analyses agree withinerror (0.703490±14 vs. 0.703480±47), attesting to theefficacy of our calculations for spike componentstripping. In addition, the Sr concentration determinedby ID for BHVO 1 (435±14ppm 1 S.D.) run as singlesmall spiked dissolutions, agrees within error with theUSGS certified value (403±25ppm 1 S.D.). These 87Sr/86Sr values in turn agree with the analyses of BHVO 2Gproduced by micromilling, indicating that for Srisotopes, the two standards are identical (despitedocumented differences in Pb isotopes between BHVO1 and BHVO 2: Woodhead and Hergt, 2000; Baker et al.,2004). Our 87Sr/86Sr values for BHVO 2G (0.703492±471 S.D., n=3) and BCR 2G (0.705095±13 1 S.D.,n=5) run as small samples are similar to thosedetermined for analyses >100ng Sr by Mahoney etal. (2003;0.703487±9 and 0.705024±5, respectively). Analyses of SRM 607 were carried out on largedissolutions (~600ng Sr), from which a~20-ng aliquotwas taken through the column separation procedure.This was to ensure sample homogeneity at a large scale,in order to circumvent the problem of powderheterogeneity at the scale of a few ng Sr (B. Charlier,unpublished data). Our mixed 84Sr-87Rb spike wascalibrated for concentrations of Rb and Sr against SRM607, which has certified values of 523.9±1.01 and65.485±0.320(2 S.D.) for Rb and Sr, respectively. Weobtain concentrations of Sr (506±25ppm 1 S.D.) andRb (63±2ppm1 S.D.), where n=11. The 87Sr/86Sr value for feldspar glass"P(0.704145±15 1 S.D., n=19) is in agreement with the two TIMSvalues reported by Davidson et al. (2001) of 0.704138±13 and 0.704135±10. The data for rock standards demonstrate that weare able to produce both accurate and precise data for7Sr/86Sr and concentrations in small samples runfrom powders or produced by microsampling, evenwhen offline spike stripping calculations are required. 7.3. Fractionation behaviour of small Sr analyses byTIMS It is well established that the mass fractionationinherent in all TIMS analyses is more pronounced forsmaller samples and so it is important to establish thatthe corrections applied to the data are as valid aspossible. With large Sr loads (>100ng) run on Tafilaments, mass fractionation is usually limited and themeasured 86Sr/88Sr ratio decreases steadily throughoutthe analysis and rarely drops below 0.1190 (acceptedvalue is 0.1194). Small samples (~3-12ng) loaded onRe filaments with an activator, such as those analysed aspart of this study, often run more erratically. Beams are Table 2Sr/86Sr and Rb and Sr concentrations (where determined) for standards used in this study 87Sr/Sr 1 S.D. Sr conc (ppm) 1 S.D. Rb conc (ppm) 1 S.D. (1) BHVO 1 0.703490 0.000014 21 (2) BHVO 1 0.703480 0.000047 435 14 5 (3) BHVO 2G 0.703492 0.000047 3 (4) BCR 2G 0.705095 0.000013 5 (5) SRM 607 1.200400 0.000026 63 2 506 25 (6) Feldspar glass “T” 0.704145 0.000015 526 9 Row 1: analyses of a single large dissolution and separation (>600ng Sr) of BHVO 1 powder, which was then run multiple times as 2.1 to 14ng loads(n total=21). Row 2: results from single, small (~10ng) spiked dissolutions of BHVO 1 powder for 87Sr/86Sr and Sr concentration by ID, thencorrected offline for spike contributions. Rows 3 and 4: BHVO 2G and BCR 2G sampled from single glass fragments (supplied by S.A. Wilson,USGS) using micromilling and analysed for isotopic composition only. Row 5: SRM 607 analyses performed on >600ng spiked dissolutions, afterwhich only 20ng was taken through the column separation procedure, then analysed. Certified value for SRM 607 is; 87Sr/86Sr=1.20039±20 20.Row 6: feldspar glass “I" analyses represent 5-20ng Sr spiked dissolutions of micromilled fragments of this glass standard (corrected offline for spikecontribution). occasionally unstable and mass fractionation can beboth in the normal and reverse sense, the latter beingwhere the 86Sr/88s increases for a period of time duringthe run. Reverse massfractionation results fromheterogeneous emission of the Sr load from the filament;emission in one area of the filament can cease while itinitiates in another, less depleted part of the Sr reservoir.Small samples usually fractionate to a much greaterextent with the 86Sr/88 Sr ratio often decreasing to below0.1190, and sometimes as low as 0.1180 for 3ng loads.This often necessitates accepting data which for largesamples would be rejected because of the extent offractionation. However, data need not be rejected if itcan be shown with reasonable certainty that it adheres tothe mass fractionation model being applied. To examine the mass fractionation behaviour of smallSr standards, five analyses ofNBS 987, which exhibitedboth normal and reverse fractionation and also stableand erratic beams were selected from load sizes of 3, 6and 12ng. Plots of lnSr/Srmeas versus lnS/Srmeasand ln8Sr/86Srmeas versus ln88Sr/86Srmeas for 18 blocksof 10 ratios from each of the 5 standards (90 points intotal) are shown in Fig. 4a and b, respectively. Alsoshown are the actual slopes defined by the sample dataand those calculated for the power and exponentialfractionation laws. All five standards closely follow theexponential fractionation law (Thirlwall, 1991), asshown by the almost identical slopes for the data andthat expected for exponential fractionation, despiteshowing a range of running behaviours and degrees offractionation. The slightly poorer MSWD of the array inFig. 4a versus that in b (1.9 vs. 0.58) is not due to thefractionation departing from the exponential law (as thisis not observed in Fig. 4b). Rather, it is due to collectionof small beam sizes at the start and toward the end of theanalysis such that uncertainties on the Sr measurement(only 0.56% of the total Sr load) are increased becauseof lower signal-to-noise ratios. The measurement of 87Sr/86Sr on microsamples iscarried out within the same range of measured 86Sr/88Srratios obtained on the standards; in this way, we assurethat deviations from predictable exponential lawfractionation behaviour due to extreme 86Sr/88Sr ratiosare not problematic. 7.4. Rb analyses ofmicrosamples by Multiple CollectorInductively Coupled Plasma Mass SpectrometryMC-ICPMS) A significant source of error in attaining accurate andprecise Rb-Sr ages by TIMS arises from the inability toaccurately correct for instrumental mass fractionation of (a) Ln88Sr/6Sr measured (b) Ln 88sr/86Sr measured Fig. 4. (a) In(84Sr/86Srmeas) versus In(88Sr/86Srmeas) and (b) ln(84Sr/8Srmeas) versus ln(Sr/86Srmeas) for five small Sr analyses (18blocksconsisting of 10 individual ratios are shown for each analysis). Thesolid line denotes a best-fit regression to the block data and their 1 S.E.uncertainties and is shown with the calculated slope, 2o uncertaintyand MSWD. Also given are the theoretical slopes for exponential(EXP) and power laws (PL). The diamond in (a) represents the ‘true’isotopic composition of NBS 987. the 7Rb/85Rb ratio during analysis. This is because Rbhas only two naturally occurring isotopes, so unlike Srthere is no stable isotope ratio which can be used for themass fractionation correction. With conventional TIMSanalysis, the Rb mass fractionation for samples can onlybe estimated by repeated analysis of Rb standards of thesimilar load size as samples and run under identicalinstrument conditions. In practice such an approach islikely to underestimate the actualil uncertainty andincrease the inaccuracy of Rb isotope ratio measure-ments in real samples because of the effects of othermatrix elements (e.g., Ba, K and Na) in the latter and theinability to exactly match std and sample load sizes.With isotope dilution measurements, these uncertaintiesand inaccuracies propagate into the Rb content calcula-tions and consequently the 87Rb/86Sr ratio used onisochron plots. Waight et al. (2002b) demonstrated that it is possibleto attain highly reproducible and accurate results for Rb Table 3 Average 90zrZr and Rb/Rb ratios obtained in each of the four analytical sessions Ratio 19-07-05 n 20-07-05 n 21-07-05 na 29-09-05 n° 90Zr/Zrb 4.58786±49 (106ppm) 18 4.58709±51 (110ppm) 10 4.58643±24(53ppm) 4 4.58673±12 (27ppm) 10 87Rb/85Rbc 0.386103±91 (237ppm) 11 0.386075±74 (191ppm) 12 0.385892±88 (229ppm) 12 0.385933±29 (75ppm) 10 Number of standards on which average ratio is based. 90zr/Zr ratio determined on a mixed Sr-Zr solution with 9ZrZr corrected for mass bias using an exponential law and an 88Sr/86Sr ratio of 8.375209.e 87Rb/85Rb measured on a mixed Rb-Sr-Zr solution with an Rb/Sr ratio of 1 and corrected for 87Sr isobaric interference on 87Rb (19-07-05) ormixed Rb-Zr solutions (all other analytical sessions). Mass bias on 87Rb/85Rb corrected using an exponential law and the average 90zr/lzrdetermined for that session. isotope measurements using MC-ICPMS. This ap-proach uses external element normalisation, where the90Zr/1 Zr ratio of admixed Zr is used to correct for massbias of the’Rb/8SRb using a published value for the Zrisotope ratio. Despite small variations in the relativefractionation behaviour ofRb and Zr, it was neverthelessdemonstrated that MC-ICPMS analysis of Rb using Zrfor mass fractionation correction yielded a 26-foldincrease in external precision on the 87Rb/85Rb ratiowhen compared with conventional TTIIMMSS analysis(0.05% 2 S.D. vs. 1.3%2 S.D., respectively). It wasalso shown that even for large (>2ug) Rb samples runby TIMS,Rb/"Rb ratios deviated significantlycompared to those values obtained by MC-ICPMS (upto±0.5%). For very small Rb samples of just a few ngRb, such as those produced by micromilling, MC-ICPMS should yield similar if not greater improvementsover TIMS. In this study, microsample Rb fractionswereanalysed by MC-ICPMS using the Durham UniversityThermo-Finnigan Neptune. Each analysis was carriedout in static multi-collection mode and comprised 1block of 50 cycles each with a 4-s integration. All data were processed offline for mass bias and interferingelement corrections. The analytical method we used wasslightly different to that of Waight et al. (2002b) andNebel et al. (2005) in that rather th907917.an using an "accepted'or published zr/’l Zr ratio for mass bias correcting the87Rb/85Rb, we determined a ‘true’90zr/lZr value forour Neptune. This was done daily at the start of theanalytical session by doping a 200-ppb solution of (Rbfree) NBS 987 with RomilTM ICP Zr single elementstandard (see Table 3). The measured 88Sr/86Sr (aftercorrection for 86Kr interference on mass 86Sr bymonitoring mass Kr) was used to mass bias correecc1the 90zr/l Zr using an exponential law and an 88Sr/86Srratio of 8.375209 (equivalent to 86Sr/88Sr=0.1194). The90Zr/1Zr could also have been mass bias corrected to an‘accepted’87Rb/85Rb ratio. However, we feel that thenatural Rb ratio is not as well characterised as the Srisotope ratios for NBS 987. Fig.5 is a plot of the naturallogs of measured 90Zr/Zr versus 88Sr/86Sr for the Sr-doped Zr solutions used to calibrate the 9zr/1Zr ratio.If the two elements have identical mass bias coefficientsthe data should fall along a straight line whose slope is afunction of the atomic masses of the isotopes and whose Ln Sr/Sr measured Fig. 5. In(zr/Zrmeas) versus In(88Sr/86Srmeas) for mixed Sr-Zr standard solutions (the solution on 19-07-05 also contained Rb) during four separateanalytical sessions. Solid and dashed lines represent the theoretical line expected for exponential fractionation, based on the actual masses of theisotopes, an 88Sr/86Sr ratio of 8.375209 and a9zr/'lZr ratio of 4.5874 (solid line; Minster and Ricard, 1981) and 4.5882 (dashed line; Munker et al.,2001). Grey shaded field represents the error on the zr/Zr ratio reported by Minster and Ricard (1981). B.L.A. Charlier et al. / Chemical Geology xx (2006) xxx-xxx Fig. 6.90zr/Zr ratios, corrected for mass bias using Sr, an exponential law and an 88Sr/86Sr ratio of 8.375209 (reciprocal of 0.1194), for eachanalytical session (filled squares) and the overall average (open square). Also shown for comparison are the averageeZrZr TIMS values reportedby Nomura et al. (1983), Minster and Ricard (1981) and Sahoo and Masuda (1997) and the MC-ICPMS value reported Miinker et al. (2001). absolute position is determined by the‘true’or acceptedisotope ratios of Sr and Zr. Clearly, the data do notdefine a single line and each analytical session plots as adistinct cluster. This suggests that the relative differencein mass bias coefficients between Sr and Zr variesbetween sessions, which is why we normalise the Zr tothe Sr for each session rather than using a fixed value.Absolute mass bias variations within single analyticalsessions on the Neptune are limited in extent, whichobviously affects regression statistics. Despite this,overall the data in Fig. 5 still fall close to the theoreticallines for exponential mass bias using a value of8.375209 for88Sr/86Sr and the 90zr/lzr values ofMinster and Ricard (1981), Sahoo and Masuda (1997)or Miinker et al. (2001)—compare Fig. 6. Table 3 lists the ‘88Sr/86Sr-normalised90Zr/Zr ratiosobtained during four separate analytical sessions. Theoverall average90Zr/Zr ratio obtained for the fouranalytical sessions is 4.5870±12 (Fig. 6). This is slightly lower than the values used by Waight et al.(2002b) and Nebel et al. (2005) to correct the Rb massbias (by 212ppm and 256ppm, respectively). Never-theless, it is only 81 ppmlower, and well within error, ofthe values reported by Sahoo and Masuda (1997;Zr/'Zr=4.5874±11 2 S.D.), Minster and Ricard (1981;90Zr/Zr=4.5874±11 2 S.D.)and Sanloup et al.(2000). Reproducibility on the90Zr/Zr ratio, aftermass bias correction to the88Sr/86s ratio, duringindividual sessions is between 27ppm and 52ppm (2S.D.).The long-term reproducibility is slightly worse at269ppm (Fig. 6), but is still comparable to the bestobtained by TIMS (Minster and Ricard, 1981; Sahooand Masuda, 1997). Fig. 7 is a plot of the natural logs of measured Rb/Rb versus90Zr/Zr for the Rb standards measured inthe four analytical sessions. As with Fig. 5, the dataclearly do not lie along a single line, which implies massbias coefficients for Rb and Zr are not equal and the Fig. 7. In(Rb/Rbmeas) versus In(zr/Zrmeas) for mixed Rb-Zr standard solutions during four separate analytical sessions. Solid and dashed linesrepresent the theoretical line expected for exponential fractionation, based on the actual masses of the isotopes, an Rb/Rb ratio of 0.385706(IUPAC) and a 90zr/lZr ratio of 4.5874 (solid line; Minster and Ricard, 1981) and 4.5882 (dashed line; Munker et al., 2001). Grey shaded fieldrepresents the error on the 9zrZr ratio reported by Minster and Ricard (1981). magnitude of the difference between the two variesbetween the different analytical sessions. Nevertheless,the data clusters do appear to fall close to and have asimilar overall slope to the theoretical lines forexponential mass bias using a value for Rb/8Rb of0.38571 as recommended by the IUPAC (Rosman andTaylor, 1998) and the same 90Zr/l Zr ratios as in Fig. 5.The measured lnRb/8Rb values for the differentanalytical sessions (Fig. 7) are between 4.6% and 5%higher than the IUPAC value (-0.952) which shows thedegree of mass bias per amu is approximately 2.5% atthe Rb mass range, an order of magnitude greater thanwould be expected with a TIMS analysis. Unlike withTIMS, where mass fractionation changes with time, Fig.7 shows that the Rb (and Zr) mass bias during MC-ICPMS analysis remains fairly constant within individ-ual analytical sessions and can be readily correctedusing the Zr. Table 3 lists the average 87Rb/8Rb ratios obtained onthe Rb standard for each session, corrected for mass biasusing an exponential law and using the average 90Zr/Zr ratio obtained during the same analytical session.The Rb standard run on the 19-07-05 was intentionallydoped with Sr (Rb/Sr=1) so as to test the accuracy ofour offline correction for 87Sr on 87Rb. Without acorrection for the interference from 87Sr the measuredRb/Rb ratio was 0.49728 but as can be seen fromTable 3 after correction the average Rb/Rb is withinerror of the pure Rb standards run in the following twosessions. This is testament to the accuracy of ourinterfering element correction algorithm. Although notattributable to an interference from 7Sr, the average87Rb/Rb values of all the sessions are neverthelesshigher than the average of 0.38540±19 reported byWaight et al.(2002b) and by Nebel et al. (2005; for massbias corrections using the90Zr/2Zr and90zr/94zi ratios).). The values are, however, similar to thosereported by Nebel et al. (2005) using the 90zr/Zrand which they subsequently dismissed because of anobserved interference onZr. A mass scan across theZr peak on the Neptune, with a mass resolution of5000 (Fig. 8), shows no evidence of any interferenceand as such can be eliminated as the reason for our Zr-corrected 87Rb/"Rb ratios being slightly higher thanthose reported by Waight et al. (2002b). Our long-termaverage 87Rb/8Rb ratio is 0.38602±16 (411ppm, 2 S.D.) and this is ~800 ppm higher than the IUPAC valuewhile the value reported by Waight et al. (2002b)happens to be ~800ppm lower. Relative to IUPACvalues our data are actually no less accurate than thoseof Waight et al. (2002b) or Nebel et al. (2005). The reproducibility of the 87Rb/85Rb ratio obtainedon the standards during the four sessions varies between75ppm and 237ppm (2 S.D.; Table 3; Fig. 9) which isbetter than the range reported for individual by eitherWaight et al. (2002b) or Nebel et al. (2005) at 363 to390ppm and 300 to 500ppm respectively. Our long-term reproducibility (411ppm;2 S.D.) also comparesfavourably to the long-term reproducibility of 500 and800ppm reported by Waight et al. (2002b) and Nebel etal. (2005). These improvements are attributable to twofactors. 1. Mass bias on the Neptune is extremely stable overperiods of several hours. This improves the repro-ducibility of individual sessions since minimising themass bias variation also minimises the effect of themass bias coefficients of Zr and Rb not being equal. 2. The method of normalising the 90zr/l Zr relative toSr at the start of each session also probably serves tominimise the effects of different mass bias coeffi-cients for Rb and Zr. Mass bias correcting Zr relative Mass Fig. 8. Scan across theZr peak at a mass resolution of 5000. Peak slightly off centre as Zr is not in the mass calibration file. Solid line is thel Zrpeak at full scale. Dashed line is a close up of the base of theZr peak to highlight the lack of any interference at either the high or low mass sides (seeNebel et al., 2005). Fig. 9.Rb/Rb ratios, corrected for mass bias relative to Zr for the four analytical sessions. Closed squares are Rb data corrected using the averageZr/Zr ratio determined for the session and give an average of 0.38602±16 (411ppm, 2 S.D.). Open squares are Rb data ifcorrected using a fixed90Zr/Zr ratio of 4.588 (as in Waight et al., 2002b; Nebel et al., 2005) and give an average of 0.38582±37 (953ppm, 2 S.D.). Note the better long-term reproducibility of the Rb ratio if corrected for mass bias using a unique Zr ratio determined for each session. to Sr effectively forces the mass bias coefficient of Zrto equal Sr and it is likely that the mass biascoefficients of Sr and Rb are more similar than Zr andRb. Whatever the exact explanation or mechanism, itis clear from Fig. 9 that if the87Rb/85Rb had beenmass bias corrected to a constant Zr/Zr ratio, as inprevious studies, then our long-term reproducibilitywould have been almost a factor of two worse ataround 950ppm (2 S.D.). To test the Rb analysis method further we measuredthe85Rb/Rb ratio on theRb spike IRMM-618during the final analytical session, again using Zr tocorrect for mass bias. Even under ideal circumstancesthis can be regarded as a challenging measurement forTIMS or MC-ICPMS since theRb is so small (onlyabout 2% of total Rb) relative to Rb. This is reflectedby the very large error of±0.000024 or 1171 ppm (2o)quoted on the certified Rb/'Rb value of 0.020498(certificate available online; http://www.irmm.jrc.be/ html/reference_materials_catalogue/). Four separateanalyses of the spike were carried out with an87Rbintensity of 14-15V giving anRb intensity around280mV. Fig. 10 shows the results for each measurement0.020498. The internal precision of each measurementwas between 62 and 97ppm and the overall averageRb/Rb ratio was 0.020460±1(2 S.D.; Fig 10),somewhat below the certified value but considerablvmore reproducible. This value of 0.020460 is relative toanRb/Rb value of 0.385933 obtained on the Rbstandards (Table 3) which is slightly higher than the[UPAC value of 0.38571. If our Rb value for IRMM-618 is re-normalised on the basis of the offset of thenatural Rb standard for that session from the IUPACvalue then the averageRb/'Rb ratio increases to0.020472 (Fig. 10), only just below the lower limit ofthe certified value for IRMM-618 (Fig. 10). If the[RMM-618 value is re-normalised to the87Rb/85Rbreported by Waight et al. (2002b) then the85Rb/87Rb Fig. 10. 85Rb/Rb, corrected for mass bias relative to Zr, for the four analyses of IRMM-618Rb spike. Solid squares are relative to the 87Rb/8SRbvalue for the Rb standard for the final session (Table 3), solid circles re-normalised to the IUPAC value and solid diamonds re-normalised to the valueof Waight et al. (2002b). Open symbols are the averages of the data shown as solid symbols. X is the certified value for IRMM-618 together withquoted uncertainty. ratio increases to 0.020488, well within error of thecertified value. The IRMM-618 spike was calibrated forconcentration using the values we have measured i.e.,0.020460±1, relative to 87Rb/85Rb=0.385933 obtainedon the Rb standards. 8. Case studies 8.1. 87Sr/86Sr variations in plagioclase fromParinacota Volcano To illustrate the above methods on young magmaticrocks, we describe results from a 50-um-thick sectionthrough a zoned plagioclase crystal (PAR-130P1) from adacite lava dome of Parinacota Volcano, Chile (Fig. 11a;the complete data set will be presented elsewhere). Theyouthfulness of this system (8-50ka) and its low bulkRb/Sr ratio (~0.2) means that the Sr isotope composi-tion can be investigated directly, obviating the need forisotope dilution measurements in order to perform agecorrections to the measured ratios. Major element profiles in the crystal were determinedfrom BSE images calibrated using electron microprobedata (Fig. 11b), combined with trace element concentra-tions determined by electron microprobe (Fe, Sr, Ba, Mgand Ti: Ginibre et al., 2002a,b). These studies identifiedeffects of fractional crystallisation from core to rim aswell as two major dissolution events (surfaces R1 andR2 in Fig. 11a). In R1, an outwards increase in minor elements is correlated with increasing An content,suggesting the influence of more-mafic magma, whereasat R2, the An content increases at fairly constant minorelement content reflecting an increase in Tor Pu,O. The chemical zones can be precisely located withBSE imagery, but their replication with the millingmicroscope limits the accuracy of the milling process,especially if twin planes are more visible than the zones,as in the present case, or (in other cases) if the section istoo thick and/or crystal zones are not perpendicular tothe slide. Sr concentrations in PAR-130P1 varied from 1800 to2400ppm and were used to calculate the millingvolumes required for analysis. Calculated Sr contentsin the milled samples from various zones varies between5 and 10ng. Zones between 60 and 200 um wide and300 um long were milled parallel to the zones seen onthe microscope,with milling depth set between 30 and40 um,producing samples in the region of 3-6ug. Themounting resin was partially touched but not theunderlying glass. Analyses of the resin show that itcontains blank levels of Sr (amounting to <0.1% of thetotal analyte in this example). The lower 87Sr/86Sr outwards of zone R1 (Fig.11c)shows the influence of a less-radiogenic mmaaggma,plausibly more mafic, as suggested by the 101element chemical zonation. The intermediate isotopicratio in zone 5 is due to the inaccurate milling of thezone boundary (as seen under the microscope after Distance to the rim (um) Fig. 11. (a) Back-scattered electron (BSE) image of zoned plagioclase crystal PAR-130P1 from Parinacota volcano: white lines show the location ofthe BSE profile shown in (b), black lines show the width of the individual zones sampled for the isotopic profile shown in (c), dots are the location ofelectron microprobe analyses, with corresponding Sr concentrations in ppm. R1 and R2 are resorption surfaces. (b) Greyscale profile from the BSE-image calibrated in terms of An content using microprobe major element analyses. (c) Sr isotope profile. The thickness of the bars denotes 2o within-run uncertainties, and the NBS 987 external precision is shown at 25 ppm 2o (Table 1). Differences in total length of the profiles (b) and(c) is due tothe variable width of some of the zones (mainly zone 5) at different points on the crystal. milling) and represents therefore mixing between twozones, rather than a gradual change in Sr/oSr ratios. In contrast, the increase in 87Sr/86Sr towards the rimbetween zones 6 and 1 reflects crustal contaminationand can be correlated with the extent of fractionalcrystallisation of the liquid. The absence of mafic inputat the resorption zone R2, as suggested by the constantminor element contents, is confirmed by the continuitylof the contamination trend in87Sr/86Sr across thisresorption surface. In this example, the total range of87Sr/86Sr values of 0.00020 is about 6.6times the 2 S.D.external precision of 0.00003 (for 6ng loads; Table 1),but internal variations as small as 0.00006 (i.e., twice the2 S.D. external precision) can be resolved, well beyondthe performance so far reported by LA-ICPMS. 8.2. Initial ’Sr/86Sr in crystals from older systems;28.4Ma Fish Canyon Tuff, Colorado In older systems, and/or those where high Rb/Srratios result in significant 87Sr ingrowth during magmaevolution, variations in 87Sr/86Sr; can only be investi-gated after age an correction has been applied to the87Sr/86Sr ratio, based on the 87Rb/86Sr of the sample(derived from isotope dilution measurements of the Rband Sr concentrations). Evidence for heterogeneousinitial ratios onaa single-mineral scale has beendocumented for some older magmatic rocks; theLachlan Granites (Waight et al., 2000), Rum gabbros(Tepley and Davidson, 2003), the Shap Granite (Coxet al., 1996) and Bavarian granodiorites (Siebel et al.,2005). Here we demonstrate that it is possible toinvestigate the °Sr/86Sr in a number of different mineral phases with a range in Rb/Sr ratio, in particularsingle biotite grains, from an Oligocene ignimbrite, theFish Canyon Tuff (FCT: Lipman, 2000). The FCT waserupted at 28.4±0.049Ma (Schmitz and Bowring,2001)and iiss an archetypal example of the ‘monotonousintermediate’ignimbrites of Hildreth (1981), charac-terised by homogeneity in magma composition at thechamber-wide scale, contrasting thus sw iwith extremetextural and chemical complexities at the centimetre-millimetre scale (Bachmann et al.,2002). Fig. 12 is an 87Sr/86Sr vs. 87Rb/86Sr isochron plot withdata for multi-crystal biotite separates of varying purityfrom the FCT (Lanphere and Baadsgaard, 2001). In theirstudy, the authors achieved the spread in 87Rb/86Sr bysequentially purifying a bulk biotite separate with variousseparation techniques, and attributed the increase inRb/86Sr to the increasingly successful removal ofincluded low 87Rb/86Sr phases (e.g., apatite). Addingtwo analyses of plagioclase and sanidine to all theirbiotite data, Lanphere and Baadsgaard (2001) generatedan isochron with an age of 27.38±0.13Ma, with 87Sr/Sr;=0.70642±10(n=34). When the total uncertaintyof the Sr/Sr is prprooppaaggaatteedd from the externareproducibility of the standard and the measurementuncertainty for each data point, the fit of this isochron isparticularly good statistically (MSWD=0.40), becauseof the very large quoted uncertainty of 0.222% on thestandard 87Sr/86Sr ratios. We have used micromilling to investigate the extentto which the bulk mineral samples used by Lanphereand Baadsgaard (2001) might mask heterogeneitypresent in the87Sr/86Sr ratios of individual biotitegrains. A more complete mineral data set from the FCT Fig. 12. 8Sr/86Sr versus Rb/86Sr isochron plot of biotite analyses of varying purity from the Fish Canyon Tuff (Lanphere and Baadsgaard, 2001)The inset shows the single biotite analyses produced by microsampling for comparison (2o uncertainties smaller than symbol size). The dashed line is. a line of best fit to the single grain data generated using Isoplot (Ludwig, 2002). will be presented elsewhere. Our approach involvedexcising single biotite crystals from a thick section(~150um) of FCT which was sampled from the samegeographical area as the Lanphere and Baadsgaard(2001) study. Multiple overlapping holes were milled inthe section around the crystals of interest, which werethen removed using a needle. Weights for these singlebiotite samples were 0.12 to 0.23mg, and Sr and Rbcontents were 38-99ppm and 264-300ppm, respec-tively, amounting to 7.4-15.3ng Sr and 33.3-69.9ngRb per analysis. Results are shown on the inset diagramin Fig. 6 (’Sr/86Sr normalised to NBS 987=0.71024)for comparison with the Lanphere and Baadsgaard(2001) data. The new single grain data fall within therange ofRb/86Sr defined by the poor biotite’of theprevious study (which may indicate the presence of tinymineral inclusions with low 87Rb/86Sr in our samples),but with a significant scatter and deviation to moreradiogenic 87Sr/86Sr values at a given 87Rb/86Sr. A best-fit line to the single grain biotite data defines an age of23.7±4.3Ma (n=7;87Sr/86Sr=0.70788±99), and withan MSWD=2159 cannot be termed an isochron. Whenage corrected to 28.4Ma, the single biotite data have an8’Sr/&6Sr external variability of 0.95%o (2o), which isfar outside the propagated total uncertainty for eachindividual biotite analysis (0.00005 to 0.00018 2g).These data clearly indicate that at the single grain scale,biotites preserve considerable isotopic diversity andwere not in isotopic equilibrium with the magma at thetime of eruption, contravening a fundamental tenet inisochron dating; namely that 7Sr/86Sr at t=0 washomogenous (Davidson et al., 2005b). 9. Conclusions Isotopic heterogeneity at the single-crystal scale,especially for Sr isotopes in feldspars, is becomingincreasingly apparent in magmatic rocks. Measuringsuch variations has been attempted by LA-MC-ICPMSand by micromilling followed by TIMS analysis, butonly the latter technique has the ability to copeadequately with interferences from Rb, Ca and REE indetermining Sr isotope ratios to the precision requiredfor widespread utility. We have honed and refined micromilling techniquesfor the removal of ug-sized solid samples fromtexturally controlled areas within crystals set in 100±50 um polished sections for Sr and Rb analysis at nglevels. High spatial precision is achieved through carefulcontrol of the geometry of milling, and pre-selection ofsample areas, such that ~3ng or more of Sr are obtainedfor TIMS analysis. Subsequent chemical isolation of Sr from microsamples under low blank conditions permitsanalysis of 87Sr/86Sr ratios to our long-term externalprecision (against NBS 987) of ±50ppm (2 S.D.) for3ng load sizes. Application of these techniques to a<50-ka-zoned plagioclase from Parinacota volcano,Chile, shows that differences inn87Sr/86Sr ratio assmall as 0.000072 can be distinguished at the 2 S.D.level. In addition, the same micromilled samples can bespiked for Rb-Sr analysis, where the Rb/8SRb ratioscan be determined to ±75ppm (2 S.D.) using Zr toperform external element normalisation on Rb. Thispermits one to either date, using Rb-Sr isochrons,sufficiently old or Rb-rich samples (provided initialequilibrium of 87Sr/86Sr ratios is demonstrable orassumed) or, alternatively, to show that a particularapparent Rb/Sr isochron is not valid due to heteroge-neity in the initial Sr/86Sr ratios. We can demonstrateusing this technique that an apparently precise Rb-Srisochron age for biotite fractions from the Fish CanyonTuff is not valid, because the various biotite crystalswere not in original isotopic equilibrium and must inpart be xenocrystic. This observation has importantimplications for the use of such ‘isochrons’ in resolvingthe timescales of magmatic evolution. Acknowledgements Technique development has been aided by discus-sions with Frank Tepley (University of Oregon). TodWaight and an anonymous reviewer provided helpfulreviews, which improved the quality of the manuscript.Early drafts benefited from comments by Colin Wilson.Roberta Rudnick is thanked for editorial comments.This work was funded through research grants fromNERC (NER/A/S/2000/01008) and the EC Framework5 (EVG1-2001-00046-ERUPT).[RR] References Bachmann, O.,Dungan, M.A., Lipman, P.W., 2002. The Fish Canyonmagma body, San Juan Volcanic Field, Colorado: rejuvenationand eruption of an upper-crustal batholith. J. Petrol. 43,1469-1503. ( Baker, J., Peate,D., Waight, T.,Meyzen, C., 2004. Pb isotopic analysis of standards and samples u sing a 2 07Pb _ 204Pb double s pike a nd thallium to correct for mass bias with a d ouble f o cusing MC- ICPMS. Chem. Geol.211,275-3 0 3. ) ( Birck, J.L., 1986. P recision K-R b- Sr i sotopic analysis: application toRb- S r chronology. Chem. G eol. 5 6, 73- 8 3. ) Bizzarro, M., Simonetti, A., Stevenson, R.K., Kurszlaukis, S., 2003.In situ 87Sr/86Sr investigation of igneous apatites and carbonatesusing laser ablation MC-ICPMS. Geochim. Cosmochim. Acta67, 289-302. ( Christensen,J.N., H a lliday, A.N., Lee, D .-C. , Hall, C.M., 1995. In s ituSr isotopic analysis by l aser ablation. Earth Planet. Sci.L e tt. 136,79- 8 5. ) ( Cox, R.A., Dempster, T.J.,Bell, B.R., Rogers,G., 1996. Crystallisationof the Shap Granite: evidence from zoned K-feldspar megacrysts. J. Geol. Soc. (Lond.) 153, 625-635. ) ( Davidson, J.P., Tepley Ⅲ I, F.J., 1997. Recharge i n volcanic systems;evidence from isotope profiles o f p h enocrysts. S c ience 2 7 5, 826-829. ) ( Davidson, J.P. , Tepley Ⅲ I, F. J.,Knesel,K . M., 1998. Cr y stal is o tope stratigraphy; a method for constraining magma dif f erentiation pathways. Eos, 79, 185, 1 89, 193. ) ( Davidson, J . P., T epley Ⅲ I , F . J., P a lacz, Z . , M e ffan-Main, S., 200 1 . Magma recharge, contamination and residence times revealed by insitu laser ablation isotopic analysis of feldspar in volcanic rocks. E a rth Planet. Sci . Let t . 184,427 - 442. ) ( Davidson, J .P., Hora, J.M., Garrison , J.M. , Dungan, M.A., 2005a.Crustal forensics in arc magmas.J. V o lcanol. Geotherm. Res. 140 , 157-170. ) ( Davidson, J., C harlier, B. , Hora, J .M., P erlroth,R., 2005b. M i neralisochrons a n d is o topic fingerprinting: pi t falls a n d promises. Geology 3 3, 29- 3 2. ) ( Deniel, C . , P in, C ., 2 001. Single-stage method for the sim u ltaneousisolation of lead and strontium f rom silicate samples f or isotopic measurements. Anal. Chim. Acta 426, 95-103. ) ( Geist, D.J., Myers, J.D., Frost , C .D., 1988. Megacryst bulk rock isotopic disequilibrium as an i n dicator of contamination processes, the Edgecumbe Vo l canic Field, Al a ska. Co n trib. Mi n eral.Pet r ol.99, 1 05- 1 12. ) ( Ginibre, C., Worner, G., K ronz, A., 2002a. M i nor an d trace el e ment zoning in plagioclase: implications fo r magma chamber processes at P arinacota V olcano, N. C h ile. C o ntrib. Mineral. Pe t rol. 14 3 , 300-315. ) ( Ginibre, C . , Kronz, A., Worner, G ., 2002b. High-resolut 1 i t o 1o n q uanti-tative imaging o f p l agioclase c omposition us i ng accumulatedback-scattered electron i mage: n ew co n straints on osc i llatoryzoning. Contrib. M ineral.Petrol. 1 42, 436-4 4 8. ) ( Hildreth, W., 1981. Gradients in s ilicic magma chambers: implicationsfor lithospheric magmatism. J. Geophys.Res. 8 6, 1 0153-10192. ) ( Horwitz, E.P., Chiarizia, R ., D eitz, M.L., 1992. A n ovel str o ntium-selective extraction chromatographic resin. S o lv. E x tr. I o n E x ch.10,313-336. ) ( Lanphere, M .A., Baadsgaard, H., 2001. Precise K- Ar , 4Ar/Ar, Rb- Sr and U/Pb mineral ages from the 27.5Ma Fish Canyon T uff reference standard. Chem. Geo l .175,653 - 671. ) ( Lipman, P . W., 2 0 00. Th e ce n tral Sa n Juan cal d era clu s ter: re g ionalvolcanic framework. In: Bethke, P.M., H ay, R.L. ( Eds.),Ancient L ake Creede: Its V olcano-Tectonic S etting, History ofSedimentation, a nd R e lation o f Mineralisation i n t h e CreedeMining D i strict. Spec. P ap.-Geol. Soc. Am., v o l. 3 4 6, p p . 9 - 6 9 . ) Ludwig, K.R., 2002. Isoplot/Ex version 2.49: A GeochronologicalToolkit for MicrosoftTM ExcelTM. Berkeley Chronology Center,Berkeley, CA. ( Mahoney, J. B ., Weiss, D. , Keiffer, B. , Fr i edman, R., Pretorius, W., Scoates,J., Goolaerts, A., Maerschalk, C., 2003.Ongoing isotopiccharacterization of USGS standards: MC-I C PMS and TIMS data f rom the P a cific Centre f o r i s otopic a n d geochemical res e arch, University of British Columbia, P aper 1 17 -18, Geol. S o c. A m .2003, S eattle Annual Meeting. ) ( Mank, A . J.G . , M a son, P.R.D., 199 9 . A c r it i cal ass e ssment of lase r ablation I CP M S as a n a na l ytical tool for depth anal y sis in silica-based glass samples. J . Anal. At. Spectrom. 1 4, 1 143-1153. ) ( Minster, J.F., Ricard, L.P., 1981 . The isotopic composition of zirconium. Int. J. Mass Spectrom. Ion Phys. 37 , 259- 2 72. ) ( Muller, W. , 2003. S trengthening t he l ink b etween geochronology,textures and petrology.Earth P l anet. Sci. Lett. 206,2 3 7-251. ) ( Miiller , W. , Mancktelow, N.S., Meier, M., 2000. Rb-Sr microchronsof synkinematic mica in mylonites: an example from the DAV faultof the E astern A lps. Earth Planet. Sci . L ett. 180, 385-397. ) ( Miinker, C., Weyer, S., Scherer, E., Mezger, K ., 2001. Separation of high field strength elements (Nb, Ta, Zr, Hf) and L u fr o m ro c ksamples for MC-ICPMS measurements. Geochemistry, Geophys· ics, Geosystems 2, paper numbe r 2001GC000183. ) ( Nebel, O ., M ezger, K ., S cherer, E .E., M iinker, C., 2005. H igh precision determinations of 8Rb/Rb in ge o logic ma t erials by MC-ICPMS. Int. J. Mass S pectrom. 246, 10-18. ) ( Nomura, M . , K o gure, K., O k amoto, M. , 198 3 . Iso t opic ab u ndanceratios and atomic weight o f zirconium. I nt. J . Mass Spectrom. IonPhys. 50, 219. ) ( Ramos, F . C., Wolff, J.A., T ollstrup, D.L., 2004. Measuring Sr/Sr variations in minerals and groundmass from basalts using LA-MC- ICPMS. Chem. Geol. 2 11, 135-158. ) ( Rickwood, P.C., 1 9 77. A technique for extracting small crystals f rom thin sections . Am. Mineral. 62, 382 -3 84. ) Rosman, K.J.R., Taylor, P.D.P., 1998. Isotopic composition of theelements 1997. Pure Appl. Chem. 70, 217-236. ( Sahoo, S.K., M asuda, A . , 1 9 97. P r ecise measurement of zirconium i sotopes by t hermal i onisation mass spectrometry. C hem. Geol. 141, 117-126. ) ( Sanloup,C., Bliche r t-Toft,J., Telouk, P., A l barede, F. , 2000. Zr isotope a nomalies in c h ondrites and th e pr e sence of°Nb in the e a rly solar system. Earth P l anet. Sci. Lett. 184, 7 5 -8 1 . ) ( Schmidberger, S . S., Simonetti, A., Francis, D . , 2 0 03. Small-scale Sr isotope investigation o f clinopyroxenes from pe r idotite xenoliths by laser ablation MC-ICPMS: implications for ma n tle metasoma- tism. Chem. G eol. 1 99, 317-329. ) ( Schmitz, M .D., Bowring, S . A., 2 0 01. U - Pb zir c on and tit a nitesystematics of the Fish Canyon T uff: an a ssessment o f h igh-precision U- P b geochronology and its ap p lication to young volcanic rocks . Geochim. Cosmochim. Acta. 65, 2 571-2 5 87. ) ( Siebel, W., Reitter , E. , Wenzel, T. , Blaha, U., 2005. S r i sotope systematics of K-feldspars in plutoni c rock s revealed by theRb-Sr m icrodrilling technique . Chem. Geol. 222, 183-199. ) ( Simonetti, A., B e ll, K . , 1 9 93. Is o topic disequilibrium in c l inopyrox- e nes from n e phelinitic lavas, N apak V o lcano, ea s tern Ug a nda Geology 21, 243- 2 46. ) ( Steiger, R.H., Jager , E. , 1977. Subcommission on g eochronology:convention on the u se of decay constants in geo- and cosmochro-nology. Earth Planet. Sci. Lett. 36, 359-362. ) ( Sylvester, P . (Ed.), 2001. L aser-ablation-ICPMS in the Ear t h Sci e nces.Principles and applications. Min. Assoc. C a nada, Sh o rt Course, vol. 29.243 pp. ) ( Tepley II, F .J., D avidson, J . P., 2 0 03. M in eral-scale Sr - isotope constraints on magma evolution and chamber dynamics in th e Rum layered intrusion, Scotland. Contrib. M ineral. P etrol. 1 45, 628-641. ) ( Tepley I II, F.J. , Davidson, J.P., Clynne, M .A., 1999. Ma g maticinteractions as recorded in plagioclase phenocrysts of Chaos Crags,L a ssen Volcanic C e n t er, California. J . Petrol. 40, 787-8 0 6. ) ( Thirlwall, M.F .,1 991. Long-term reproducibility of multicollector Srand Nd isotope ratio analysis. Chem. Geol . , Iso t .Geo s ci. Sect. 94, 85-104. ) ( Waight, T.E., Maas, R ., N icholls, I .A., 2000. Fingerprinting feldspar phenocrysts u sing c r ystal i sotopic composition stratigraphy: ) ( implications f or crystal transfer and magma mingling in S-type g ranites. Contrib. M ineral. P etrol. 1 39, 227-2 3 9. ) ( Waight, T . , Baker, J ., Peate, D., 2002a. Sr isotope ratio measurements by double-focusing MC-ICPMS: t e chniques, observations and pitfalls . In t . J. Mass Spectrom. 221 , 229-244. ) Waight, T., Baker, J., Peate, D., 2002b. Rb isotope dilution analysesby MC-ICPMS using Zr to correct for mass fractionation: towards improved Rb-Sr geochronology? Chem. Geol. 186,99-116. ( Woodhead, J . D., H ergt, J .M., 2 000. P b-isotope a nalyses o f U SGS reference materials. Geostand. Geoanal. Res. 24,33-38. ) CHEMGE- No of Pages 在岩浆岩中,将单晶微晶化以得到微量的固体样品进行同位素分析,可以从晶体(尤其是长石)中获得重要的成岩信息。由于可以在钻前充分评估样品区域的纹理背景,因此可以获得特殊的细节。在大块岩石尺度上进行分析时,这些信息是未知的或丢失的。在此,我们提出了一种综合的方法来精确分析从矿物中提取的微量固体样品中纯化的铷和锶的钠含量。物理采样技术是基于计算机数控(CNC)钻样机(Micromill™),新设计的专门针对复杂增生的采样和增长结构。物理采样技术是基于计算机数控(CNC)钻样机(Micromill分别介绍了用于TIMS和MC-ICPMS分析的Sr和Rb分离的化学方法,并在微钻产生的样品尺寸较小的情况下评估了这些分析技术的性能。物理采样技术是基于计算机数控(CNC)钻样机Micromill机械取样、常规溶出和化学分离,再经TIMS分析,虽然费时,但仍是测定大多数地质材料中Sr同位素组成的最准确和最精确的方法,其范围广泛,包括Sr浓度、Rb/Sr比值和基体类型。使用这些技术,可以实现长期的2 S.D.外部精度50ppm的负载尺寸小至3ng Sr。物理采样技术是基于计算机数控(CNC)钻样机Micromill我们用两个例子证明了这些技术的有效性。首先从< 50 ka单一长石晶体Parinacota火山(智利)显示,87 Sr / 86锶同位素范围可达0.00006,微量的放射锶可以忽略不计。第二种是来自科罗拉多28.4Ma鱼峡谷凝灰岩,用于演示同位素稀释测量Rb和Sr含量计算87Rb/86Sr的效用,从而对87Sr/86Sr比值进行定年校正,以建立单晶或区域之间87Sr/86Sr的变化。我们证明了鱼峡谷凝灰岩中的黑云母晶体的sr同位素变化远远超过了分析误差,因此所涉及的晶体并不处于同位素平衡状态,不能用来建立等时年份。另一方面,我们同位素稀释测量的精度可以用来测量铷、锶。
确定


还剩18页未读,是否继续阅读?

产品配置单
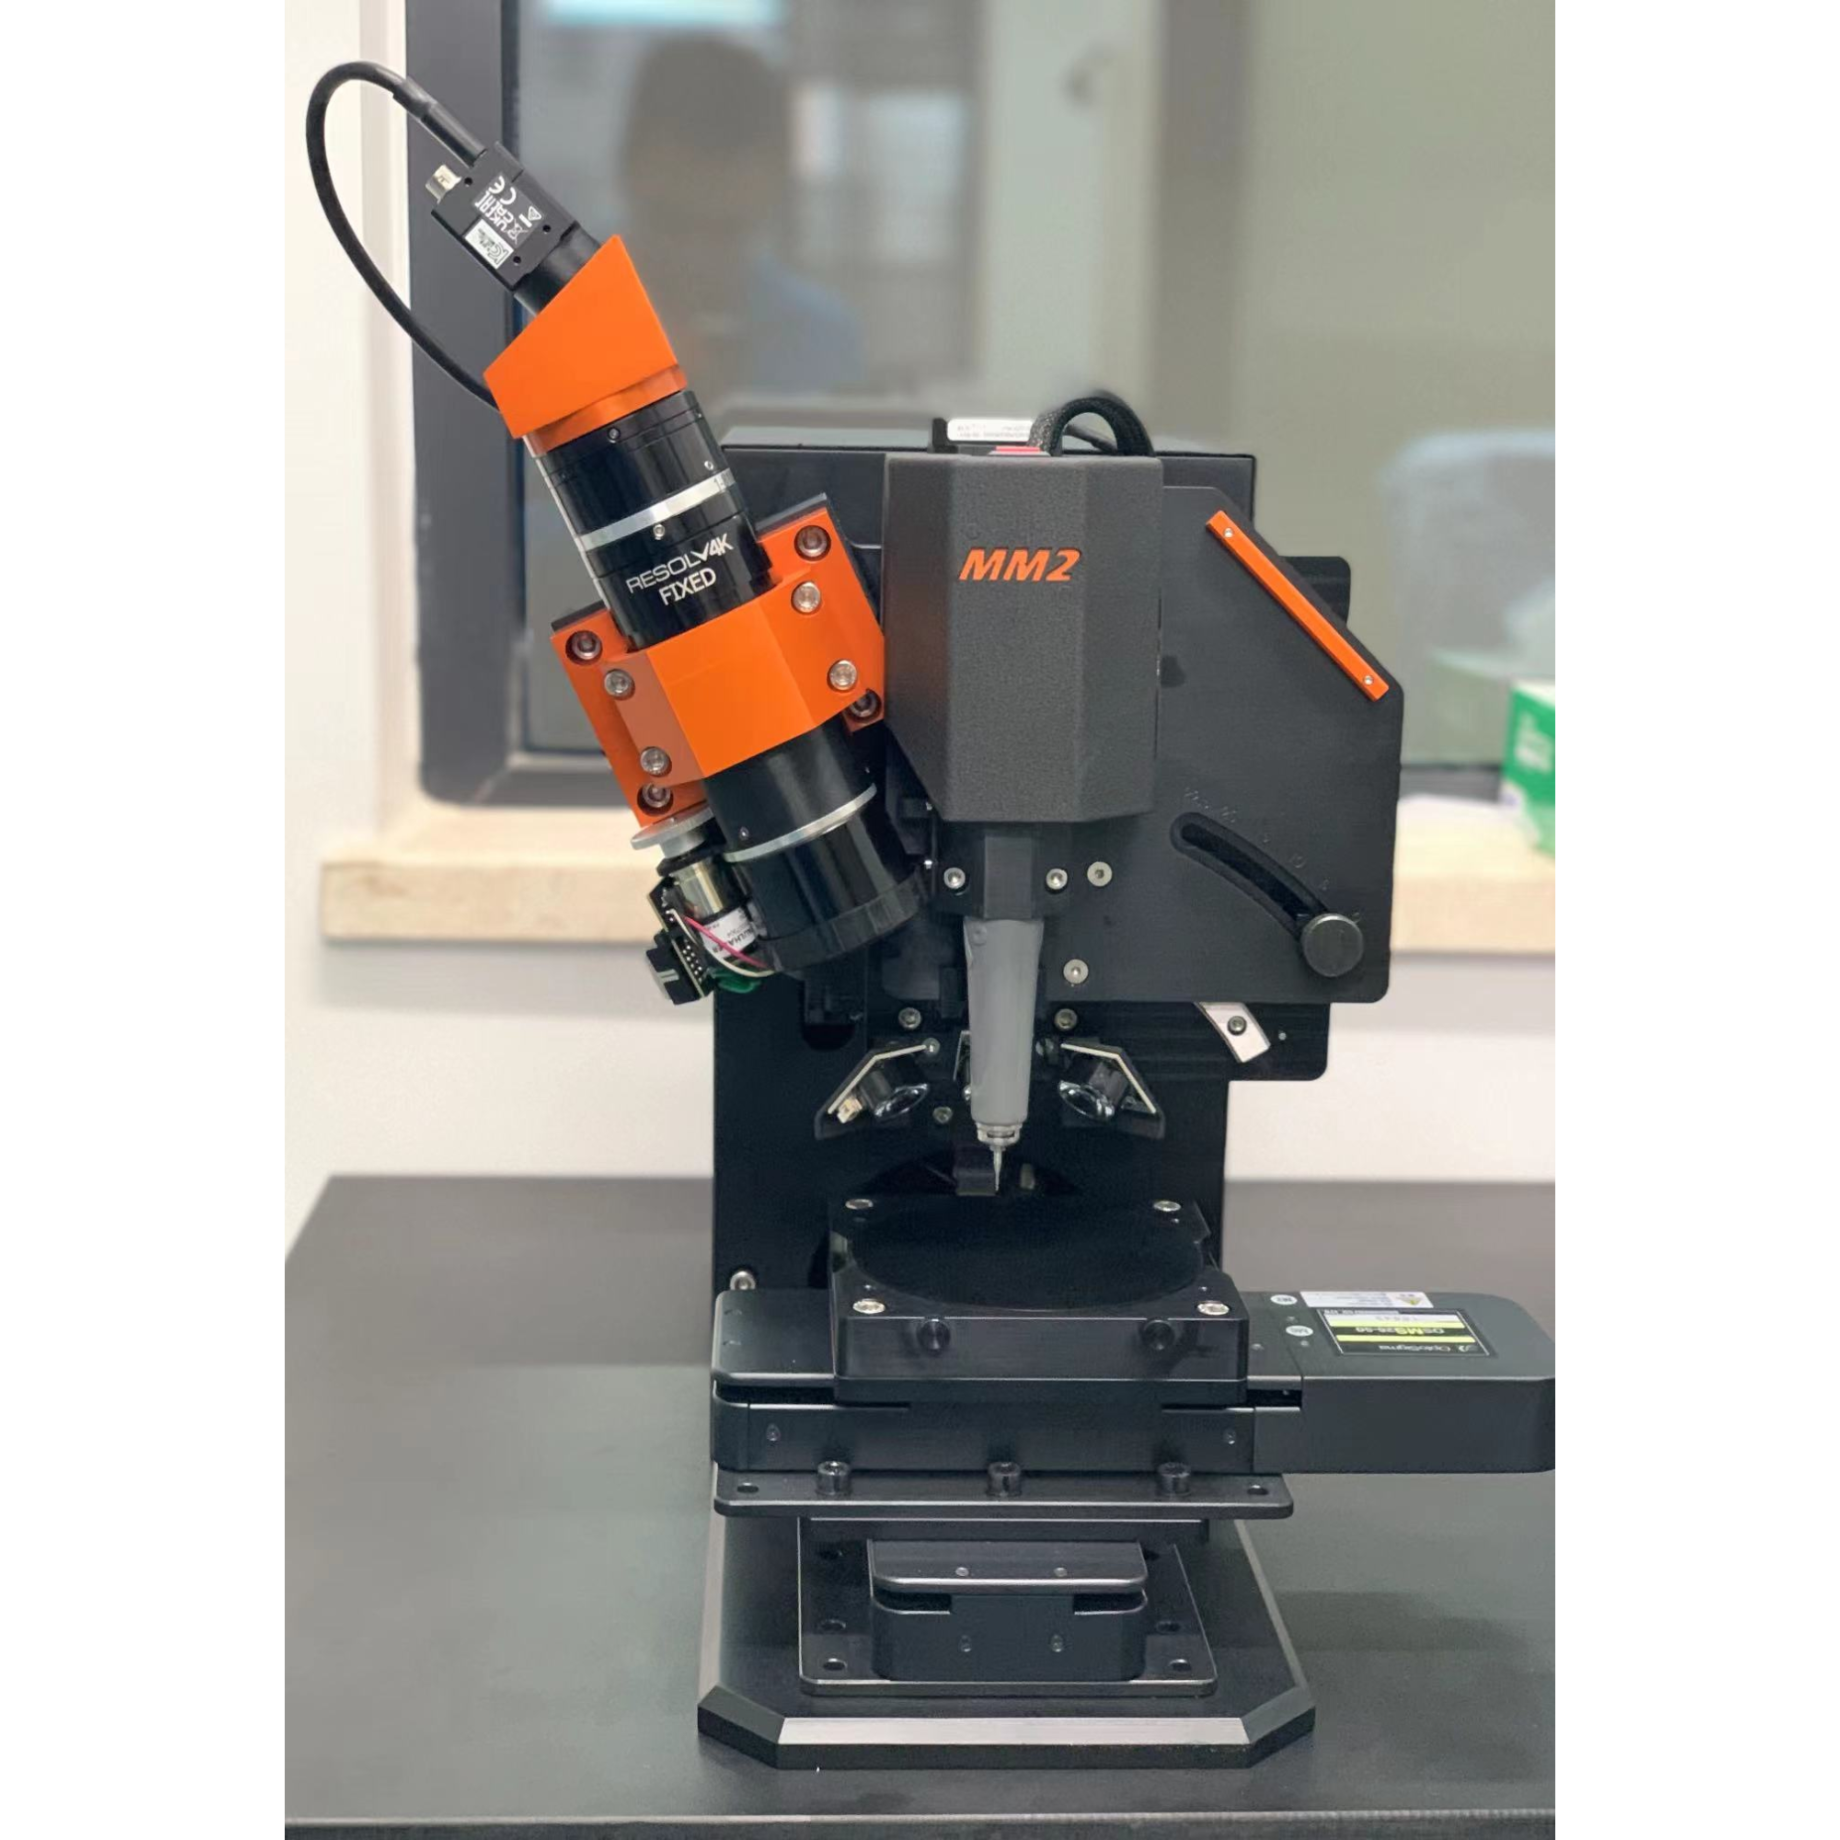
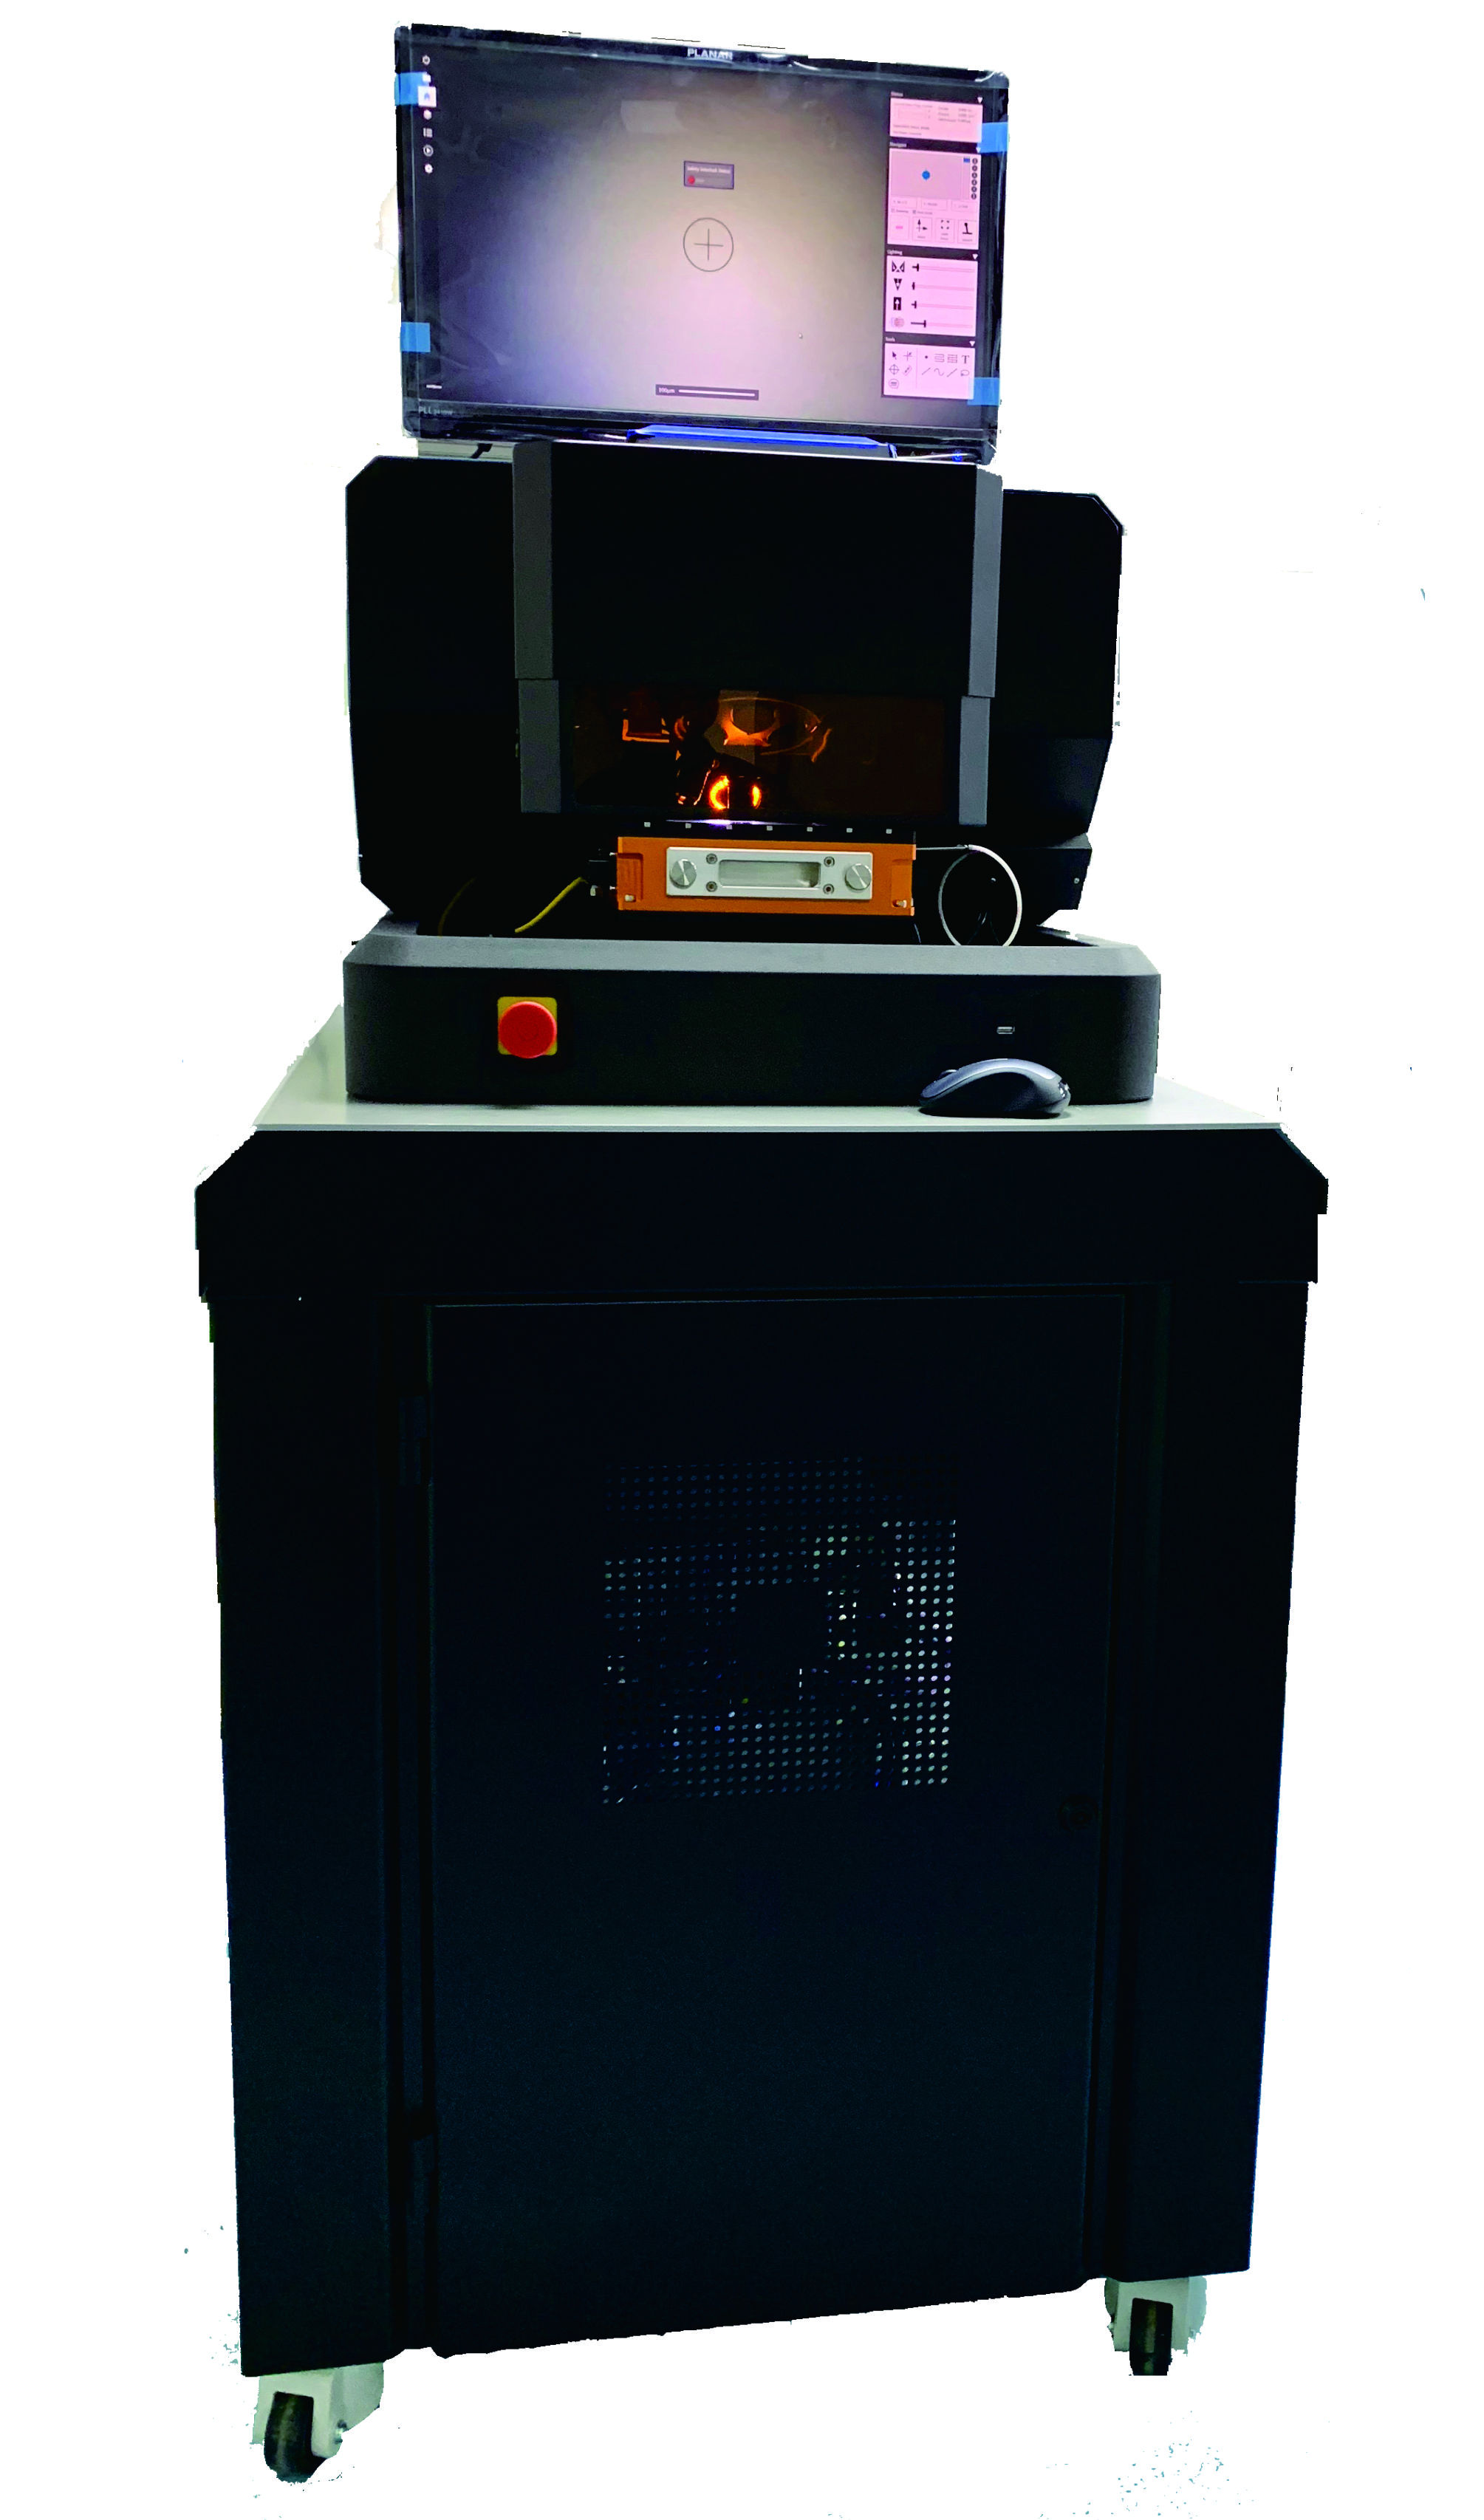
上海凯来仪器有限公司为您提供《用于岩石学和地质年代学的单晶尺度锶和铷同位素的微采样和高精度分析方法(英文原文)》,该方案主要用于金属矿产中微取样检测,参考标准--,《用于岩石学和地质年代学的单晶尺度锶和铷同位素的微采样和高精度分析方法(英文原文)》用到的仪器有MicroMill2 高精度微区取样仪
推荐专场
相关方案
更多
该厂商其他方案
更多