


方案详情
文
用美国Artium公司的新一代的PDI-200MD型粒子粒径速度测试系统,测量了柴油喷雾对象的喷雾液滴粒径和速度,并以此来检验验证一种新型的测试方法L2F技术的有效性。
方案详情

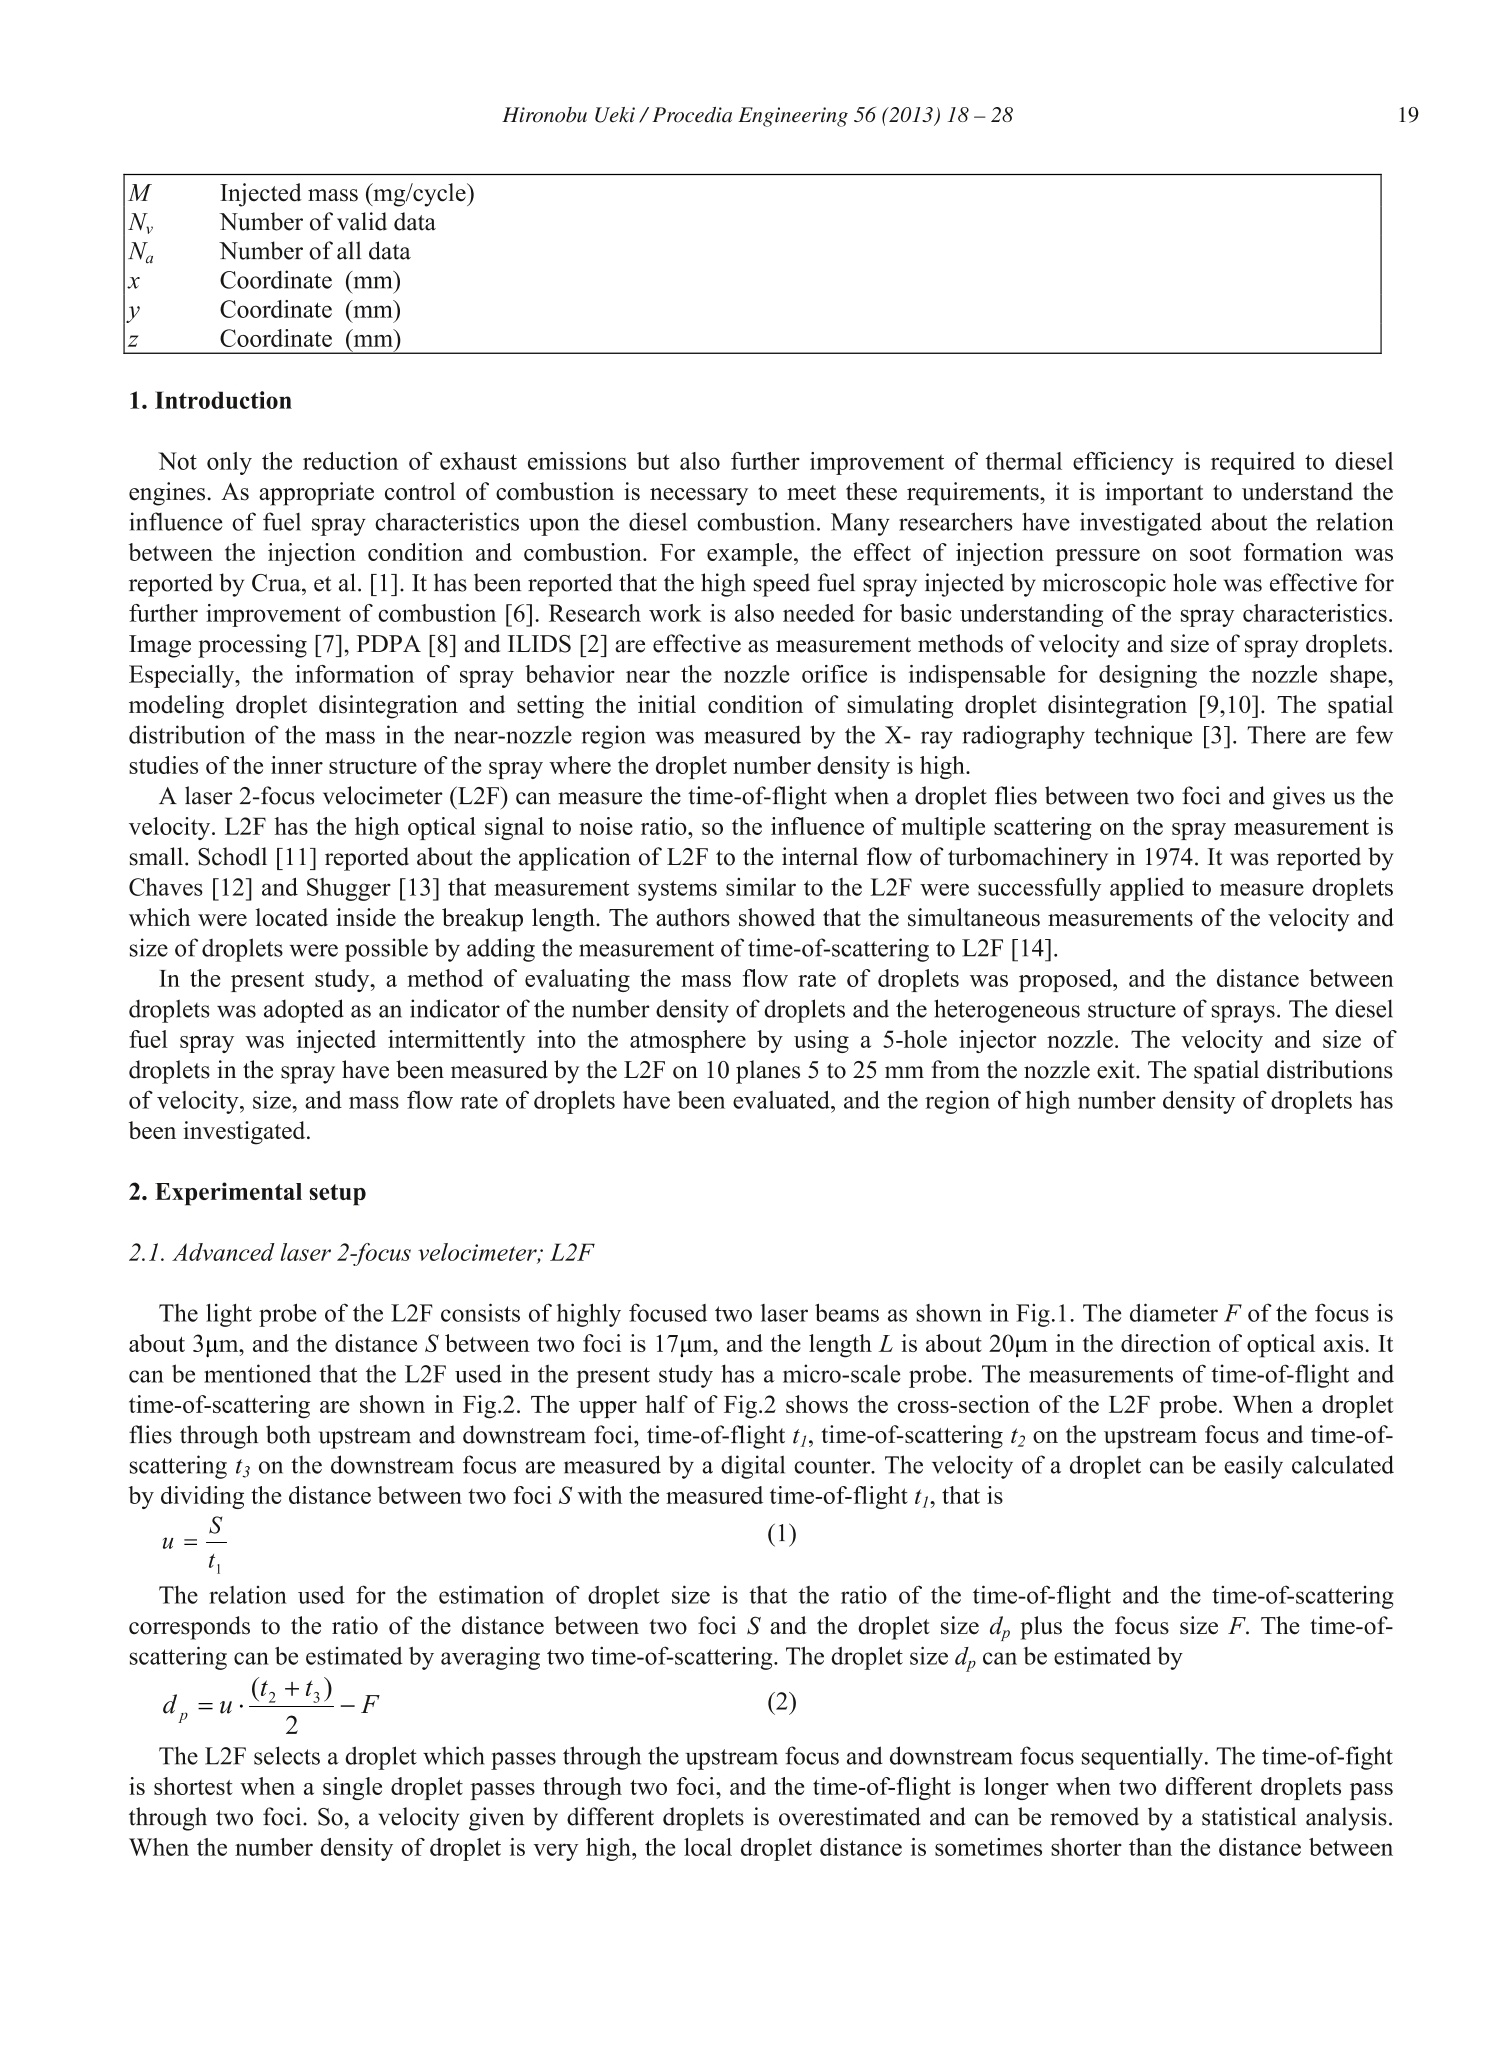
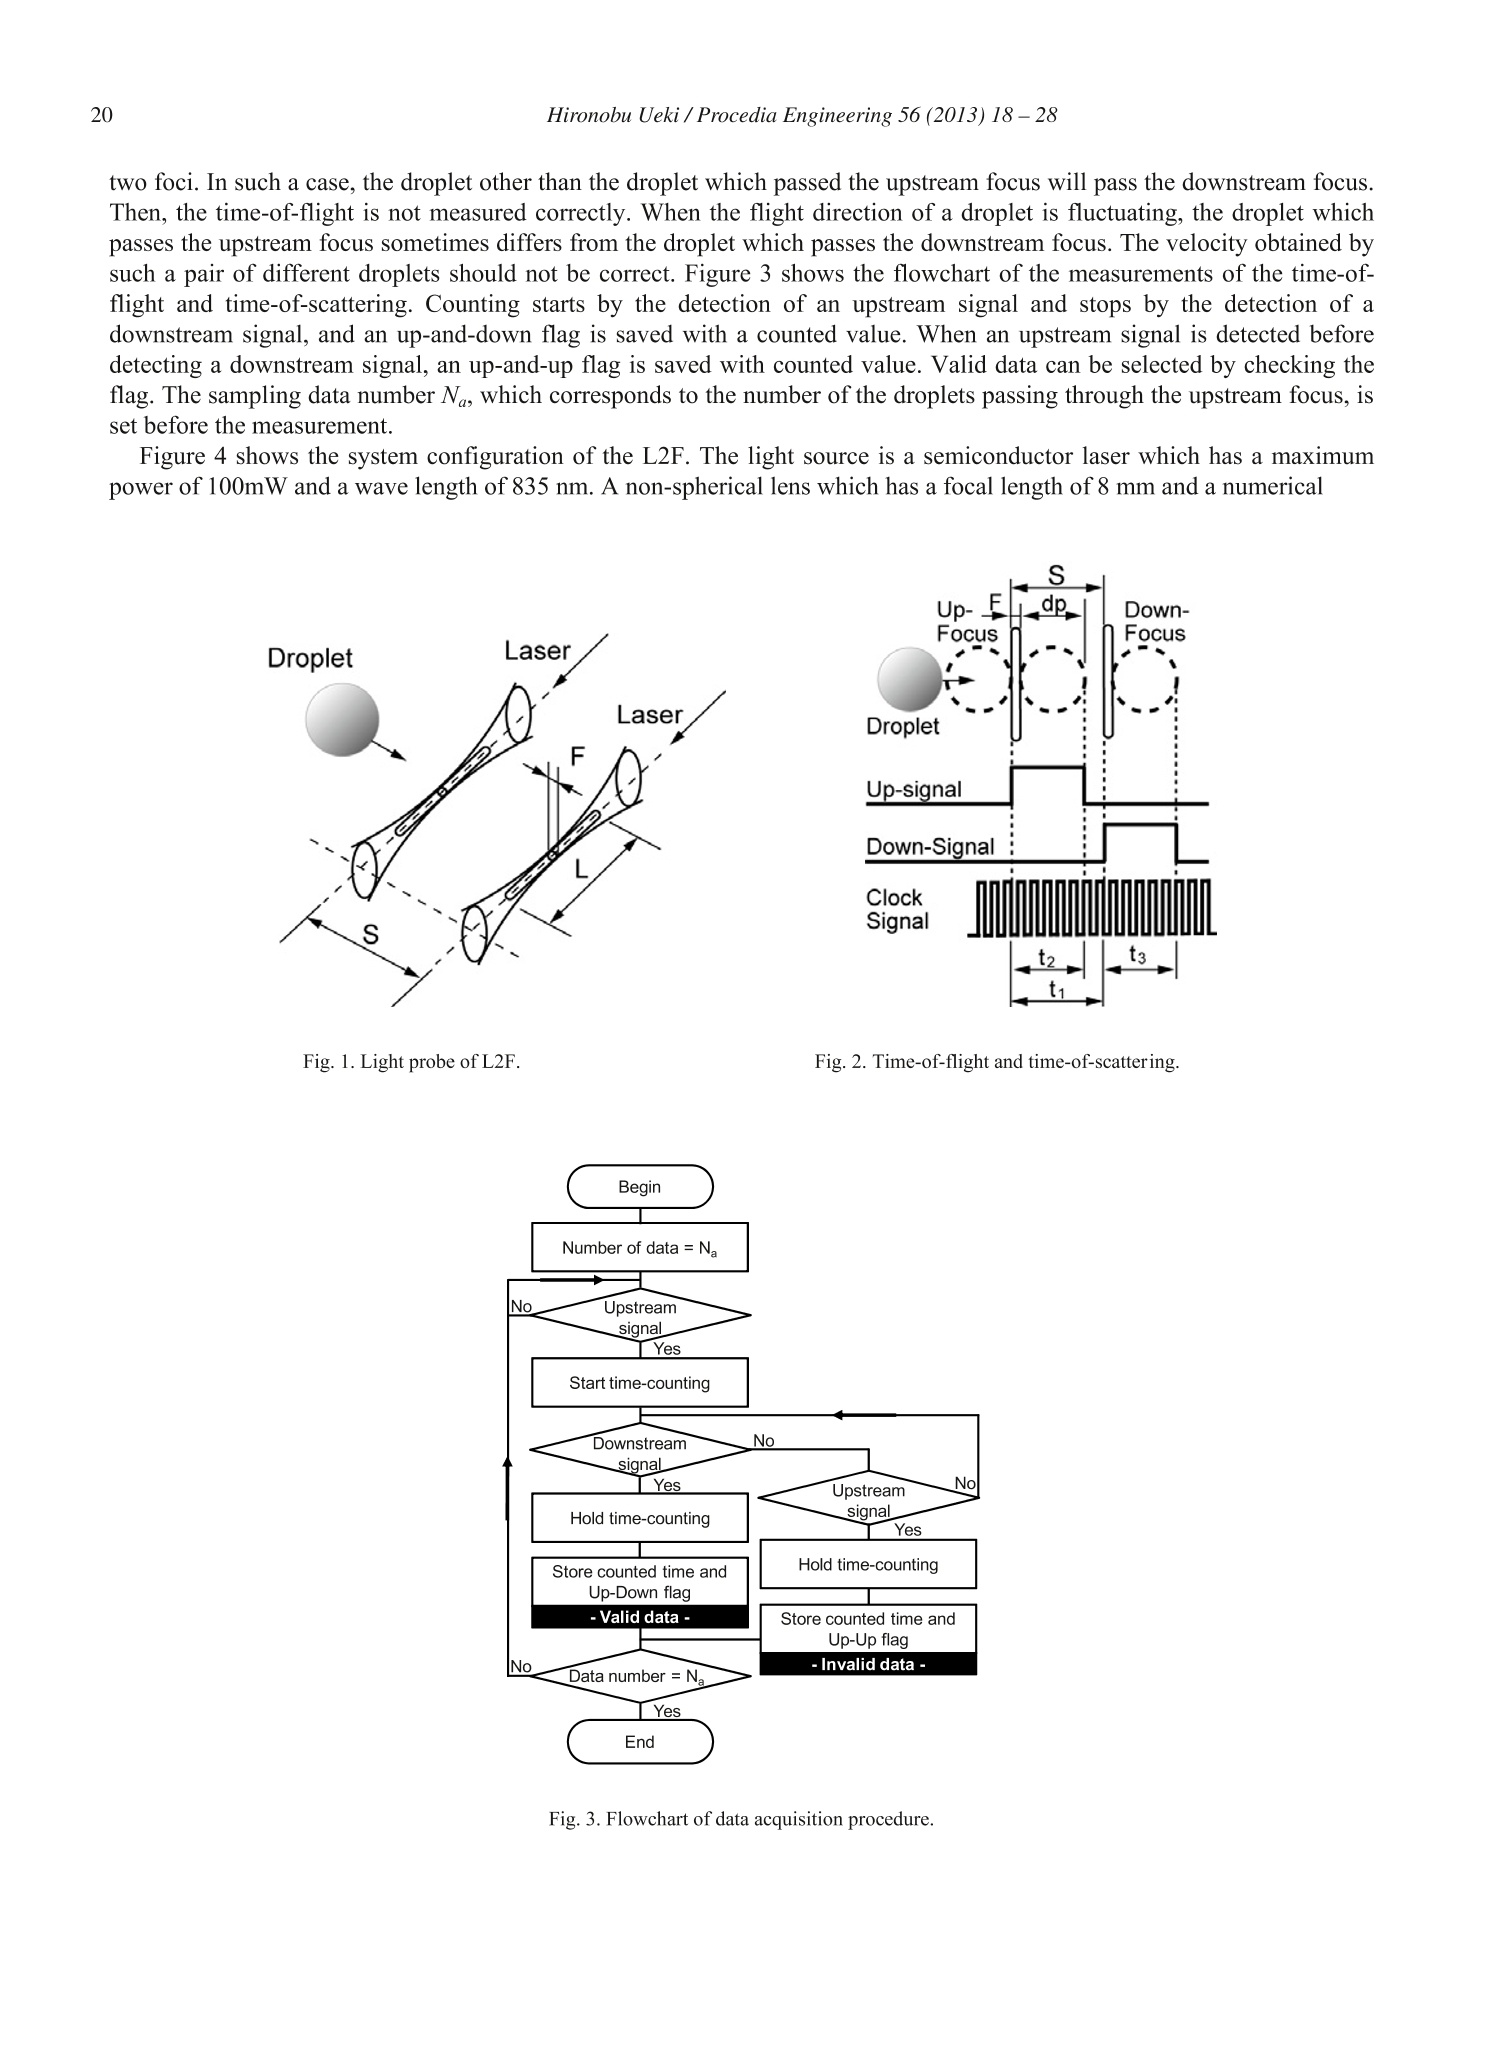
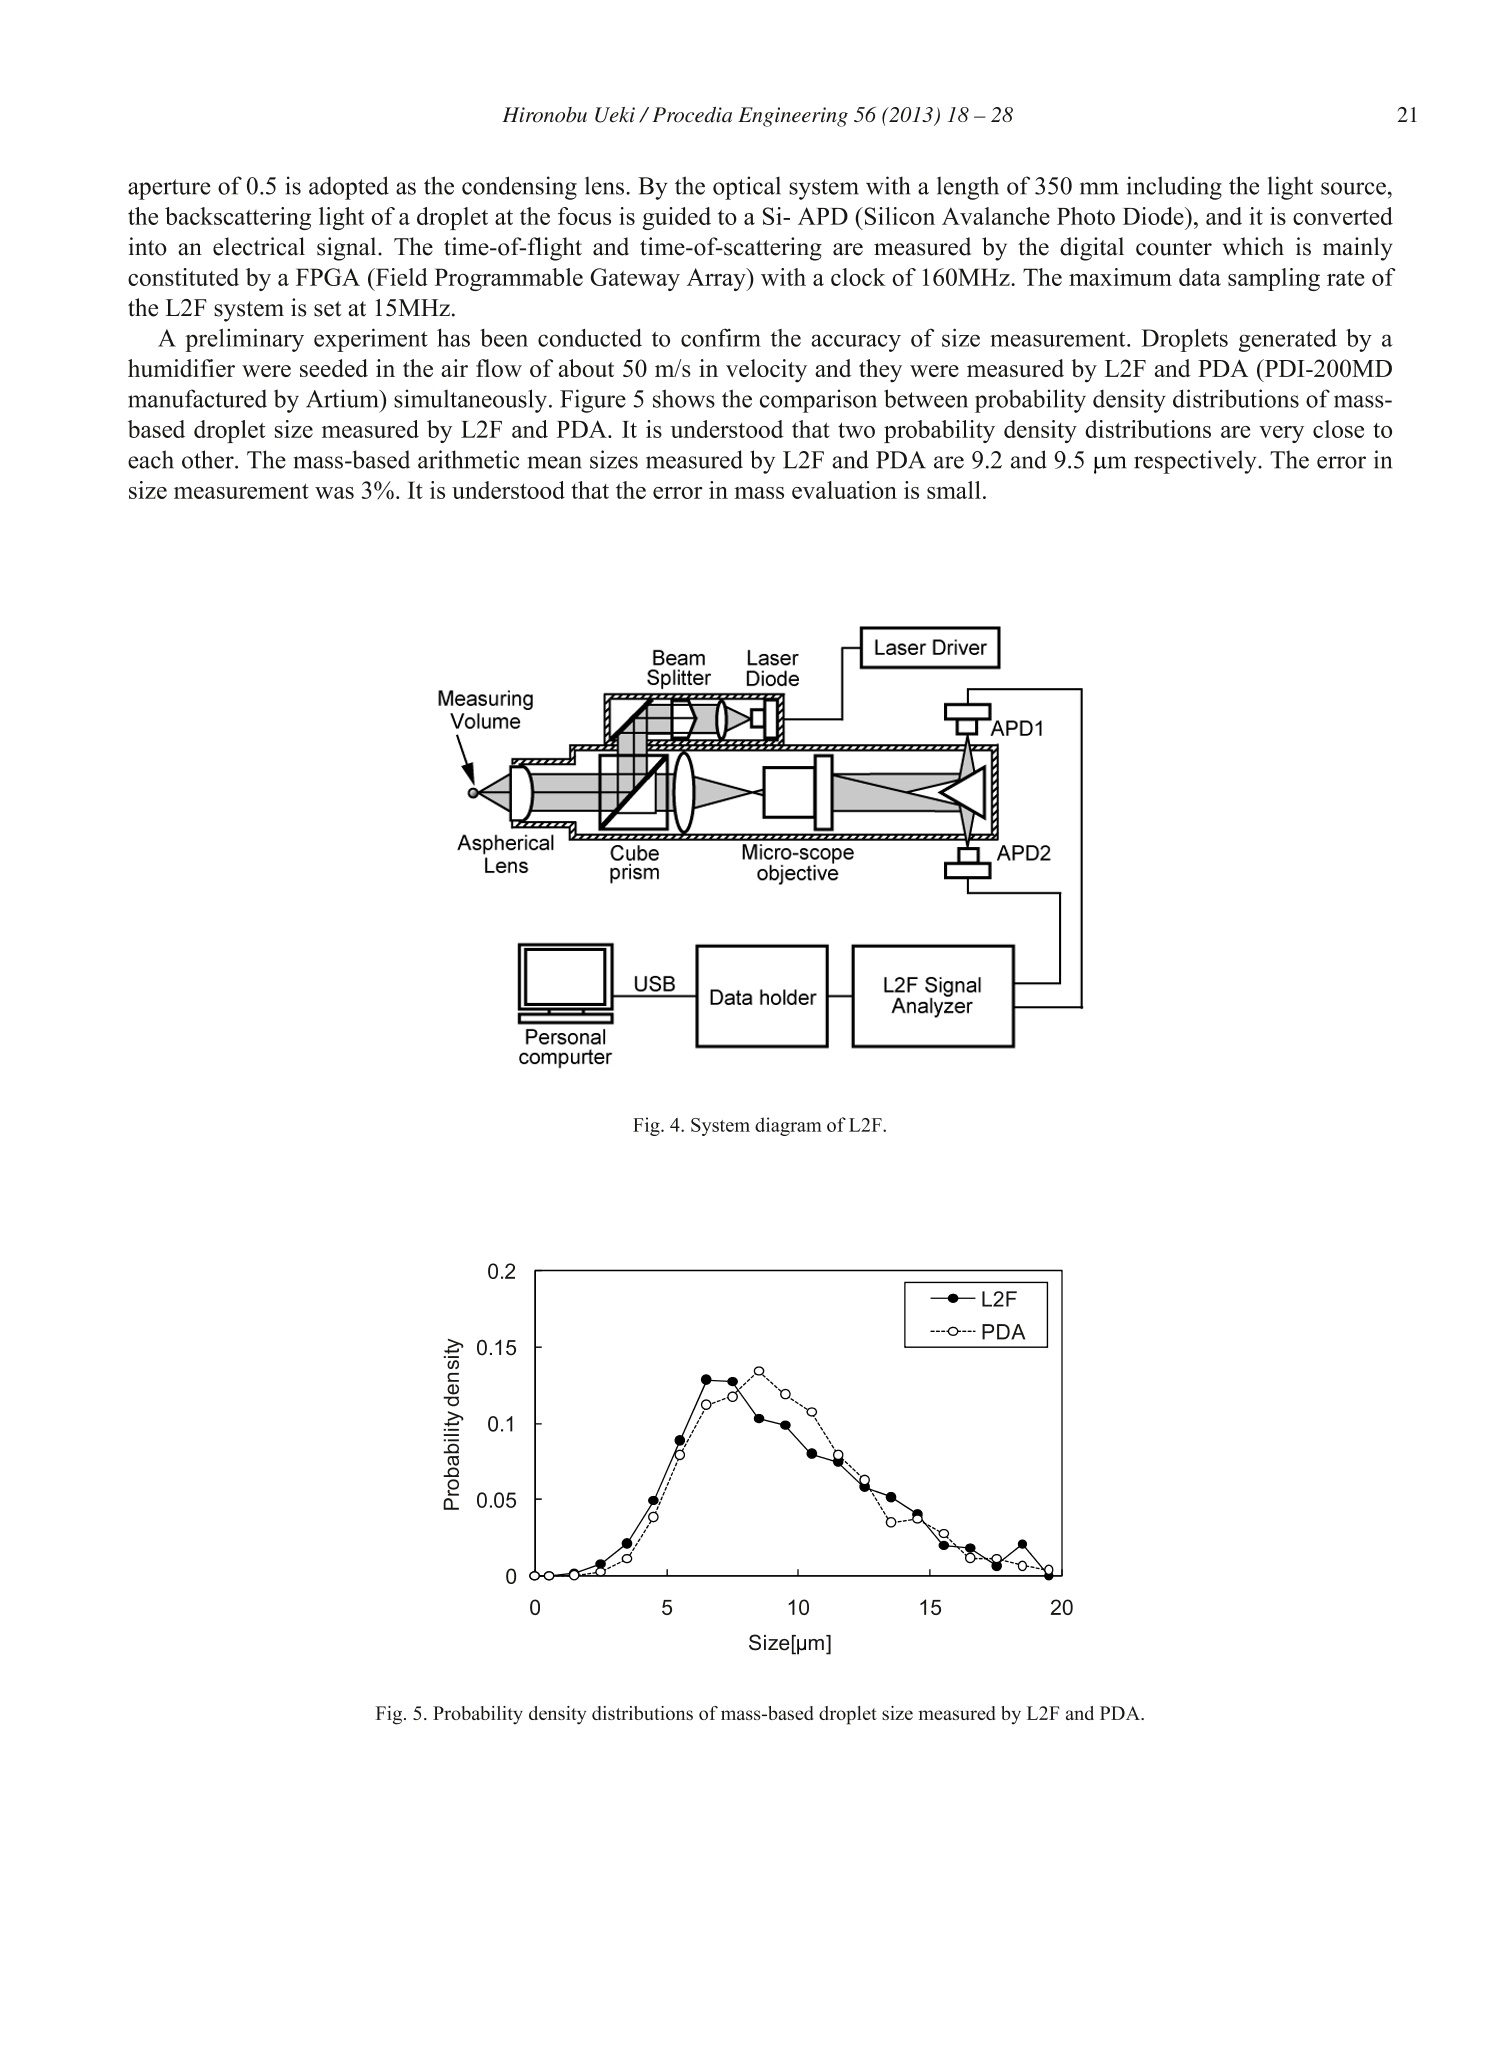
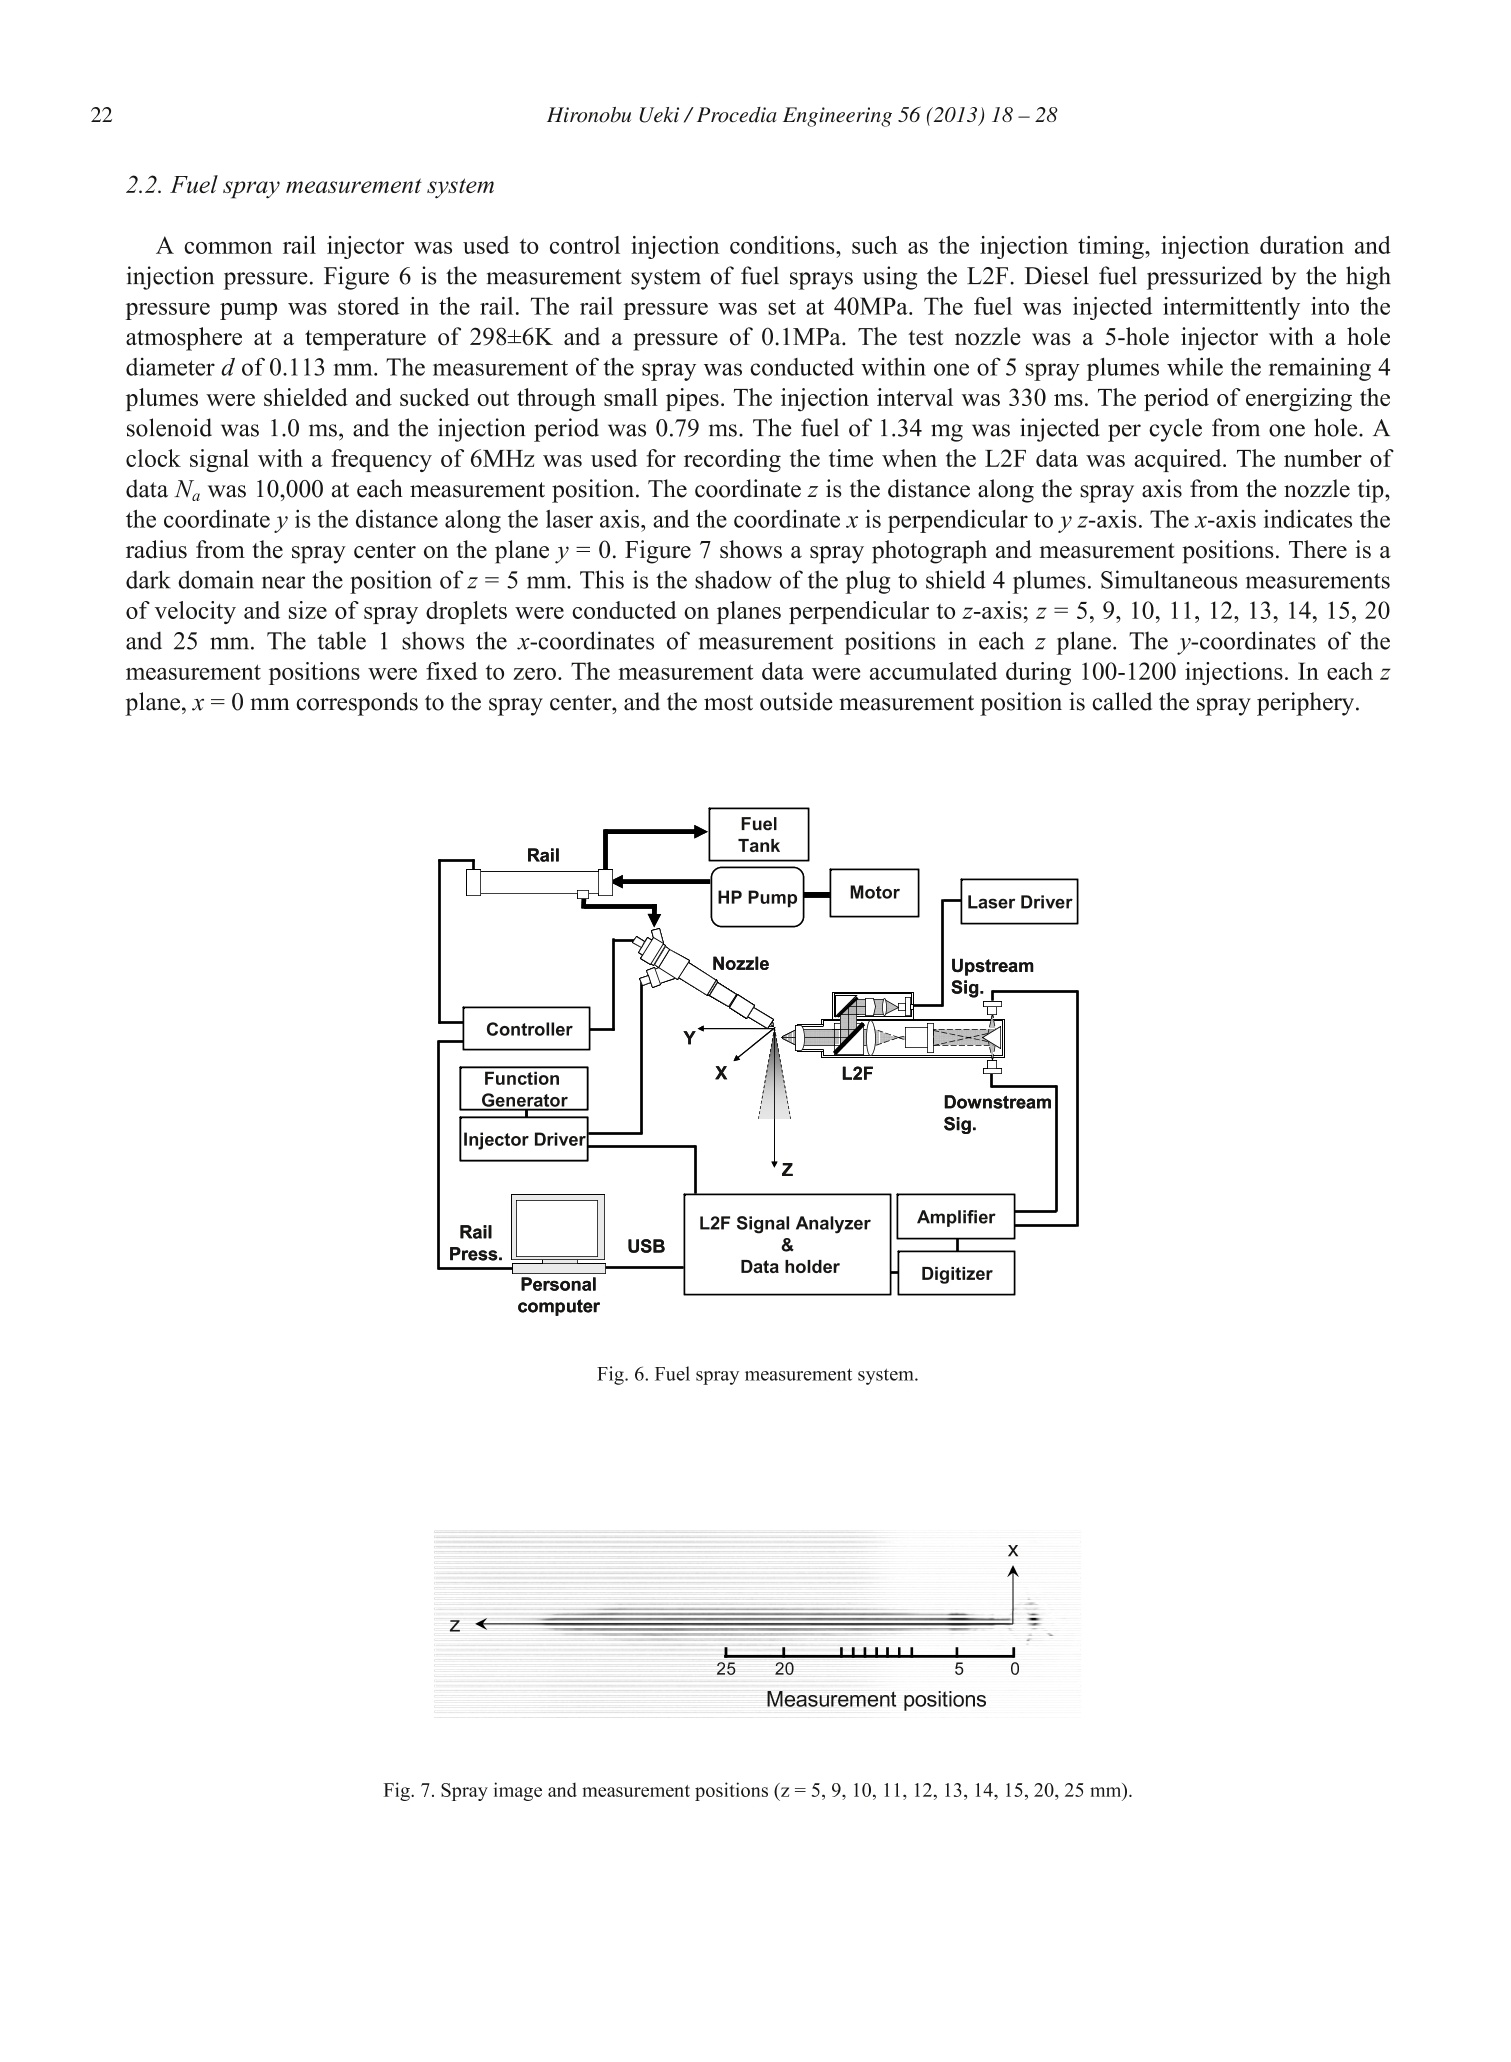
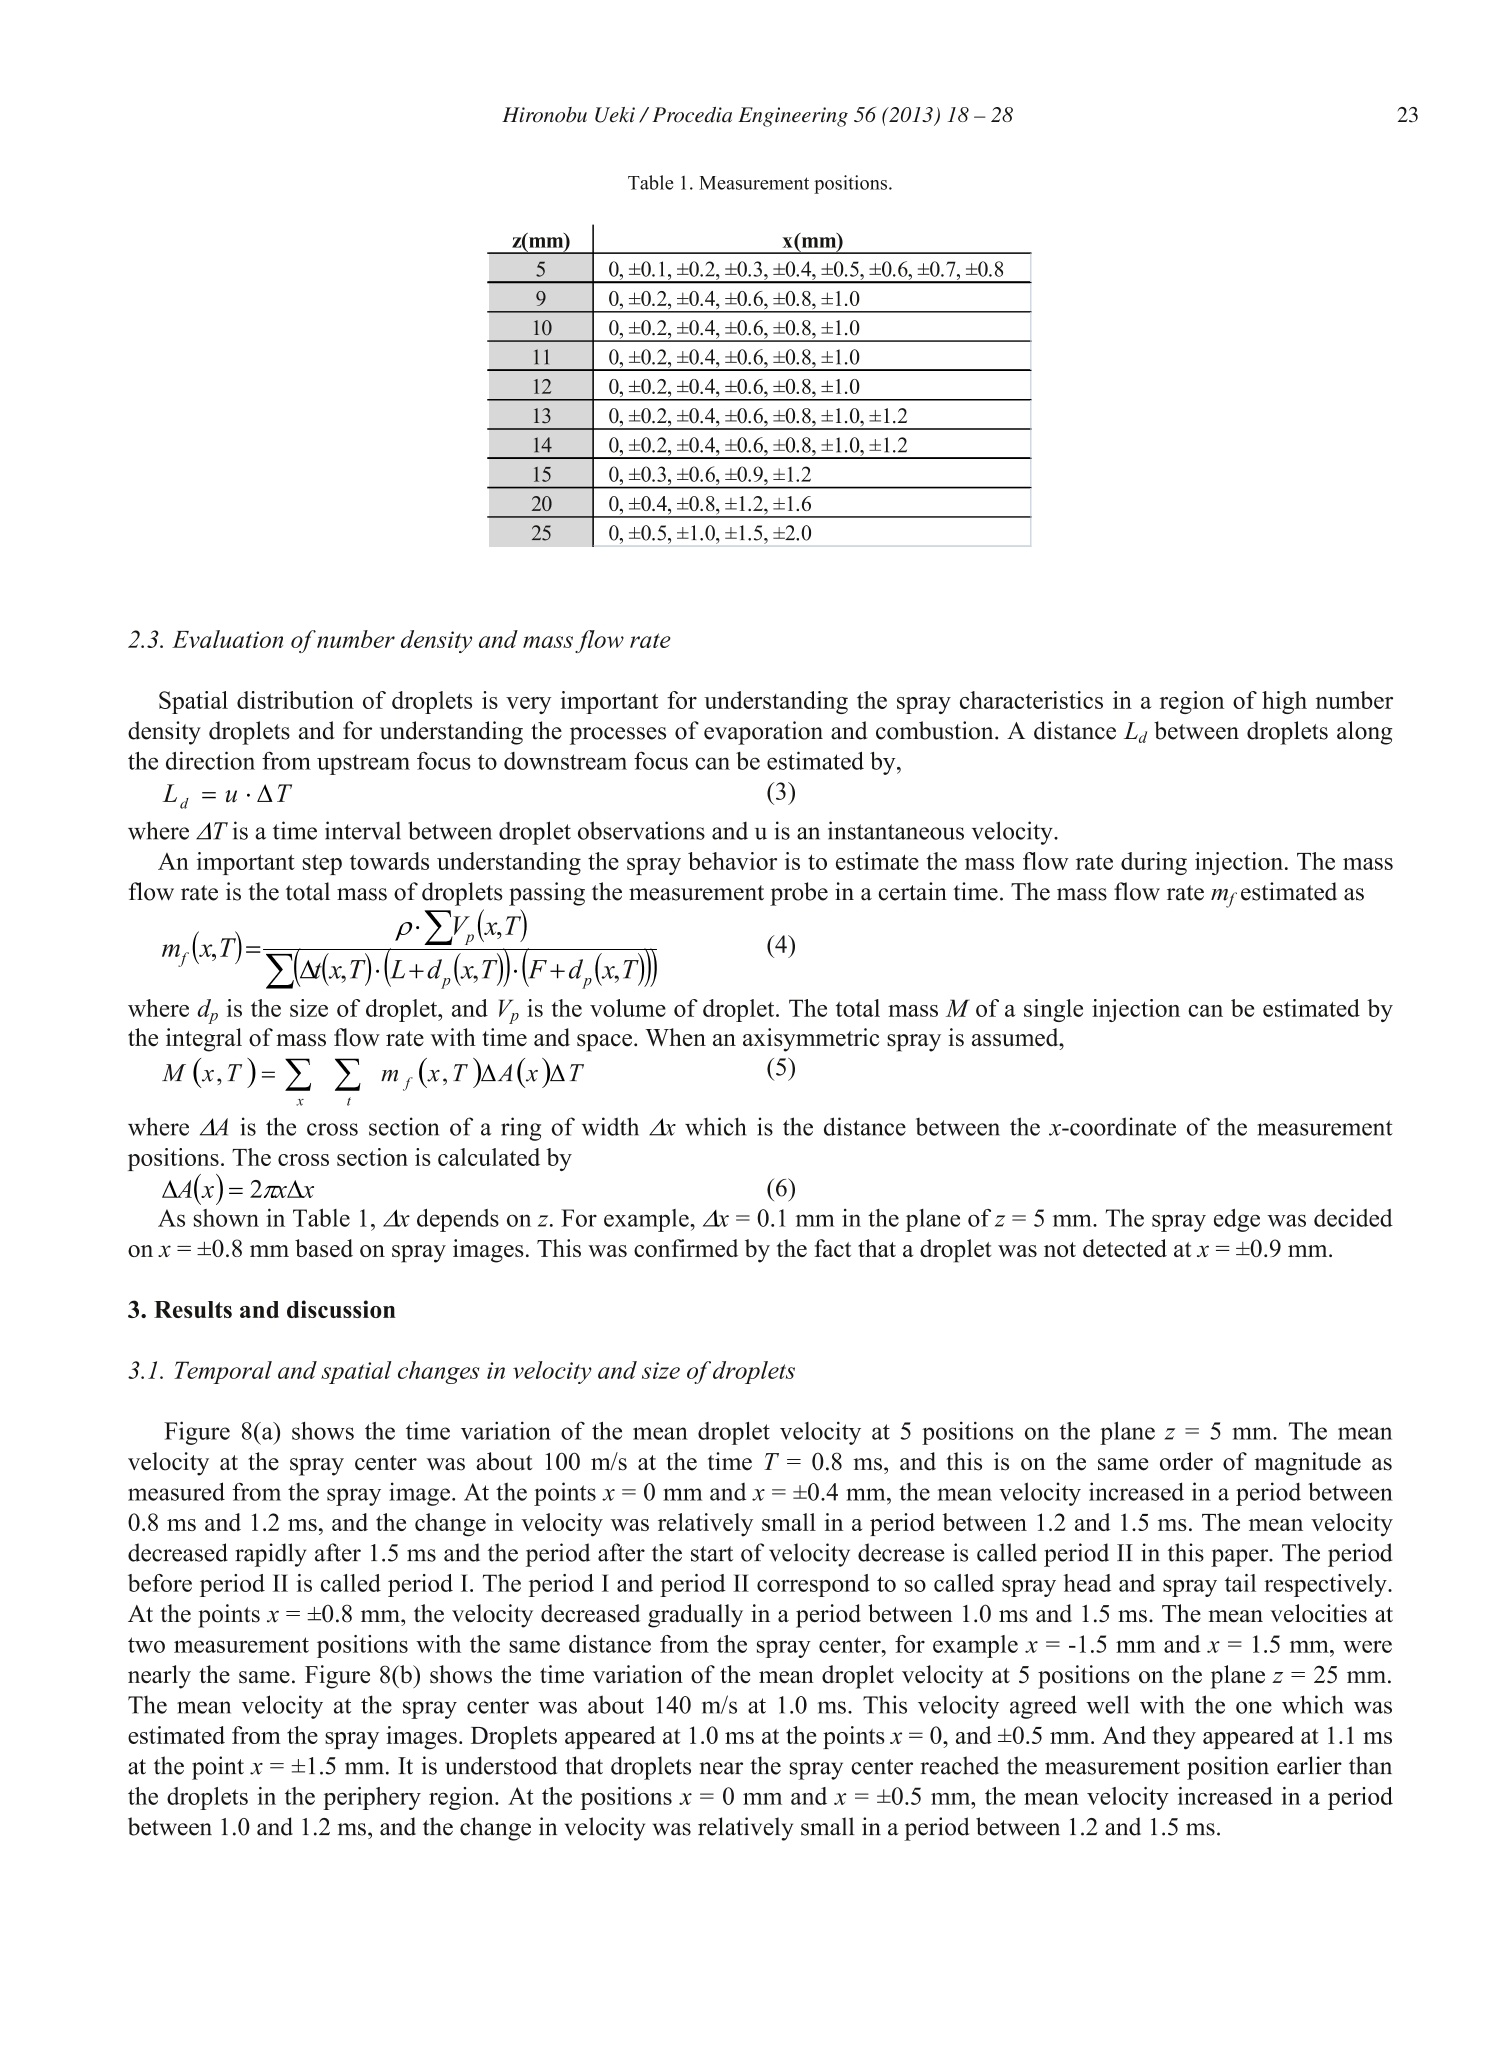
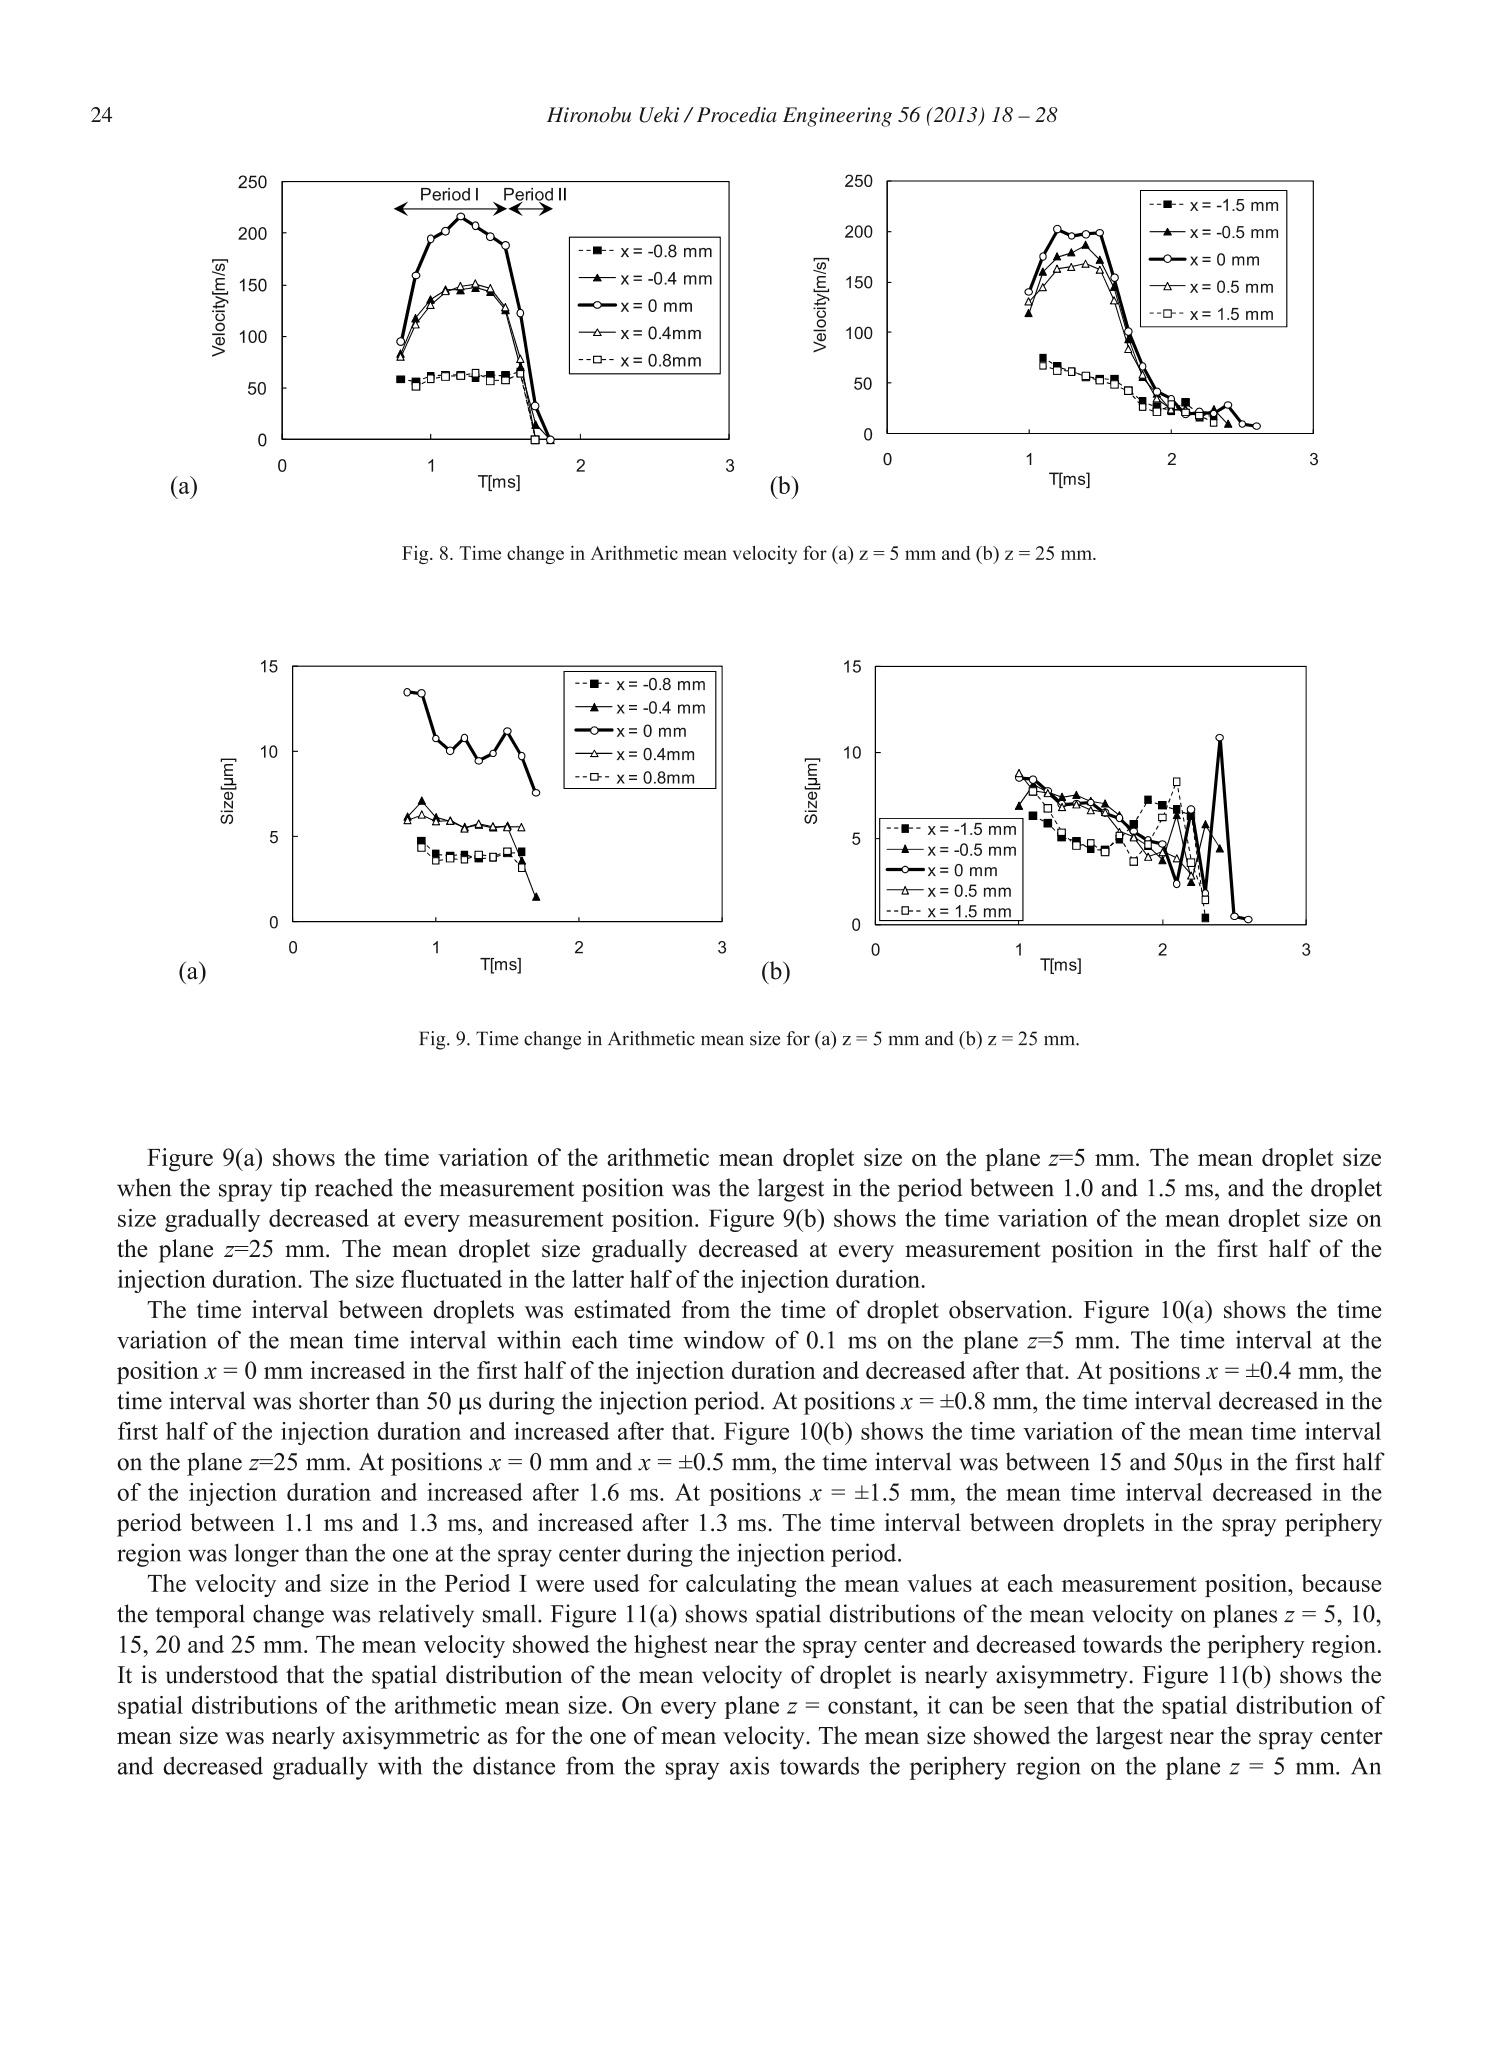
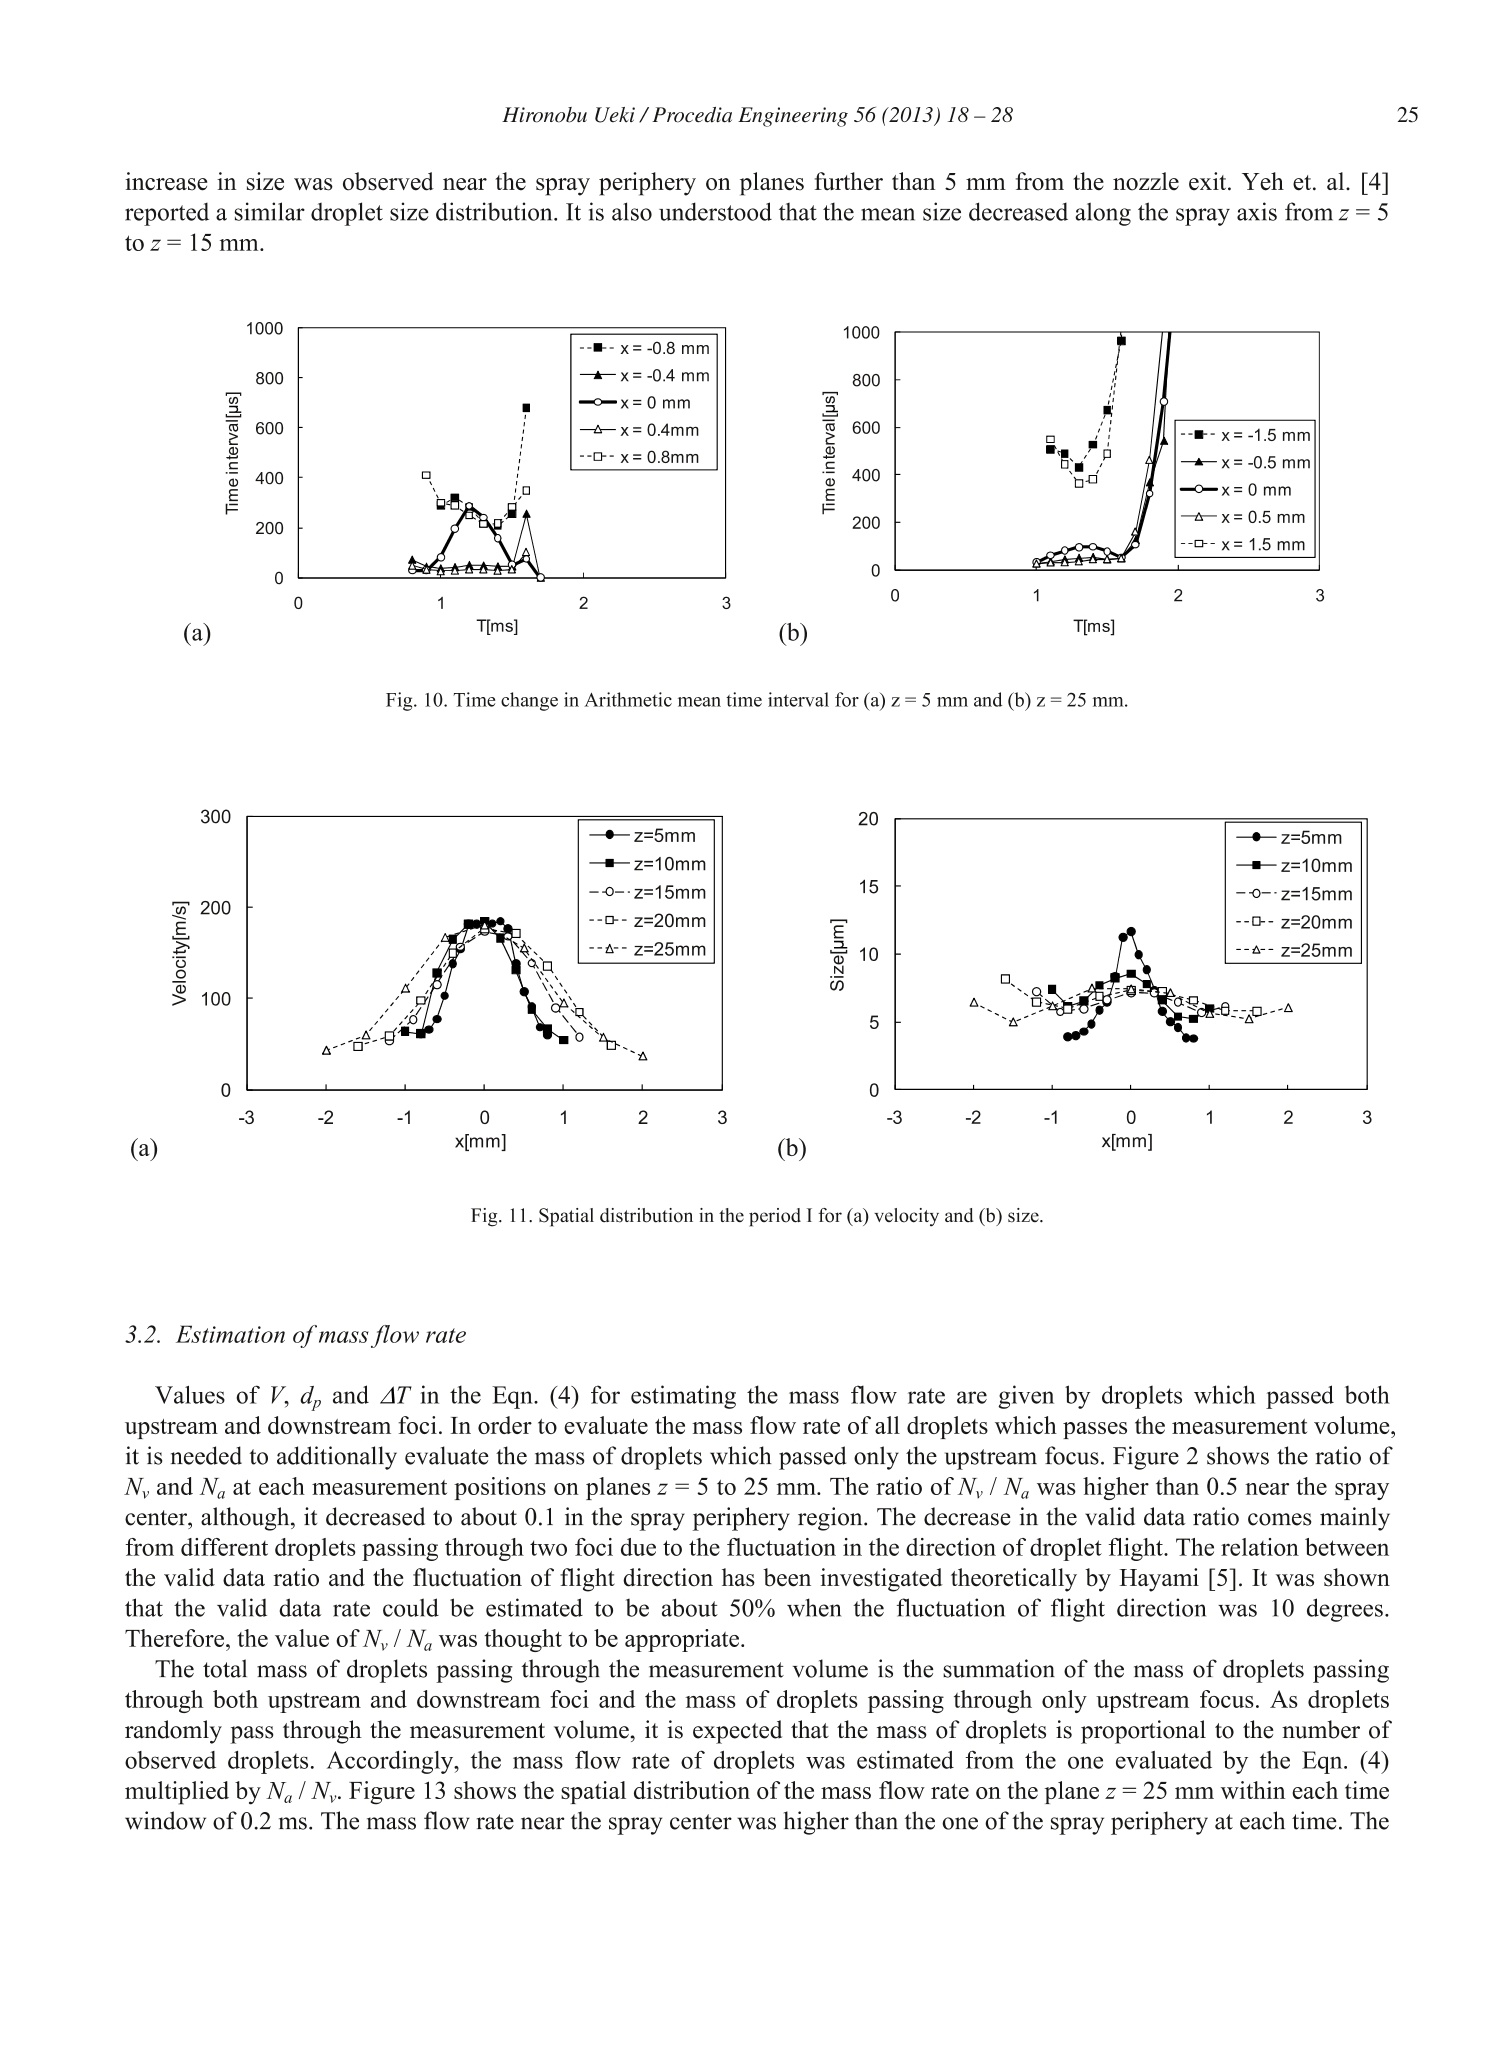
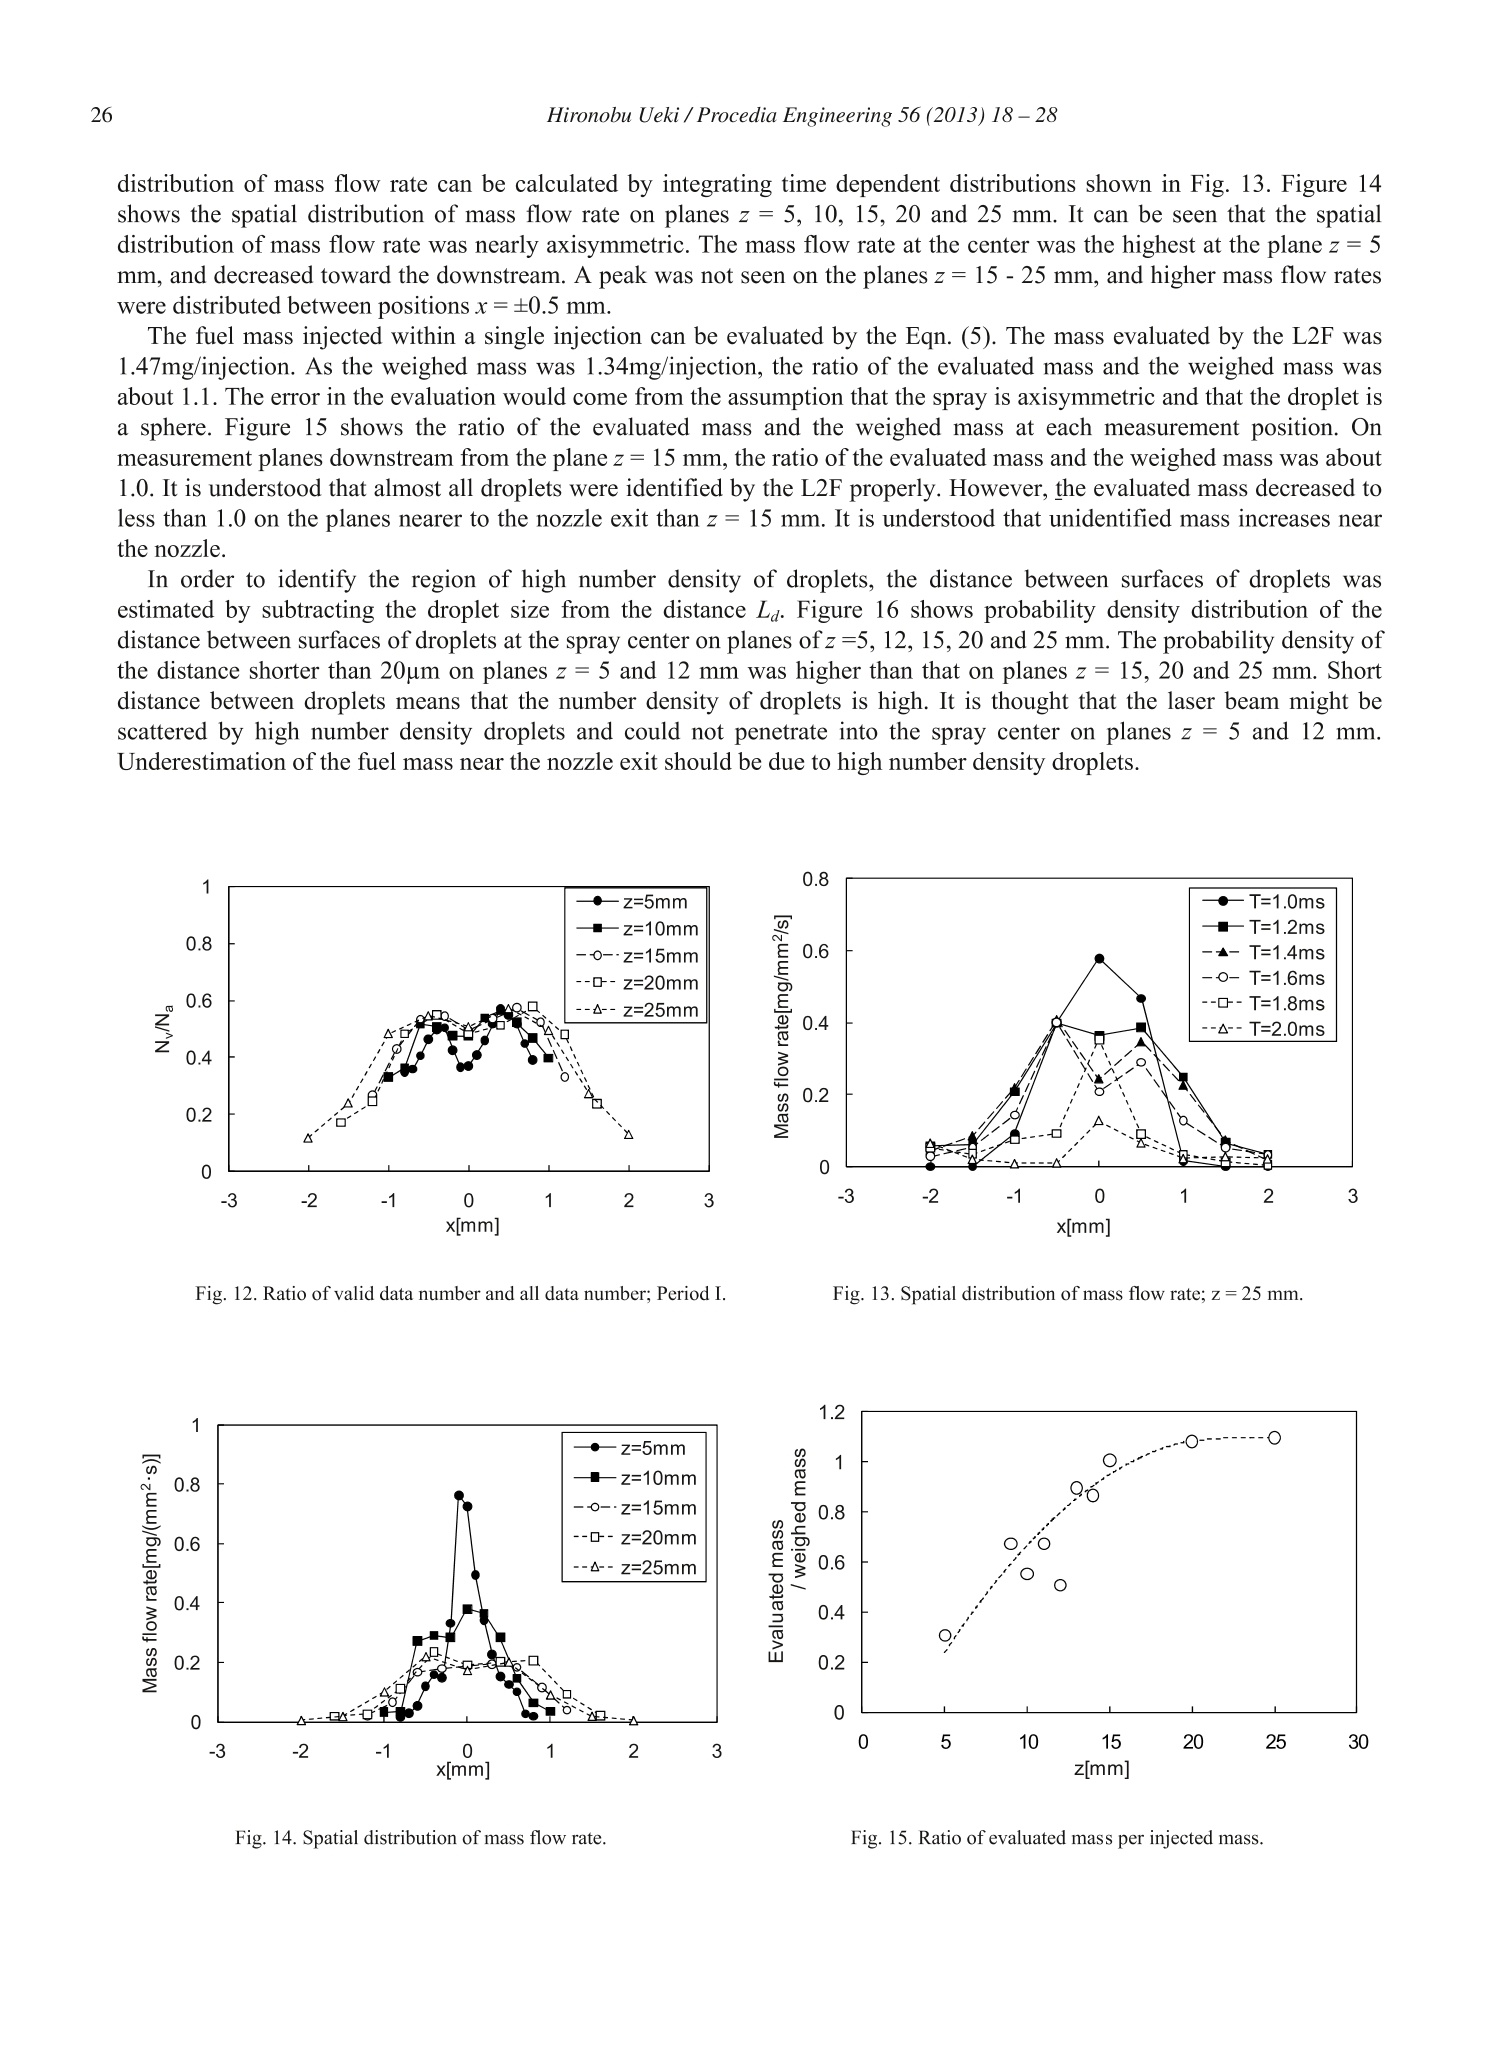
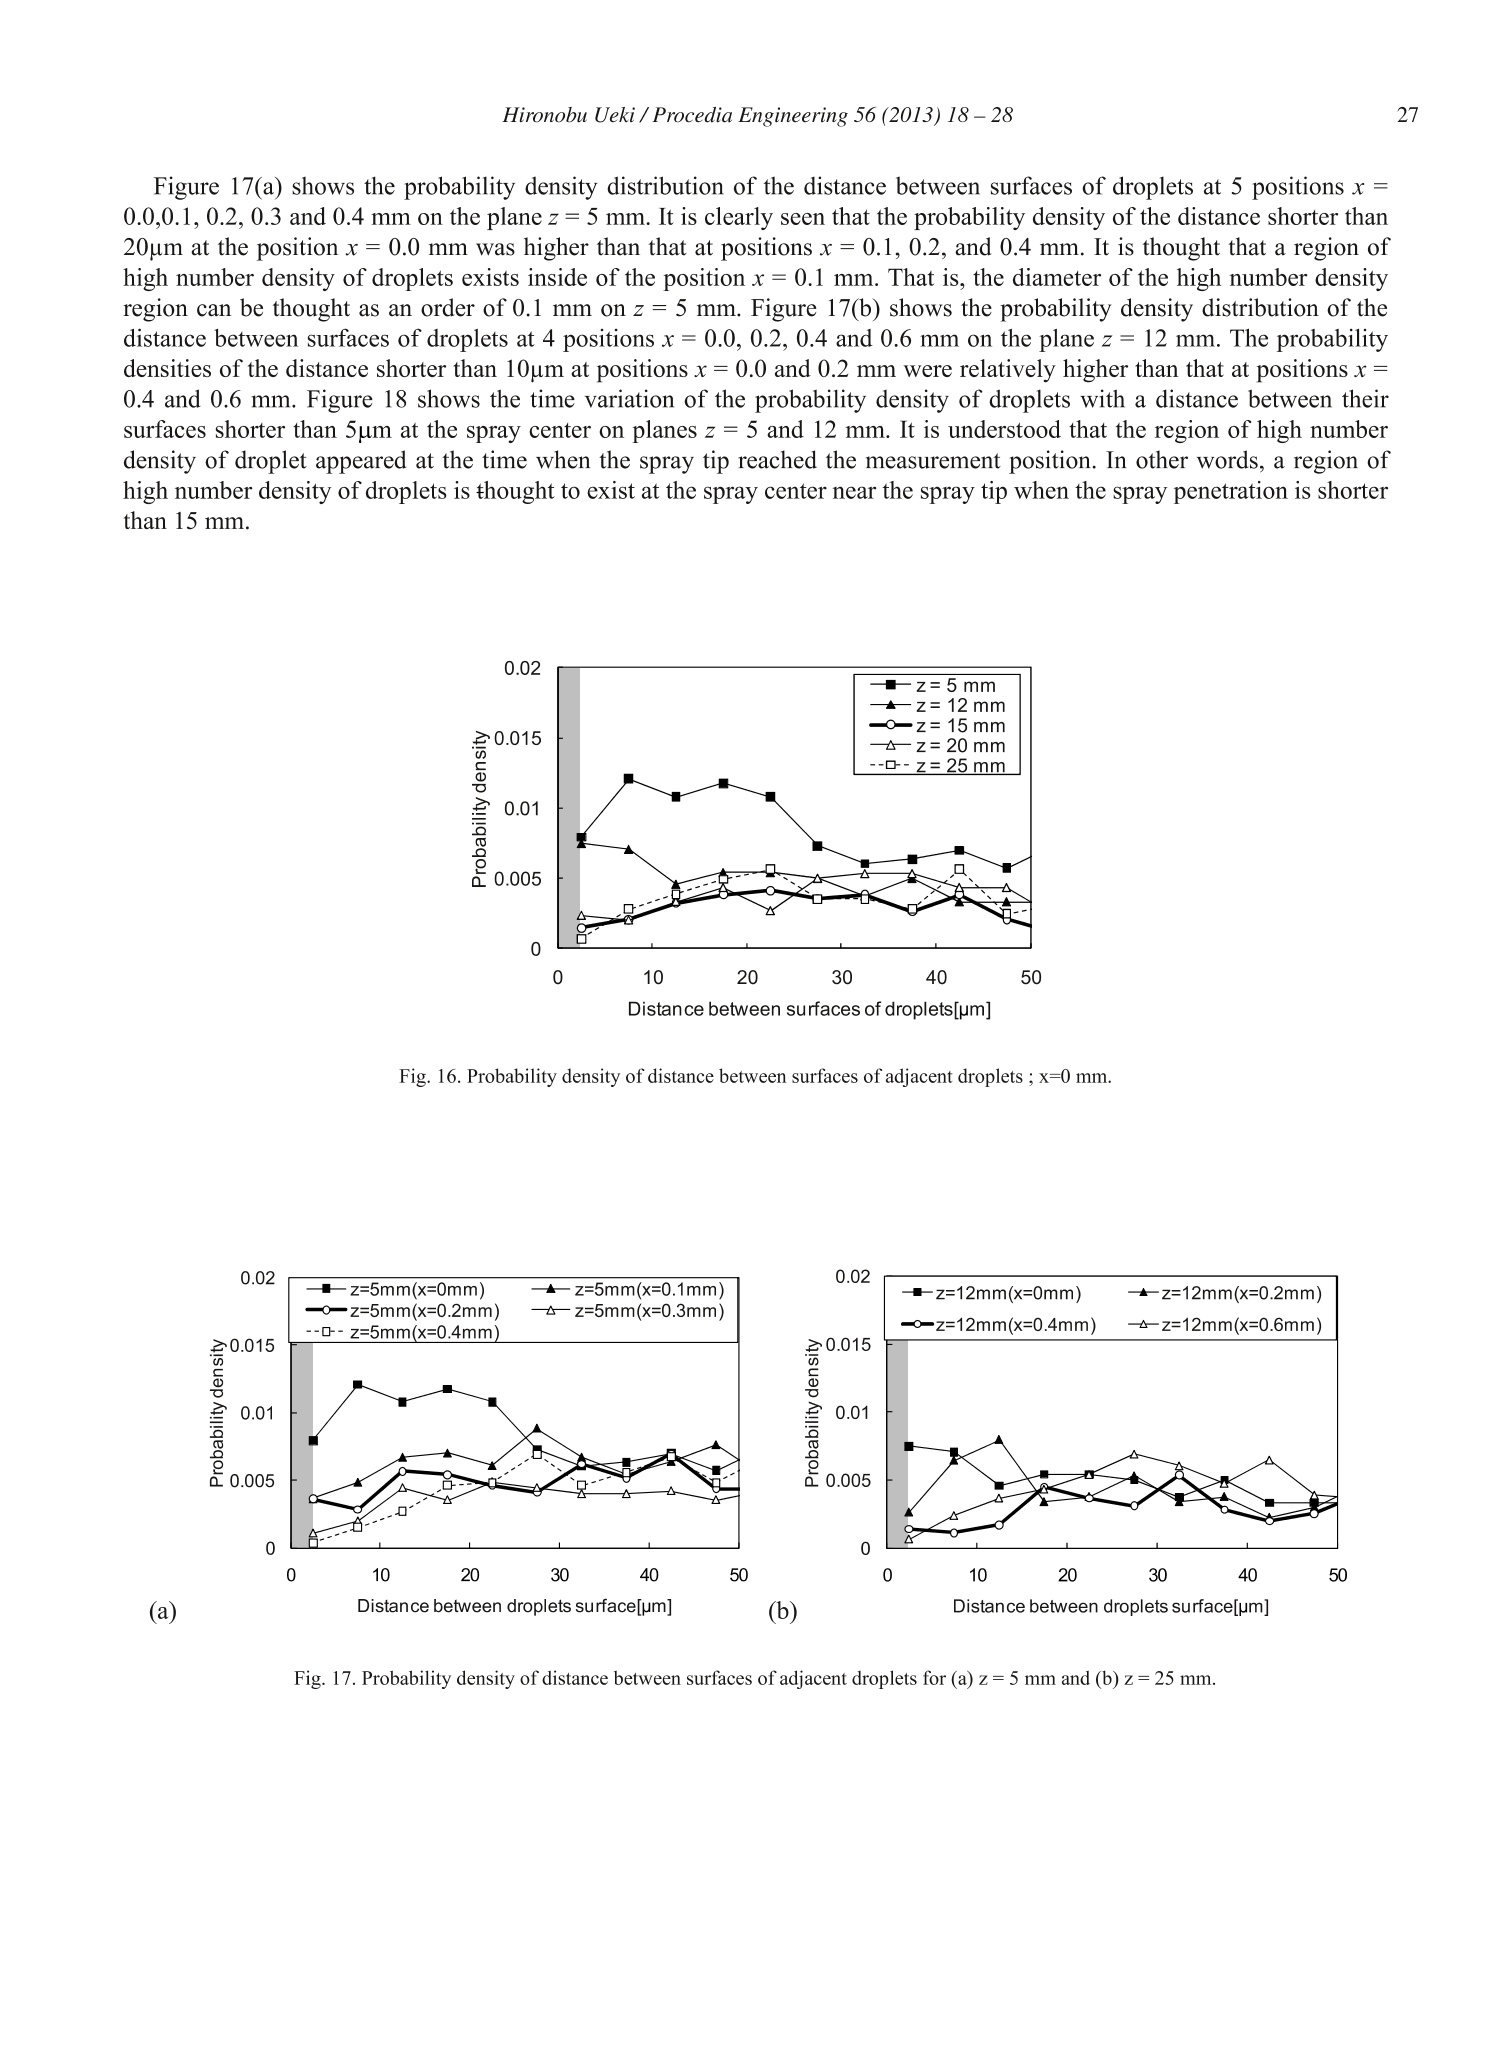
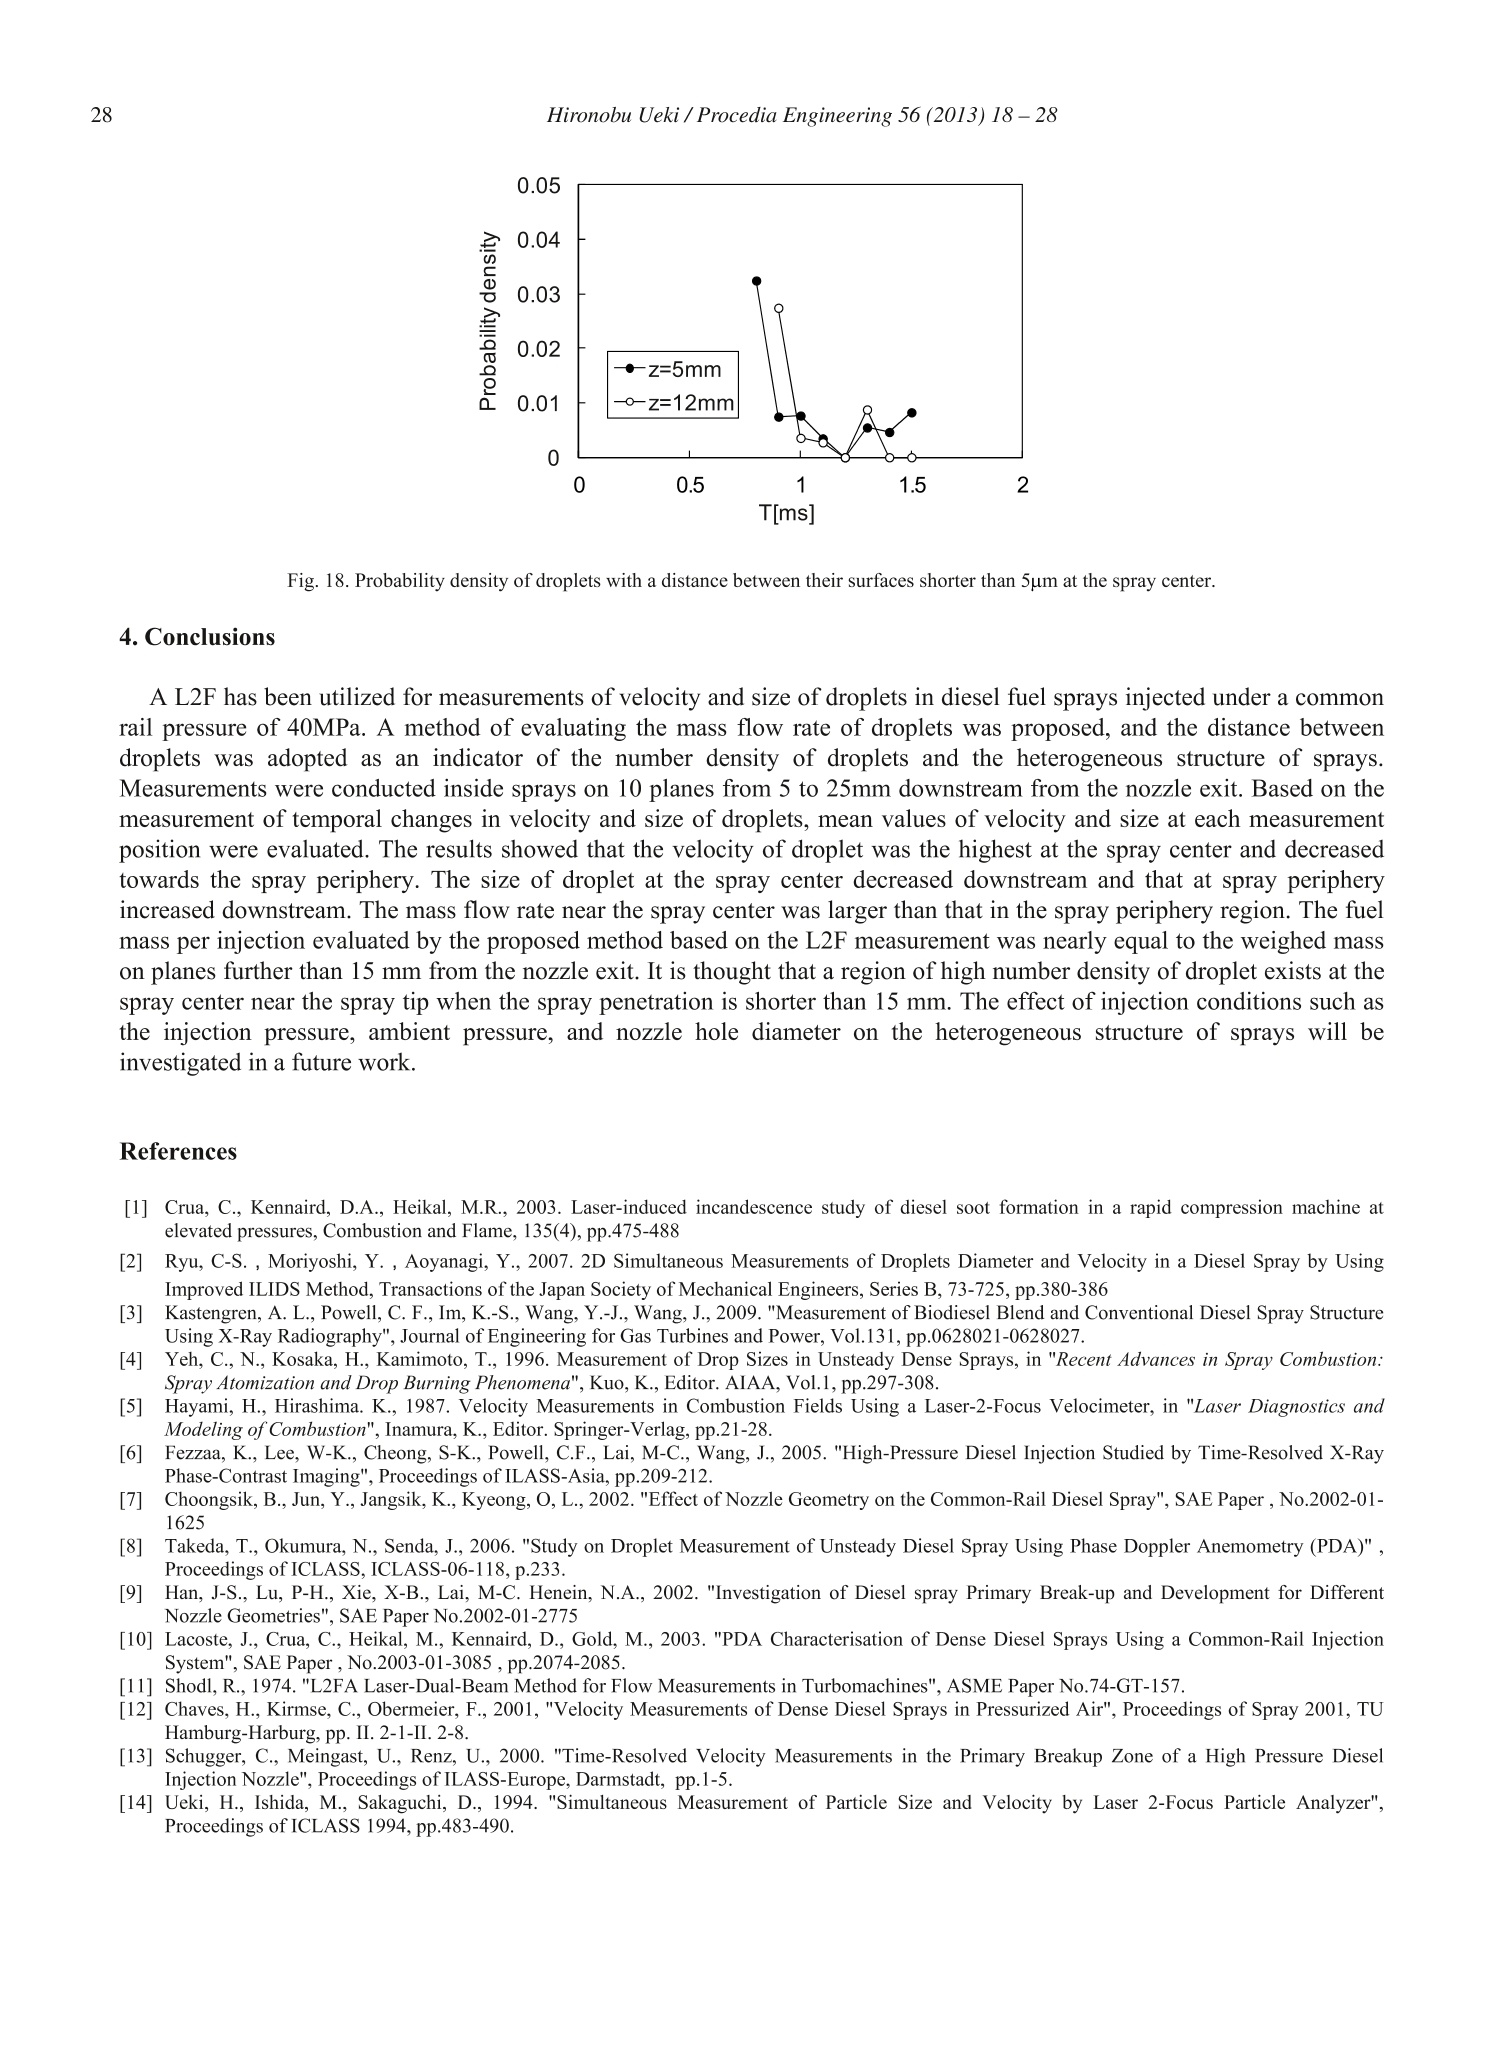
Available online at www.sciencedirect.comSciVerse ScienceDirect 19Hironobu Ueki /Procedia Engineering 56(2013)18-28 * Corresponding author. Tel.: +81-95-819-2520; fax: +81-95-819-2534.Selection and peer review under responsibility of the Bangladesh Society of Mechanical Engineersdoi:10.1016/j.proeng.2013.03.085 ProcediaEngineering ELSEVIER Procedia Engineering 56 (2013)18-28 www.elsevier.com/locate/procedia 5" BSME International Conference on Thermal Engineering Heterogeneous structure in diesel fuel sprays Hironobu Ueki* Nagasaki University, 1-14 Bunkyo-machi, Nagasaki 852-8521, Japan Abstract A laser 2-focus velocimeter (L2F) has been applied for measurements of velocity and size of droplets in diesel sprays. The maximum dataacquisition rate of 15 MHz has been achieved by using FPGA in order to capture every droplet which appears in the micro-scalemeasurement volume. A method of evaluating the mass flow rate of droplets was proposed, and the distance between droplets wasadopted as an indicator of the number density of droplets and the heterogeneous structure of sprays. The diesel fuel spray was injectedintermittently into the atmosphere by using a 5-hole injector nozzle. The orifice diameter of the injector nozzle was 0.113 mm, and theinjection pressure was set at 40MPa by using a common rail system. Measurements were conducted in the spray on 10 planes from 5 to 25mm downstream from the nozzle exit. It was shown that the velocity of droplet was the highest at the spray center and decreased towardsthe spray periphery. The size of droplet at the spray center decreased downstream and that at spray periphery increased downstream. Themass flow rate near the spray center was larger than that in the spray periphery region. It was confirmed that the fuel mass per injectionevaluated by the proposed method based on the L2F measurement was nearly equal to the injected mass in a plane further than 15 mmfrom the nozzle exit. The probability density of droplet with a distance shorter than 5 um to the adjacent droplet increased remarkablynear the spray center 5 and 12 mm downstream from the nozzle exit. It is thought that a region of high number density of droplet exists atthe spray center near the spray tip when the spray penetration is shorter than 15 mm. @2013 The Authors. Published by Elsevier Ltd. Open access under CC BY-NC-ND license. Selection and peer review under responsibility of the Bangladesh Society of Mechanical Engineers Keywords: Heat Engine, Droplet, Atomization, Laser Measurement Nomenclature d Diameter of nozzle orifice (mm) Focus diameter (um) Focus length (um) Distance between two foci (um) Time-of-flight (ms) T Time after injection start (ms)tit2 Time-of-scattering on the upstream focus (ms)t3 Time-of-scattering on the downstream focus (ms)t Time (ms) Velocity (m/s) Diameter of droplet (um) Distance between droplets (um) Area (mm) mf Mass flow rate ( E-mail address: ueki@nagasaki-u.ac.jp ) 1. Introduction Not only the reduction of exhaust emissions but also further improvement of thermal efficiency is required to dieselengines. As appropriate control of combustion is necessary to meet these requirements, it is important to understand theinfluence of fuel spray characteristics upon the diesel combustion. Many researchers have investigated about the relationbetween the injection condition and combustion. For example, the effect of injection pressure on soot formation wasreported by Crua, et al. [1]. It has been reported that the high speed fuel spray injected by microscopic hole was effective forfurther improvement of combustion [6]. Research work is also needed for basic understanding of the spray characteristics.Image processing [7], PDPA [8] and ILIDS [2] are effective as measurement methods ofvelocity and size of spray droplets.Especially, the information of spray behavior near the nozzle orifice is indispensable for designing the nozzle shape,modeling droplet disintegration and setting the initial condition of simulating droplet disintegration [9,10].The spatialdistribution of the mass in the near-nozzle region was measured by the X- ray radiography technique [3]. There are fewstudies of the inner structure of the spray where the droplet number density is high. A laser 2-focus velocimeter (L2F) can measure the time-of-flight when a droplet flies between two foci and gives us thevelocity. L2F has the high optical signal to noise ratio, so the influence of multiple scattering on the spray measurement issmall. Schodl [11] reported about the application of L2F to the internal flow of turbomachinery in 1974. It was reported byChaves [12] and Shugger [13] that measurement systems similar to the L2F were successfully applied to measure dropletswhich were located inside the breakup length. The authors showed that the simultaneous measurements of the velocity andsize of droplets were possible by adding the measurement of time-of-scattering to L2F [14]. In the present study, a method of evaluating the mass flow rate of droplets was proposed, and the distance betweendroplets was adopted as an indicator of the number density of droplets and the heterogeneous structure of sprays. The dieselfuel spray was injected intermittently into the atmosphere by using a 5-hole injector nozzle. The velocity and size ofdroplets in the spray have been measured by the L2F on 10 planes 5 to 25 mm from the nozzle exit. The spatial distributionsof velocity, size, and mass flow rate of droplets have been evaluated, and the region of high number density of droplets hasbeen investigated. 2. Experimental setup 2.1.Advanced laser 2-focus velocimeter; L2F The light probe of the L2F consists of highly focused two laser beams as shown in Fig.1. The diameter F of the focus isabout 3pm, and the distance S between two foci is 17um, and the length L is about 20um in the direction of optical axis. Itcan be mentioned that the L2F used in the present study has a micro-scale probe. The measurements of time-of-flight andtime-of-scattering are shown in Fig.2. The upper half of Fig.2 shows the cross-section of the L2F probe. When a dropletflies through both upstream and downstream foci, time-of-flight ty, time-of-scattering t2 on the upstream focus and time-of-scattering ts on the downstream focus are measured by a digital counter. The velocity of a droplet can be easily calculatedby dividing the distance between two foci S with the measured time-of-flight ty, that is The relation used for the estimation of droplet size is that the ratio of the time-of-flight and the time-of-scatteringcorresponds to the ratio of the distance between two foci S and the droplet size d plus the focus size F. The time-of-scattering can be estimated by averaging two time-of-scattering. The droplet size dp can be estimated by The L2F selects a droplet which passes through the upstream focus and downstream focus sequentially. The time-of-fightis shortest when a single droplet passes through two foci, and the time-of-flight is longer when two different droplets passthrough two foci. So, a velocity given by different droplets is overestimated and can be removed by a statistical analysis.When the number density of droplet is very high, the local droplet distance is sometimes shorter than the distance between two foci. In such a case, the droplet other than the droplet which passed the upstream focus will pass the downstream focus.Then, the time-of-flight is not measured correctly. When the flight direction of a droplet is fluctuating, the droplet whichpasses the upstream focus sometimes differs from the droplet which passes the downstream focus. The velocity obtained bysuch a pair of different droplets should not be correct. Figure 3 shows the flowchart of the measurements of the time-of-flight and time-of-scattering. Counting starts by the detection of an upstream signal and stops by the detection of adownstream signal, and an up-and-down flag is saved with a counted value. When an upstream signal is detected beforedetecting a downstream signal, an up-and-up flag is saved with counted value. Valid data can be selected by checking theflag. The sampling data number Na, which corresponds to the number of the droplets passing through the upstream focus, isset before the measurement. Figure 4 shows the system configuration of the L2F. The light source is a semiconductor laser which has a maximumpower of 100mW and a wave length of 835 nm. A non-spherical lens which has a focal length of 8 mm and a numerical Fig. 1. Light probe of L2F. Fig. 2. Time-of-flight and time-of-scattering. Fig. 3. Flowchart of data acquisition procedure. aperture of 0.5 is adopted as the condensing lens. By the optical system with a length of 350 mm including the light source,the backscattering light of a droplet at the focus is guided to a Si- APD (Silicon Avalanche Photo Diode), and it is convertedinto an electrical signal. The time-of-flight and time-of-scattering are measured by the digital counter which is mainlyconstituted by a FPGA (Field Programmable Gateway Array) with a clock of 160MHz. The maximum data sampling rate ofthe L2F system is set at 15MHz. A preliminary experiment has been conducted to confirm the accuracy of size measurement. Droplets generated by ahumidifier were seeded in the air flow of about 50 m/s in velocity and they were measured by L2F and PDA (PDI-200MDmanufactured by Artium) simultaneously. Figure 5 shows the comparison between probability density distributions of mass-based droplet size measured by L2F and PDA. It is understood that two probability density distributions are very close toeach other. The mass-based arithmetic mean sizes measured by L2F and PDA are 9.2 and 9.5 um respectively. The error insize measurement was 3%. It is understood that the error in mass evaluation is small. Fig. 4. System diagram of L2F. Fig. 5. Probability density distributions of mass-based droplet size measured by L2F and PDA. 2.2. Fuel spray measurement system A common rail injector was used to control injection conditions, such as the injection timing, injection duration andinjection pressure. Figure 6 is the measurement system of fuel sprays using the L2F. Diesel fuel pressurized by the highpressure pump was stored in the rail. The rail pressure was set at 40MPa. The fuel was injected intermittently into theatmosphere at a temperature of 298±6K and a pressure of 0.1MPa. The test nozzle was a 5-hole injector with a holediameter d of 0.113 mm. The measurement of the spray was conducted within one of 5 spray plumes while the remaining 4plumes were shielded and sucked out through small pipes. The injection interval was 330 ms. The period of energizing thesolenoid was 1.0 ms, and the injection period was 0.79 ms. The fuel of 1.34 mg was injected per cycle from one hole. Aclock signal with a frequency of 6MHz was used for recording the time when the L2F data was acquired. The number ofdata Na was 10,000 at each measurement position. The coordinate z is the distance along the spray axis from the nozzle tip,the coordinate y is the distance along the laser axis, and the coordinate x is perpendicular to y z-axis. The x-axis indicates theradius from the spray center on the plane y= 0. Figure 7 shows a spray photograph and measurement positions. There is adark domain near the position of z =5 mm. This is the shadow of the plug to shield 4 plumes. Simultaneous measurementsof velocity and size of spray droplets were conducted on planes perpendicular to z-axis; z =5,9,10,11,12,13,14,15, 20and 25 mm. The table 1 shows the x-coordinates of measurement positions in each z plane. The y-coordinates of themeasurement positions were fixed to zero. The measurement data were accumulated during 100-1200 injections. In each zplane, x=0 mm corresponds to the spray center, and the most outside measurement position is called the spray periphery. Fig. 6. Fuel spray measurement system. Fig. 7. Spray image and measurement positions (z=5, 9, 10,11,12,13,14,15,20,25 mm). Table 1. Measurement positions. z(mm) x(mm) 5 0.±0.1,±0.2,±0.3,±0.4,±0.5,±0.6,±0.7,±0.8 9 0.±0.2.±0.4.±0.6,±0.8.±1.0 10 0,±0.2,±0.4,±0.6,±0.8,±1.0 11 0.±0.2.±0.4.±0.6.±0.8.±1.0 12 0.±0.2.±0.4,±0.6,±0.8,±1.0 13 0.±0.2.±0.4,±0.6.±0.8,±1.0.±1.2 14 0,±0.2,±0.4,±0.6,±0.8,±1.0,±1.2 15 0,±0.3,±0.6,±0.9,±1.2 20 0.±0.4.±0.8.±1.2.±1.6 25 0,±0.5,±1.0,±1.5,±2.0 2.3. Evaluation ofnumber density and mass flow rate Spatial distribution of droplets is very important for understanding the spray characteristics in a region of high numberdensity droplets and for understanding the processes of evaporation and combustion. A distance La between droplets alongthe direction from upstream focus to downstream focus can be estimated by, where AT is a time interval between droplet observations and u is an instantaneous velocity. An important step towards understanding the spray behavior is to estimate the mass flow rate during injection. The massflow rate is the total mass of droplets passing the measurement probe in a certain time. The mass flow rate mrestimated as where dis the size of droplet, and V, is the volume of droplet. The total mass M of a single injection can be estimated bythe integral of mass flow rate with time and space. When an axisymmetric spray is assumed, where 44 is the cross section of a ring of width Ax which is the distance between the x-coordinate of the measurementpositions. The cross section is calculated by A4(x)=2mxAx (6) As shown in Table 1, 4x depends on z. For example, 4x=0.1 mm in the plane ofz =5 mm. The spray edge was decidedon x=±0.8 mm based on spray images. This was confirmed by the fact that a droplet was not detected at x=±0.9 mm. 3. Results and discussion 3.1. Temporal and spatial changes in velocity and size ofdroplets Figure 8(a) shows the time variation of the mean droplet velocity at 5 positions on the plane z =5 mm. The meanvelocity at the spray center was about 100 m/s at the time T=0.8 ms, and this is on the same order of magnitude asmeasured from the spray image. At the points x=0 mm and x= ±0.4 mm, the mean velocity increased in a perio tween0.8 ms and 1.2 ms, and the change in velocity was relatively small in a period between 1.2 and 1.5 ms. The medecreased rapidly after 1.5 ms and the period after the start of velocity decrease is called period II in this paper.The periodbefore period II is called period I. The period I and period II correspond to so called spray head and spray tail respectively.At the points x=±0.8 mm, the velocity decreased gradually in a period between 1.0 ms and 1.5 ms. The mean velocities attwo measurement positions with the same distance from the spray center, for example x=-1.5 mm and x= 1.5 mm, wenreearly the same. Figure 8(b) shows the time variation of the mean droplet velocity at 5 positions on the plane z =25 mm.The mean velocity at the spray center was about 140 m/s at 1.0 ms. This velocity agreed well with the one which wasestimated from the spray images. Droplets appeared at 1.0 ms at the points x=0, and ±0.5 mm. And they appeared at 1.1 msat the point x=±1.5 mm. It is understood that droplets near the spray center reached the measurement position earlier thanthe droplets in the periphery region. At the positions x=0 mm and x=±0.5 mm, the mean velocity increased in a periodbetween 1.0 and 1.2 ms, and the change in velocity was relatively small in a period between 1.2 and 1.5 ms. Fig. 8. Time change in Arithmetic mean velocity for (a) z=5 mm and (b)z=25 mm. Fig. 9. Time change in Arithmetic mean size for (a) z=5 mm and (b) z=25 mm. Figure 9(a) shows the time variation of the arithmetic mean droplet size on the plane z=5 mm. The mean droplet sizewhen the spray tip reached the measurement position was the largest in the period between 1.0 and 1.5 ms, and the dropletsize gradually decreased at every measurement position. Figure 9(b) shows the time variation of the mean droplet size onthe plane z=25 mm. The mean droplet size gradually decreased at every measurement position in the first half of theinjection duration. The size fluctuated in the latter half of the injection duration. The time interval between droplets was estimated from the time of droplet observation. Figure 10(a) shows the timevariation of the mean time interval within each time window of 0.1 ms on the plane z=5 mm. The time interval at theposition x=0 mm increased in the first half of the injection duration and decreased after that. At positions x = ±0.4 mm, thetime interval was shorter than 50 us during the injection period. At positions x=±0.8 mm, the time interval decreased in thefirst halfof the injection duration and increased after that. Figure 10(b) shows the time variation of the mean time intervalon the plane z=25 mm. At positions x=0 mm and x=±0.5 mm, the time interval was between 15 and 50us in the first halfof the injection duration and increased after 1.6 ms. At positions x =+1.5 mm, the mean time interval decreased in theperiod between 1.1 ms and 1.3 ms, and increased after 1.3 ms. The time interval between droplets in the spray peripheryregion was longer than the one at the spray center during the injection period. The velocity and size in the Period I were used for calculating the mean values at each measurement position, becausethe temporal change was relatively small. Figure 11(a) shows spatial distributions of the mean velocity on planes z =5, 10,15, 20 and 25 mm. The mean velocity showed the highest near the spray center and decreased towards the peripherIy regiont is un.derstood that the spatial distribution of the mean velocity of droplet is nearly axisymmetry. Figure 11(b) shows thespatial distributions of the arithmetic mean size. On every planez =constant, it can be seen that the spatial distribution ofmean size was nearly axisymmetric as for the one of mean velocity. The mean size showed the largest near the spray centerand decreased gradually with the distance from the spray axis towards the periphery region on the plane z =5 mm. An increase in size was observed near the spray periphery on planes further than 5 mm from the nozzle exit. Yeh et. al. [4]reported a similar droplet size distribution. It is also understood that the mean size decreased along the spray axis from z =5to z=15 mm. (a) Fig. 10. Time change in Arithmetic mean time interval for (a) z=5 mm and (b) z=25 mm. (a) Fig. 11. Spatial distribution in the period I for (a) velocity and (b) size. 3.2. Estimation ofmass flow rate Values of V, d, and AT in the Eqn. (4) for estimating the mass flow rate are given by droplets which passed bothupstream and downstream foci. In order to evaluate the mass flow rate of all droplets which passes the measurement volume,it is needed to additionally evaluate the mass of droplets which passed only the upstream focus. Figure 2 shows the ratio ofN, and N, at each measurement positions on planes z = 5 to 25 mm. The ratio of N, / Na was higher than 0.5 near the spraycenter, although, it decreased to about 0.1 in the spray periphery region. The decrease in the valid data ratio comes mainlyfrom different droplets passing through two foci due to the fluctuation in the direction of droplet flight. The relation betweenthe valid data ratio and the fluctuation of flight direction has been investigated theoretically by Hayami [5]. It was shownthat the valid data rate could be estimated to be about 50% when the fluctuation of flight direction was 10 degrees.Therefore, the value ofN, /N, was thought to be appropriate. The total mass of droplets passing through the measurement volume is the summation of the mass of droplets passingthrough both upstream and downstream foci and the mass of droplets passing through only upstream focus. As dropletsrandomly pass through the measurement volume, it is expected that the mass of droplets is proportional to the number ofobserved droplets. Accordingly, the mass flow rate of droplets was estimated from the one evaluated by the Eqn. (4)multiplied byNa/N. Figure 13 shows the spatial distribution of the mass flow rate on the plane z= 25 mm within each timewindow of 0.2 ms. The mass flow rate near the spray center was higher than the one of the spray periphery at each time. The distribution of mass flow rate can be calculated by integrating time dependent distributions shown in Fig. 13. Figure 14shows the spatial distribution of mass flow rate on planes z =5, 10, 15, 20 and 25 mm. It can be seen that the spatialdistribution of mass flow rate was nearly axisymmetric. The mass flow rate at the center was the highest at the plane z =5mm, and decreased toward the downstream. A peak was not seen on the planes z=15-25 mm, and higher mass flow rateswere distributed between positions x=±0.5 mm. The fuel mass injected within a single injection can be evaluated by the Eqn. (5). The mass evaluated by the L2F was1.47mg/injection. As the weighed mass was 1.34mg/injection, the ratio of the evaluated mass and the weighed mass wasabout 1.1. The error in the evaluation would come from the assumption that the spray is axisymmetric and that the droplet isa sphere. Figure 15 shows the ratio of the evaluated mass and the weighed mass at each measurement position. Ormeasurement planes downstream from the plane z =15 mm, the ratio of the evaluated mass and the weighed mass was about1.0. It is understood that almost all droplets were identified by the L2F properly. However, the evaluated mass decreased toless than 1.0 on the planes nearer to the nozzle exit than z = 15 mm. It is understood that unidentified mass increases nearthe nozzle. In order to identify the region of high number density of droplets, the distance between surfaces of droplets wasestimated by subtracting the droplet size from the distance La. Figure 16 shows probability density distribution of thedistance between surfaces of droplets at the spray center on planes ofz =5, 12, 15, 20 and 25 mm. The probability density ofthe distance shorter than 20um on planes z = 5 and 12 mm was higher than that on planes z = 15, 20 and 25 mm. Shortdistance between droplets means that the number density of droplets is high. It is thought that the laser beam might bescattered by high number density droplets and could not penetrate into the spray center on planes z =5 and 12 mm.Underestimation of the fuel mass near the nozzle exit should be due to high number density droplets. Fig. 12. Ratio of valid data number and all data number; Period I. Fig. 13. Spatial distribution of mass flow rate; z=25 mm. Fig. 14. Spatial distribution of mass flow rate. Fig. 15. Ratio of evaluated mass per injected mass. Figure 17(a) shows the probability density distribution of the distance between surfaces of droplets at 5 positions x=0.0,0.1,0.2, 0.3 and 0.4 mm on the plane z =5 mm. It is clearly seen that the probability density of the distance shorter than20um at the position x=0.0 mm was higher than that at positions x=0.1, 0.2, and 0.4 mm. It is thought that a region ofhigh number density of droplets exists inside of the position x= 0.1 mm. That is, the diameter of the high number densityregion can be thought as an order of 0.1 mm on z= 5 mm. Figure 17(b) shows the probability density distribution of thedistance between surfaces of droplets at 4 positions x=0.0, 0.2, 0.4 and 0.6 mm on the plane z =12 mm. The probabilitydensities of the distance shorter than 10um at positions x = 0.0 and 0.2 mm were relatively higher than that at positions x =0.4 and 0.6 mm. Figure 18 shows the time variation of the probability density of droplets with a distance between theirsurfaces shorter than 5um at the spray center on planes z =5 and 12 mm. It is understood that the region of high numberdensity of droplet appeared at the time when the spray tip reached the measurement position. In other words, a region ofhigh number density of droplets is thought to exist at the spray center near the spray tip when the spray penetration is shorterthan 15 mm. Fig. 16. Probability density of distance between surfaces ofadjacent droplets ; x=0 mm. Fig. 18. Probability density of droplets with a distance between their surfaces shorter than 5um at the spray center. 4. Conclusions A L2F has been utilized for measurements of velocity and size of droplets in diesel fuel sprays injected under a commonrail pressure of 40MPa. A method of evaluating the mass flow rate of droplets was proposed, and the distance betweendroplets was adopted as an indicator of the number density of droplets and the heterogeneous structure of sprays.Measurements were conducted inside sprays on 10 planes from 5 to 25mm downstream from the nozzle exit. Based on themeasurement of temporal changes in velocity and size of droplets, mean values of velocity and size at each measurementposition were evaluated. The results showed that the velocity of droplet was the highest at the spray center and decreasedtowards the spray periphery. The size of droplet at the spray center decreased downstream and that at spray peripheryincreased downstream. The mass flow rate near the spray center was larger than that in the spray periphery region. The fuelmass per injection evaluated by the proposed method based on the L2F measurement was nearly equal to the weighed masson planes further than 15 mm from the nozzle exit. It is thought that a region of high number density of droplet exists at thespray center near the spray tip when the spray penetration is shorter than 15 mm. The effect of injection conditions such asthe injection pressure, ambient pressure, and nozzle hole diameter on the heterogeneous structure of sprays will beinvestigated in a future work. References ( [1] Crua, C. , K ennaird, D.A., H e ikal, M.R., 2 0 03. Laser-induced in c andescence st u dy of diesel soot fo r mation in a r a p id co m pression mac h ine at elevated pressures, Combustion and Flame, 135(4),pp . 475-48 8 ) ( [21 R yu, C -S. , Moriyoshi, Y . , Aoyanagi, Y . ,2007.2D Sim u ltaneous Mea s urements of D r oplets Diameter and Velocity in a D i e s el Spray by Using Improved ILI D S Method, Transactions of the Japan Society of Mechanical Engineers, Series B, 73-725, pp.380-386 ) ( [3] K astengren, A . L . , Powell, C. F . , Im, K.-S., Wang, Y.-J., W a ng, J., 2009. "Measurement of Biodiesel Blen d and C o nventional Diesel Spray Structure ) ( U sing X-Ray Radiography", Journal o f Engineering for G as Turbines and P ower, Vol.131,pp.0628021-0628027. ) ( [4] Yeh, C .,N., Kosaka, H ., Kamimoto, T . , 1 996. Measurement of Drop S i zes in U nsteady Dense Sprays, i n "Rec e nt Advances in Spray Combustion: Spray Atomization and Drop Burning Phenomena", Kuo, K., Editor. A I AA, Vo l .1, pp.297-308. ) ( [5] H ayami, H ., H irashima. K . , 1 987. Velocity Measurements in C ombustion F i elds Using a L a ser-2-Focus V e locimeter, in " Laser D iagnostics andModeling of Combustion", Inamura, K., Editor. Springer-Verlag,pp.21-28. ) ( [6] F ezzaa, K ., L ee, W -K., Cheong, S- K ., Po w ell, C. F ., Lai, M-C., Wang, J., 20 0 5. "High-Pressure Die s el Injection Studied by T ime-Resolved X-Ray P hase-Contrast Imaging", P r oceedings of ILASS-Asia, pp.209-212. ) ( [7] Choongsik, B., J un, Y., Jangsik, K., Kyeong, O, L., 2002. "Effect of Nozzle Geometry on the Common-Rail Diesel Spray", SAE Paper , No.2002-01-1625 ) ( [8] T akeda, T ., Okumura, N ., Senda, J., 2006. "Study on Droplet Measurement of Unstead y Diesel Spray Usin g Phas e Doppler Anemometry (PDA)", Proceedings o f ICLASS, IC L ASS-06-1 1 8,p.233. ) ( [9] H an, J-S., L u, P -H., X ie, X-B., Lai, M-C. Henein, N. A ., 200 2 . "Investigation of Diesel spr a y Primary Break-up and Develo p ment for Diff e ren t N ozzle G eometries", SAE Paper No.2002-0 1 -2 7 75 ) ( [10] 1 L acoste, J., Crua, C . , Heikal , M. , Kennaird , D., Gold, M . ,2003. "PDA Characterisation of Dense Diesel Sprays Using a Common-Rail I njectionSystem", SAE Paper, No.2003-01-3085,pp.2074-2085. ) ( [11] S : hodl, R ., 1974."L2FA L a ser-Dual-Beam Method for Flow Me a surements in Turbomachines", ASM E Paper No.74-GT-157. ) ( 12] ( Chaves, H., Kirmse, C., Obermeier, F., 2001, "Velocity Measurements of Dense Diesel Sprays in Pressurized A ir", Proceedings of Spray 2001, TU H amburg-Harburg, pp. II. 2-1-II. 2-8. ) ( [13 ] Schugger, C . , M e ingast, U . , R e nz, U., 2 0 00. "Time-Resolved Vel o city Mea s urements in the Primary Breakup Zone o f a High P r e ssure Diesel I njection Nozzle", Proceedings of ILASS-Europe, Darmstadt, p p.1-5. ) ( [14] U 1 eki, H ., I shida, M., Sakaguchi, D ., 1 994. " Simultaneous Measurement of Pa r ticle S i ze a n d V e locity by La s er 2- F o c us Pa r ticle A n alyzer", P roceedings of ICLASS 1994, pp.483-490. ) A laser 2-focus velocimeter (L2F) has been applied for measurements of velocity and size of droplets in diesel sprays. The maximum data acquisition rate of 15 MHz has been achieved by using FPGA in order to capture every droplet which appears in the micro-scale measurement volume. A method of evaluating the mass flow rate of droplets was proposed, and the distance between droplets was adopted as an indicator of the number density of droplets and the heterogeneous structure of sprays. The diesel fuel spray was injectedintermittently into the atmosphere by using a 5-hole injector nozzle. The orifice diameter of the injector nozzle was 0.113 mm, and the injection pressure was set at 40MPa by using a common rail system. Measurements were conducted in the spray on 10 planes from 5 to 25mm downstream from the nozzle exit. It was shown that the velocity of droplet was the highest at the spray center and decreased towards the spray periphery. The size of droplet at the spray center decreased downstream and that at spray periphery increased downstream. The mass flow rate near the spray center was larger than that in the spray periphery region. It was confirmed that the fuel mass per injection evaluated by the proposed method based on the L2F measurement was nearly equal to the injected mass in a plane further than 15 mmfrom the nozzle exit. The probability density of droplet with a distance shorter than 5 m to the adjacent droplet increased remarkably near the spray center 5 and 12 mm downstream from the nozzle exit. It is thought that a region of high number density of droplet exists at the spray center near the spray tip when the spray penetration is shorter than 15 mm.
确定
还剩9页未读,是否继续阅读?

产品配置单

北京欧兰科技发展有限公司为您提供《柴油喷雾中液滴粒径和速度及其空间分布检测方案(激光干涉仪)》,该方案主要用于柴油中液滴粒径和速度及其空间分布检测,参考标准--,《柴油喷雾中液滴粒径和速度及其空间分布检测方案(激光干涉仪)》用到的仪器有激光相位多普勒干涉仪LDV,PDI,PDPA,PDA、LaVision SprayMaster 喷雾成像测量系统
推荐专场


相关方案
更多
该厂商其他方案
更多