


方案详情
文
Laser-induced incandescence can be applied to raw exhaust at the open tailpipe, or along the exhaust train using either an in situ optical cell or by extractive sam-pling to an external cell. While in situ measurements are preferable to avoid artifacts caused by extractive sam-pling, the experimental setup may be complex and thus more expensive to implement. In this paper we make a direct comparison of time-resolved in situ versus ex-tracted-sample measurements for rapid engine tran-sients of load and speed. In addition, we compare meas-urements for exhaust extracted from three different loca-tions: 1) at the turbocharger output; 2) at the muffler entrance; 3) at the muffler exit. The results show that extractive sampling sufficiently replicates in situ meas-urements obtained at the muffler entrance, and that rapid transients in soot concentration vary to a small but detectable degree with the measurement location.
方案详情

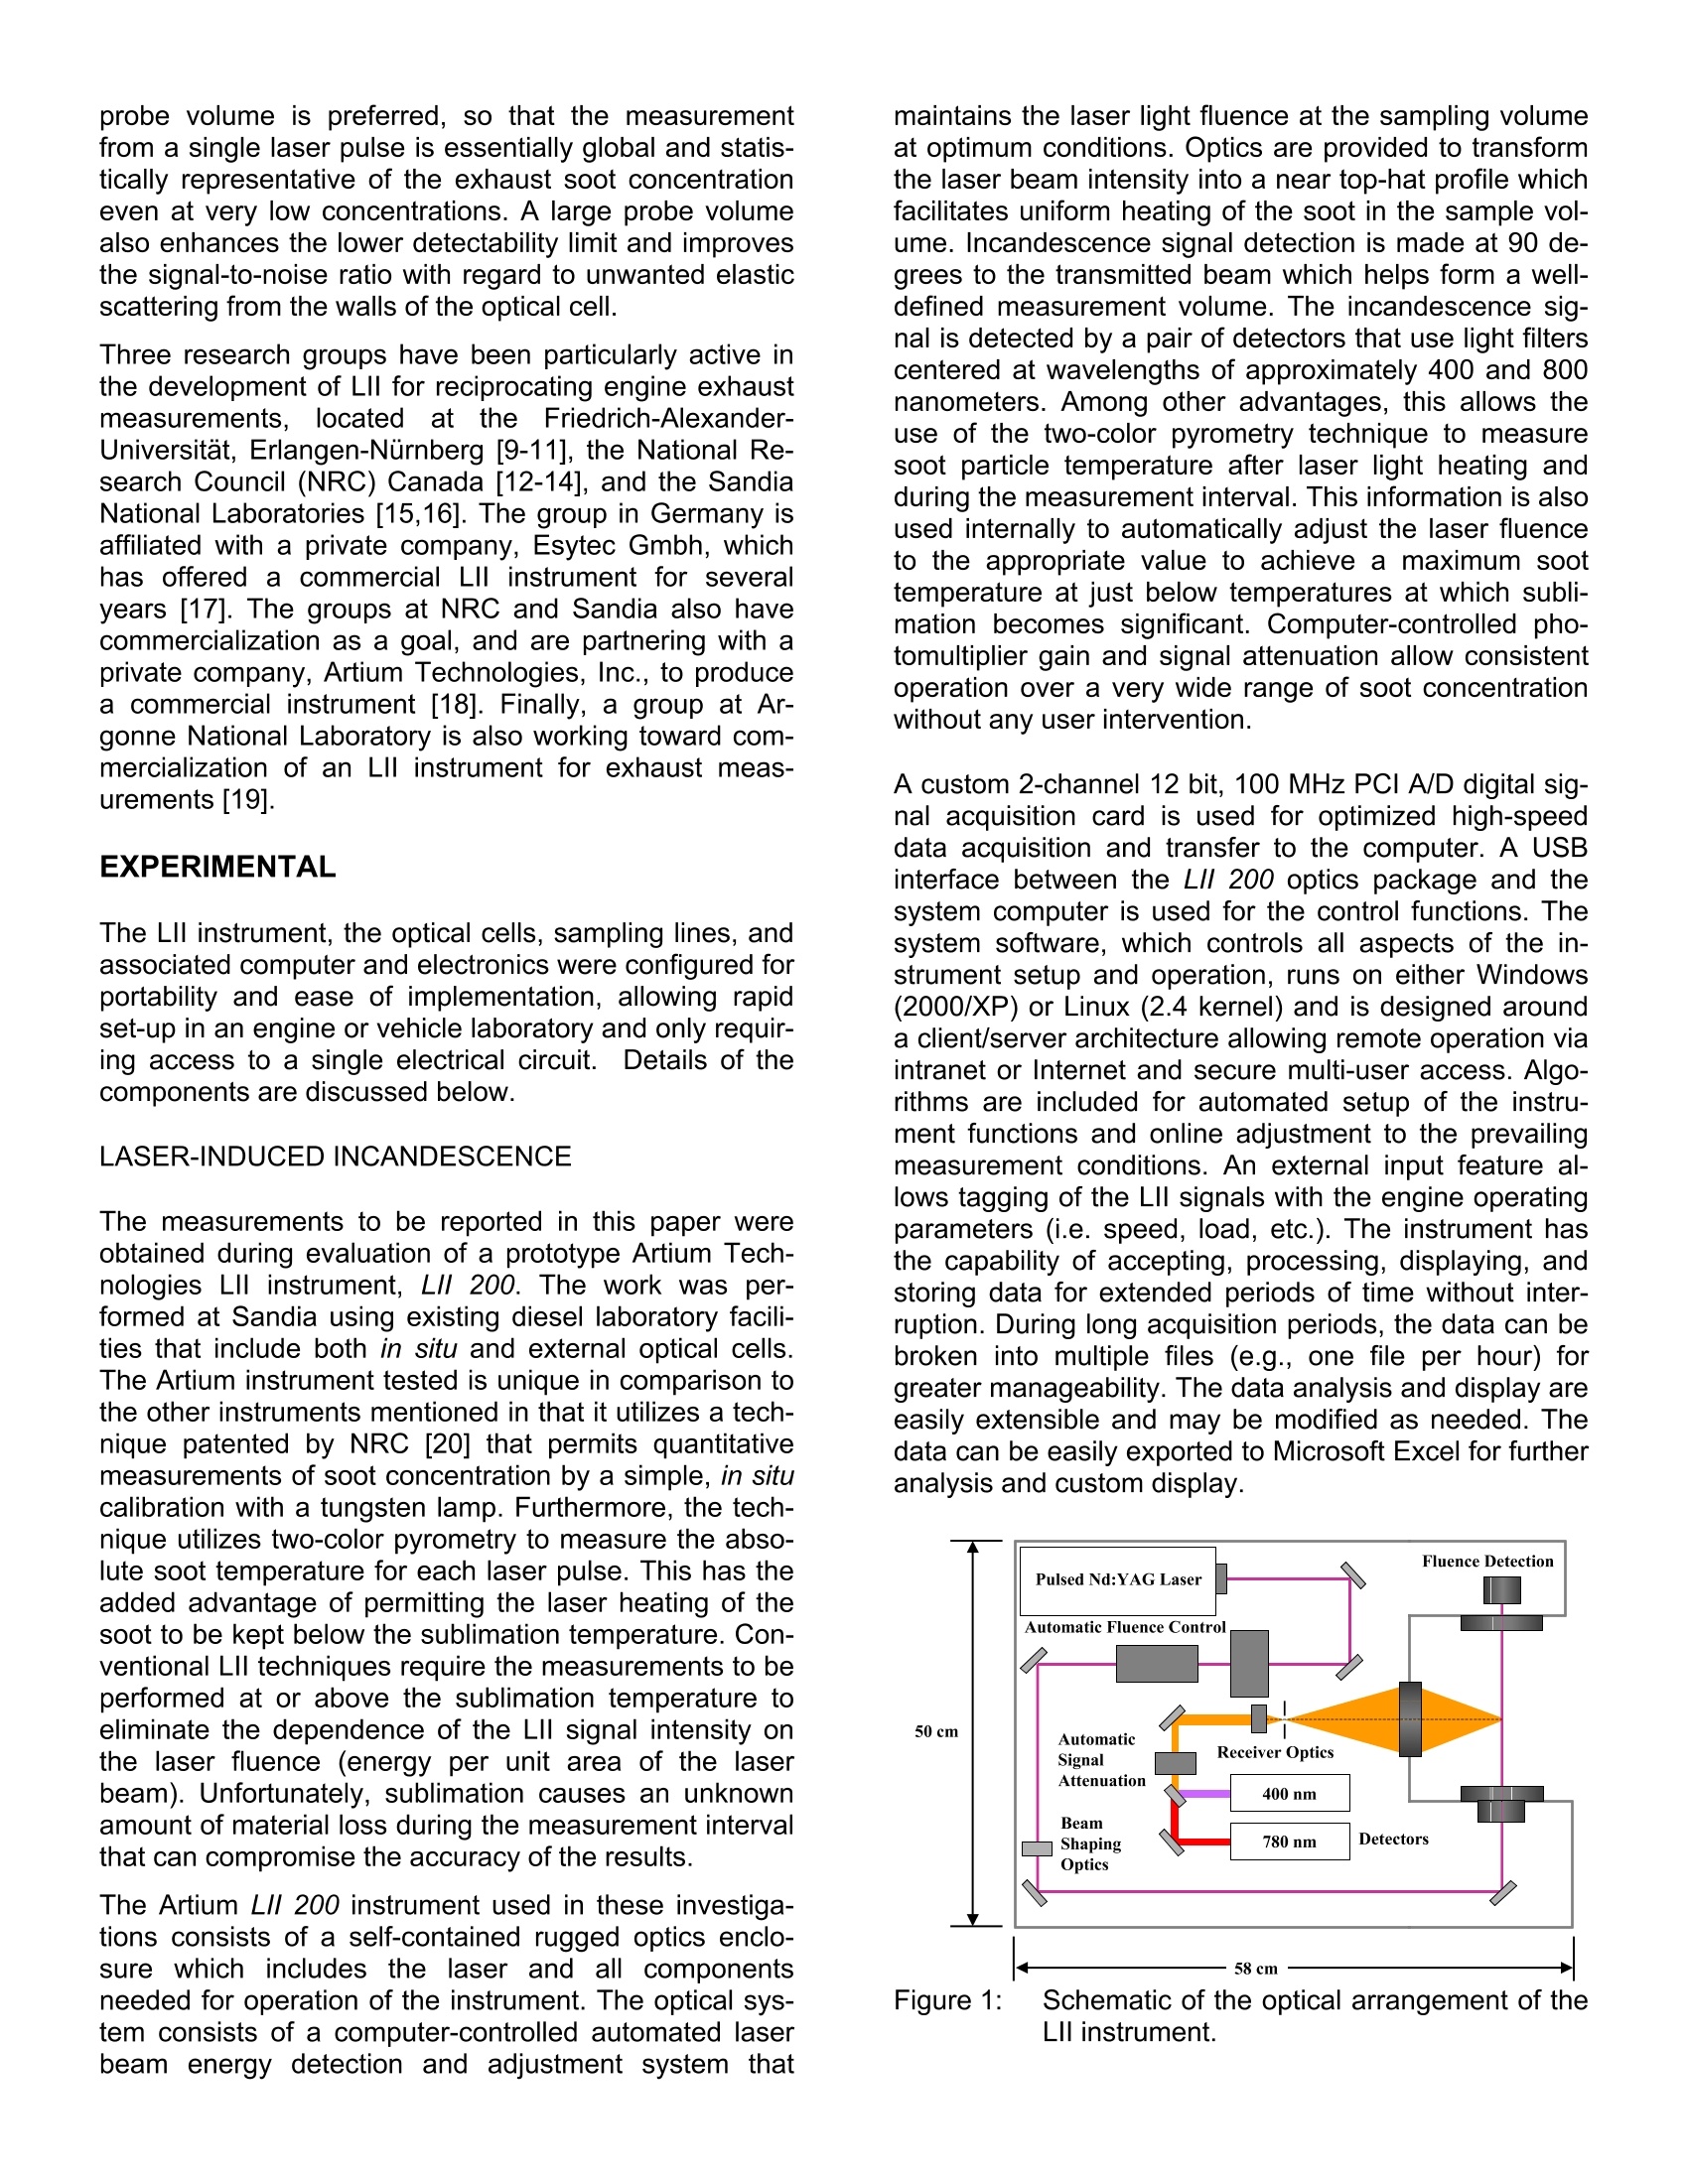
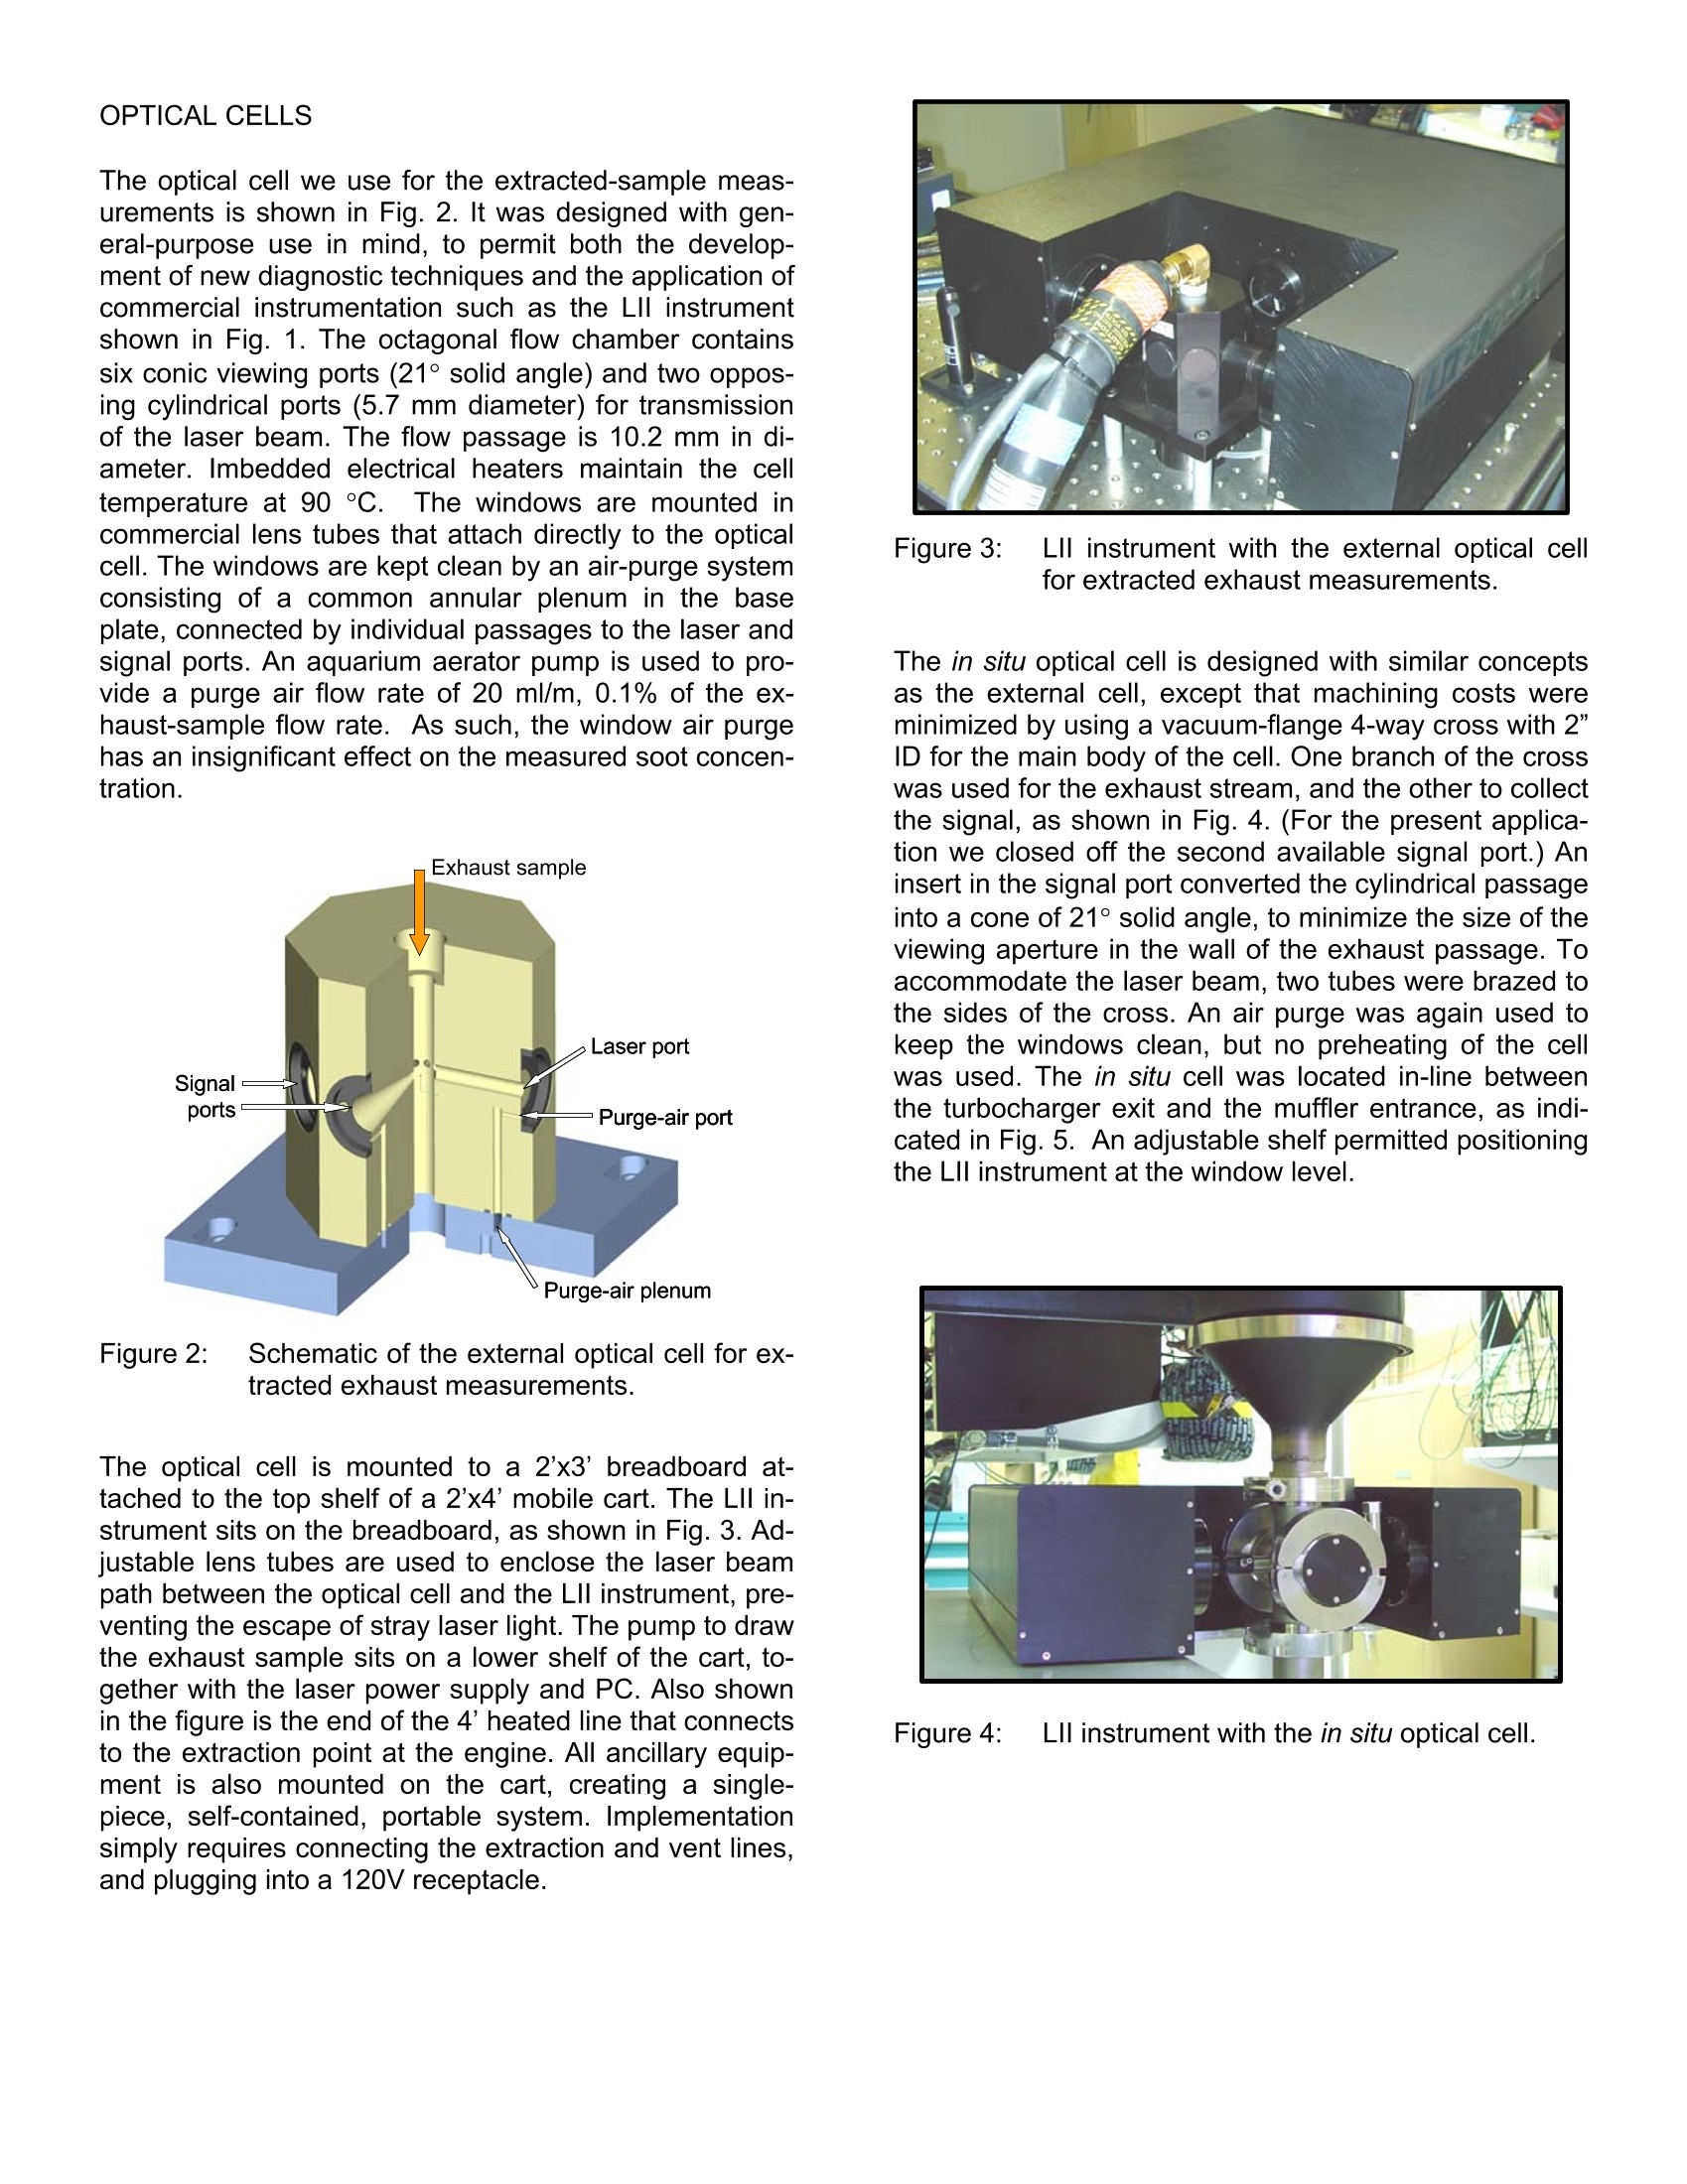
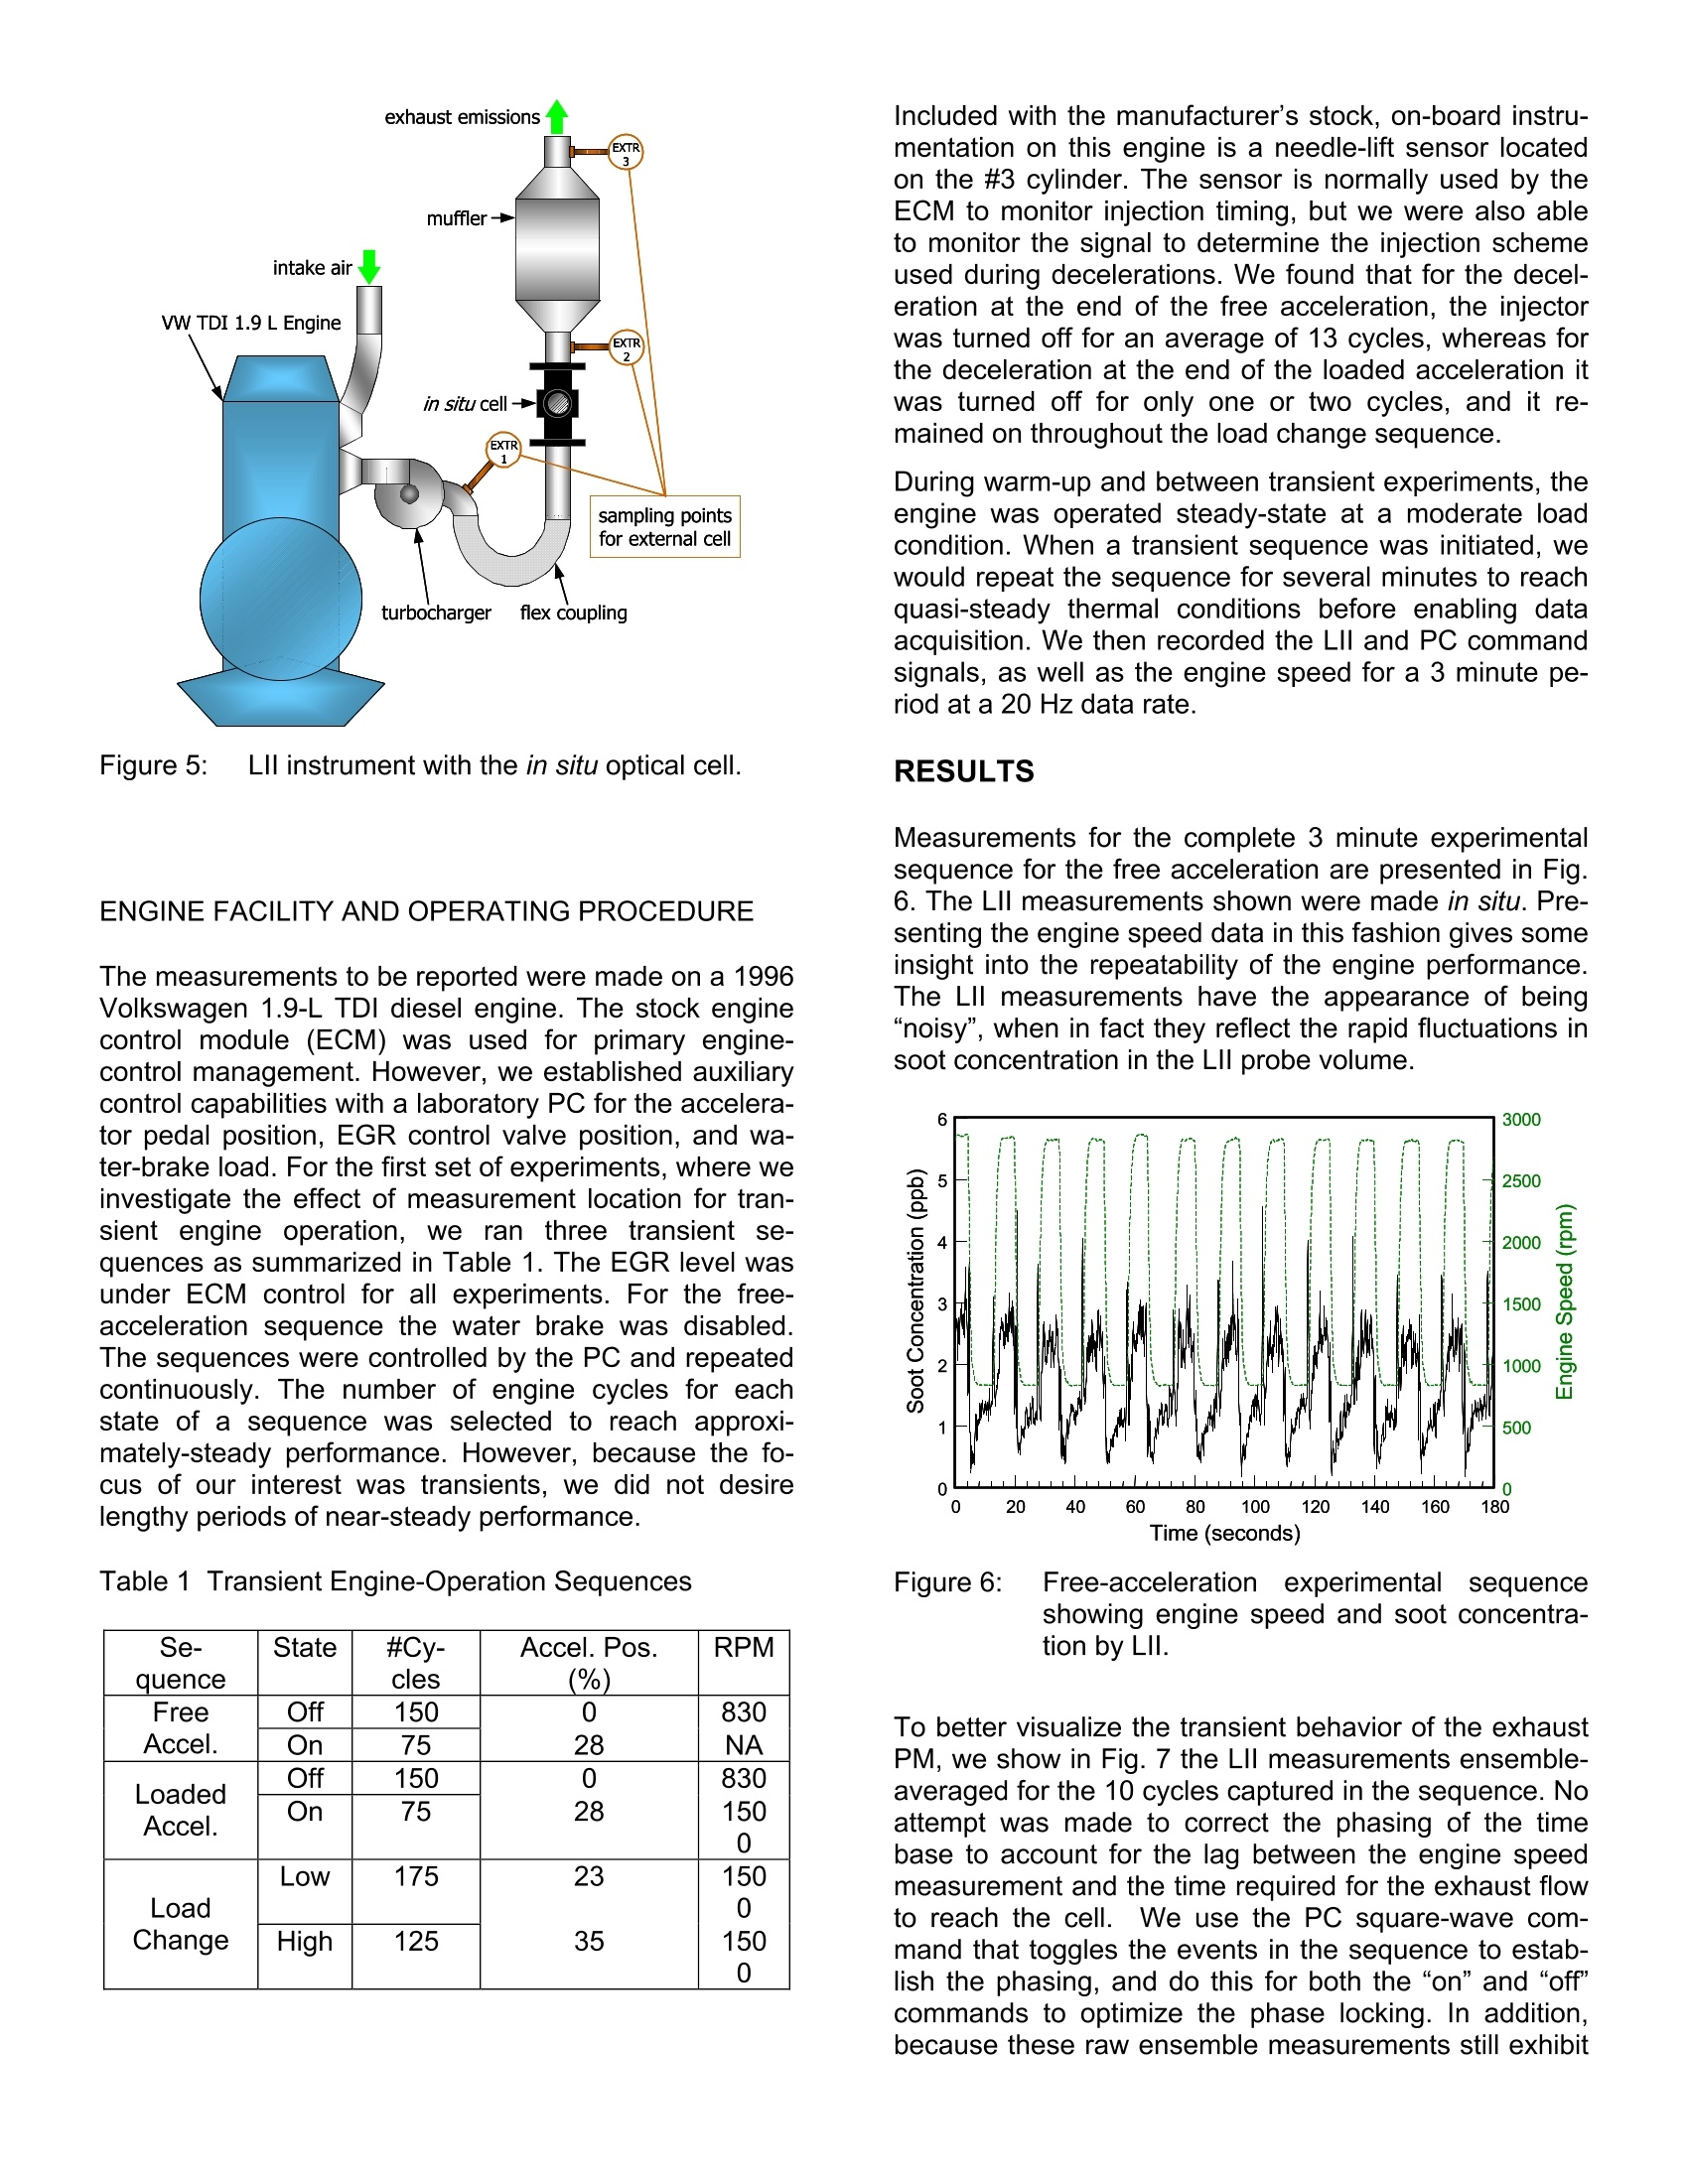
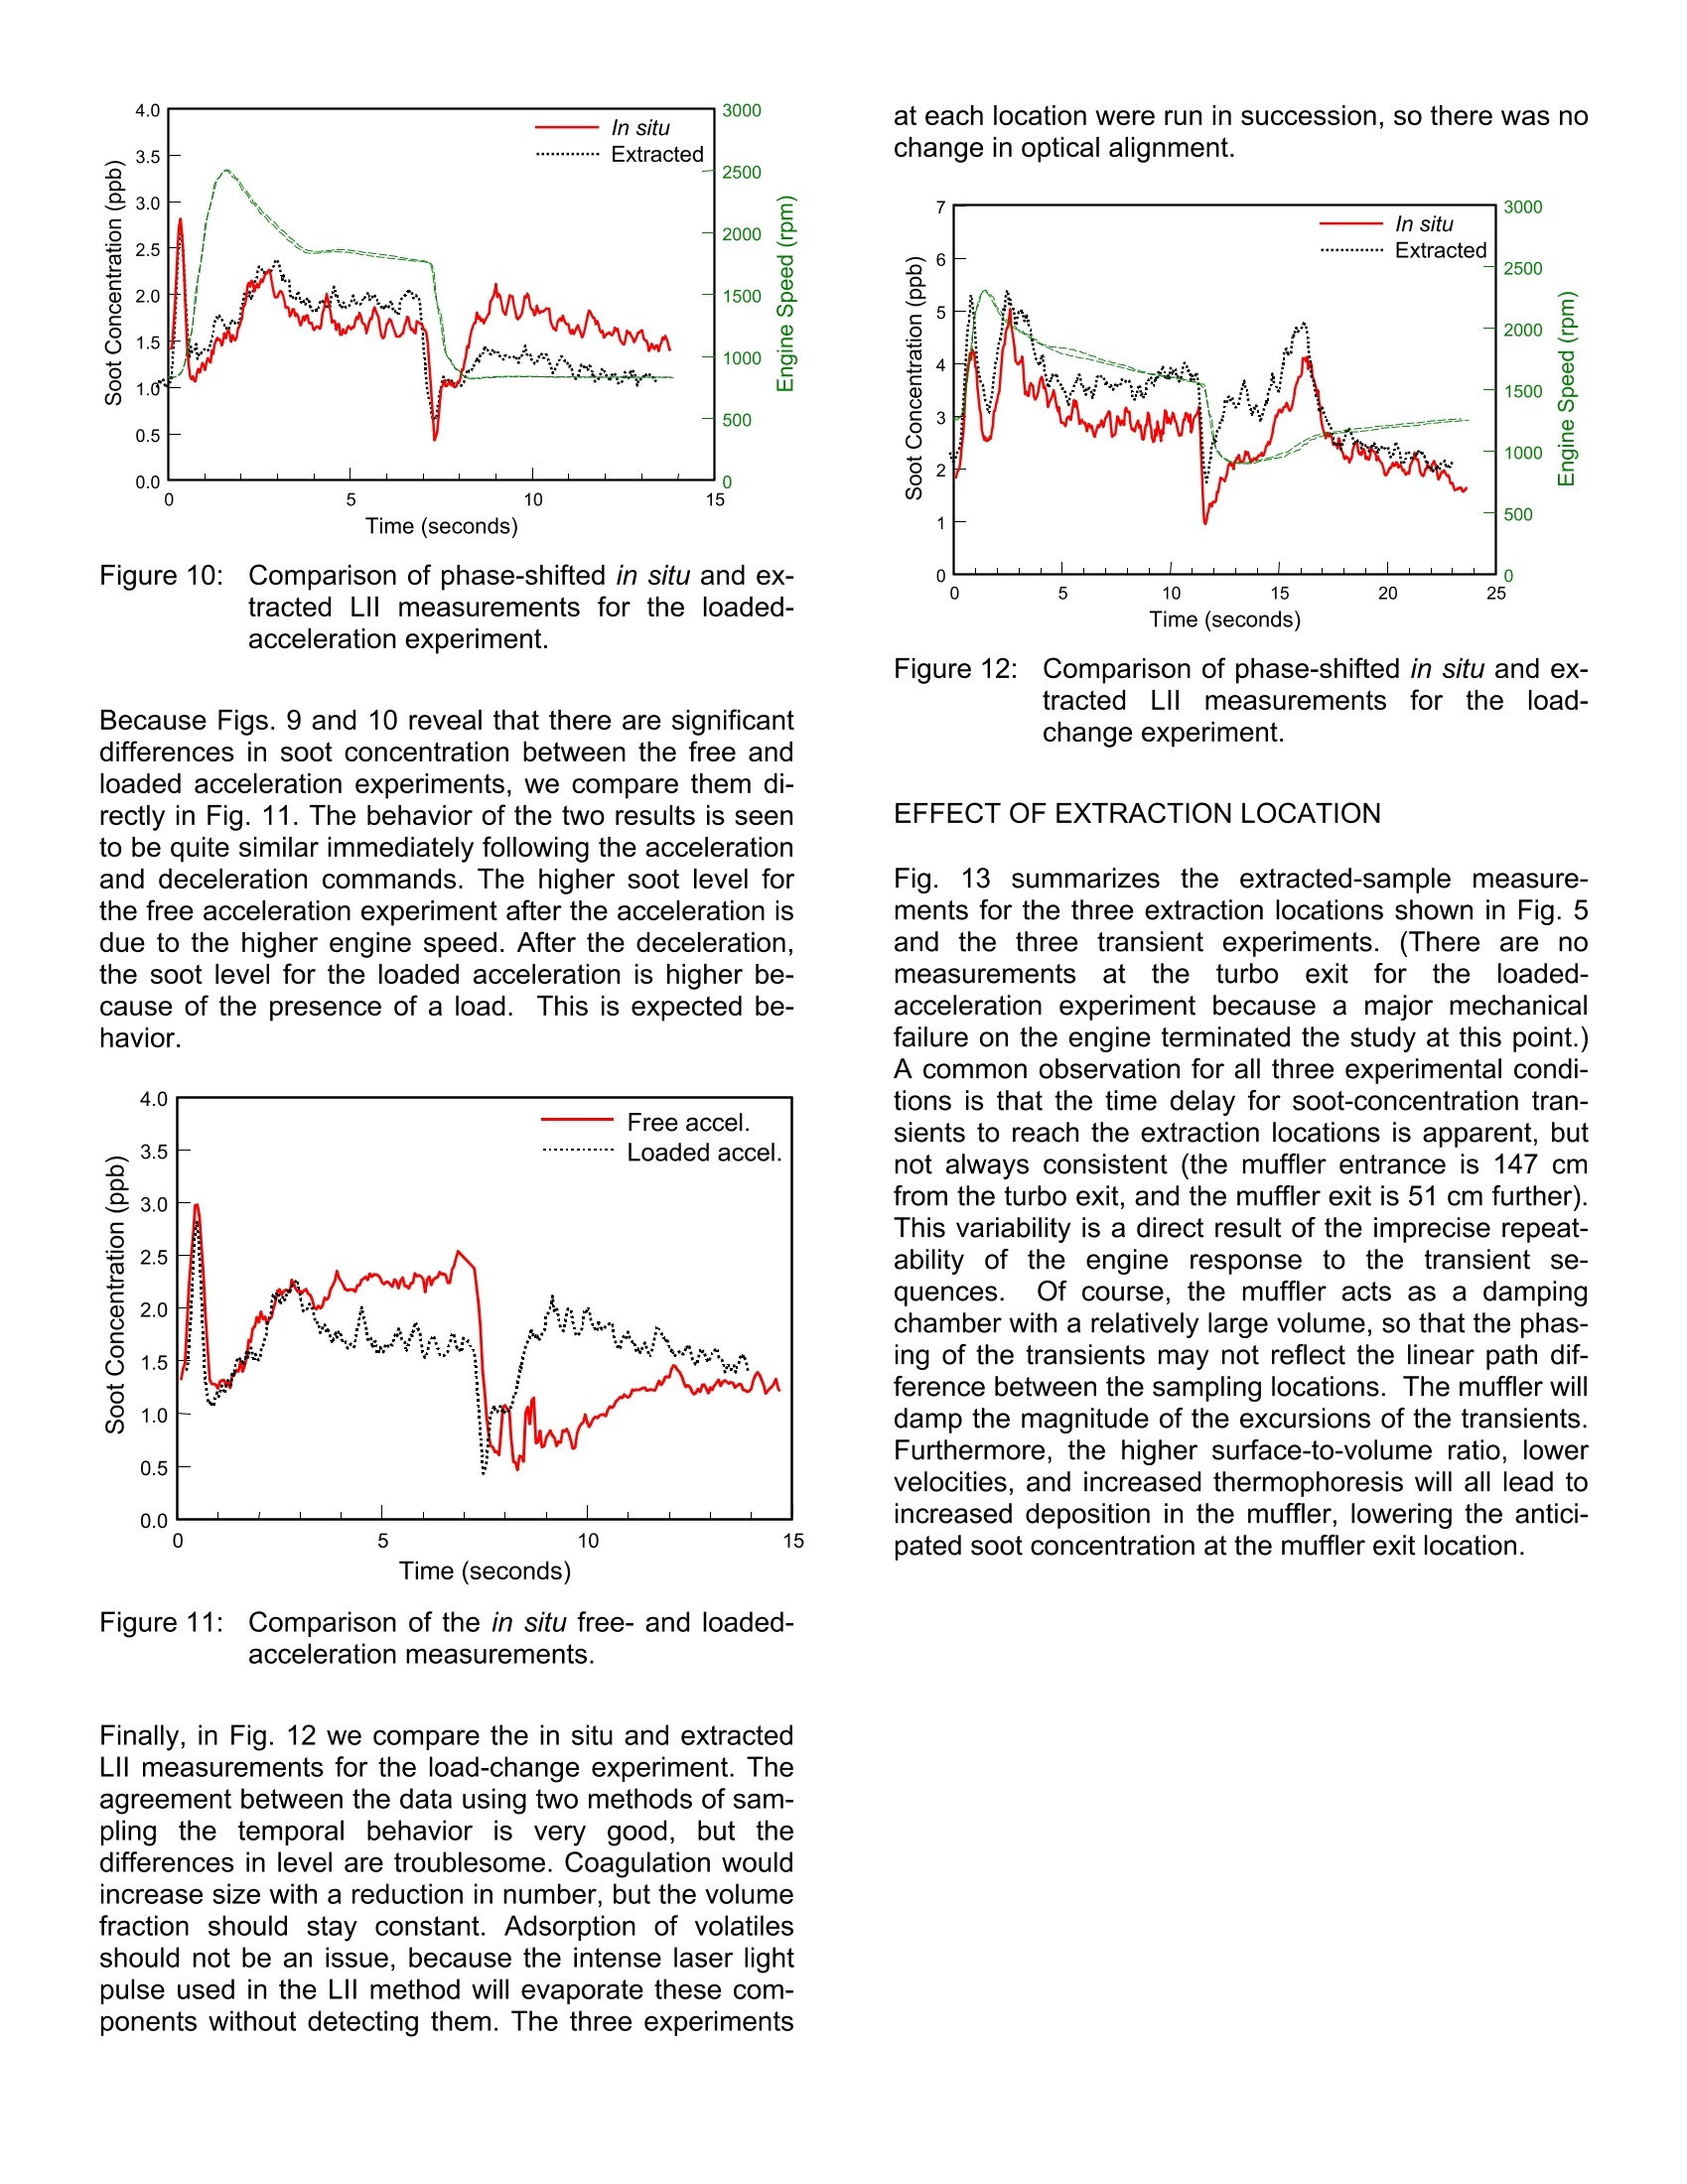
04ANNUAL-174 OPTICAL CELLS Influence of Measurement Location on TransientLaser-Induced Incandescence Measurements ofParticulate Matter in Raw Diesel Exhaust ABSTRACT Laser-induced incandescence can be applied to rawexhaust at the open tailpipe, or along the exhaust trainusing either an in situ optical cell or by extractive sam-pling to an external cell. While in situ measurements arepreferable to avoid artifacts caused by extractive sam-pling, the experimental setup may be complex and thusmore expensive to implement. In this paper we make adirect comparison of time-resolved in situ versus ex-tracted-sample measurements for rapid engine tran-sients of load and speed. In addition, we compare meas-urements for exhaust extracted from three different loca-tions: 1) at the turbocharger output; 2) at the mufflerentrance; 3) at the muffler exit. The results show thatextractive sampling sufficiently replicates in situ meas-urements obtained at the muffler entrance, and thatrapid transients in soot concentration vary to a small butdetectable degree with the measurement location INTRODUCTION Laser-induced incandescence (LIl) has been shownover the past few years to be a valuable measurementtechnique for diesel particulate matter (PM) emissions. Ahigh-energy,pulsed laser is used to heat the PM to veryhigh temperatures, resulting in blackbody radiation thatis proportional to the volume concentration of elementalcarbon (EC). The EC component of PM is also referredto as soot.:. Key advantages of LIl over more estab-lished, conventional techniques, are the ability to makereal-time measurement in raw exhaust (i.e., without dilu-tion) with high sensitivity (detection to better than onepart-per-trillion [1]). In addition, because an LIl system is Peter O. WitzeSandia National Laboratories Gregory A. PayneWilliam D. BachaloArtium Technologies Gregory J. Smallwood National Research Council Canada virtually maintenance free, it is possible to run continu-ously, producing an analog-out signal suitable for a con-ventional, emissions data-acquisition system. Since Lll can be applied to raw exhaust, in situ meas-urements are possible. Application to an open, tailpipeexhaust is relatively easy to implement, but inline meas-urements such as the entrance to a particulate filter re-quire optical access that can be both expensive andcumbersome. A much easier approach is to extract ex-haust through a sampling line to an external optical cell.In this paper we present a direct comparison of Lllmeasurements obtained in situ and by extraction. Wealso compare measurements for three different extrac-tion locations, and in the appendix report some prelimi-nary efforts for obtaining crank-angle-resolved LII meas-urements. EVOLUTION OF LII The early research using Lll focused on planar (PLII)imaging of soot distributions in stationary flames [2-4].PLII was also applied to in-cylinder studies of dieselcombustion [5-7], and played an instrumental role in ourcurrent understanding of the structure and chemistry ofburning diesel jets [8]. More recently, Lll has seen ex-tensive development as a highly-sensitive, real-time di-agnostic for reciprocating engine PM emissions. Be-cause, in general, the PM in engine exhaust is spatiallyhomogeneous, planar imaging is unnecessary, and issupplanted by single-point detection techniques usingfast photodiodes or photomultiplier tubes. Typically, aprobe volume defined by the collimated laser beam andthe collection optics is imaged onto the detector. A large probe volume is preferred, so that the measurementfrom a single laser pulse is essentially global and statis-tically representative of the exhaust soot concentrationeven at very low concentrations. A large probe volumealso enhances the lower detectability limit and improvesthe signal-to-noise ratio with regard to unwanted elasticscattering from the walls of the optical cell. Three research groups have been particularly active inthe development of Lll for reciprocating engine exhaustmeasurements, located atthe Friedrich-Alexander-Universitat, Erlangen-Nurnberg [9-11], the National Re-search Council (NRC) Canada [12-14], and the SandiaNational Laboratories [15,16]. The group in Germany isaffiliated with a private company, Esytec Gmbh, whichhas offered a commercial LIl instrument for severalyears [17]. The groups at NRC and Sandia also havecommercialization as a goal, and are partnering with aprivate company, Artium Technologies, Inc., to producea commercial instrument [18]. Finally, a group at Ar-gonne National Laboratory is also working toward com-mercialization of an Lll instrument for exhaust meas-urements [191. EXPERIMENTAL The LIl instrument, the optical cells, sampling lines, andassociated computer and electronics were configured forportability and ease of implementation, allowing rapidset-up in an engine or vehicle laboratory and only requir-ing access to a single electrical circuit.Details of thecomponents are discussed below. LASER-INDUCED INCANDESCENCE The measurements to be reported in this paper wereobtained during evaluation of a prototype Artium Tech-nologies LII instrument, LII 200. The work was per-formed at Sandia using existing diesel laboratory facili-ties that include both in situ and external optical cells.The Artium instrument tested is unique in comparison tothe other instruments mentioned in that it utilizes a tech-nique patented by NRC [20] that permits quantitativemeasurements of soot concentration by a simple, in situcalibration with a tungsten lamp. Furthermore, the tech-nique utilizes two-color pyrometry to measure the abso-lute soot temperature for each laser pulse. This has theadded advantage of permitting the laser heating of thesoot to be kept below the sublimation temperature. Con-ventional LIl techniques require the measurements to beperformed at or above the sublimation temperature toeliminate the dependence of the Lll signal intensity onthe laser fluence (energy per unit area of the laserbeam). Unfortunately, sublimation causes an unknownamount of material loss during the measurement intervalthat can compromise the accuracy of the results. The Artium L// 200 instrument used in these investiga-tions consists of a self-contained rugged optics enclo-sure which includes the laser and all componentsneeded for operation of the instrument. The optical sys-tem consists of a computer-controlled automated laserbeam energy detection and adjustment system that maintains the laser light fluence at the sampling volumeat optimum conditions. Optics are provided to transformthe laser beam intensity into a near top-hat profile whichfacilitates uniform heating of the soot in the sample vol-ume. Incandescence signal detection is made at 90 de-grees to the transmitted beam which helps form a well-defined measurement volume. The incandescence sig-nal is detected by a pair of detectors that use light filterscentered at wavelengths of approximately 400 and 800nanometers. Among other advantages, this allows theuse of the two-color pyrometry technique to measuresoot particle temperature after laser light heating andduring the measurement interval. This information is alsoused internally to automatically adjust the laser fluenceto the appropriate value to achieve a maximum soottemperature at just below temperatures at which subli-mation becomes significant. Computer-controlled pho-tomultiplier gain and signal attenuation allow consistentoperation over a very wide range of soot concentrationwithout any user intervention. A custom 2-channel 12 bit, 100 MHz PCI A/D digital sig-nal acquisition card is used for optimized high-speeddata acquisition and transfer to the computer. A USBinterface between the L/l 200 optics package and thesystem computer is used for the control functions. Thesystem software, which controls all aspects of the in-strument setup and operation, runs on either Windows(2000/XP) or Linux (2.4 kernel) and is designed arounda client/server architecture allowing remote operation viaintranet or Internet and secure multi-user access. Algo-rithms are included for automated setup of the instru-ment functions and online adjustment to the prevailingmeasurement conditions. An external input feature al-lows tagging of the LIl signals with the engine operatingparameters (i.e. speed,load, etc.). The instrument hasthe capability of accepting, processing, displaying, andstoring data for extended periods of time without inter-ruption. During long acquisition periods, the data can bebroken into multiple files (e.g., one file per hour) forgreater manageability. The data analysis and display areeasily extensible and may be modified as needed. Thedata can be easily exported to Microsoft Excel for furtheranalysis and custom display. Figure 1: Schematic of the optical arrangement of theLIl instrument. The optical cell we use for the extracted-sample meas-urements is shown in Fig. 2. It was designed with gen-eral-purpose use in mind, to permit both the develop-ment of new diagnostic techniques and the application ofcommercial instrumentation such as the LIl instrumentshown in Fig. 1. The octagonal flow chamber containssix conic viewing ports (21° solid angle) and two oppos-ing cylindrical ports (5.7 mm diameter) for transmissionof the laser beam. The flow passage is 10.2 mm in di-ameter. Imbedded electrical heaters maintain the celltemperature at 90 ℃.The windows are mounted incommercial lens tubes that attach directly to the opticalcell. The windows are kept clean by an air-purge systemconsisting of a common annular plenum in the baseplate, connected by individual passages to the laser andsignal ports. An aquarium aerator pump is used to pro-vide a purge air flow rate of 20 ml/m, 0.1% of the ex-haust-sample flow rate. As such, the window air purgehas an insignificant effect on the measured soot concen-tration. Figure 2: Schematic of the external optical cell for ex-tracted exhaust measurements. The optical cell is mounted to a 2'x3'breadboard at-tached to the top shelf of a 2'x4’'mobile cart. The Lll in-strument sits on the breadboard, as shown in Fig.3. Ad-justable lens tubes are used to enclose the laser beampath between the optical cell and the Lll instrument, pre-venting the escape of stray laser light. The pump to drawthe exhaust sample sits on a lower shelf of the cart, to-gether with the laser power supply and PC. Also shownin the figure is the end of the 4'heated line that connectsto the extraction point at the engine. All ancillary equip-ment is also mounted on the cart, creating a single-piece, self-contained, portable system. Implementationsimply requires connecting the extraction and vent lines,and plugging into a 120V receptacle. Figure 3: LIl instrument with the external optical cellfor extracted exhaust measurements. The in situ optical cell is designed with similar conceptsas the external cell, except that machining costs wereminimized by using a vacuum-flange 4-way cross with 2”ID for the main body of the cell. One branch of the crosswas used for the exhaust stream, and the other to collectthe signal, as shown in Fig. 4. (For the present applica-tion we closed off the second available signal port.) Aninsert in the signal port converted the cylindrical passageinto a cone of 21°solid angle, to minimize the size of theviewing aperture in the wall of the exhaust passage. Toaccommodate the laser beam, two tubes were brazed tothe sides of the cross. An air purge was again used tokeep the windows clean, but no preheating of the cellwas used. The in situ cell was located in-line betweenthe turbocharger exit and the muffler entrance, as indi-cated in Fig. 5. An adjustable shelf permitted positioningthe Lll instrument at the window level. Figure 4: Lll instrument with the in situ optical cell. Figure 5: LIlinstrument with the in situ optical cell. ENGINE FACILITY AND OPERATING PROCEDURE The measurements to be reported were made on a 1996Volkswagen 1.9-L TDI diesel engine. The stock enginecontrol module (ECM) was used for primary engine-control management. However, we established auxiliarycontrol capabilities with a laboratory PC for the accelera-tor pedal position, EGR control valve position, and wa-ter-brake load. For the first set of experiments, where weinvestigate the effect of measurement location for tran-sient engine operation, we ran three transient se-quences as summarized in Table 1. The EGR level wasunder ECM control for all experiments. For the free-acceleration sequence the water brake was disabled.The sequences were controlled by the PC and repeatedcontinuously. The number of engine cycles for eachstate of a sequence was selected to reach approxi-mately-steady performance. However, because the fo-cus of our interest was transients, we did not desirelengthy periods of near-steady performance. Table 1 Transient Engine-Operation Sequences Se- quence State #Cy-cles Accel. Pos.%) RPM FreeAccel. Off 150 0 28 830NA On 75 LoadedAccel. Off 150 0 28 8301500 On 75 Load Change LoW 175 23 35 1500150 0 High 125 Included with the manufacturer’s stock, on-board instru-mentation on this engine is a needle-lift sensor locatedon the #3 cylinder. The sensor is normally used by theECM to monitor injection timing,but we were also ableto monitor the signal to determine the injection schemeused during decelerations. We found that for the decel-eration at the end of the free acceleration, the injectorwas turned off for an average of 13 cycles, whereas forthe deceleration at the end of the loaded acceleration itwas turned off for only one or two cycles, and it re-mained on throughout the load change sequence. During warm-up and between transient experiments, theengine was operated steady-state at a moderate loadcondition. When a transient sequence was initiated, wewould repeat the sequence for several minutes to reachquasi-steady thermal conditions before enabling dataacquisition. We then recorded the Lll and PC commandsignals, as well as the engine speed for a 3 minute pe-riod at a 20 Hz data rate. RESULTS Measurements for the complete 3 minute experimentalsequence for the free acceleration are presented in Fig.6. The Lll measurements shown were made in situ. Pre-senting the engine speed data in this fashion gives someinsight into the repeatability of the engine performance.The LIl measurements have the appearance of being“noisy", when in fact they reflect the rapid fluctuations insoot concentration in the Lll probe volume. Figure 6: Free-acceleration experimental sequenceshowing engine speed and soot concentra-tion by Lll. To better visualize the transient behavior of the exhaustPM, we show in Fig. 7 the Lll measurements ensemble-averaged for the 10 cycles captured in the sequence. Noattempt was made to correct the phasing of the timebase to account for the lag between the engine speedmeasurement and the time required for the exhaust flowto reach the cell. We use the PC square-wave com-mand that toggles the events in the sequence to estab-lish the phasing, and do this for both the “on”and “off"commands to optimize the phase locking. In addition,because these raw ensemble measurements still exhibit significant fluctuations, we apply a smoothing procedurewhere we plot the average of every 5-adjacent points.As seen in Fig. 7, this has only a moderate effect on theamplitude of the largest excursions in the transientmeasurements. Figure 7: Ensemble average of free-acceleration re-sults comparing the raw ensemble with a 5-point smoothing procedure. The Lll measurements presented in Fig. 7 reveal anabrupt burst of soot in response to thhea aacnccelerate com-mand, followed by a return to the initial level and then amore gradual rise to a plateau that appears to approachan asymptote toward the end of the high speed interval.A corresponding rapid reduction of soot is seen to occurwhen fuel injection is interrupted at deceleration. Asmentioned earlier, fuel injection is disabled by the ECMfor an average of 13 engine cycles for this free-acceleration experiment. Assuming an average speed of2000 rpm, this corresponds to slightly less than onesecond, which is of the order of the corresponding ob-served soot decay period. This is followed by anotherrapid burst of soot that we suspect is due to the resump-tion of fuel injection. From this point there is a moregradual decline to a minimum before an increase at aslower rate, approaching an asymptote near the initialsoot concentration. IN SITU VERSUS EXTRACTION The optical cells used for this study were not specificallydesigned for compatibility with the Artium LIl instrument.As a consequence, the signal-collection ports of the ex-ternal cell have a smaller geometric solid angle than thecollection optics of the Lll instrument, resulting in a lossof measured LIl signal that necessitated the applicationof a correction factor to the magnitude of the Lll meas-urements of extracted soot. Due to this clipping of thecollected light, the external cell was also much moresensitive to misalignment than the in situ cell. The in situ Lll measurements for the free-accelerationexperiment are shown in Fig. 8 compared with extractedsample results taken from just before the muffler, imme-diately downstream of the in situ cell (see Fig. 5). Theseand subsequent measurements report the 5-point aver- age of ensemble averaged results for a sequence of 10transient operations..The engine speed measurementsfor both experiments are shown, to illustrate engine per-formance repeatability. The extracted Lll results are de-layed in time relative to the in situ measurements be-cause of the additional transit time of the exhaust gasesfrom the extraction point to the external optical cell. Nei-ther is compensated to align with the engine speed data. Figure 8: Comparison of in situ and extracted LIlmeasurements for the free-acceleration ex-periment. In Fig. 9 we show the extracted measurements empiri-cally phase-shifted to align with the in situ results, andamplitude corrected as discussed earlier. The similarityof the measurements is excellent, particularly consider-ing the difficulty of achieving identical engine perform-ance for measurements taken many hours apart. Figure 9: Comparison of phase-shifted in situ and ex-tracted Lll measurements for the free-acceleration experiment. In Fig. 10 we show the comparison for the loaded-acceleration experiment described in Table l, whereagain we have phase-shifted the extracted measure-ments. We don’t have an explanation for the differencesin amplitude in the quasi-steady regions following theacceleration and deceleration transients. However, thegeneral features of the transient soot concentration fol-low the same temporal behavior in both cases. Figure 10: Comparison of phase-shifted in situ and ex-tracted Lll measurements for the loaded-acceleration experiment. Because Figs. 9 and 10 reveal that there are significantdifferences in soot concentration between the free andloaded acceleration experiments, we compare them di-rectly in Fig. 11. The behavior of the two results is seento be quite similar immediately following the accelerationand deceleration commands. The higher soot level forthe free acceleration experiment after the acceleration isdue to the higher engine speed. After the deceleration,the soot level for the loaded acceleration is higher be-cause of the presence of a load. This is expected be-havior. Figure 1:1 :Comparison of the in situ free-and loaded-acceleration measurements. Finally, in Fig. 12 we compare the in situ and extractedLll measurements for the load-change experiment. Theagreement between the data using two methods of sam-pling the temporal behavior is very good, but thedifferences in level are troublesome. Coagulation wouldincrease size with a reduction in number, but the volumefraction should stay constant. Adsorption of volatilesshould not be an issue, because the intense laser lightpulse used in the Lll method will evaporate these com-ponents without detecting them. The three experiments at each location were run in succession, so there was nochange in optical alignment. Figure 12: Comparison of phase-shifted in situ and ex-tracted LIl measurements for the load-change experiment. EFFECT OF EXTRACTION LOCATION Fig.13 summarizes the extracted-sample measure-ments for the three extraction locations shown in Fig.5and the three transient experiments. (There are nomeasurementss at the turbo exitfor the loaded-acceleration experiment because a major mechanicalfailure on the engine terminated the study at this point.)A common observation for all three experimental condi-tions is that the time delay for soot-concentration tran-sients to reach the extraction locations is apparent, butnot always consistent (the muffler entrance is 147 cmfrom the turbo exit, and the muffler exit is 51 cm further).This variability is a direct result of the imprecise repeat-ability of the engine response to the transient se-quences.. Of course, the muffler acts as a dampingchamber with a relatively large volume, so that the phas-ing of the transients may not reflect the linear path dif-ference between the sampling locations. The muffler willdamp the magnitude of the excursions of the transients.Furthermore, the higher surface-to-volume ratio, lowervelocities, and increased thermophoresis will all lead toincreased deposition in the muffler, lowering the antici-pated soot concentration at the muffler exit location. a.) Free acceleration Time (seconds) b.)Loaded acceleration c.) Load change Figure 13::Effect of extraction location on LIl meas-urements of soot concentration. For both the free and loaded acceleration, the burst ofsoot at the start of the transients is measurably lower atthe muffler exit compared11to the other locations. whereas this is not the case for the load change. For theremainder of the experimental periods the soot levelsare quite similar at all locations with two exceptions.First, for the high speed portion of the free acceleration(Fig. 13a) the soot concentration at the muffler exit isconsiderably lower than at the other two locations,whereas for the low speed portion the muffler entranceand exit concentrations are similar but lower than at theturbo exit. Second, following the load change in Fig. 13cthere are significant differences in soot concentration forall three locations, with a consistent trend of lower sootwith distance from the engine. This is consistent withdeposition of the soot particles along the pathway fromthe engine, with the greatest deposition occurring in themuffler. CONCLUSIONS Considering the difficulty in achieving closely repeatedconditions, it would appear that soot concentration doesnot change significantly during passage through the ex-haust system. As Lil is insensitive to coagulation anddesorption, it is likely that any changes observed aredue to deposition on the walls. There also is negligibleloss in temporal behavior between in situ and extractedmeasurements. Some differences in concentration wereobserved, which are likely due to diffusion, damping oftransients, and mixing in the streamwise direction. Given the number of possibilities for variance in the sootemissions, the results were in good agreement and thetrends were clearly identifiable. We have evaluated theLll method under steady state conditions and havefound excellent precision in the measurements. Varia-tions over extended periods of time were much smallerthan the variance seen in the present results. Thus, itmay be concluded that the variations in the data weredue to the source (changes in the engine conditions,exhaust system, and sampling devices). Nonetheless,the results provide useful information of the transientemissions characteristic of diesel engines, whether insitusampling or extractive sampling is used. ACKNOWLEDGMENTS This work was performed at the Combustion ResearchFacility, Sandia National Laboratories, Livermore, CA.The Sandia contribution was funded by the U.S. De-partment of Energy, Office of FreedomCAR and VehicleTechnologies under the direction of Gurpreet Singh. TheArtium contribution was funded by NASA Glenn Re-search Center under SBIR Phase I-III contracts, and bythe U. S. EPA under SBIR Phase land Phase Il con-tracts. The NRC contribution was funded by the Particu-lates POL of the Canadian Government's PERD Pro-gram. REFERENCES 1. Wainner, R. T., Seitzman, J. M. and Martin. S. R.,"Soot Measurements in a Simulated Engine Exhaust using Laser-Induced Incandescence," AIAA J. 37,No.6, pp. 738-743,1999. 2. Vander Wal, R. L. and Weiland, K. J., '"Laser-Induced Incandescence: Development and Charac-terization Towards a Measurement of Soot VolumeFraction,"Appl.Phys. B 59:445-452,1994. 3. Shaddix, C. R and Smyth, K. C.,"Quantitative Meas-urements of Enhanced Soot Production in Steadyand Flickering Methane/Air Diffusion Flame,"Comb.and Flame 99:723-732, 1994. 4. Ni, T., Pinson, J. A., Gupta, S. and Santoro, R. J.,"Two-Dimensional Imaging of Soot Volume Fractionby the Use of Laser-Induced Incandescence,"Appl.Opt. 34:7083-7091,1995. 5.CDec., J. E.,zur Loye, A. O. and Siebers, D. L., "SootDistribution in a D. I. Diesel Engine Using 2-DLaser-Induced Incandescence Imaging," SAE Paper No.910224,1991. 6. Won, Y-H., Kamimoto, T., Kobayashi, H. and Ko-saka, H., "2-D Soot Visualization in Unsteady SprayFlame by means of Laser Sheet Scattering Tech-nique," SAE Paper No. 910223, 1991. 7. Pinson, J. A., Mitchell, D. L., Santoro, R. J. and Litz-inger, T. A., "Quantitative, Planar Soot Measure-ments in a D.I. Diesel Engine Using Laser-InducedIncandescence and Light Scattering," SAE PaperNo.932650, 1993. 8. Dec, J. E., “A Conceptual Model of DI Diesel Com-bustion Based on Laser-Sheet Imaging,” SAE PaperNo. 970873, 1997. 9.. sSchraml, S., Will, S., and Leipertz, A., “SimultaneousMeasurement of Soot Mass Concentration and Pri-mary Particle Size in the Exhaust of a DI Diesel En-gine by Time-Resolved Laser-Induced Incandes-cence (TIRE-LII),"SAE Paper 1999-01-0146,1999. 10. Schraml, S., Will, S., Leipertz, A., Zens, T., andD'Alfonso,N., “Performance Characteristics of TIRE-LII Soot Diagnostics in Exhaust Gases of Diesel En-gines," SAE Paper No.2000-01-2002, 2000. 11. Schraml, S., Heimgartner, C., Will, S., Leipertz, A.,and Hemm, A.,“Application of a New Soot Sensorfor Exhaust Emission Control Based on Time Re-solved Laser Induced Incandescence (TIRE-LII),"SAE PaperNo. 2000-01-2864,2000. 12. Snelling,D. R., Smallwood, G. J1., Sawchuk, R. A.,NBCeill, W. S., Gareau, D., Clavel, D., Chippior, W. L.,Liu, F., Gulder, O. L. and Bachalo, W. D., “Particu-late Matter Measurements in a Diesel Engine Ex-haust by Laser-Induced Incandescence and theStandard Gravimetric Procedure,” SAE Paper No.1999-01-3653,1999. 13.Snelling, D. R., Smallwood, G.J. and Gulder,O. L.,"Soot Volume Fraction Characterization Using the Laser-Induced Incandescence Detection Method."Proceedings of the 10" International Symposium onApplications of Laser Techniques to Fluid Mechan-ics, Lisbon, 2000. 14. Smallwood, G. J.,Snelling, D. R., Neill, W. S., Liu,F., Bachalo, W. D., and Gulder, O. L., “Laser-Induced Incandescence Measurements of Particu-late Matter Emissions in the Exhaust of a Diesel En-SIonS Ingine,” Proceedings of the Fifth International Sympo-sium on Diagnostics and Modeling of Combustion inInternal Combustion Engines (COMODIA), Nagoya,2001. 15. Witze, P. O.,“Qualitative Laser-Induced Incandes-cence Measurements of Soot Emissions DuringTransient Operation of a Port Fuel-Injected Engine,”Proceedings of the Fifth International Symposium onDiagnostics and Modeling of Combustion in InternalCombustion Engines (COMODIA), Nagoya,2001. 16. Axelsson, B., and Witze, P. O.,“Qualitative Laser-Induced Incandescence Measurements of Particu-late Emissions During Transient Operation of a TDIDiesel Engine,"SAE Paper No. 2001-01-3574. 17.http://www.esytec.de/englisch/index_engl.htm. 18. http://www.ca.sandia.gov/pmc. 19. http://transtech.anl.gov/v1n4/tgi-instrument.html. 20. Snelling, D. R., Smallwood, G. J. and Gulder, O. L.,“Absolute Light Intensity Measurements in Laser In-duced Incandescence,”US Patent No. 6,154,277,2000. 21. Dec, J. E. and Kelly-Zion, P. L., “The Effects ofInjection Timing and Diluent Addition on Late-Combustion Soot Burnout in a DI Diesel EngineBased on Simultaneous 2-D Imaging of OH andSoot," SAE Paper No. 2000-02-0238,2000. 22. Reitz, R. D., U. of Wisconsin, private communica-tion. 23. Green, R. M., “Measuring the Cylinder-to-CylinderEGR Distribution in the Intake of a Diesel EngineDuring Transient Operation,” SAE Paper No. 2000-01-2866,2000. 24. http://www.cambustion.co.uk. 25. Henein, N. A., Tagomori, M. K., Yassine, M. K., He-nien, H. A., Hartman, P. and Asmus, T., “In-SituPhase-Shift Measurement of the Time-ResolvedUBHC Emissions, SAE Paper No. 950161, 1995. CONTACT The author Witze (witze@sandia.gov) is with the Com-bustion Research Facility, Sandia National Laboratories,PO Box 969, MS 9053, Livermore, CA 94551-0969. There is reason to expect that crank-angle-resolved,cylinder-out PM measurements may be important to theunderstanding of in-cylinder soot formation mechanisms.For example, Dec and Kelly-Zion [21] used planar imag-ing by Lll to investigate incomplete burnout in the bulkgases of a heavy-duty diesel engine. They observedinhomogeneous soot pockets that tend to follow the pis-ton down during the first part of the expansion, ratherthan expanding uniformly. Crank-angle-resolvedLIImeasurements in the exhaust port could resolve thisphenomena, avoiding the need for optical access to thecylinder. As another example, the high swirl and reentrant pistonbowl characteristic of small-bore, high speed diesel en-gines creates an environment for inhomogeneous in-cylinder soot distributions. Computational fluid mechan-ICSinvestigationsspredictunoxidixedsootpocketstrapped in the piston bowl [22], such that crank-angleresolved measurements of PM flux in the exhaust portcould be valuable for model validation. Although obtaining optical access to the exhaust port isfar easier than in-cylinder access, it is not a trivial task.In addition, for two-valve-per-cylinder engines such asthe one used here, it is not uncommon to have adjacentintake and exhaust manifolds (on the same side of theblock) that make optical access even more difficult.Green [23] modified both manifolds on the engine usedin the present study to obtain optical access to all fourintake runners to develop an absorption technique forthe measurement of cylinder-to-cylinder EGR distribu-tion. Because the cost and time required to modify themanifolds was substantial, future applications of thetechnique were performed with an optical probe that wasinserted into the intake runner. An alternative approach is to continuously extract a sam-ple of the flow to an external measurement location,such as the Cambustion fast-response flame ionizationdetector [2244]1 for measuringunburned hydrocarbon(UHC). With this instrument, a gas sample is extractedfrom the exhaust port through a fine capillary tube (typi-cally 0.5 mm ID) to the ionizing flame. Because very littlemixing occurs in the streamwise direction, fast responsetimes are observed (10-90% of full scale in typically 4ms). The transit time for the sample to flow from thepickup point in the exhaust port to the flame can bemeasured directly using the procedure described1bbyHenein, et al. [25], where a nitrogen jet was used toabruptly interrupt the UHC concentration of the extractedsample. Unfortunately, capillary-sized sampling lines are notcompatible with the larger measurement volumes re-quired for optimal Lil measurements. The use of largerdiameter sample linesthus raisesthe question ofwhether mixing along the extraction path to the opticalcell severely compromises the achievable temporalresolution. In the remainder of this Appendix we assess the possible of making crank-angle-resolved LIl meas-urements using extractive sampling techniques. TEMPORAL RESPONSE ESTIMATE Fig. 14 illustrates the flow setup we used to emulate thepreviously mentioned procedure of Henein et al. [25]. A15 cm length of 14" stainless steal tubing was insertedthrough the exhaust manifold to within a centimeter ofthe exhaust valves. This piece of tubing was connectedto a 100 cm length of similar tubing with a compression“tee" fitting. This longer line was heated to 90 °℃ andconnected to the optical cell. Clean nitrogen at 400 kPawas intermittently delivered to the 90-degree branch ofthe“tee" through a fast-acting solenoid valve. Figure 14: Flow setup for synchronous interruption ofthe exhaust flow by a nitrogen jet. With the engine running at 1500 rpm (80 ms/cycle), ourYAprocedure was to open the solenoid valve every 20 en-gine cycles for a duration of 5 engine cycles. The se-quencing of the solenoid valve was controlled by thesame PC software that provided the engine transientsreported earlier in this paper. Shown in Fig. 15 are syn-chronous LIl measurements made at TDC of the com-pression stroke for an ensemble-average of 10 injectionsequences. Unlike the calibrated Lll measurements pre-sented in the first section of this paper, the data shownhere are simply the maximum of the Lll signal in volts. Itis seen that it takes two engine cycles for the effect ofthe nitrogen jet to achieve approximately 90% of the as-ymptotic values for both jet-on and jet-off. Figure 15:Synchronous LIl measurements for the ni-trogen-injection sequence. Note, however, the unusually high value for the LIlmeasurement for cycle #1. This is due to an increase inthe exhaust gas density in the optical cell caused by the400 kPa supply pressure for the nitrogen. (The nitrogeninjection command occurred at TDC of valve overlap;the Lll measurements were taken one-half cycle later atTDC of compression/expansion.)This explanation isconfirmed by the crank-angle resolved Lll measure-ments for the second injection cycle shown in Fig. 16,which reveal a distinct oscillation in the PM concentra-tion caused by pressure waves. Figure 16::Crank-angle resolved Lll measurements forthe second nitrogen-injection event. The flow rate for the extracted sample in Figs. 15 and 16was 5 Ipm. By increasing it to 10 lpm we significantlydampened the pressure oscillations, as shown by thecrank-angle resolved LIl measurements in Fig. 17 for theinitial part of the injection sequence. Based on a simplebench top deflection experiment, we estimated that thenitrogen jet arrives at the gap in the sampling line 16 msafter the command to open the solenoid valve. From thispoint, the data in Fig. 17 show a transit time through the100 cm line to the optical cell of 335 crank-angle de-grees (37 ms). Assuming simple plug flow, this corre-sponds to an average flow rate of 2.7 Ipm during this interval, as compared to the set, steady-state flow rate of10 Ipm. This confirms that the transit time to the opticalcell is strongly influenced by the high pressure of thenitrogen supply. However, we chose to use a high pres-sure to insure a rapid interruption of the PM concentra-tion in the sample flow. The results shown in Fig. 17 im-ply a response time on the order of 60-90 crank-angledegrees. While this is marginal, at best, it would seem tobe adequate to observe some transient behavior duringblowdown and exhaust. Figure 17: Crank-angle resolved Lll measurements ofthe exhaust flow interrupted by a nitrogeniet. TEMPORAL RESPONSE RESULTS Presented in Fig. 18 are crank-angle resolved LIl meas-urements for one complete engine cycle, recorded with30 crank-angle-degree resolution. The sample flow ratewas 20 Ipm, and each data point represents an ensem-ble-average of 100 laser pulses. The straight line is theaverage of all the measurements, and reveals that thereis no noticeable transient behavior in the results. Wetook some measurements at other sample flow rateswith similar results. Figure 18:(Crank-angle resolved Lll measurements ofthe exhaust flow for the configuration de-scribed in Fig. 16 (115 cm line length). In a last attempt to resolve transient behavior within anengine cycle, we moved the optical cell to as close to theengine as possible, as shown in Fig. 19. The total sam-ple line length was 30 cm, and it was necessary to havea 90-degree elbow in the line. Because of vibration ofthe engine, it was not possible to use a PMT to detectthe LIl signal. In its place we used a small photodiodethat could be mounted directly to the optical cell. Thisresulted in significantly lower Lll signal levels. Figure 19: Position of the close-coupled optical cell. Lll measurements for the close-coupled optical cell aregiven in Fig. 20 for flow rates of 10 and 20 Ipm. Becausethere was much less transient behavior for the former,results are shown for 90 crank-angle-degree resolution,whereas for the latter 10 degree resolution is used. Forplug flow at 20 lpm, and nominal exhaust valve openingat -180 crank-angle degrees, the exhaust event is calcu-lated to reach the sampling cell at -45 crank-angle de-grees, which is in reasonable agreement with the begin-ning of the Lll transient. This suggests that the increasein LlI signal at this time is most likely due to an increasein PM concentration, and not an artifact of a density in-crease associated with a pressure increase at blow-down. Thus, in this preliminary effort, it appears that it is possi-ble to measure transient crank-angle resolved soot con-centrations with Lll. However, further effort is requiredto optimize the conditions for close-coupled sampling.
确定


还剩9页未读,是否继续阅读?

产品配置单


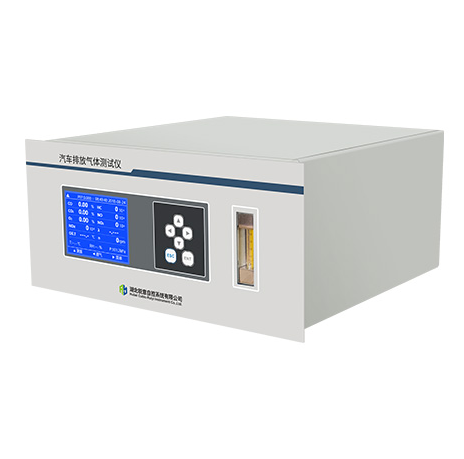
北京欧兰科技发展有限公司为您提供《柴油燃料喷雾中碳烟体积分数,碳烟初级粒径检测方案(尾气检测)》,该方案主要用于柴油中碳烟体积分数,碳烟初级粒径检测,参考标准--,《柴油燃料喷雾中碳烟体积分数,碳烟初级粒径检测方案(尾气检测)》用到的仪器有汽车发动机多参量测试系统、激光诱导白炽光烟雾粒子成像分析仪(LII)
推荐专场


烟气监测(CEMS)/烟气分析仪
更多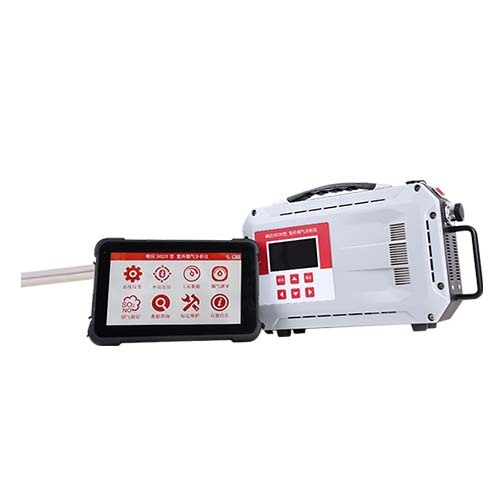
相关方案
更多
该厂商其他方案
更多