


方案详情
文
采用两台LaVision ImagerProX4M相机和两台CMOS相机构成一套可以测量两个互相垂直平面的2D2C和2D3C速度矢量场的粒子成像测速系统。用于带侧后缘锥度方型背车辆低频尾流动力学研究。
方案详情

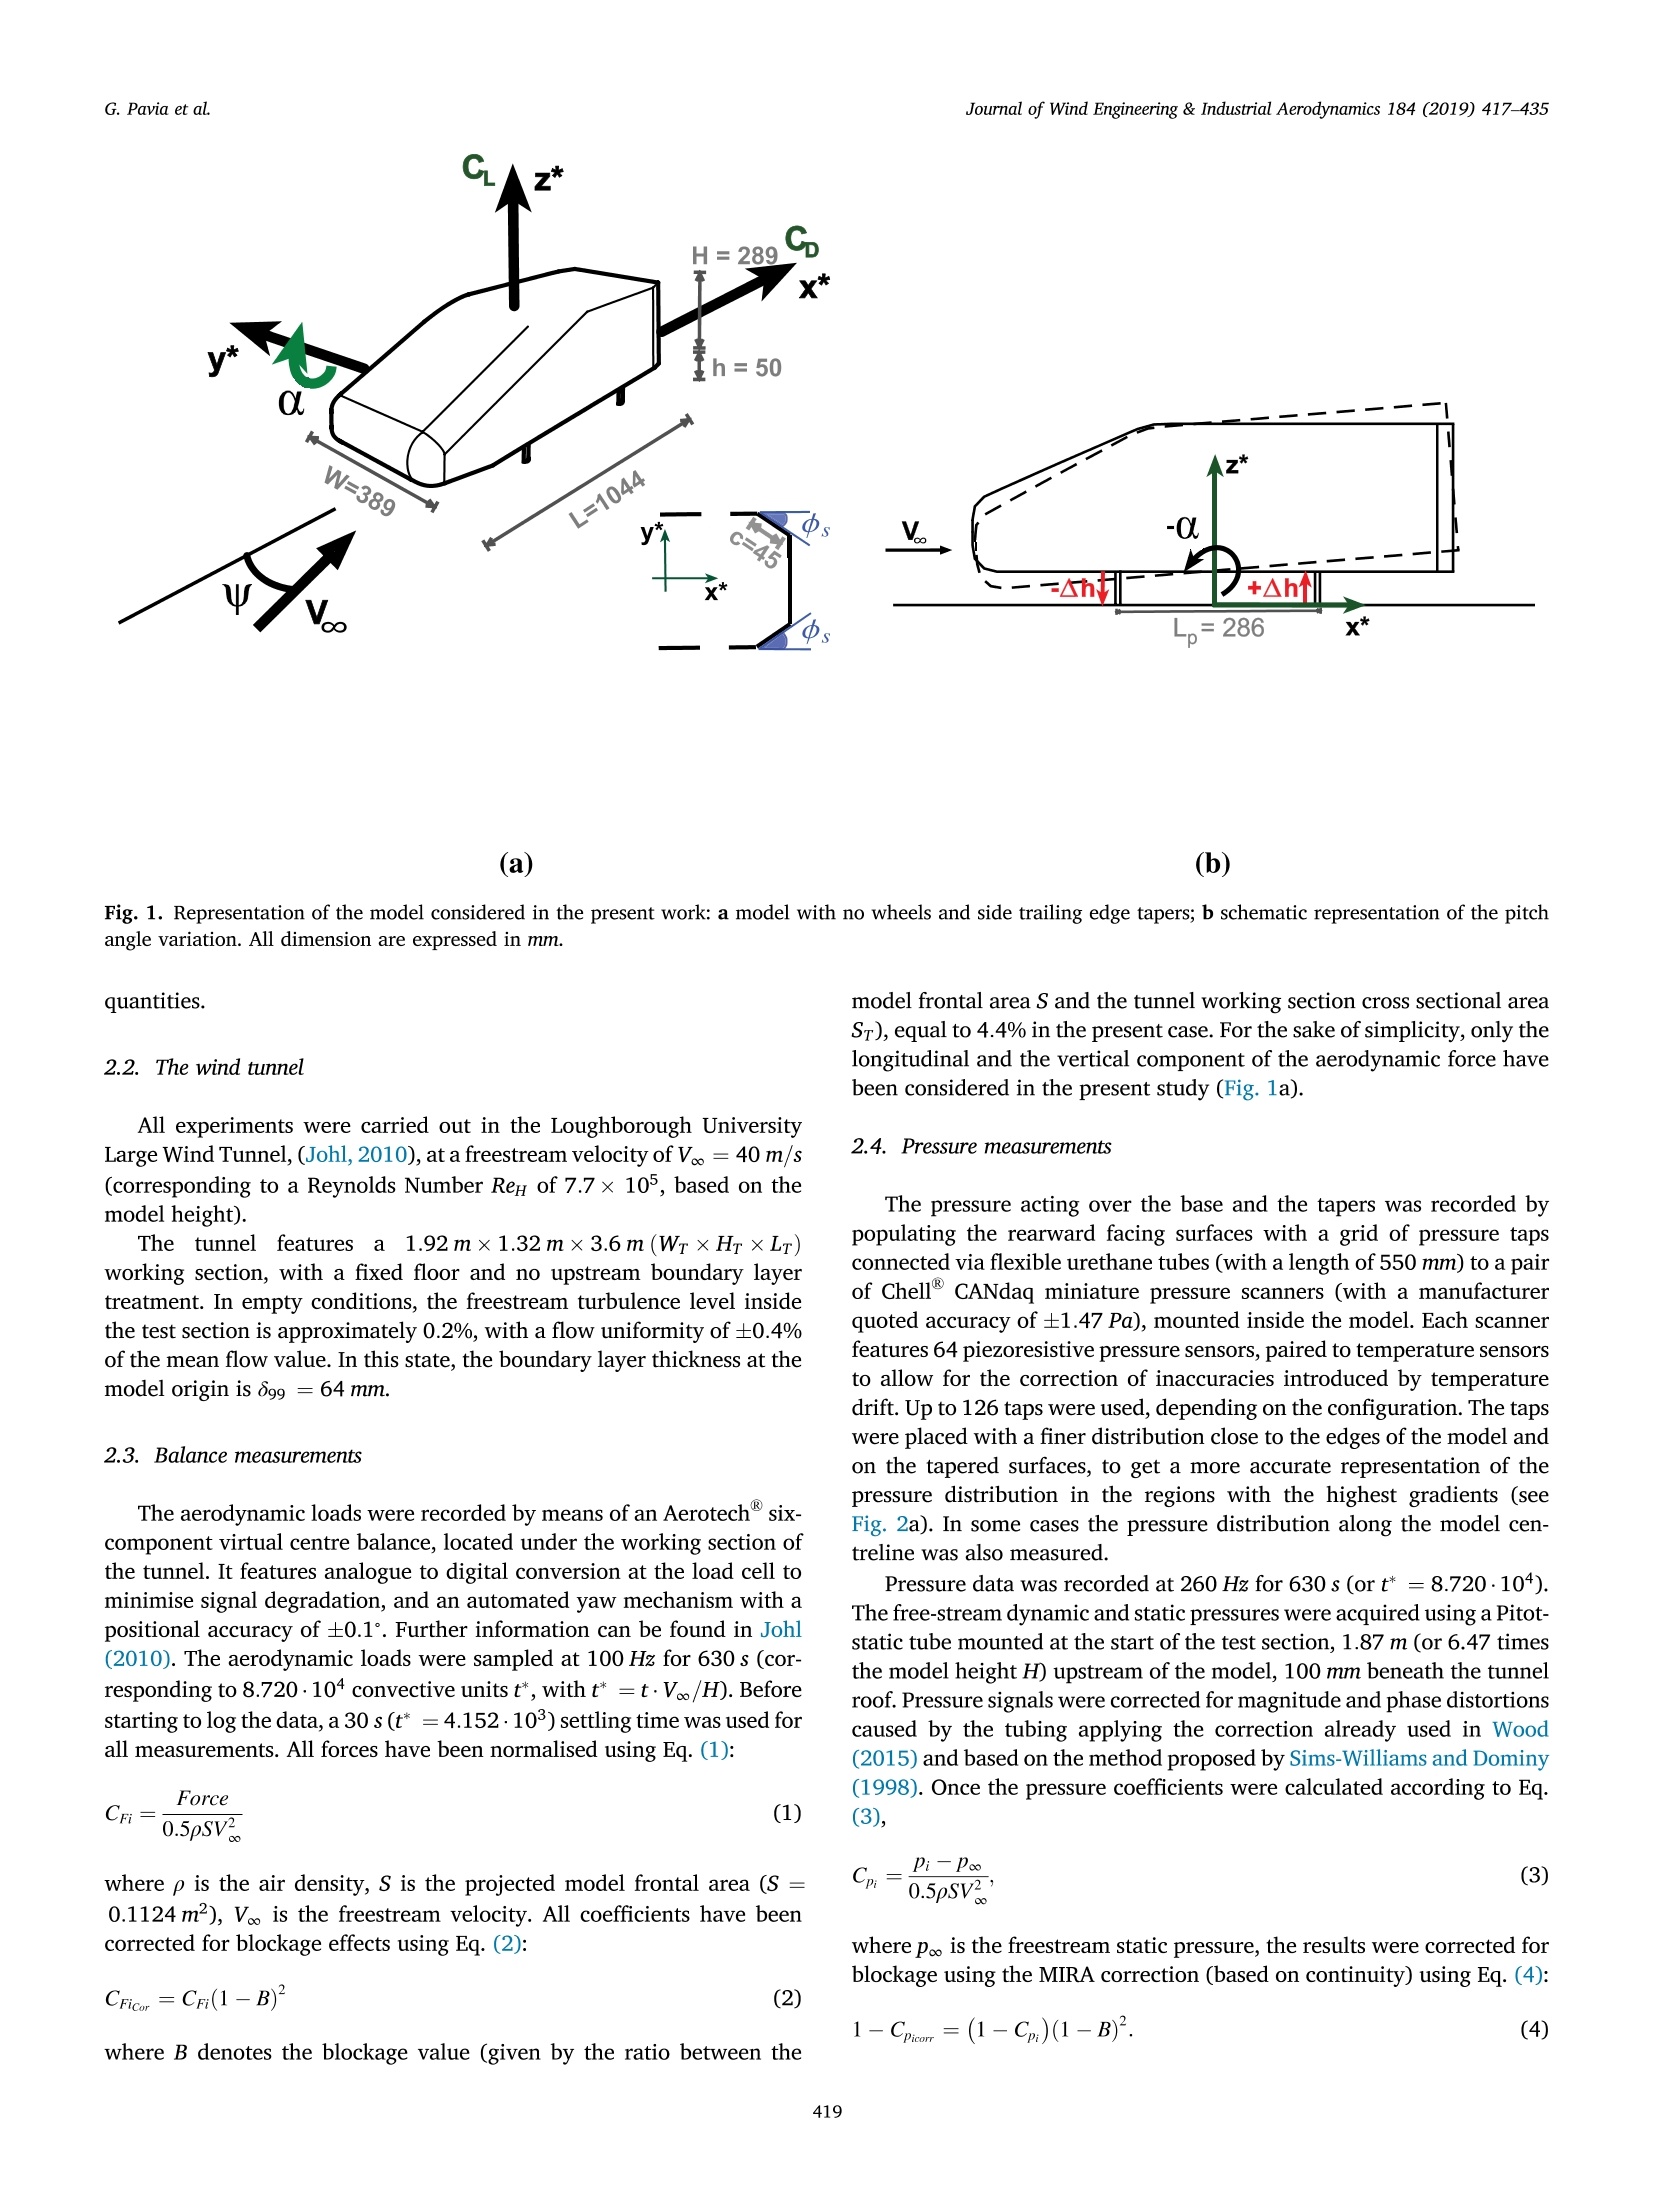
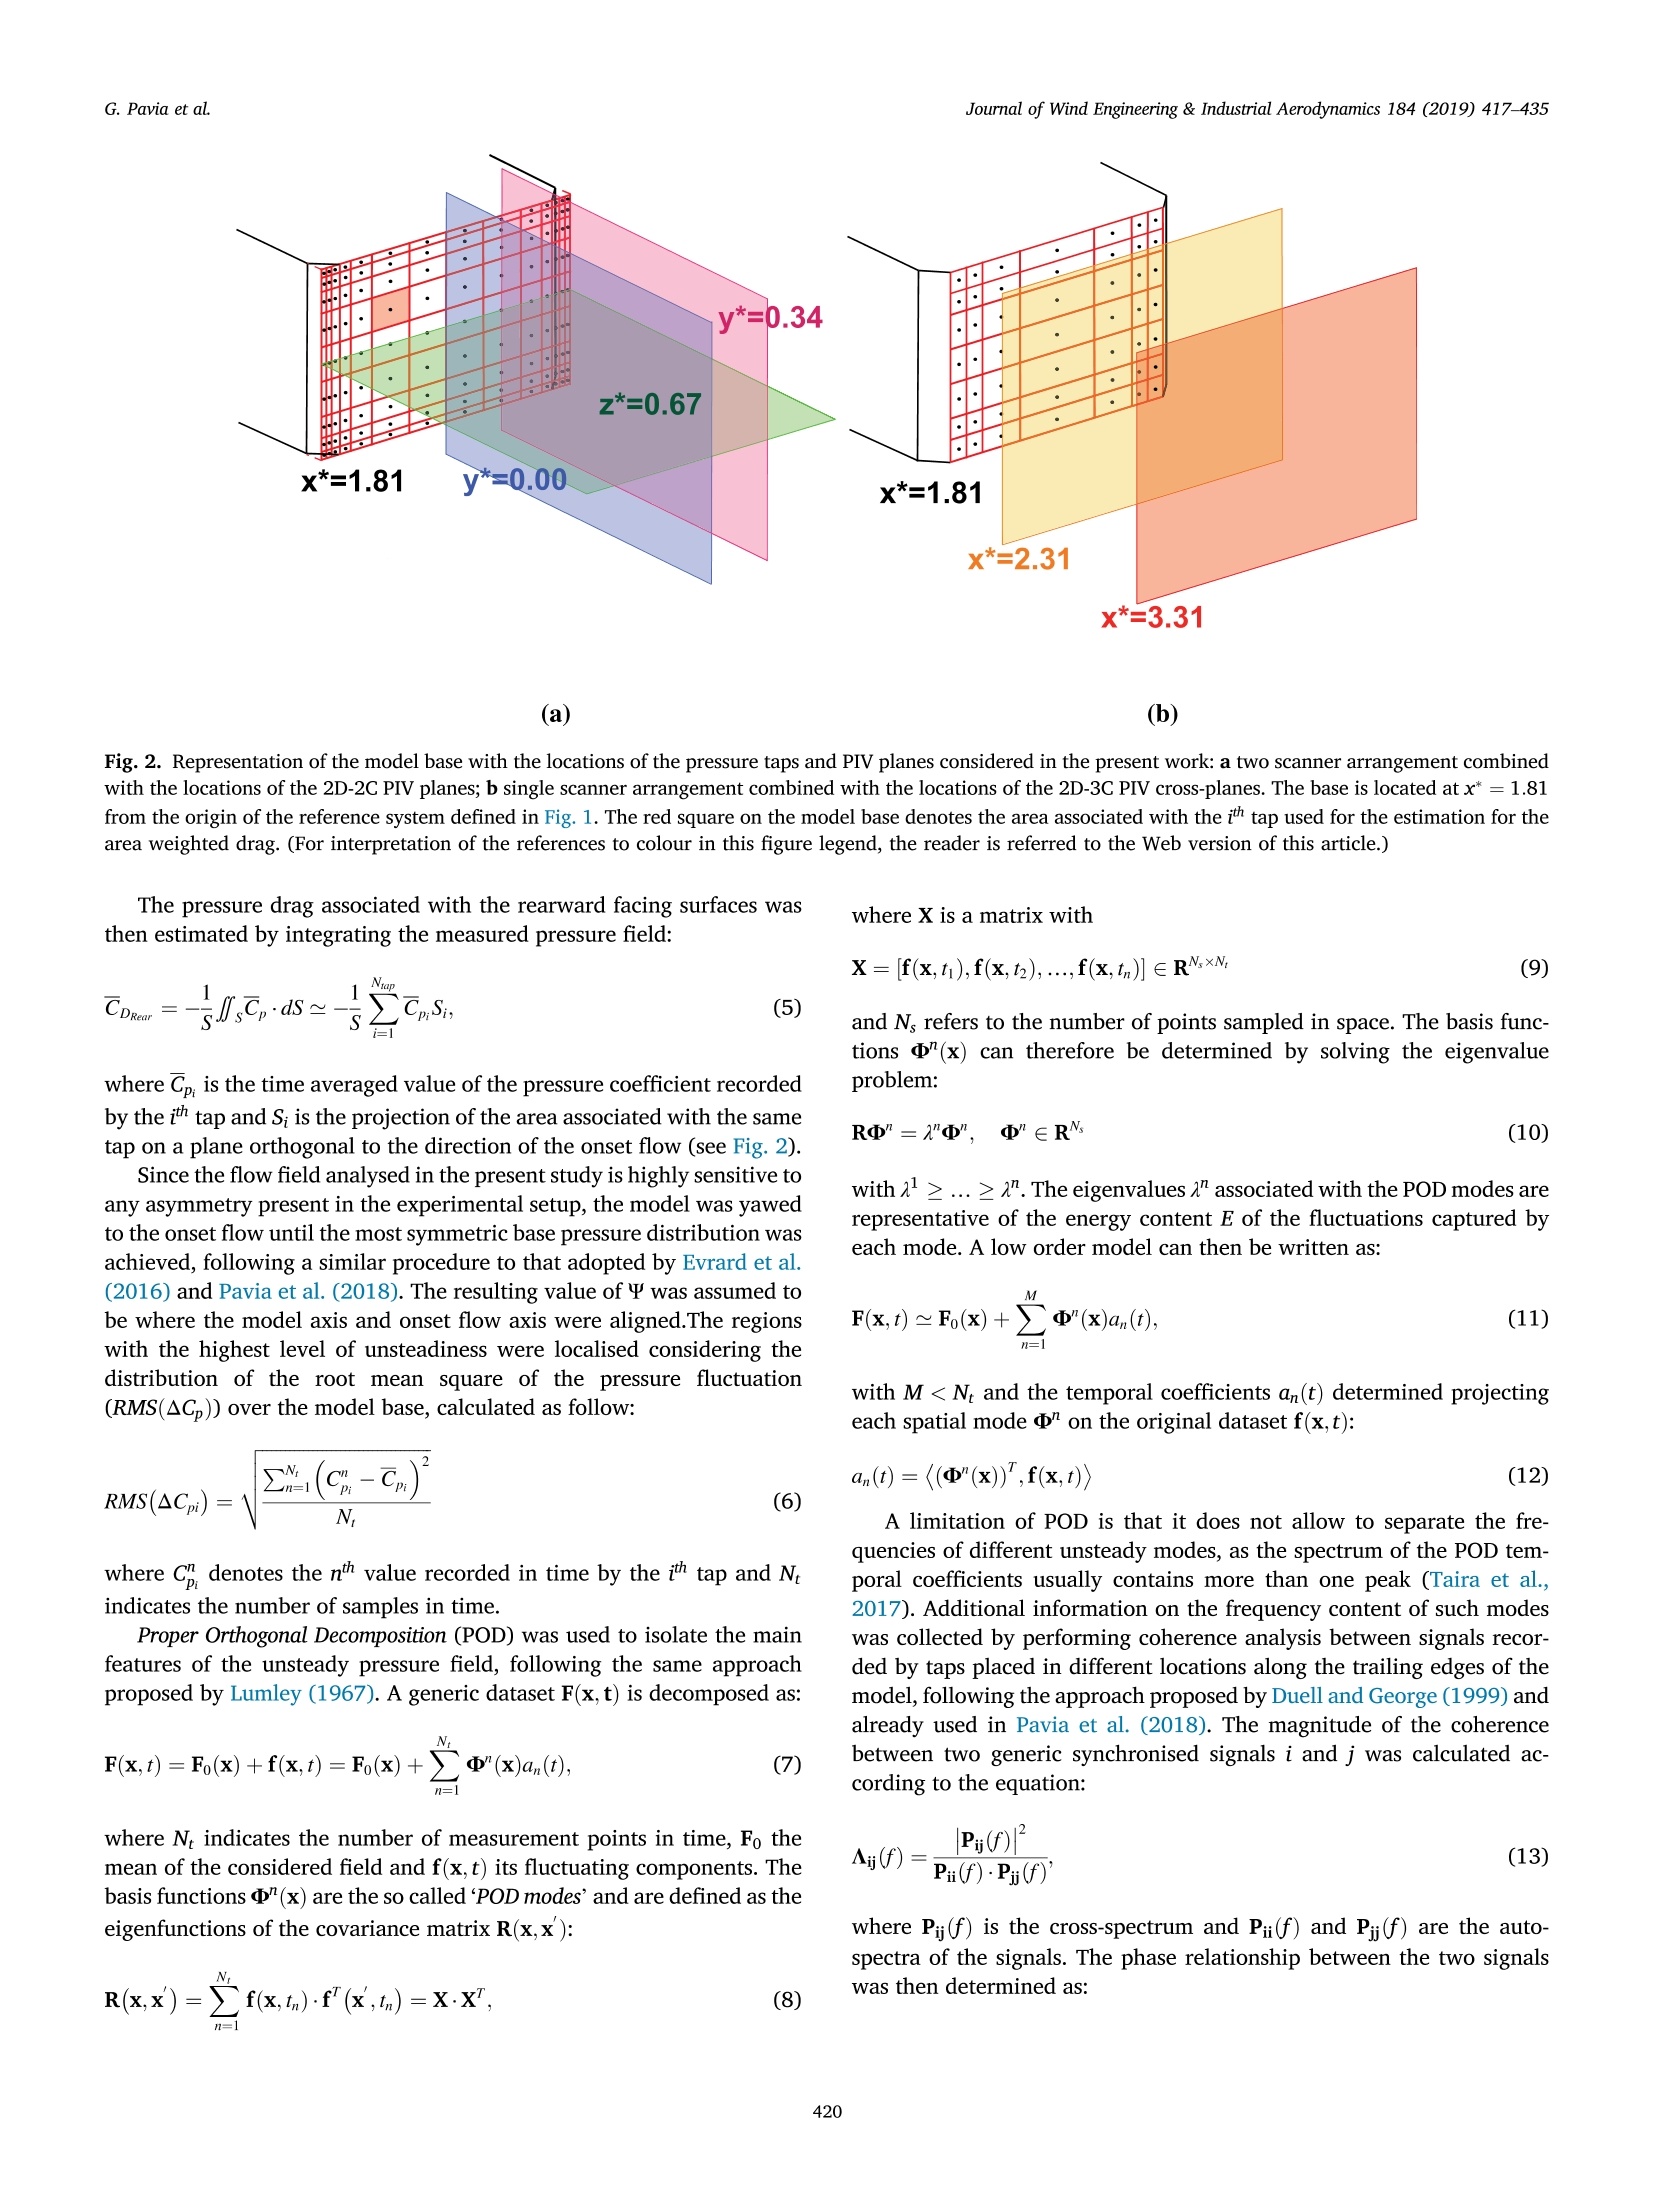
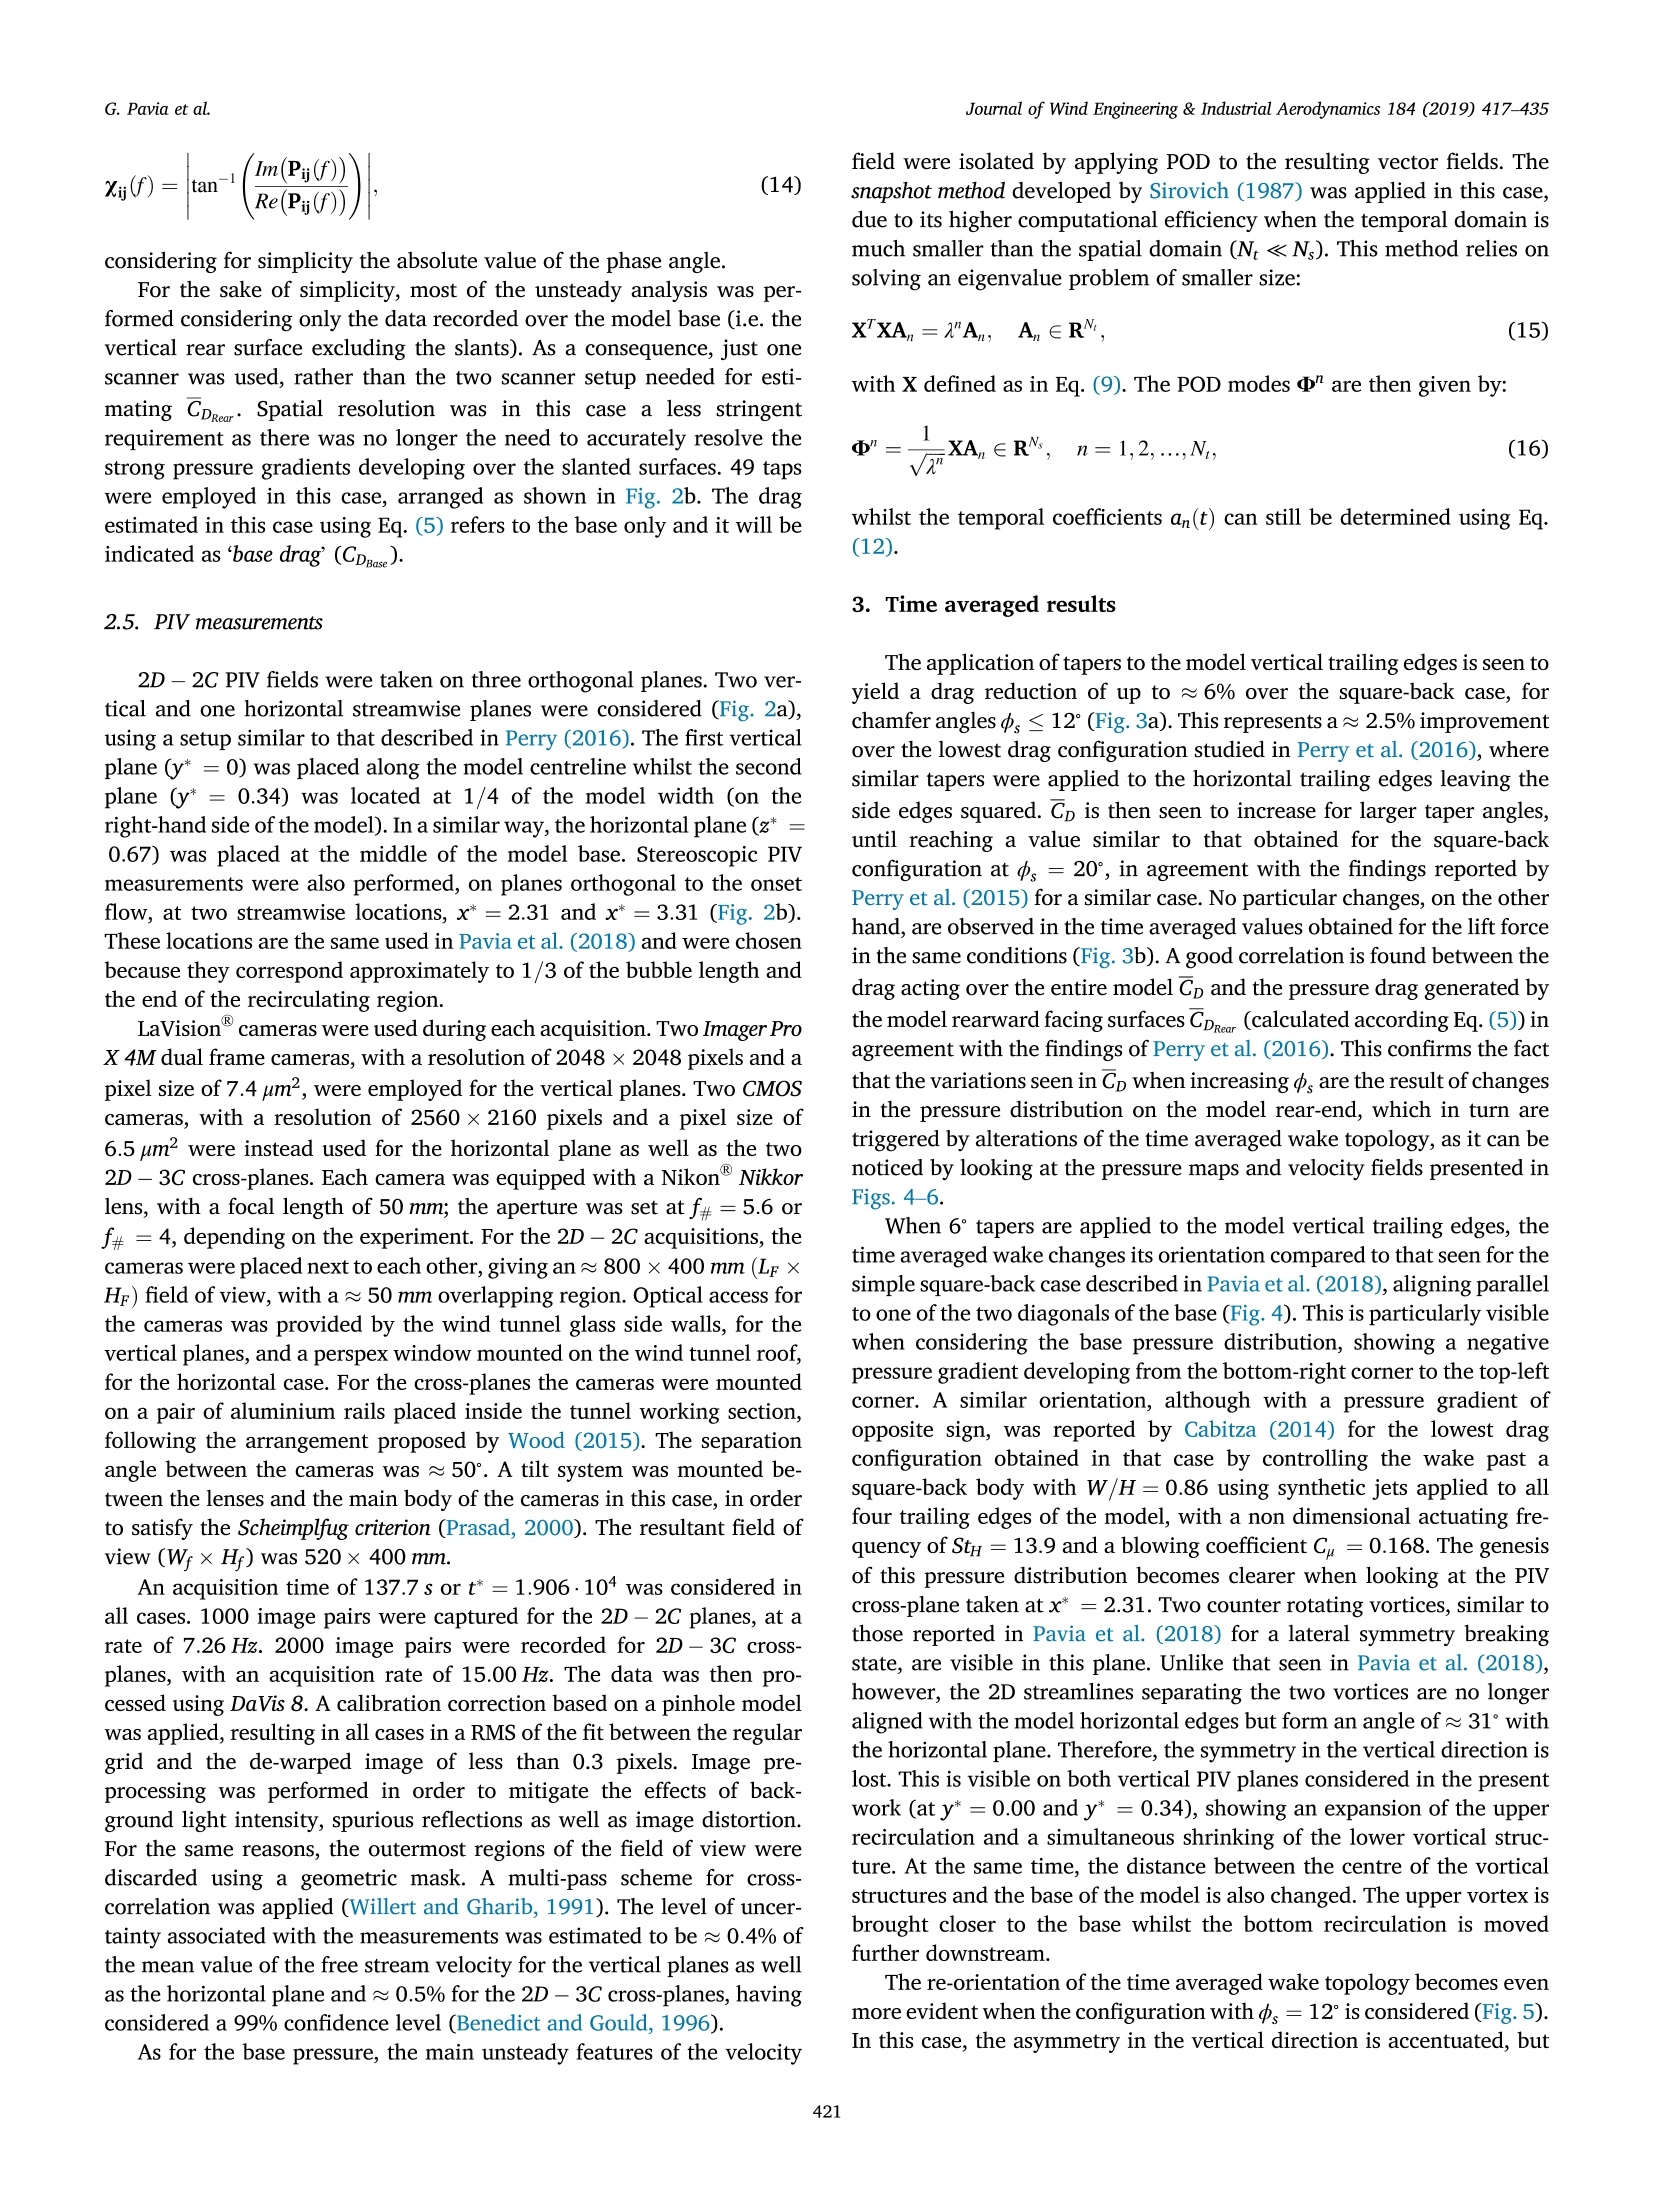
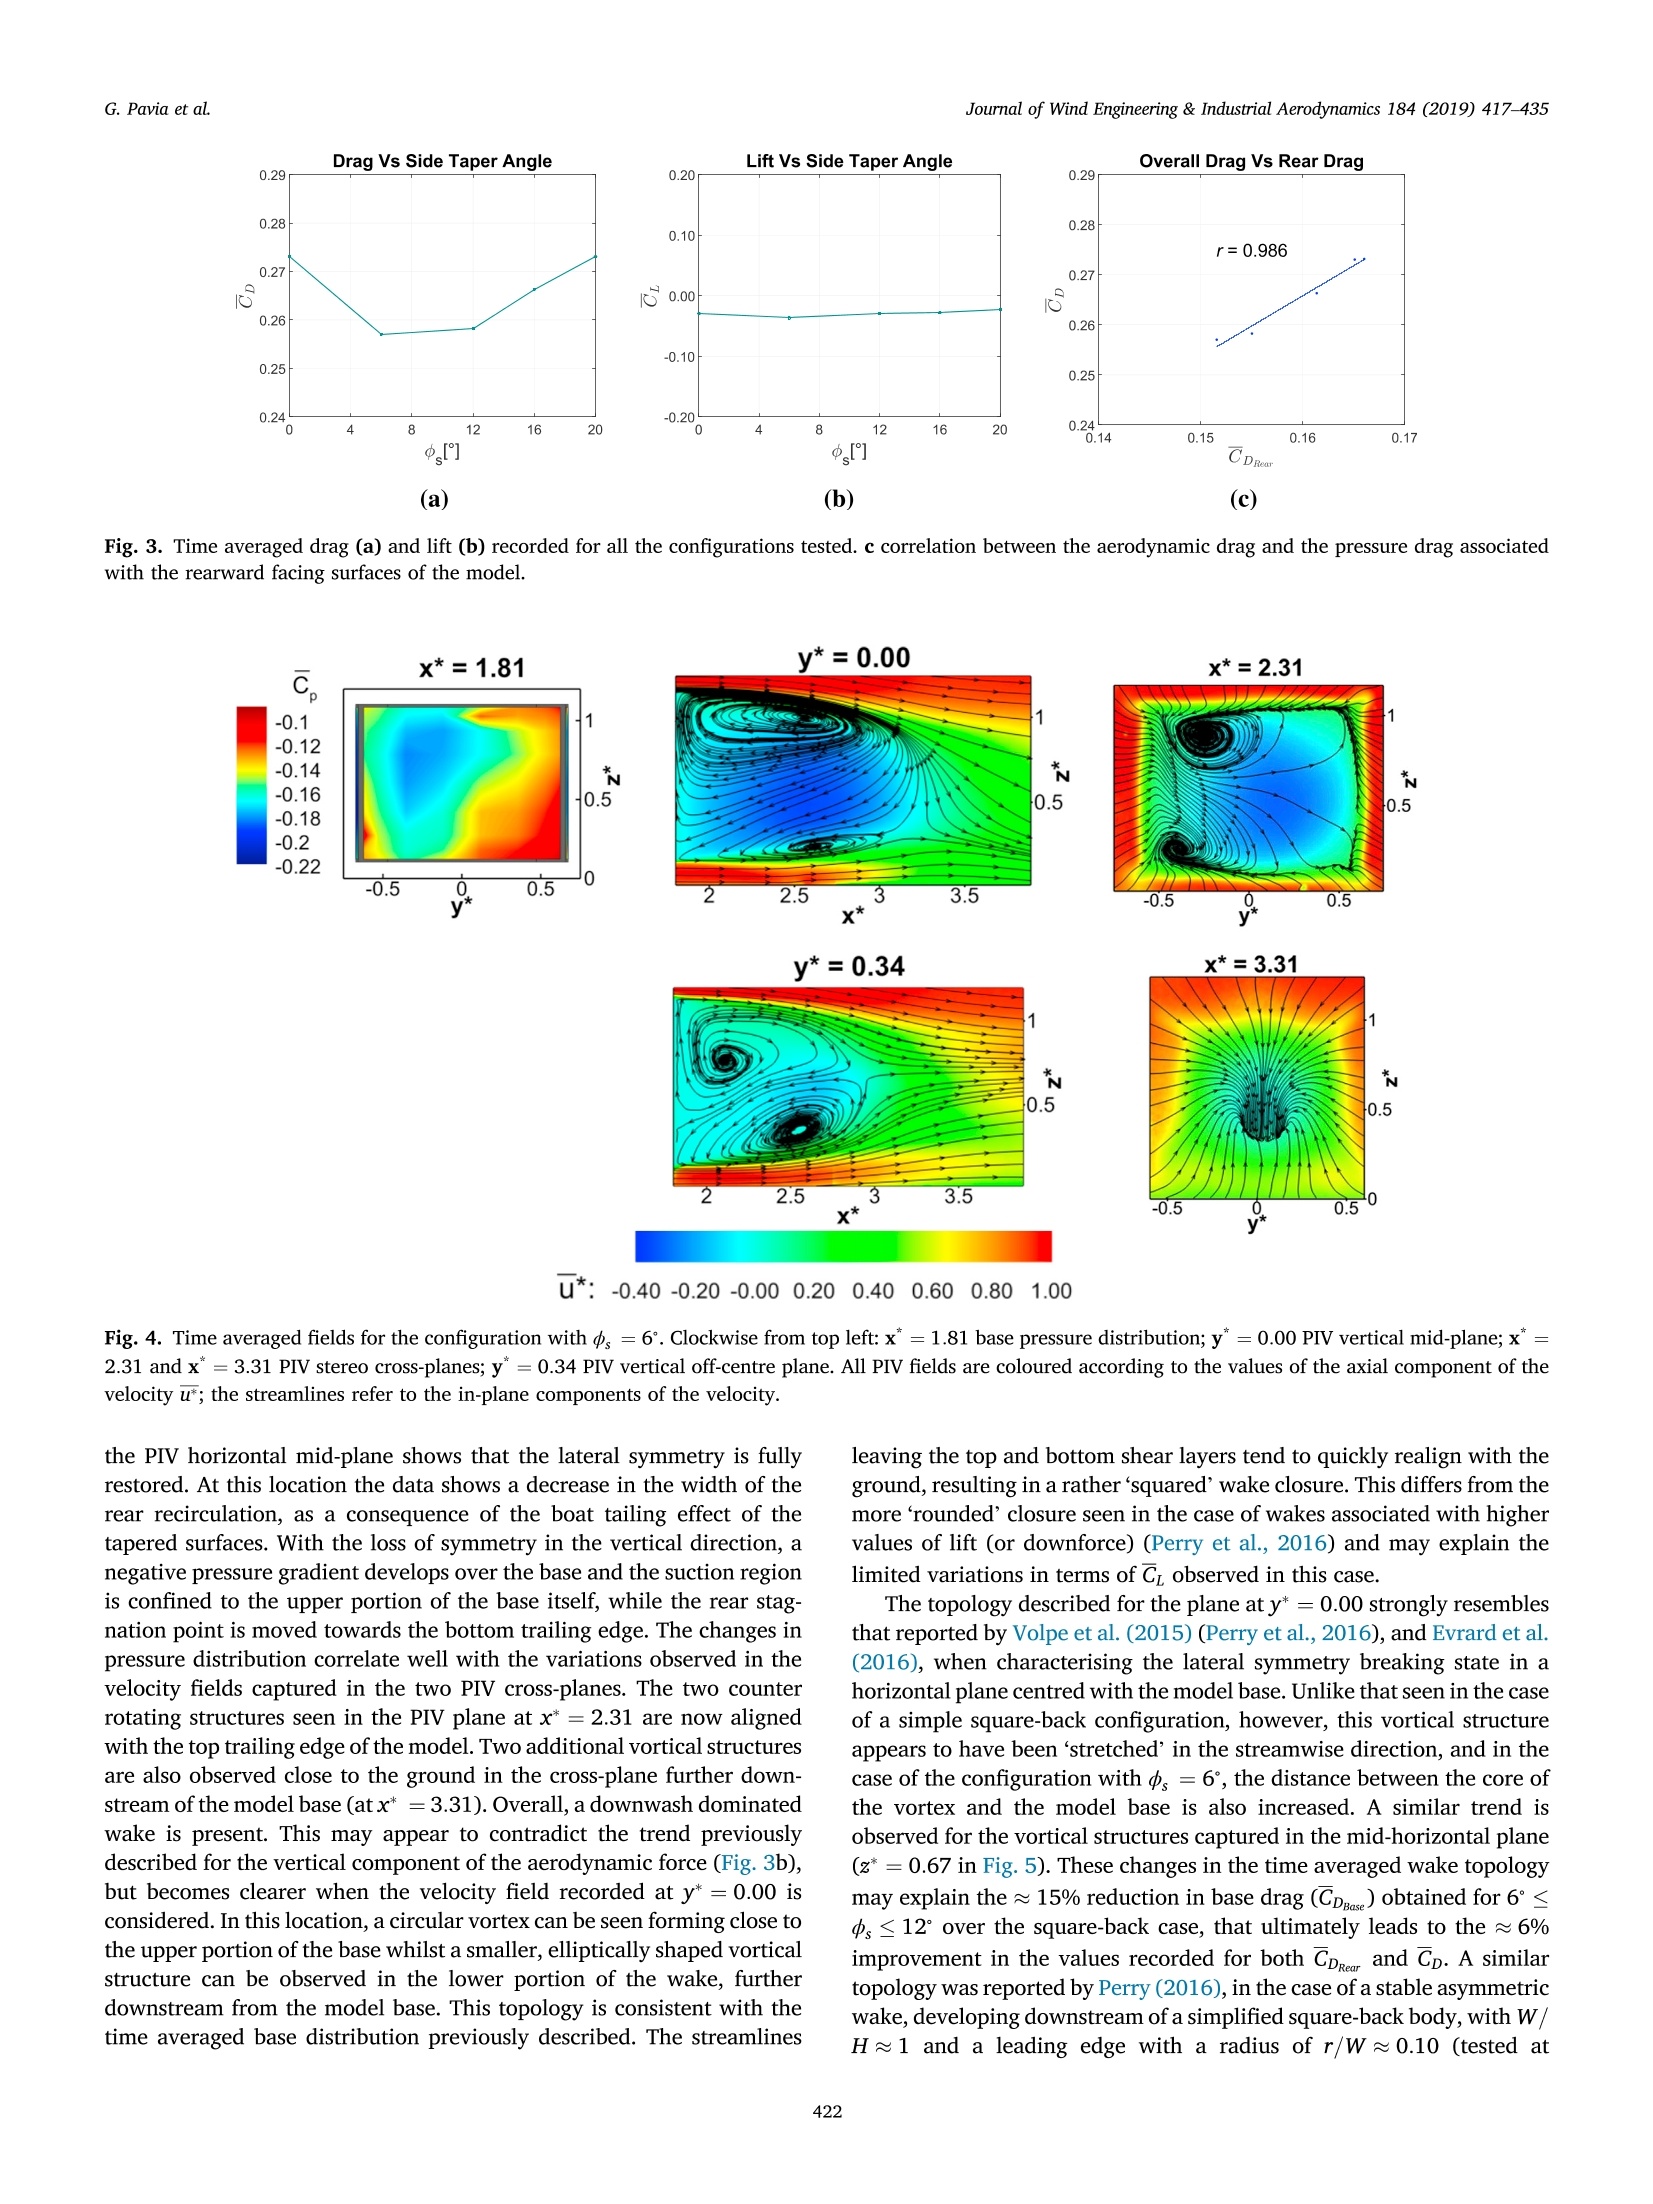
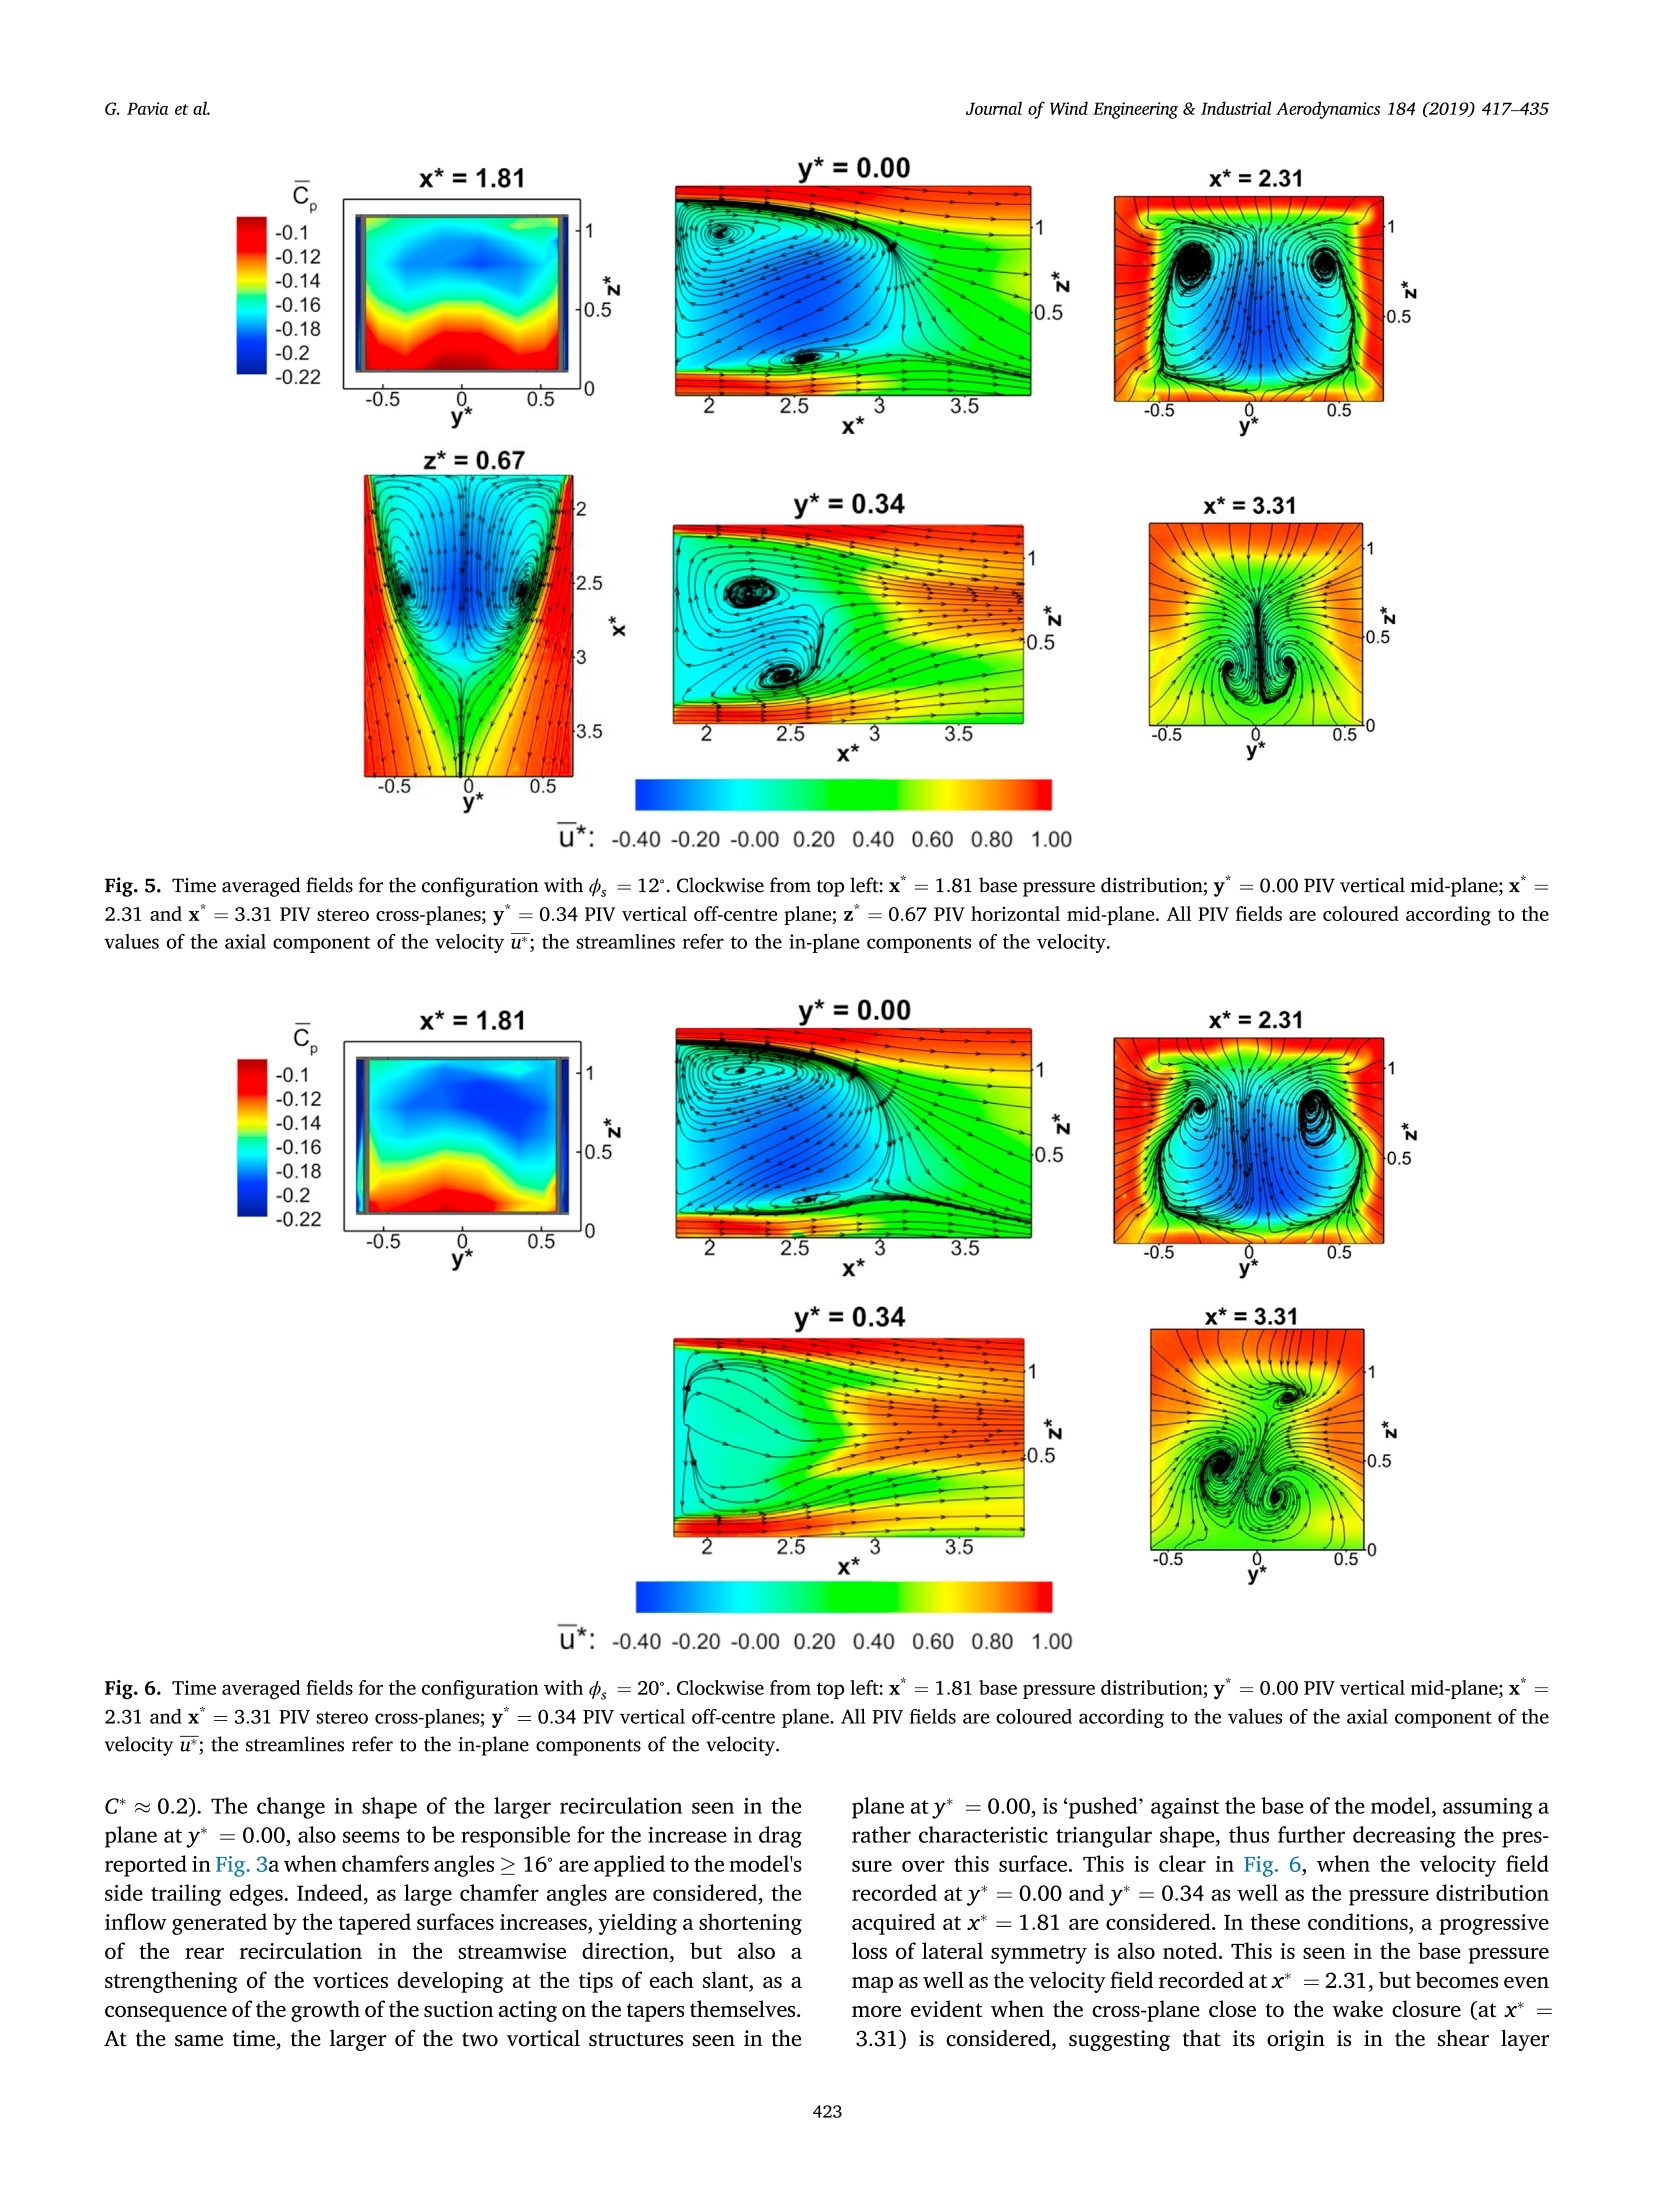
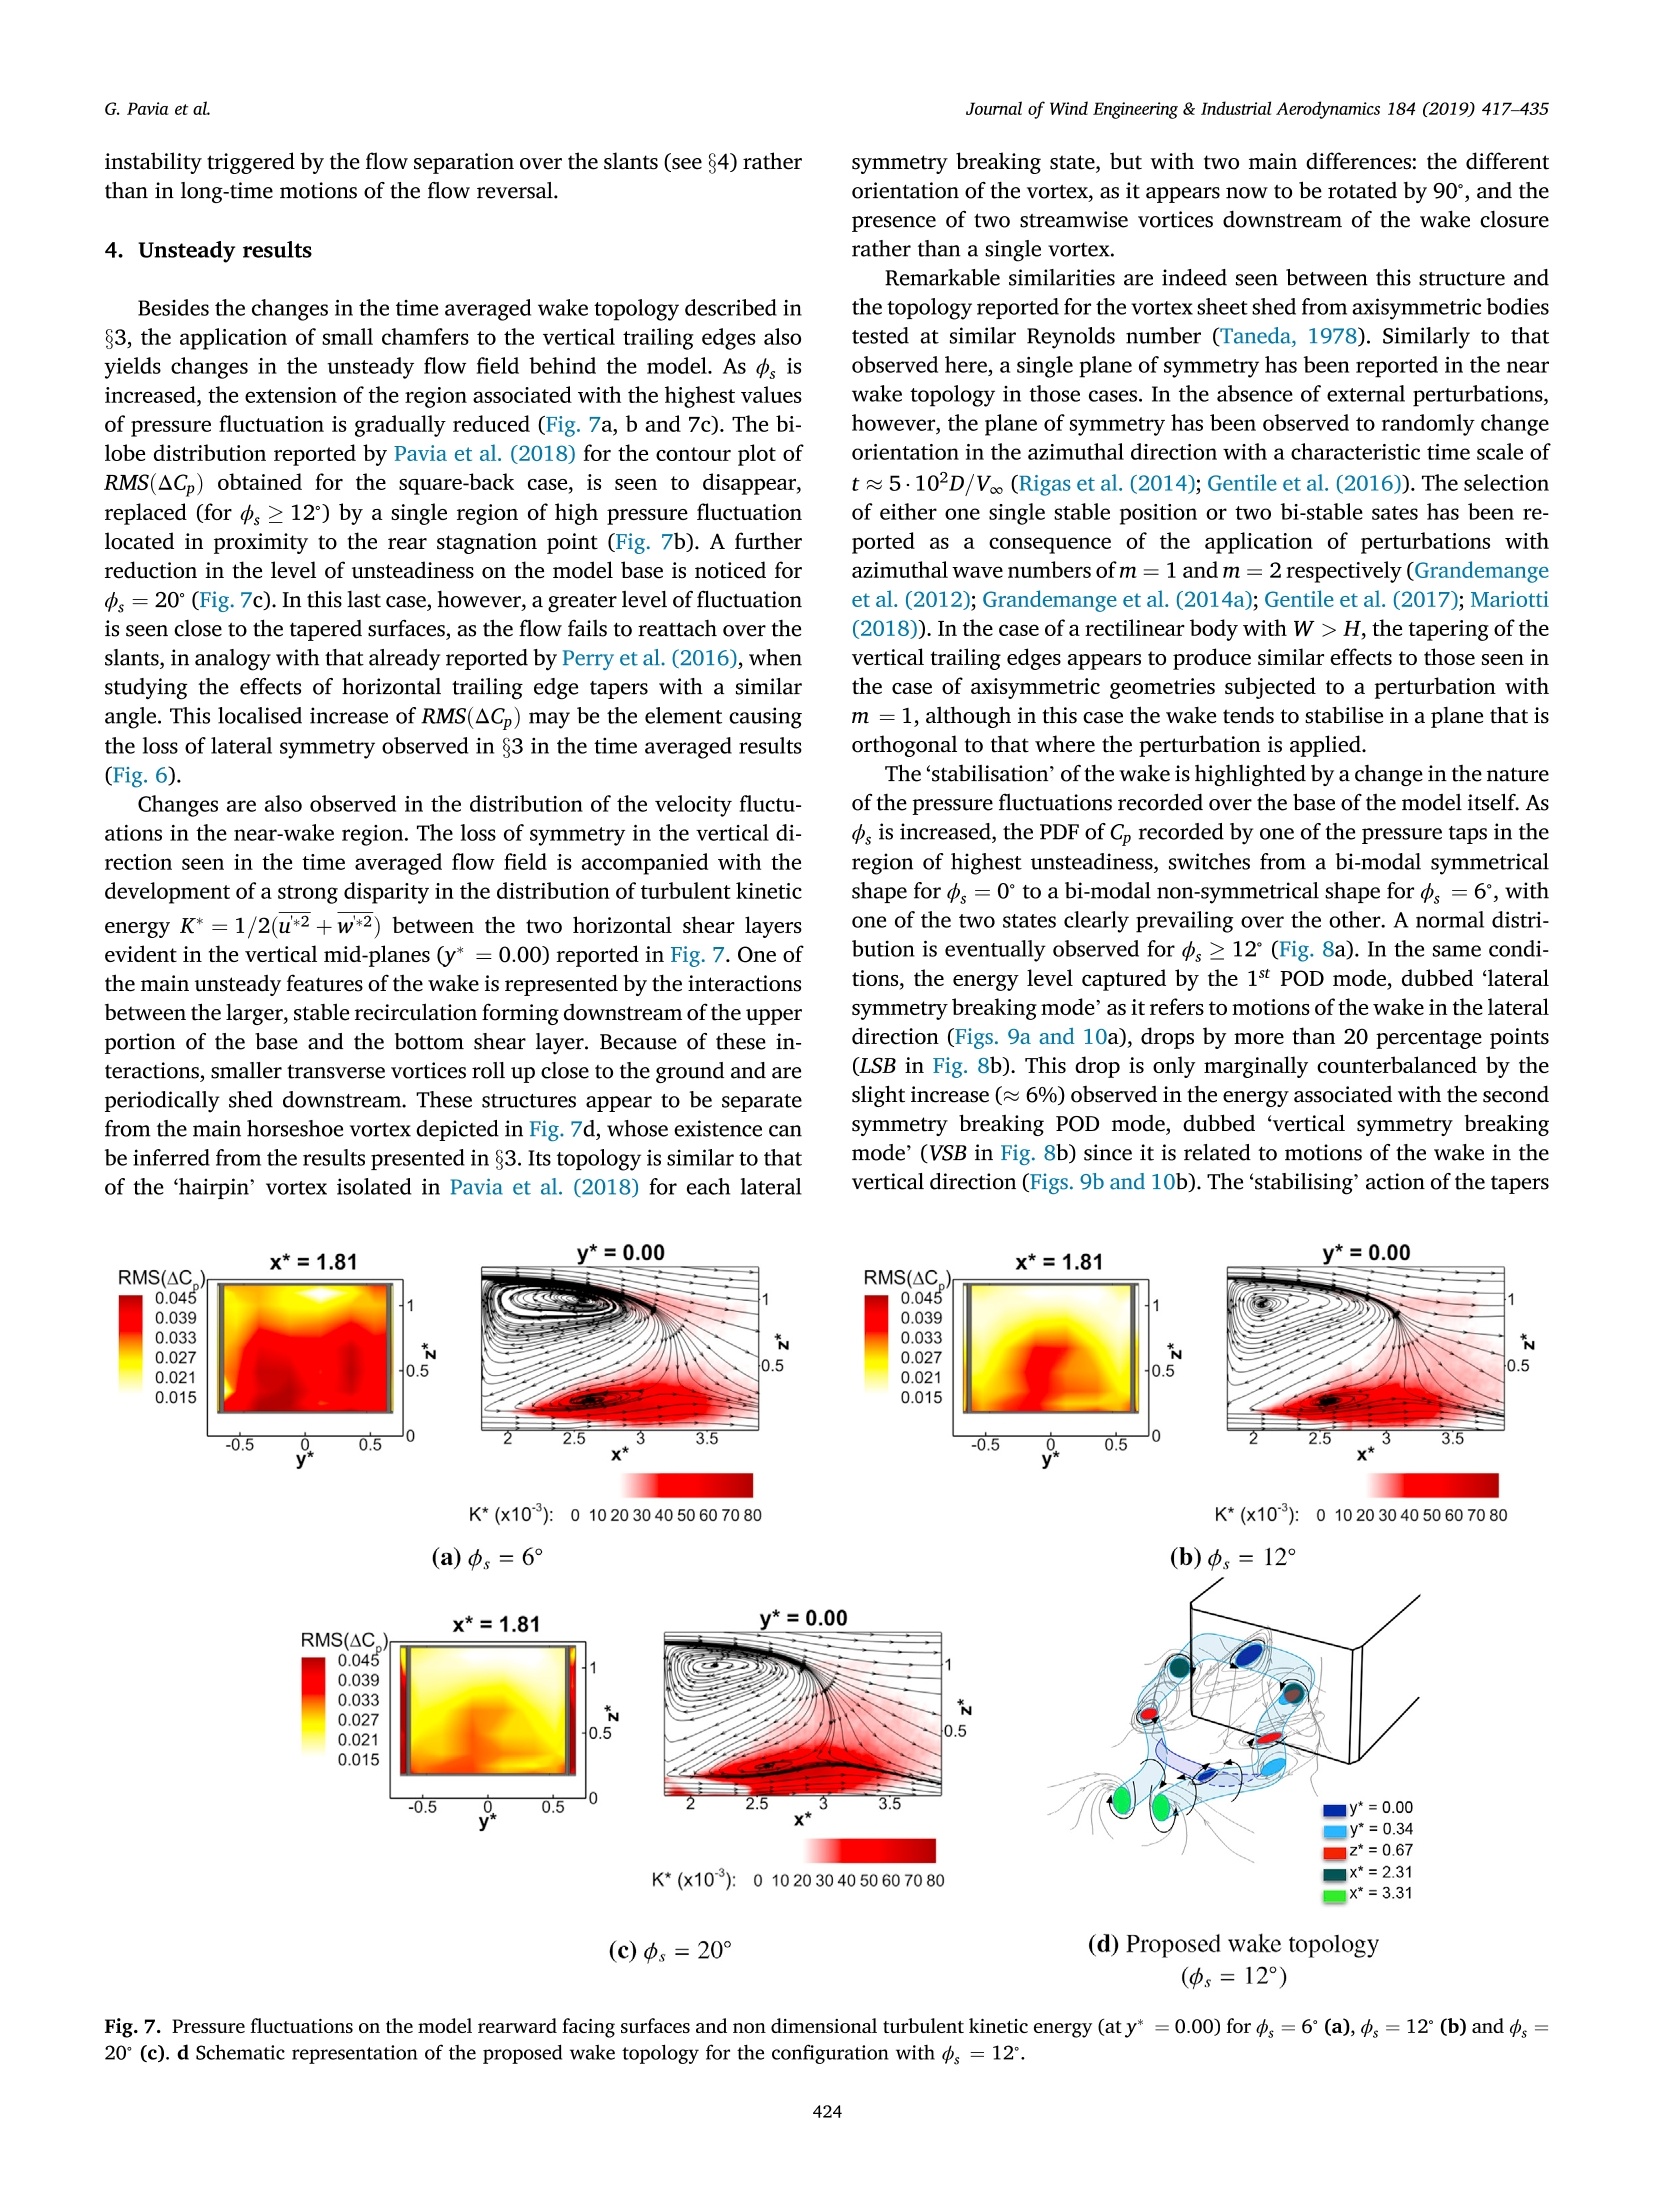
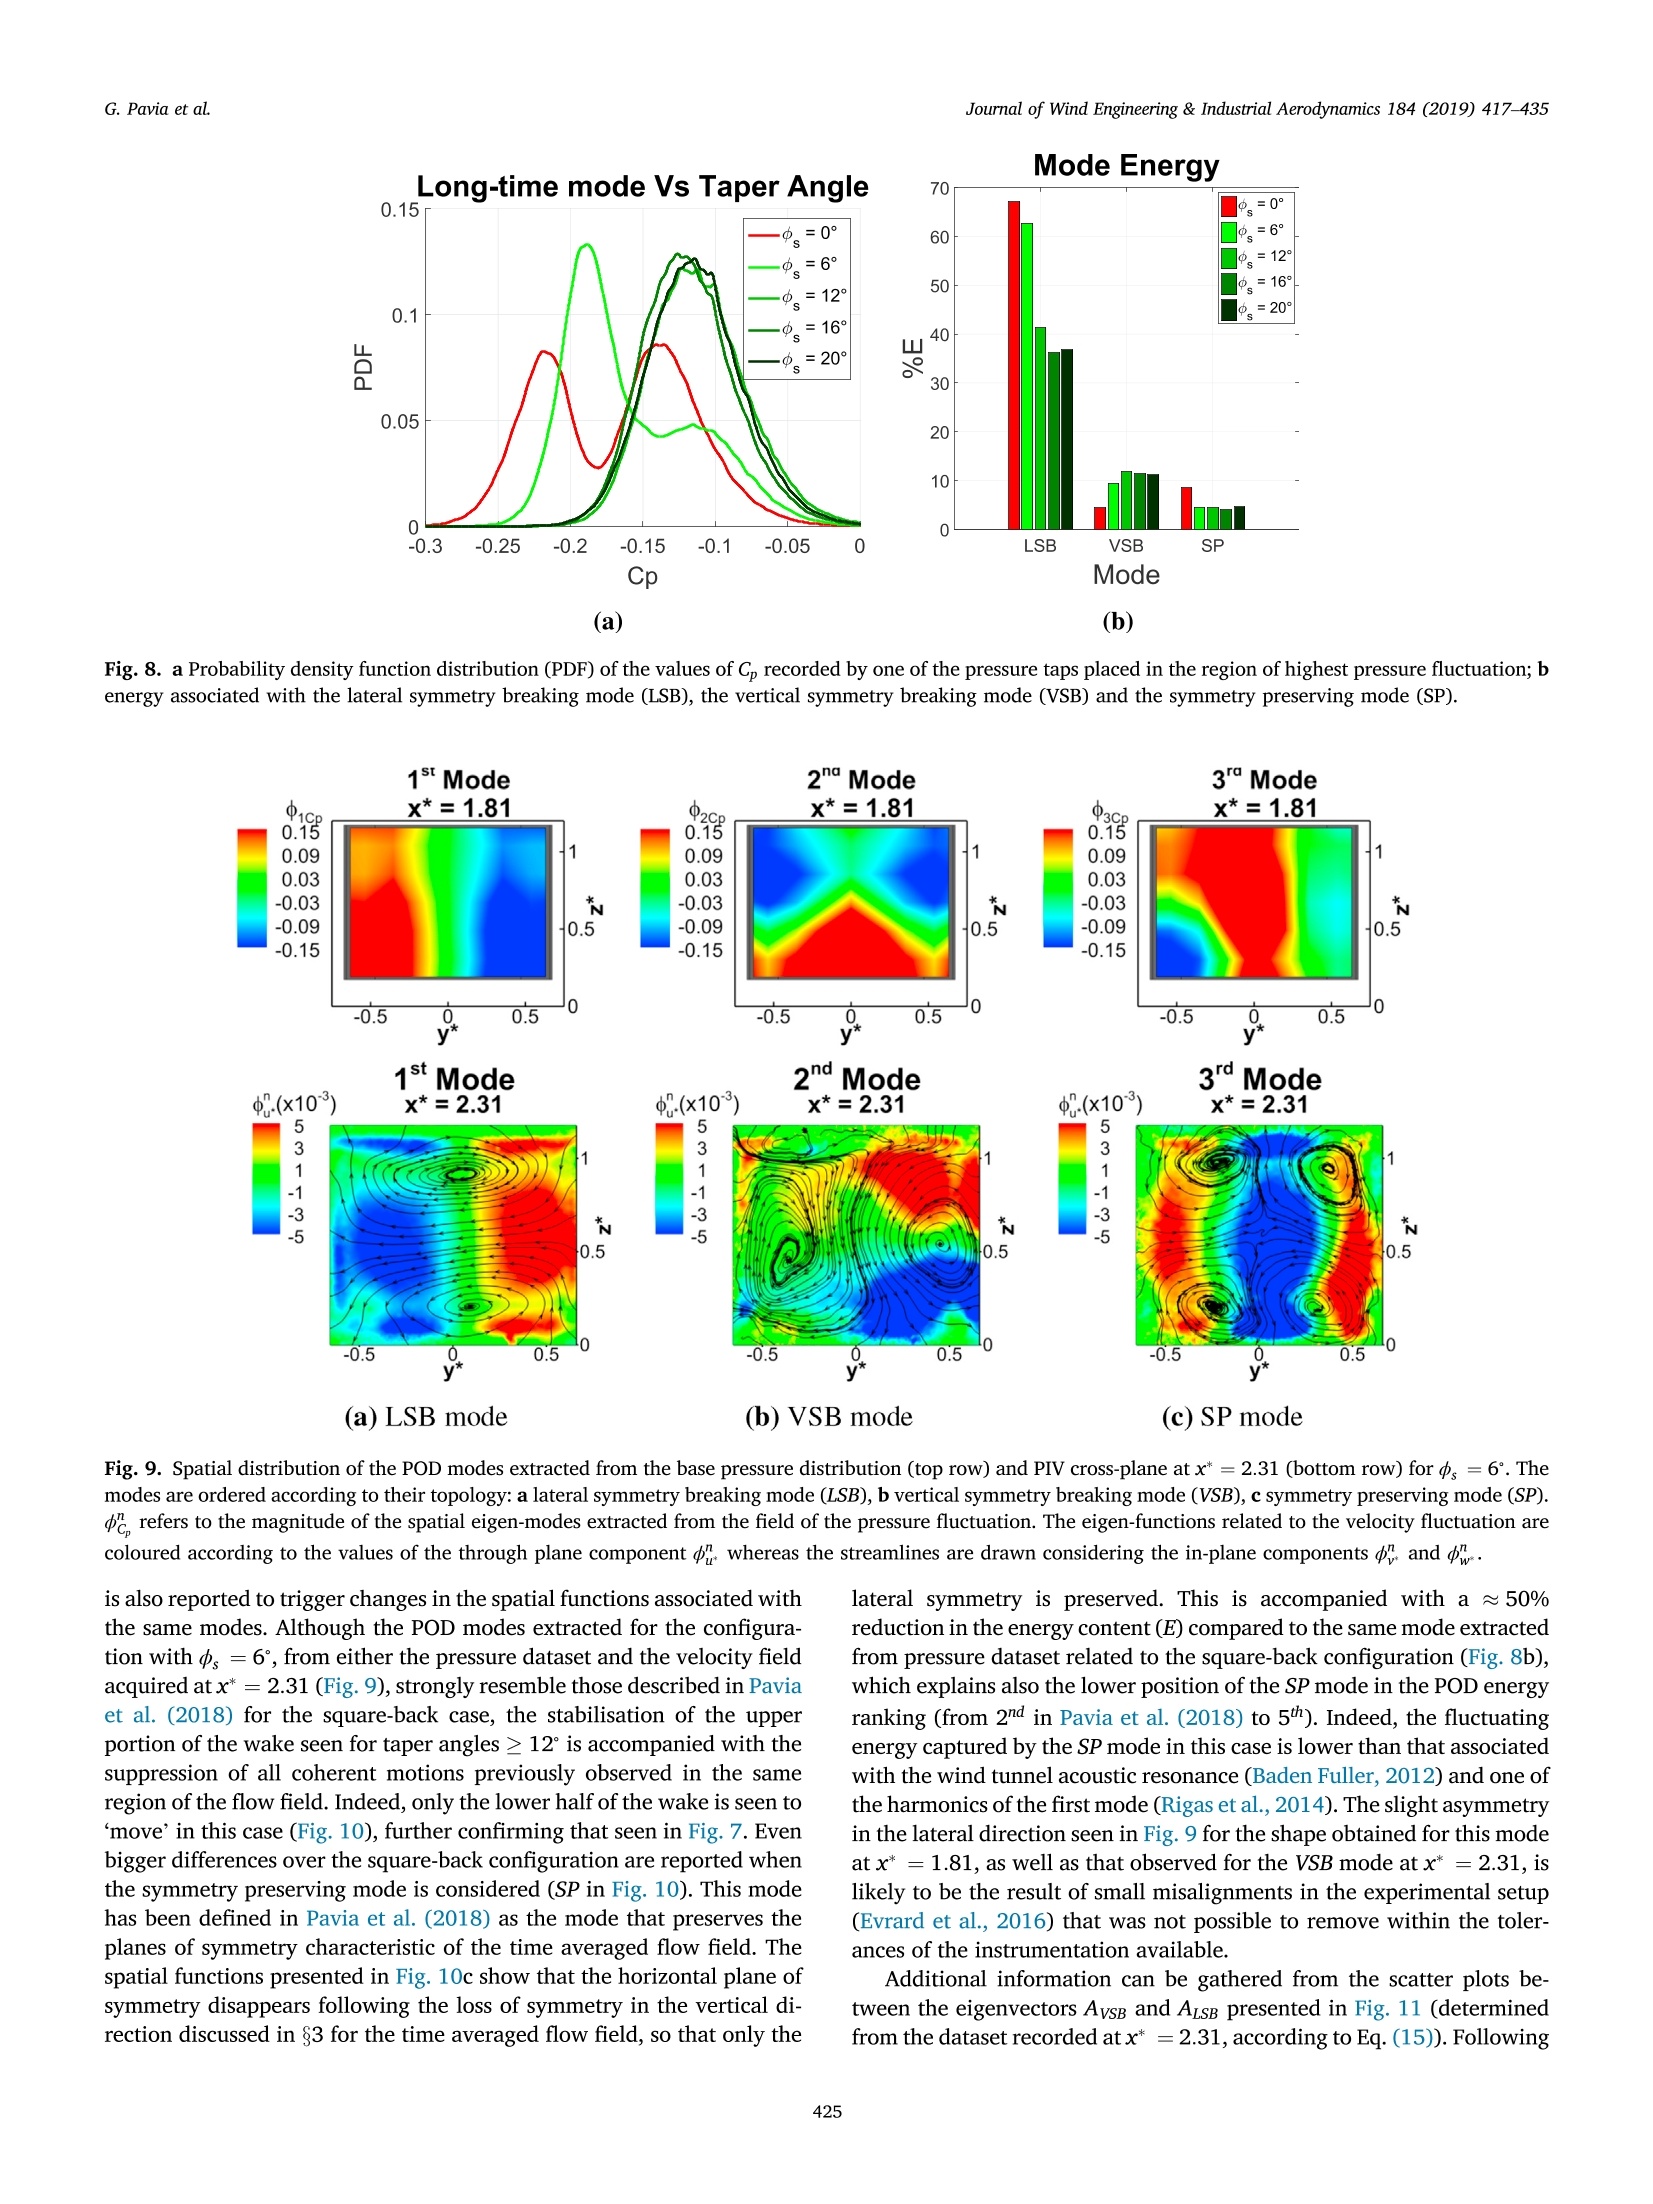
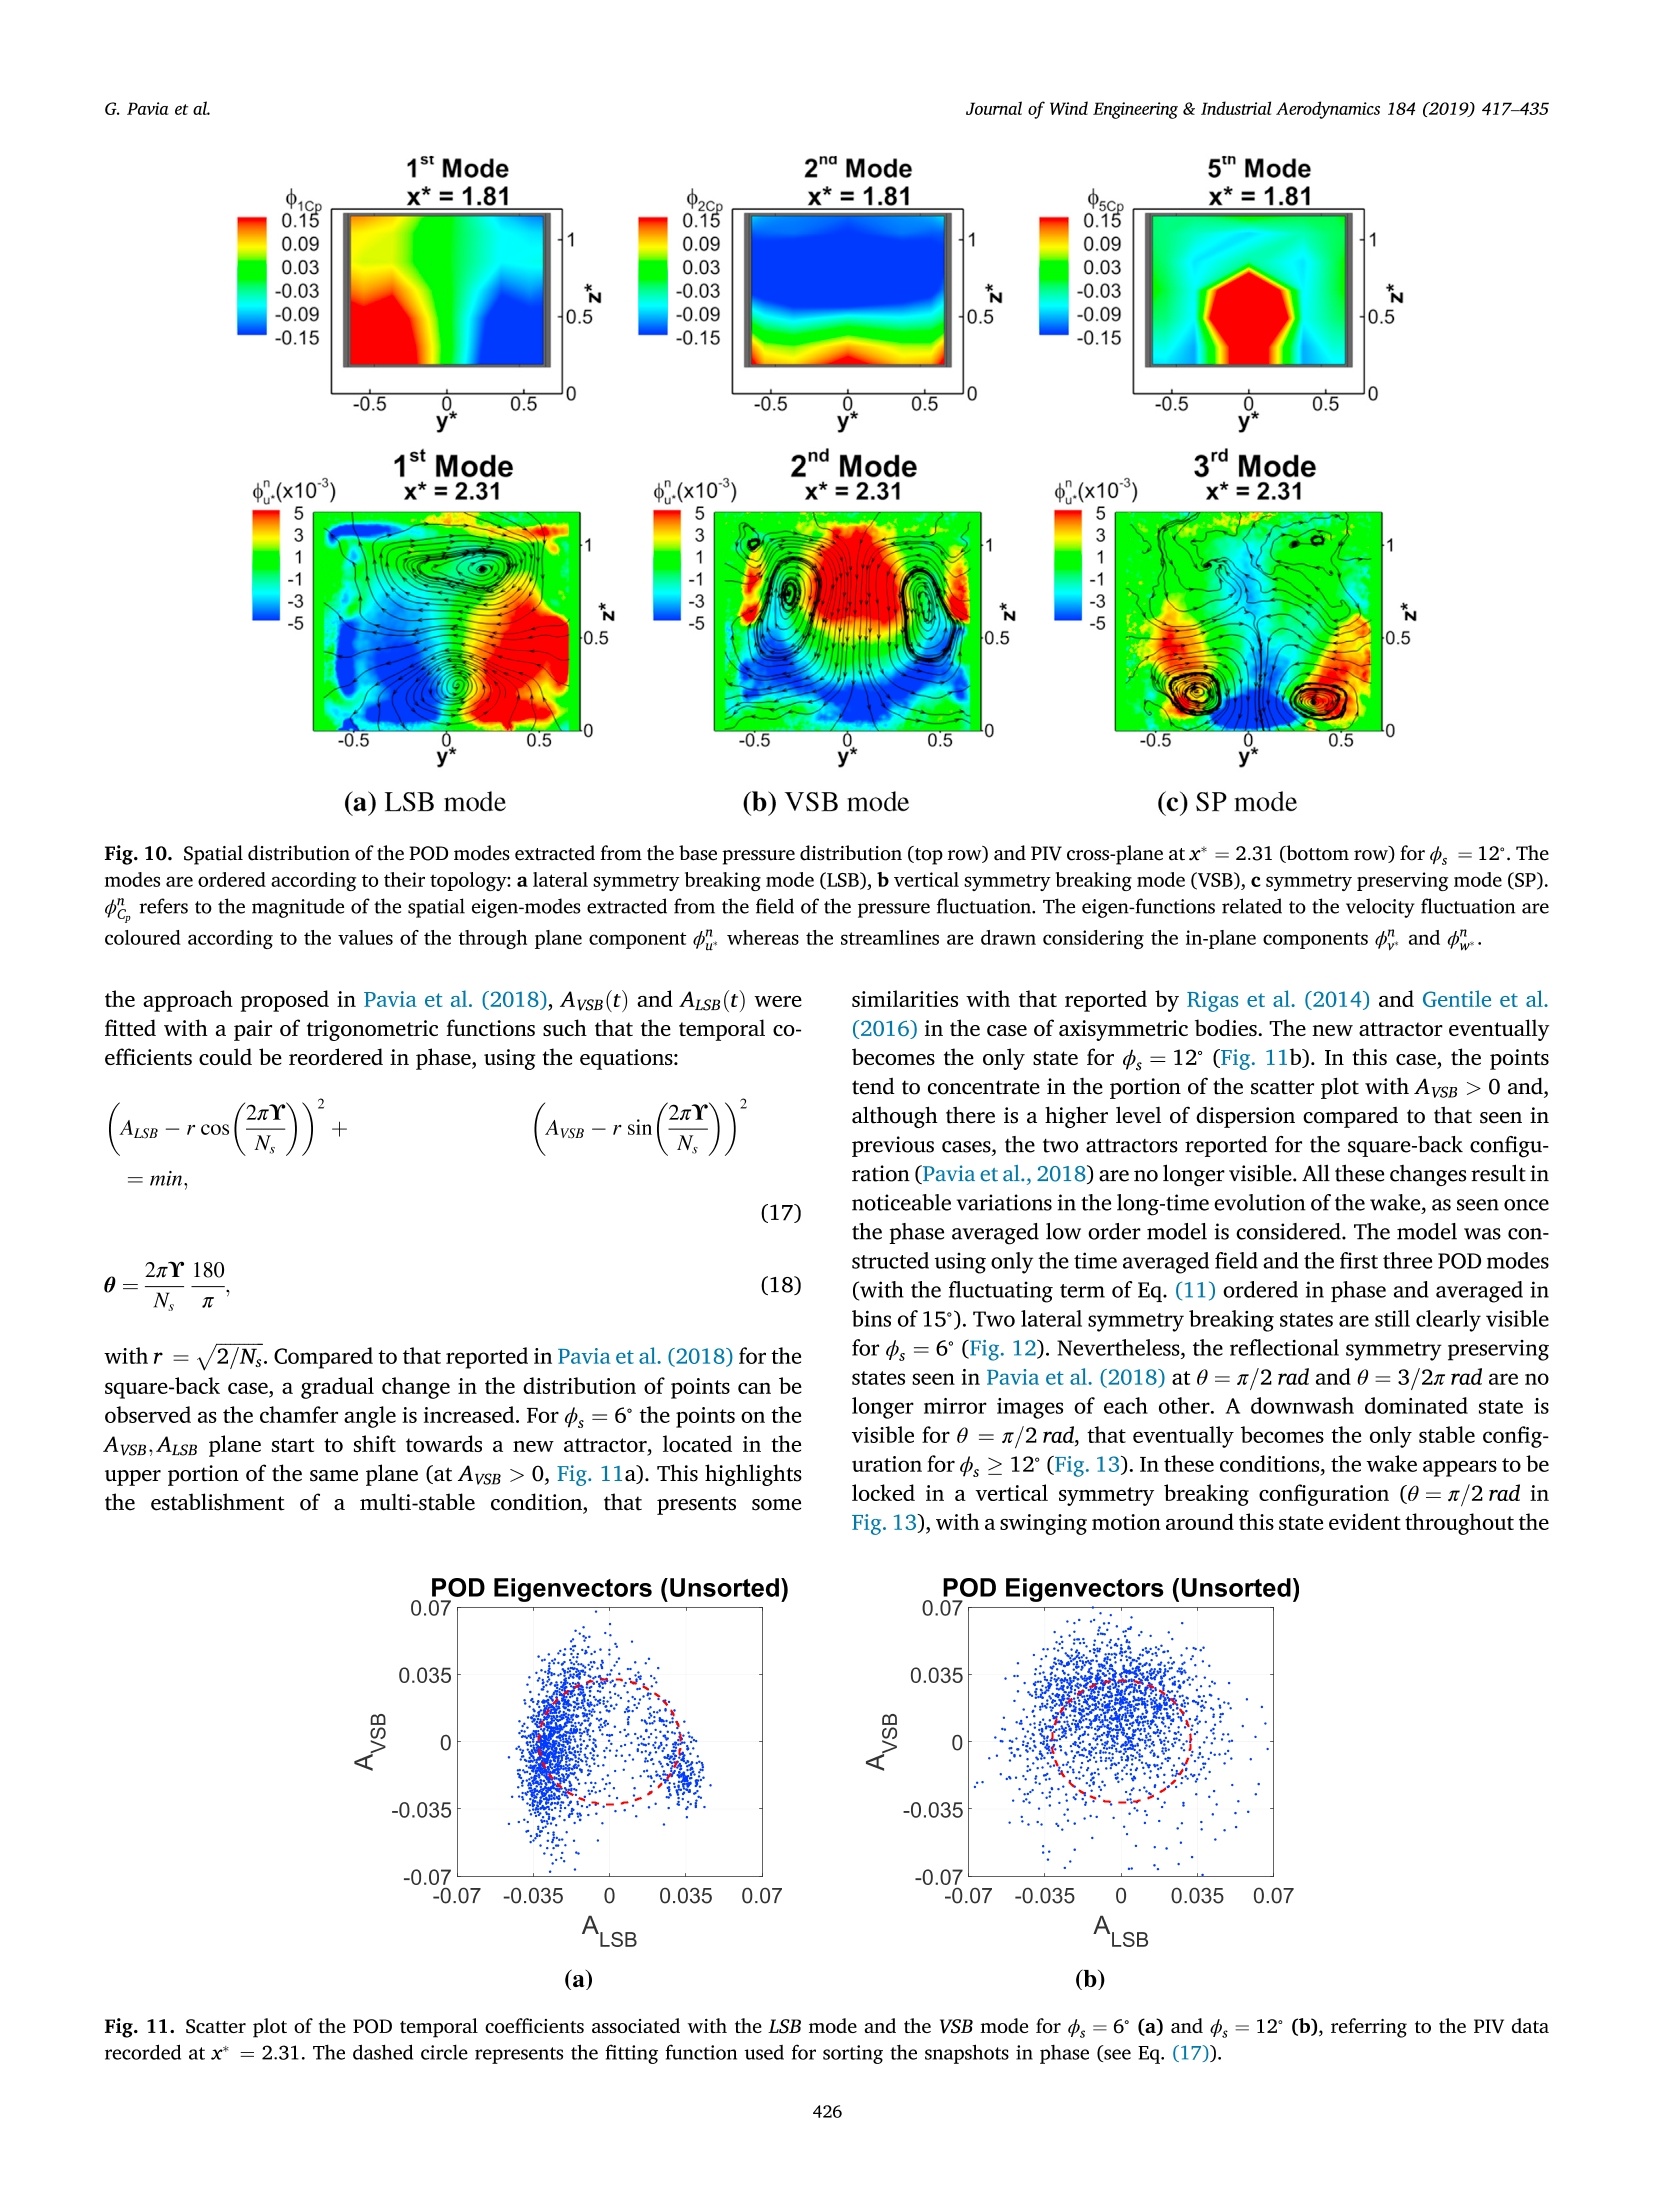
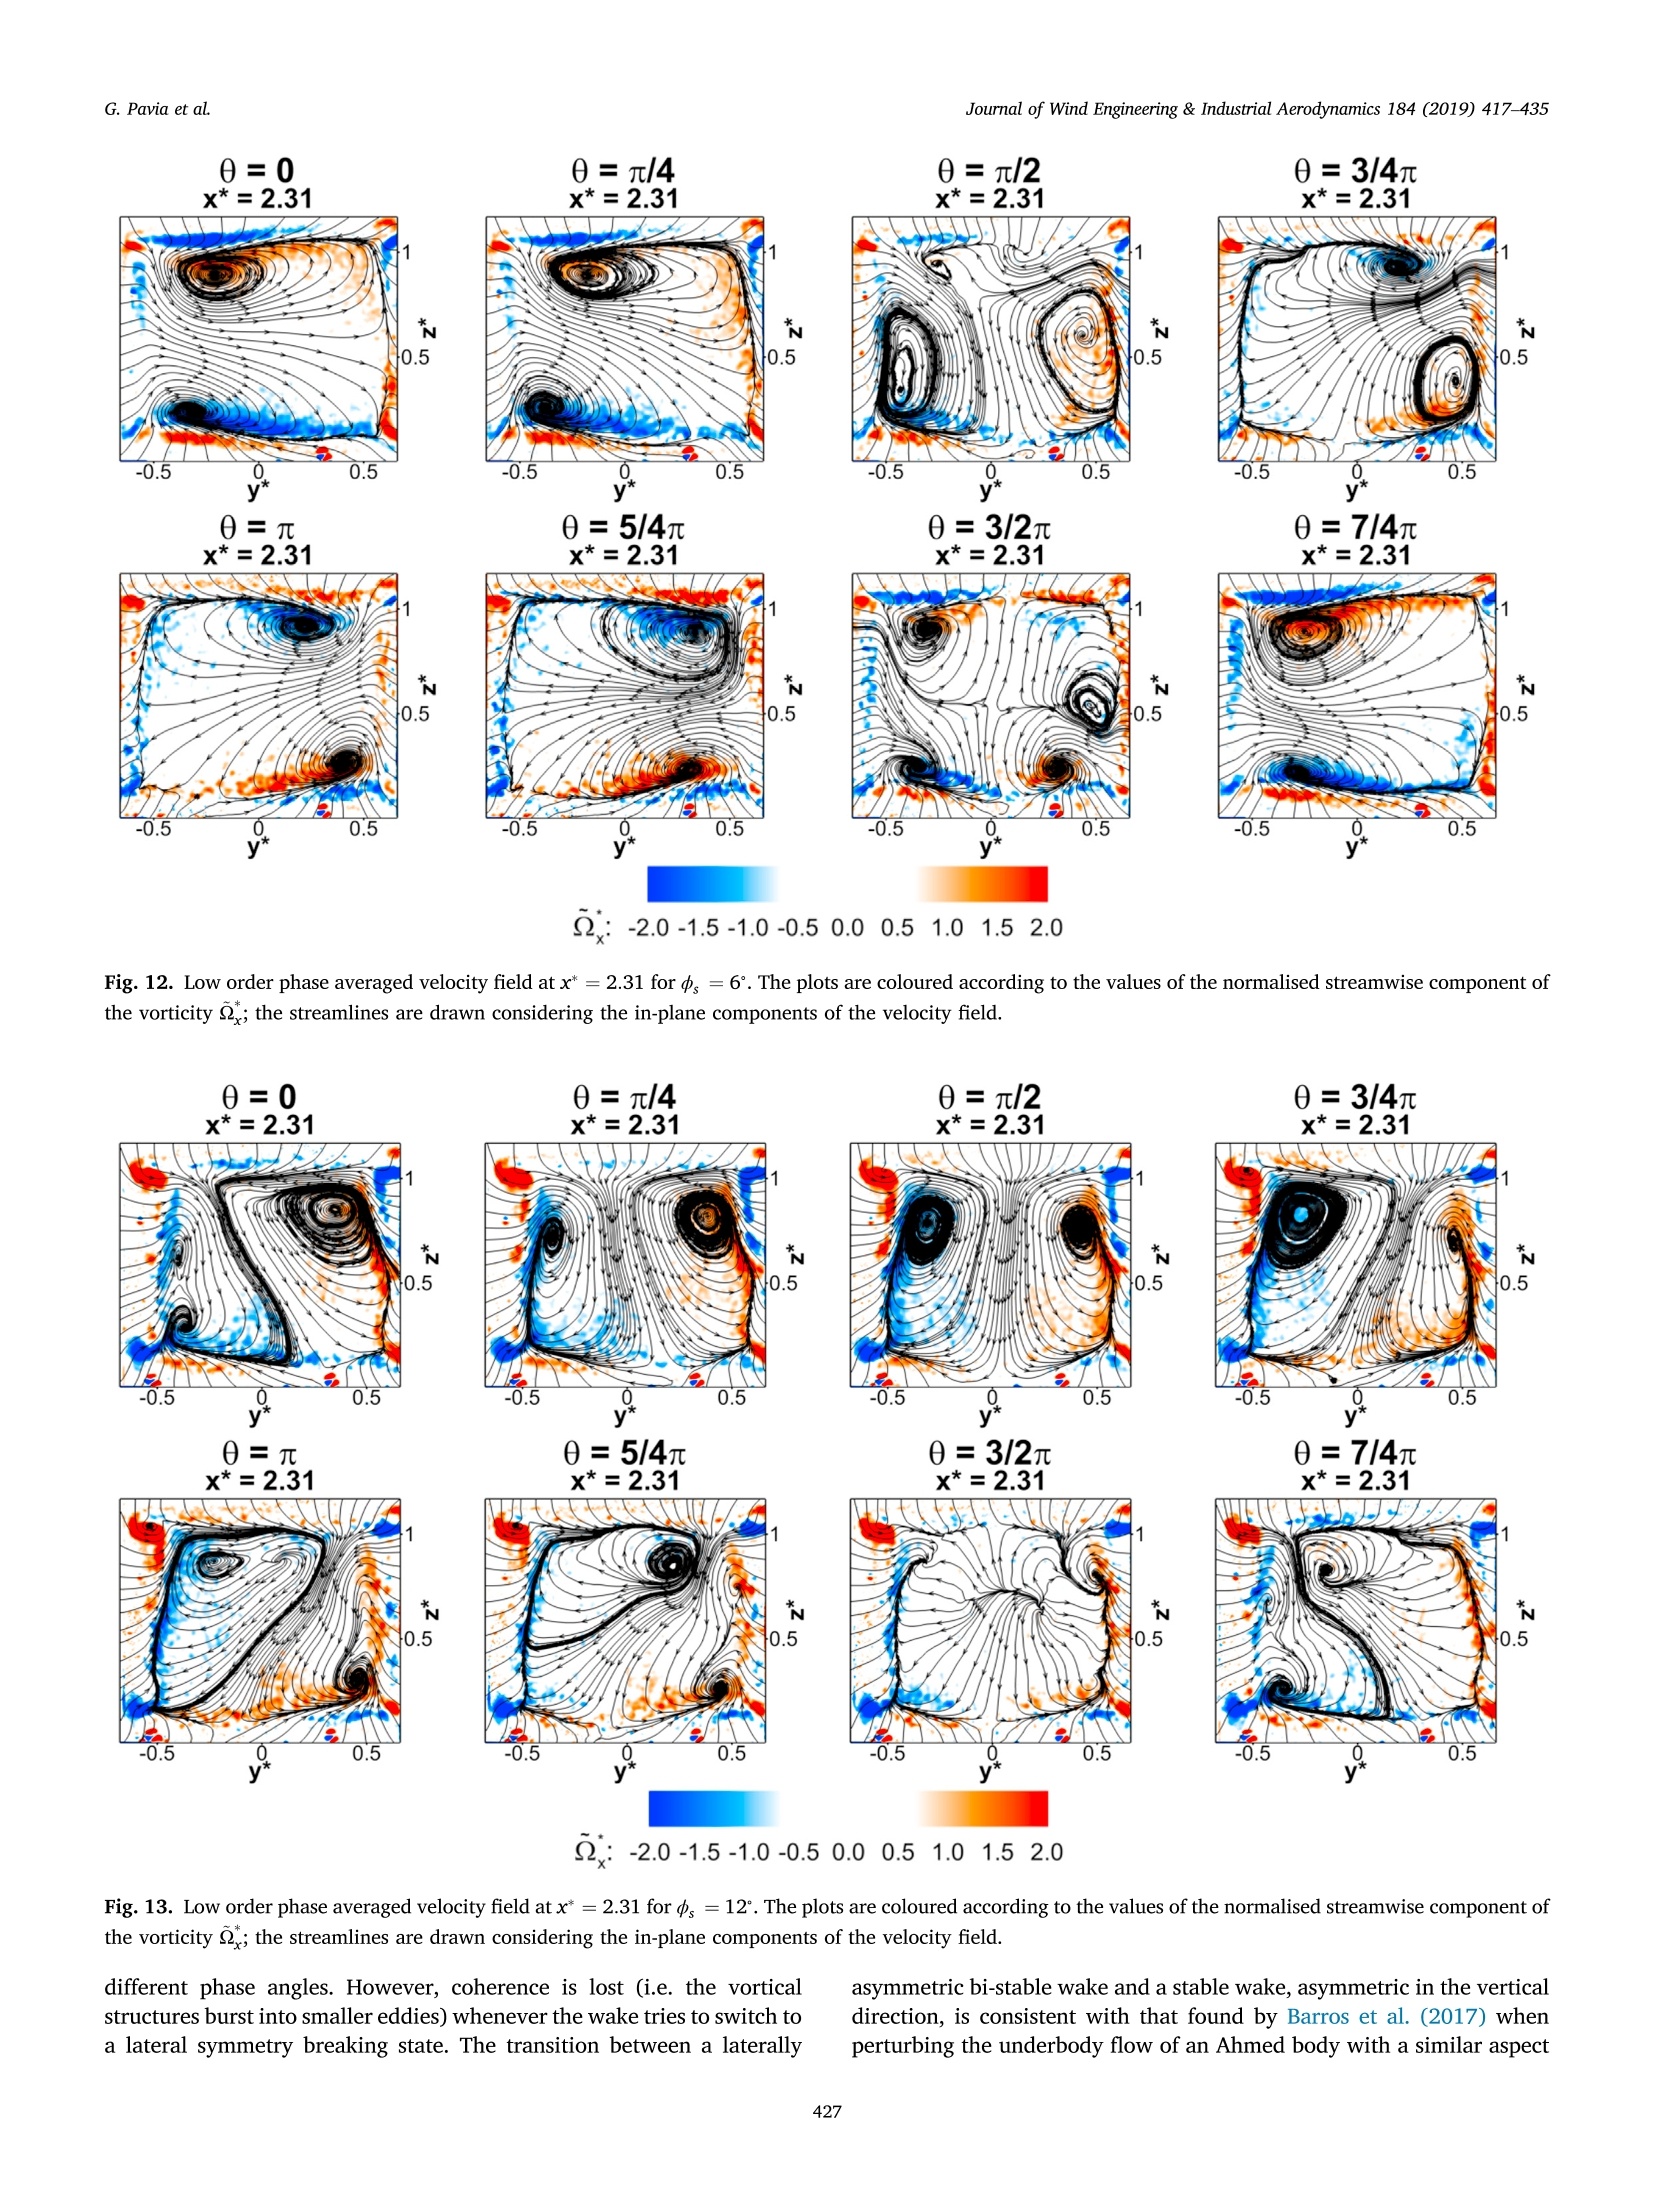
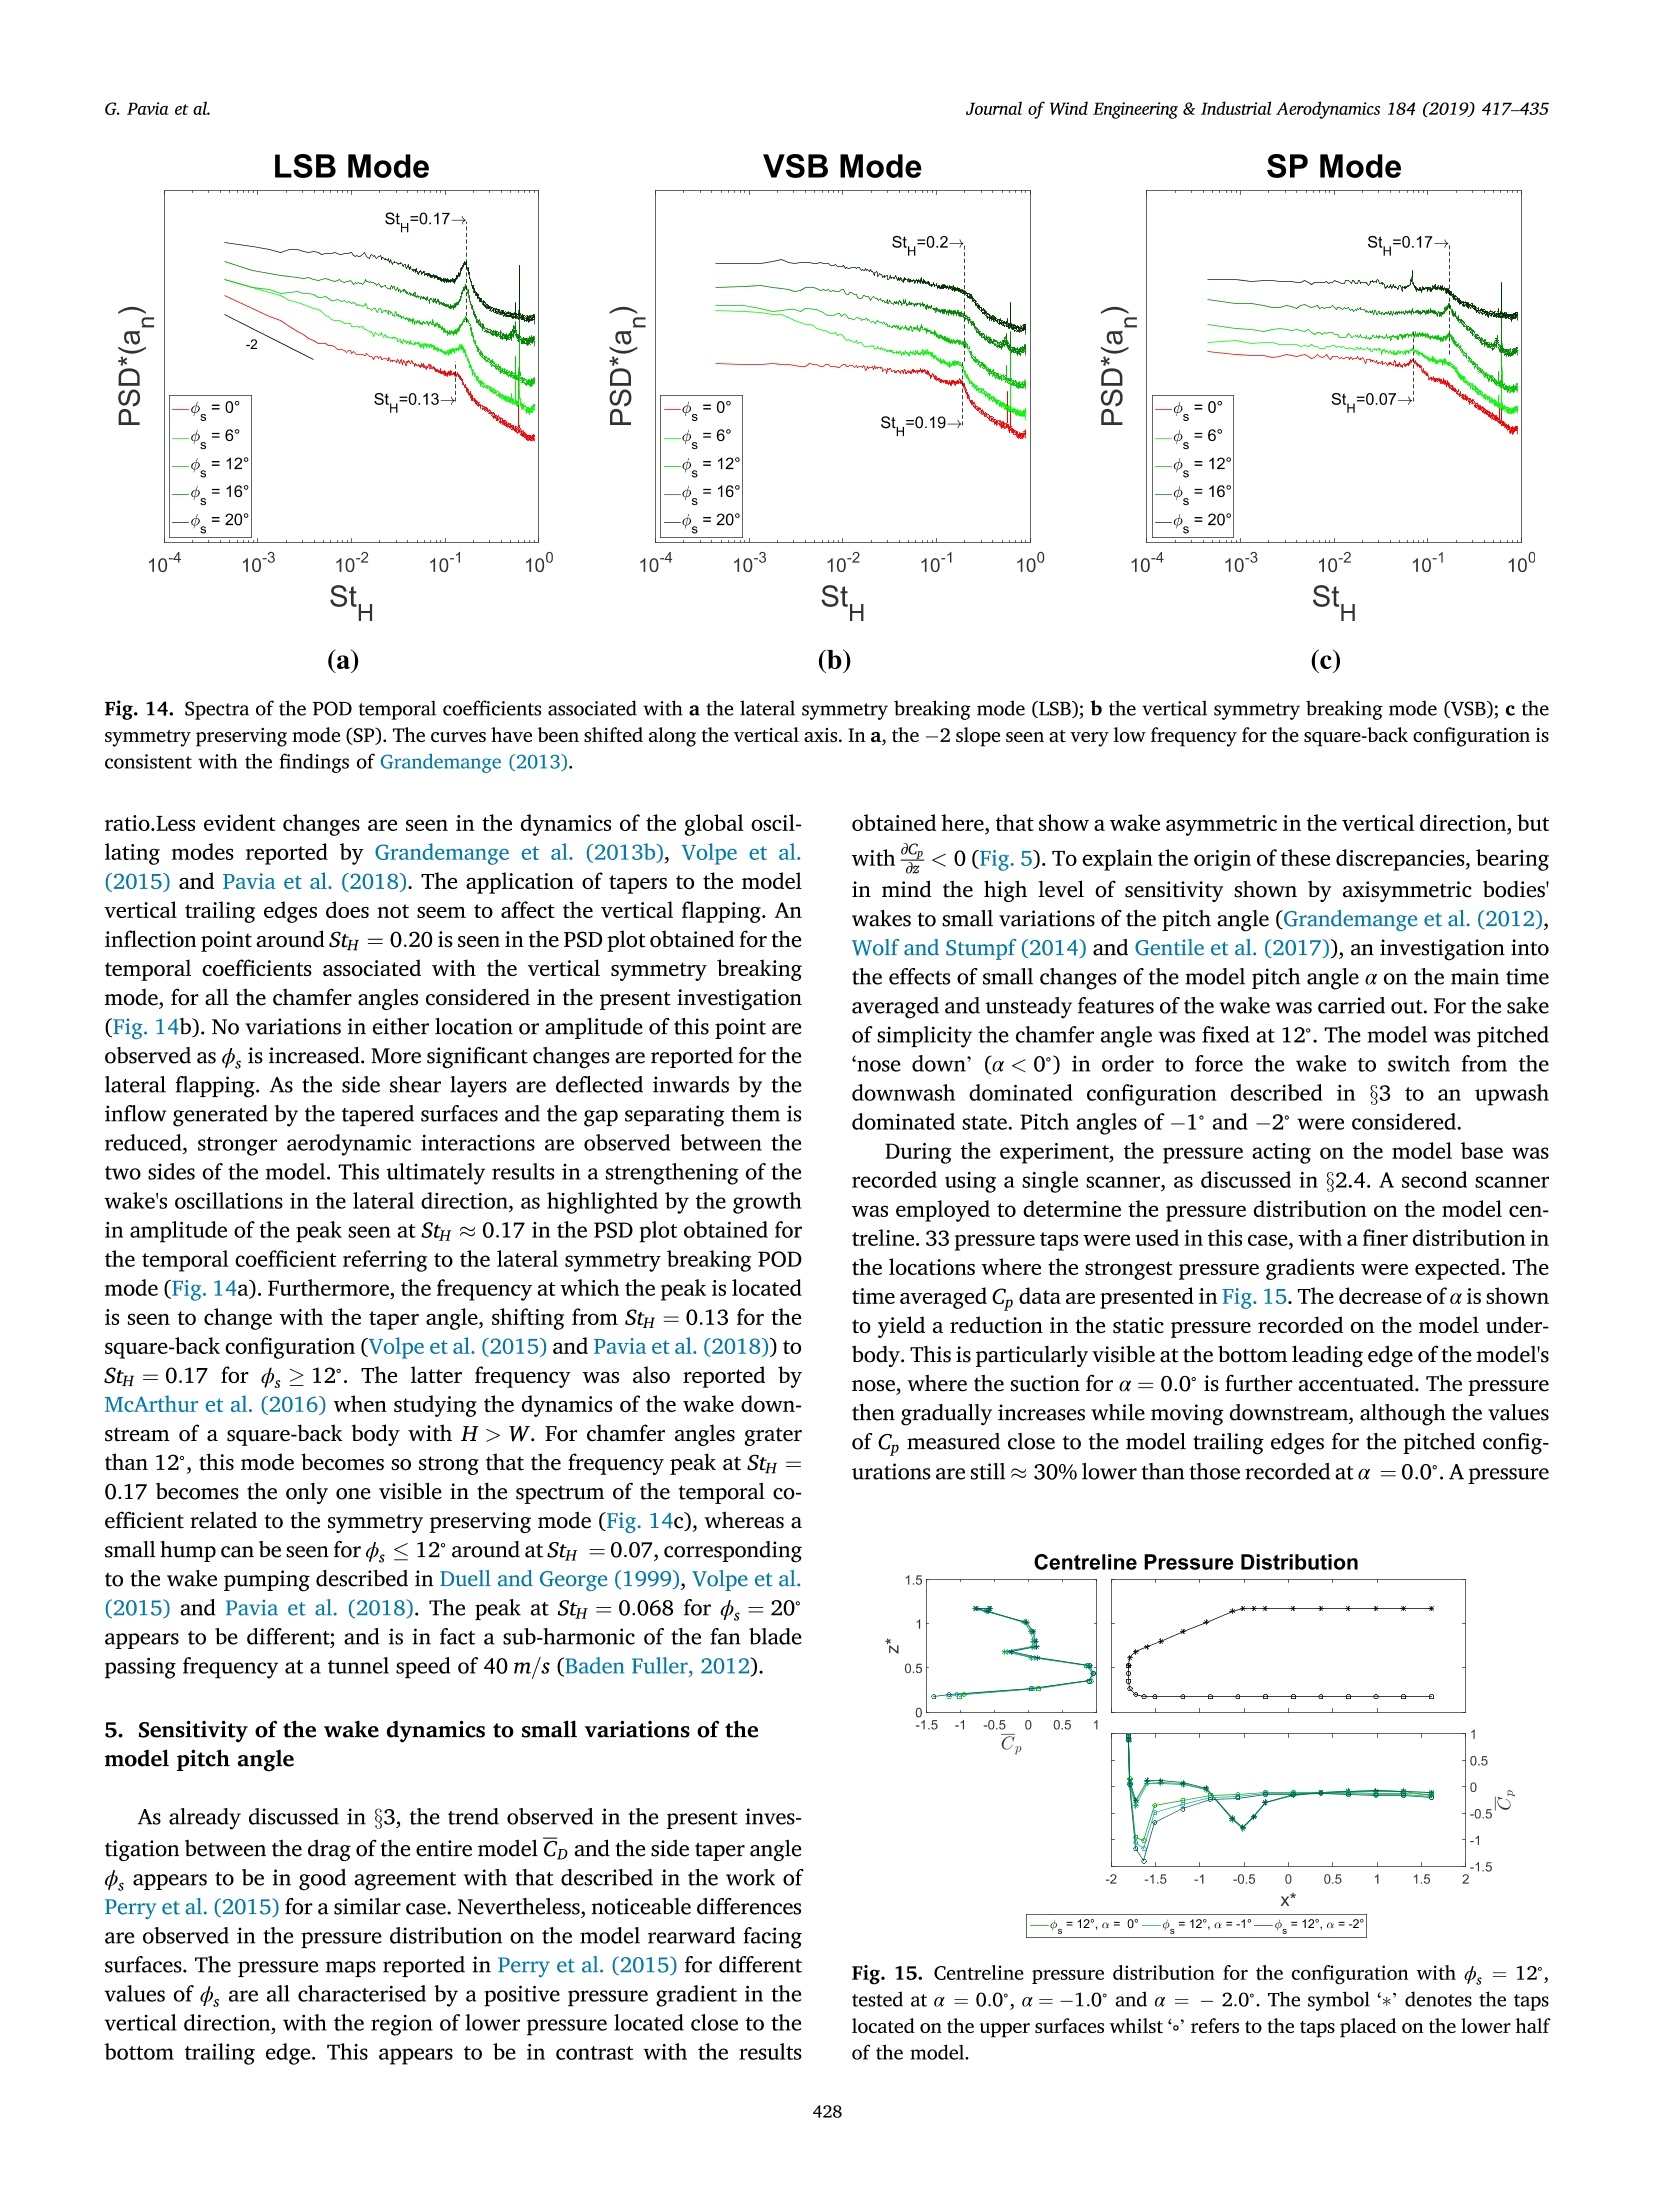
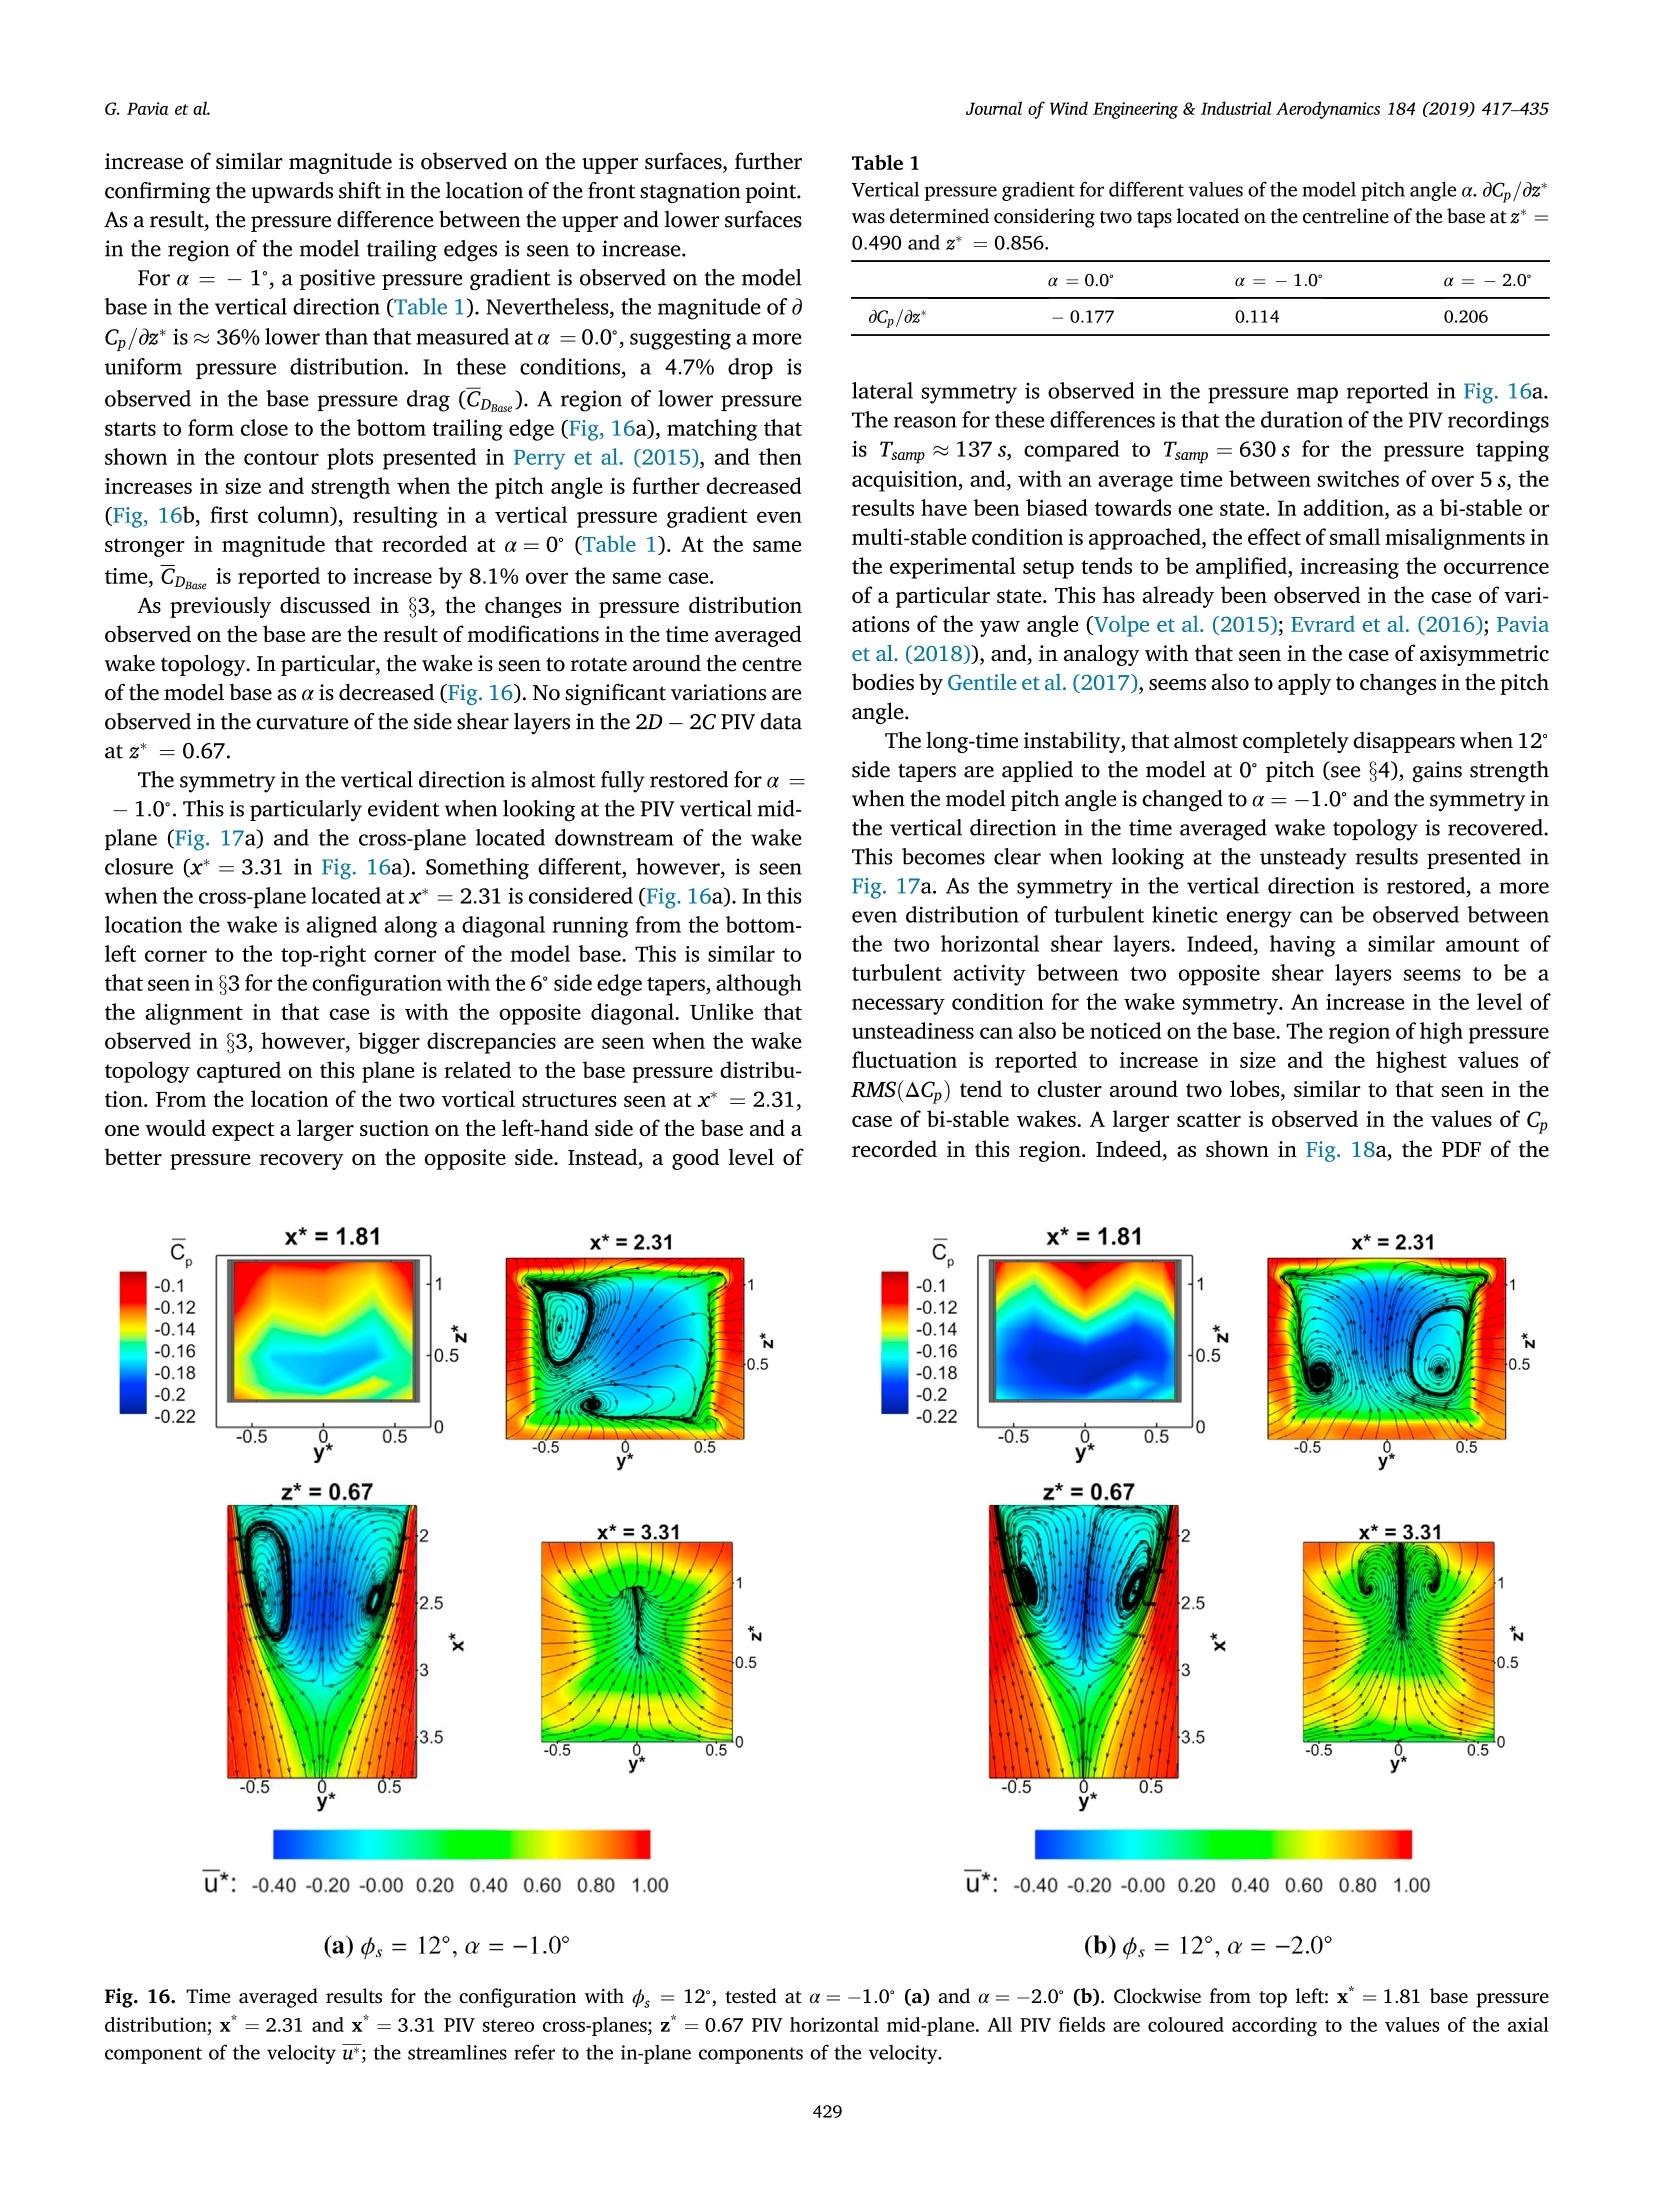
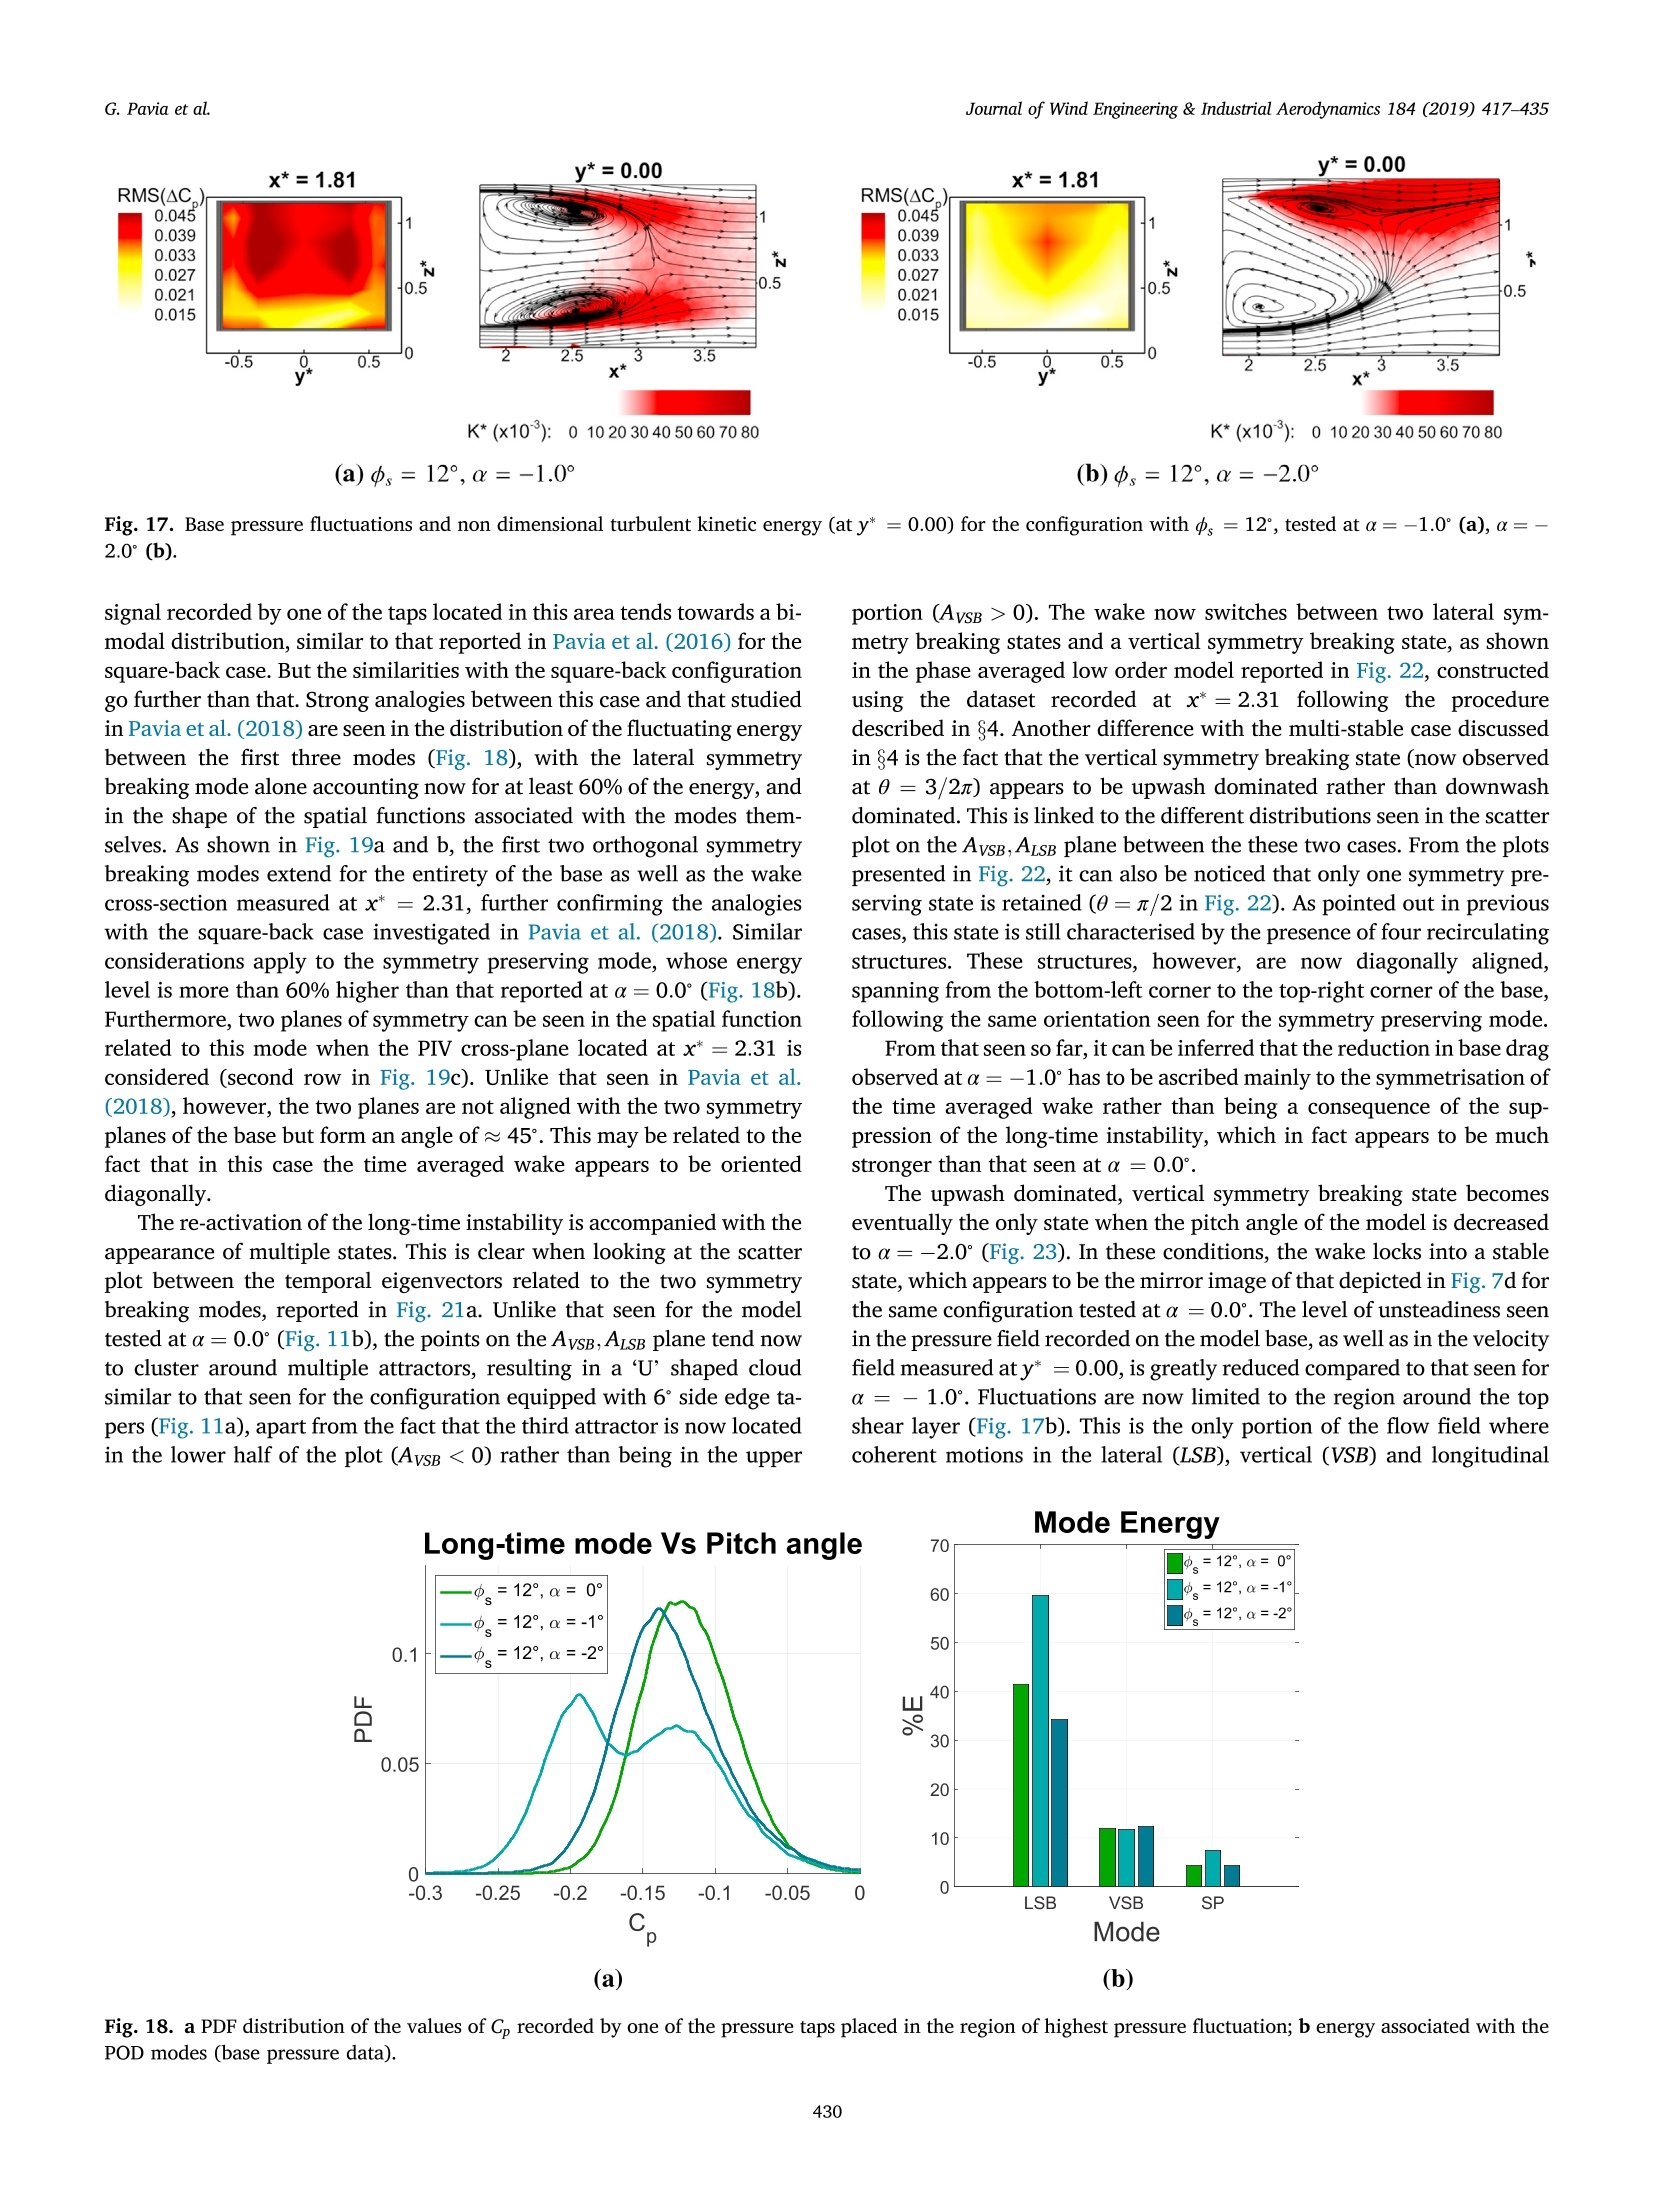
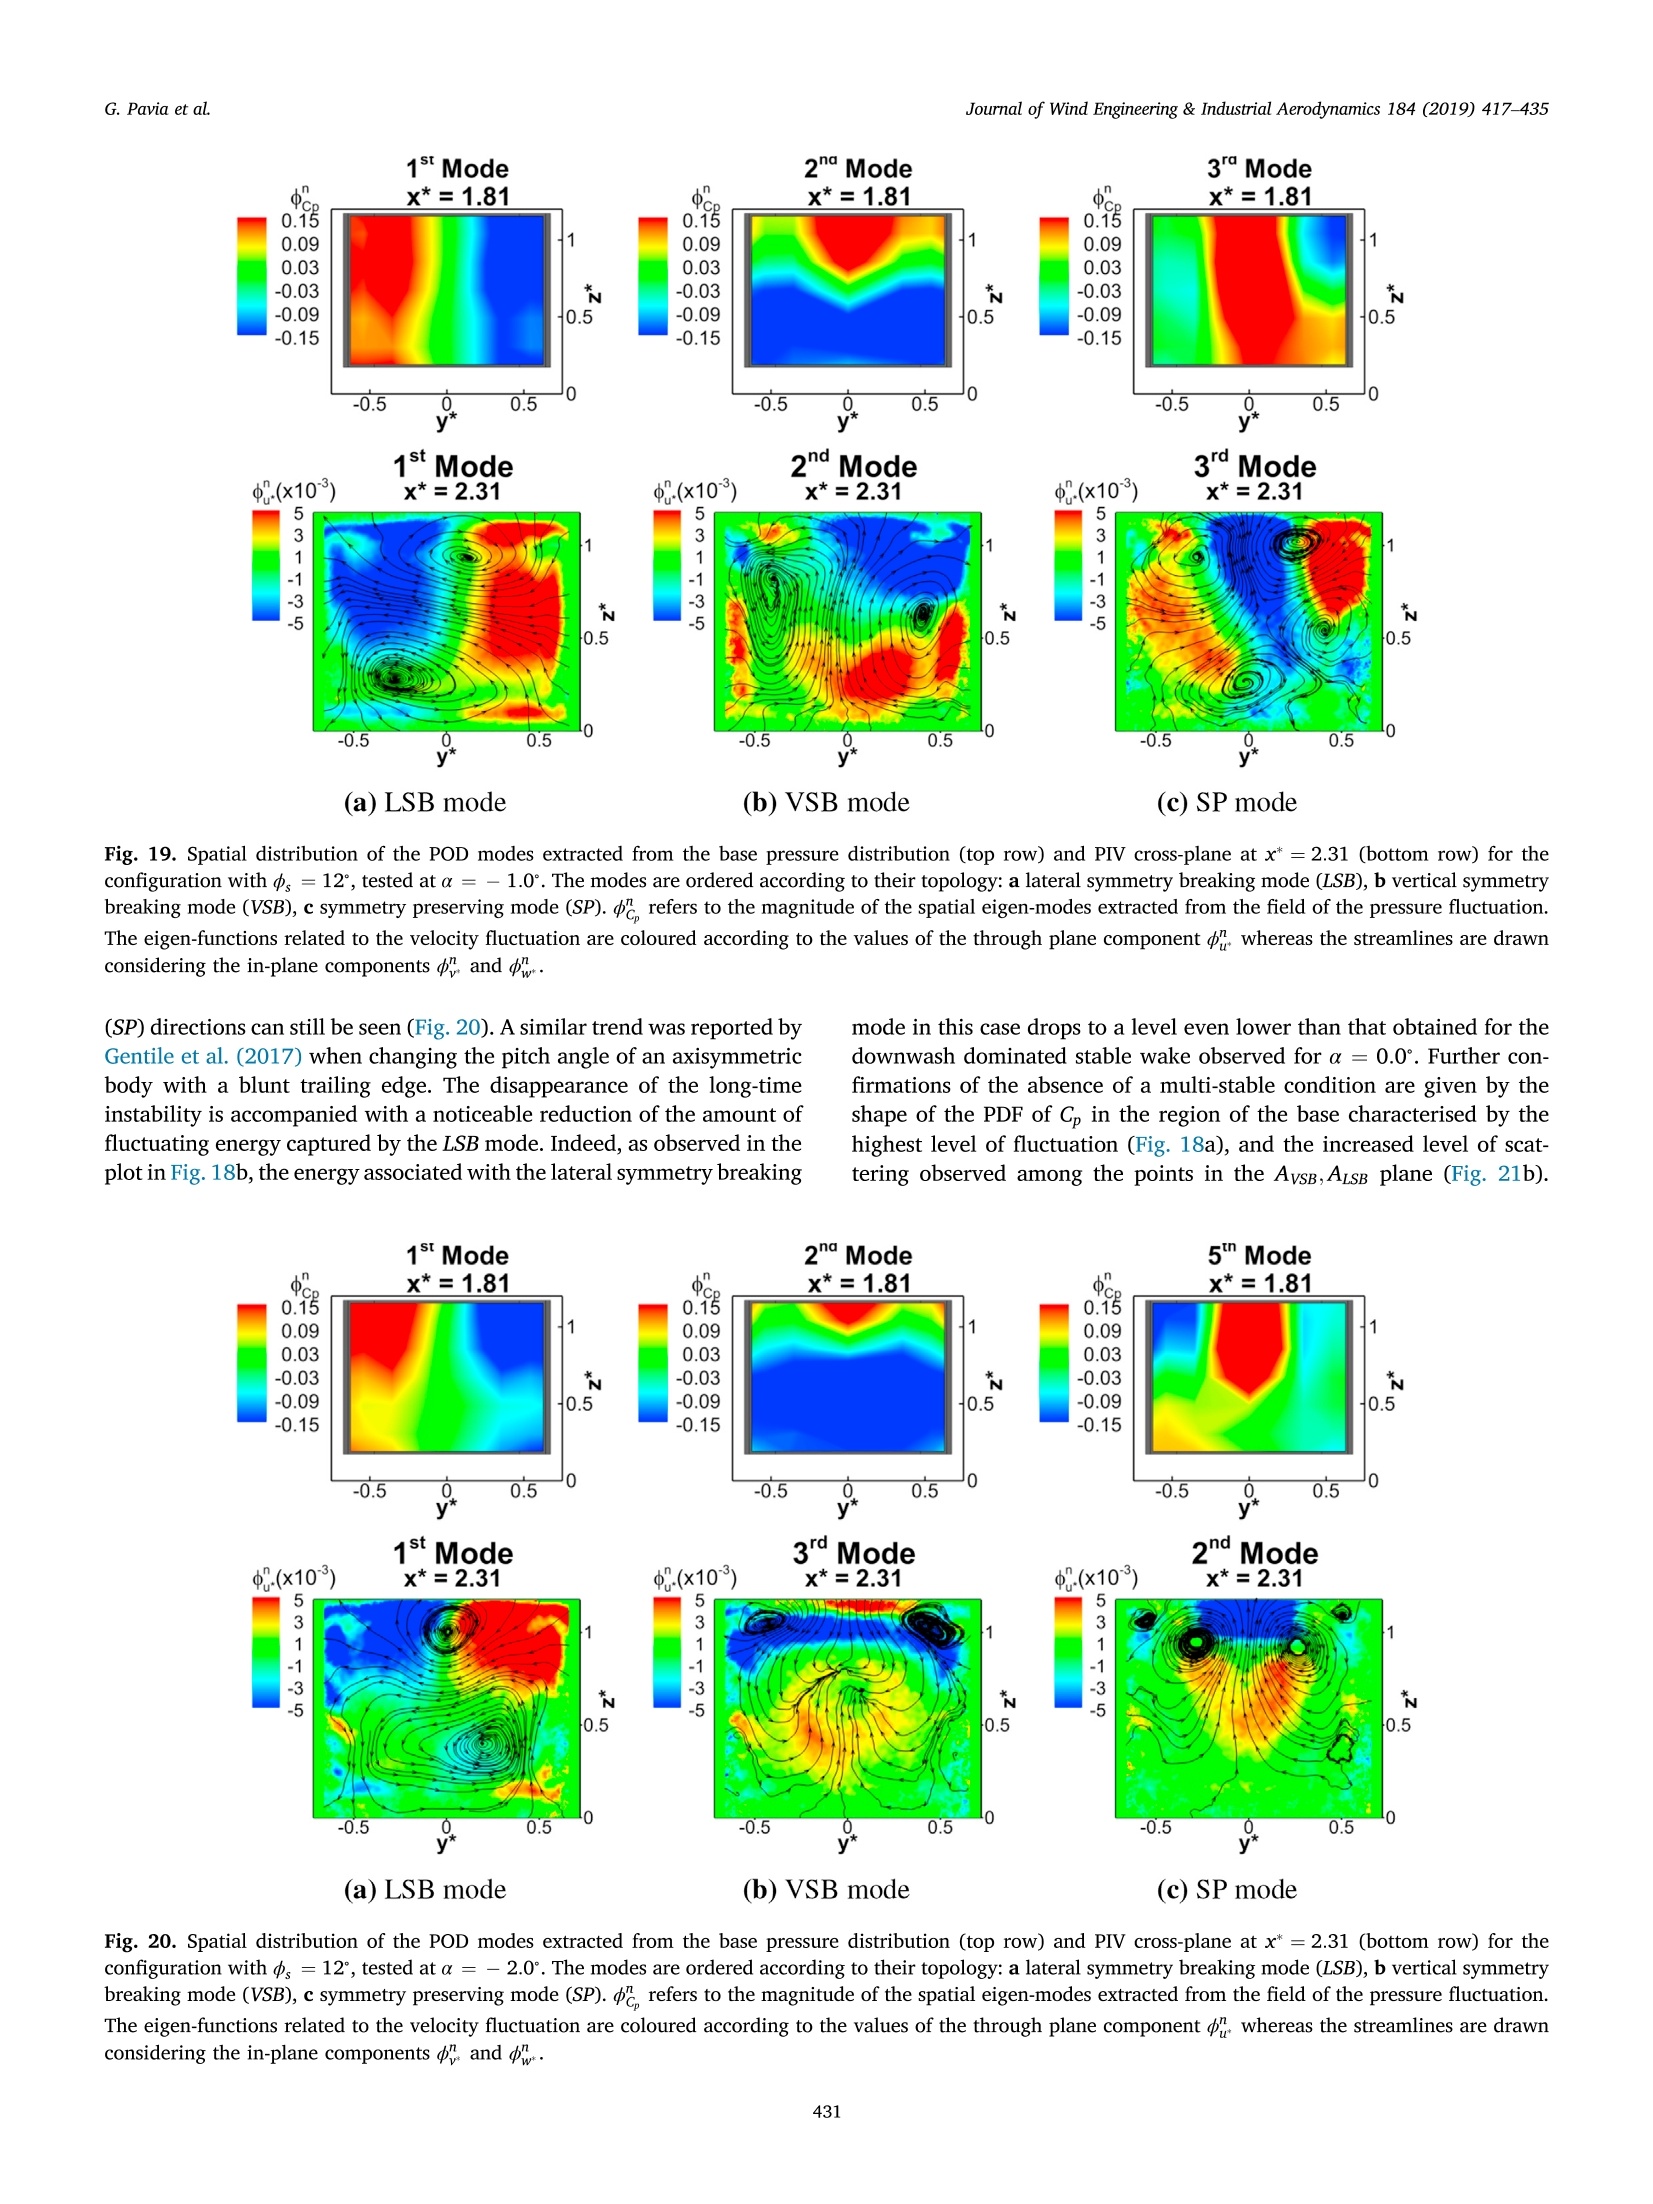
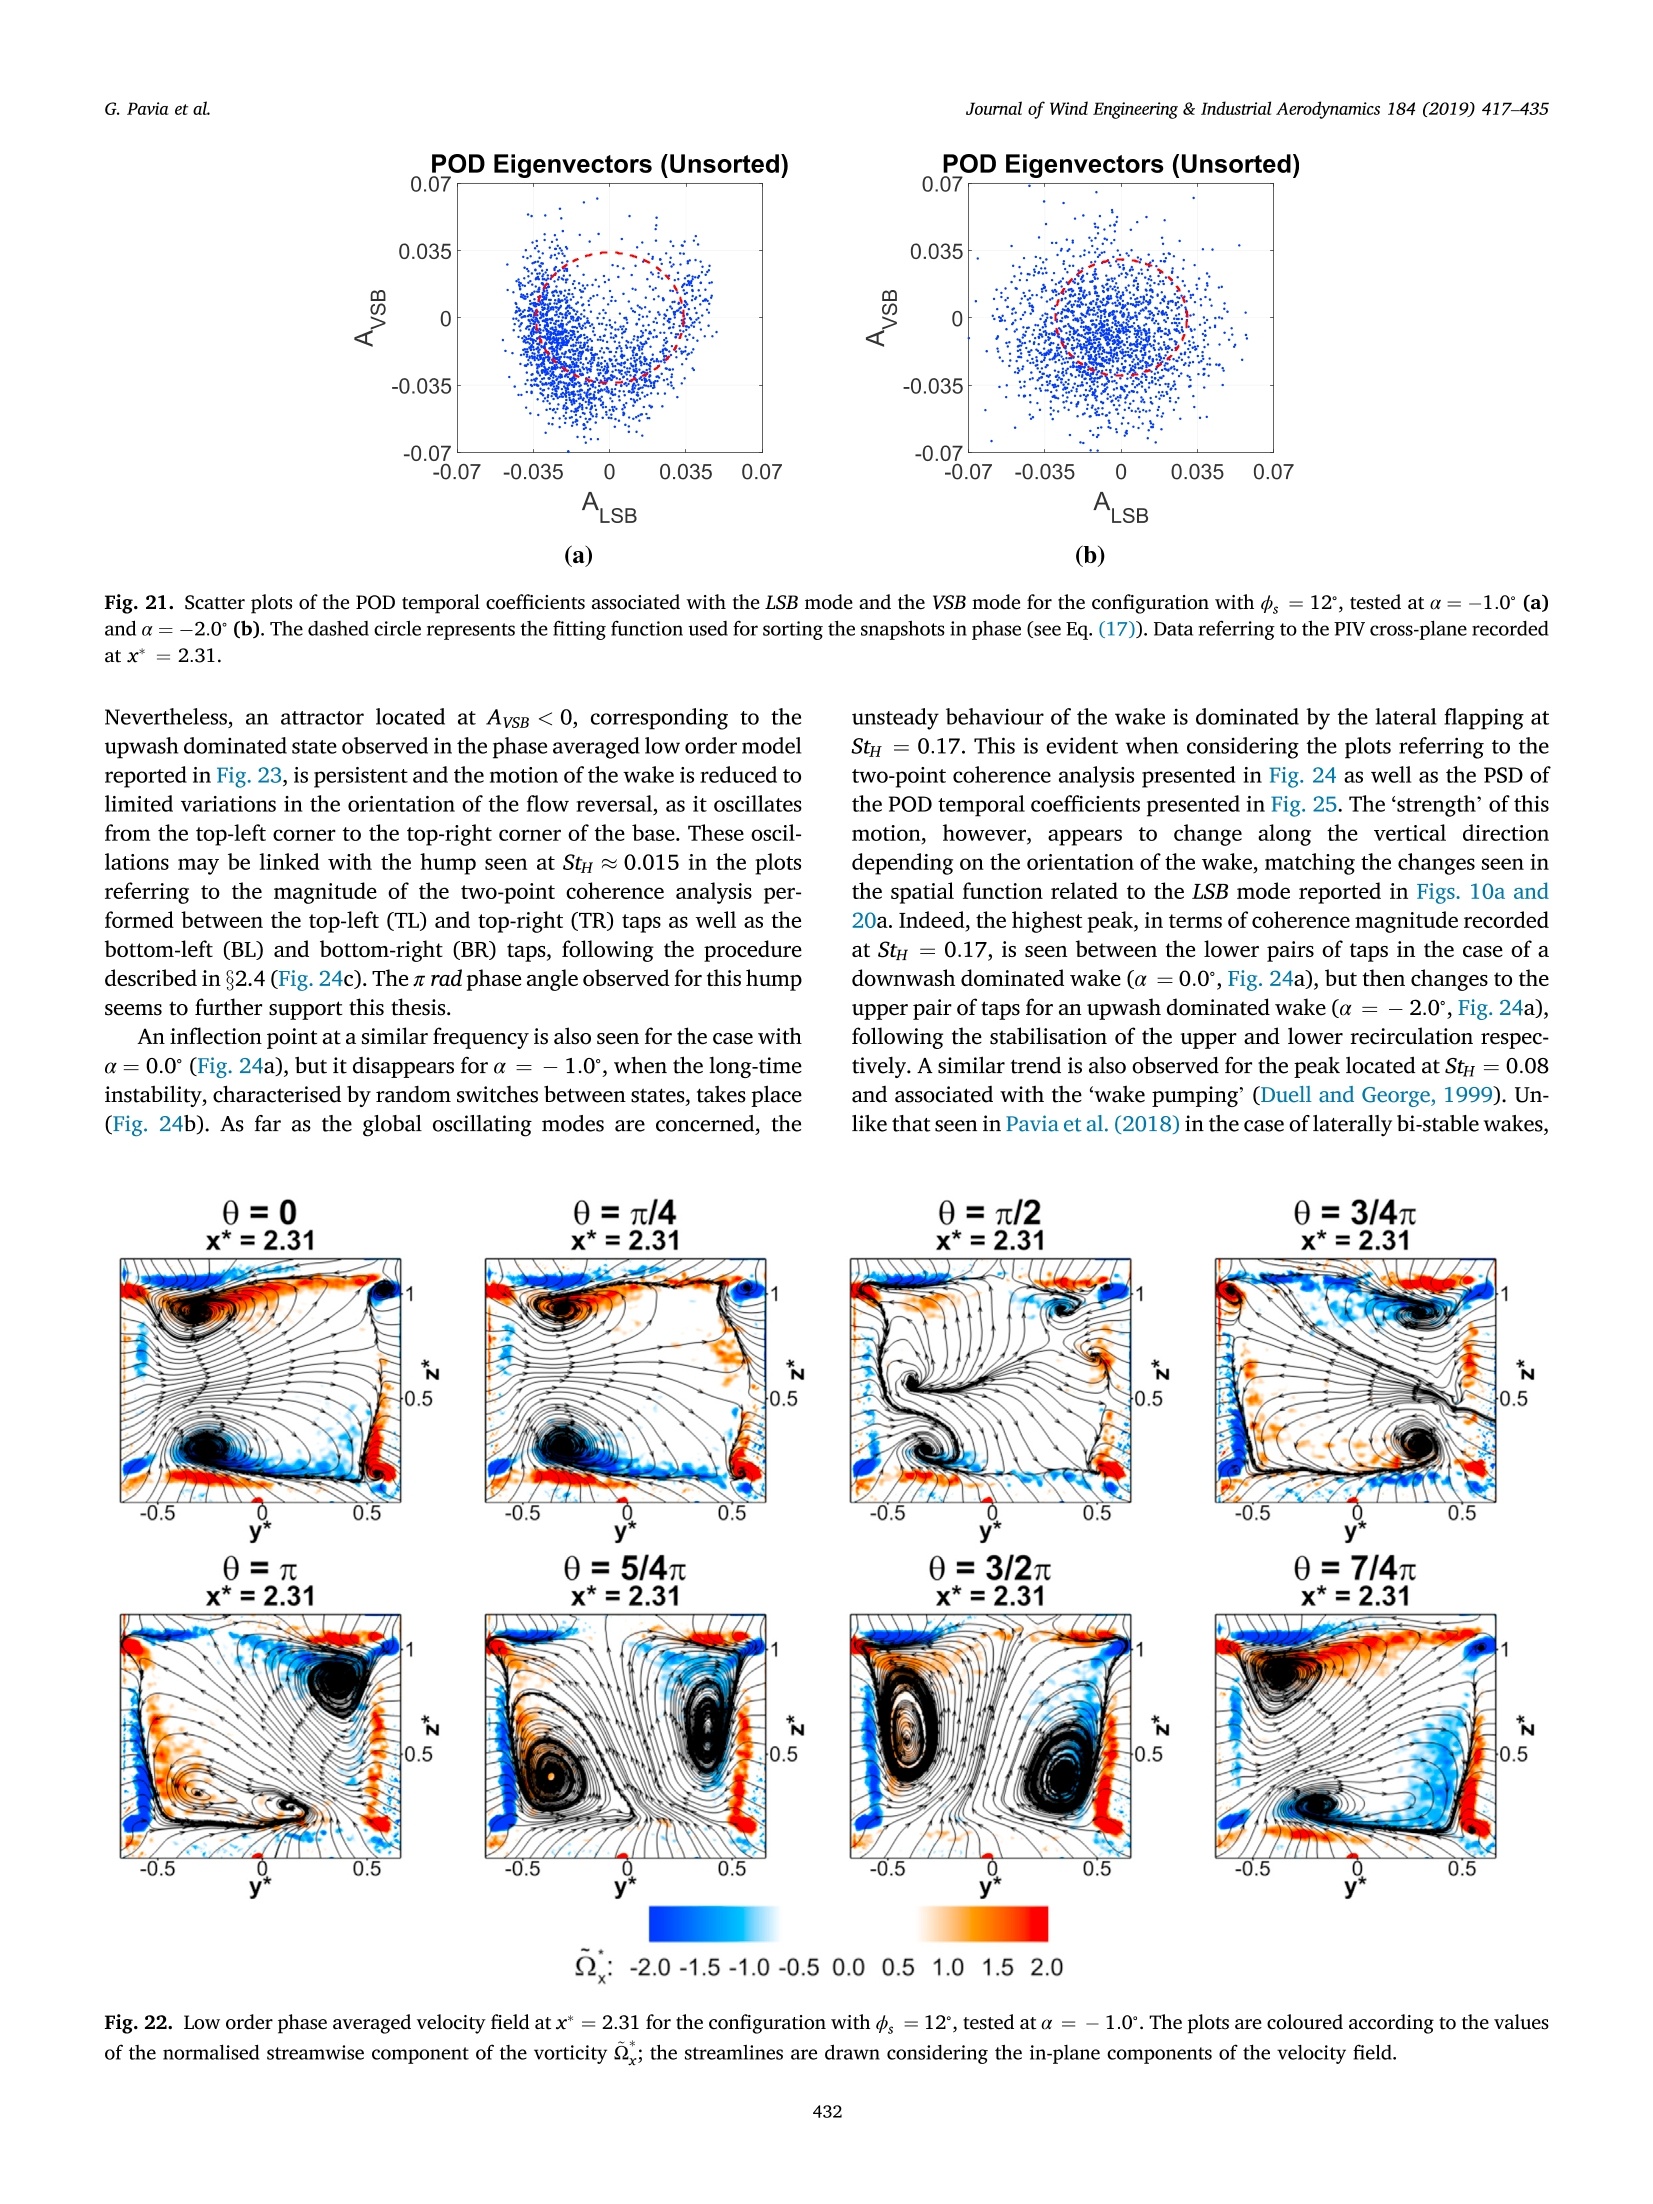
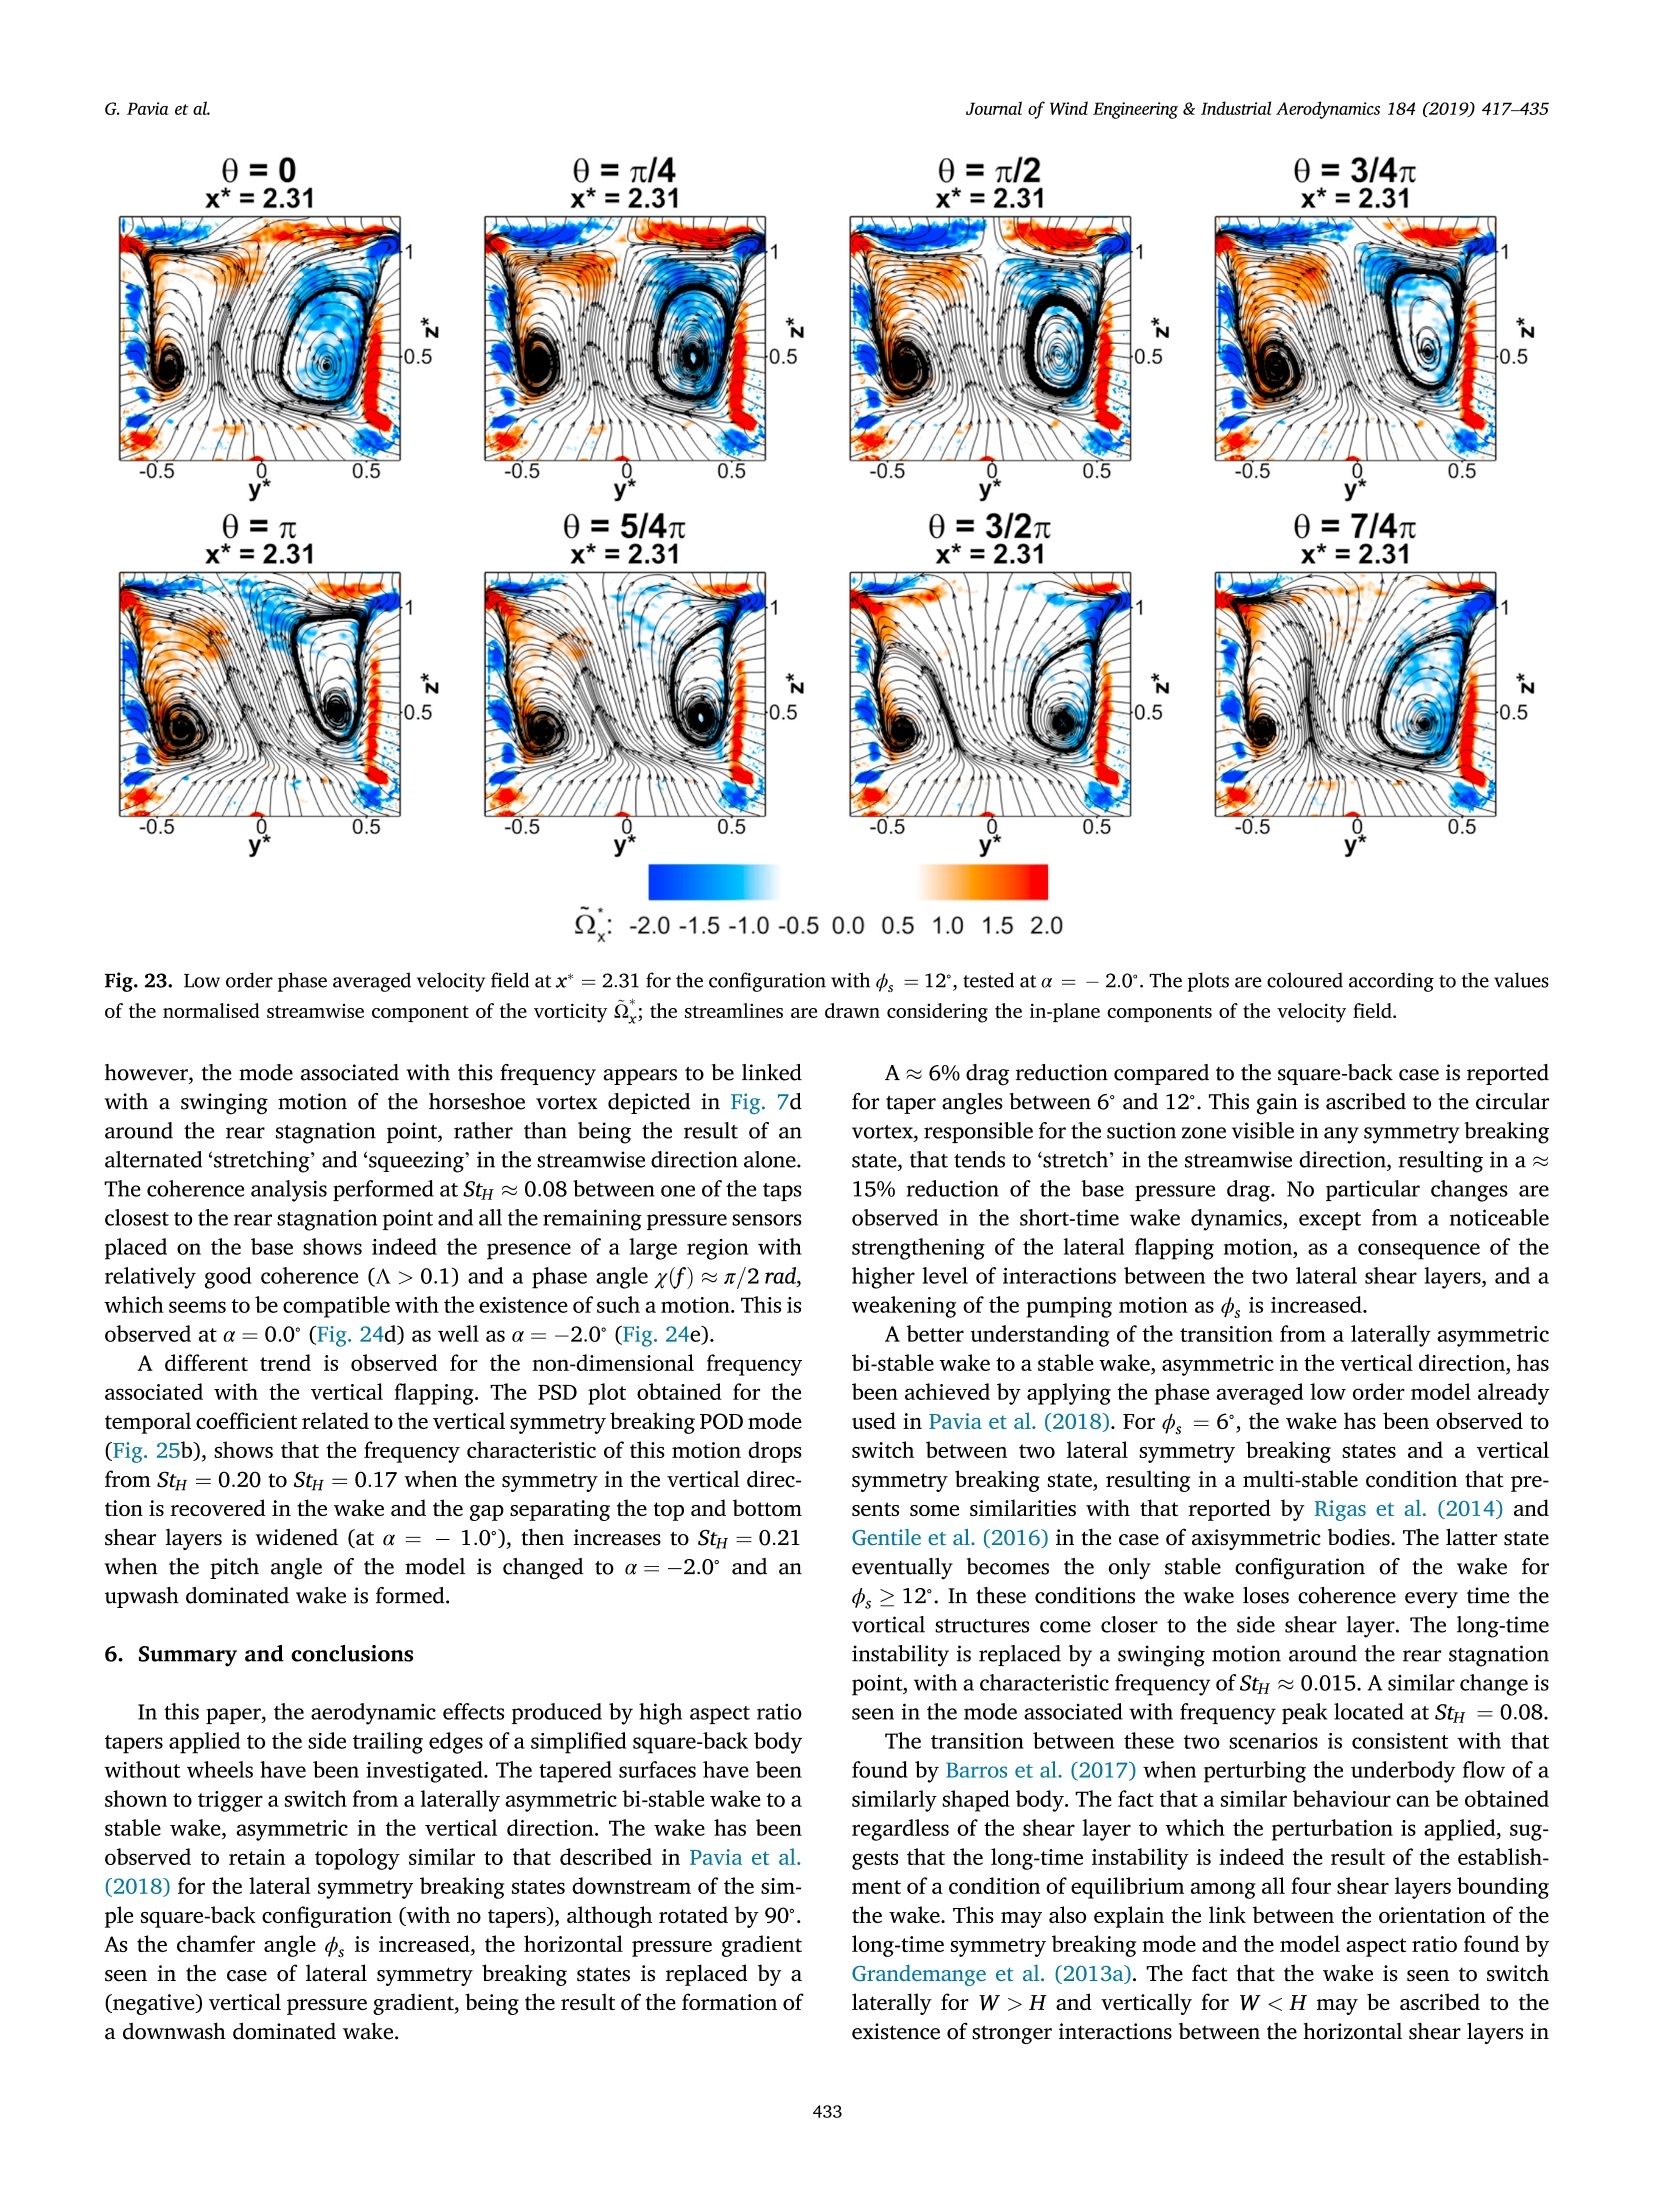
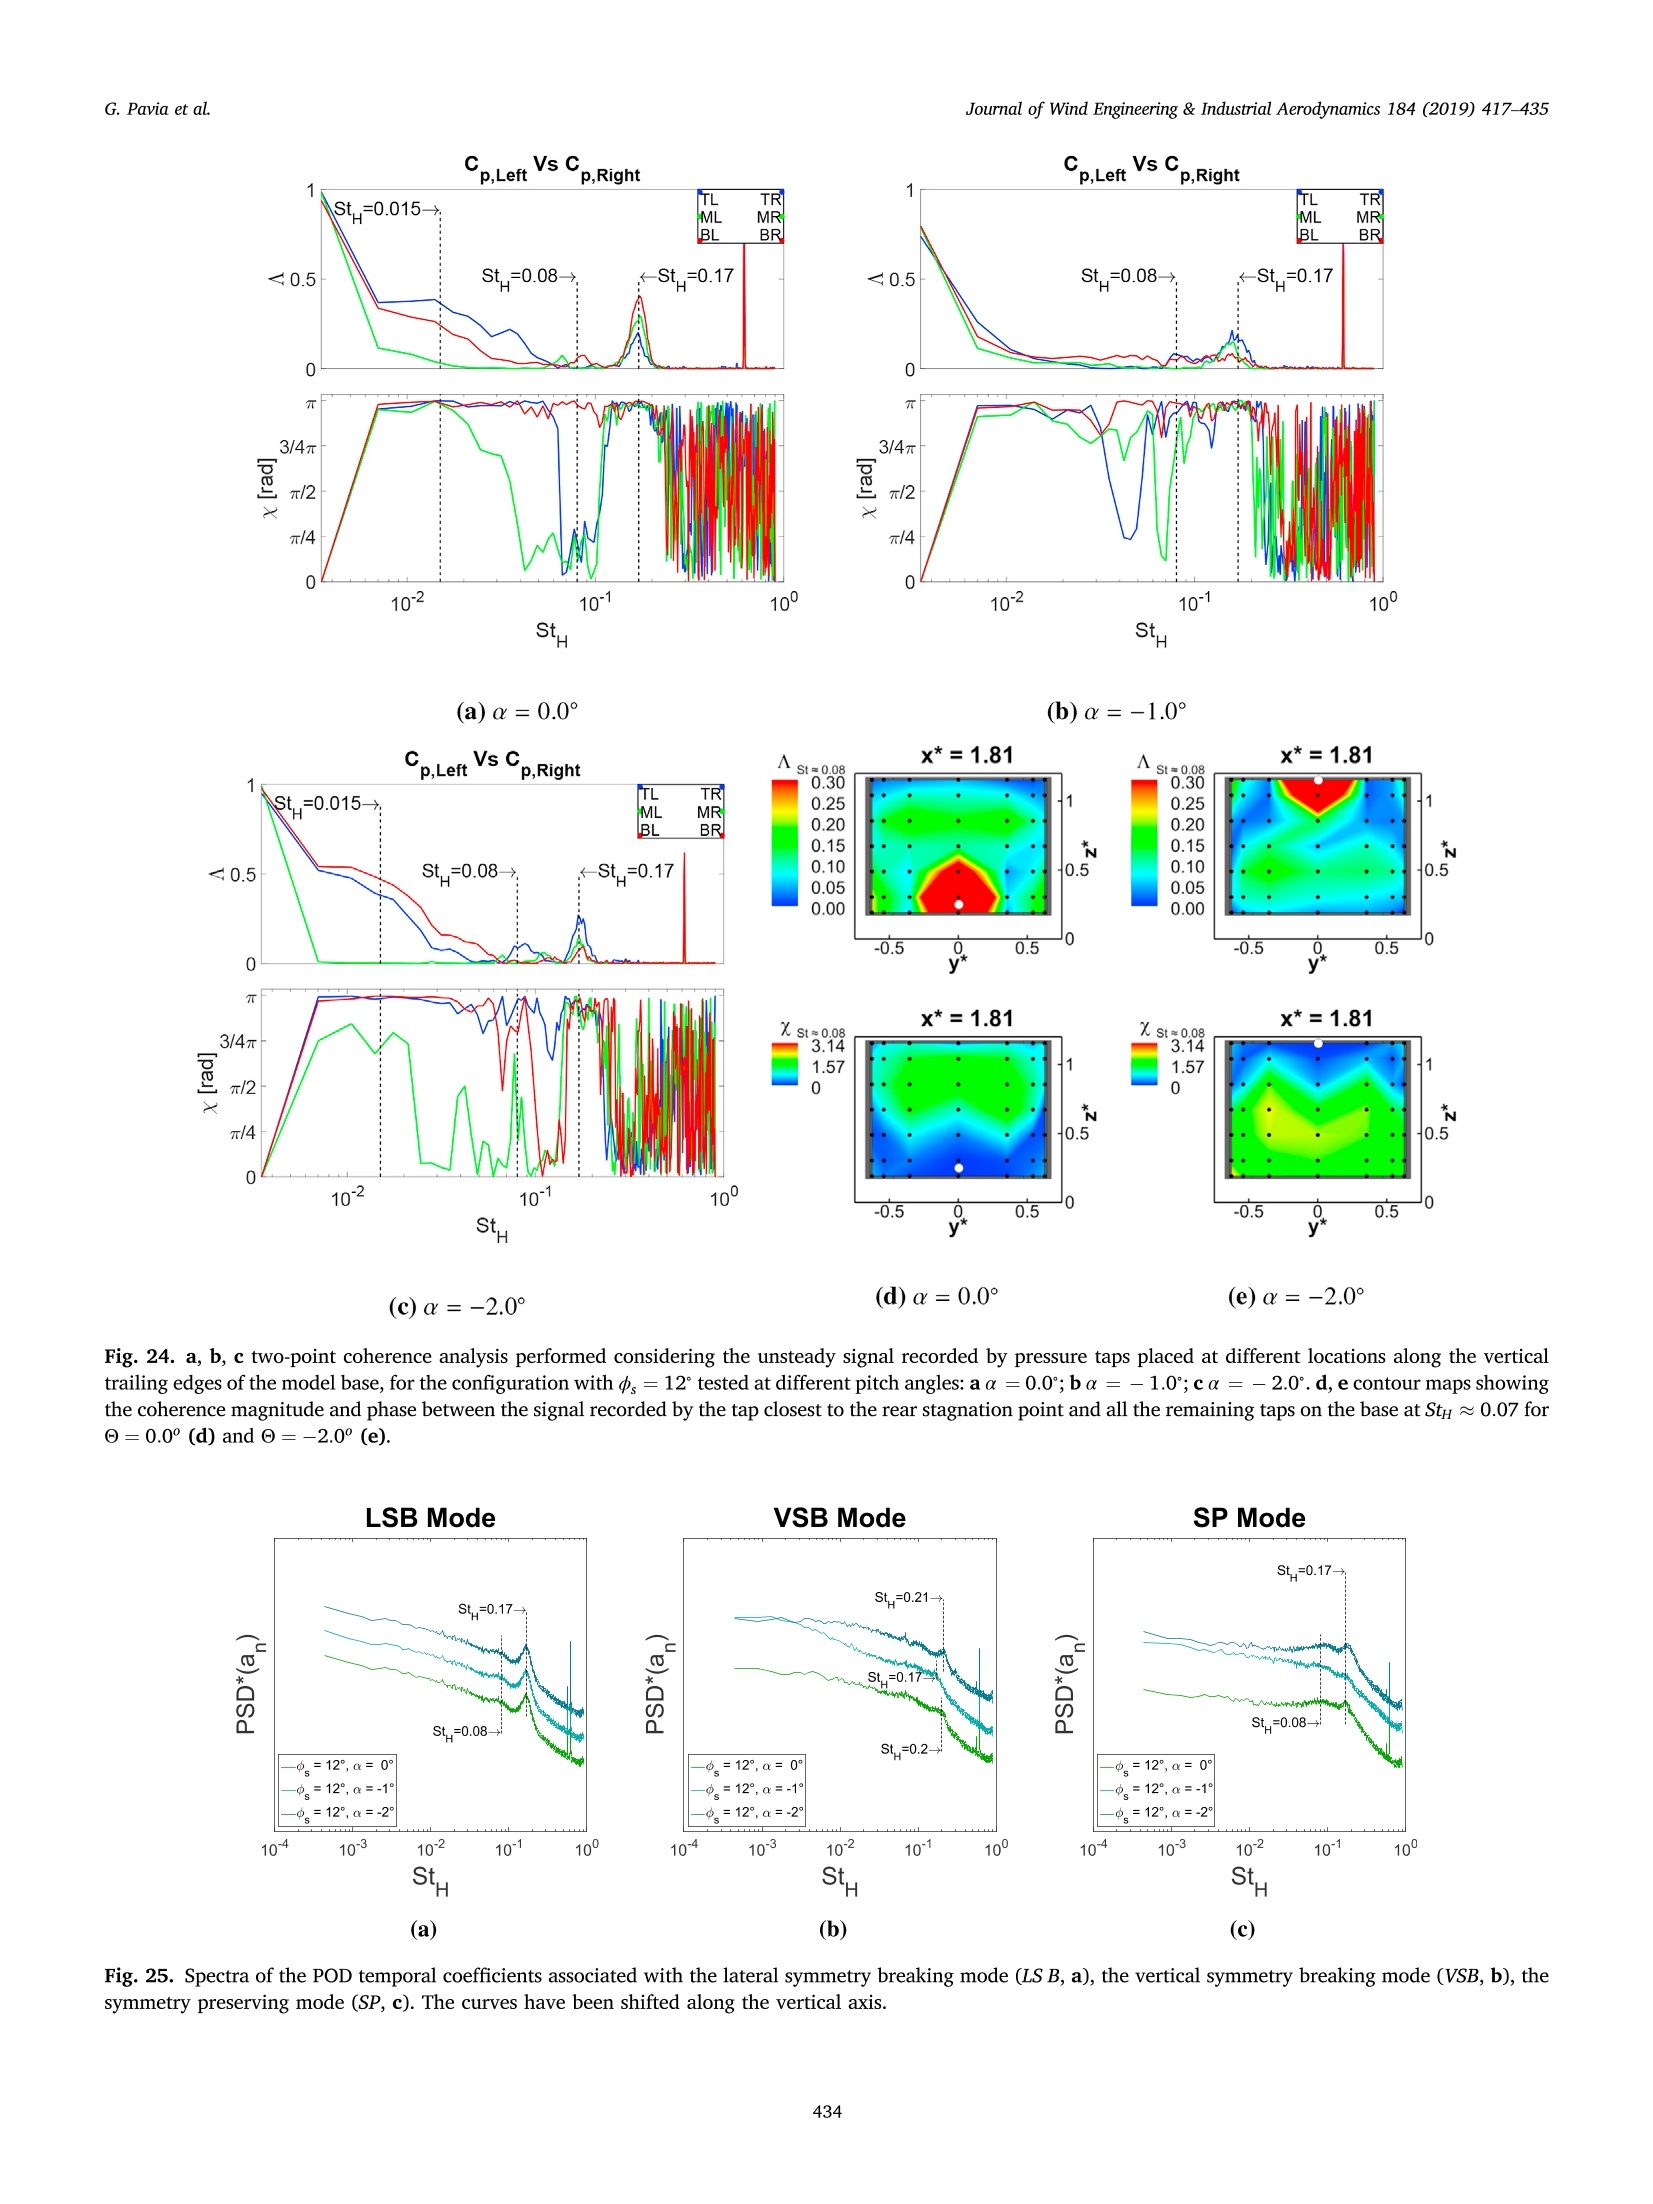
Journal of Wind Engineering & Industrial Aerodynamics 184 (2019) 417-435Journal of Wind Engineering & Industrial Aerodynamics Journal of Wind Engineering & Industrial Aerodynamics 184 (2019) 417-435G. Pavia et al. Contents lists available at ScienceDirect ELSEVIER journal homepage: www.elsevier.com/locate/jweia Low-frequency wake dynamics for a square-back vehicle with side trailingedge tapers Giancarlo Pavia , Martin Passmore, Max VarneyStewart Miller Building, Loughborough University, Loughborough, Leicestershire, LE11 3TU, United Kingdom ARTICLEINF O ABSTRACT Keywords:Bluff body aerodynamicsWake dynamicsWake bi-stability In this paper, the effects of side trailing edge tapering on the wake of a simplified square-back vehicle areinvestigated. The tapered surfaces are reported to trigger a switch from a laterally asymmetric bi-stable wake to avertically asymmetric stable wake. The wake structure reported in the literature for lateral symmetry breakingstates is seen to rotate by 90° as the angle of the tapered surfaces 中, is increased. A 6% drag reduction over thesimple square-back case is reported for 6°<中<12°. This gain is found to be the result of the stretching of thecircular vortex responsible for the suction zone visible in any symmetry breaking state. A downwash dominatedwake is observed in these conditions. The sensitivity of such a wake to small variations of the model pitch angle(for 中s =12°) is also assessed. As the pitch angle a is reduced from 0° to - 2°, the time averaged wake is reportedto switch from a downwash dominated topology to an upwash dominated topology. A strengthening of the long-time instability is observed when the symmetry in the vertical direction is recovered and is accompanied with a4.9% reduction in base drag over the same model tested at a=0°. Since the seminal work of Grandemange et al. (2013b), the long-timedynamic behaviour of the wakes developing downstream of square-backbluff bodies has been the object of an ever-growing interest in the sci-entific community. Over the last few years, remarkable progress has beenmade in the characterisation (Volpe et al. (2015); Pavia et al. (2018)),modelling (Brackston et al., 2016) and control (Grandemange et al.(2014b); Evrard et al. (2016)) of such instability. Evidence of the pres-ence of this unsteady behaviour has been found also on geometries morerelevant to the transport industry (Grandemange et al. (2015) and Paviaand Passmore (2017)) and commercially available passenger cars (Bon-navion et al., 2017), making it of great interest for the engineeringcommunity. Strong analogies have been seen between this mode and the multi-stable behaviour reported for the wake developing downstream ofaxisymmetric geometries (Rigas et al., 2014). In the latter case, thesymmetry breaking mode has been shown to be highly sensitive to smallvariations of the angle between the body’s axis of revolution and theonset flow (Wolf and Stumpf (2014) and Gentile et al. (2017)) as well asperturbations applied to either the boundary layer developing around thebody or the shear layer bounding the wake (Grandemange et al. (2012); Focusing on the effects of base aspect ratio on the bi-stable mode,Grandemange et al. (2013a) reported a bi-stable motion for the wake of asquare-back body in the lateral direction for W> H and in the verticaldirection when W 0.08 (where C* =h/H, with h referring to the distance between thebottom flat surface of the model and the ground). Within this range, itwas postulated that instabilities from both the shortest and the largestside may occur, although the limit case at W/H =1 was not observed inthe experiment, arguably due to the presence of residual asymmetries inthe experimental setup. For a square-back geometry with W > H, a strong relationship hasbeen found between the time averaged wake topology in the mid-verticalplane and the tendency of the wake to develop a bi-stable behaviour inthe lateral direction. Perry et al. (2016), pointed out that the lateralbi-stable behaviour was weakened in the case of either upwash- ordownwash-dominated wakes as well as when the distance separating thetop and bottom shear layer was reduced while preserving the symmetryof the time averaged wake in the vertical direction. Barros et al.(2017),perturbing the flow passing underneath a square-back Ahmed body ( E-mail address: G . Pa vi a@lboro.ac.uk ( G. P avia). ) ( h t t ps://doi.org/10.1016/j.jweia.20 1 8.12.009 ) before separation, showed that the restoration of the flow symmetryalong a plane normal to the ground was always accompanied with theoccurrence of a bi-stable motion of the wake in the spanwise direction,revealing the existence of a bifurcation scenario where the flow switchesbetween a wall-normal asymmetric recirculation and a bi-stable spanwiseconfiguration. During the transition between these two scenarios,meandering motions of the wake between asymmetric wall-normal andspanwise states were also reported, although without the presence of aperfect bimodal distribution. In Grandemange et al. (2013a), when a configuration with W/H=0.75 was tested at different values of the ground clearance C*, a bi-stablebehaviour was seen only for C*=0.10 and 0.50≤C*≤1.00, whereas astable state, asymmetric in the vertical direction, was reported for0.1< C* <0.5, with 0C,/0z* <0 over the model base. A similar asym-metry was described by Cabitza (2014) when considering a prismaticmodel with W/H =0.86, tested at a ground clearance of C* =0.56. Inthat case, the author speculated that the cause of the asymmetry was tobe found in the proximity of the model with the ground. Nevertheless,when the shear layers were perturbed using synthetic jets and thesensitivity of the system to different forcing frequencies and amplitudeswas tested, a bi-stable behaviour was seen along both vertical andspanwise directions. Interestingly, the control strategy yielding thelowest drag was found to stabilise the wake in a non-symmetric config-uration, aligned with one of the two diagonals of the base. Similar results in terms of time averaged base pressure distributionwere reported by Perry (2016), testing a square-back model at C*~ 0.2,with W/H~1 and a leading edge radius of r/W~0.10. The timeaveraged velocity field along the model centreline showed strong simi-larities with that seen in the mid-horizontal plane obtained for lateralsymmetry breaking states (Volpe et al., 2015): it features a circular vortexacting close to the upper portion of the base and an elliptical vorticalstructure forming along the bottom shear layer, in proximity to the wakeclosure. For the same geometry, Perry (2016) reported the appearance ofa bi-stable motion, mostly along the lateral direction, when the boundarylayer developing along the lateral surfaces was perturbed by changingthe ride height (0.13≤C*<0.33) and/or altering the shape of the modelfront-end. A comparable topology was reported by Van Raemdonck andVan Tooren (2008), when testing a prismatic model with W/H= 0.74 atC* =0.14. However, no information was provided on the wake dy-namics. Traces of asymmetry in the vertical direction had been previ-ously reported for the wake developing downstream of a square-backAhmed body with W/H=1 by Krajnovic and Davidson (2003), per-forming LES simulations. The asymmetry, however, was found to almostcompletely disappear when the level of refinement of the mesh wasincreased, further suggesting the existence of a strong relationship be-tween the boundary layer development and the wake’s size and topology.A stable vertical asymmetry can also be seen in the experimental resultscollected by McArthur et al. (2016). In this case, although the modelemployed had strong similarities with that considered by Van Raem-donck and Van Tooren (2008), the topology of the wake along the modelcentreline was shown to be a mirror image of that described in the pre-vious cases. One explanation for this may be found in the different shapeof the model front-end, featuring an upper leading edge with a radius(r/W =2.35) almost 20 times larger than radii used for the side andlower leading edges (r/W=0.12). Nevertheless, the short-time wakedynamics described in Volpe et al. (2015) and Pavia et al. (2018) werestill recognisable, with a pumping motion occurring at Stn ~ 0.08 and alateral flapping seen at StH ~ 0.17. For a similar geometry, Castelainet al. (2018), reported a switch from an upwash dominated stable waketo a downwash dominated stable wake when the underbody blockagewas increased from≈ 0% to90%. Forcing the lateral shear layers has been found to be an effective wayto stabilise the wake (Brackston et al.(2016); Pavia et al.(2016)), whilealso reducing drag. In particular, Pavia et al. (2016) pointed out that theapplication of high aspect ratio tapers to the vertical trailing edges of theWindsor body stabilised the wake in a vertically asymmetric state. In these conditions, an improvement of up to 13% was seen in the pressurerecovery over the model rear facing surfaces. A similar gain in terms ofdrag reduction had already been reported for the same configuration byPerry et al.(2015), although with a different time averaged base pressuredistribution. When compared, the time averaged pressure maps pre-sented in Pavia et al. (2016) and Perry et al. (2015) are mirror images,although no evident differences can be found in the experimental setupbetween the two cases. The present work aims to shed some light on the mechanism pro-moting the stabilisation of the wake in such conditions while alsoinvestigating the cause of the discrepancies reported in the literature. Forthis reason, an experimental campaign consisting of balance measure-ments, pressure tappings and PIV acquisitions was carried out in theLoughborough University Large Wind Tunnel, using the same model as inPerry et al.(2015) and Pavia et al. (2016), equipped with side edge taperswith chamfer angles 中s up to 20°. For the model with 中s= 12°, thesensitivity of the wake to variations of the pitch angle a (up to -2°) isalso assessed. 2. Experimental methodology 2.1. The Windsor body The Windsor body employed in the work reported here is as used inPerry et al. (2016) and Pavia et al. (2018) (Fig. 1a). It is a simplifiedgeometry featuring a slanted front-end, forming a 23° angle with the flatroof.Rounded leadingedges, with radii of 50 mm at the nose and 200 mmon the roof, are also employed, to avoid flow separation. These featuresmake this model more representative of mass produced passenger carsthan the Ahmed model (Ahmed et al., 1984), used by Grandemange et al.(2013b), Volpe et al. (2015) and Evrard et al. (2016)). At the scale used inthis work (length L = 1044 mm, width W= 389 mm, height H =289 mm) the Windsor model is approximately equivalent to a 1/4 scalepassenger car. A removable rear section has also been used, allowing thetesting of multiple rear-end shapes. Different side trailing edge tapers have been investigated, following asimilar approach to that of Perry et al. (2015) and Pavia et al.(2016)(Fig. 1a). Each taper has a chord c of 45 mm, giving a fixed aspect ratio ofAR =6.4 (with AR defined as the ratio between the height of the modeland the chord of the taper); slant angles 中, of 0°, 6,12°, 16°, and 20°have been considered, with 中,denoting the angle formed between eachvertical taper and the model's sides. The sensitivity of the wake's topologyand unsteady behaviour to small changes of the model pitch angle hasalso been investigated. When installed in the wind tunnel, the model was connected to the sixcomponent balance located beneath the working section floor via fourpins,consisting of M8 threaded bars. During the tests at zero pitch anglea, the ground clearance was set at 50 mm (C* =0.173 when normalisedwith the model height). The pitch angle was changed by varying thedistance between the model and the ground using the pins connecting themodel with the underfloor balance. Only negative values of a have beenconsidered (model pitched ‘nose down’). The fore-body was lowered byAh, with Ah=(Lp/2)tan(a) (where L, denotes the distance separatingfront and rear pins), whilst the aft-body was raised by the same amount,as depicted in Fig. 1b. A digital inclinometer was used to check theinclination of the model relative to the ground, with an accuracy of±0.2°. The SAE coordinate system (SAE, 2010) is used throughout; the X axisis aligned with the flow in the downstream direction, the Z axis is ver-tical, positive upwards, and the Y axis follows a right handed coordinatesystem. The origin is on the ground plane at mid wheelbase (Lp/2), midtrack (W/2). All the dimensions as well as the coordinates in the refer-ence systems have been normalised using the model height H as referencelength and are denoted with the superscript * throughout the paper. Forthe sake of clarity, the symbol“-”is used to indicate all the timeeraged quantities whilst“~” denotes conditionally averag (a) (b) 2.2. The wind tunnel All experiments were carried out in the Loughborough UniversityLarge Wind Tunnel, (Johl, 2010), at a freestream velocity ofV.。=40 m/s(corresponding to a Reynolds Number ReH of 7.7×10⁵, based on themodel height). The tunnellIfeatures aa1.92m×1.32m×3.6m(Wr×Hr ×Lr)working section, with a fixed floor and no upstream boundary layertreatment. In empty conditions, the freestream turbulence level insidethe test section is approximately 0.2%, with a flow uniformity of ±0.4%of the mean flow value. In this state, the boundary layer thickness at themodel origin is 899=64mm. 2.3. Balance measurements The aerodynamic loads were recorded by means of an Aerotech@ six-component virtual centre balance, located under the working section ofthe tunnel. It features analogue to digital conversion at the load cell tominimise signal degradation, and an automated yaw mechanism with apositional accuracy of ±0.1°. Further information can be found in Johl(2010). The aerodynamic loads were sampled at 100 Hz for 630 s (cor-responding to 8.720-104 convective units t*, with t* =tV./H). Beforestarting to log the data, a 30 s (t*=4.15210) settling time was used forall measurements. All forces have been normalised using Eq. (1): where p is the air density, S is the projected model frontal area (S =0.1124 m²), V. is the freestream velocity. All coefficients have beencorrected for blockage effects using Eq. (2): where B denotes the blockage value (given by the ratio between the model frontal area S and the tunnel working section cross sectional areaSr), equal to 4.4% in the present case. For the sake of simplicity, only thelongitudinal and the vertical component of the aerodynamic force havebeen considered in the present study (Fig. 1a). 2.4. Pressure measurements The pressure acting over the base and the tapers was recorded bypopulating the rearward facing surfaces with a grid of pressure tapsconnected via flexible urethane tubes (with a length of 550 mm) to a pairof Chell CANdaq miniature pressure scanners (with a manufacturerquoted accuracy of ±1.47 Pa), mounted inside the model. Each scannerfeatures 64 piezoresistive pressure sensors, paired to temperature sensorsto allow for the correction of inaccuracies introduced by temperaturedrift. Up to 126 taps were used, depending on the configuration. The tapswere placed with a finer distribution close to the edges of the model andon the tapered surfaces, to get a more accurate representation of thepressure distribution in the regions with the highest gradients (seeFig. 2a). In some cases the pressure distribution along the model cen-treline was also measured. Pressure data was recorded at 260 Hz for 630s (or t*=8.720104).The free-stream dynamic and static pressures were acquired using a Pitot-static tube mounted at the start of the test section, 1.87 m (or 6.47 timesthe model height H) upstream of the model, 100 mm beneath the tunnelroof. Pressure signals were corrected for magnitude and phase distortionscaused by the tubing applying the correction already used in Wood(2015) and based on the method proposed by Sims-Williams and Dominy(1998). Once the pressure coefficients were calculated according to Eq.(3), where Po. is the freestream static pressure, the results were corrected forblockage using the MIRA correction (based on continuity) using Eq.(4): (a) (b) Fig. 2. Representation of the model base with the locations of the pressure taps and PIV planes considered in the present work: a two scanner arrangement combinedwith the locations of the 2D-2C PIV planes; b single scanner arrangement combined with the locations of the 2D-3C PIV cross-planes. The base is located at x*=1.81from the origin of the reference system defined in Fig. 1. The red square on the model base denotes the area associated with the ith tap used for the estimation for the area weighted drag. (For interpretation of the references to colour in this figure legend, the reader is referred to the Web version of this article.) where Cp is the time averaged value of the pressure coefficient recordedby the ith tap and S; is the projection of the area associated with the sametap on a plane orthogonal to the direction of the onset flow (see Fig.2). Since the flow field analysed in the present study is highly sensitive toany asymmetry present in the experimental setup, the model was yawedto the onset flow until the most symmetric base pressure distribution wasachieved, following a similar procedure to that adopted by Evrard et al.(2016) and Pavia et al. (2018). The resulting value of 平 was assumed tobe where the model axis and onset flow axis were aligned.The regionswith the highest level of unsteadiness were localised considering thedistribution of the root mean square of the pressure fluctuation(RMS(AG,)) over the model base, calculated as follow: where C" denotes the nh value recorded in time by the ih tap and N.indicates the number of samples in time. Proper Orthogonal Decomposition (POD) was used to isolate the mainfeatures of the unsteady pressure field, following the same approachproposed by Lumley (1967). A generic dataset F(x, t) is decomposed as: where N indicates the number of measurement points in time, Fo themean of the considered field and f(x,t) its fluctuating components. Thebasis functions "(x) are the so called‘PODmodes’ and are defined as theeigenfunctions of the covariance matrix R(x,x): where X is a matrix with and N, refers to the number of points sampled in space. The basis func-tions n(x) can therefore be determined by solving the eigenvalueproblem: with A...A". The eigenvalues A" associated with the POD modes arerepresentative of the energy content E of the fluctuations captured byeach mode. A low order model can then be written as: with M 0, Fig. 11a). This highlightsthe establishment of a multi-stable condition, that presents some similarities with that reported by Rigas et al. (2014) and Gentile et al.(2016) in the case of axisymmetric bodies. The new attractor eventuallybecomes the only state for 中s=12° (Fig. 11b). In this case, the pointstend to concentrate in the portion of the scatter plot with AvsB > 0 and,although there is a higher level of dispersion compared to that seen inprevious cases, the two attractors reported for the square-back configu-ration (Pavia et al., 2018) are no longer visible. All these changes result innoticeable variations in the long-time evolution of the wake, as seen oncethe phase averaged low order model is considered. The model was con-structed using only the time averaged field and the first three POD modes(with the fluctuating term of Eq.(11) ordered in phase and averaged inbins of 15°). Two lateral symmetry breaking states are still clearly visiblefor中s=6°(Fig.12). Nevertheless, the reflectional symmetry preservingstates seen in Pavia et al. (2018) at0=n/2 rad and 0=3/2n rad are nolonger mirror images of each other. A downwash dominated state isvisible for 0=n/2 rad, that eventually becomes the only stable config-uration for中s ≥ 12°(Fig. 13). In these conditions, the wake appears to belocked in a vertical symmetry breaking configuration (0= n/2 rad inFig.13), with a swinging motion around this state evident throughout the Fig. 11. Scatter plot of the POD temporal coefficients associated with the LSB mode and the VSB mode for 中s=6°(a) and 中s=12°(b), referring to the PIV datarecorded at x* =2.31. The dashed circle represents the fitting function used for sorting the snapshots in phase (see Eq. (17)). different phase angles. However, coherence is lost (i.e. the vorticalstructures burst into smaller eddies) whenever the wake tries to switch toa lateral symmetry breaking state. The transition between a laterally asymmetric bi-stable wake and a stable wake,asymmetric in the verticaldirection, is consistent with that found by Barros et al. (2017) whenperturbing the underbody flow of an Ahmed body with a similar aspect LSB Mode VSB Mode (a) (b) (c) ratio.Less evident changes are seen in the dynamics of the global oscil-lating modes reported by Grandemange et al. (2013b), Volpe et al.(2015) and Pavia et al. (2018). The application of tapers to the modelvertical trailing edges does not seem to affect the vertical flapping. Aninflection point around StH =0.20 is seen in the PSD plot obtained for thetemporal coefficients associated with the vertical symmetry breakingmode, for all the chamfer angles considered in the present investigation(Fig.14b). No variations in either location or amplitude of this point areobserved as 中, is increased. More significant changes are reported for thelateral flapping. As the side shear layers are deflected inwards by theinflow generated by the tapered surfaces and the gap separating them isreduced, stronger aerodynamic interactions are observed between thetwo sides of the model. This ultimately results in a strengthening of thewake's oscillations in the lateral direction, as highlighted by the growthin amplitude of the peak seen at Stn ~0.17 in the PSD plot obtained forthe temporal coefficient referring to the lateral symmetry breaking PODmode (Fig. 14a). Furthermore, the frequency at which the peak is locatedis seen to change with the taper angle, shifting from StH =0.13 for thesquare-back configuration (Volpe et al. (2015) and Pavia et al. (2018)) toStH =0.17 for中s ≥ 12. The latter frequency was also reported byMcArthur et al. (2016) when studying the dynamics of the wake down-stream of a square-back body with H> W. For chamfer angles graterthan 12°, this mode becomes so strong that the frequency peak at StH=0.17 becomes the only one visible in the spectrum of the temporal co-efficient related to the symmetry preserving mode (Fig.14c), whereas asmall hump can be seen for 中s ≤12° around at Stn=0.07, correspondingto the wake pumping described in Duell and George (1999), Volpe et al.(2015) and Pavia et al. (2018). The peak at StH=0.068 for 中s=20°appears to be different; and is in fact a sub-harmonic of the fan bladepassing frequency at a tunnel speed of 40 m/s (Baden Fuller, 2012). 5. Sensitivity of the wake dynamics to small variations of themodel pitch angle As already discussed in 83, the trend observed in the present inves-tigation between the drag of the entire model Cp and the side taper angles appears to be in good agreement with that described in the work ofPerry et al. (2015) for a similar case. Nevertheless, noticeable differencesare observed in the pressure distribution on the model rearward facingsurfaces. The pressure maps reported in Perry et al. (2015) for differentvalues of 中, are all characterised by a positive pressure gradient in thevertical direction, with the region of lower pressure located close to thebottom trailing edge. This appears to be in contrast with the results obtained here, that show a wake asymmetric in the vertical direction, butwith Gn<0(Fig. 5). To explain the origin of these discrepancies, bearingin mind the high level of sensitivity shown by axisymmetric bodies'wakes to small variations of the pitch angle (Grandemange et al. (2012),Wolf and Stumpf (2014) and Gentile et al. (2017)), an investigation intothe effects of small changes of the model pitch angle a on the main timeaveraged and unsteady features of the wake was carried out. For the sakeof simplicity the chamfer angle was fixed at 12°. The model was pitched‘nose down’(a<0°) in order to force the wake to switch from thedownwash dominated configuration described in 83 to an upwashdominated state. Pitch angles of -1°and -2° were considered. During the experiment, the pressure acting on the model base wasrecorded using a single scanner, as discussed in 82.4. A second scannerwas employed to determine the pressure distribution on the model cen-treline. 33 pressure taps were used in this case, with a finer distribution inthe locations where the strongest pressure gradients were expected. Thetime averaged C data are presented in Fig. 15. The decrease of o is shownto yield a reduction in the static pressure recorded on the model under-body. This is particularly visible at the bottom leading edge of the model'snose, where the suction for a =0.0° is further accentuated. The pressurethen gradually increases while moving downstream, although the valuesof Cp measured close to the model trailing edges for the pitched config-urations are still≈ 30% lower than those recordedat a=0.0°. A pressure Fig. 15. Centreline pressure distribution for the configuration with 中s=12,tested at a=0.0°,a=-1.0° and α= - 2.0. The symbol ‘*’denotes the tapslocated on the upper surfaces whilst‘o’refers to the taps placed on the lower halfof the model. increase of similar magnitude is observed on the upper surfaces, furtherconfirming the upwards shift in the location of the front stagnation point.As a result, the pressure difference between the upper and lower surfacesin the region of the model trailing edges is seen to increase. For a=- 1, a positive pressure gradient is observed on the modelbase in the vertical direction (Table 1). Nevertheless, the magnitude of 0Cp/0z* is ≈ 36% lower than that measured at a =0.0°, suggesting a moreuniform pressure distribution. In these conditions, a 4.7% drop isobserved in the base pressure drag (CDBase). A region of lower pressurestarts to form close to the bottom trailing edge (Fig, 16a), matching thatshown in the contour plots presented in Perry et al. (2015), and thenincreases in size and strength when the pitch angle is further decreased(Fig, 16b, first column), resulting in a vertical pressure gradient evenstronger in magnitude that recorded at α=0°(Table 1). At the sametime,CD is reported to increase by 8.1% over the same case. As previously discussed in 83, the changes in pressure distributionobserved on the base are the result of modifications in the time averagedwake topology. In particular, the wake is seen to rotate around the centreof the model base as ais decreased (Fig. 16). No significant variations areobserved in the curvature of the side shear layers in the 2D - 2C PIV dataat z*=0.67. The symmetry in the vertical direction is almost fully restored for a=- 1.0°. This is particularly evident when looking at the PIV vertical mid-plane (Fig.17a) and the cross-plane located downstream of the wakeclosure (x*=3.31 in Fig.16a).Something different, however, is seenwhen the cross-plane located at x* = 2.31 is considered (Fig.16a). In thislocation the wake is aligned along a diagonal running from the bottom-left corner to the top-right corner of the model base. This is similar tothat seen in 83 for the configuration with the 6°side edge tapers, althoughthe alignment in that case is with the opposite diagonal. Unlike thatobserved in 83, however, bigger discrepancies are seen when the waketopology captured on this plane is related to the base pressure distribu-tion. From the location of the two vortical structures seen at x*=2.31,one would expect a larger suction on the left-hand side of the base and abetter pressure recovery on the opposite side. Instead, a good level of Table 1 Vertical pressure gradient for different values of the model pitch angle a.0Cp/0z*was determined considering two taps located on the centreline of the base at z*=0.490 and z* =0.856. α=0.0° a=-1.0° α=-2.0° 0Cp/oz* -0.177 0.114 0.206 lateral symmetry is observed in the pressure map reported in Fig. 16a.The reason for these differences is that the duration of the PIV recordingsis Tsamp ~ 137 s, compared to Tsamp =630 s for the pressure tappingacquisition, and, with an average time between switches of over 5 s, theresults have been biased towards one state. In addition, as a bi-stable ormulti-stable condition is approached, the effect of small misalignments inthe experimental setup tends to be amplified, increasing the occurrenceof a particular state. This has already been observed in the case of vari-ations of the yaw angle (Volpe et al. (2015); Evrard et al.(2016); Paviaet al. (2018)), and, in analogy with that seen in the case of axisymmetricbodies by Gentile et al. (2017), seems also to apply to changes in the pitchangle. The long-time instability, that almost completely disappears when 12°side tapers are applied to the model at 0° pitch (see 84), gains strengthwhen the model pitch angle is changed to a=-1.0° and the symmetry inthe vertical direction in the time averaged wake topology is recovered.This becomes clear when looking at the unsteady results presented inFig. 17a. As the symmetry in the vertical direction is restored, a moreeven distribution of turbulent kinetic energy can be observed betweenthe two horizontal shear layers. Indeed, having a similar amount ofturbulent activity between two opposite shear layers seems to be anecessary condition for the wake symmetry. An increase in the level ofunsteadiness can also be noticed on the base. The region of high pressurefluctuation is reported to increase in size and the highest values ofRMS(AG) tend to cluster around two lobes, similar to that seen in thecase of bi-stable wakes. A larger scatter is observed in the values of Cprecorded in this region. Indeed, as shown in Fig. 18a, the PDF of the Fig. 16. Time averaged results for the configuration with 中s=12°, tested at a=-1.0° (a) and α=-2.0° (b). Clockwise from top left: x*=1.81 base pressuredistribution; x*=2.31 and x*=3.31 PIV stereo cross-planes; z*=0.67 PIV horizontal mid-plane. All PIV fields are coloured according to the values of the axialcomponent of the velocity u*; the streamlines refer to the in-plane components of the velocity. Fig. 17. Base pressure fluctuations and non dimensional turbulent kinetic energy (at y*=0.00) for the configuration with 中s =12°, tested at a=-1.0°(a), a=-2.0° (b). signal recorded by one of the taps located in this area tends towards a bi-modal distribution, similar to that reported in Pavia et al. (2016) for thesquare-back case. But the similarities with the square-back configurationgo further than that. Strong analogies between this case and that studiedin Pavia et al. (2018) are seen in the distribution of the fluctuating energybetween the first three modes (Fig. 18), with the lateral symmetrybreaking mode alone accounting now for at least 60% of the energy, andin the shape of the spatial functions associated with the modes them-selves. As shown in Fig. 19a and b, the first two orthogonal symmetrybreaking modes extend for the entirety of the base as well as the wakecross-section measured at x*=2.31, further confirming the analogieswith the square-back case investigated in Pavia et al. (2018). Similarconsiderations apply to the symmetry preserving mode, whose energylevel is more than 60% higher than that reported at a=0.0° (Fig.18b).Furthermore, two planes of symmetry can be seen in the spatial functionrelated to this mode when the PIV cross-plane located at x*=2.31 isconsidered (second row in Fig.19c). Unlike that seen in Pavia et al.(2018), however, the two planes are not aligned with the two symmetryplanes of the base but form an angleof~ 45°. This may be related to thefact that in this case the time averaged wake appears to be orienteddiagonally. The re-activation of the long-time instability is accompanied with theappearance of multiple states. This is clear when looking at the scatterplot between the temporal eigenvectors related to the two symmetrybreaking modes, reported in Fig. 21a. Unlike that seen for the modeltested at a=0.0° (Fig. 11b), the points on the AvsB,ALsB plane tend nowto cluster around multiple attractors, resulting in aU’ shaped cloudsimilar to that seen for the configuration equipped with 6° side edge ta-pers (Fig. 11a), apart from the fact that the third attractor is now locatedin the lower half of the plot (AvsB <0) rather than being in the upper portion (AvsB >0). The wake now switches between two lateral sym-metry breaking states and a vertical symmetry breaking state, as shownin the phase averaged low order model reported in Fig. 22, constructedusing the dataset recorded at x*=2.31 following the proceduredescribed in 84. Another difference with the multi-stable case discussedin $4 is the fact that the vertical symmetry breaking state (now observedat 0=3/2n) appears to be upwash dominated rather than downwashdominated. This is linked to the different distributions seen in the scatterplot on the AvsB, AisB plane between the these two cases. From the plotspresented in Fig. 22, it can also be noticed that only one symmetry pre-serving state is retained (0=n/2 in Fig. 22). As pointed out in previouscases, this state is still characterised by the presence of four recirculatingstructures. These structures, however, are now diagonally aligned,spanning from the bottom-left corner to the top-right corner of the base,following the same orientation seen for the symmetry preserving mode. From that seen so far, it can be inferred that the reduction in base dragobserved at a=-1.0° has to be ascribed mainly to the symmetrisation ofthe time averaged wake rather than being a consequence of the sup-pression of the long-time instability, which in fact appears to be muchstronger than that seen at a =0.0°. The upwash dominated, vertical symmetry breaking state becomeseventually the only state when the pitch angle of the model is decreasedto α=-2.0° (Fig. 23). In these conditions, the wake locks into a stablestate, which appears to be the mirror image of that depicted in Fig. 7d forthe same configuration tested at a=0.0. The level of unsteadiness seenin the pressure field recorded on the model base, as well as in the velocityfield measured at y* =0.00, is greatly reduced compared to that seen fora=-1.0°. Fluctuations are now limited to the region around the topshear layer (Fig.17b). This is the only portion of the flow field wherecoherent motions in the lateral (LSB), vertical (VSB) and longitudinal (a) (b) 中c 0.15 0.09 0.03 -0.03 -0.09 -0.15 0(×10) 0.5 Jo 0.5 0 Fig. 19. Spatial distribution of the POD modes extracted from the base pressure distribution (top row) and PIV cross-plane at x* =2.31 (bottom row) for theconfiguration with 中s= 12°, tested at a=-1.0°. The modes are ordered according to their topology: a lateral symmetry breaking mode (LSB), b vertical symmetrybreaking mode (VSB),c symmetry preserving mode (SP). refers to the magnitude of the spatial eigen-modes extracted from the field of the pressure fluctuation.The eigen-functions related to the velocity fluctuation are coloured according to the values of the through plane component . whereas the streamlines are drawnconsidering the in-plane components o and qw. (b) VSB mode Fig. 20. Spatial distribution of the POD modes extracted from the base pressure distribution (top row) and PIV cross-plane at x*=2.31 (bottom row) for theconfiguration with 中s=12°, tested at a=--2.0°. The modes are ordered according to their topology: a lateral symmetry breaking mode (LSB), b vertical symmetrybreaking mode (VSB), c symmetry preserving mode (SP). refers to the magnitude of the spatial eigen-modes extracted from the field of the pressure fluctuation.The eigen-functions related to the velocity fluctuation are coloured according to the values of the through plane component h. whereas the streamlines are drawnconsidering the in-plane components . and q. (a) (b) Fig. 21. Scatter plots of the POD temporal coefficients associated with the LSB mode and the VSB mode for the configuration with 中s=12°, tested at a=-1.0°(a)and a=-2.0° (b). The dashed circle represents the fitting function used for sorting the snapshots in phase (see Eq. (17)). Data referring to the PIV cross-plane recordedat x* =2.31. Q:-2.0-1.5-1.0-0.5 0.00.51.0 1.52.0 Fig. 22. Low order phase averaged velocity field at x*= 2.31 for the configuration with 中s =12°, tested at a=-1.0°. The plots are coloured according to the valuesof the normalised streamwise component of the vorticity; the streamlines are drawn considering the in-plane components of the velocity field. Q: -2.0-1.5-1.0-0.50.00.51.0 1.52.0 however, the mode associated with this frequency appears to be linkedwith a swinging motion of the horseshoe vortex depicted in Fig. 7daround the rear stagnation point, rather than being the result of analternated ‘stretching'and ‘squeezing' in the streamwise direction alone.The coherence analysis performed at Stn ≈0.08 between one of the tapsclosest to the rear stagnation point and all the remaining pressure sensorsplaced on the base shows indeed the presence of a large region withrelatively good coherence (A>0.1) and a phase angle x(f)≈n/2 rad,which seems to be compatible with the existence of such a motion. This isobserved at a=0.0° (Fig. 24d) as well as a=-2.0(Fig.24e). A different trend is observed for the non-dimensional frequencyassociated with the vertical flapping. The PSD plot obtained for thetemporal coefficient related to the vertical symmetry breaking POD mode(Fig. 25b), shows that the frequency characteristic of this motion dropsfrom StH=0.20 to StH =0.17 when the symmetry in the vertical direc-tion is recovered in the wake and the gap separating the top and bottomshear layers is widened (at a= - 1.0°), then increases to StH =0.21when the pitch angle of the model is changed to a=-2.0°and anupwash dominated wake is formed. 6. Summary and conclusions In this paper, the aerodynamic effects produced by high aspect ratiotapers applied to the side trailing edges of a simplified square-back bodywithout wheels have been investigated. The tapered surfaces have beenshown to trigger a switch from a laterally asymmetric bi-stable wake to astable wake, asymmetric in the vertical direction. The wake has beenobserved to retain a topology similar to that described in Pavia et al.(2018) for the lateral symmetry breaking states downstream of the sim-ple square-back configuration (with no tapers), although rotated by 90°.As the chamfer angle中s is increased, the horizontal pressure gradientseen in the case of lateral symmetry breaking states is replaced by a(negative) vertical pressure gradient, being the result of the formation ofa downwash dominated wake. A~ 6% drag reduction compared to the square-back case is reportedfor taper angles between 6° and 12°. This gain is ascribed to the circularvortex, responsible for the suction zone visible in any symmetry breakingstate, that tends to ‘stretch’in the streamwise direction, resulting in a ~15% reduction of the base pressure drag. No particular changes areobserved in the short-time wake dynamics, except from a noticeablestrengthening of the lateral flapping motion, as a consequence of thehigher level of interactions between the two lateral shear layers, and aweakening of the pumping motion as 北 is increased. A better understanding of the transition from a laterally asymmetricbi-stable wake to a stable wake, asymmetric in the vertical direction, hasbeen achieved by applying the phase averaged low order model alreadyused in Pavia et al. (2018). For 中s=6°, the wake has been observed toswitch between two lateral symmetry breaking states and a verticalsymmetry breaking state, resulting in a multi-stable condition that pre-sents some similarities with that reported by Rigas et al. (2014) andGentile et al. (2016) in the case of axisymmetric bodies. The latter stateeventually becomes the only stable configuration of the wake for中s≥12°. In these conditions the wake loses coherence every time thevortical structures come closer to the side shear layer. The long-timeinstability is replaced by a swinging motion around the rear stagnationpoint, with a characteristic frequency of StH ~ 0.015. A similar change isseen in the mode associated with frequency peak located at StH =0.08. The transition between these two scenarios is consistent with thatfound by Barros et al. (2017) when perturbing the underbody flow of asimilarly shaped body. The fact that a similar behaviour can be obtainedregardless of the shear layer to which the perturbation is applied,sug-gests that the long-time instability is indeed the result of the establish-ment of a condition of equilibrium among all four shear layers boundingthe wake. This may also explain the link between the orientation of thelong-time symmetry breaking mode and the model aspect ratio found byGrandemange et al. (2013a). The fact that the wake is seen to switchlaterally for W> H and vertically for W
确定
还剩17页未读,是否继续阅读?

产品配置单


北京欧兰科技发展有限公司为您提供《带侧后缘锥度方型背车辆中尾流动力学检测方案(CCD相机)》,该方案主要用于其他中尾流动力学检测,参考标准--,《带侧后缘锥度方型背车辆中尾流动力学检测方案(CCD相机)》用到的仪器有LaVision HighSpeedStar 高帧频相机、德国LaVision PIV/PLIF粒子成像测速场仪、LaVision DaVis 智能成像软件平台
推荐专场
CCD相机/影像CCD
更多


相关方案
更多
该厂商其他方案
更多