


方案详情
文
In January 2004, Memorial University purchased a stereoscopic Particle Image Velocimetry
(PIV) system for making flow measurements. Although the system was potentially very
versatile, its primary application was envisioned to be in a towing tank. The system was
supplied as a complete package of hardware and software for calibration, data collection and
analysis. The intention of the PIV system designers was to collect as many data frames as
possible for a fixed measurement plane location, relative to the model. This required the PIV
system to be fixed on the towing carriage, moving with the model being studied. It was found
during some preliminary experiments that an active seeding delivery system was necessary to
ensure sufficiently high seeding particle concentration, especially when measuring flow
velocities around a model hull with a large yaw angle. This paper describes the development of
a seeding technique for a PIV system that can be used in a towing tank. The paper also includes
an estimate of the uncertainty of the measurement system, including the analysis of the flow
behind the device used to deliver seed particles into the flow.
方案详情

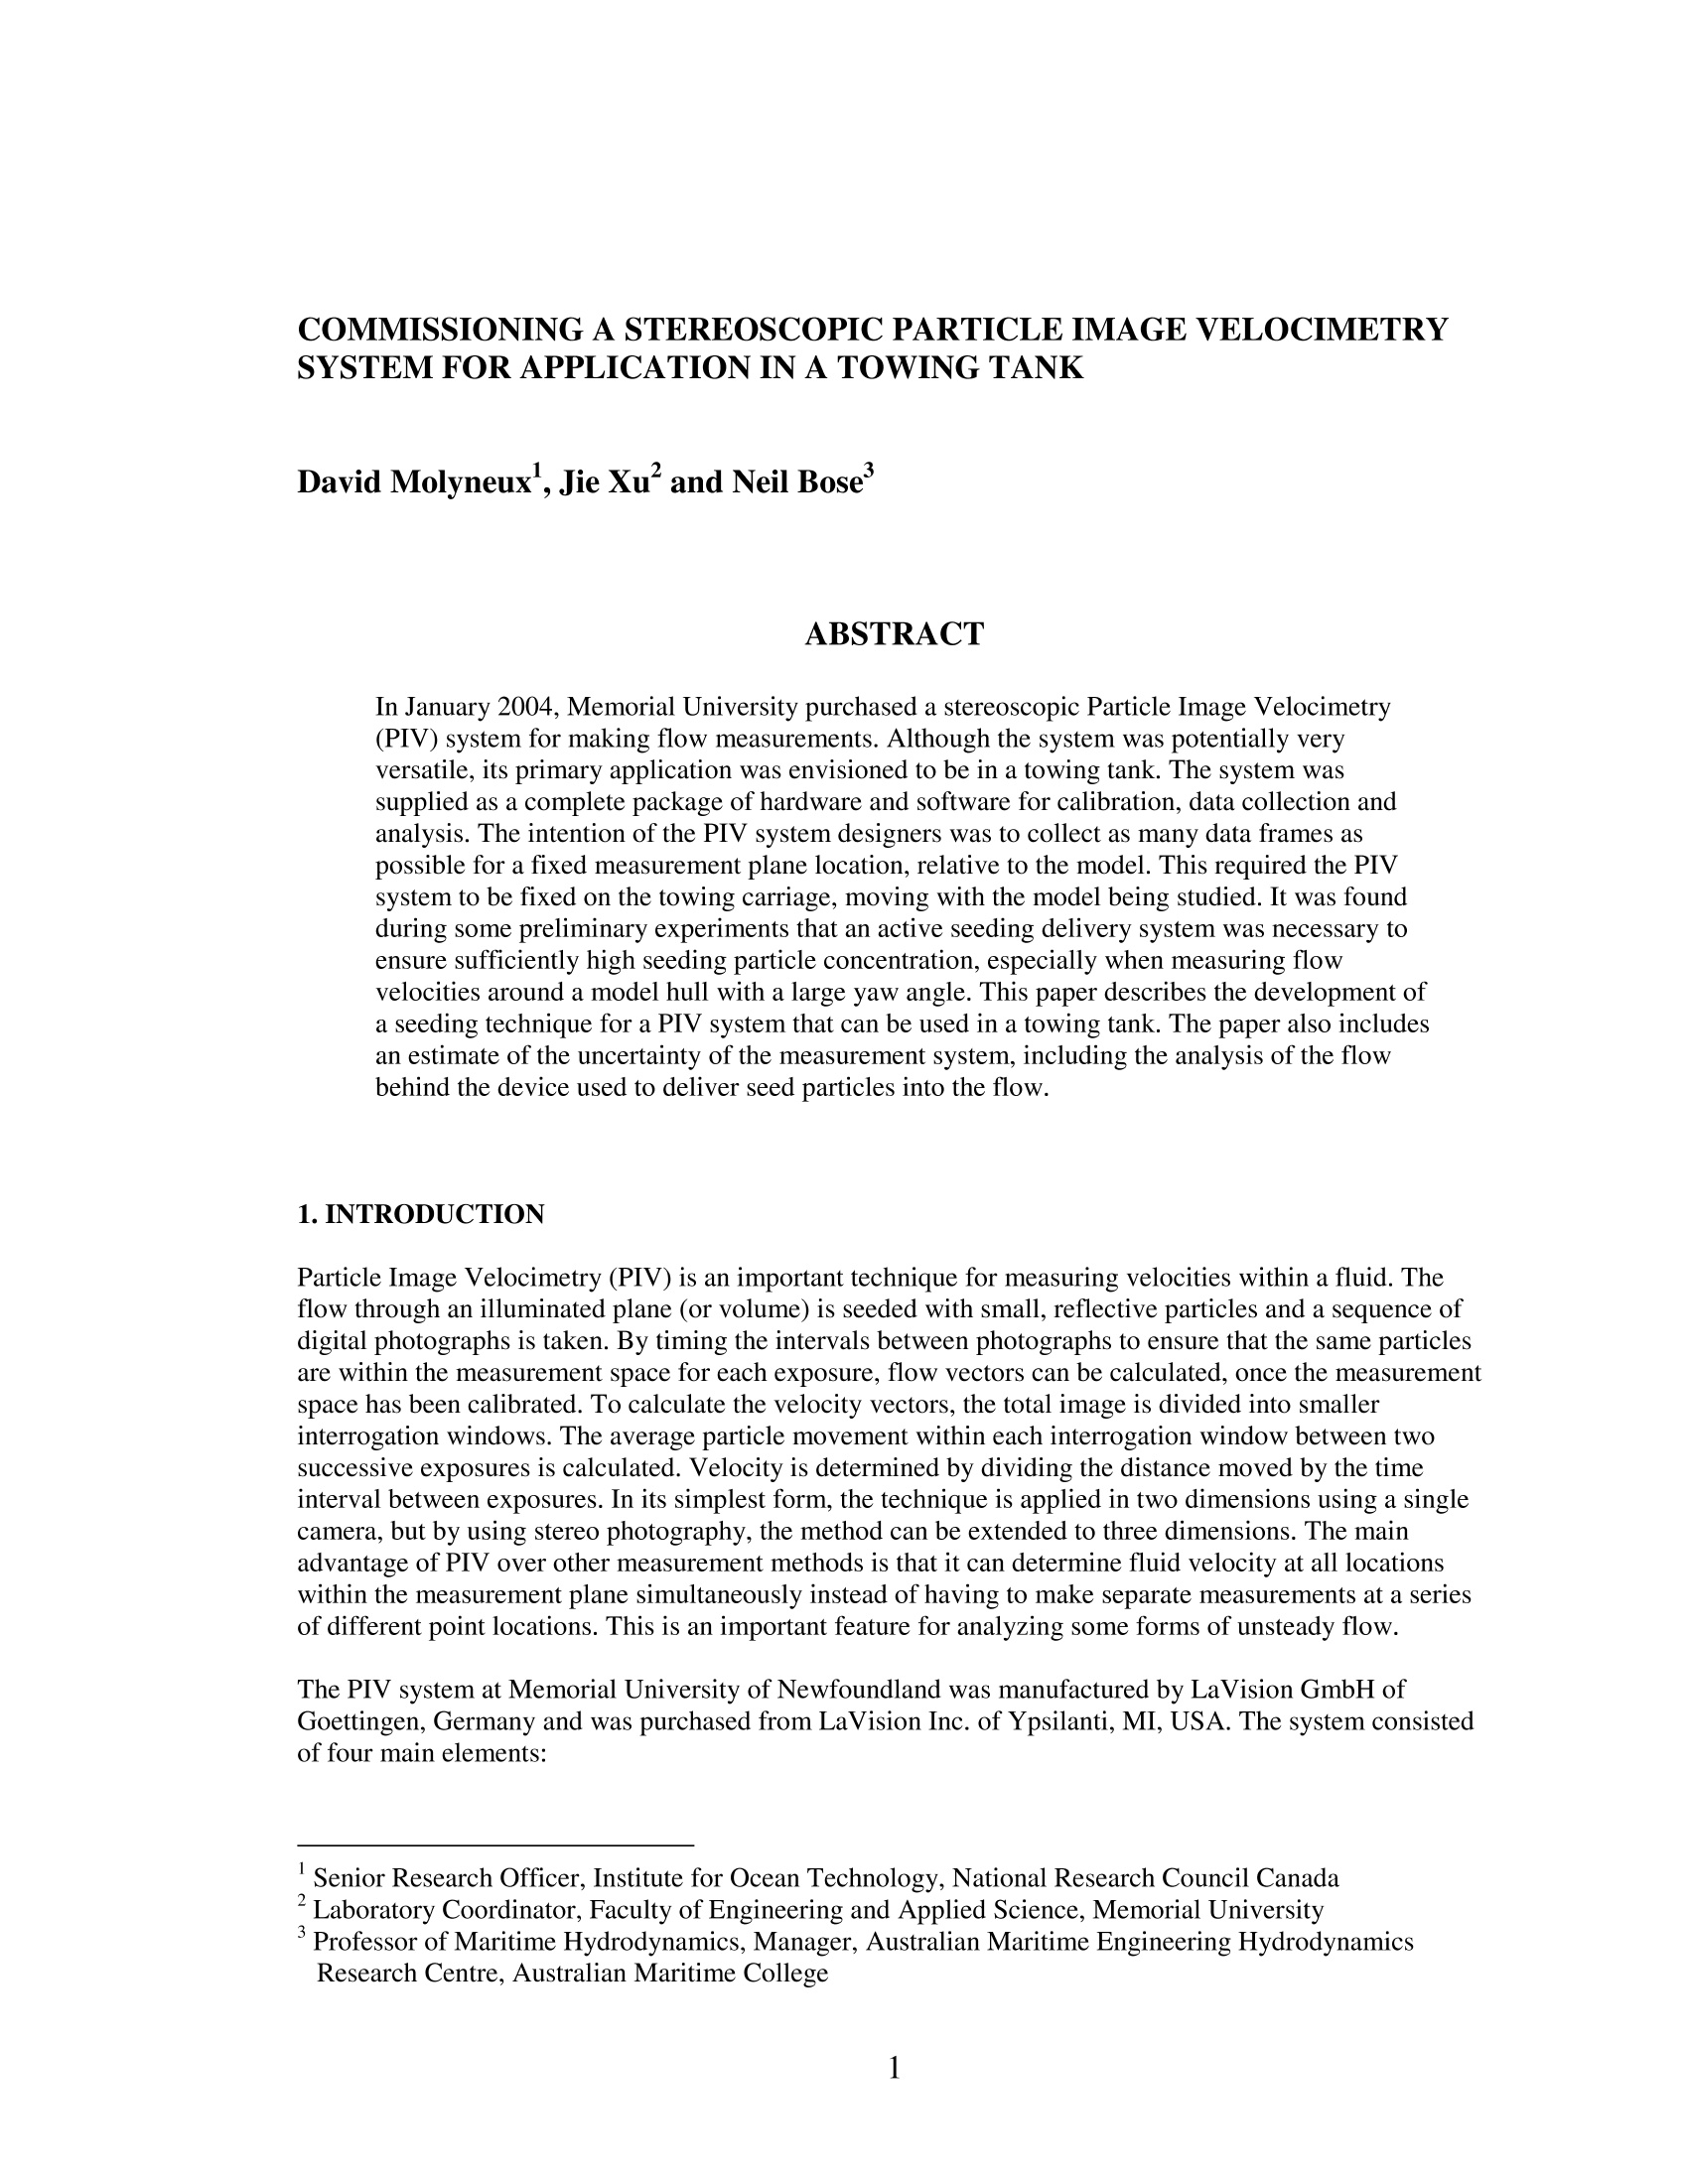
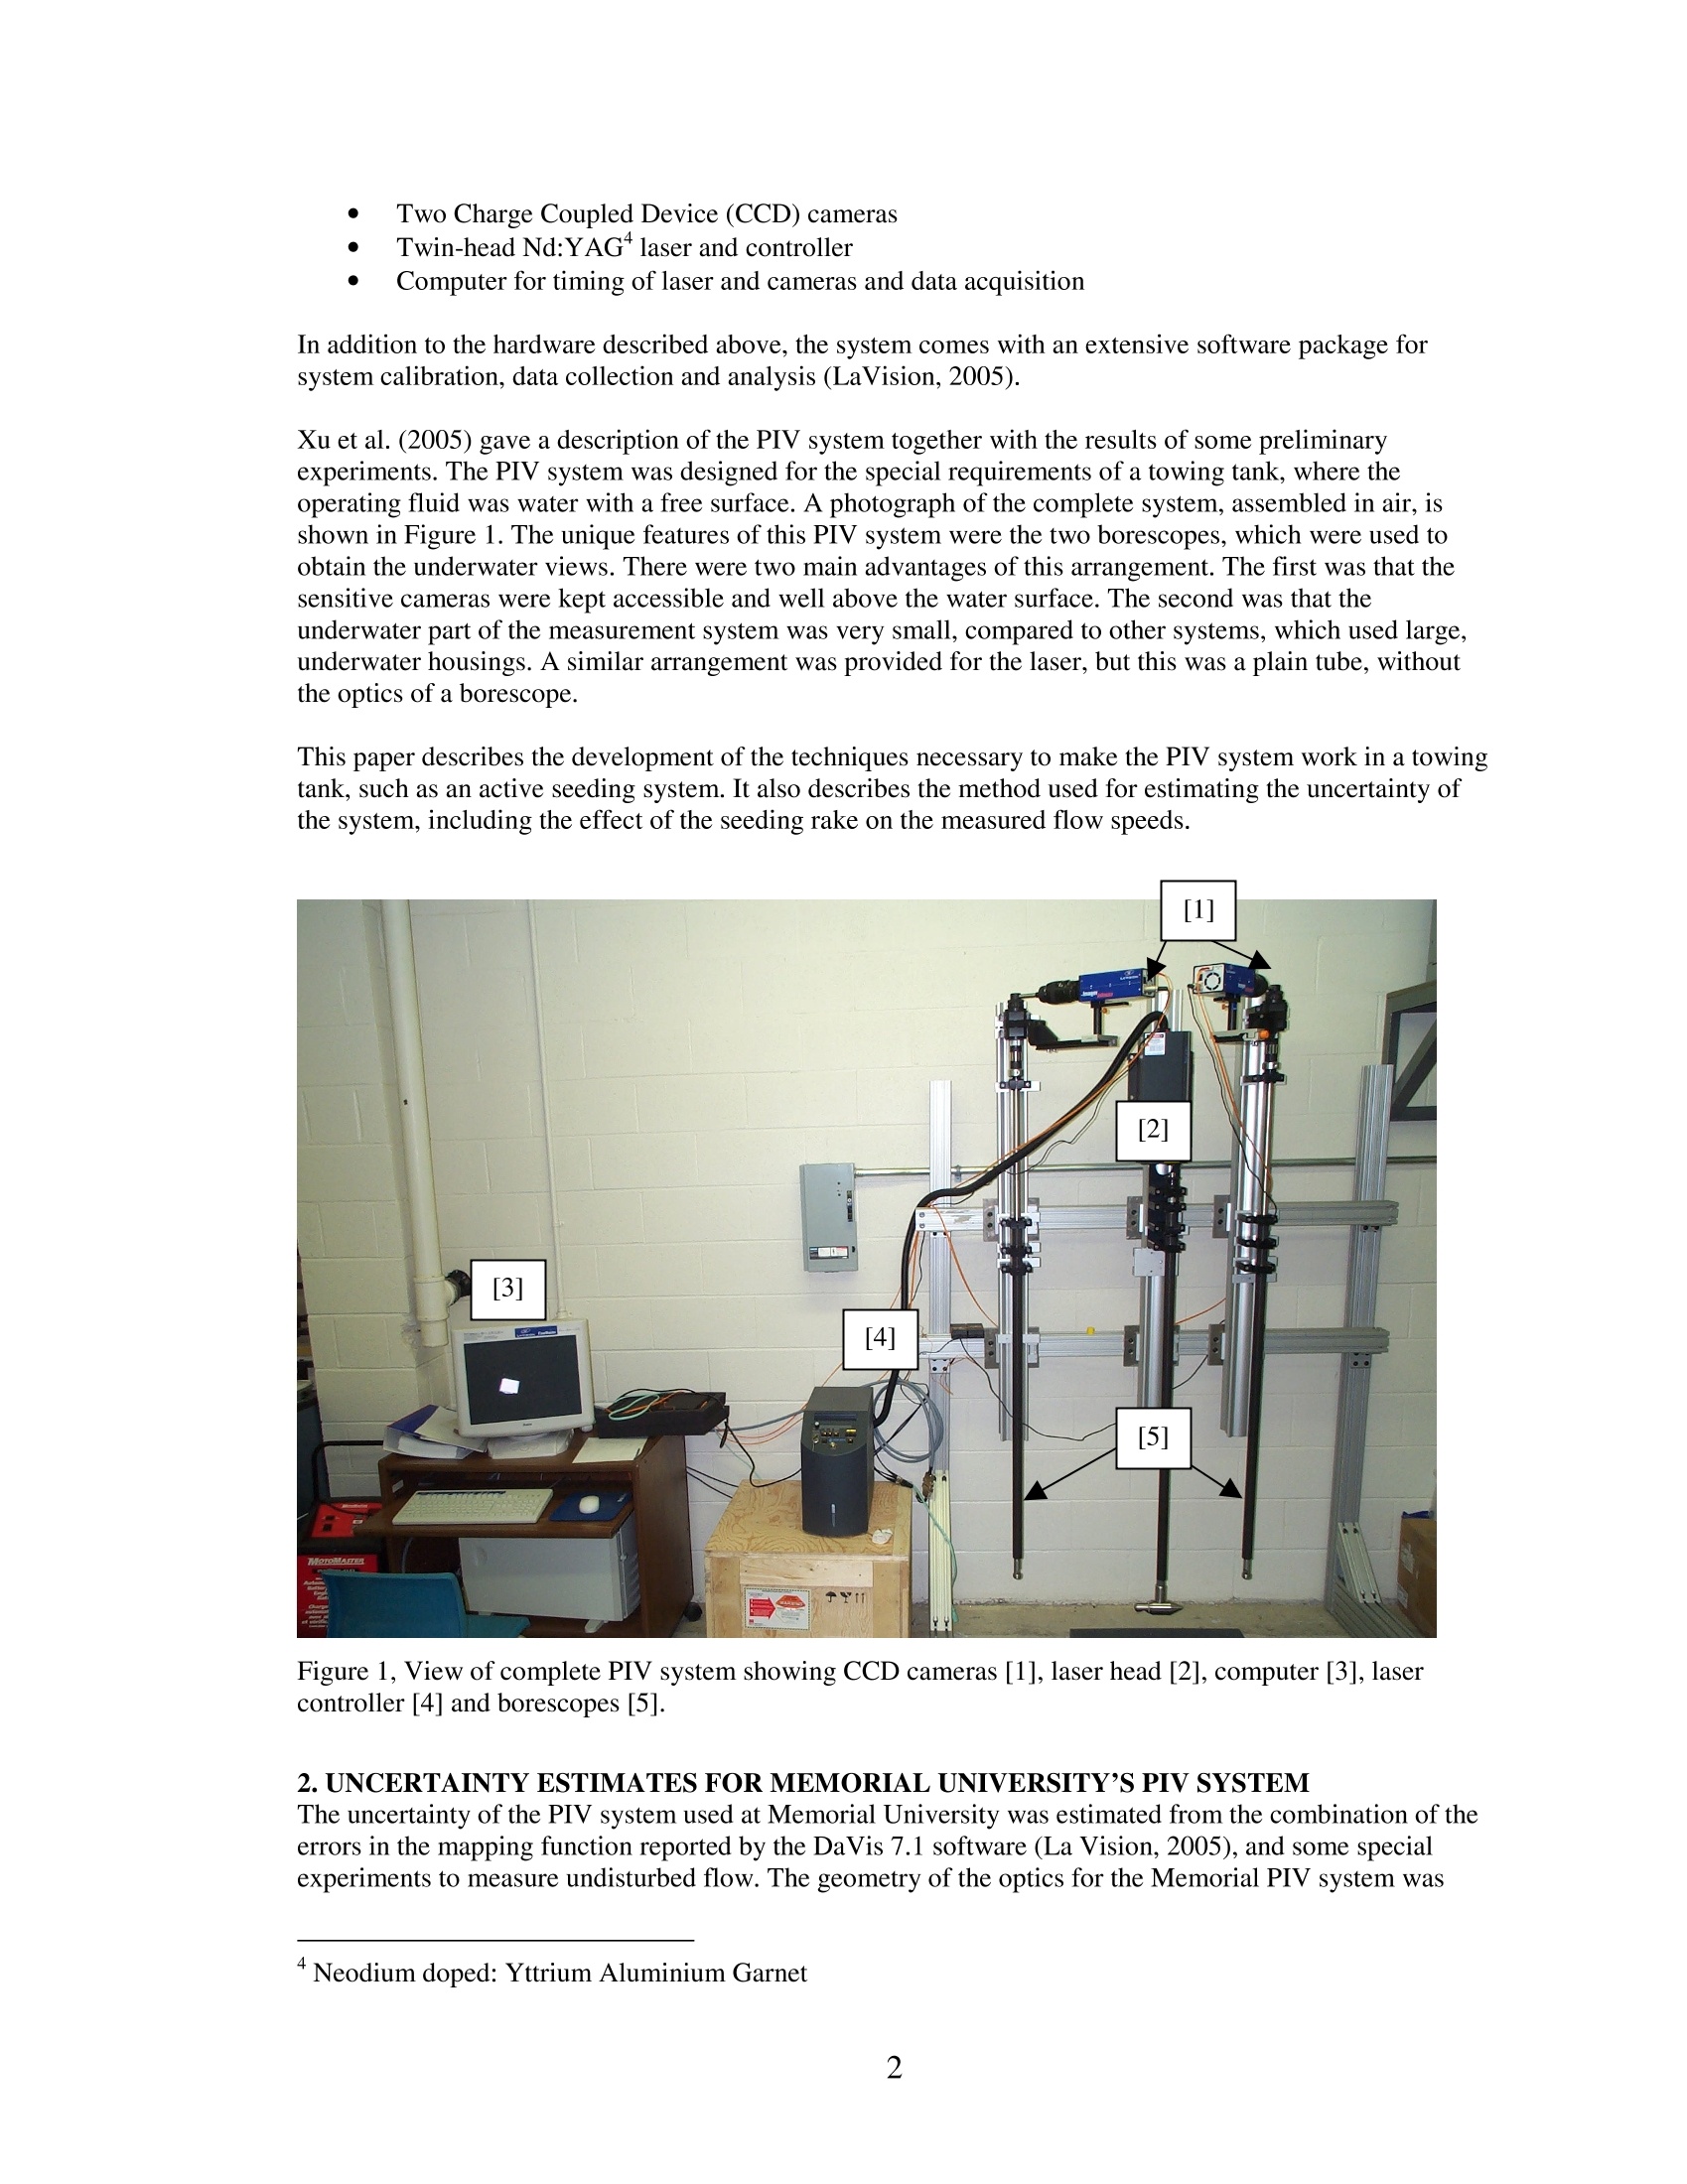
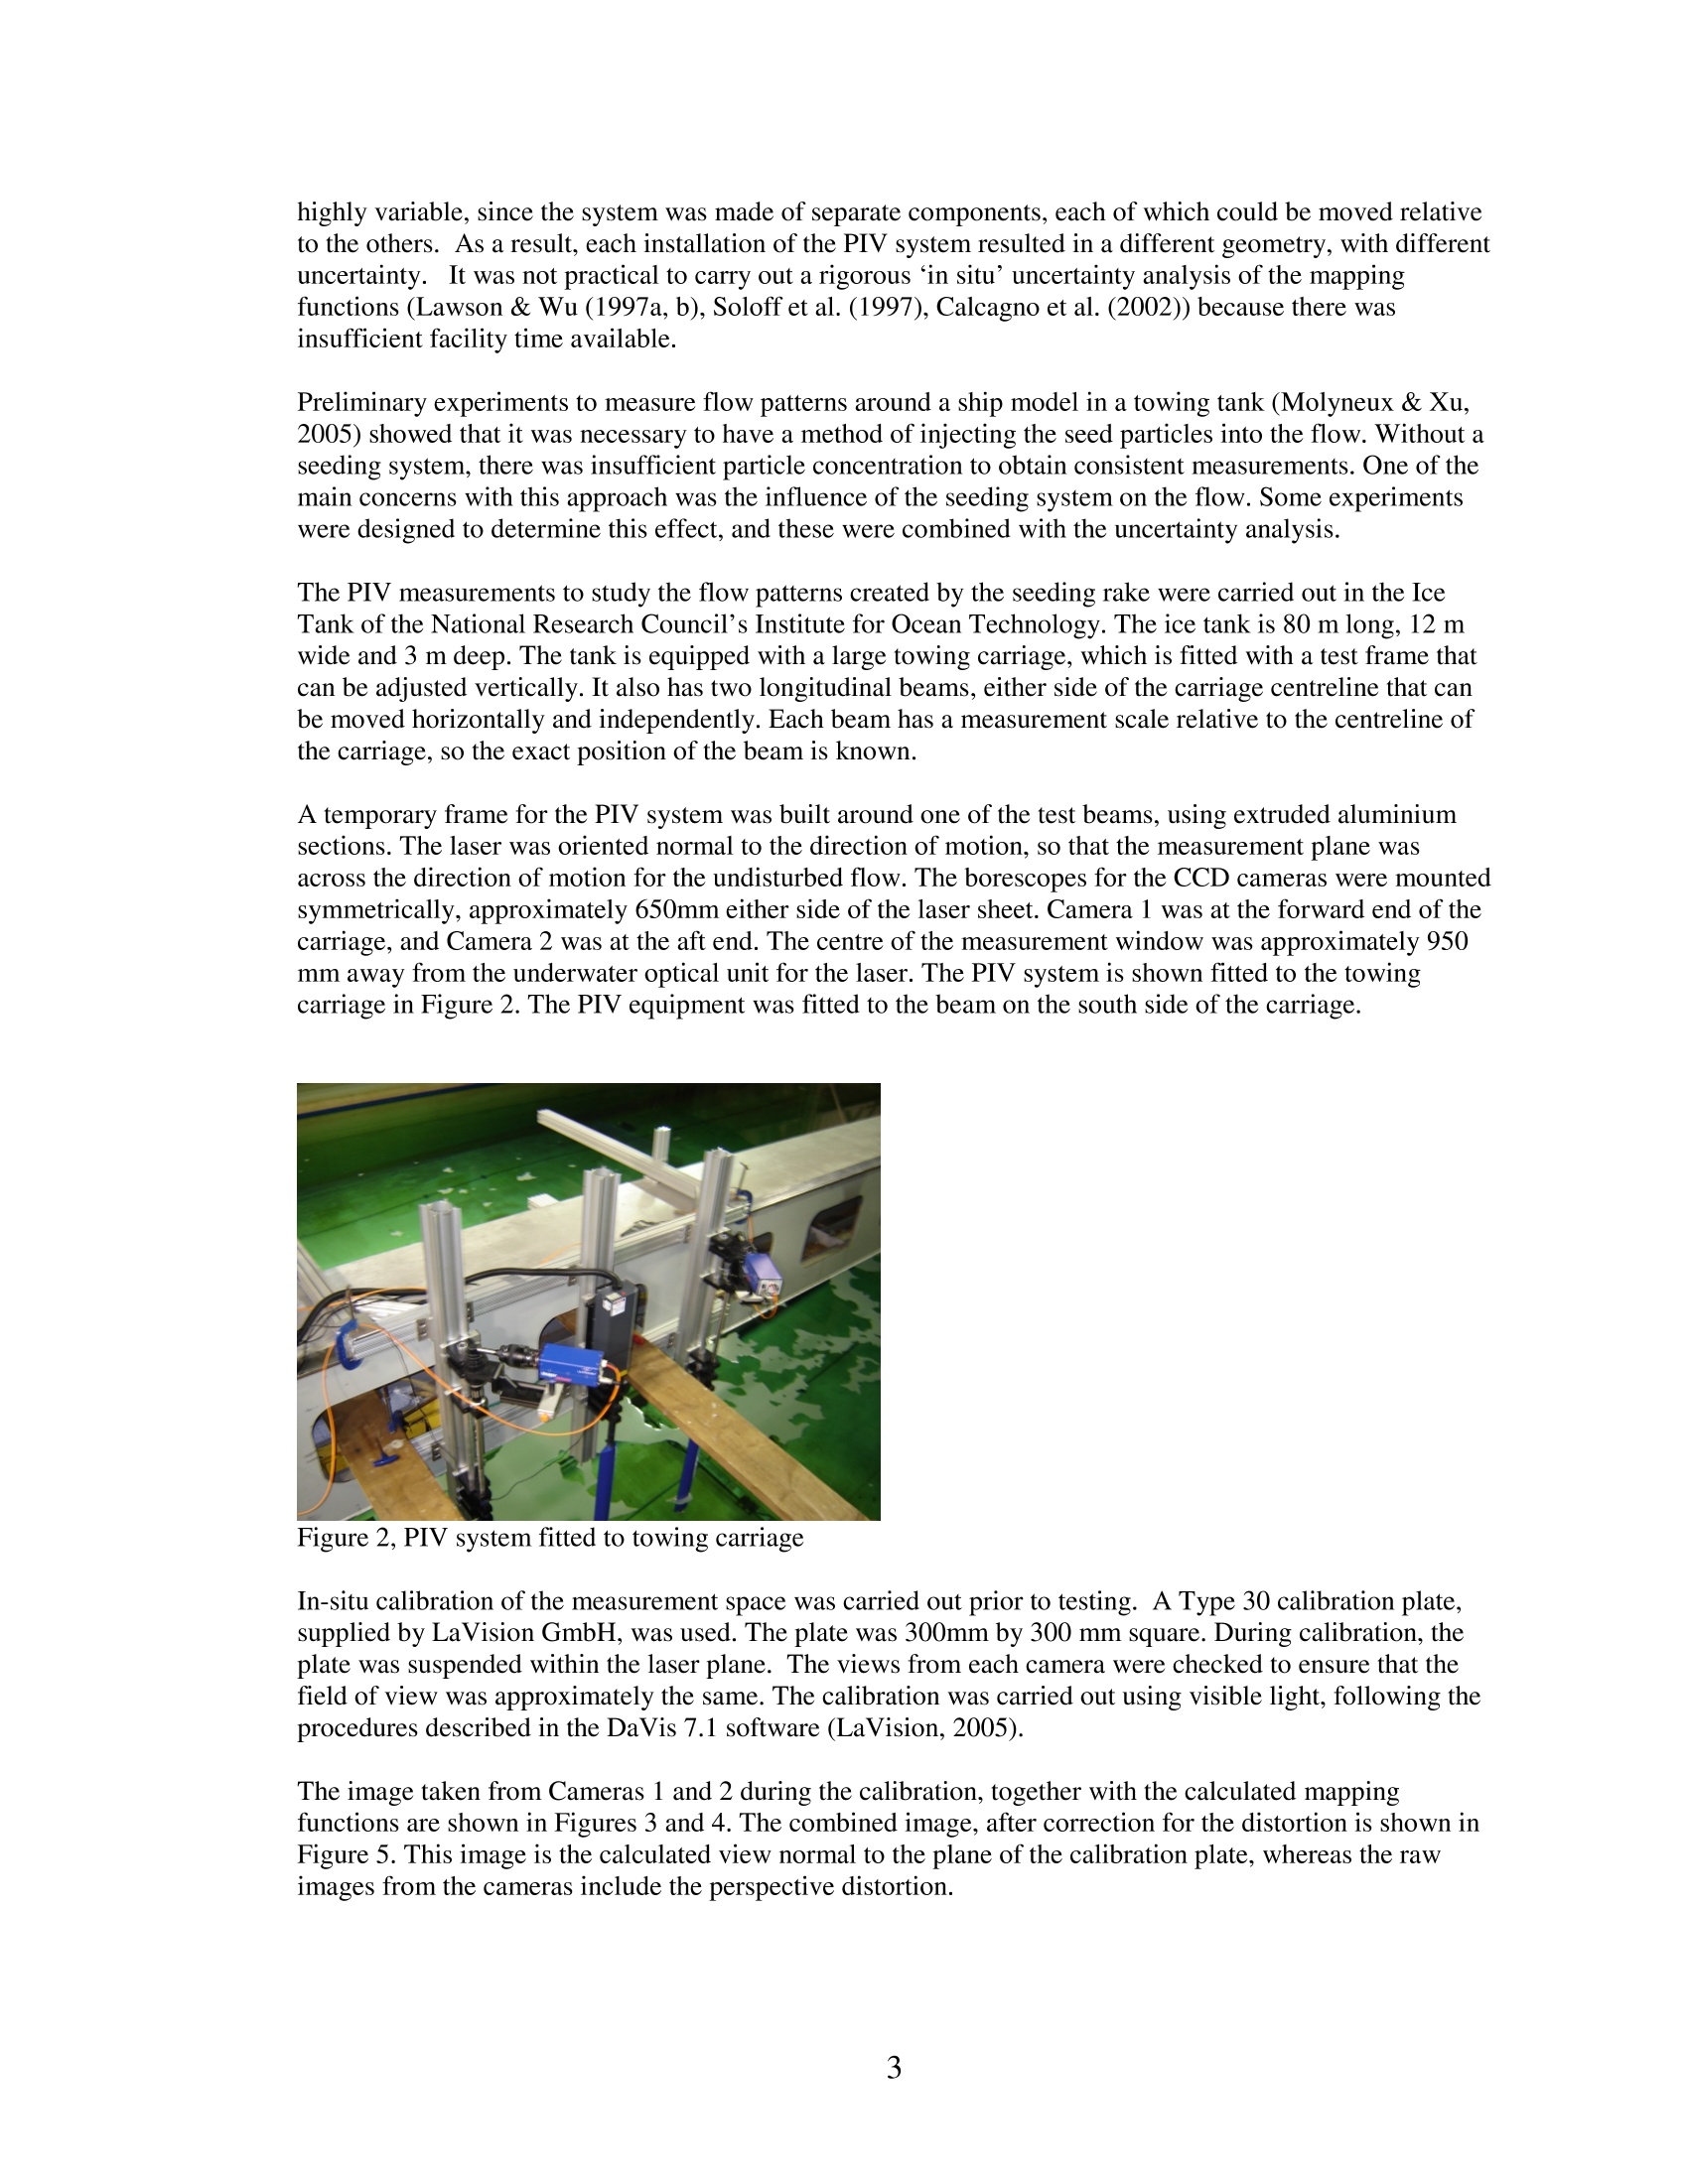
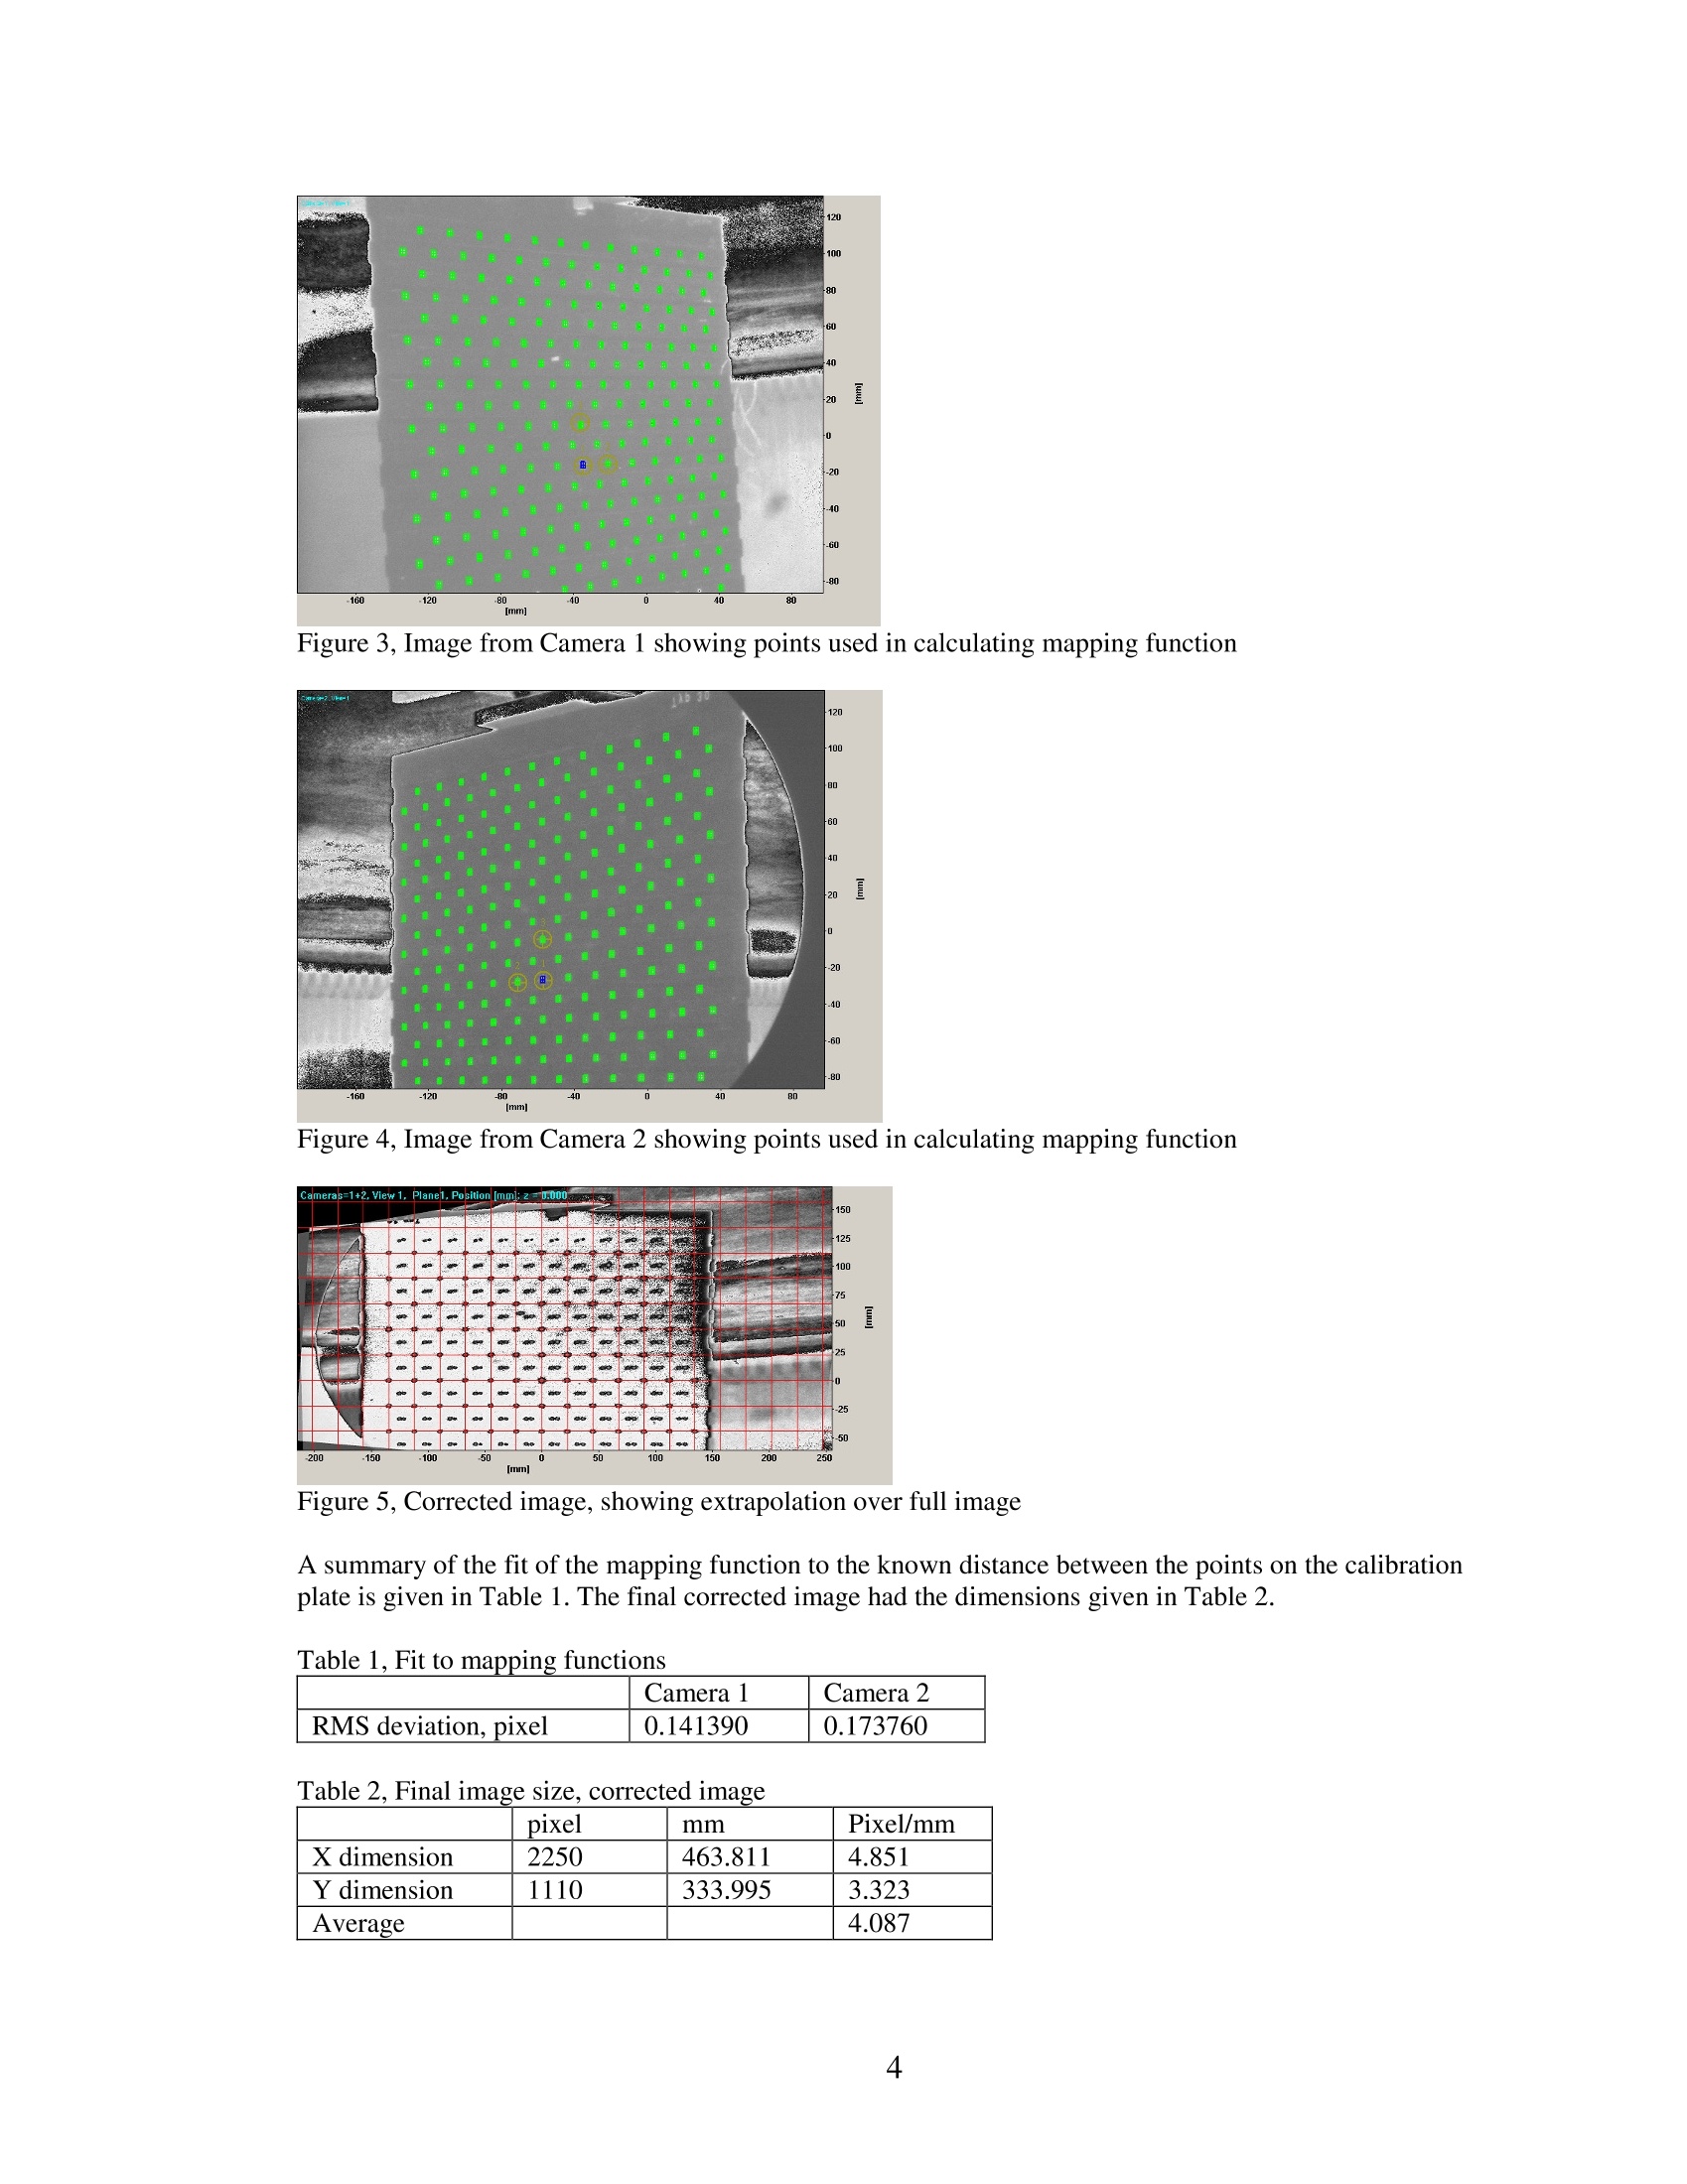
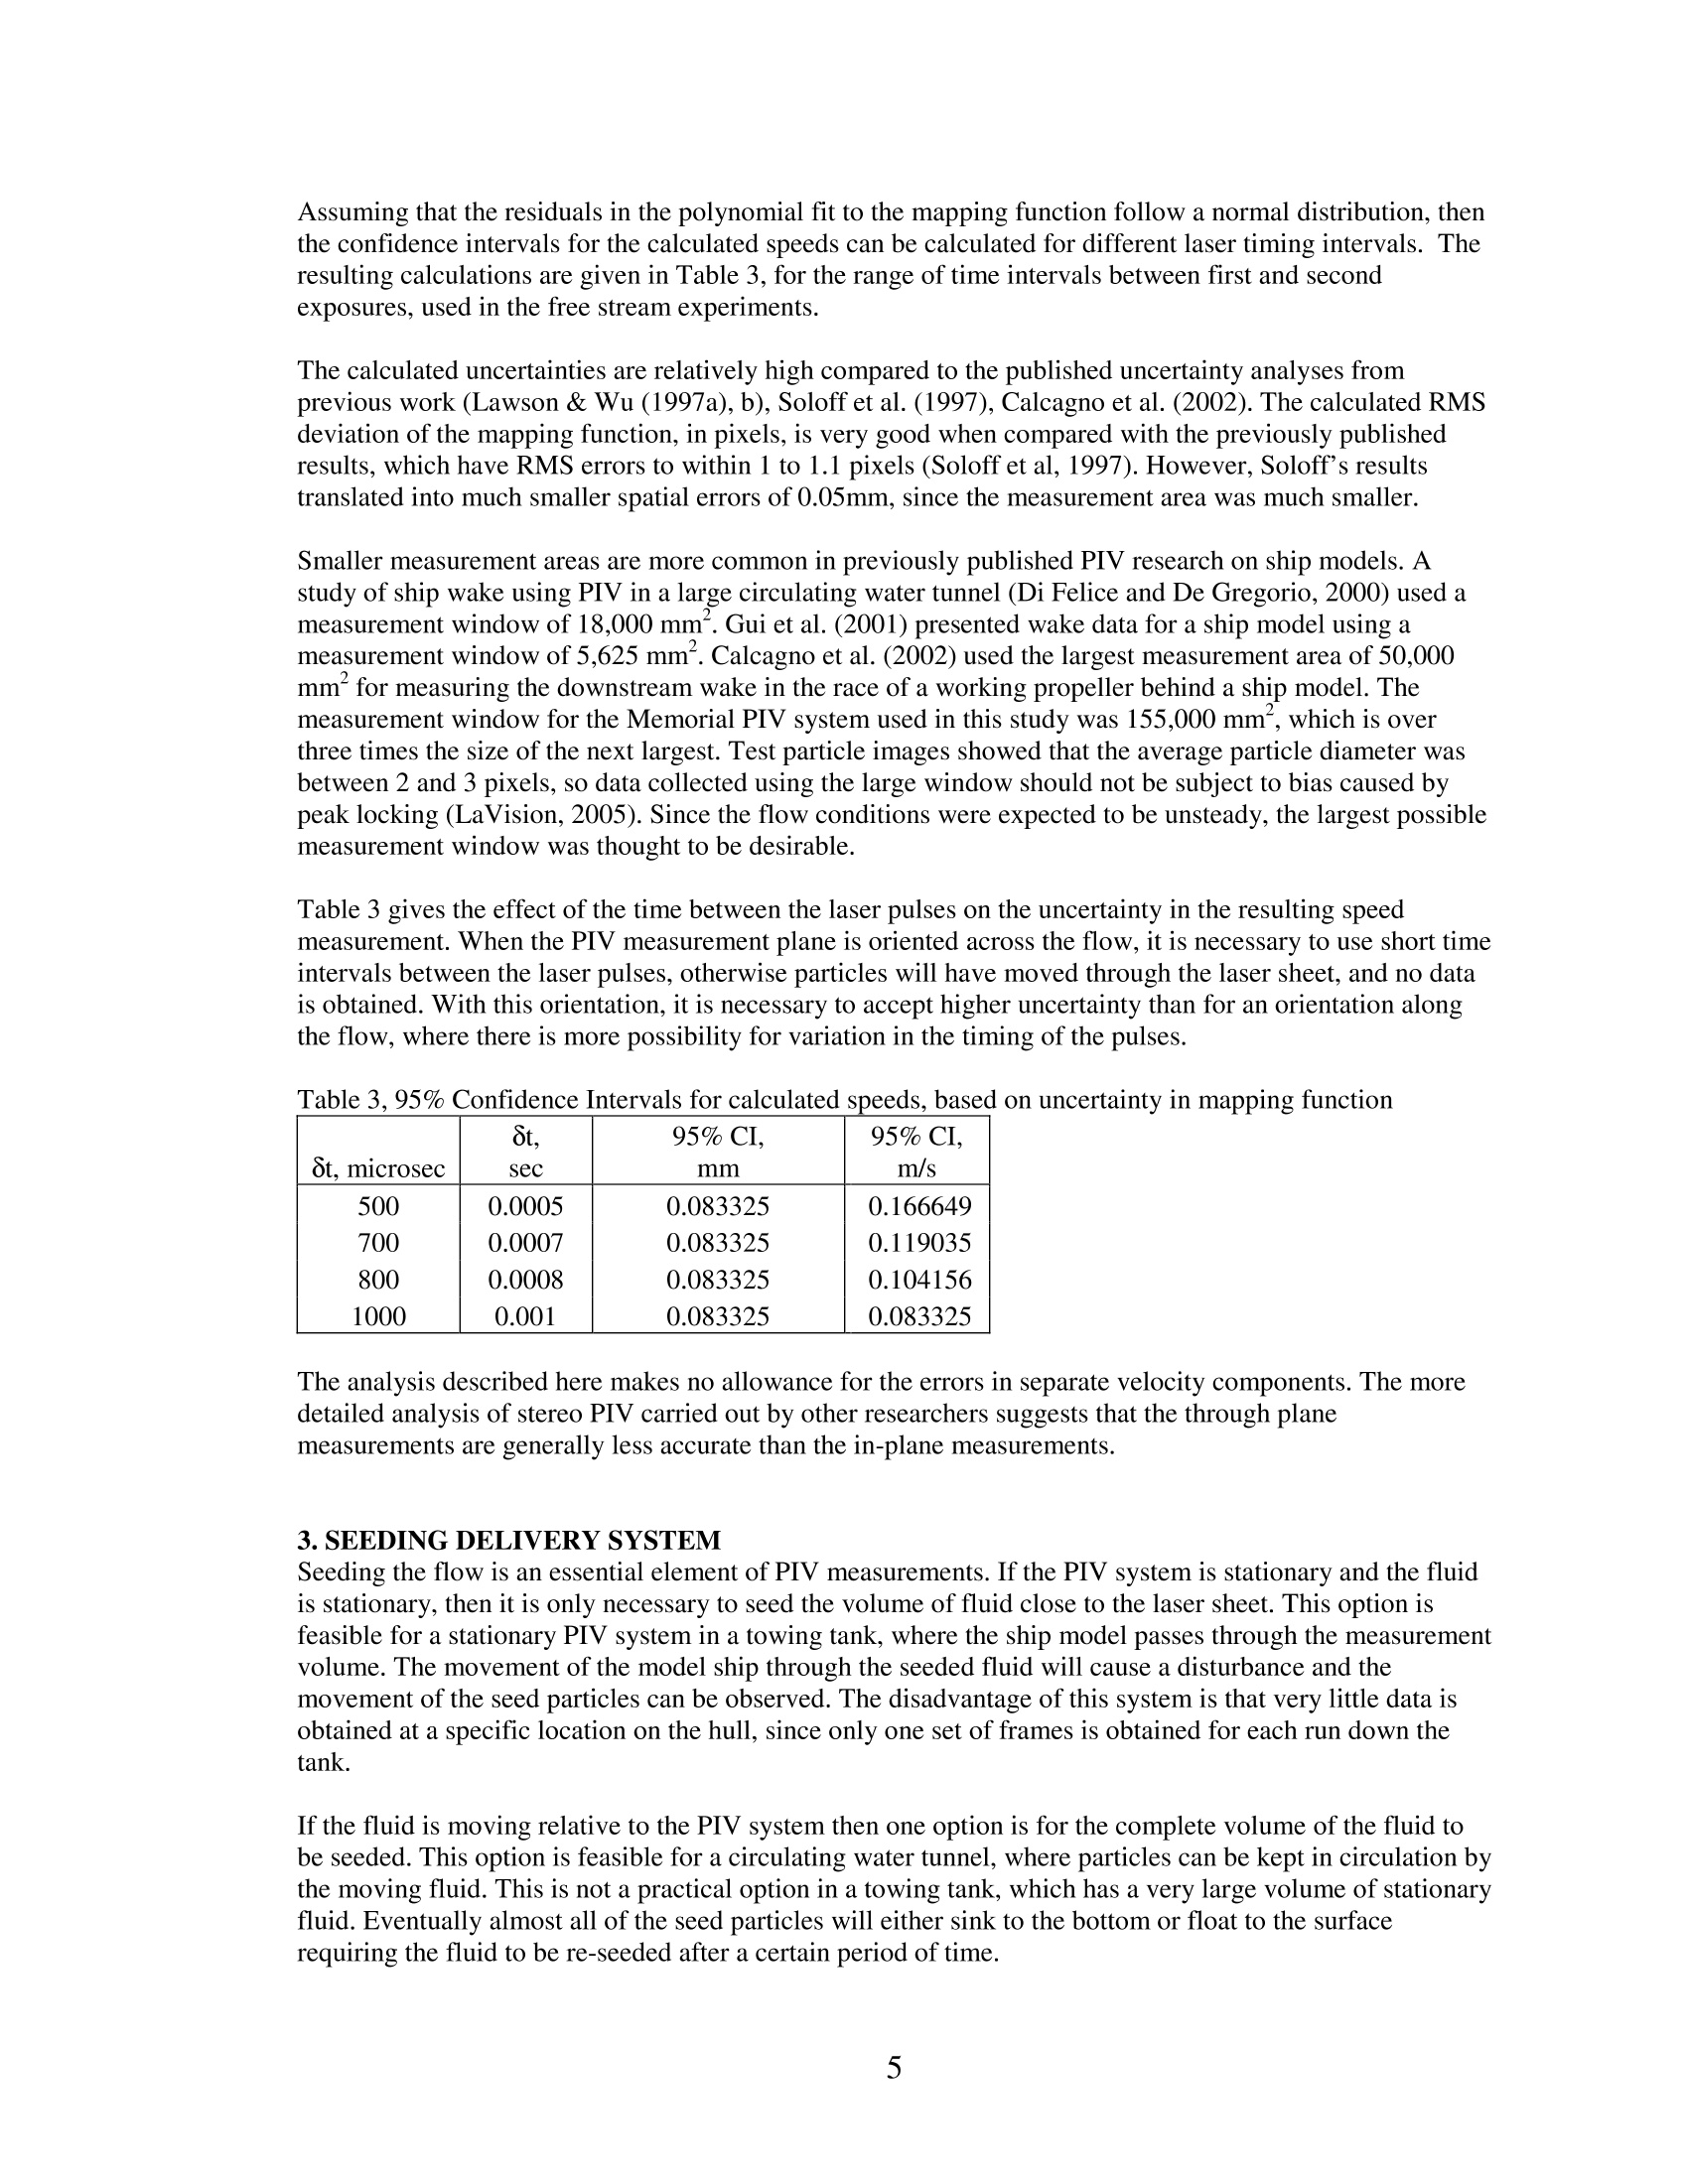
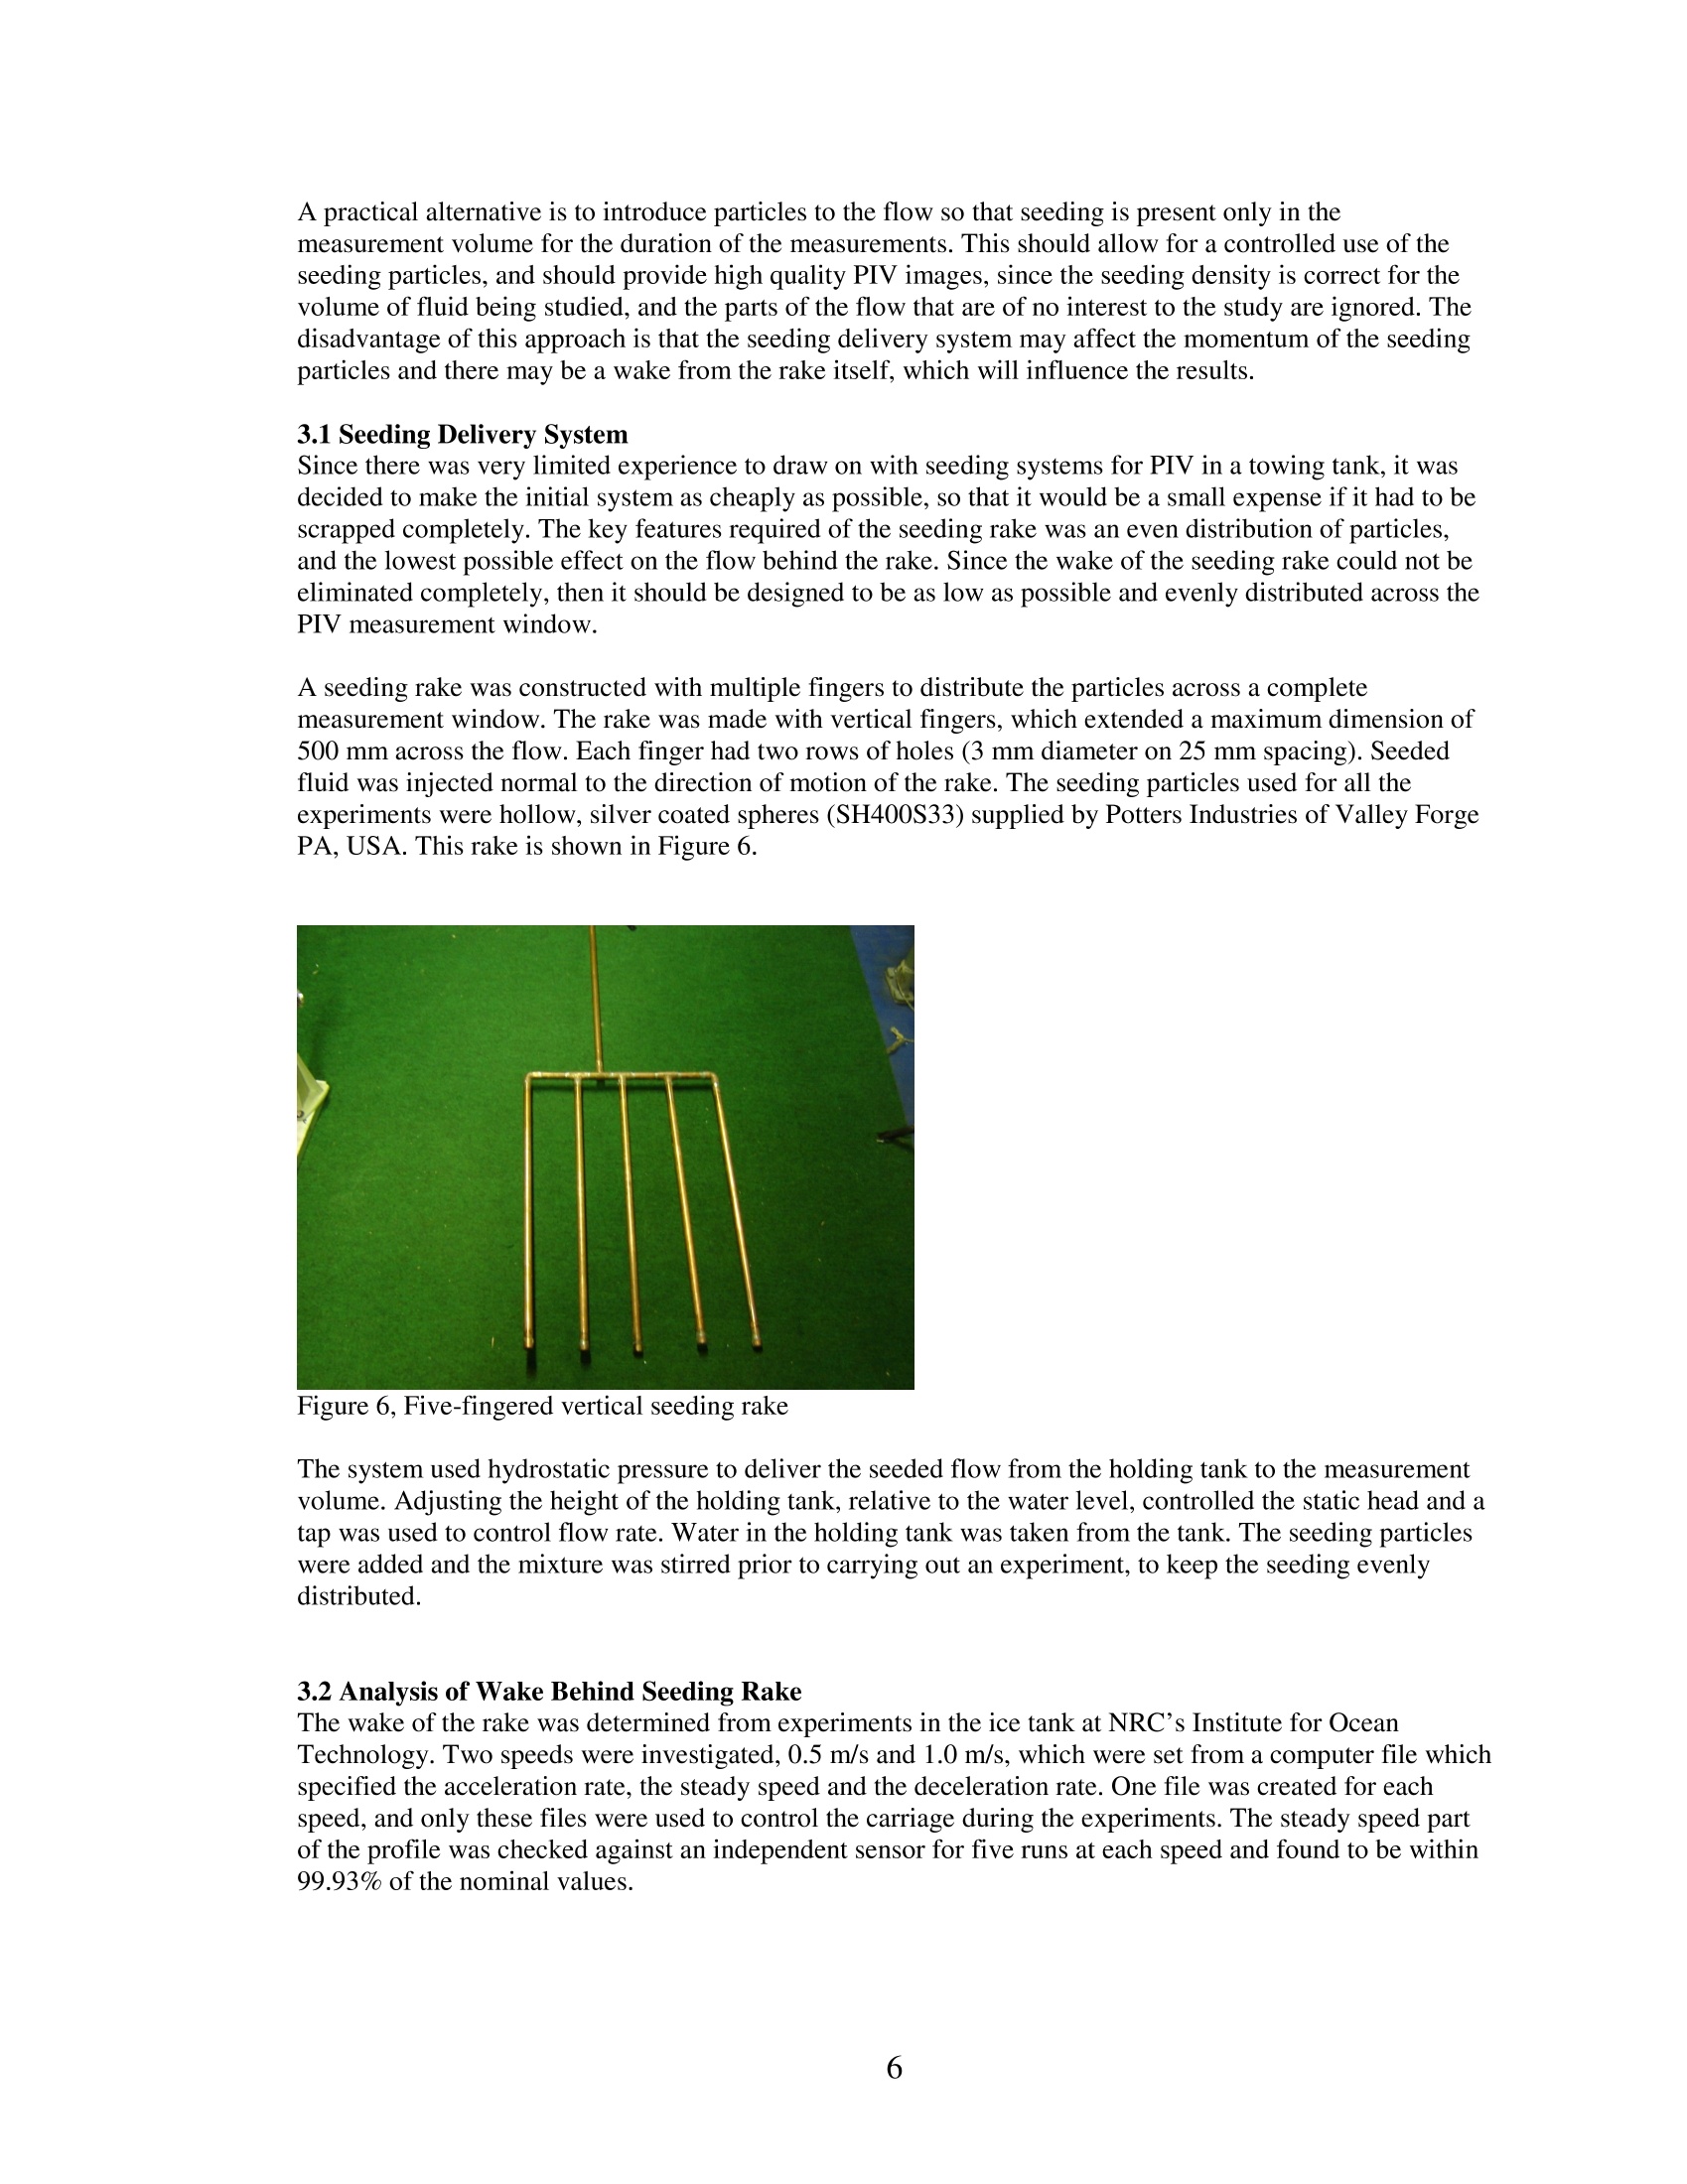
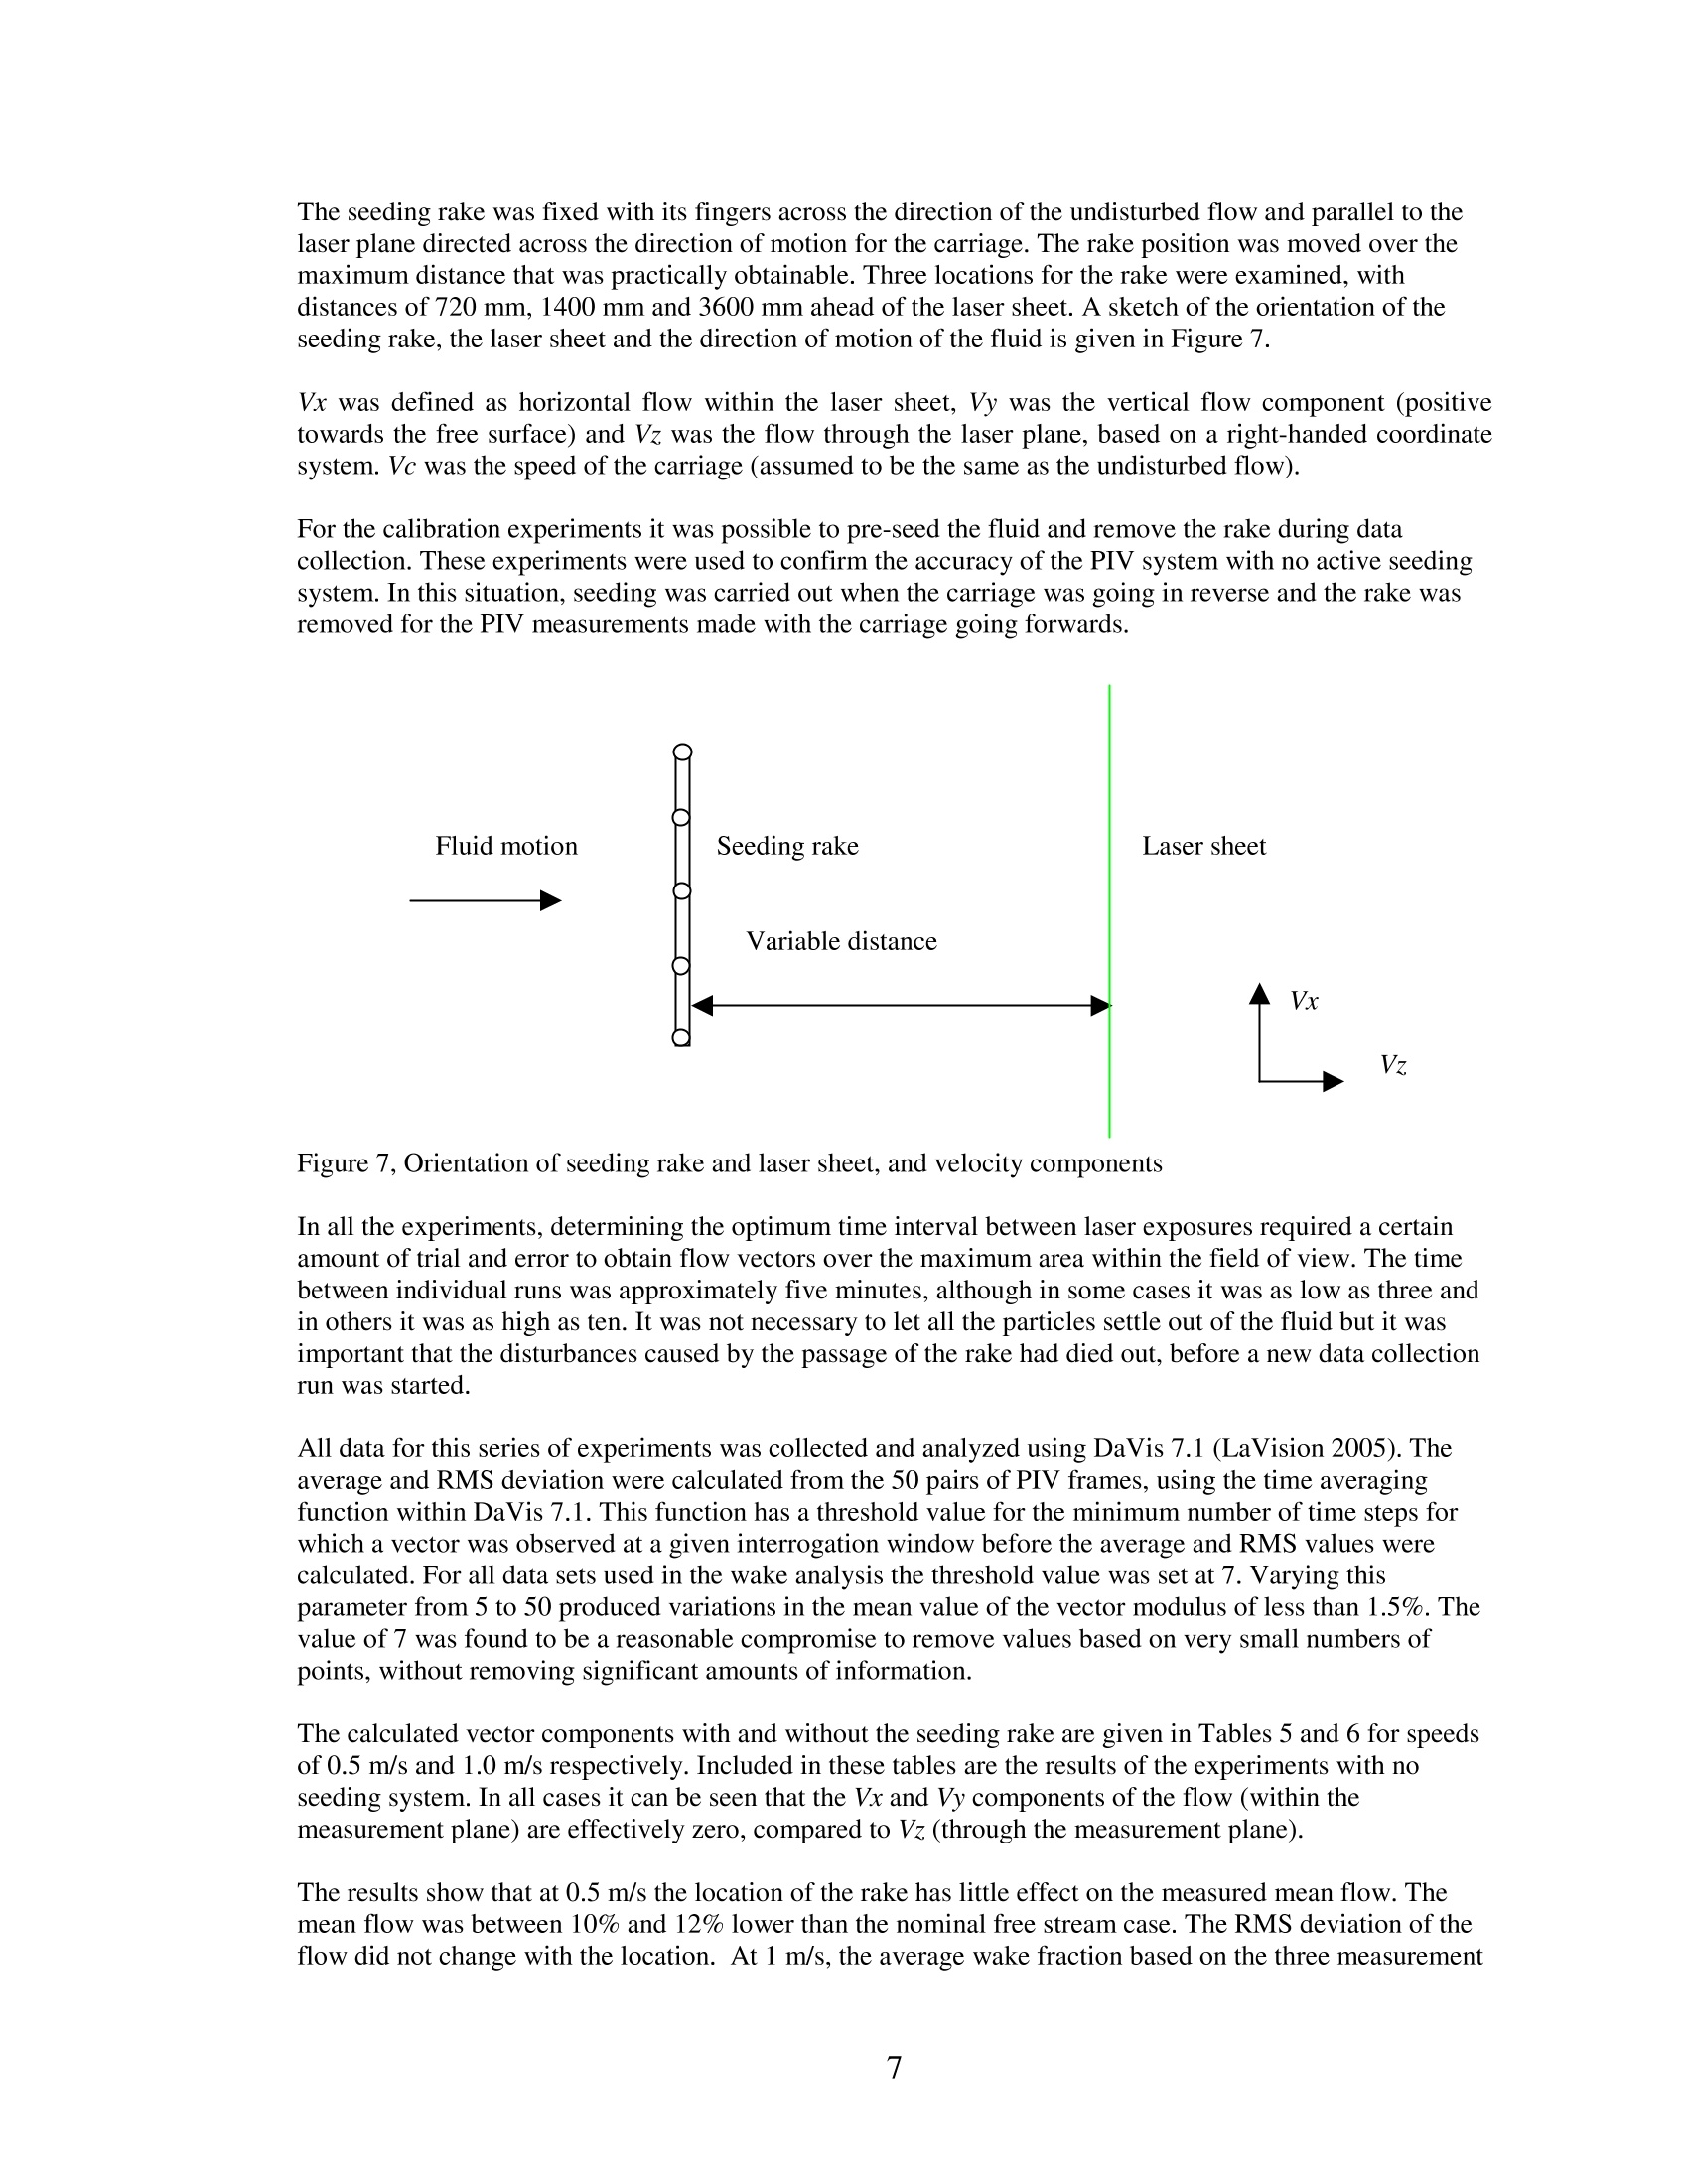
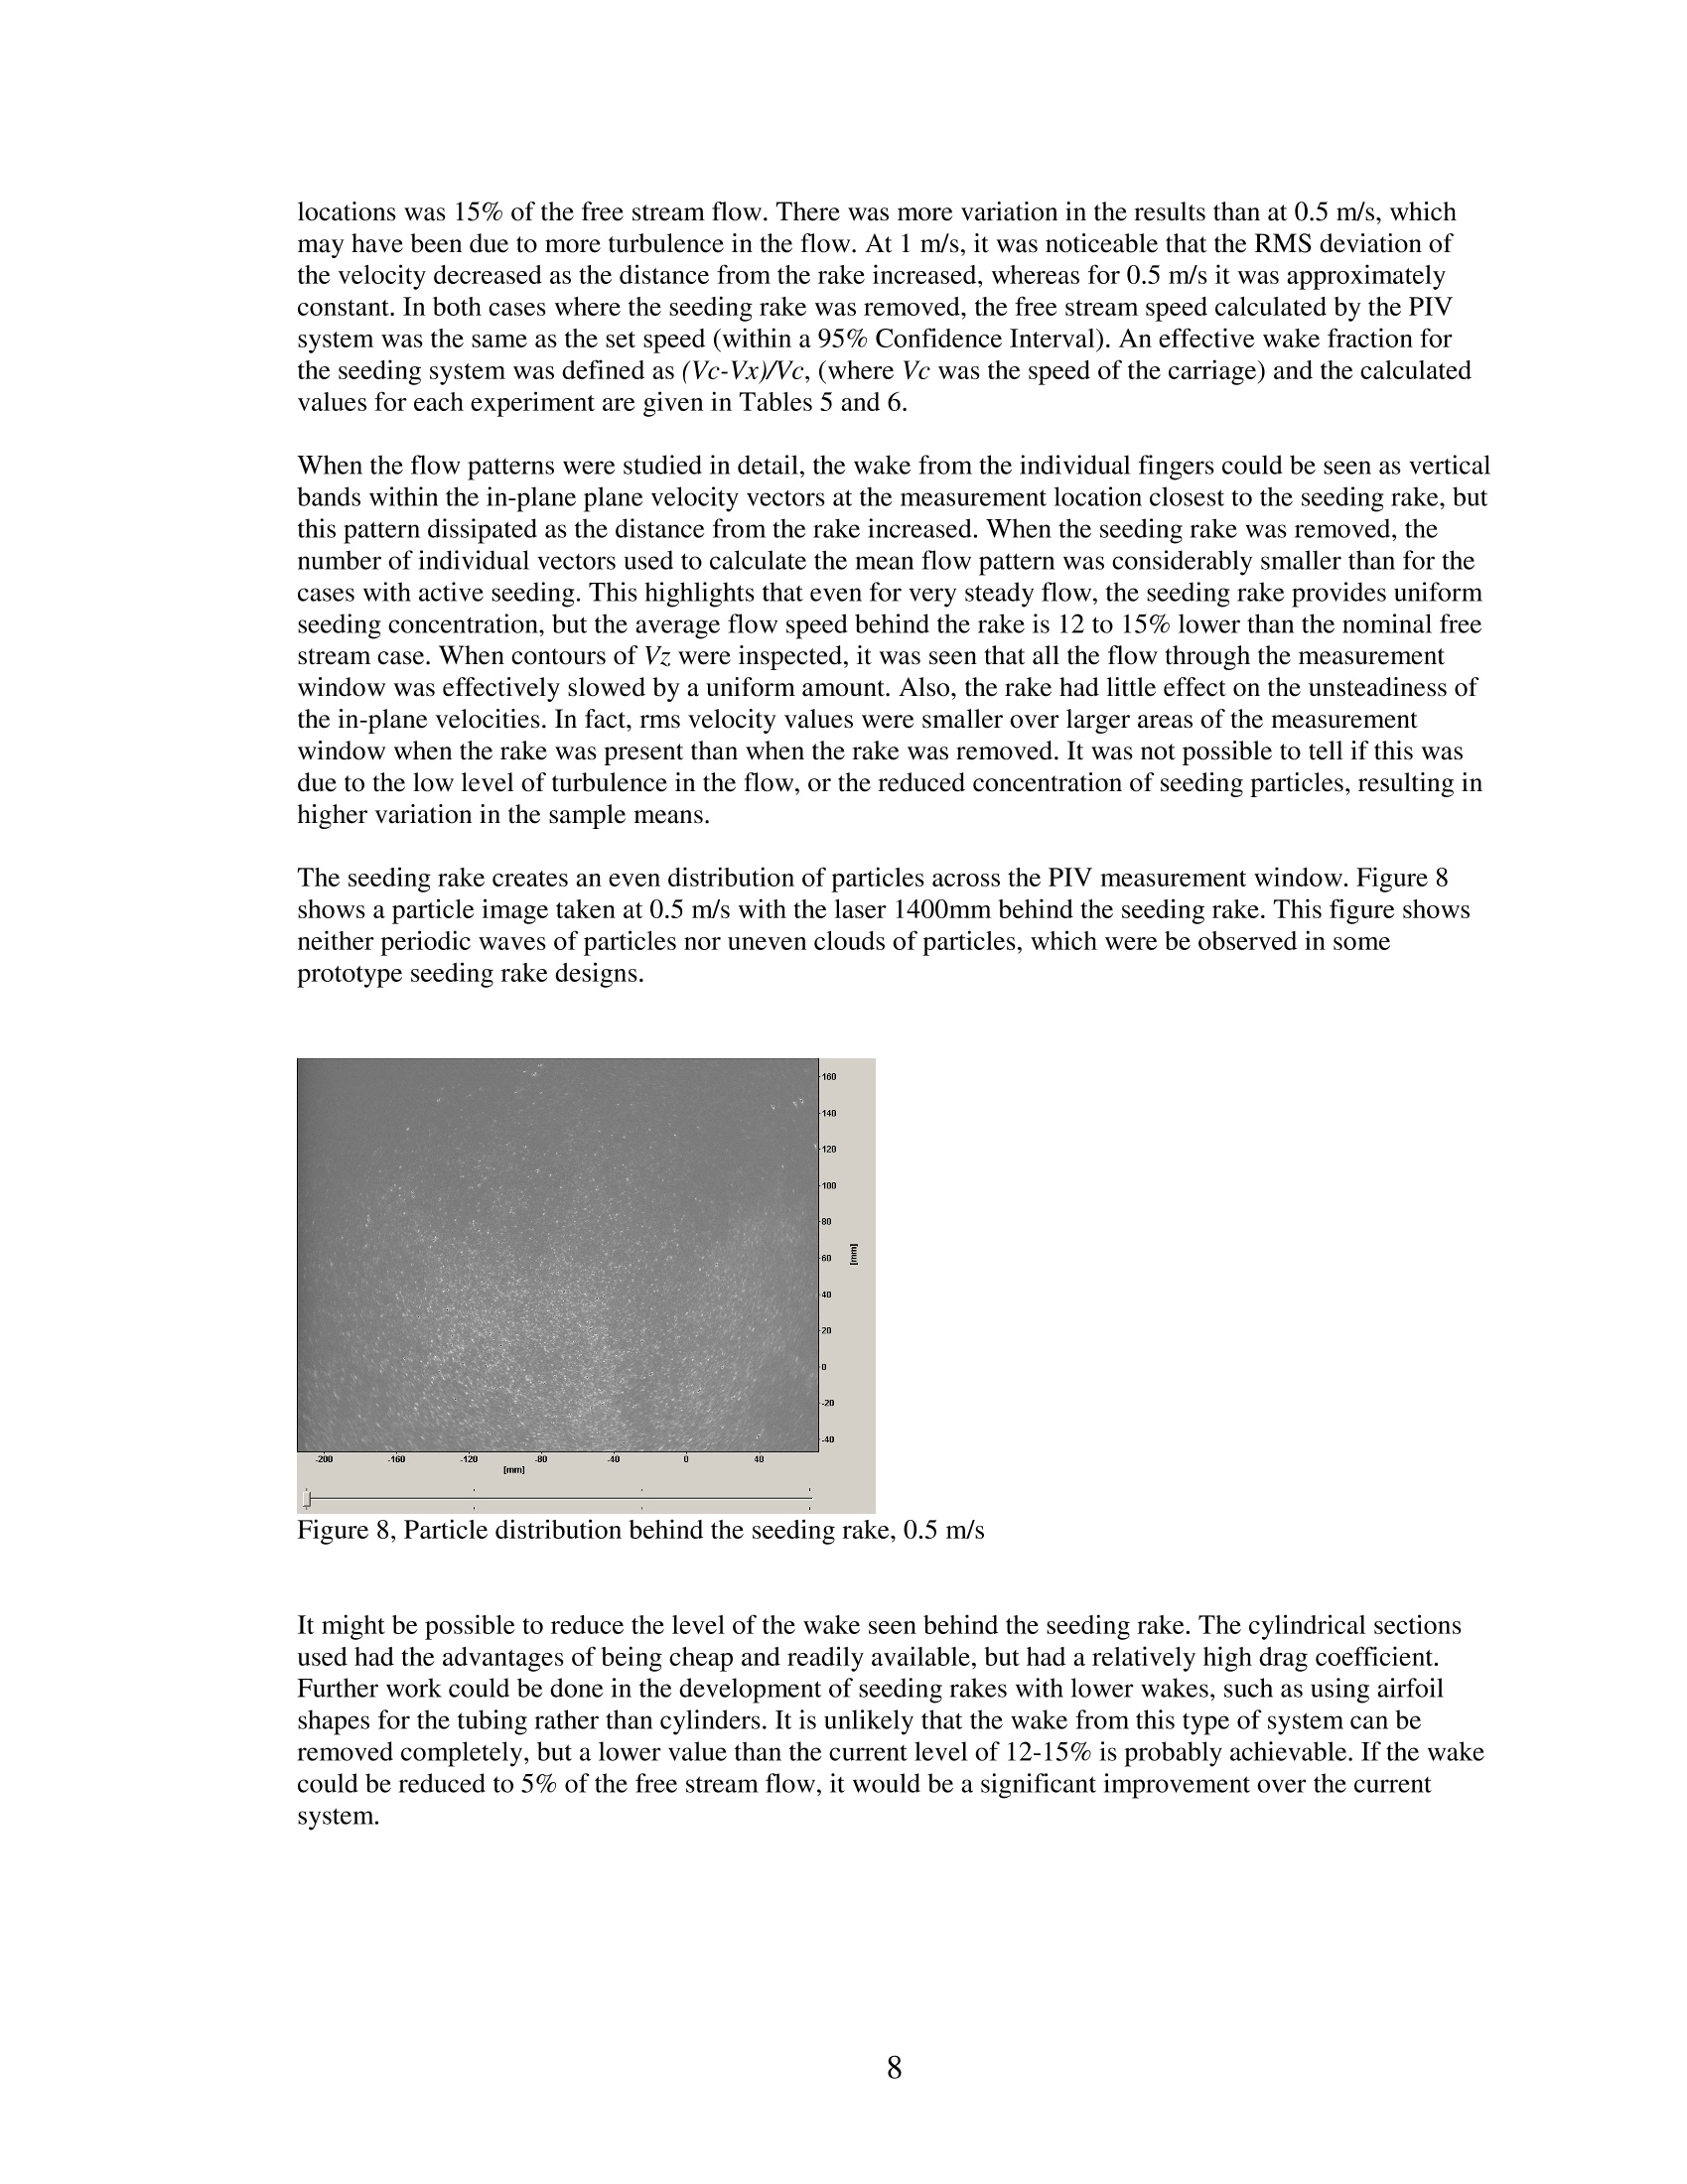
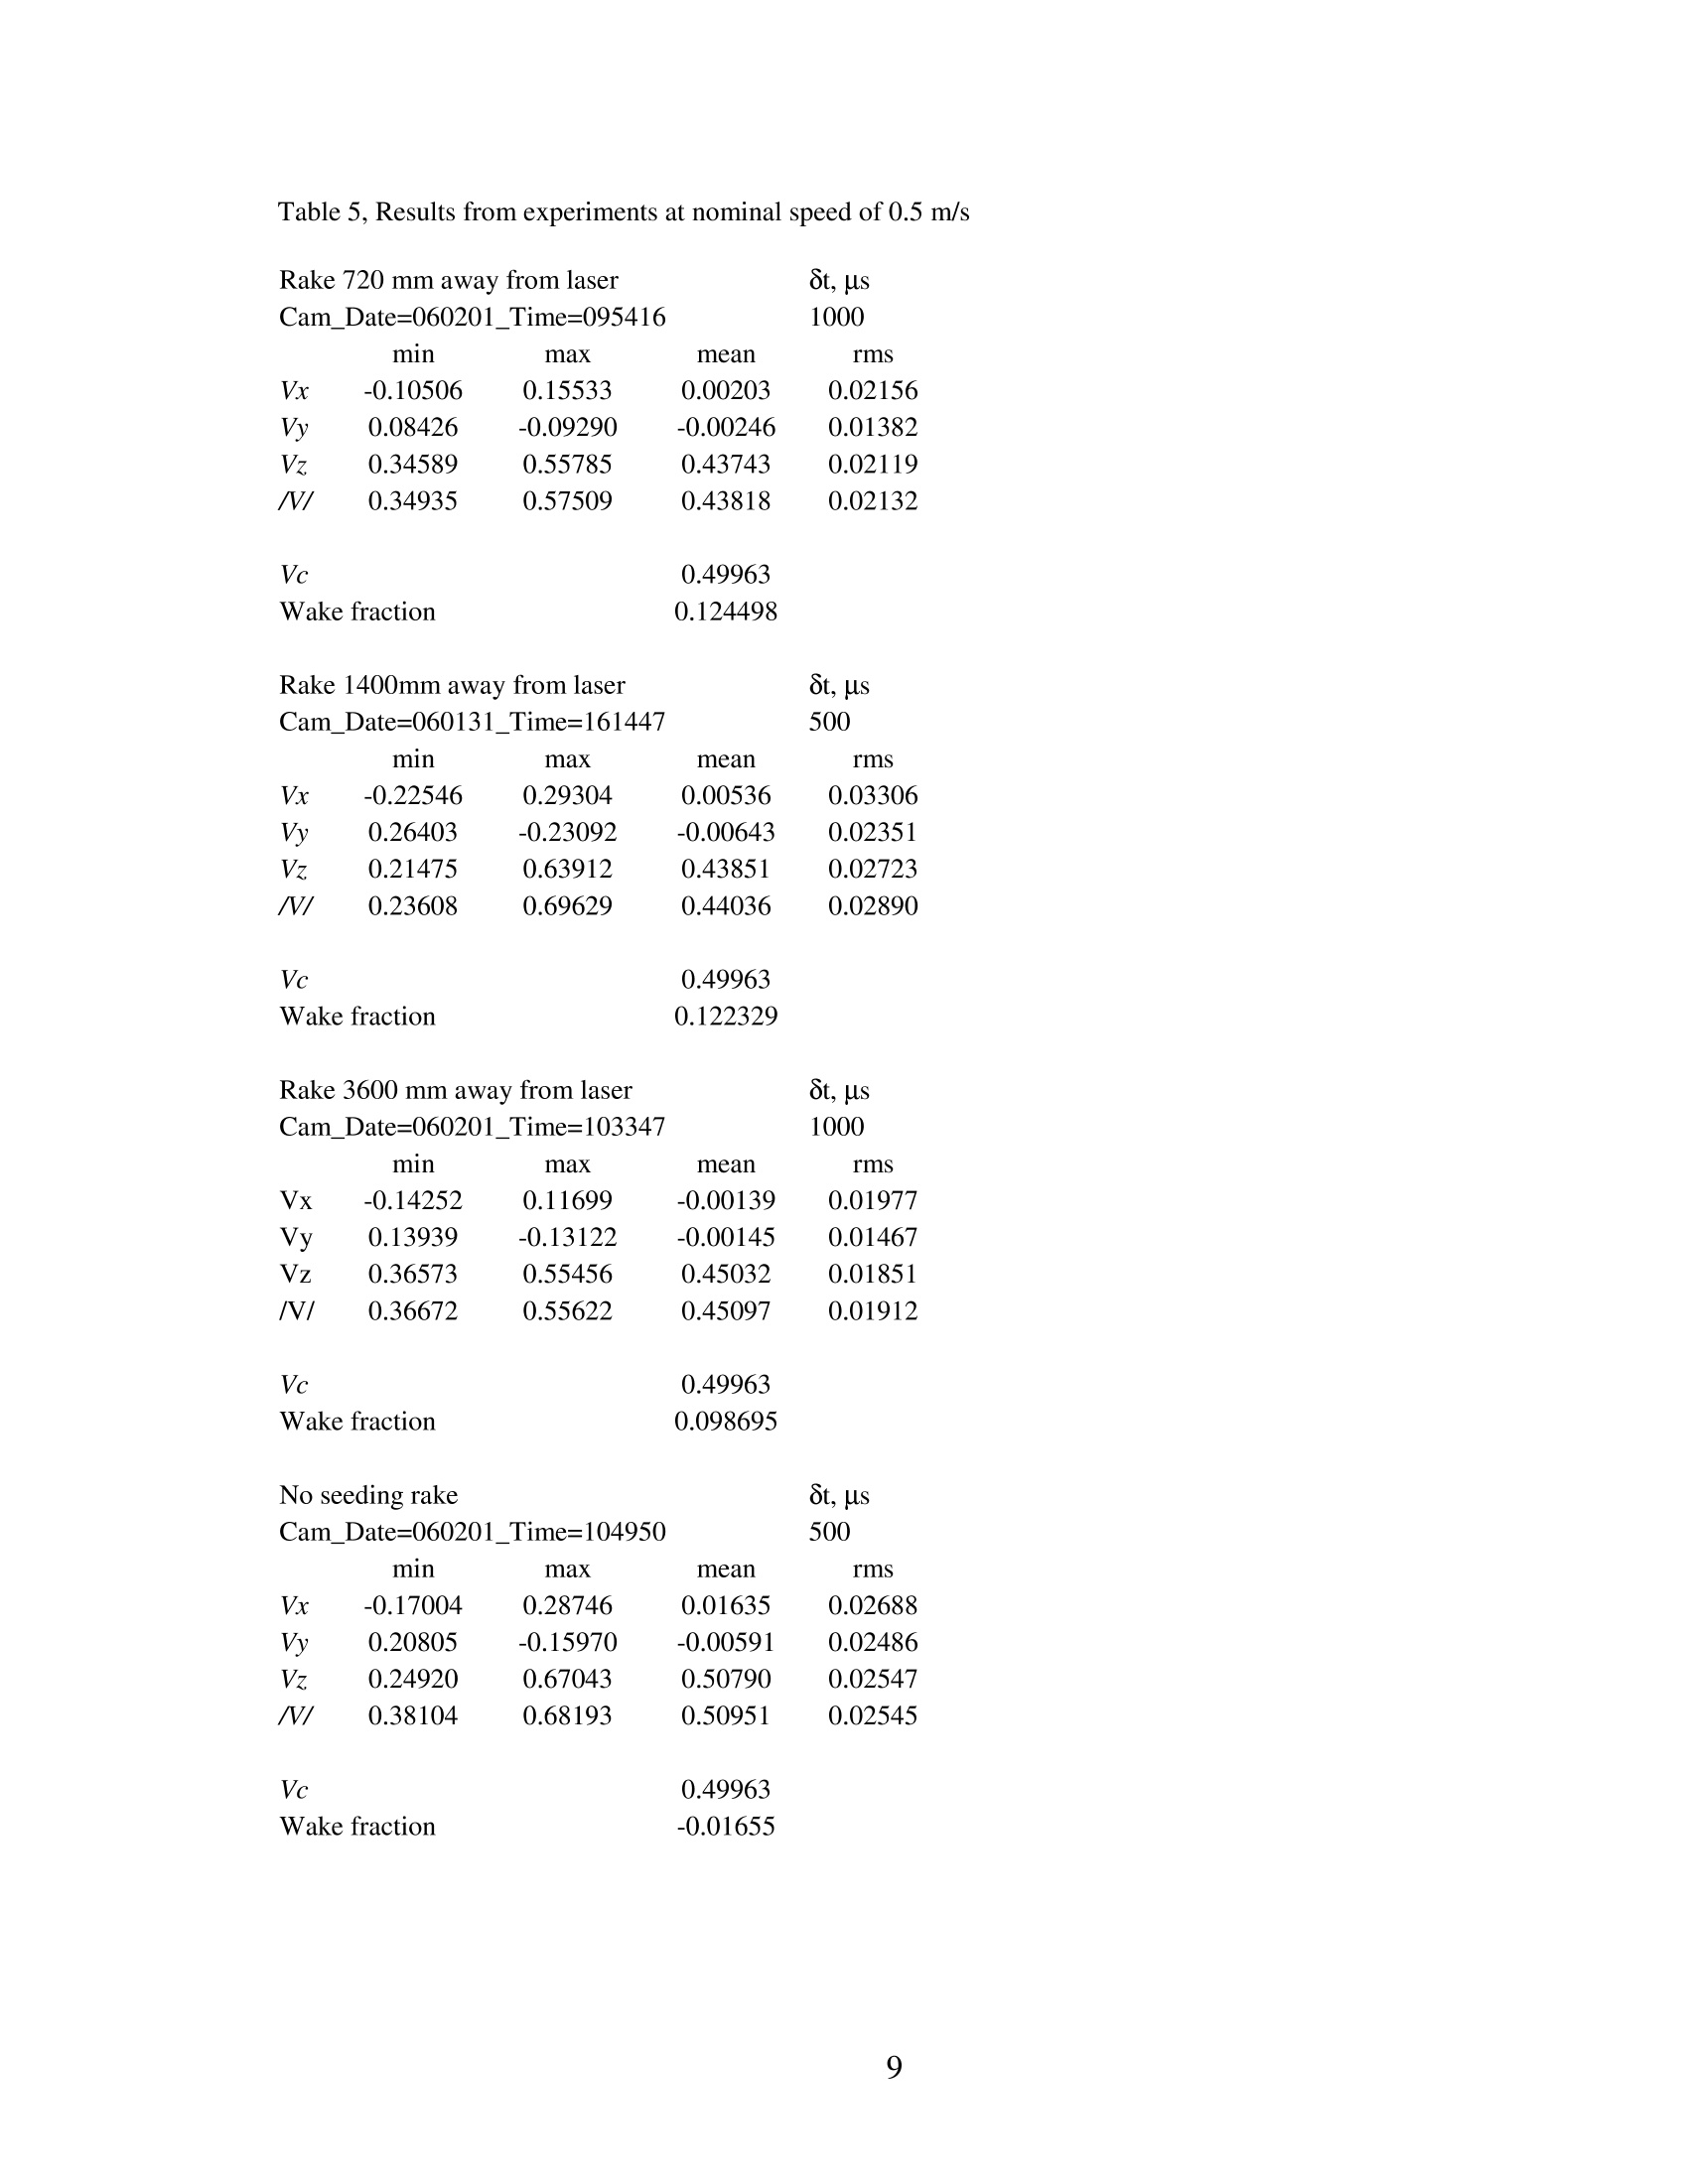
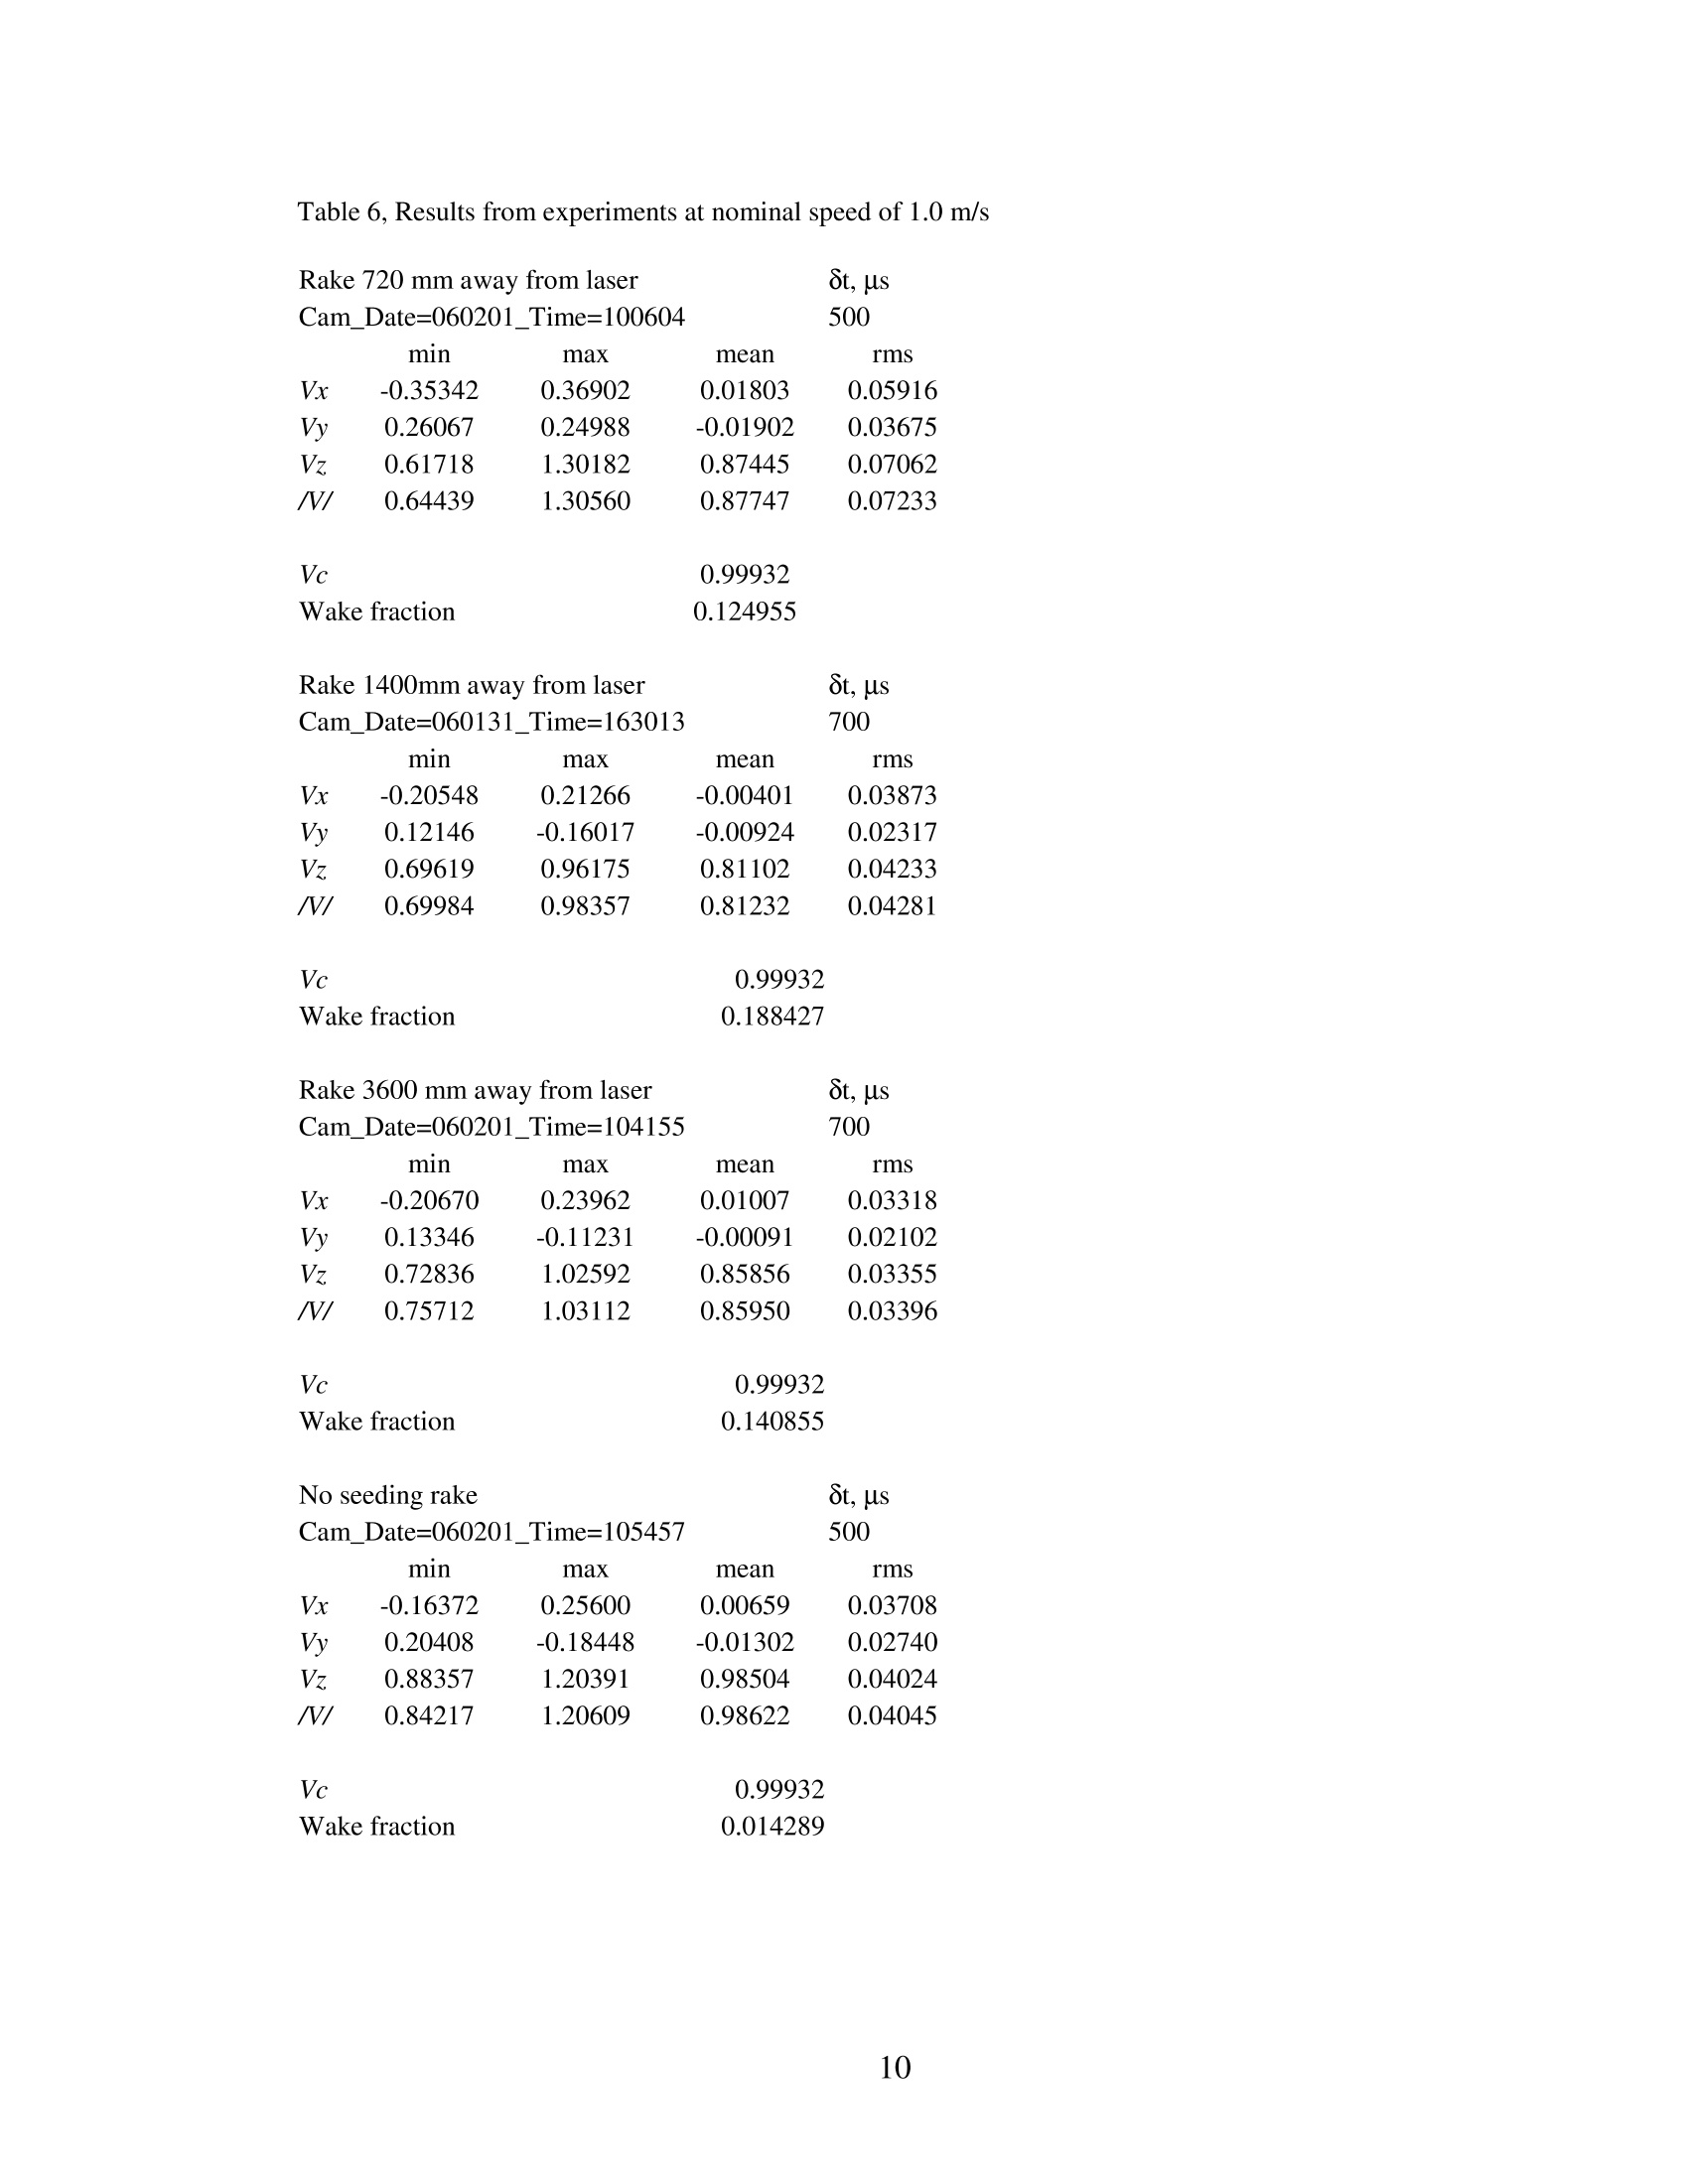
COMMISSIONING A STEREOSCOPIC PARTICLE IMAGE VELOCIMETRYSYSTEM FOR APPLICATION IN A TOWING TANK David Molyneux, Jie Xu’ and Neil Bose’ ABSTRACT In January 2004, Memorial University purchased a stereoscopic Particle Image Velocimetry(PIV) system for making flow measurements. Although the system was potentially veryversatile, its primary application was envisioned to be in a towing tank. The system wassupplied as a complete package of hardware and software for calibration, data collection andanalysis. The intention of the PIV system designers was to collect as many data frames aspossible for a fixed measurement plane location, relative to the model. This required the PIVsystem to be fixed on the towing carriage, moving with the model being studied. It was foundduring some preliminary experiments that an active seeding delivery system was necessary toensure sufficiently high seeding particle concentration, especially when measuring flowvelocities around a model hull with a large yaw angle. This paper describes the development ofa seeding technique for a PIV system that can be used in a towing tank. The paper also includesan estimate of the uncertainty of the measurement system, including the analysis of the flowbehind the device used to deliver seed particles into the flow. 1.INTRODUCTION Particle Image Velocimetry (PIV) is an important technique for measuring velocities within a fluid. Theflow through an illuminated plane (or volume) is seeded with small, reflective particles and a sequence ofdigital photographs is taken. By timing the intervals between photographs to ensure that the same particlesare within the measurement space for each exposure, flow vectors can be calculated,once the measurementspace has been calibrated. To calculate the velocity vectors, the total image is divided into smallerinterrogation windows. The average particle movement within each interrogation window between twosuccessive exposures is calculated. Velocity is determined by dividing the distance moved by the timeinterval between exposures. In its simplest form, the technique is applied in two dimensions using a singlecamera, but by using stereo photography, the method can be extended to three dimensions. The mainadvantage of PIV over other measurement methods is that it can determine fluid velocity at all locationswithin the measurement plane simultaneously instead of having to make separate measurements at a seriesof different point locations. This is an important feature for analyzing some forms of unsteady flow. The PIV system at Memorial University of Newfoundland was manufactured by LaVision GmbH ofGoettingen, Germany and was purchased from LaVision Inc. of Ypsilanti, MI, USA. The system consistedof four main elements: ( Senior Research Officer, I nstitute for Ocean Technology,National Research Council Canada "Laboratory Coordinator, Faculty of Engineering and Applied Science, Memorial University ) ( Professor of Maritime Hydrodynamics, Manager, Australian Maritime Engineering Hydrodynamics Research C entre, A ustralian Maritime College ) Two Charge Coupled Device (CCD) cameras Twin-head Nd:YAGlaser and controller ● Computer for timing of laser and cameras and data acquisition In addition to the hardware described above, the system comes with an extensive software package forsystem calibration, data collection and analysis (LaVision, 2005). Xu et al. (2005) gave a description of the PIV system together with the results of some preliminaryexperiments. The PIV system was designed for the special requirements of a towing tank, where theoperating fluid was water with a free surface. A photograph of the complete system, assembled in air, isshown in Figure 1. The unique features of this PIV system were the two borescopes, which were used toobtain the underwater views. There were two main advantages of this arrangement. The first was that thesensitive cameras were kept accessible and well above the water surface. The second was that theunderwater part of the measurement system was very small, compared to other systems, which used large,underwater housings. A similar arrangement was provided for the laser, but this was a plain tube, withoutthe optics of a borescope. This paper describes the development of the techniques necessary to make the PIV system work in a towingtank, such as an active seeding system. It also describes the method used for estimating the uncertainty ofthe system, including the effect of the seeding rake on the measured flow speeds. Figure 1, View of complete PIV system showing CCD cameras [1], laser head [2], computer [3], lasercontroller [4] and borescopes [5]. 2. UNCERTAINTY ESTIMATES FOR MEMORIAL UNIVERSITY'S PIV SYSTEM The uncertainty of the PIV system used at Memorial University was estimated from the combination of theerrors in the mapping function reported by the DaVis 7.1 software (La Vision, 2005), and some specialexperiments to measure undisturbed flow. The geometry of the optics for the Memorial PIV system was ( 4* Neodium doped: Yttrium Aluminium Garnet ) highly variable, since the system was made of separate components, each of which could be moved relativeto the others. As a result, each installation of the PIV system resulted in a different geometry, with differentuncertainty. It was not practical to carry out a rigorous ‘in situ’uncertainty analysis of the mappingfunctions (Lawson & Wu (1997a, b), Soloff et al. (1997), Calcagno et al. (2002)) because there wasinsufficient facility time available. Preliminary experiments to measure flow patterns around a ship model in a towing tank (Molyneux & Xu,2005) showed that it was necessary to have a method of injecting the seed particles into the flow. Without aseeding system, there was insufficient particle concentration to obtain consistent measurements. One of themain concerns with this approach was the influence of the seeding system on the flow. Some experimentswere designed to determine this effect, and these were combined with the uncertainty analysis. The PIV measurements to study the flow patterns created by the seeding rake were carried out in the IceTank of the National Research Council’s Institute for Ocean Technology. The ice tank is 80 m long, 12 mwide and 3 m deep. The tank is equipped with a large towing carriage, which is fitted with a test frame thatcan be adjusted vertically. It also has two longitudinal beams, either side of the carriage centreline that canbe moved horizontally and independently. Each beam has a measurement scale relative to the centreline ofthe carriage, so the exact position of the beam is known. A temporary frame for the PIV system was built around one of the test beams, using extruded aluminiumsections. The laser was oriented normal to the direction of motion, so that the measurement plane wasacross the direction of motion for the undisturbed flow. The borescopes for the CCD cameras were mountedsymmetrically,approximately 650mm either side of the laser sheet. Camera 1 was at the forward end of thecarriage, and Camera 2 was at the aft end. The centre of the measurement window was approximately 950mm away from the underwater optical unit for the laser. The PIV system is shown fitted to the towingcarriage in Figure 2. The PIV equipment was fitted to the beam on the south side of the carriage. Figure 2, PIV system fitted to towing carriage In-situ calibration of the measurement space was carried out prior to testing. A Type 30 calibration plate,supplied by LaVision GmbH, was used. The plate was 300mm by 300 mm square. During calibration, theplate was suspended within the laser plane. The views from each camera were checked to ensure that thefield of view was approximately the same. The calibration was carried out using visible light, following theprocedures described in the DaVis 7.1 software (LaVision, 2005). The image taken from Cameras 1 and 2 during the calibration, together with the calculated mappingfunctions are shown in Figures 3 and 4. The combined image, after correction for the distortion is shown inFigure 5. This image is the calculated view normal to the plane of the calibration plate, whereas the rawimages from the cameras include the perspective distortion. Figure 3, Image from Camera 1 showing points used in calculating mapping function Figure 4, Image from Camera 2 showing points used in calculating mapping function Figure 5, Corrected image, showing extrapolation over full image A summary of the fit of the mapping function to the known distance between the points on the calibrationplate is given in Table 1. The final corrected image had the dimensions given in Table 2. Table 1, Fit to mapping functions Camera 1 Camera 2 RMS deviation, pixel 0.141390 0.173760 Table 2, Final image size, corrected image pixel mm Pixel/mm X dimension 2250 463.811 4.851 Y dimension 1110 333.995 3.323 Average 4.087 Assuming that the residuals in the polynomial fit to the mapping function follow a normal distribution, thenthe confidence intervals for the calculated speeds can be calculated for different laser timing intervals. Theresulting calculations are given in Table 3, for the range of time intervals between first and secondexposures, used in the free stream experiments. The calculated uncertainties are relatively high compared to the published uncertainty analyses fromprevious work (Lawson & Wu (1997a), b), Soloff et al. (1997), Calcagno et al.(2002). The calculated RMSdeviation of the mapping function, in pixels, is very good when compared with the previously publishedresults, which have RMS errors to within 1 to 1.1 pixels (Soloffet al, 1997). However, Soloff’s resultstranslated into much smaller spatial errors of 0.05mm, since the measurement area was much smaller. Smaller measurement areas are more common in previously published PIV research on ship models. Astudy of ship wake using PIV in a large circulating water tunnel (Di Felice and De Gregorio, 2000) used ameasurement window of 18,000 mm. Gui et al. (2001) presented wake data for a ship model using ameasurement window of 5,625 mm. Calcagno et al. (2002) used the largest measurement area of 50,000mm"for measuring the downstream wake in the race of a working propeller behind a ship model. Themeasurement window for the Memorial PIV system used in this study was 155,000 mm , which is overthree times the size of the next largest. Test particle images showed that the average particle diameter wasbetween 2 and 3 pixels, so data collected using the large window should not be subject to bias caused bypeak locking (LaVision, 2005). Since the flow conditions were expected to be unsteady, the largest possiblemeasurement window was thought to be desirable. Table 3 gives the effect of the time between the laser pulses on the uncertainty in the resulting speedmeasurement. When the PIV measurement plane is oriented across the flow, it is necessary to use short timeintervals between the laser pulses, otherwise particles will have moved through the laser sheet, and no datais obtained. With this orientation, it is necessary to accept higher uncertainty than for an orientation alongthe flow, where there is more possibility for variation in the timing of the pulses. Table 3, 95% Confidence Intervals for calculated speeds, based on uncertainty in mapping function 8t, microsec 8t.sec 95% CI. mm 95% CI.m/s 500 0.0005 0.083325 0.166649 0.0007 0.083325 0.119035 0.0008 0.083325 0.104156 1000 0.001 0.083325 0.083325 The analysis described here makes no allowance for the errors in separate velocity components. The moredetailed analysis of stereo PIV carried out by other researchers suggests that the through planemeasurements are generally less accurate than the in-plane measurements. 3.SEEDING DELIVERY SYSTEM Seeding the flow is an essential element of PIV measurements. If the PIV system is stationary and the fluidis stationary, then it is only necessary to seed the volume of fluid close to the laser sheet. This option isfeasible for a stationary PIV system in a towing tank, where the ship model passes through the measurementvolume. The movement of the model ship through the seeded fluid will cause a disturbance and themovement of the seed particles can be observed. The disadvantage of this system is that very little data isobtained at a specific location on the hull, since only one set of frames is obtained for each run down thetank. If the fluid is moving relative to the PIV system then one option is for the complete volume of the fluid tobe seeded. This option is feasible for a circulating water tunnel, where particles can be kept in circulation bythe moving fluid. This is not a practical option in a towing tank, which has a very large volume of stationaryfluid. Eventually almost all of the seed particles will either sink to the bottom or float to the surfacerequiring the fluid to be re-seeded after a certain period of time. A practical alternative is to introduce particles to the flow so that seeding is present only in themeasurement volume for the duration of the measurements. This should allow for a controlled use of theseeding particles, and should provide high quality PIV images, since the seeding density is correct for thevolume of fluid being studied, and the parts of the flow that are of no interest to the study are ignored. Thedisadvantage of this approach is that the seeding delivery system may affect the momentum of the seedingparticles and there may be a wake from the rake itself, which will influence the results. 3.1 Seeding Delivery System Since there was very limited experience to draw on with seeding systems for PIV in a towing tank, it wasdecided to make the initial system as cheaply as possible, so that it would be a small expense if it had to bescrapped completely. The key features required of the seeding rake was an even distribution of particles,and the lowest possible effect on the flow behind the rake. Since the wake of the seeding rake could not beeliminated completely, then it should be designed to be as low as possible and evenly distributed across thePIV measurement window. A seeding rake was constructed with multiple fingers to distribute the particles across a completemeasurement window. The rake was made with vertical fingers, which extended a maximum dimension of500 mm across the flow. Each finger had two rows of holes (3 mm diameter on 25 mm spacing). Seededfluid was injected normal to the direction of motion of the rake. The seeding particles used for all theexperiments were hollow, silver coated spheres (SH400S33) supplied by Potters Industries of Valley ForgePA, USA. This rake is shown in Figure 6. Figure 6, Five-fingered vertical seeding rake The system used hydrostatic pressure to deliver the seeded flow from the holding tank to the measurementvolume. Adjusting the height of the holding tank, relative to the water level, controlled the static head and atap was used to control flow rate. Water in the holding tank was taken from the tank. The seeding particleswere added and the mixture was stirred prior to carrying out an experiment, to keep the seeding evenlydistributed. 3.2 Analysis of Wake Behind Seeding Rake The wake of the rake was determined from experiments in the ice tank at NRC’s Institute for OceanTechnology. Two speeds were investigated, 0.5 m/s and 1.0 m/s, which were set from a computer file whichspecified the acceleration rate, the steady speed and the deceleration rate. One file was created for eachspeed, and only these files were used to control the carriage during the experiments. The steady speed partof the profile was checked against an independent sensor for five runs at each speed and found to be within99.93% of the nominal values. The seeding rake was fixed with its fingers across the direction of the undisturbed flow and parallel to thelaser plane directed across the direction of motion for the carriage. The rake position was moved over themaximum distance that was practically obtainable. Three locations for the rake were examined, withdistances of 720 mm, 1400 mm and 3600 mm ahead of the laser sheet. A sketch of the orientation of theseeding rake, the laser sheet and the direction of motion of the fluid is given in Figure 7. Vx was defined as horizontal flow within the laser sheet, Vy was the vertical flow component (positivetowards the free surface) and Vz was the flow through the laser plane, based on a right-handed coordinatesystem. Vc was the speed of the carriage (assumed to be the same as the undisturbed flow). For the calibration experiments it was possible to pre-seed the fluid and remove the rake during datacollection. These experiments were used to confirm the accuracy of the PIV system with no active seedingsystem. In this situation, seeding was carried out when the carriage was going in reverse and the rake wasremoved for the PIV measurements made with the carriage going forwards. Figure 7,Orientation of seeding rake and laser sheet, and velocity components In all the experiments, determining the optimum time interval between laser exposures required a certainamount of trial and error to obtain flow vectors over the maximum area within the field of view. The timebetween individual runs was approximately five minutes, although in some cases it was as low as three andin others it was as high as ten. It was not necessary to let all the particles settle out of the fluid but it wasimportant that the disturbances caused by the passage of the rake had died out, before a new data collectionrun was started. All data for this series of experiments was collected and analyzed using DaVis 7.1 (LaVision 2005). Theaverage and RMS deviation were calculated from the 50 pairs of PIV frames, using the time averagingfunction within DaVis 7.1. This function has a threshold value for the minimum number of time steps forwhich a vector was observed at a given interrogation window before the average and RMS values werecalculated. For all data sets used in the wake analysis the threshold value was set at 7. Varying thisparameter from 5 to 50 produced variations in the mean value of the vector modulus of less than 1.5%. Thevalue of 7 was found to be a reasonable compromise to remove values based on very small numbers ofpoints,without removing significant amounts of information. The calculated vector components with and without the seeding rake are given in Tables 5 and 6 for speedsof 0.5 m/s and 1.0 m/s respectively. Included in these tables are the results of the experiments with noseeding system. In all cases it can be seen that the Vx and Vy components of the flow (within themeasurement plane) are effectively zero, compared to Vz (through the measurement plane). The results show that at 0.5 m/s the location of the rake has little effect on the measured mean flow. Themean flow was between 10% and 12% lower than the nominal free stream case. The RMS deviation of theflow did not change with the location. At 1 m/s, the average wake fraction based on the three measurement locations was 15% of the free stream flow. There was more variation in the results than at 0.5 m/s, whichmay have been due to more turbulence in the flow. At 1 m/s, it was noticeable that the RMS deviation ofthe velocity decreased as the distance from the rake increased, whereas for 0.5 m/s it was approximatelyconstant. In both cases where the seeding rake was removed, the free stream speed calculated by the PIVsystem was the same as the set speed (within a 95% Confidence Interval). An effective wake fraction forthe seeding system was defined as (Vc-Vx)/Vc, (where Vc was the speed of the carriage) and the calculatedvalues for each experiment are given in Tables 5 and 6. When the flow patterns were studied in detail, the wake from the individual fingers could be seen as verticalbands within the in-plane plane velocity vectors at the measurement location closest to the seeding rake, butthis pattern dissipated as the distance from the rake increased. When the seeding rake was removed, thenumber of individual vectors used to calculate the mean flow pattern was considerably smaller than for thecases with active seeding. This highlights that even for very steady flow, the seeding rake provides uniformseeding concentration, but the average flow speed behind the rake is 12 to 15% lower than the nominal freestream case. When contours of Vz were inspected, it was seen that all the flow through the measurementwindow was effectively slowed by a uniform amount. Also, the rake had little effect on the unsteadiness ofthe in-plane velocities. In fact, rms velocity values were smaller over larger areas of the measurementwindow when the rake was present than when the rake was removed. It was not possible to tell if this wasdue to the low level of turbulence in the flow, or the reduced concentration of seeding particles, resulting inhigher variation in the sample means. The seeding rake creates an even distribution of particles across the PIV measurement window.Figure 8shows a particle image taken at 0.5 m/s with the laser 1400mm behind the seeding rake. This figure showsneither periodic waves of particles nor uneven clouds of particles, which were be observed in someprototype seeding rake designs. Figure 8, Particle distribution behind the seeding rake, 0.5 m/s It might be possible to reduce the level of the wake seen behind the seeding rake. The cylindrical sectionsused had the advantages of being cheap and readily available, but had a relatively high drag coefficient.Further work could be done in the development of seeding rakes with lower wakes, such as using airfoilshapes for the tubing rather than cylinders. It is unlikely that the wake from this type of system can beremoved completely, but a lower value than the current level of 12-15% is probably achievable. If the wakecould be reduced to 5% of the free stream flow, it would be a significant improvement over the currentsystem. Table 5, Results from experiments at nominal speed of 0.5 m/s Rake 720 mm away from laser 8t, us Cam_Date=060201_Time=095416 1(10oo Wake fraction -0.01655 Table 6, Results from experiments at nominal speed of 1.0 m/s Rake 720 mm away from laser 8t, us Cam_Date=060201_Time=100604 500 min max mean rms -0.35342 0.36902 0.01803 0.05916 0.26067 0.24988 -0.01902 0.03675 0.61718 1.30182 0.87445 0.07062 /V/ 0.64439 1.30560 0.87747 0.07233 Vc 0.99932 Wake fraction 0.124955 Rake 1400mm away from laser 8t, us Cam_Date=060131_Time=163013 700 min max mean rms -0.20548 0.21266 -0.00401 0.03873 0.12146 -0.16017 -0.00924 0.02317 0.69619 0.96175 0.81102 0.04233 /V/ 0.69984 0.98357 0.81232 0.04281 Vc 0.99932 Wake fraction 0.188427 Rake 3600 mm away from laserCam_Date=060201_Time=104155 ot, us 700 min max mean rms -0.20670 0.23962 0.01007 0.03318W 0.13346 -0.11231 -0.00091 0.02102 0.72836 1.02592 0.85856 0.03355 /V/ 0.75712 1.03112 0.85950 0.03396 Vc 0.99932 Wake fraction 0.140855 No seeding rake 8t,us Cam_Date=060201_Time=105457 500 min max mean rms W-0.16372 0.25600 0.00659 0.03708W 0.20408 -0.18448 -0.01302 0.02740 0.88357 1.20391 0.98504 0.04024 /V/ 0.84217 1.20609 0.98622 0.04045 Vc 0.99932 Wake fraction 0.014289 4.CONCLUSIONS A preliminary study (Molyneux and Xu, 2005) had shown that it was necessary to use a seeding rake whencarrying out experiments using PIV to measure the flow vectors around a ship model in a towing tank.Without active seeding of the flow, it was not possible to make consistent measurements of flow velocity,especially on the downstream side of the hull, because the seed particle concentration was too low. The rakewas needed to deliver seeding particles into the flow, and maintain the minimum concentration required foraccurate measurements. Ideally the rake should have no effect on the flow, but this is impossible. The nextbest option is to have minimum disturbance to the flow, and to have that disturbance distributed uniformlyacross the measurement window of the PIV system. The rakes used for these experiments created a uniform disturbance across the measurement area, butreduced the mean flow speed by 12 to 15%, depending on the flow speed. The location of the rake relativeto the measurement area has little effect on the measured mean speed, but the particle concentrationdecreases as the distance is increased. Since the area of the rake is large,in relation to the measurementarea, it should affect all of the flow being studied. As a result, if the same rake and relative location areused, then flow patterns measured for different geometric arrangements of a ship model should becomparable, but with a similar bias to the results, caused by the presence of the seeding rake. The estimated uncertainty for the PIV velocity analysis is higher than the range discussed by otherresearchers. This is principally due to the need to orient the laser sheet across the strongest direction of theflow, and the high level of magnification obtained. For the system described in this paper the uncertainty inthe measured flow speed is estimated be between 8% and 16%. The 8% values of uncertainty are estimatedfor a flow speed of 1.0 m/s with laser pulse times of 1000 us. The 16% value of uncertainty was estimatedfor a flow speed of 0.5 m/s, with a laser pulse time of 500 us. Using a smaller measurement area, with less magnification, would lower the uncertainty. Another way oflowering the uncertainty would be to increase the time between the laser pulses. The relatively highuncertainty was accepted for two reasons. The first was the desire for the largest measurement area from asingle field ofview. The second was because the measurement plane was across the strongest flowdirection. This is the primary plane of interest for many flow measurements around a ship hull (e.g. a wakesurvey through the propeller plane). This required relatively short laser pulse times to ensure the sameparticles are within the measurement space for both image pairs, which resulted in relatively high values ofuncertainty. The design of the rake should be improved so that it has a lower wake. It is unlikely that the wake will beremoved completely, but a wake of 5% would be a significant improvement over to the currently achievedvalue of 12-15%. 5.ACKNOWLEDGEMENTS The work described in this paper would not have been possible without the help and support of manypeople, which is gratefully acknowledged: Dr. Steve Anderson of La Vision, for providing advice and support based on his years of experiencecarrying out PIV experiments and designing PIV systems. The Canada Foundation for Innovation and the Newfoundland and Labrador Department ofInnovation, Trade and Rural Development for financial support of the purchase of the PIVsystem. Mr. Jim Gosse, Laboratory Technician in the Fluids Laboratory at Memorial University for allhis help during the set-up and carrying out the preliminary experiments in the OERC TowingTank at MUN. The staff at IOT for preparing the model for testing and assisting with the many tasks requiredduring experiments at IOT and the management of IOT is thanked for their financial support. 6. REFERENCES Calagno, G., Di Felice, F., Felli, M,and Pereira, F. 2002 ‘Application of Stereo PIV: Propeller WakeAnalysis in a Large Circulating Water Channel', 11* Symposium on Applications of Laser Techniques toFluid Mechanics, Calouste Gulbenkian Foundation, Lisbon, Portugal, 8" to 11h July, Paper 26-4. Di Felice, F. & De Gregorio, F. 2000‘Ship Model Wake Analysis by Means of PIV in a Large CirculatingWater Channel', Proceedings of 10"International Offshore and Polar Engineering Conference, Seattle,USA, May 28-June 2, pp. 392-397 Gui, L., Longo, J. and Stern, F. 2001,“Towing Tank PIV Measurement System, Data and UncertaintyAssessment for DTMB Model 5512', Experiments in Fluids, Volume 31, pp. 336-346. LaVision Inc. 2005‘DaVis Flowmaster Software Manual for DaVis 7.1' Lawson, N. J. and Wu, J. 1997(a)“Three-dimensional Particle Image Velocimetry: Error Analysis ofStereoscopic Techniques’, Measurement Science and Technology, Volume 8, pp 894-900. Lawson, N. J. and Wu, J. 1997(b) “Three-dimensional Particle Image Velocimetry: Experimental ErrorAnalysis of a Digital Angular Stereoscopic System', Measurement Science and Technology, Volume 8, pp1455-1464. Molyneux, W. D., and Xu, J. 2005 ‘Particle Image Velocimetry Experiments to Measure Flow Around andEscort Tug',IOT/NRC, TR-2005-10. Soloff, S. M., Adrian, R. J. and Liu, Z-C. 1997 ‘Distortion Compensation for Generalized StereoscopicParticle Image Velocimetry’,Measurement Science and Technology, Volume 8, pp 1441-1454. Xu, J., Molyneux, W. D. and Bose,N. 2005‘A Versatile Particle Image Velocimetry System for FlowMeasurements in Water Tanks’, 7" Canadian Marine Hydromechanics and Structures Conference, Halifax,N. S. September.
确定
还剩10页未读,是否继续阅读?

产品配置单
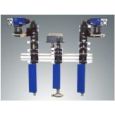
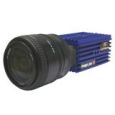
北京欧兰科技发展有限公司为您提供《拖曳水池,船舶模型中速度矢量场,速度场检测方案(粒子图像测速)》,该方案主要用于船舶中速度矢量场,速度场检测,参考标准--,《拖曳水池,船舶模型中速度矢量场,速度场检测方案(粒子图像测速)》用到的仪器有水下粒子成像测速系统(Under Water PIV)、Imager SX PIV相机
推荐专场


相关方案
更多
该厂商其他方案
更多