


方案详情
文
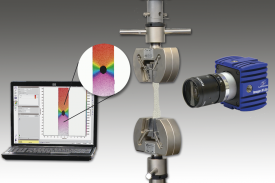
采用LaVision DaVis8.3 DIC 形变应变分析软件。对铝铜合金X射线成像数据进行分析,并和LBM-DEM模拟结果进行了定量对比分析。
方案详情

Acta Materialia 163 (2019) 208-225 209T.C. Su et al./Acta Materialia 163 (2019) 208-225 https://doi.org/10.1016/j.actamat.2018.10.0061359-6454/◎ 2018 Acta Materialia Inc. Published by Elsevier Ltd. This is an open access article under the CC BY license (http://creativecommons.org/licenses/by/4.0/). Contents lists available at ScienceDirect Acta Materialia ELSEVIER journal homepage:www.elsevier.com/locate/ actamat Full length article Semi-solid deformation of Al-Cu alloys: A quantitative comparisonbetween real-time imaging and coupled LBM-DEM simulations T.C. Sua*, C. O'Sullivan ,T.Nagira, H. Yasuda, C.M. Gourlay a Department of Materials, Imperial College London,London, SW7 2AZ, UK Department of Civil and Environmental Engineering, Imperial College London, London, SW7 2AZ, UKJoining and Welding Research Institute, Osaka University, 567-0047,Japan “Department of Materials Science and Engineering, Kyoto University, 606-8501, Japan ARTICLEINF O ABSTRACT Article history:Received 17 July 2018Received in revised form3 October 2018Accepted 4 October 2018 Available online 9 October 2018 Keywords:Semi-solidDilatancySynchrotron radiationImage analysisDiscrete element method Semi-solid alloys are deformed in a wide range of casting processes; an improved understanding andmodelling capability is required to minimise defect formation and optimise productivity. Here wecombine thin-sample in-situ X-ray radiography of semisolid Al-Cu alloy deformation at 40-70% solidwith 2D coupled lattice Boltzmann method - discrete element method (LBM-DEM) simulations. Thesimulations quantitatively capture the key features of the in-situ experiments, including (i) the localcontraction and dilation of the grain assembly during shear deformation; (ii) the heterogeneous strainfields and localisation features; (iii) increases in local liquid pressure in regions where liquid wasexpelled from the free surface in the experiment; and (iv) decreases in liquid pressure in regions wheresurface menisci are sucked-in in experiments. The verified DEM simulations provide new insights intothe role of initial solid fraction on the stress-deformation response and support the hypothesis that thebehaviour of semi-solid alloys can be described using critical state soil mechanics. o 2018 Acta Materialia Inc. Published by Elsevier Ltd. This is an open access article under the CC BY license (http://creativecommons.org/licenses/by/4.0/). 1. Introduction Pressurised casting processes such as high-pressure die-casting[1-3], squeeze casting [4,5], and twin-roll casting [6-8] are widelyused in metal processing. These casting techniques often induceshear deformation with compressive stresses on semi-solid alloyscontaining a solid network, and the complex stress and strainlocalisation can lead to casting defect formation such as concen-trated porosity [9-12], macrosegregation [7,13-16] and shearcracking [15]. These defects have been related to the occurrence ofshear-induced dilation [9,10,16-19], and subsequent strain local-isation. The behaviour is similar to the Reynolds' dilatancy phe-nomenon [20] in densely packed granular materials [21], whoseload:deformation behaviour is well-described by critical state soilmechanics [22]. In the last decade, in-situ deformation experimentson semi-solid alloys using thin-sample radiography [23-30] andbulk-sample tomography[31-33] have enabled direct observationof semi-solid deformation mechanisms. These have directlyconfirmed that shear-induced dilation [24,34] leads to grain ( * Corresponding author. ) rearrangement and strain localisation, and can cause macro-segregation [27,34] and shear-cracking [34]. Modelling studies of semi-solid deformation have includedthixotropic viscosity-based models [35-37]; strain localisationcriteria [38,39]; finite-element microstructure-based models athigh solid fraction [40,41]; models of deformation-induced mac-rosegregation (e.g. in the continuous casting of steel [42-45]); andmodels of hot tearing under tensile load [46-48].In most of thesecases, the models do not account for isothermal shear-inducedvolume changes including dilatancy. To address this, here weadopt the particulate discrete element method (DEM), as it is well-suited to modelling deformation involving grain rearrangementwithin a solid network with dilatancy, coupled with the latticeBoltzmann method to simulate the behaviour of the interstitialliquid; this approach has not previously been used in semi-solidmetals research. In DEM, each particle (grain) in an assembly is explicitlymodelled, the force imposed at each grain-grain contact is deter-mined by a specified force-displacement law [49], and grain dis-placements are determined explicitly by considering dynamicequilibrium. Particulate DEM has been broadly applied to simulatedeformation in granular matter such as soils [49], rock-liquid mixtures [50,51], partially molten magma [52], cement pastes[53,54], and powder metallurgy [55,56]. Furthermore, couplingwith the lattice Boltzmann method (LBM) allows the behaviour ofthe interstitial liquid phase to be captured and solid-liquid mo-mentum interactions to be modelled [57-61]. A few studies havealso applied DEM to simulate semi-solid alloy deformation[62-64]; Sistaninia et al. [62,63] developed a 3D model for highsolid fraction deformation based on a combined discrete/finiteelement method, while Yuan et al. [64] simulated dendrite rear-rangement and shear-induced dilation behaviour as a function ofsolid fraction during 2D equiaxed dendritic solidification. However,these studies did not apply a coupled DEM-LBM approach to ac-count for the particle-liquid interactions. In this paper, we begin by analyzing four synchrotron radiog-raphy datasets of shear deformation in globular semi-solid alloys at44-71 vol % solid, each containing~1000-2000 grains in the fieldof view and approximately one grain thick. The relatively largegrain assemblies enable a study of the development of strain het-erogeneities and localisation features. The synchrotron datasets arequantified by X-ray intensity analysis and digital image correlation(DIC). A 2D liquid-solid coupled LBM-DEM model is then developedusing the initial microstructures from the synchrotron experimentsas inputs. A single set of DEM parameters was determined by cal-ibrating the model across all deformation experiments from 44 to71% solid so that only the initial solid fraction and contact stresswere varied in the parametric study. The simulations and experi-ments are compared quantitatively, and then the simulations areused to extract deeper insights into the semi-solid deformationmechanisms occurring in the experiments. 2. Methods 2.1. Synchrotron radiography Al-Cu alloys containing 8 and 15 wt% Cu and grain refined with1 wt% Al-5Ti--1B were cast into a steel mould to create fine equi-axed dendritic microstructures. Slices with thickness 150-200 umwere prepared from the casting. A slice of alloy was placed in the200 um thick cavity between two Al203 windows, and two BNplates were attached to complete the specimen cell as described inRef.[26]. 2.2. Synchrotron image processing and quantification In order to calculate the initial volumetric solid fraction, g, X-ray intensity processing was applied to the radiographs. For anisothermal mush with fully mixed liquid, in each transmitted imagethe intensity at a pixel, Ist, is mainly a function of the solid fractionin that beam path, the X-ray absorption coefficients, and the samplethickness [23,66: where Io is the incident X-ray intensity,wL, Ms, and ucell are the X-rayabsorption coefficients of the liquid, solid and shear cell (i.e., Al203windows). Lallov, Ls are the length of semi-solid alloy and solid inthe beam path respectively. As the deformation experiments wereconducted isothermally, the X-ray absorption coefficients can beregarded as constants. For the initial radiograph I& ( indicatesparameters prior to deformation), it is assumed that the samplethickness Lalloy was uniform, so the intensity of the transmittedbeam through the alloy i& is only a function of L and can be linkedto the solid fraction gs in a given averaging area A [23]: where l is the transmitted intensity through 100% liquid andequals to I(=0), i is the transmitted intensity through 100%solid and equals to l(L=Lalloy), and A is the averaging area on L/Lalloy to derive solid fraction, gA. The ly and i?fields were evaluatedfrom the local intensity minimum/maximum images IsL.min I.maxusing a rolling-ball algorithm [67] on the radiograph Is prior todeformation. Throughout the paper, the average stress and strainmeasurements were determined by using a consistent normalisedREV size to account for the effect of grain size on the quantificationof stress and strain heterogeneity. In all cases the REV size wasnormalised by the grain size of the corresponding experiment/simulation. The rolling-ball radius was the nearest integer of √10d/2 (d is the mean grain size measured by a line intercept method) inorder to obtain representative minimum and maximum intensities.The i min and I.max can be simply rewritten as I(Lg=Lmin) andI(=Lmax) where Lmin and Lomax are the local minimum andmaximum thickness of solid phase defined from rolling-ball scan-ning, respectively. To relate the Imin and IL. max fields to the l? andI fields, two multipliers r and rs were introduced to let r·s.minconverge to the centre of liquid interstices, and let rs·IsL.max capturethe brightest pixel of grains. The volume fraction of solid, g?, wasthen obtained by averaging L/Lalloy values within the FOV, whichcanbe represented as g=grov=(i/lioy noywith theassumption of 1=ru·1z.min and i=rs·1 max With this approach,the measured initial volume fraction of solid was 44%,50%,66%, and71% for these four samples. The initial volumetric solid fraction, g?, coupled with the bulkalloy compositions were applied to calculate the X-ray absorptioncoefficient of the liquid,ul, and solid, us [68]: where pL and ps are liquid and solid densities calculated usingreference [69], WAlL,WCu.L,WAl.s, and wcu.s are the mass fractions ofaluminium and copper in the liquid (L) and solid (S) from the phase Table 1 A summary for in-situ observation on semi-solid deformation experiments performed at the SPring-8 synchrotron facility, Hyogo, Japan. The push-plate moving rate wasmeasured directly from time-series images. The average semi-solid alloy grain size was measured by applying the line interception method on the initial radiographic pro-jection image (ASTM E112-96 standard test method). The volume fraction of solid was evaluated by applying a volume averaging method to the initial image (see Supple-mentary Information 1). Parameters (experiment#) Unit 44% solid (15071202) 50% solid (15071409) 66% solid (15071203) 71% solid (18013006) Alloy composition wt.% Al-15Cu-0.05Ti-0.01B Al-15Cu-0.05Ti-0.01B Al-8Cu-0.05Ti-0.01B Al-8Cu-0.05Ti-0.01B Average grain size, d um 80 120 130 120 Average volume fraction of solid, g; 44% 50% 66% 71% Sample dimension width xheight mm 10.0×5.0 10.0×10.0 7.5×10.0 10.0×10.0 Radiography pixel size um 2.5 2.5 2.5 2.75 Field of view (FOV) mm 5.1×5.1 5.1x5.1 5.1x5.1 5.6×5.6 Averaging size for local solid fraction, A pxl 101 151 165 139 X-ray absorption coefficient of liquid, cm -1 59.6 63.3 49.1 52.6 X-ray absorption coefficient of solid, us cm 22.9 23.5 21.3 21.8 diagram [70], and (w/p)Al (w/p)cu are the mass X-ray absorptioncoefficients of pure aluminium and copper at 16 keV X-ray energy[71]. The evaluated j and us were used to calculate Lalloy and Ls-S.minprior to deformation: With this approach, the initial thickness of the semi-solid wascalculated to be 180±30 um for the four samples, consistent withexpectation. The solid fraction field, gs.Rev, was obtained for images beforeand during deformation by volume averaging L/Lalloy over pro-jected areas of √10d × √10d which is a representative elementaryvolume (REV) that is sufficiently large to average the local micro-structure and small enough that important variations in the solidfraction gs.Rev can be captured [72,73]. The averaging REV size andX-ray absorption coefficients are summarised in Table 1. A detailedexample of finding the g? and gRey fields from radiographs isillustrated in Supplementary Information (SI) Section 1. During deformation, the local sample thickness can change. Thesample thickness field in frame n, Lalloy can be found throughrearranging Eq.(1) and obtaining IsL.min by applying the rolling-ballalgorithm on each radiograph Is: where Ls.min is the local minimum thickness of solid phase. Alter-natively, Lalloy can be evaluated from the transmitted intensitythrough a point of 100% solid in frame n, I through rearranging Eq.(1): Whether Eq. (5) or Eq.(6) is better suited to calculating Lalloydepends on whether Lemin or I can be more accurately measured.To proceed, we identified regions that meet one of the followingthree criteria. · For regions with sufficiently small deformation, the change ofLs.min can be neglected. Therefore, it was assumed that for anyREV with an average grain displacement <0.05uz, Ls.min=Ls minin Eq. (5). (u is the y-component of push-plate displacement inframe n): · For regions with a sufficiently large liquid interstice, the IsL.mincan be regarded as the intensity of liquid, I. Therefore, it wasassumed that for any REV with a liquid interstice ≥0.2dx0.2d,Ls.min=0 in Eq. (5). 。 For regions with highly-compacted solid grains (i.e., in front ofthe push plate), the IsL.max can be regarded as the intensity of thesolid, Is. Therefore, it was assumed that for any REV withaverage grain displacement >0.95uZ anduy>0.25 mm, the ls=IsL.max and Lalloy was found using Eq.(6). Sufficient regions met one of these three criteria that the wholeLalloy field could be computed from interpolation of≈100 scatteredLalloy(x,y) points per frame.A step-by-step guide to the procedure isgiven in SI Section 2. The volumetric solid fraction field for radio-graph n, gs.Rev, was then obtained: The volumetric strain of any representative element, enol, wasevaluated from the volume-averaged solid fraction gs.Rey and gsRevusing Eq.(9) which is derived in SI Section 2: 2.3. Digital image correlation (DIC) analysis DIC analysis was applied on the synchrotron datasets using the2D Strain Module in DaVis 8.3 software (LaVision Imaging Com-pany, Goettingen, Germany). The side length of the square subsetused for correlation was the nearest odd integer of √10dpxl (dpxl isthe mean grain size in pixels) similar to the REV for deriving gs Revin order to offer sufficient greyscale pattern for correlation whilemapping heterogeneous strain. The step size was set to the nearestinteger of √10dx/4 to reconstruct the displacement vector fieldwith reasonable resolution. The DIC parameters used are listed inTable: 2.Thee accumulated displacement was (conducted by Table 2 Summary of parameters selected for conducting digital image correlation (DIC). Parameters Unit 44% solid 50%solid 66% solid 71% solid Average grain size, d um 80 120 130 120 Average grain size, d in pixels pixel 32 48 52 44 Correlation subset size pixel 101 151 165 139 Correlation step size pixel 25 38 41 35 summing all displacement vectors from the correlation betweenthe 1st/2nd frames to (n-1)"h/nth frames for each calculation point.The conversion to rotation-free strain fields was performed bypartial differentiation on the accumulated displacement vectorfield and using the polar decomposition algorithm [74]. Finally, allof the displacement vector fields and strain fields were filtered bythe bilinear interpolation method [75,76] to smooth out discon-tinuous features. 2.4. Discrete element method (DEM) simulations Since DEM is not commonly used in semi-solid alloy model-ling, the general principles are outlined here. DEM is a dynamicmodelling technique that idealises an assembly of solid particlesas quasi-rigid bodies in mechanical contact. Initial and boundaryconditions are specified and the main calculations take place atdiscrete time intervals; these calculations determine the forcesand moments acting on each particle/grain, and update theparticle positions and orientations. The force and moment(scalar in 2D DEM) components considered here arise fromRef. [49]: 1. Pair-wise contact: direct interaction between two grains, orbetween a grain and wall. These are determined via a contactdetection phase that identifies contacting particles and usingcontact models that relate grain overlap to a contact force. 2. Pair-wise bonding: non-contact bonding that allows tensilecontact forces between grains (this is used to simulate themembrane boundary here) 3. Gravitational (body) force. The DEM model used here does notinclude a gravitational field since the movement of grains in theexperiment is observed to be majorly controlled by the physicalcontact between grain surfaces rather than gravity. In each DEM calculation cycle, the dynamic equilibrium ofeach particle is considered to determine an acceleration, aVerlet-type explicit time integration is then used to determinethe particle displacements and rotations for the current timestep from the acceleration value. The particle positions, orien-tations and velocities are updated and these new positions andvelocities are used to calculate the contact and drag forces forthe next time increment. DEM is algorithmically similar tomolecular dynamics. 4. Drag force and moment from liquid flow. Digital 2D grain assemblies were generated to represent eachmicrostructure from the thin sample (~1 grain thick) experiments.To obtain the size and shape distributions, 120 grains were pickedfrom a radiograph prior to deformation for each dataset (Fig. 1a andb). The perimeter of each grain was identified using the “pointpicker”plugin in ImageJ (National Institute of Health, USA), and aleast-squares elliptical function was fitted to the perimeter points,as shown in Fig. 1c. The usage of the elliptical function was becausethis gave a good fit to the actual globular grain shape whilecapturing the asphericity in a computationally efficient way. Toreduce the calculation cost further, each ellipse was simplified as two equivalent overlapping circles (Fig.1d). Grain size and shapedistributions were reproduced by picking and simplifying 120grains from the radiograph and converting them into 20 graintemplates to generate a grain assembly in the DEM package PFC2DVer. 5.0 (Itasca Consulting Group, Inc). To generate a DEM sample,these grains with normal stiffness 1×10⁴ N/m were constrainedby a rectangular box with the same size as the thin-plate sample foreach experiment, and then isotropic compression was applied by aservo-controlled mechanism until a target 2D stress of 500 N/mwas reached. Examination of experimental radiographs showed that theoutside Al203 wall did not touch the semi-solid samples asshown in SI Section 3 (Fig. SI-6) except for the left edge of the71% solid sample and there was only a small degree of surfacedeformation (with displacement <0.15d). We can infer from thisthat the sample is constrained by surface tension, i.e. the motionof a grain at the free surface would increase the local curvature ofthe liquid-air interface, which would decrease the local liquidpressure and apply a suction that resists grain motion. In thisway, the surface grains have an apparent cohesion and surfacetension stabilises the free surfaces against gravity and preventsslumping. To simulate the apparent cohesion, the rigid wallswere deleted and the surface grains were assigned partialcohesion using parallel bonds in PFC2D that create a movablemembrane boundary that constrains the packing of grains similarto reference [77,78]. These parallel-bonded surface grains areshaded red and linked by red lines in Fig. 1e-g. With thisapproach, a constraint force, Fn, would be installed on anymembrane grain if the grain started to displace outward, and thedirection of Fn for the membrane circle was determined from theposition of its two adjacent membrane grains (Fig. 1h and i). Thesample generation stage finished when the maximum magnitudeof grain velocity in the system was less than 10-7m/s, and theaverage contact force magnitude excluding membrane circles, Fo,was extracted to obtain the extent of the pre-existing forcenetwork for each sample. The initial 2D packing fraction, fpk,was measured for each assembly by randomly distributing 5000measurement circles with diameter 20d across the whole as-sembly (see SI Section 7 for the descriptions of measurementcircle). To simulate the push-plate, a new rigid wall was intro-duced as illustrated in Fig. 1e. The use of measurement circles asa representative volume (RV) follows measurement approachesin the DEM literature [79-81]. The concept of a circular RV inDEM analysis here is different from the use of square/rectangularREVs for image analysis suggested by Ref. [23]. The key parameters used for the DEM simulations are sum-marised in Table 3. The solid phase densities differed in the fourvirtual samples because experiments were either carried out atdifferent temperatures or with different bulk alloy compositions toachieve the range of solid fractions, and the density was calculatedusing the composition and temperature-dependent equations ofref. [69]. However, the simulated results would not be significantlyaltered if a single density had been used across all simulations. Alow sliding friction coefficient, u, was used at contacts as the liquidphase is expected to provide lubrication, while the rolling- (f) (9) Fig. 1. The procedure to simulate semi-solid deformation adapting microstructures from deformation experiments: (a) in-situ synchrotron radiography imaging on 66% solidsample before deformation, (b) 120 particles selected for shape analysis, (c) circled particle in (b) fitted using an elliptical equation, and (d) the corresponding two-circle grain usedto represent the shape of the fitted ellipse in (c). After adapting particle size and shape distribution by measuring 120 particles, a grain assembly (simulation C) was created whichwas constrained by the push plate and membrane as shown in (e), and (f) is the deformation microstructure during push-plate displacement with rate duy/dt=30 um s-1. Theblack lines in (f) indicate the contact force chain and the thickness of each line is proportional to the contact force magnitude. The blue solid square in (e-f) indicates the cor-responding field of view in X-ray imaging.(g-h)The cropped region from the dash-line square in (e)and (f), respectively.(h) Showing that constraint force normal to the membranewas applied as the membrane boundary deformed,and (i) the determination of normal force direction from two adjacent circles. (For interpretation of the references to colour inthis figure legend, the reader is referred to the Web version of this article.) resistance coefficient, jr, was specified from the consideration ofthe non-spherical shape of particles and the existence of contactsurfaces rather than point contacts [82]. High bonding strengthswere assigned to the membrane contacts to prevent bond breakage. Past DEM studies have shown that, provided changes in themean grain size do not significantly alter the number of grains inthe sample, many of the deformation features scale with the meangrain size [83,84]. The contraction or dilation behaviour is sensitiveto initial solid fraction and the average grain size plays a moreminor role, mainly affecting the magnitude of volume change. To account for the plastic deformation of grains during sheardeformation, the contact force-overlap relationship in Fig. 2a was applied. This represents the flow curve of Al alloys deformed atconstant shear rate without work hardening after yielding (Uy,Fy)at homologous temperature near to 1.0[85]. The setting of anelastic unloading/reloading path between an unloading point (Uun,Fun) and residual overlap point (Ures,0) shown in Fig. 2a enables thegrain-grain contact to follow the behaviour of cyclic loading in al-loys [86]. This plastic force-overlap relationship did not apply onthe grain-wall contacts or any bonded contacts between two cir-cular membrane grains. The membrane boundary and plastic force-overlap relationship were incorporated using the embeddedscripting language FISH in PFC2D, and the detailed code de-scriptions are in SI Section 4. Table 3 Parameters used during shear deformation stage. The initial void ratio eo =(1- To ensure the mechanical stability of deformation simulation, there is a nonzeroslope of force-overlap relationship after yielding point corresponding to the red linein Fig. 2a. The timestep setting allows the push plate have a constant vertical displacement2.00×10-10 m between two calculation cycles for all simulation datasets. 2.5. LBM-DEM two-phase coupling In order to incorporate the liquid phase, the lattice Boltzmannmethod (LBM) was applied and LBM-DEM coupling as proposed byCook et al. [57] was used. The LBM solves the Navier-Stokes equa-tions for the liquid on a regular grid. Each grid node contains apacket of liquid particles that are allowed to move in horizontal,vertical and diagonal directions. The grid nodes in the vicinity of aliquid-solid surface act as a no-slip bounce-back boundary to theinterstitial liquid. The detailed description of governing equationsand key parameters in the LBM-DEM coupling adopted in thisresearch is given in SI Section 5. The rectangular LBM grid extended beyond the DEM sampleboundaries (Fig. 2b). The lattice spacing was 40 um, and the averagegrain size d to lattice spacing ratios were 2-3; an immersedboundary scheme was used to achieve sub-lattice resolution. Theliquid density, pL, calculated from Ref.[69], dynamic viscosity, w,from Ref. [87], and LB liquid calculation timestep are listed in (b) (C) Fig.2. (a) Normal force-overlap relationship used in the DEM simulation where Fo isthe mean contact force prior to deformation related to initial solid fraction g?, and Uo isthe corresponding mean contact overlap.(b) Installing the Al-Cu liquid domain on theDEM grain assembly (Fig. 1e) by setting liquid lattice nodes and liquid boundaryconditions. The Al-Cu liquid domain is controlled by fixed bounce-back boundary(black dashed line), moving bounce-back boundary (green dashed line), and solid zoneoutside of the membrane (grey-shaded area) corresponding to the lattice solid fractione=0.(c) The magnified view of the dashed grey box in (b) showing the DEM grains,membrane circles, solid zone, and lattice nodes with spacing 40um. (For interpretationof the references to colour in this figure legend, the reader is referred to the Webversion of this article.) Table 4. The kinematic viscosities (uLlp) used in the four simula-tions were in the narrow range 6.10-6.75×10⁻⁷m²/s, showingthat the Cu concentration in the liquid has a minor effect on theliquid flow behaviour. Following past work on interstitial liquidflow and permeability in 2D simulations of packed granular ma-terials and porous media [88-90], the concept of a“hydrodynamicradius” was used and set to be 0.8. This enables the liquid and solidphases to both exist as percolating networks as in the thin sampleexperiments. Before deformation, the liquid velocity was initialisedas zero. The LB bounce-back boundary condition [91] was appliedon boundary nodes (dashed black line in Fig. 2b), and the LB nodesoutside of the DEM membrane boundary were identified as aneffective “solid zone" to inhibit liquid Al from flowing out of theDEM sample. The solid zone applied in the LBM simulations has noeffect on the DEM simulation of the grains. When the membranedeforms, the LBM solid zone adapts to the new shape of themembrane. Table 4Liquid parameters used in LBM-DEM coupling simulation. Property Unit Value Liquid density, pL kg m' Simulation A, for 44% solid sample 2903 Simulation B, for 50% solid sample 2948 Simulation C, for 66% solid sample 2787 Simulation D, for 71% solid sample 2810 Liquid dynamic viscosity, u Pa s Simulation A, for 44% solid sample 1.92×10⁻³ Simulation B, for 50% solid sample 1.99×10⁻³ Simulation C, for 66% solid sample 1.70×10 Simulation D, for 71% solid sample 1.75×10⁻³ LBM Simulation timestep, ot S 6.66×10* The timestep setting in LBM was 100 times higher than DEM timestep listed inTable 3. During shear deformation, the push plate acts as a movingbounce-back boundary [92] and nodes overlapping with the pushplate are automatically identified as solid. The liquid pressurechange Ap in response to shear deformation was derived from thechange of liquid density for each LBM node, and the speed of soundcs, in the LBM domain (detail in SI Section 5): where po is the initial liquid density listed in Table 4, and p(xi, t) isthe liquid density at position X; at simulation time t. The liquid dragforce and moment acting on DEM grains were updated by a cycle ofthe LBM-DEM coupling algorithm (see SI Section 5 for detail). 3. Results and discussion 3.1. Analysis of radiography image sequences Fig. 3a-d shows processed in-situ X-ray images from fourdatasets prior to deformation. Each image shows the solid fractionin the beam path, L/Laloy, at each pixel, calculated from thetransmitted intensities using Eq. (2) and SI-Eq. (3). In this conver-sion, white represents solid (L/Lalloy=1) and black representsliquid (L /Lalloy=0). Pixels with L/Lalloy value not falling in therange [0,1] are coloured red, and are mainly regions of oxide andpores. Fig. 3e-h are the Ls/Lalloy field after a push-plate displace-ment of 5d for each dataset. The changes in intensity of the Ls/Lalloyshading indicate changes in the local solid fraction due to grainrearrangement and liquid flow. The L/lalloy fields were volume averaged using a REV of√10d x√10d to obtain the solid fraction field prior to deforma-tion (Fig. 3i-1) where the red pixels in Fig. 3a-d were excludedfrom the averaging process. Fig. 3i-l shows that the solid phasedistribution before deformation is slightly segregated with a highersolid fraction nearer the top of the FOV. This is especially evident forthe 44% solid dataset and is due to grain buoyancy in Al-15Cuwhere the density of the solid is lower than the liquid [69]. Aftera 5d increment of push-plate displacement, Fig. 3m-p shows thedevelopment of more heterogeneous solid fraction field. In allsamples, Fig. 3m-p shows accumulation/compaction of grains andexpulsion of liquid (hotter colours) in front of the push plate wherethe local gs.Rev is increased to ≈0.8. Additionally, for the 66% and71% solid samples, a reduced solid fraction and increased liquidfraction (cooler colours) with geRey from 0.4 to 0.5 is present aheadof the compaction zone. The local changes in solid fraction correspond to volumetricstrains in the grain assembly, which are plotted as volumetric strainmaps ein Fig. 3q-t using Eq. (9) on the volume-averaged solidfraction maps. It is clear from Fig. 3q-t that, for initial solid frac-tions of 44% and 50%, deformation is mostly contractive (blue) withonly small pockets of local dilation (red) and, as the initial solidfraction increases, an increasing proportion of the sample un-dergoes shear-induced dilation (red) and the magnitude of localdilation increases. In Fig. 3q and r, the push-plate displacement onthe low solid fraction datasets (44% and 50%) developed acompaction field with e"-0.3, while the compaction zone in66% and 71% solid datasets is less significant (Fig. 3s and t), wheree" falls in the range -0.2~-0.1. It should also be noted that thenegative eregions to the right of the FOV in Fig. 3s and the right-bottom of the FOV in Fig. 3t represent local contraction corre-sponding to the suction of liquid away to the dilating regionselsewhere in the sample. While there are differences between bulk 3D deformation andthe current study on thin sample deformation with interactionswith the confining walls, we note that the key features measuredhere have also been measured in bulk 3D tomographic imaging [31]and in microstructures after semi-solid deformation experiments.For example, shear-induced contraction in samples containing aloose solid network [17], shear-induced dilatation in samples con-taining a dense solid network [9,19], and the localisation of dilat-ancy [9]. The main deformation mechanisms that increase and decreasethe solid fraction and cause volumetric strain in Fig. 3q-t, and theresultant heterogeneous solid fraction field in Fig. 3m-p are shownin Fig. 4 using the 66% solid sample as an example. In region A, theincrease in solid fraction (contraction) can be seen to be due tograins being pushed closer together and expelling some interstitialliquid and, in this case, also due to compression of the individualgrains. In region B, the decrease in solid fraction (dilation) is due tograins moving apart and liquid being drawn in interstitial. In regionB, all grains are in mechanical contact with their neighbours and,therefore, the shear-induced dilation (dilatancy) is caused by grainspushing one another apart under the action of compressive andshear contact forces. 2D displacement fields were obtained by tracking the motion ofgrains using DIC. Fig. 5a-d shows the incremental displacementvectors for a push-plate displacement of 0 to 5d for each dataset,and the background image is the time averaged radiographs from0 to 5d push-plate displacement for comparison. The vectors inFig. 5a-d represent grain movement and show that, for the samepush-plate displacement, grains are displaced deeper into thesample as the initial solid fraction increases. The displacementvector field in DIC can be directly converted to shear strain (exy)fields as shown in Fig. 5e-h, where the background for each shearstrain field is selected as the image at 5d push-plate displacement.In Fig. 5e-h, it is clear that the exy is highly localised above the top-right corner of push plate. The red region near to the parting planein the 44% solid sample (Fig. 5e) is relatively small, while the redbands of localised shear strain form in 50% solid (Fig.5f). A more-developed region of shear strain along the parting plane can befound in Fig. 5g and h which is wider and deeper than in Fig. 5e-f.From Fig. 5e-h, it can be seen that at the same push-platedisplacement a higher solid fraction induces a larger area of shearstrain(red) around the parting plane. The formation of blue regionsin Fig.5g and h is due to Exy <0 development near to the left partingplane aligning with the top-left corner of push-plate (outside of theleft edge of the FOV). Volumetric Strain evo (from X-ray Intensity) [-] Contraction+ Dilation Fig. 3. Analysis of experimental X-ray datasets. (a-d) Calculation of L'/Lalloy (the fraction of solid at a beam path) field on synchrotron X-ray imaging before deformation and(e-h)L/Lalloy field on deformation after 5d increment of push-plate displacement. The conversion from L/Lalloy or L/Lalloy field to image is shown in SI-Eq. 3.(i-l) Average filteredresults from (a-d) with window size √10d x √10d showing initial solid fraction field gRev·(m-p) Average filtered results from (e-h) showing solid fraction evolution gsRevduring deformation.(q-t) The evaluation of volumetric strain e"using Eq. (9). Images in the leftmost column correspond to the 44% solid sample, followed by 50%, 66%,and 71%solid samples, respectively. White-line scale bars read 2mm. four experiments while varying few parameters: the initial packingfraction (i.e. the solid fraction), the initial average contact stress,solid/liquid densities, and liquid viscosity directly linking to cor-responding experiments. Note that, while the solid/liquid densities Radiography Image of 66% Solid Before Deformation cB 2mm Fig. 4. Microstructure of deformation experiment at 66% solid. Two regions from the image were selected for detailed observation in order to gain insights on strain localisation.Region A shows high compaction along the y-direction, while the shear-induced dilation phenomenon can be clearly seen in region B when push-plate displacement (uy) equals to10d. Similar dilation behaviour can be observed in region B in the LBM-DEM simulation. and liquid viscosity were calculated for the relevant temperatureand phase compositions, the variation in these parameters is smalland the simulated results would not be significantly altered if asingle density and liquid viscosity value had been used across allsimulations. Thus, effectively two parameters were varied. Theoptimised set of parameters including contact stiffness values andfriction coefficients is shown in Table 3, and was found by an iter-ative approach to reproduce the deformation microstructure ineach experiment across the full range of applied displacements.This was done by starting with literature values for stiffness [64,93]and friction coefficient [64,82,93,94], and then varying these toobtain a good correlation (enorm in Eq. (11) within 10%) of the 1Ddisplacement profile between simulation and experiment. To enable direct comparison DIC analysis was performed onDEM simulated data, using the same DIC techniques and parame-ters as in the experimental analysis. To do this, DEM grains werecoloured by random greyscale to construct a speckle pattern, thepixel size and FOV of DEM microstructure plots were adjusted to bethe same as in radiography images,and the same DIC parameterswere used (Table 2). Fig. 5i-l shows the result for the displacementfields, and a good correlation of vector fields between experiment(Fig.5a-d) and simulation (Fig. 5i-l) can be seen. It can also be seenthat the DIC shear strain fields from the simulations (Fig. 5m-p)correctly capture many of the shear strain localisation character-istics in the experiments (Fig. 5e-h). For example, the shape andextent of the red localised shear zones, and the influence of initialsolid fraction on the shear strain fields are well reproduced. Alsonote from Fig.5g and h, that the shear strain is positive just in frontof the push plate for the 66% solid sample while it is negative for the71% solid sample. This is because the boundary conditions areslightly different for these samples. In the 66% solid sample(Fig.5g), the sample sides did not touch the Al203 side walls and, inthe 71% solid sample, the left edge of the sample is in contact withthe Al2O3 side wall (as introduced in section 2.4). The simulations inFig. 5o and p used the boundary conditions measured for eachexperiment and gave a similar result. This is because constraintfrom the left side wall prevents grain displacement to the left,resulting in a change in shear strain direction. The displacement vector fields in Fig. 5i-l were then interpo-lated and scanned to construct grain displacement profiles asshown in Fig.6a, which plots the grain displacement relative to the push-plate displacement at various distances ahead of the push-plate along a 1D line starting at the middle of the push-plate asindicated by the vertical dashed line in Fig. 5m. Comparison of the1D displacement profiles between experiments and simulationsafter a 5d increment of push-plate displacement confirms that thesimulation reproduces the gradient of the displacement as well asthe higher relative displacement in higher solid fraction datasets.To quantify this, Fig. 6b is a bar chart of the normalised error ofsimulated displacement profiles compared with the experiments,enorm, with increments of push-plate displacement from 1d to 5d.The normalised error is defined as: where Y=250pm and Y2=3000um are the nearest and farthestpoints from the middle point of the push plate in the FOV,uEXP anduDEM are the push-plate displacement lengths, and 8EXP(Y) andDEM(Y) are the interpolated displacement magnitude in scan pointY in an experiment and simulation. The scan resolution is 1 um.From Fig.6b, it can be seen that the error value enorm is <10% for allexperiment/simulation pairs, indicating good agreement betweensimulation and experiment. We next examine how closely the simulations can reproduce theheterogeneous strain patterns observed in the radiography data-sets. Comparison between localised strains can be simplified by theconversion from two-dimensional strain fields to averaged one-dimensional line profiles by averaging along x or y within a ROI,as shown from Fig. 7 to Fig. 10. In (c) and (d) of Figs. 7-10, the redlines correspond to LBM-DEM simulations and the black linescorrespond to experimental measurements taken from the red ROI(box outlined by the red-dashed line in (a) and (b) of Figs. 7-10,which is averaged along y). The red ROI was selected to investigatethe development of strain heterogeneity across the parting plane.In (e) and (f) of Figs. 7-10, the blue lines correspond to LBM-DEMsimulations and the black lines correspond to experimental mea-surements taken from the blue ROI ahead of the push plate (boxoutlined by blue-dashed line in (a) and (b) of Figs. 7-10, which isaveraged along x). The blue ROI was selected to investigate the Shear Strain Exy (from DIC) [-] Fig. 5.(a-d) The superimposition of time-averaged raw images and displacement vectors for experiments. Each time-averaged image is the averaging of radiographic imagesequences from the onset of deformation to the deformed image after 5d increment of push-plate displacement, and the displacement vectors are derived from digital imagecorrelation (DIC). The spacing between two adjacent displacement vectors is equal to the DIC subset size of that dataset.(e-h) Shear strain exy field for experiments derived fromDIC. The background images were chosen as the push-plate displacement= 5d radiographs. (i-l)The superimposition of time-averaged speckled DEM grain plots and displacementvectors.(m-p) Shear strain exy field for simulations derived from DIC. The dashed line in (m) indicates the middle of the push-plate. The first row corresponds the 44% solid sampleand simulation A, followed by 50% solid/simulation B, 66% solid/simulation C, and 71% solid/simulation D. Black-line scale bars read 2mm. transitions of contraction-to-dilation response ahead of the pushplate. The strain profiles acquired from triangulation are "jumpy"because the strains are calculated from the relative positionchanges of groups of three adjacent grains without any averagingby a REV. It can be seen in Figs. 7-10 that, in general, there is goodagreement between experiments and simulations. Specifically, thestrain profiles from the 44%solid fraction experiment and simula-tion A (Fig. 7) show net-contraction in front of the push plate fromthe e profile in X-ray intensity processing on the experiment anddivergence (Exx+eyy) profiles by DIC and triangulation on simulation A in Fig. 7c and e, and the distinctively negative (<0.1) volumetric strain or divergence toy≈12d in the blue ROI(Fig. 7e) and at x<0 in the red ROI (Fig.7c) is captured well. Theaverage shear strain profiles show minimal strain localisation inboth the experiment and simulation (Fig. 7e and f). For deformation at a slightly higher initial solid fraction (50%solid sample and simulation B) shown in Fig. 8, the volumetricstrain e in the experiment and divergence profiles in the simu-lation are contractive in Fig. 8c and e, but less negative than inFig. 7c and e.The shear strain profiles (Fig.8d) go higher than in the44% solid/simulation A of Fig.7, indicating more strain-localisation Fig. 6. (a) Line plot showing relative displacement (grain displacement magnitudedivided by push-plate displacement) profiles of shear experiment and simulationdeformation microstructures from a scan of displacement length field after 5d incre-ment of push-plate displacement.(b) Bar chart showing normalised error values enorm(defined in Eq. (11)) with different push-plate displacement lengths for each dataset. at higher solid fraction. Shear strain development occurs ahead ofthe push plate to y~15d in both the experiment and correspondingsimulation B, as shown in Fig. 8f. Fig. 9 shows that deformation at higher initial solid fraction (66%) gives rise to localisation of both positive e" and shear strainexy in a similar location (x≈-5~ -3d in the red ROI of Fig. 9c andd), which indicates a dilatant region [26]. The broad positive(dilative) " and divergence zone to x≈12d in Fig. 9c is a distinc-tive difference of strain response compared with the contractivelow solid fraction datasets in Figs.7c and 8c. In Fig.9d, peaks of theshear strain profile are approximately located at the parting plane(x≈0). The co-location of the positive zone in divergence/volu-metric strain profiles and exy peaks in Fig. 9c and d gives a dilatantshear band width at 66% solid within the range 10d to 15d, which isconsistent with the measurements in past bulk rheology tests[9,17,95]. Analysis of the blue ROI, captures the contraction fieldimmediately ahead of push-plate (Fig. 9e), followed by relativelysmooth and positive profiles (normalised y axis from 2d to 21d), inboth the experiment and corresponding simulation C. Thecontraction field at the push plate front is due to local compactionat this location. Fig. 9c captures another negative (contractive)volumetric strain region to the far-right of the red ROI starting atx= 12d, both in the o profile of the experiment and the diver-gence profiles from LBM-DEM simulation B, due to liquid drainageat this location (i.e. the suction of liquid from the far-right of theFOV to feed dilation near the parting-plane). Fig. 10 is the response of the highest solid fraction datasetstudied here (71%) which had the most net-dilative response andsimulation D. Fig. 10c shows a liquid-enriched dilation zone atx<7d, followed by a contraction zone to the right of the red ROI(negative e"or divergence at x> 10d) both in the experiment andsimulation D strain profiles. In the red ROI, both the experimental Fig. 7. Direct comparison among strain profiles from 44% solid sample and simulation A after 5d increment of push-plate displacement. (a) Two regions of interest (ROIs) to studythe profiles of strain. The first ROI outlined by the red-dashed line contains the region in front of push plate (x<0), the parting plane (x=0), and right-hand side of push plate(x>0). The second ROI outlined by the blue-dashed line contains the region in front of the push plate (y=0) to y=25d(b) ROIs for the strain profile from simulation deformationmicrostructure in which the DEM grains were coloured semi-transparent light grey and the liquid domain were coloured dark grey.(c) The corresponding volumetric strain in (a)and divergence in (b) using the red ROI. The x-direction is scaled by the mean grain size d and the parting plane is set as the origin (x=0). XIP= X-ray Intensity Processing.(d) Theaveraged shear strain profiles for the red ROI in (a) and (b). (e) The volumetric strain or divergence profiles for the blue ROI. The origin corresponds to the bottom edge of blue ROI.(f) The shear strain profiles for the blue ROI. (For interpretation of the references to colour in this figure legend, the reader is referred to the Web version of this article.) Fig. 8. Direct comparison among strain profiles from 50% solid sample and simulation B after 5d increment of push-plate displacement. (a) Two regions of interest (ROIs) to studythe profiles of strain. (b) ROIs for the strain profile from the simulation deformation microstructure. (c) The corresponding volumetric strain in (a) and divergence in (b) using thered ROI. (d) The averaged shear strain profiles for red ROI in (a) and(b).(e) The volumetric strain or divergence profiles for the blue ROI. (f) The shear strain profiles for the blue ROI.(For interpretation of the references to colour in this figure legend, the reader is referred to the Web version of this article.) Fig. 9. Direct comparison among strain profiles from 66% solid sample and simulation C after 5d increment of push-plate displacement.(a) Two regions of interest (ROIs) to studythe profiles of strain. (b) ROIs for the strain profile from the simulation deformation microstructure. (c) The corresponding volumetric strain in (a) and divergence in (b) using thered ROI. (d) The averaged shear strain profiles for the red ROI in (a) and (b). (e) The volumetric strain or divergence profiles for the blue ROl. (f) The shear strain profiles for the blueROI. (For interpretation of the references to colour in this figure legend, the reader is referred to the Web version of this article.) Fig. 10. Direct comparison among strain profiles from 71% solid sample and simulation D after 5d increment of push-plate displacement.(a) Two regions of interest (ROIs) to studythe profiles of strain.(b) ROIs for the strain profile from the simulation deformation microstructure.(c) The corresponding volumetric strain in (a) and divergence in (b) using thered ROl.(d) The averaged shear strain profiles for the red ROI in (a) and (b). (e) The volumetric strain or divergence profiles for the blue ROI. (f) The shear strain profiles for the blueROI. (For interpretation of the references to colour in this figure legend, the reader is referred to the Web version of this article.) eoprofile and simulated exx + evy profile by triangulation showmore positive dilative strains ahead of the push plate (x<0d) thanin Fig. 9c, but the peak width of the exy profile in Fig. 10d is similar toFig. 9d (from 10d to 15d). The blue ROI contains a very smallcontractive region immediately ahead of the push plate, both in the71% solid experiment and simulation D (Fig.10e),and the e profilein the experiment then seems to have a periodic pattern withmultiple peaks and valleys. The explanation of this phenomenon isincomplete liquid feeding during deformation at high solid fraction.As a result, the e"field of the 71% solid sample(Fig. 3t) shows someisland-like contractive areas where liquid is sucked to adjacentdilating zones. Those locally dilative zones correspond to peaks aty≈10.5d and 17.5d in Fig. 10e. The complex heterogeneous liquidflow phenomena were not completely captured by the LBM-DEMsimulation, but a reasonable correlation with experiment inFig. 10e can still be observed. While the simulations are 2D, the thin-sample experiments canbe considered to be 2.5D with interactions from the confining walls.For the contractive region ahead of the push plate, the LBM-DEMsimulation captures grain deformation by overlap between DEMgrains which is tuned in the simple approach to plasticity in Fig. 2ato match the overlap in the through-thickness averaged radio-graphs. Therefore, although the 2D simulation model does notcapture the change in thickness directly, it does capture the'effective grain overlap'in regions of thickening due to compaction.For other regions, the change of sample thickness was low withoverlap between grains of <0.1 d both in experiments and simu-lations, where theassumption of in-plane deformationisreasonable. Comparison of all experimental and simulated profiles inFigs. 7-10 demonstrates that the coupled LBM-DEM simulationsquantitatively captureddmany of the keyy lfeaturesof the Fig. 11. Examples of the correlation between liquid behaviour in experiments and sim-ulations. (a) Liquid expelled out at ~11d push-plate displacement in low solid fractionalloy (44%), (b) increased liquid pressure field in simulation A, (c) meniscus sucked inphenomenon at ~28d push-plate displacement in high solid fraction alloy, and (d)decreased liquid pressure field at the right edge of the push plate in simulation C. heterogeneous volumetric and shear strain fields at solid fractionsin the range 44-71 vol% solid, by only altering the initial packingfraction and initial average contact stress in the simulations. Animportant feature of the LBM-DEM simulations is that the localchanges in packing density arise naturally as emergent phenomena.For example, in Fig. 4, Region B undergoes shear-induced dilationdue to grains pushing each other apart in response to contact forcesin both the experiment and simulation.The LBM-DEM simulationsalso reproduce further important phenomena observed in the ex-periments. For example, Fig. 11a shows that as the push platecontinued to 11d displacement in the lowest solid fraction sample(44%), liquid was expelled from the sample-air interface at the top-left of the sample, indicating that an excess liquid pressure devel-oped in this region. The simulated liquid pressure field in Fig. 11bcorrectly predicts a positive (red) change in liquid pressure in thisregion at 11d displacement and agrees with the location of theliquid expulsion. In Fig. 11b, note that the liquid pressure is higheston the lower-left-side of the Figure. However, the lower-left-side ofthe Figure is not a free surface; it is the edge of the experimentalFOV. In SI Section 9, the full simulation domain is shown (whichequals the whole experimental sample), where it can be seen thatthe true left-side free surface of the sample has a liquid pressurethat is lower than the liquid pressure at the top of the FOV inFig. 11b. It also shows that the region where liquid is expelled inFig. 11a is the region with the highest liquid pressure near a surfacein Fig. 11b. On the other hand, Fig. 11c shows that, in the highest solidfraction sample, menisci are sucked in to the liquid at the freesurface near the right edge of the push plate during deformation. Fig. 12. Plots of liquid velocity magnitude field (normalised by push-plate velocitymagnitude) surrounding grains for (a) simulation A (b) B, (c) C, and (d) D after 5dincrement of push-plate displacement. The black solid-outline square indicates thecorresponding FOV in radiography imaging in deformation experiments, and theradius of each grain is reduced by 80% of its original size to show the effect of hy-drodynamic radius on the LBM liquid domain. The left-hand side wall installed insimulation D is consistent with the radiograph shown in Fig.SI-6d. This is in agreement with the simulated liquid pressure field inFig. 11d where a decreased liquid pressure (blue) region exists atthis location. The different liquid pressure behaviour reflects thenet-contractive response at low solid fraction (44%, Fig. 3q) andnet-dilative shear response at high solid fraction (71%, Fig. 3t), andis a result of the coupling between local volumetric strains in thegrain assembly and the liquid pressure field. This behaviour is ex-pected to depend on the permeability and the strain rate and it wasfound that, when similar samples with initial solid fractions>73%were deformed, shear cracking occurred (not shown here). The simulated push plate penetrates the compacted grain as-sembly in the DEM domain, and simultaneously acts as a movingsolid boundary on the LBM liquid domain. Fig. 12 illustrates thesimulated liquid flow field after a push plate displacement of 5d.This field was constructed by colouring the LBM nodes by therelative velocity magnitude normalised by the push platedisplacement rate. In Fig. 12, the localised high liquid flow rate inresponse to the penetration is very clear among all deformationdatasets, but more prominent liquid flow across the whole samplein Figs. 12c and d is observed. The liquid flow is induced by the drag(momentum exchange) from adjacent DEM grains. Also in Fig. 12cand d, there is a subtle liquid flow towards the specimen centrefrom the membrane boundary with relative velocity magnitude<0.3. This can be related to a pressure differential that draws liquidto regions undergoing high shear-induced dilation. This is also seenin the experiments as a local contraction (grains moving closertogether) to the right and bottom-right of Fig. 3s and t. 3.3. Stress-deformation response A well-calibrated set of LBM-DEM simulation results can offerextra information that is not available in X-ray imaging. Fig. 13a isthe evolution of normal push-plate stress tracked to 10d push-platedisplacement, using the sum of grain-plate normal contact forcesdivided by the length of the push plate front similar to reference[96]. The normal stress gradually increases in lower solid fractionsimulations A and B, while a peak push-plate stress can be found at~2d displacement for higher solid fraction simulation C, and at 3ddisplacement for the highest solid fraction simulation D. It is notedthat the predicted push-plate stress evolution cannot be comparedwith deformation experiments since the friction between the push-plate and Al203 window compromises our ability to accuratelymeasure the push-plate load. Still, both the trend of increased peakstress in higher solid fraction simulations and the strain softeningphenomenon observed in simulation C and D are consistent withprevious deformation tests on granular/particulate materialsincluding semi-solid alloys [10,19,31,97], experimentalsoils[96,98,99], and DEM-simulated granular soils [100,101]. Fig. 13bshows the evolution of total volumetric strain, which was calcu-lated from: where eDEM is the volumetric strain directly evaluated from thechange of area in the simulation samples, A and Ader are the area ofthe initial and deformed sample, which were obtained from thearea of the polygon that joins the centroids of all surface bondinggrains minus the push-plate penetration area. Fig. 13b clearlyshows the transition from net-contractive simulation sets A and Bwith low initial solid fraction, to net-dilative simulation sets C andD with higher initial solid fraction. The reduction of sample area inA and B occurs because the initially loosely packed solid network ina low-solid fraction LBM-DEM simulation is prone to develop a highly localised contractive field, resulting in the closure of liquidinterstices. Simulation C, on the contrary, deforms with slightly netpositive veoDlEM behaviour because the contact force can be trans-mitted to the membrane to push the boundary outward andcompensate for the local contractive response ahead of the pushplate. Moreover, deformation in simulation D causes many of theliquid interstices to expand during grain rearrangement outside ofthe local compacted zone as well as the increased ability to pushthe enclosing membrane away, resulting in the net dilative defor-mation behaviour. Fig.13b also shows the slight decrease of eEMafter 6d penetration on simulation C and 7.5d penetration onsimulation D. This is because the total solid fraction of the samplesis decreased during net dilation, which increases the compress-ibility of the whole assembly. The complex liquid behaviour at the free surface of semi-solidsamples in the experiments can be related to the localised liquidpressure change Ap as shown in Fig. 11. We can then investigate therelationship between the change of volume of liquid-saturated samples and the overall liquid pressure changes. To get a repre-sentative trend, the mean liquid pressure change Ap was derivedacross the whole DEM assembly: where Nnode is the number of LBM nodes inside the DEM assembly.Fig. 13c is the evolution of Ap for each simulation set and com-parison with Fig. 13b shows the interplay between the global liquidpressure change and the volumetric strain, The net-contractivesimulations A and B have a net increase of liquid pressure inresponse to net contraction. The high solid fraction simulations Cand D have a slightly positive pressure change up to 1.5d defor-mation, followed by a decrease in liquid pressure in response to theglobal dilation, and the liquid pressure is near-constant once thepeak dilatational volumetric strain is reached (Fig. 13b). It is useful to investigate the local stress evolution in a circular RV by explicit tracking of contact force vectors in the DEM systemespecially for the region in front of the push plate and the partingplane. Fig. 13d illustrates the setting of measurement circles in theDEM system to derive the local parameters such as the effectivemean stress p', deviatoric stress q, and void ratio e. In two-dimensional DEM, the relationship between void ratio eand grainpacking fraction (i.e. solid fraction)fspk is e=(1-fs.pk)/fspk. Theselocal parameters were tracked to examine whether the DEM sys-tem behaves as a granular material such as a sand [22]. Thedianeter of the measurement region was chosen to be 20d andincludes ~250 grains; this is sufficiently large to obtain the effec-tively averaged behaviour of the regions of interest. Fig. 13e and fillustrate the evolution of the q versus p’ relationship to 10ddisplacement.Before shear deformation, the effective stress p’re-flects the required mean stress on the DEM assembly to reach thedesired packing fraction, and the mean stress values are similarbetween black and blue circles for every simulation set. The q-p’curves all start from q=0 and the stresses are increasing forsimulationA and B. It is noted that the low solid fraction simulationsets (red and blue in Fig. 13e and f) soon have an approximatelyconstant q/p’ratio and follow the regression line q=0.428p',which can be related to the well-defined critical state in soil me-chanics [22] stating that a frictional fluid should reach a macro-scopic frictional constant M= q/p'. In contrast, the maximumdeviatoric stress occurs in simulations C and D at 0.98×10⁻⁴N/mand 2.35×10⁻⁴N/m for the black circle, and 0.64×10⁻⁴N/m and2.07×10-4N/m in the blue circle, respectively. After reaching themaximum deviatoric stress, both p’ and q stresses decrease. Thesimulation C then reaches the q=0.428p'regression line, while theq-p’curves in simulation D show a nearly -50% decrease ofstresses from the peak deviatoric stress point and moves towardsthe regression line (but does not reach it by 10d push-platedisplacement). The evolution of void ratio is shown in Fig. 13g and h. The highcontraction field in front of the push plate developed at an earlystage of deformation (3d) reduces the void ratio by about -0.03 inthe black circle and about -0.01 in the blue circle. The void ratiodecrease corresponds to the increase of local mean effectivestresses as shown in Fig. 13i and j. There is a log-linear relationshipbetween the final void ratio and the final value of p'; this corre-sponds to the critical state line concept accepted for granular soilbehaviour [22]). The increase of void ratio in high solid fractiondeformation is due to shear-induced dilation in both the black andblue circles. Whilst this research used globular grains to prevent significantshape change during isothermal experiments and enable an effi-cient model, casting processes often create more complex mor-phologies such as equiaxed dendrites. Experiments [102] and DEMstudies [64] have shown that dendrites form a solid network atlower solid fraction than globular grains due to the high liquidfraction within dendrite envelopes and due to the more complexshape of the envelopes. These factors will also alter the perme-ability [103], give more contacts per grain, and affect the localstresses acting on dendrites [64]. Future research can extend theLBM-DEM approach to dendritic microstructures in the future. 4. Conclusions Time-resolved synchrotron X-ray radiography and coupledLBM-DEM simulations have been applied to investigate sheardeformation mechanisms in equiaxed globular Al-Cu alloys at44-71% solid. Microstructural and macroscopic responses to loadhave been quantified by intensity processing and digital image correlation (DIC) for radiographic imaging with>1000 grains in thefield of view (FOV), and also reproduced by LBM-DEM after findinga single set of DEM parameters calibrated across all deformationexperiments from 44 to 71% solid. From the results obtained by thevarious analysis approaches, the following conclusions can bedrawn: ·The volumetric strain during semi-solid deformation due tolocal changes of solid fraction is strongly influenced by theinitial solid fraction. A contractive strain field developed in shearor compressive deformation in alloys initially containing 44%and 50% solid. In contrast, significant net-dilation occurredduring shear on the 66% and 71% solid samples. ·The mechanism of solid fraction increase during deformation isgrains being pushed together by compaction, or by the liquidbeing sucked away. The solid fraction decrease, on the otherhand, is due to shear-induced dilation by grains pushing oneanother apart during grain rearrangement in a solid network,similar to phenomena in compacteddgranular/particulatematerials. · Deformation was highly heterogeneous and the strain wasstrongly localised. Both the experiments and simulations agreewith the trend of net-contraction ahead of the push plate and, inhigh solid fraction deformation, the co-location of dilativevolumetric strain and shear strain in a region with width of10-15 mean grains wide. Additionally, a contraction fieldformed outside the locally dilating regions in high solid fractionsamples due to liquid being sucked away to feed dilation. The coupled LBM-DEM model naturally simulates the change ofpacking density in primary Al grains as an emergent phenom-enon, and captures the complex liquid behaviour recorded inradiographs from the simulated liquid pressure change. · The calibrated LBM-DEM model provided information on boththe local stresses and void ratios; these data show that thematerial exhibits a load deformation response that can bedescribed by the critical state framework for soil behaviour. Acknowledgements The in-situ observations were supported by a Grant-in-Aid forScientific Research (S) (No. 17H06155). Experiments were con-ducted at the SPring-8 Synchrotron on BL20B2 under Proposal No.2015A1318 and 2017B1523. Analysis was carried out under theEPSRC Grant EP/K026763/1. T.C. Su gratefully acknowledges aPresident's scholarship from Imperial College London. Appendix A. Supplementary data Supplementary data to this article can be found online athttps://doi.org/10.1016/j.actamat.2018.10.006. References [1] A. Kaye, A. Street, Die Casting Metallurgy, Butterworth Scientific, London,1982. [2] E.J. Vinarcik,High Integrity Die Casting Processes, John Wiley & Sons, NewJersey, 2002. [3]W. Andresen, Die Cast Engineering: a Hydraulic, Thermal, and MechanicalProcess, CRC Press, New York, 2004. [4] X.S. Huang, L.J. He, G.B. Mi, P.J. Li, Characteristics of defect bands and theirformation mechanisms in A356 wheel fabricated by horizontal squeezecasting, Mater. Sci. Technol. 31 (4)(2015)400-408. [5] M. Masoumi, H. Hu, Influence of applied pressure on microstructure andtensile properties of squeeze cast magnesium Mg-Al-Ca alloy, Mater. Sci.Eng., A 528 (10-11)(2011)3589-3593. [6] R. Cook, P.G. Grocock,P.M. Thomas, D.V. Edmonds,J.D. Hunt, Development ofthe twin-roll casting process,J.Mater. Process. Technol. 55 (2)(1995)76-84. [7] C. Gras, M. Meredith, J.D.Hunt, Microdefects formation during the twin-roll ( c asting o f Al - M g-M n al u minium allo y s, J. M a t er. P r o cess. Te c hnol. 16 7 (1) (2005)62 -7 2. ) ( [8] Z . B ian, I . Baya n dorian, H . W . Zha n g, G . S c amans, Z. Fa n , E x t remely fine and uniform mi c rostructure of magnesi u m AZ91D al lo y sh e ets prod uc ed by melt ) conditioned twin roll casting, Mater. Sci. Technol. 25 (5)(2009)599-606. ( [9] C .M. Gourl a y, A.K. D ahl e , D i latant s hear b ands in solidi f yi n g m e tals, N at u r e 445 (7123)(2007) 70- 7 3. ) ( [10] C . M. Gour l ay, B. M eyla n , A.K. D ahl e , Shear mech a nis ms at 0 - 5 0 % solid d u r ing equiaxed dendr i tic solidification of an AZ91 magnesium a l l oy, Acta Mat e r . 5 6 (14)(2008)3403 - 3413 . ) [11]C.M. Gourlay, H.I. Laukli, A.K. Dahle, Defect band characteristics in Mg-Al andAl-Si high-pressure die castings, Metall. Mater. Trans. 38A (8) (2007)1833-1844. ( [12] S . O tarawanna, C.M. Gourlay , H.I. L a ukli, A.K. Dahle, The t hickness of defect b ands i n h i gh-pr e ssu re die castings, M ater. C har . 60 ( 12) ( 2009)1 4 3 2-14 4 1 . ) ( [13] M .C. Flemings, Solidif i cat i on P rocessing, McGraw-Hill, N ew Y o rk, 1 9 74. ) ( [14] C .P. Chen, C . Y.A. Tsao, Semi-solid deformation of non-dendritic s t ructu r es . 1 . Phenomenological behavior, Acta Mater. 45 (5)(1997)1955-1968. ) ( [ 15 ] S . Ota r awanna, H . I . L aukli, C . M. Gour l ay, A.K. Da h le, Feeding m e ch a nisms i n h i gh-pressure die cast i ngs, Met a ll.Mater. Trans.41a (7)(2 0 10 )1 836 -1 8 46. ) ( [16] M .S. K im, S.H. Kim, H.W. K im , D efor m a tion- i nduced center segrega ti on in ) ( t w in-r o ll cast high-Mg Al-Mg s t r ip s, Scr i pt a Ma t er . 1 5 2 ( 2 0 18) 6 9 -73. [17] B . Me y l a n , S. Terz i , C.M. Go u rlay , A.K. D ah le,D i latanc y a nd rheology a t 0 -60% ) ( solid dur i ng equ i axed s olidification, Acta Mater. 5 9 (8)(2011)3091- 31 01. ) [18]E. Tzimas, A. Zavaliangos, Mechanical behavior of alloys with equiaxedmicrostructure in the semisolid state at high solid content, Acta Mater. 47(2)(1999)517-528. [19]T. Sumitomo, D.H. StJohn, T. Steinberg, The shear behaviour of partially so-lidified Al-Si-Cu alloys, Mater. Sci. Eng.. A 289 (1-2)(2000)18-29.1-2)(2 F29.[20]O.Reynolds, LVII. On the dilatancy of media composed of rigid particles incontact. With experimental illustrations, Philos. Mag. Series 5 20 (127)(1885)469-481. ( [21] W . P o wrie, S o il M echanics: C o ncepts an d Ap p lications, se c ond ed., Tay l or & Francis,Ne w York, 2004. ) ( [22] A . Sch o fi e ld , P. Wrot h , Critica l State Soil Mech ani cs, M c Graw-H i l l , New York, 1968 . ) [23]C.M. Gourlay, A.K. Dahle, T. Nagira, N. Nakatsuka, K. Nogita, K. Uesugi,H. Yasuda, Granular deformation mechanisms in semi-solid alloys, ActaMater. 59 (12) (2011) 4933-4943. [24]C.M. Gourlay, C. O'Sullivan, J. Fonseca, L. Yuan, K.M. Kareh, T. Nagira,H. Yasuda, Synchrotron radiography studies of shear-induced dilation insemisolid Al alloys and steels, JOM 66 (8) (2014) 1415-1424. ( [25] T . N agira, C.M. Gourlay, A. Sugiyama Magira. c , M . Uesugi, Y. Kanzawa, M . Y oshiya, K .omcourlay. . Ue s ugi, K.Umetani, H. Yasuda, Direct observation of deformation in se m i- solid carbon steel, Scripta Mater. 64 (12)(2011) 1 12 9- 1 1 32 . ) ( [26] T . N agira, H. Yokota, S. Mori t a, H. Yasuda, M. Yoshiya, C.M. Gou rl ay, A. Sugiyama, K . Ue s ugi, K. U metani, Characterization o f shear d e formation b a s ed o n i n -situ o bservation of d eformation in s e mi - s o lid A l -Cu a l lo y s a n d water-p a rticle mixture, ISI J In t . 5 3 (7)(2013 ) 1195-1 2 01. ) [27] J. Fonseca, C. O'Sullivan, T. Nagira, H. Yasuda, C.M. Gourlay, In situ study of0urgranular micromechanics in semi-solid carbon steels, Acta Mater. 61 (11)(2013)4169-4179. [28]T. Nagira, S. Morita, H. Yokota, H. Yasuda, C.M. Gourlay, M. Yoshiya,A. Sugiyama, K. Uesugi, A. Takeuchi, Y. Suzuki, In situ observation of defor-mation in semi-solid Fe-C alloys at high shear rate, Metall. Mater. Trans. 45A(12)(2014)5613-5623. [29] S. Zabler, A. Rack, A. Rueda, L. Helfen, F. Garcia-Moreno, J. Banhart, Directobservation of particle flow in semi-solid alloys by synchrotron X-ray micro-radioscopy, Phys. Status Solidi 207 (3)(2010)718-723. [30]S. Zabler, A. Ershov, A. Rack, F. Garcia-Moreno, T. Baumbach, J. Banhart,Particle and liquid motion in semi-solid aluminium alloys: a quantitative insitu microradioscopy study, Acta Mater. 61 (4)(2013)1244-1253. ( [31] K . M . K a r e h , P.D. L e e, R . C. A twood, T . C onnolley, C . M . Gourlay , R e vealin g t h e m i cr o mechanisms behin d s e mi-solid m etal def o rmation with time- r esolved X- r ay tomography, Nat. C o mmun.5 (2014)1 - 7 . ) ( [32] B . C ai, P. D . L e e , S . Karagad d e , T .J . Mar r ow,T . C on n olle y, T i me -r esolved s y n - ch r otron tomographic qu a ntification of deformation during i ndentation ofan equiaxed s emi-solid granular alloy, Ac t a Mate r . 105 ( 2 01 6 )338-346 . ) ( [33] S . T e rzi, L . Salvo, M . S u e ry, N . L i m o d in , J . A d rien, E . M a ire, Y. P a n n ie r , M . B o rnert, D . B ernard, M . F elb e r b a um, M. Ra p paz, E. Bo l ler r , I n s i tu X-ray t omography observation o f inhomo g ene o us de f ormation in s e m i-solid alu m inium alloys, Script a Mater . 61 ( 5 )(2009) 4 49 - 452. ) ( [34] K .M. K a reh, C . O'Sullivan, T . N agira, H . Y asuda, C.M. Gourlay, D i latancy in s emi-solid s teels a t hig h soli d fraction, Act a Mater . 12 5 (20 1 7) 187 -1 9 5. ) ( [35] A . Zav a liangos, M ode l ing o f t h e m e chan i cal be h avior o f semisol i d m et a l lic alloys a t h igh volu m e fr a ctions of so l id, I nt . J . M ech. S c i. 4 0 ( 1 0)(199 8 ) 1029 -1 041 . ) ( [36] J J . Wang, A . B. P hi llion, G . M. L u, Development o f a visco-plas t ic c o nst i tutive m odeling f o r thixoform i ng o f A A6061 in semi-solid s t ate, J . Alloy. Comp. 609 (2014)290- 2 95. ) ( [37] X. Hu, Q. Zhu, H . At k inson, H. Lu, F. Z h ang H . D ong, Y . Kang, A t i me- d ep e ndent power la w viscosity model an d its appli c a t ion i n modelling semi - solid die casting of 319s alloy , A ct a Mater . 12 4 (2017) 4 1 0 - 4 2 0 . ) ( [38] M .H. S h eikh-Ansari, M . A g h ai e -K h a fri, S h ear lo c alization i n s e mi-s o lid de f ormation: a b i furcation th eory app r oach , Mec h . Res . Commu n . 89 ) ( (2018)1 - 5 . ) ( [39] M .S. A n s ari, M . A ghaie-Khafri, P redicting f l ow l ocalization in se m i-sol i d deforma t ion, I n t . J . Material Form. 11(2)(2018)165- 1 73. ) [40]O. Ludwig, J.M. Drezet, C.L. Martin, M.Suery, Rheological behavior of Al-Cualloys during solidification: constitutive modeling, experimental identifica-tion, and numerical study, Metall. Mater. Trans. 36a(6) (2005)1525-1535. [41]O. Ludwig, J.M. Drezet, P. Meneses, C.L. Martin, M. Suery, Rheologicalbehavior of a commercial AA5182 aluminum alloy during solidification,Mater. Sci. Eng., A 413 (2005) 174-179. ( [42] T. Koshikawa, M . B e llet, C.A. Gandin, H . Y amam ur a, M. B o badil l a, Ex p e ri- mental s tudy a nd t w o-p h ase n u me r ical m o deling of ma c r osegregation i n d uced b y so l id d eforma t ion during pu n ch pre s sing of s o l idifying steel i n -gots, Acta Ma t er . 12 4 (2017) 5 13- 5 27. ) ( [43] T . K ajitani, J. M. D rezet, M. Rapp a z, N umeric a l s i mulation of de f ormation- i n d u c ed s egreg a t io n i n con t inuous casti ng of s t eel , Me t all. M ater. T rans. 3 2 (6 ) (2001) 1 479-1 4 91. ) ( [44] C.S. Li , B.G . Thomas, Therm o mechanical f i nite-element m o del o f sh e ll b ehavior i n continuou s casting of s t e el, M e tall. M a t er . Tr a ns. B 3 5 (6) (2 0 04) 1151 -1 172. ) ( [45] J. Domitner, M. H . W u, A . K h aricha, A . L u d wig, B. K a u fm an n, J. R e i ter, T . Sc h aden, M odel i ng t he effects o f stran d sur f a ce bulgi ng a nd mechan i cal s oft r e duction on t h e m acroseg r egation f orma t ion in st e el c o ntin u ous ca s t - i ng, Metall. Mater. Trans. 45a(3) (2014)1415 - 1 434. ) [461A.B. Phillion,S.L. Cockcroft, P.D. Lee, A three-phase simulation of the effect ofmicrostructural features on semi-solid tensile deformation, Acta Mater. 56(16)(2008)4328-4338. ( [47 ] ] M N. M' H amdi, A. M o, H. G . F jaer, TearSim: a two-phase model add r essi n g hot t ea ring fo r m ati o n d u ring a l u minu m d ir ect c hi l l cas t ing, Metall. Mat e r . Tra n s . 37a( 1 0)(2006)3069 - 3 083. ) [48] S. Vernede, J.A. Dantzig, M. Rappaz, A mesoscale granular model for themechanical behavior of alloys during solidification, Acta Mater. 57 (5)(2009)1554-1569. [49)]] C. O'Sullivan, Particulate Discrete Element Modelling: a GeomechanicsPerspective,Spon, London, 2011. ( [50] H . Shimizu, S . M ur at a, T . I s hida, T he distinct e lement a n aly s is f o r h ydr a u l ic f racturing i n h ar d rock c o nsidering flu i d viscosity a n d p a rticle s i ze d i stri- bution, I n t . J R o ck. Me c h . Min. 48 ( 5 )(2 01 1 )7 1 2-727. ) ( [51] D . F. Bo u tt, B.K. Cook, B .J.O.L. McPher s on, J . R . Williams , Direct s i mula tio n of f luid-so l i d mechanics in porous m edia u s in g t h e discrete e l ement an d l attice-Boltzmann metho d s, J. G eophy s . R e s.-Sol. E a. 1 12 ( B 10) ( 200 7 ). ) ( [52] G.W. B ergantz, J . M. Schleicher , A . Burgisse r , Open-syste m dynamics and m ixing i n magma m u shes, Nat. Geosci. 8 (10) (2015)793- 7 9 6. ) ( [53] A . L eonardi, F.K . Witte l , M . Mendoza, H.J. H e rrman n , Coupl e d DEM-LBM m ethod f o r t h e f r e e-surfa c e s i mu l ation o f h e t erogeneous sus p ensions, Comput. P art. Mech. 1 ( 1 )(2014) 3- 1 3. ) [54]V. Slowik, j.W. ju, Discrete modeling of plastic cement paste subjected todrying, Cement Concr. Compos. 33 (9) (2011) 925-935. [55]C.L. Martin, D. Bouvard, S. Shima, Study of particle rearrangement duringpowder compaction by the discrete element method, J. Mech. Phys. Solid. 51(4)(2003)667-693. [56]H.P. Zhu, Z.Y. Zhou, R.Y. Yang, A.B. Yu, Discrete particle simulation of par-ticulate systems: a review of major applications and findings, Chem. Eng.Sci.63(23)(2008)5728-5770. [57]B.K. Cook, D.R. Noble, J.R. Williams, A direct simulation method for particle-fluid systems, Eng. Comput. 21 (2-4)(2004) 151-168. [58]D. Noble, J. Torczynski, A lattice-Boltzmann method for partially saturatedcomputational cells, Int. J. Mod. Phys. C 9(08)(1998)1189-1201. [59]Y.H. Han, P.A. Cundall, Resolution sensitivity of momentum-exchange andimmersed boundary methods for solid-fluid interaction in the lattice Boltz-mann method, Int.J. Numer. Methods Fluid.67 (3)(2011)314-327. [60] Y.H. Han, P.A. Cundall, LBM-DEM modeling of fluid-solid interaction inporous media, Int. J. Numer. Anal. Model. 37(10)(2013)1391-1407. [61]D.H. Johnson, F. Vahedifard, B. Jelinek, J.F. Peters, Micromechanics of un-drained response of dilative granular media using a coupled DEM-LBMmodel: a case of biaxial test, Comput. Geotech. 89 (2017) 103-112. ( [621 M . S i s t aninia , A.B. Phill i on, J . M. D r e zet , M . R appa z , Simulat i o n of semi- s olid m aterial mechani c al b ehavior u s ing a c o mbin e d discrete/fi n it e e l ement meth o d,Metall.M a ter. T rans. 4 2A (1) (2011 ) 239-248. ) ( [63] M . S i staninia, S. T erzi, A.B. Phillion, J.M . Drezet, M . Rappaz, 3-D g ranularmodel i ng a n d in s i tu X-ray t omogra p h i c im a ging: a co m pa r ati v e study of hot tear i ng form a ti o n a nd semi-s o lid def o rma t ion i n A l -Cu al l oys, Acta Mat e r. 61 (1 0) (2013) 3831 - 3841 . ) ( 641 L . Y u an, C . O'Sullivan, C.M. Gourlay, Exploring dendr i te coherency w ith the discrete element method, Acta M a ter. 60 (3)(2012) 1 334- 13 45. ) ( [65] K . U m etani, K . Uesugi , M. K obatake, A. Yamamoto, T . Yamashita , S. I mai , S ynchrotr on r a diati o n microimag i ng in ra b bi t mod e ls of ca n cer for pr e clin - ical testing , Nucl . Instrum . Met h ods P hys. R es. 6 09 (1) ( 2009) 38-4 9 . ) ( 66] ] D . S winehart , The B eer-Lambert l a w, J . Chem. Educ. 3 9 (7)(1962)333. 167 S . R . Sternberg, Biomedi c al image-processin g , C ompu t er 16 (1)(1983) 2 2 - 34. ) ( [68] H . Y asud a , T . N agira, M. Y oshiya, N . N akatsuk a , A . S ugiyama, K . U e sugi, K . Umeta n i, Development o f X - ray i m aging for o b serving s o lid if ication of carbon s t e els, ISI J I n t. 51 (3)(2011)402 - 4 0 8. ) ( [69] S . G anesan, D . R . P o i ri er, D ensities of a luminum-r i ch aluminum-copper alloys d uri n g solid i fication, Meta l l . Tr a n s . A 1 8 (4) ( 1987)721 - 7 23. ) [70] J.L. Murray, The aluminium-copper system, Int. Met. Rev. 30 (1)(1985) 211-234. ( [71] J .H . H u bbell,S. M . S el t zer , Ta b l es of X - Ray Mass Attenuation C o e fficients an d M a s s Energ y- abs o rption Coeffi c i e nts from 1 K e V to 20 MeV for Ele m e n t s Z = 1 t o 9 2 a nd 4 8 A d ditional S u b s tanc e s o f D o sime t ric Interest. R adiation P h ys ics D ivision, PML, N I S T, 1 996. ) ( [7212] J J . A. D a n tzig, M. R appaz, Soli d if i cation, E P FL Press, L o ndon,20 0 9. ) ( [73] S . Ganesan , D . R . Poirier, Conservation of m ass and momentum f or the flow of i nterdendritic l iq u id d uring s o lidification, M etall . T r an s . B 2 1 ( 1 ) (1 99 0) 173 - 181 . ) ( [74] L . E . Mal v ern, I ntroduc tio n to the M e chan i cs o f a Continuo u s M e dium, P rentice- H all, Inc. , Englewood C l i f fs , New J ersey, 1 969 . ) ( [75] M. B ornert , F . Brema n d, P . Doumali n , J . C. Dupre, M. F az z ini, M. Grediac , F . H ild, S. Mi s tou, J. Molimar d , J J . O rteu, L . R obert, Y . S ur r el , P . Va c h e r , B . Wattrisse, Assessment o f d i gital i mage correl a tion measur e m ent err o rs: m et hod o l ogy and result s , Exp. M ech. 4 9 ( 3 ) (2009) 3 53- 3 70. ) ( [76] F .J.Yang, X .Y . H e , C.G. Qua n, Characterization o f dynami c m i c ro g yroscopes by use o f t emporal d igital image c orr e lation, Appl. Opt . 45 (30) (2006) 7785-7790. ) ( [77] M .O da, H. K azama, Microstructur e o f s h ear bands a n d its relation t o the mechani sm s of d i latancy and f a ilure of dense g ranul a r soils , Geotech ni que 48(4)(1998) 465-481. ) ( [78] Y .H. W ang, S . C . L e u n g, A parti c ulate-scale i n vesti g ation of c emented sa n d b ehavior, Can. Geotech. J. 45 ( 1) (2008) 29-4 4 . ) ( [79 ] S . Nemat-N a sser, A v eraging th e orems in f in i t e deformation pla s t icity, M e ch. M a t e r . 31 (8)(1999)493- 5 23. ) [80] E.Masad, B. Muhunthan, Three-dimensional characterization and simulation of anisotropic soil fabric, J. Geotech. Geoenviron.126 (3)(2000)199-207. [81]A.Drescher, G.D.J. De Jong, Photoelastic verification of a mechanical modelfor the flow of a granular material, J. Mech. Phys. Solid. 20 (5)(1972)337-340. ( [82] K . Iwashita, M .O d a, Ro l lin g re s istance at conta c ts in si m ulation of shear band d e velopm e nt by DEM, J . Eng. Mech.-Asce 124 (3) (1998) 2 85- 2 92. ) [83] J.K. Morgan, M.S. Boettcher, Numerical simulations of granular shear zonesusing the distinct element method- 1. Shear zone kinematics and themicromechanics of localization, J. Geophys Res-Sol Ea 104 (B2)(1999)2703-2719. ( [84] M .J .J i ang, H .B. Yan, H.H . Zhu , S . U tili , Mo d eling shear behavior and s tr a i n l oc a l i zation i n cem e nted s ands b y t w o-dimensional disti n c t e l emen t m e thod analyses, Comput . Geotech . 38 (1 ) (2011)14-2 9 . ) ( [85] A / . C ottrell, R. S t o k es, E ffe c ts o f temperature o n t h e p l astic p r ope r ties o f alumi n ium c r ystals, i n: P roceedings o f t h e R oyal Society of L o ndon A: M athematical, P h y s ical a n d E n ginee r ing Science s , Th e Royal Soc i ety, 19 55 , p p. 1 7- 3 4. ) ( [86] J J J . H u , J .Y. Zhang, Z .H. J ia ng,X . D. D i n g, Y. S . Z h ang, S. Ha n , J. S u n , J.S . L i an, ) ( P lastic deformat i on b eh a vior d uring u n loading in c o mpre s sive cy c lic t e st o f n an o crystalline c opper, M ater. Sci. E ng., A 65 1 (201 6 ) 999- 10 0 9. ) [87] S.Ganesan,R. Speiser, D.R. Poirier, Viscosities of aluminum-rich Al-Cu liquidalloys, Metall. Trans. B 18 (2)(1987) 421-424. ( [88] Y . H a n , P . C undall , Verificatio n o f tw o - d imen s ion a l L B M -DEM coupli n g approa c h a nd i t s a pp l ication in m odeling e p isodic sand production in boreh o le, Petroleum 3 (2)(2017 ) 179 - 189. ) ( [89] K .K. Soundararajan, M u lt i-sca l e Mul t iphase Modell i ng o f G ranul ar F l ows, P hD Thesis, U n iversi t y o f C ambridge, 2 0 15 . [90] K F . K uma r , J.Y. D elenne, K. Soga, Mechanics of g r anular column c o l lapse in ) ( f luid at varying slo p e angles, J . Hydrody n . 29 ( 4) (2017) 5 2 9-54 1 . ) ( [91] X .Y. H e , Q.S. Z ou, L.S. Luo, M. D embo, Analytic solutions of s i m ple f lo w s an d an a l y sis of n onslip boundary condit io ns for the la t tice Boltz m ann B G K model, J . Stat. Phy s . 8 7 ( 1-2)(1997 ) 11 5- 136 . ) ( [92] P . L allemand, L .S. Luo, Lattic e B o ltzmann m e thod f or movin g bou n dari e s, J. Com p ut . P h ys. 184 (2)(20 0 3) 406-421. ) ( [93] P FC-particle Fl o w C o de 5.0, I t asca Consulting Group, Inc., Minn e apolis, USA, 2014. ) ( [94] D. M a rkauskas, R. Ka c ianauskas, In v estigati o n o f r i ce grain f low b y mu l ti- sphere p a rti c le m odel with r o lli n g resista n ce, Granu l . Matter 1 3 (2)( 2 011 ) 1 43- 1 48. ) [95]B.Meylan, S. Terzi, C.M. Gourlay, M. Suery, A.K. Dahle, Development of shearbands during deformation of partially solid alloys, Scripta Mater. 63 (12)(2010) 1185-1188. [96]M.J. Jiang, H.S.Yu, D. Harris, Discrete element modelling of deep penetrationin granular soils, Int. J. Numer. Anal. Model. 30 (4) (2006)335-361. [97]S.A. Metz, M.C. Flemings, Hot tearing in cast metals, AFS Trans 77 (1969)329-334. ( [98] X. S. L i, Y.F. Dafalias , Dilatanc y fo r cohesionless soils, Geotechnique 50 ( 4) (2000)449-460. ) ( [99] L . Rothenburg, N.P. K r u y t, C rit i cal state and evolutio n of coordination n um - b er i n s imulated g r anu l ar ma t e rials , I n t . J. S o lid S t ruct. 4 1 ( 2 1)(20 0 4 )5763- 5 774 . ) [100] S. Lobo-Guerrero, L.E. Vallejo, Discrete element method evaluation of gran-ular crushing under direct shear test conditions,J. Geotech. Geoenviron. 131(10)(2005)1295-1300. [101]S.Lobo-Guerrero, L.E. Vallejo, DEM analysis of crushing around driven pilesin granular materials, Geotechnique 55 (8)(2005)617-623. ( |1021 L . Arnberg, G. Chai, L . Backerud, Determination of dendritic co h erency in s olidifying melts by theologica l measurements, M ater. Sci. Eng. , A 1 73 ( 1-2) (1993)101- 1 03. ) ( [103] O . N ielsen, L . Arnberg, A. Mo, H. Thevik, Experimental determination of m ushy z o ne p e rmeability i n a lumin u m- c opper alloys with e quiaxed m i- crost r uct u res, Metall . Mater. T rans . 30 (9)(1999)2455-2462. ) Semi-solid alloys are deformed in a wide range of casting processes; an improved understanding and modelling capability is required to minimise defect formation and optimise productivity. Here we combine thin-sample in-situ X-ray radiography of semisolid Al-Cu alloy deformation at 40e70% solid with 2D coupled lattice Boltzmann method - discrete element method (LBM-DEM) simulations. The simulations quantitatively capture the key features of the in-situ experiments, including (i) the local contraction and dilation of the grain assembly during shear deformation; (ii) the heterogeneous strain fields and localisation features; (iii) increases in local liquid pressure in regions where liquid was expelled from the free surface in the experiment; and (iv) decreases in liquid pressure in regions where surface menisci are sucked-in in experiments. The verified DEM simulations provide new insights into the role of initial solid fraction on the stress-deformation response and support the hypothesis that thebehaviour of semi-solid alloys can be described using critical state soil mechanics.
确定
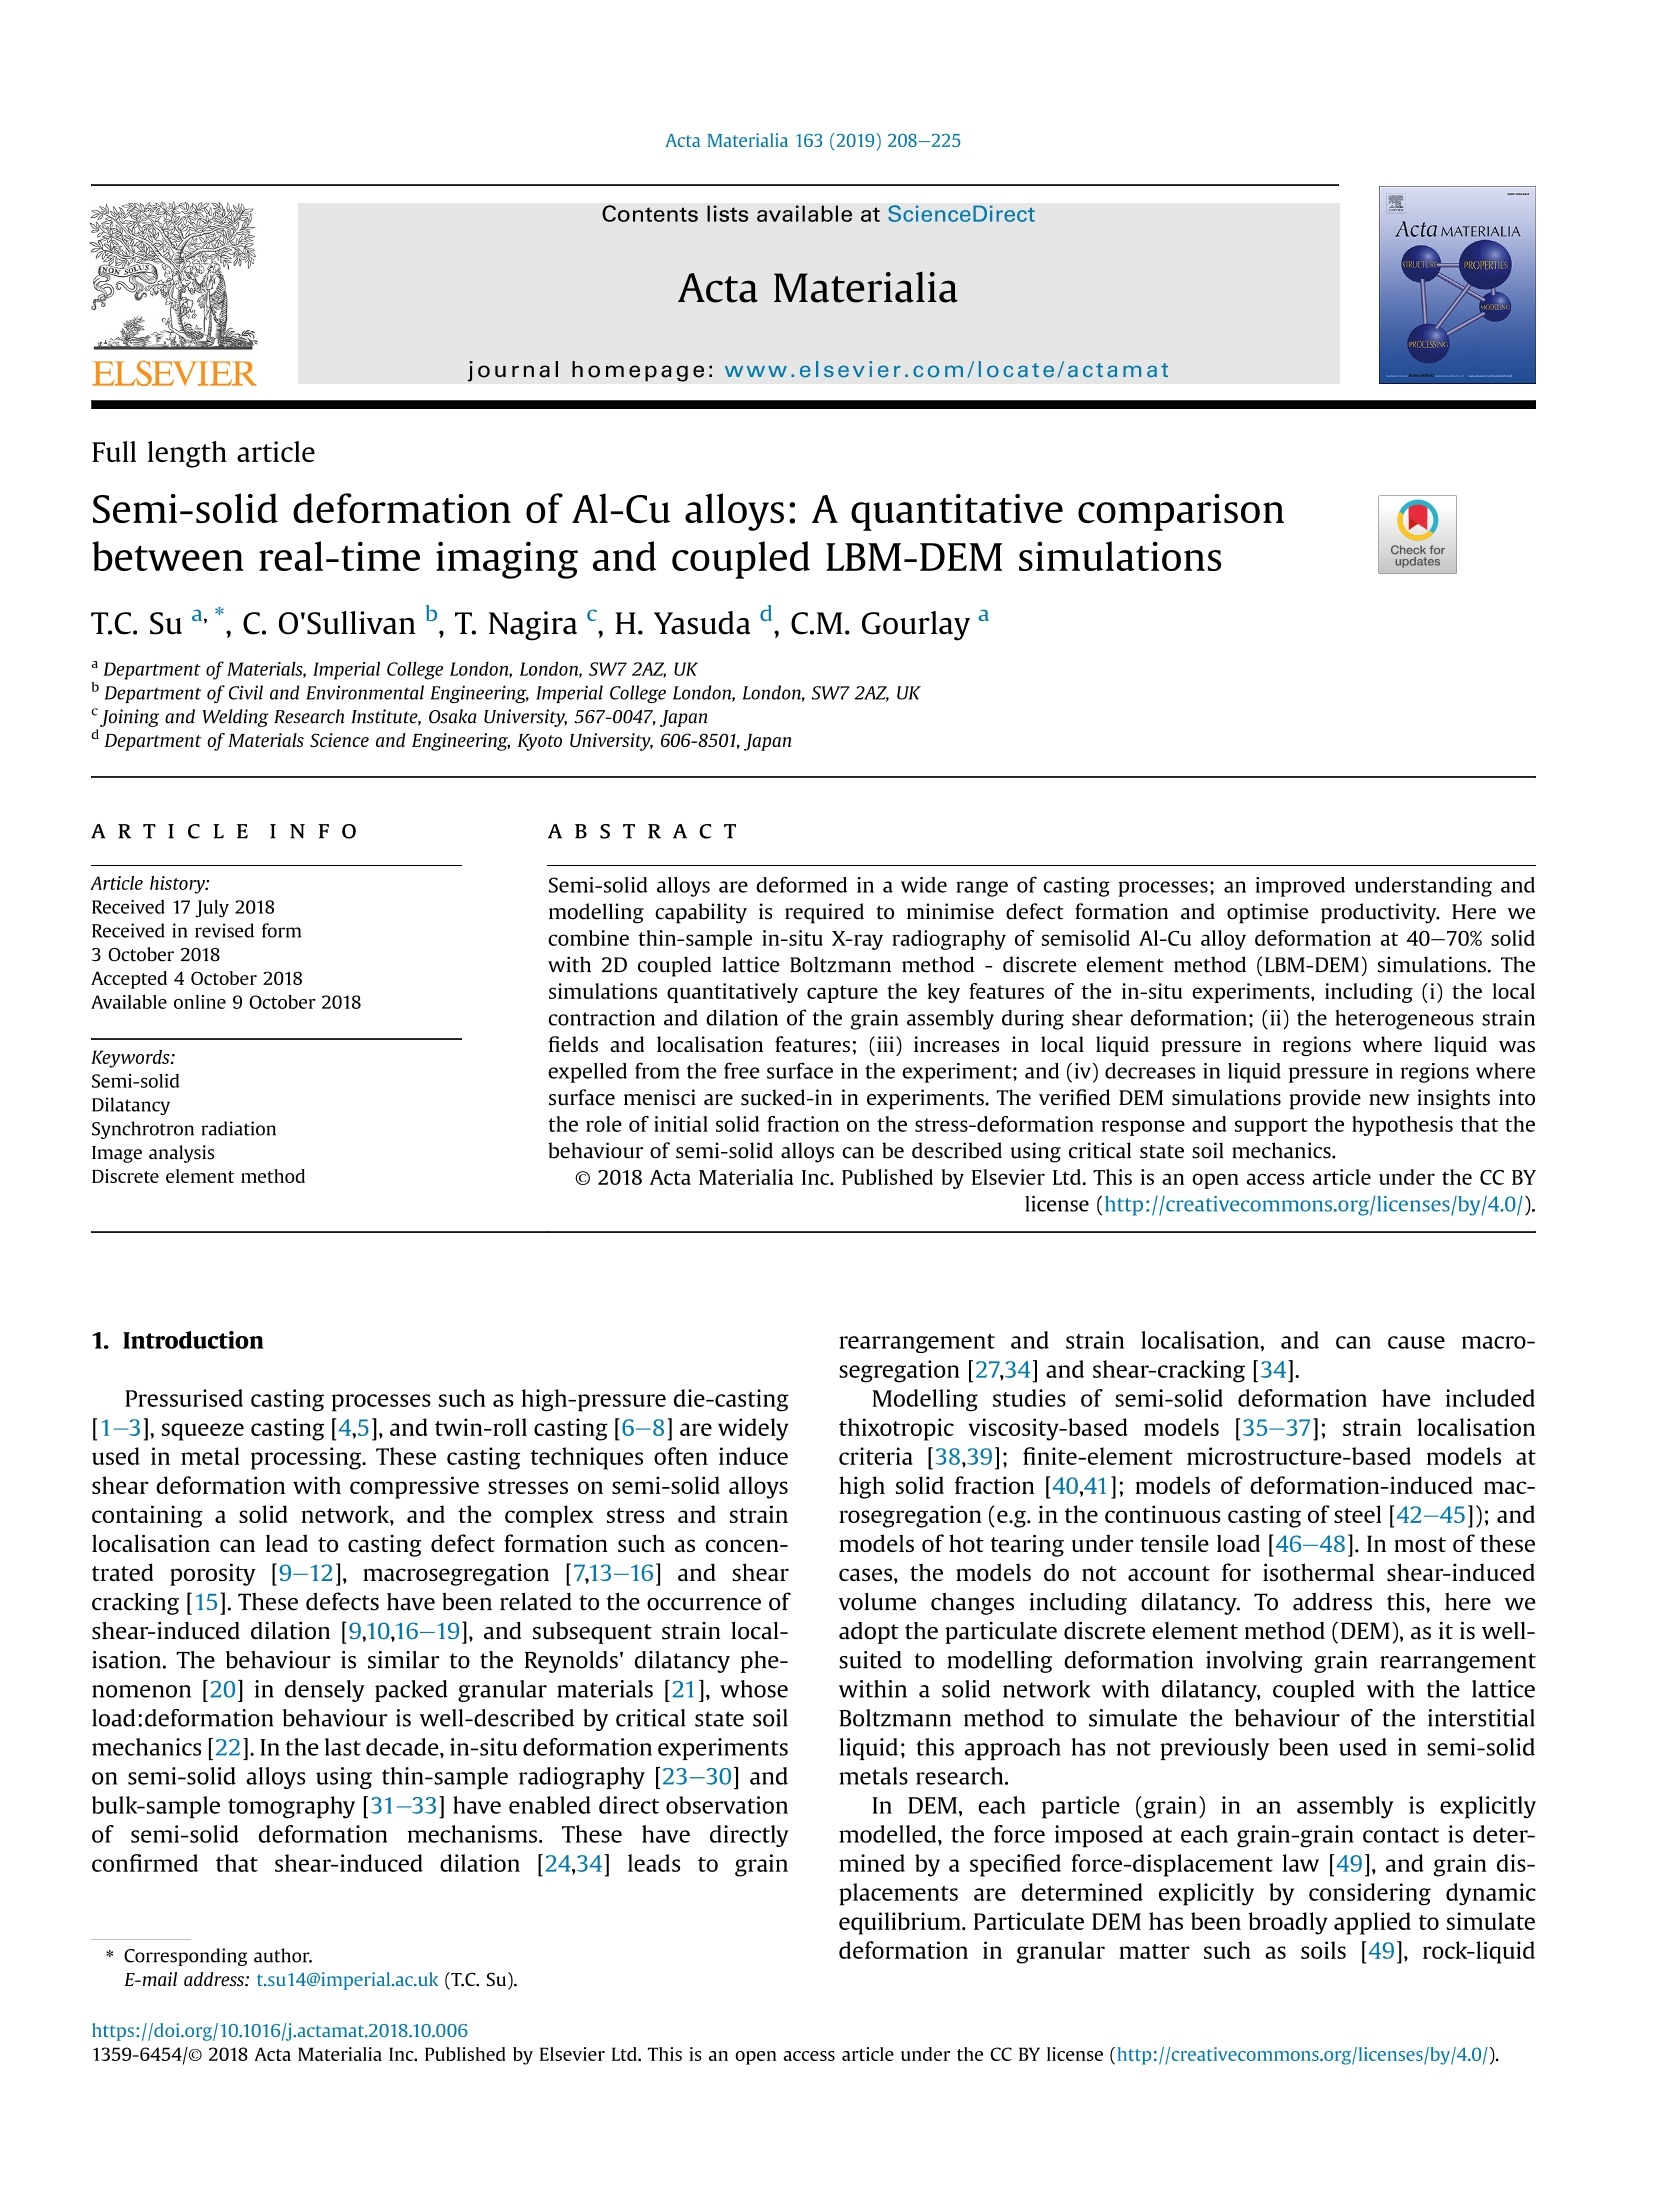
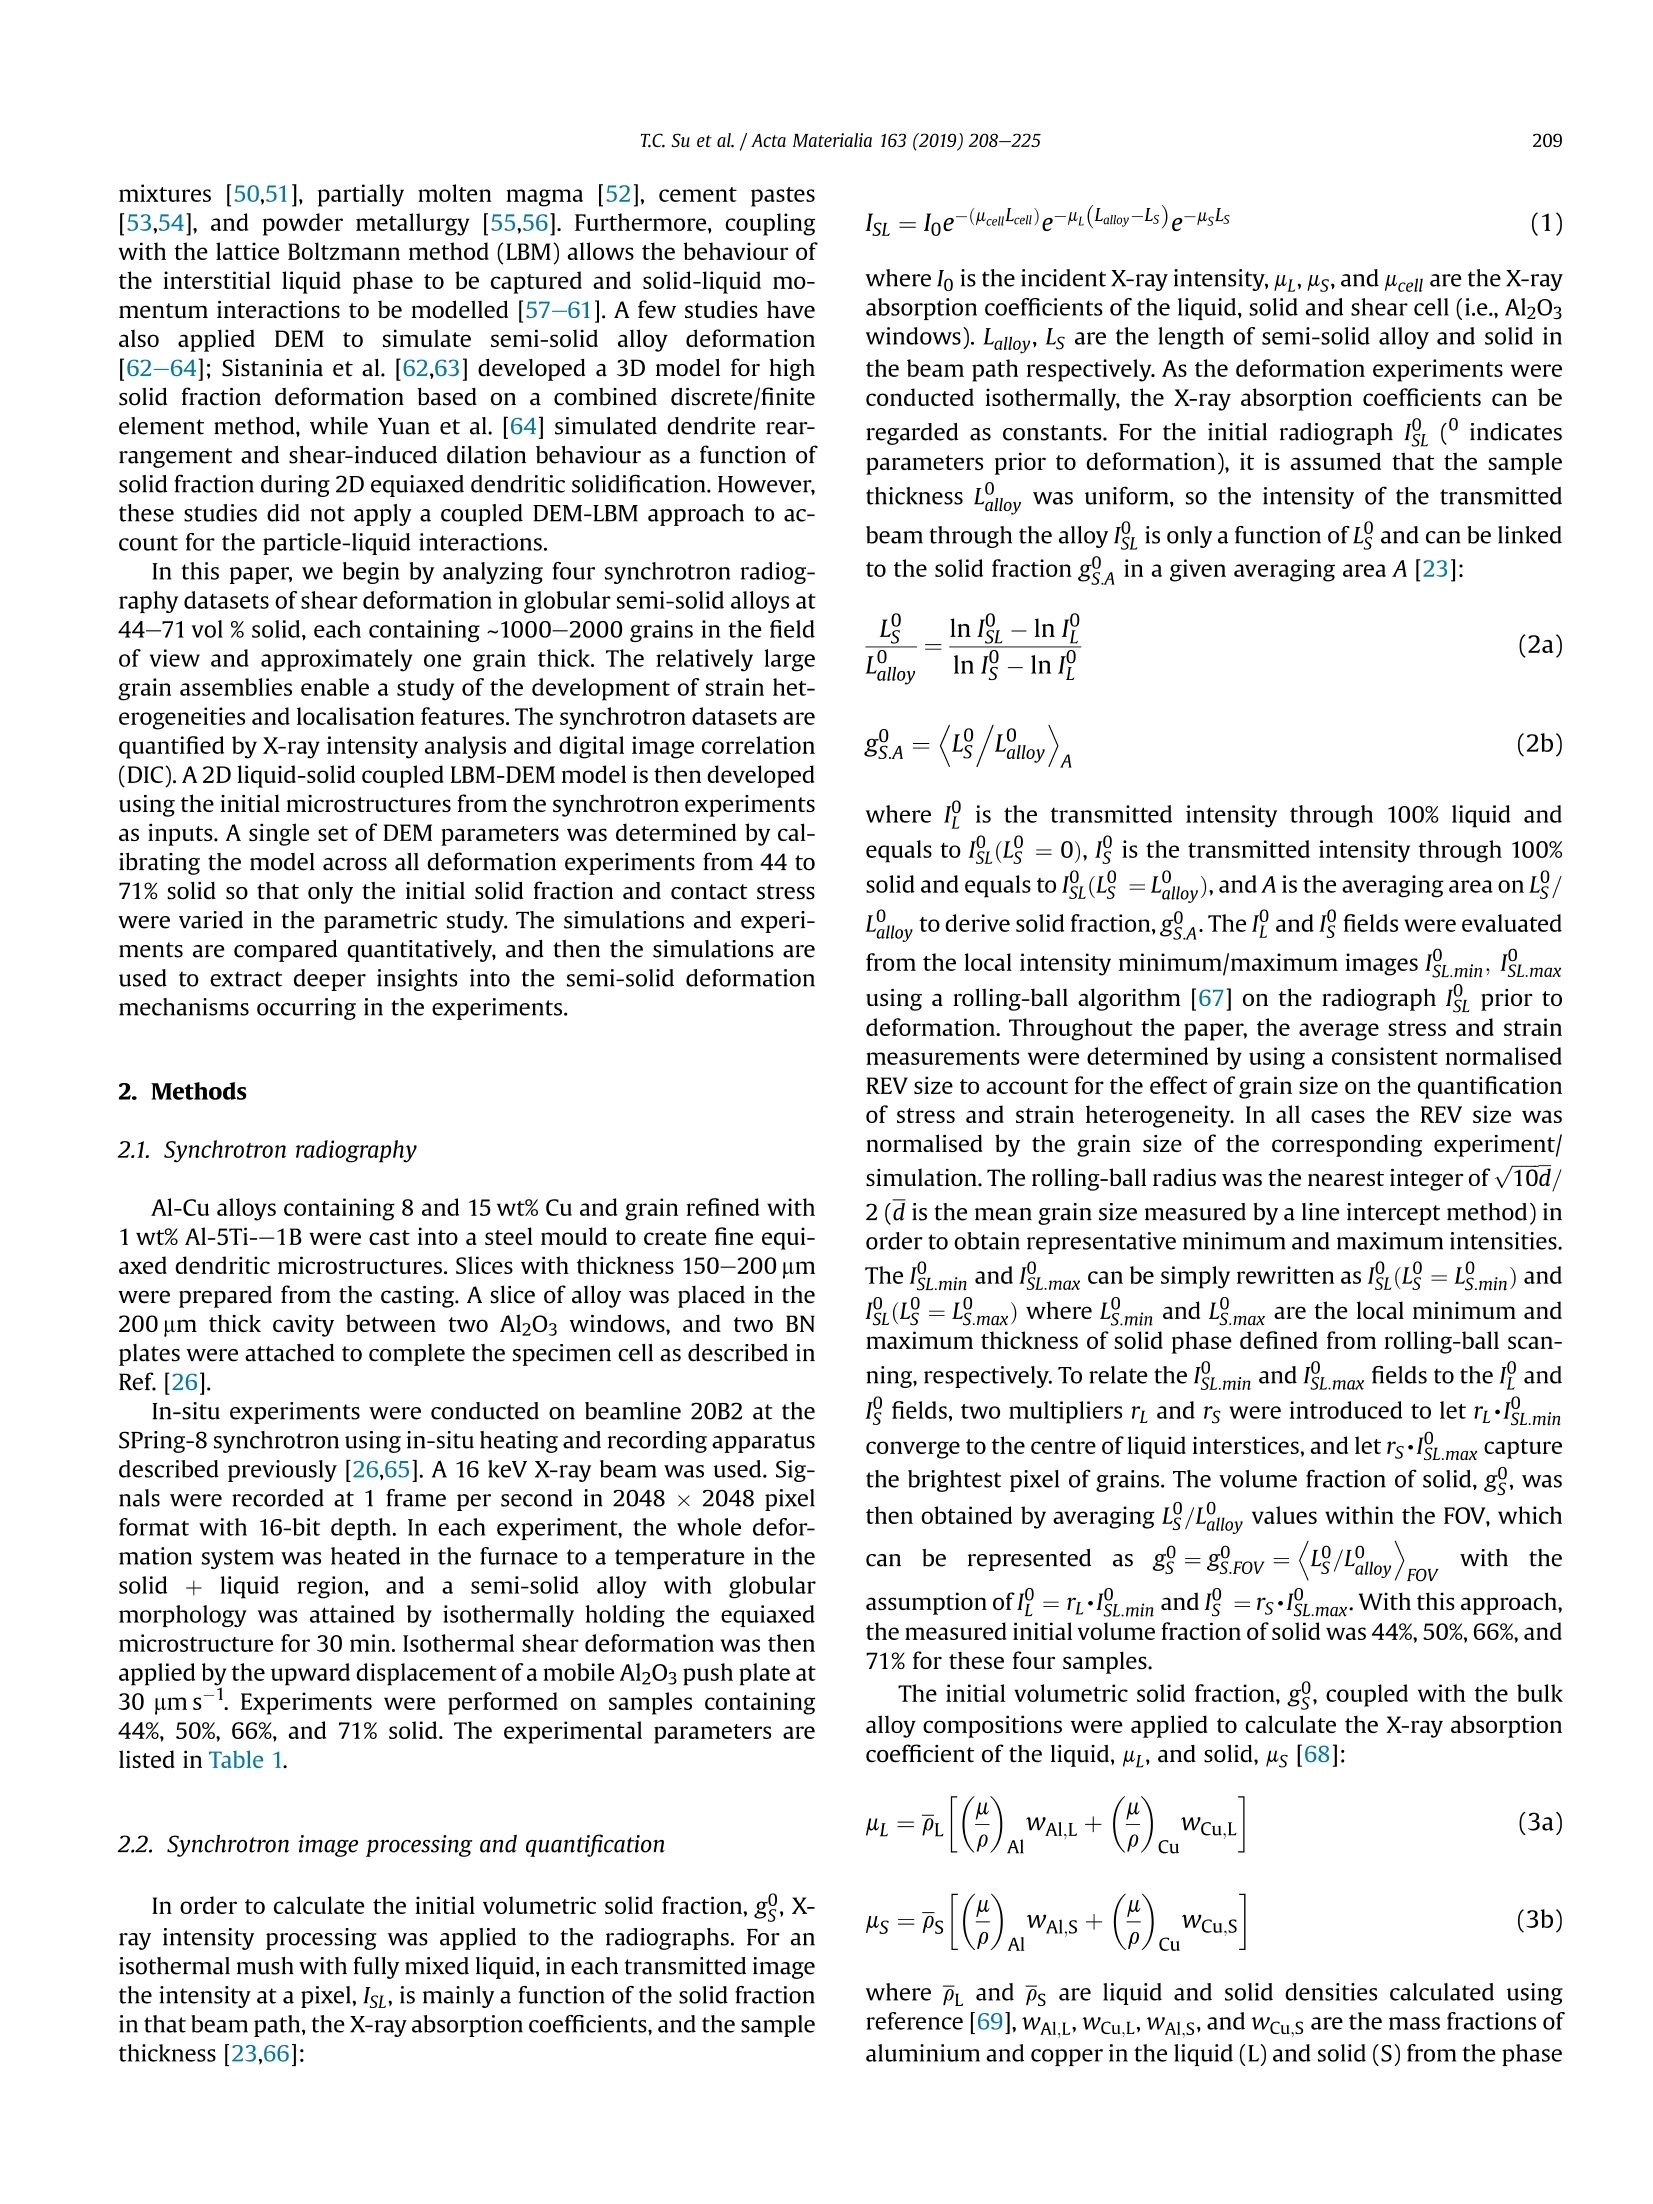
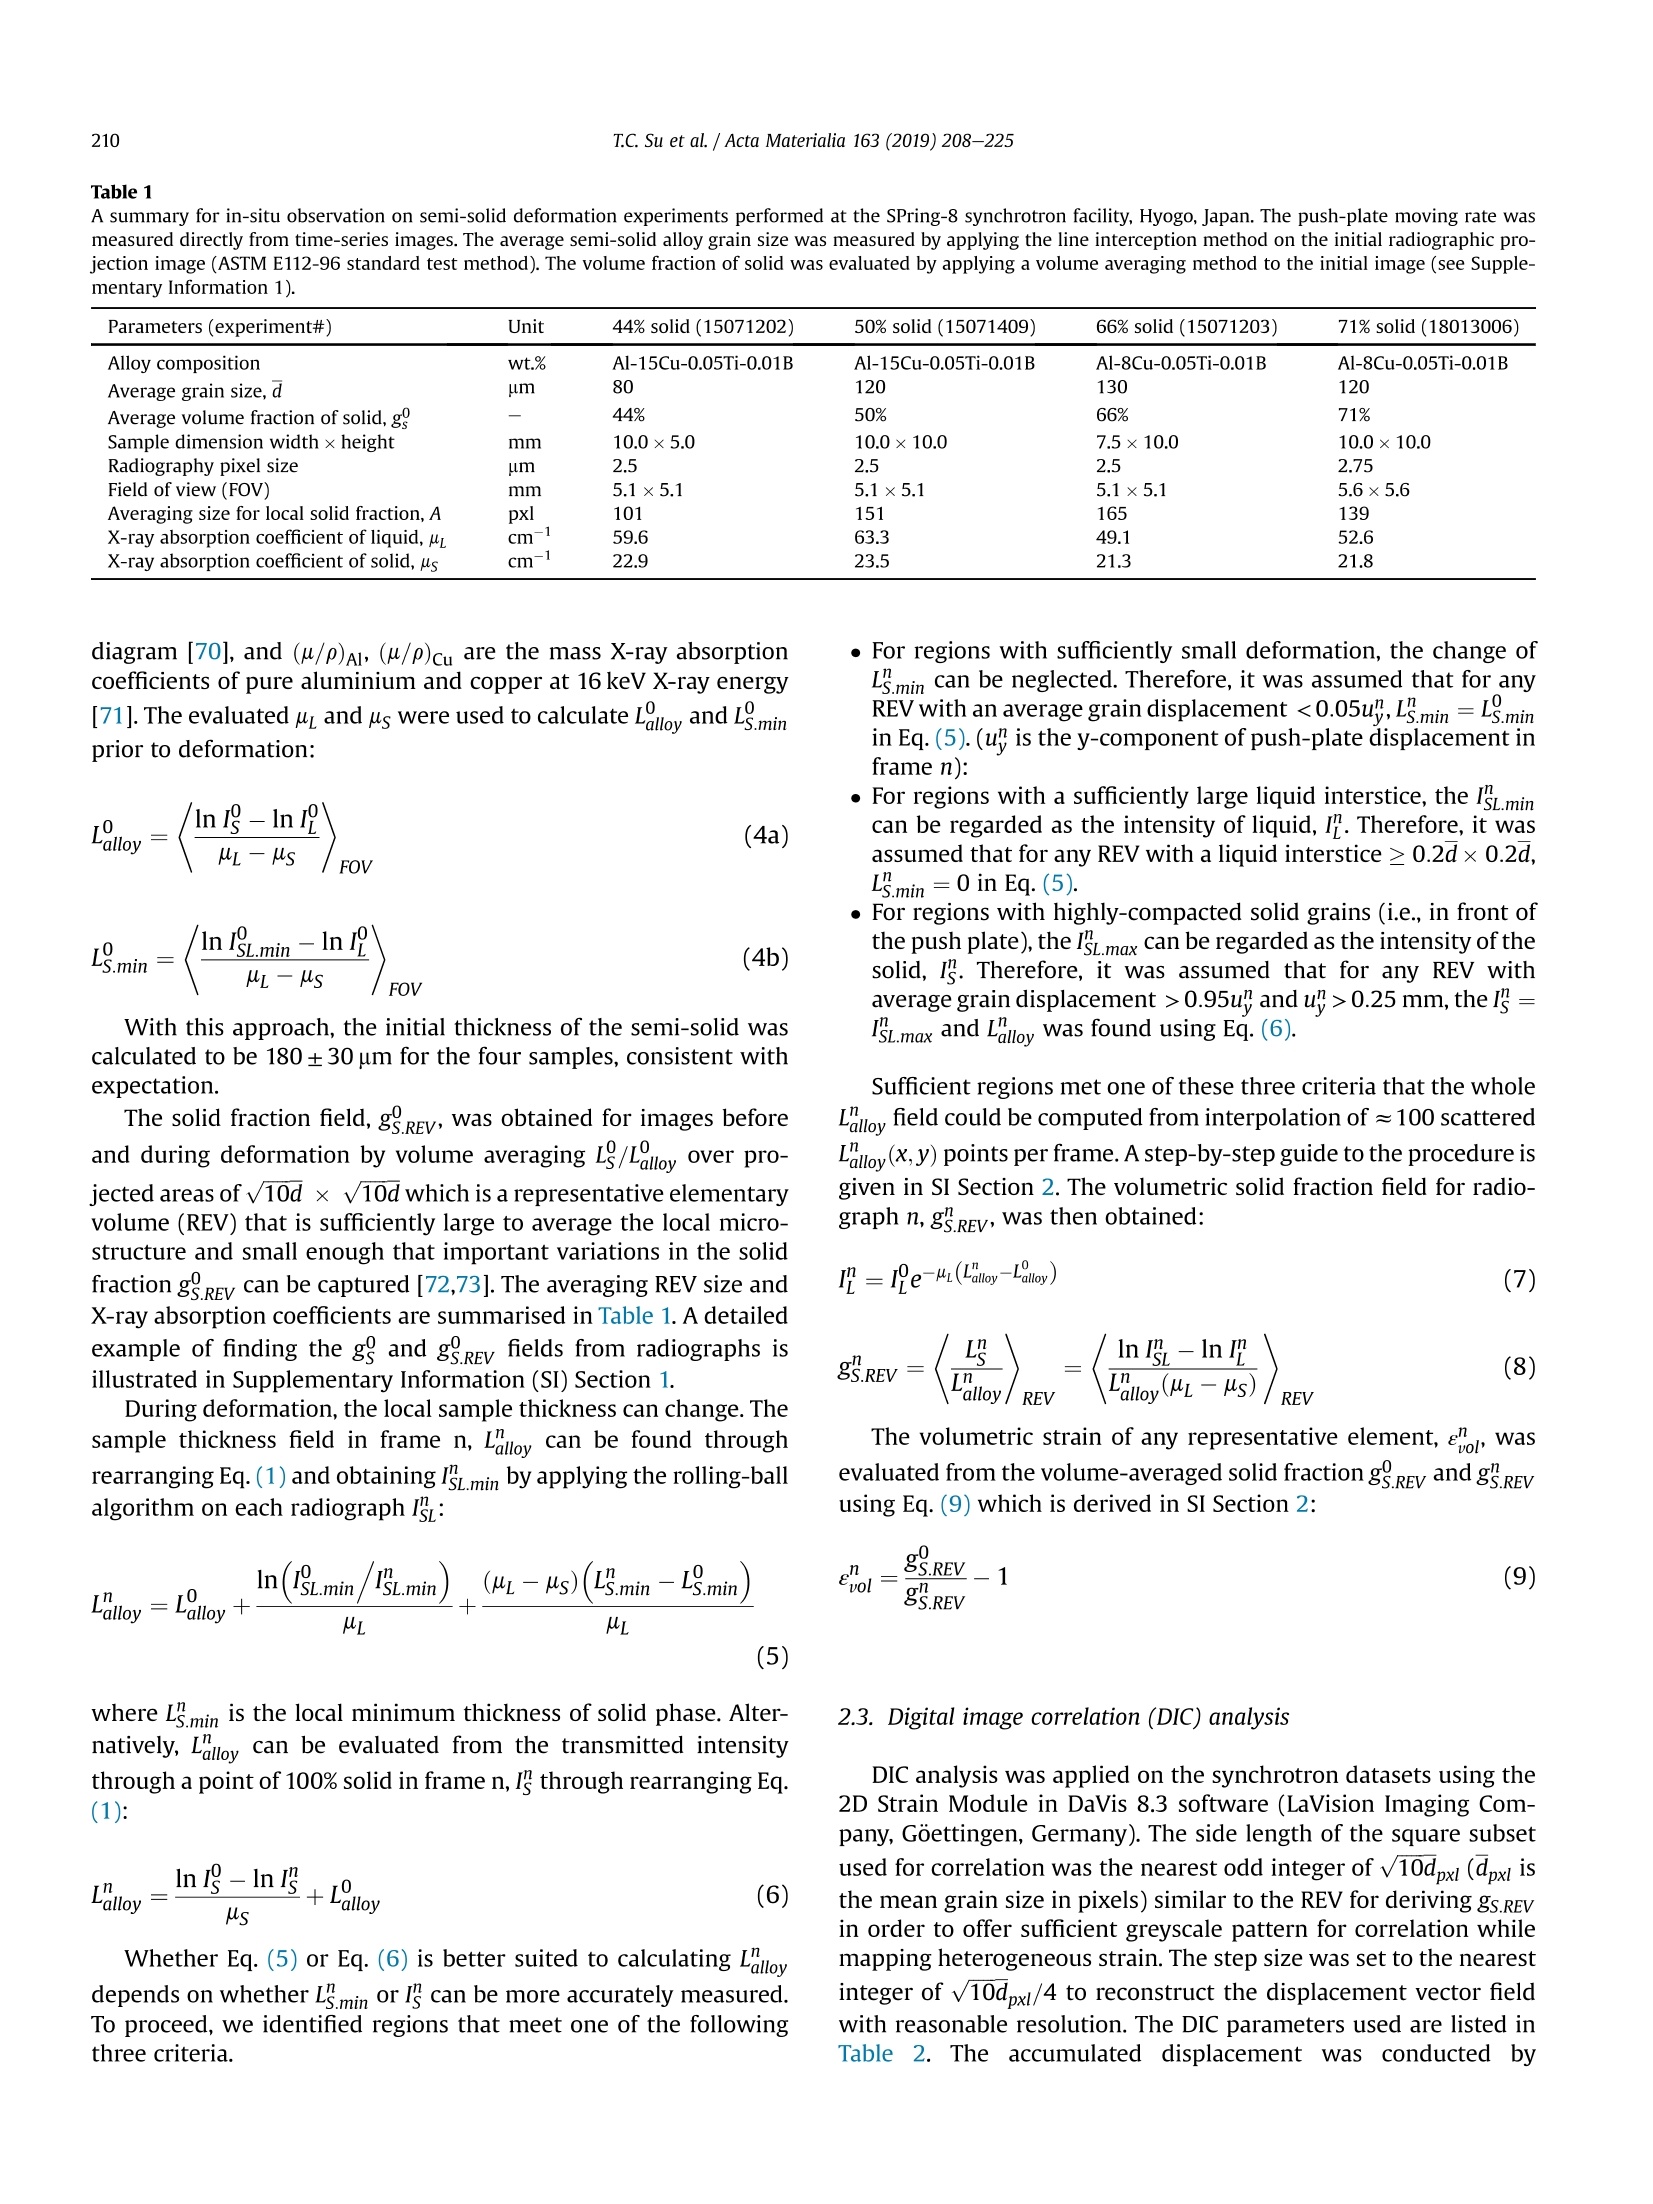
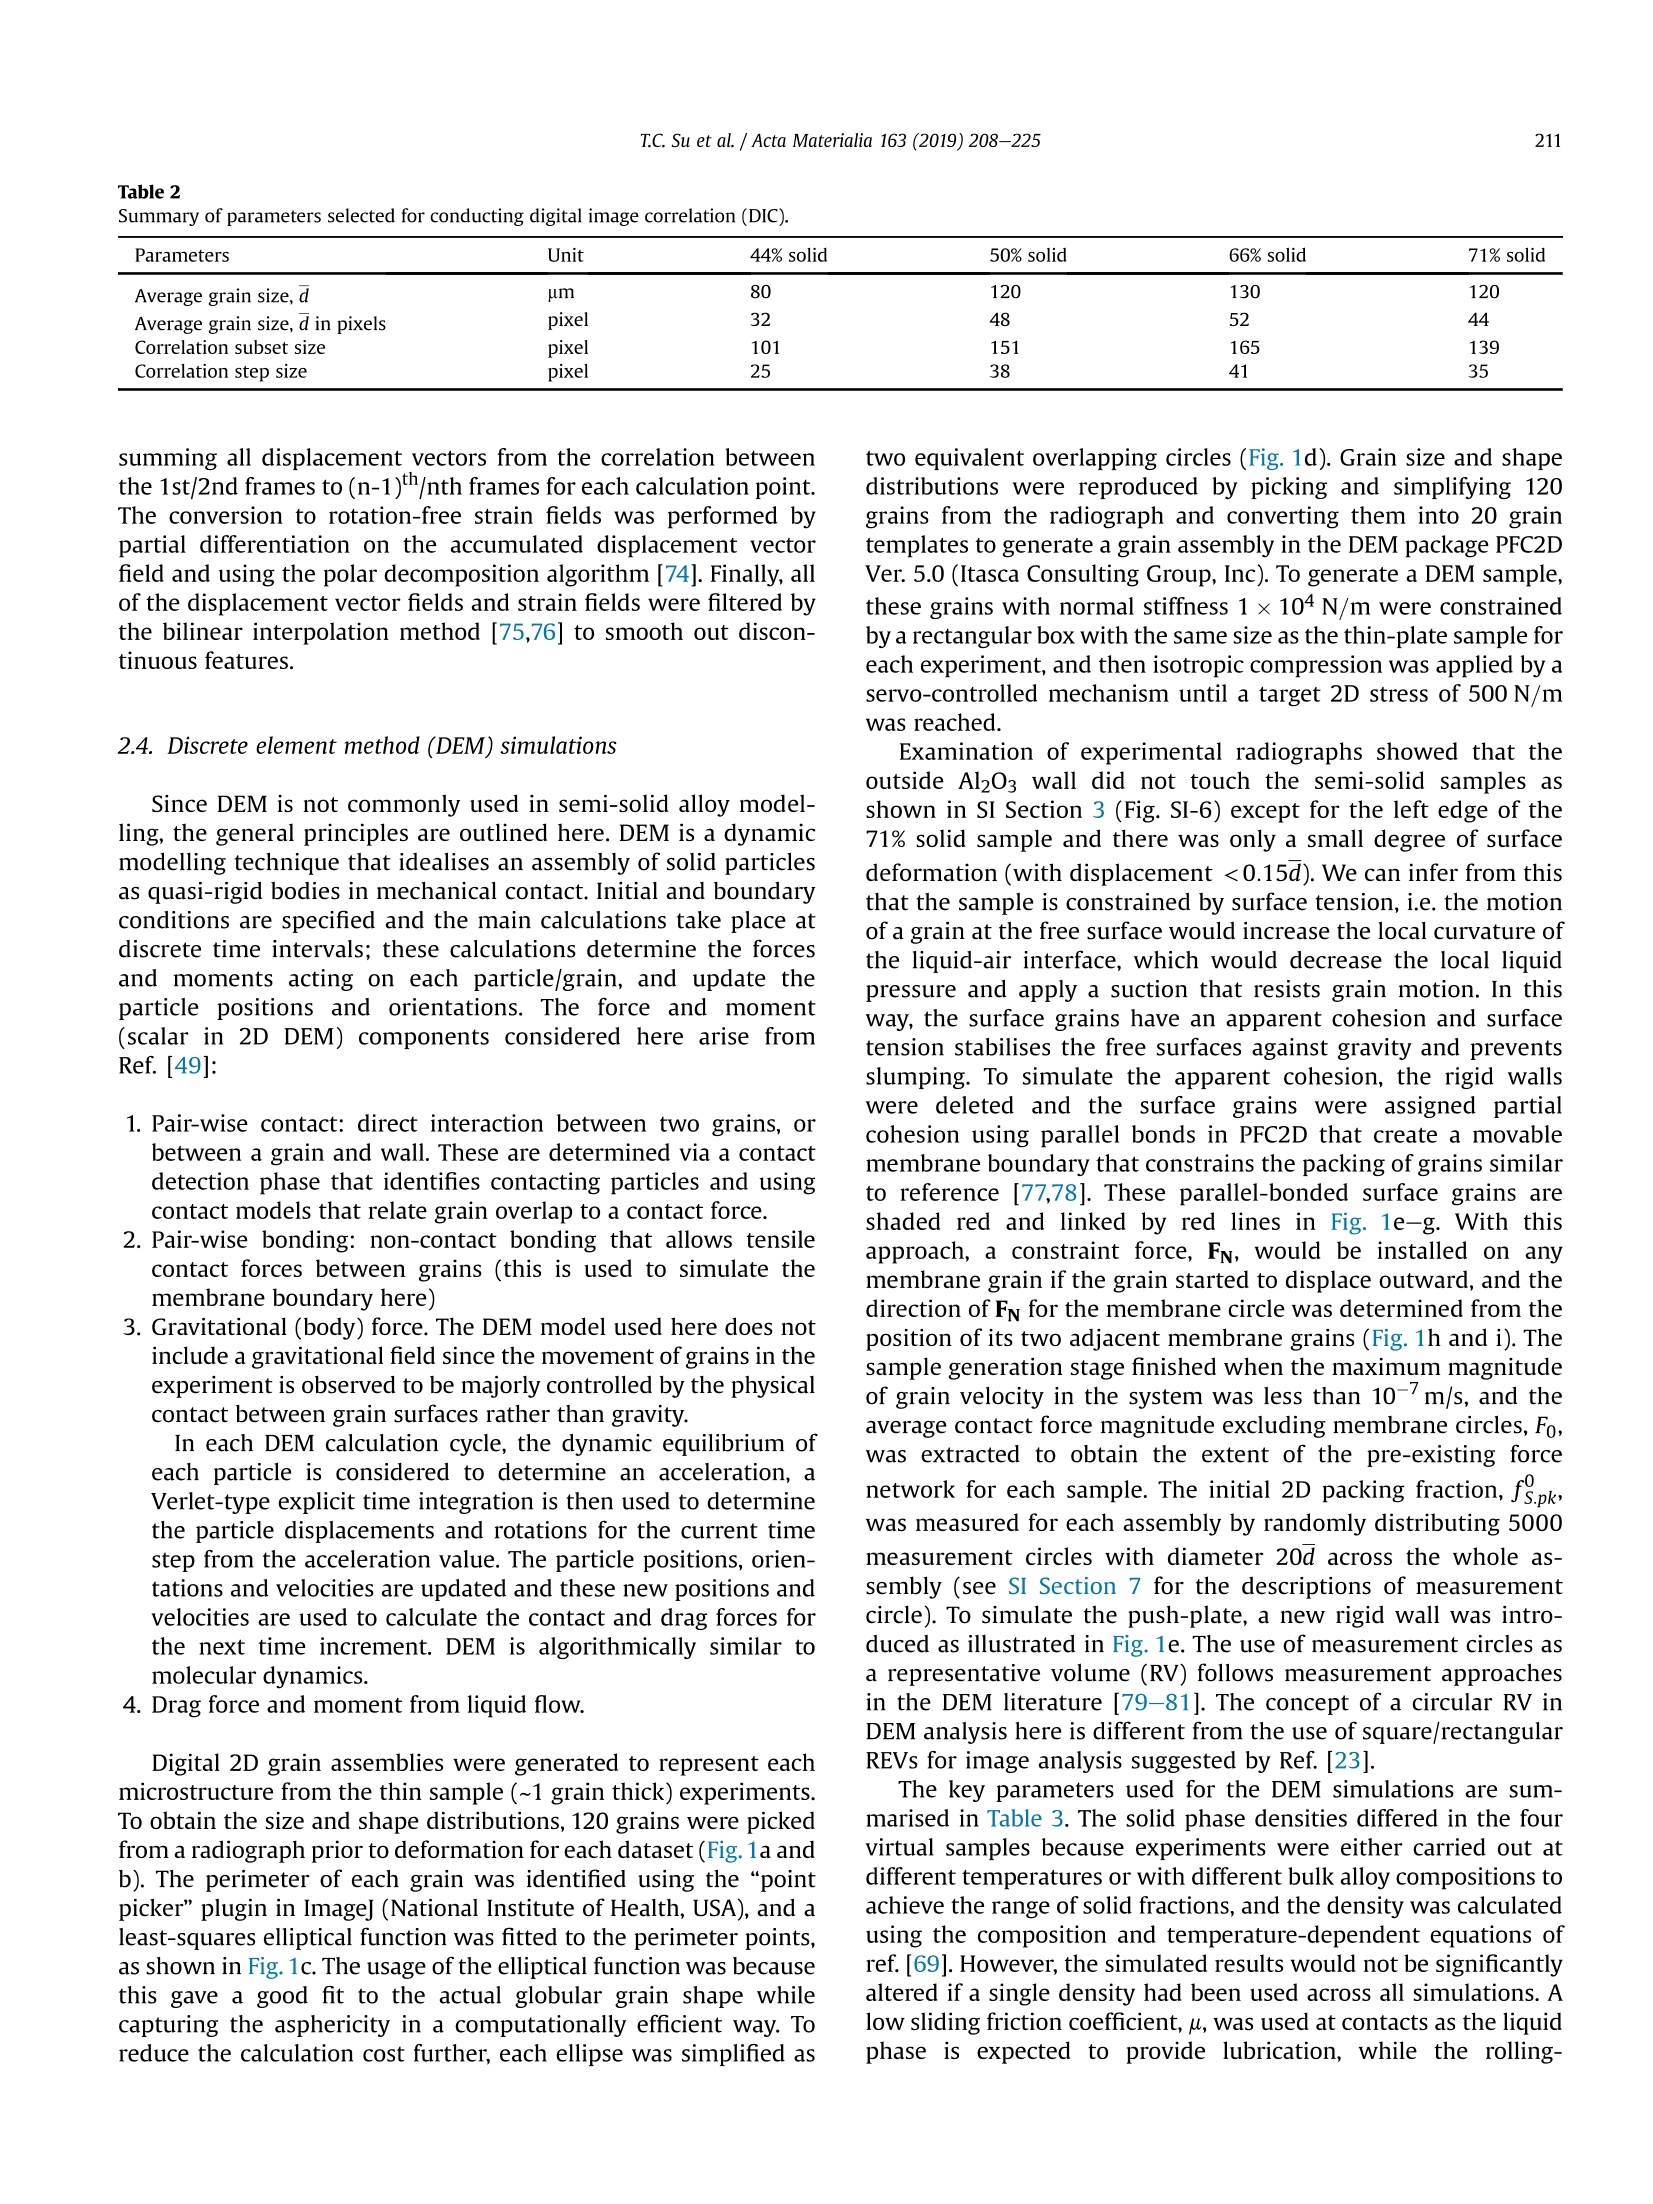
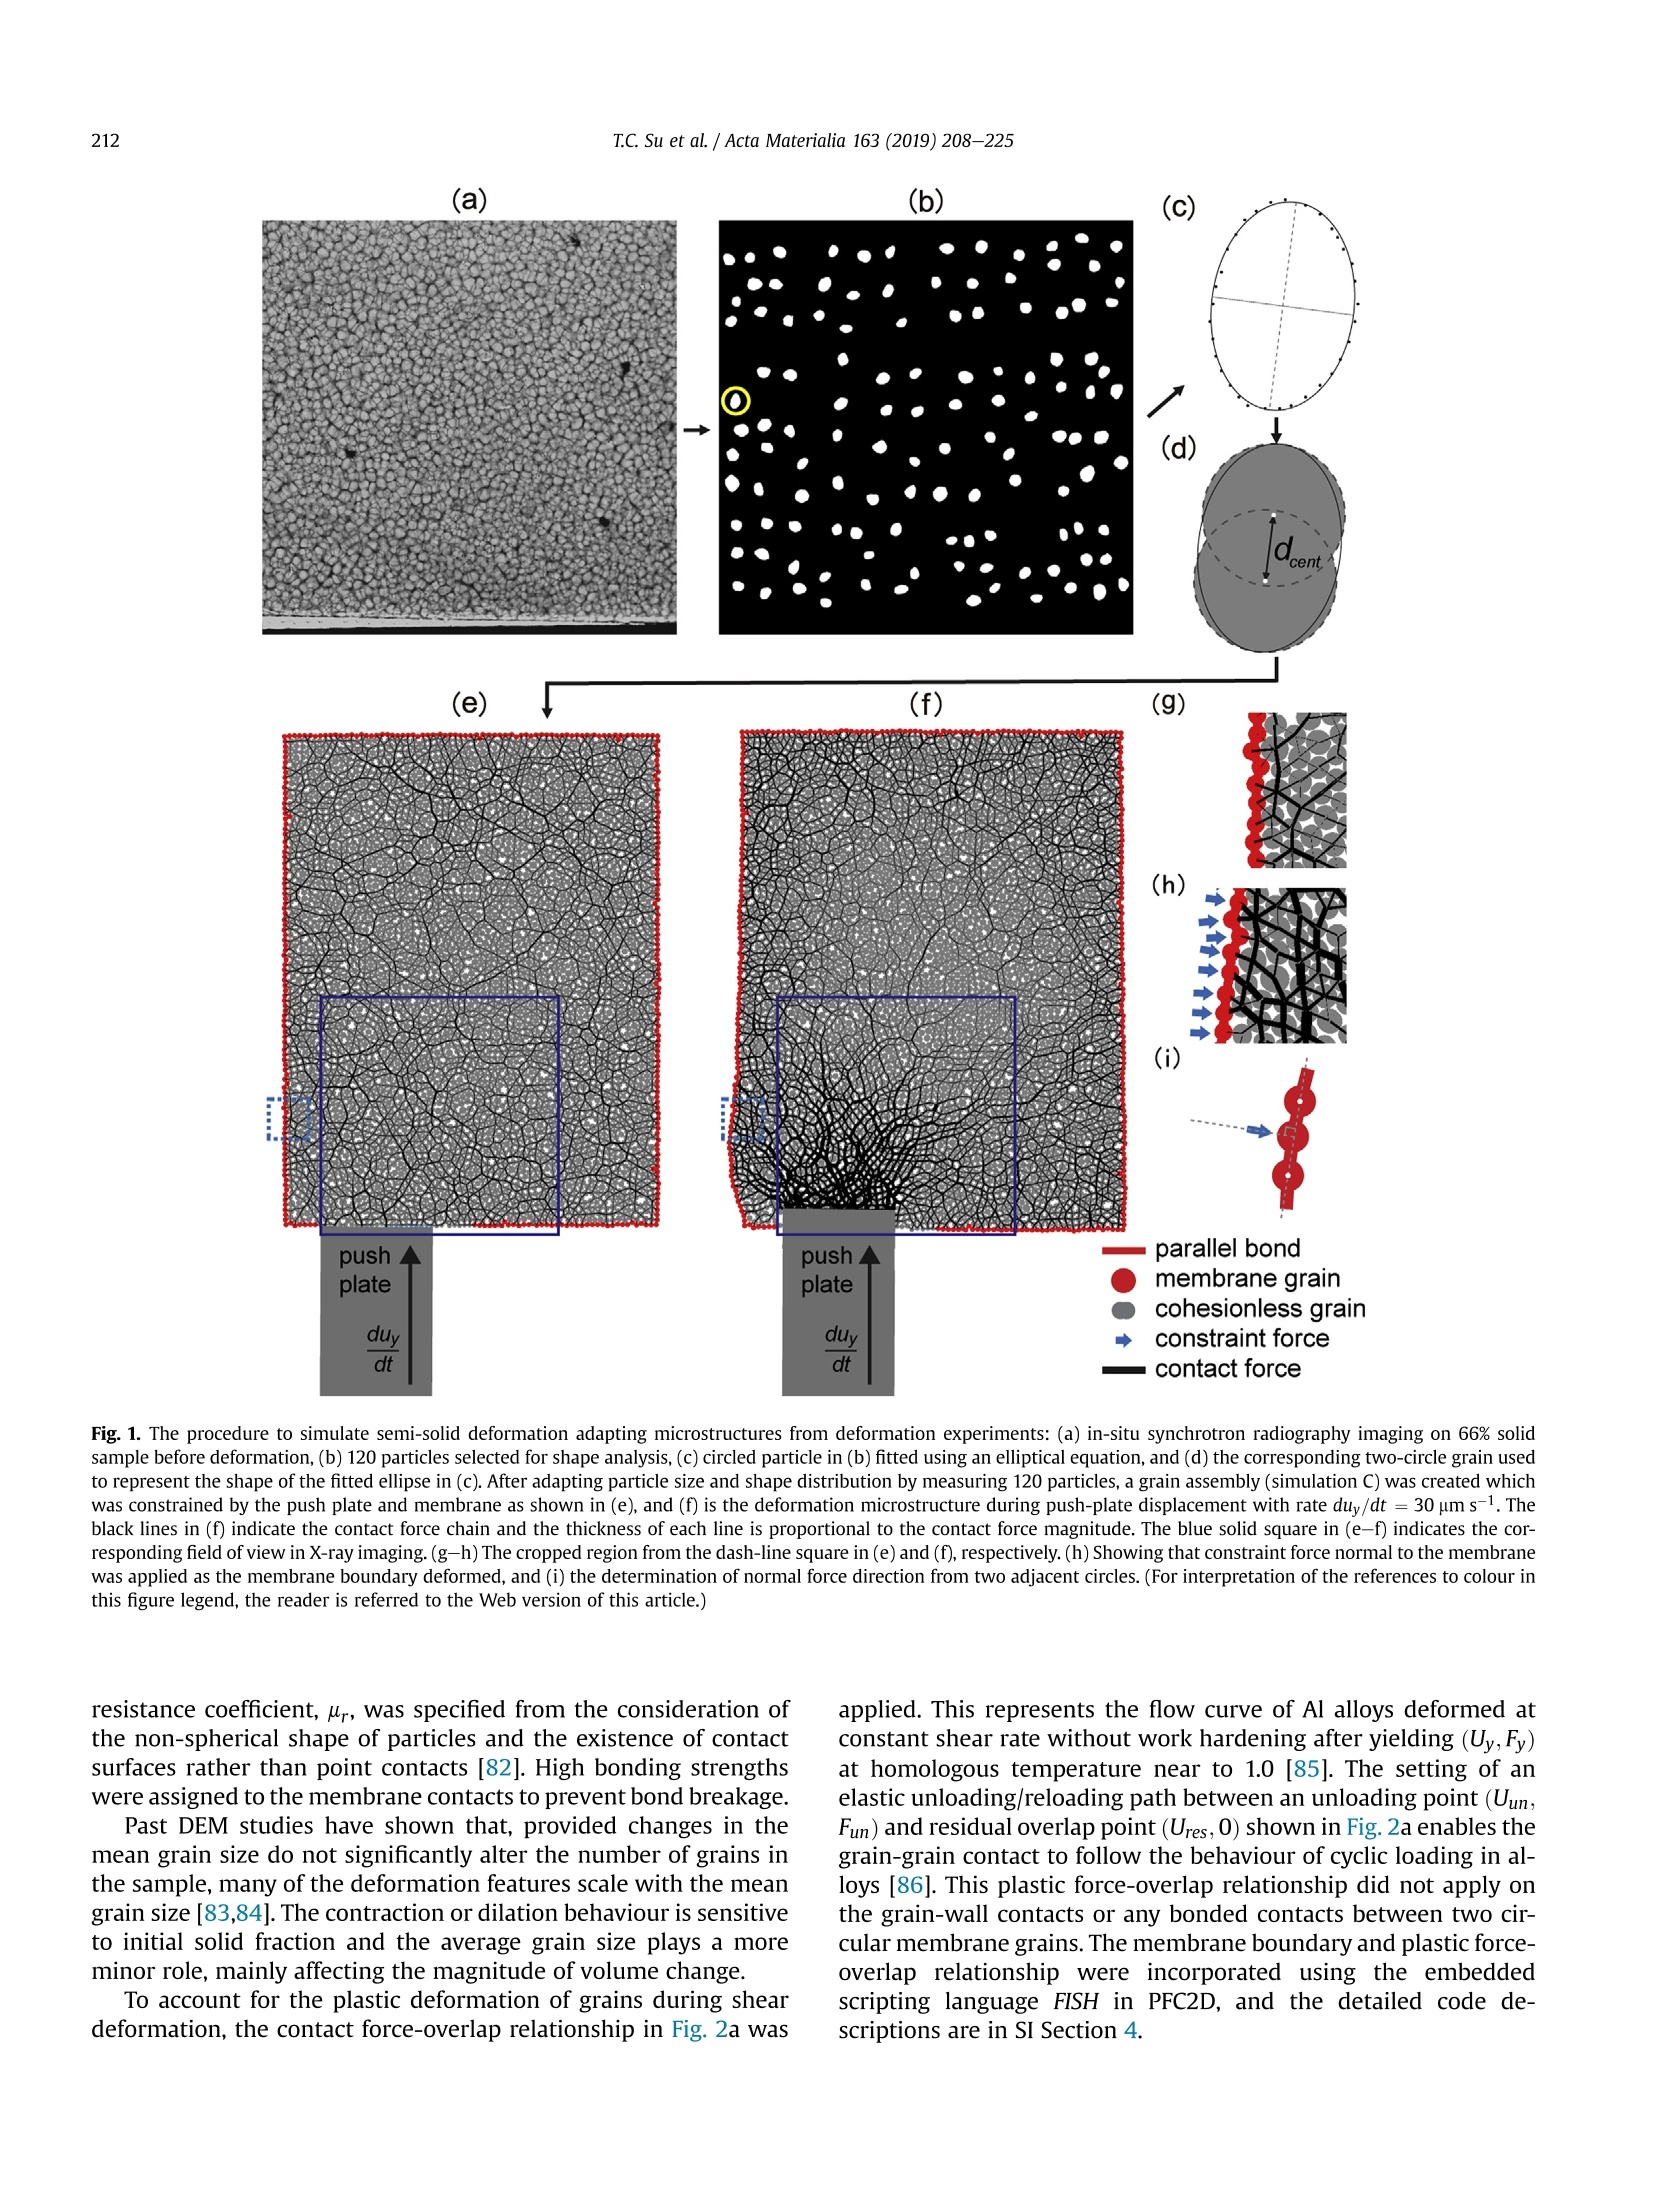
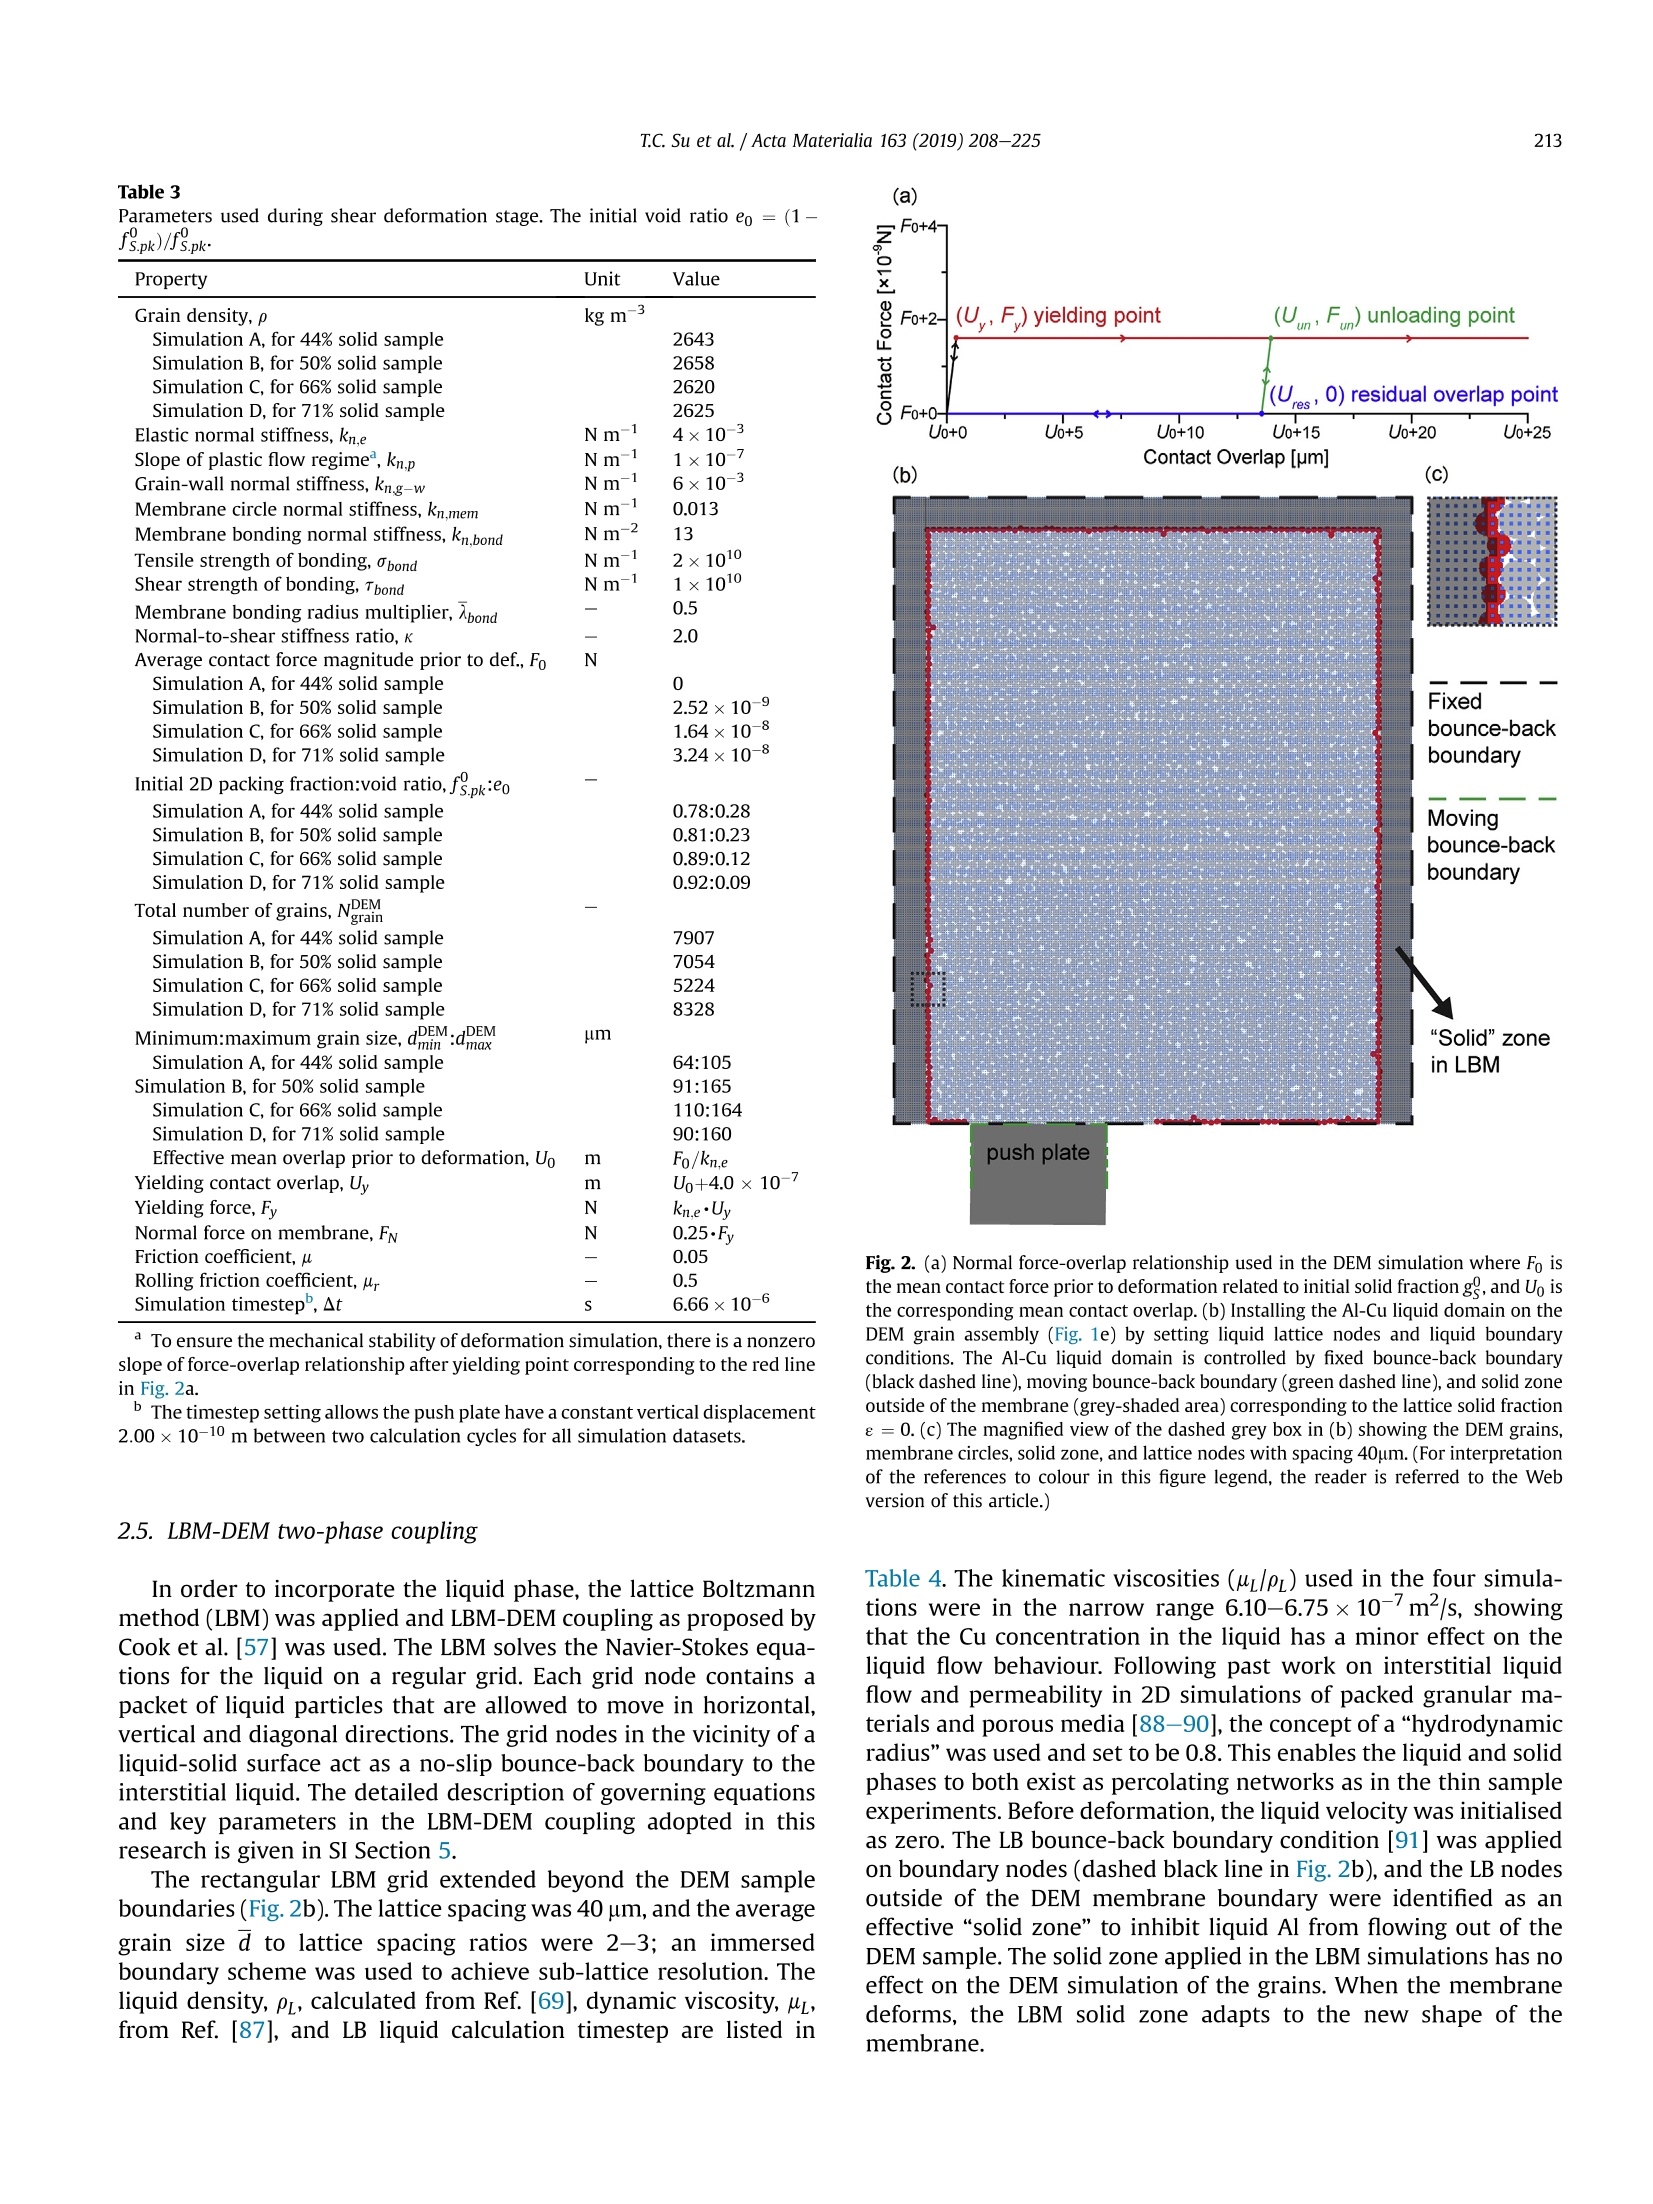
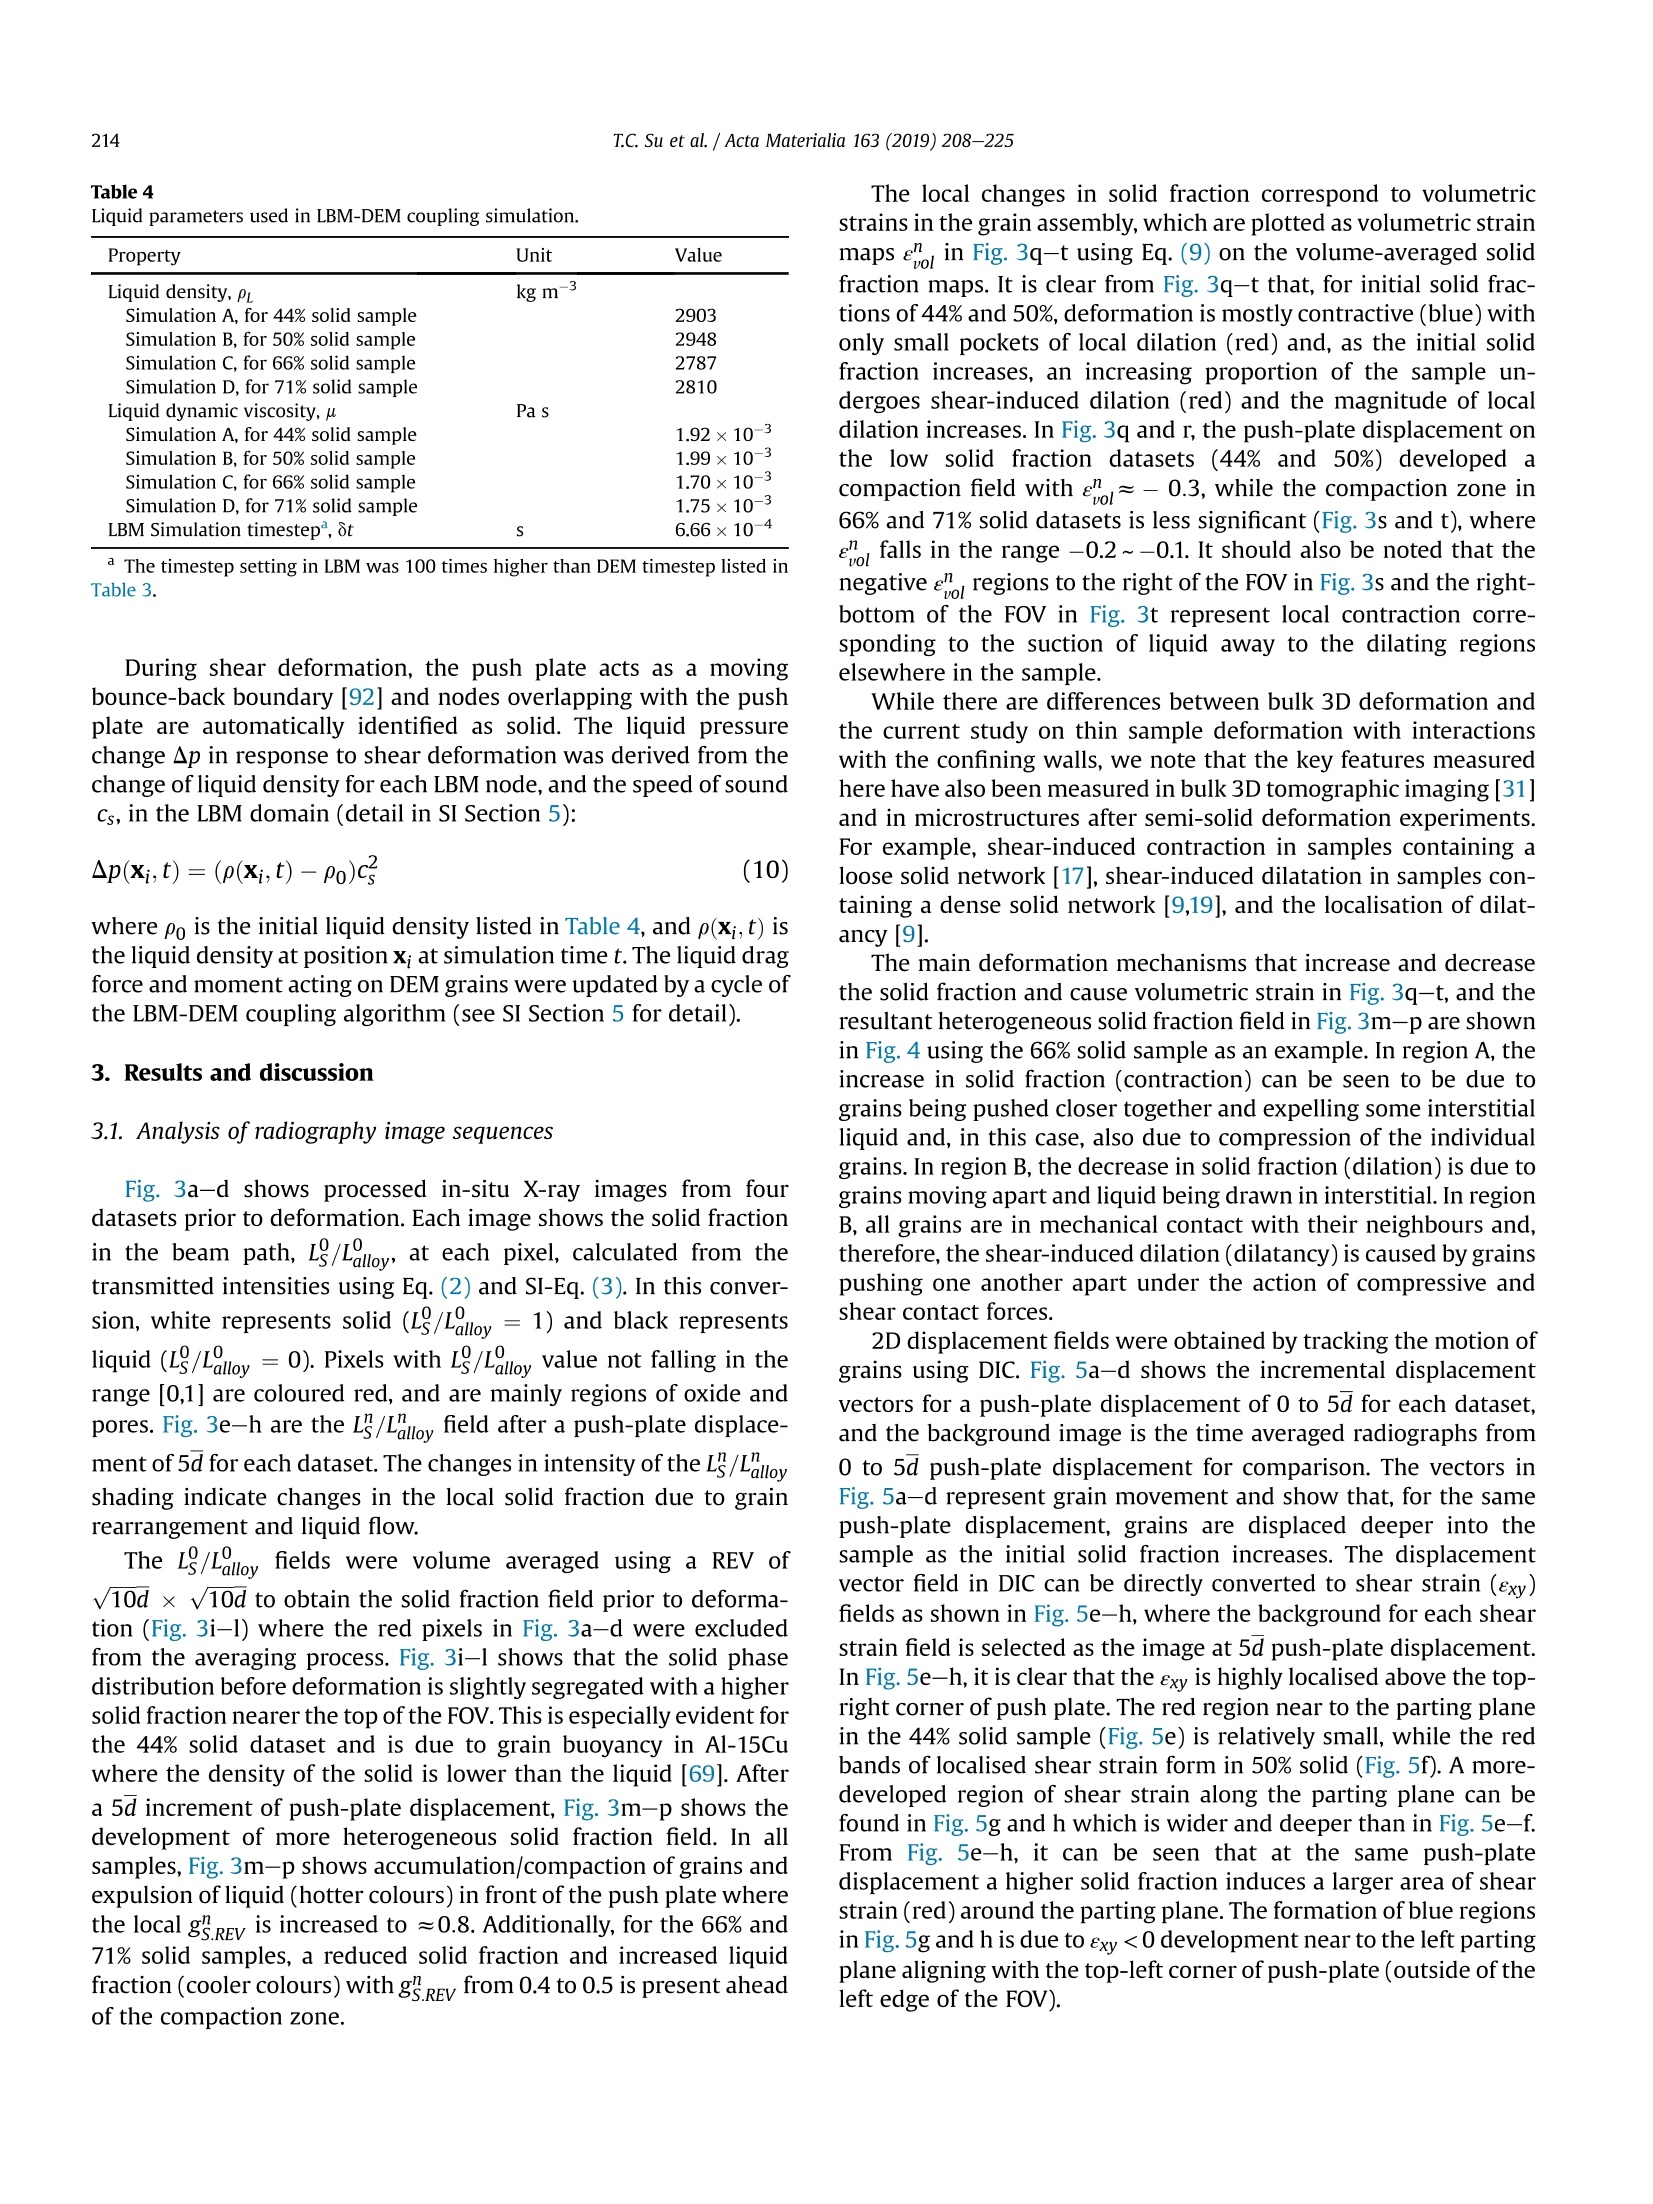
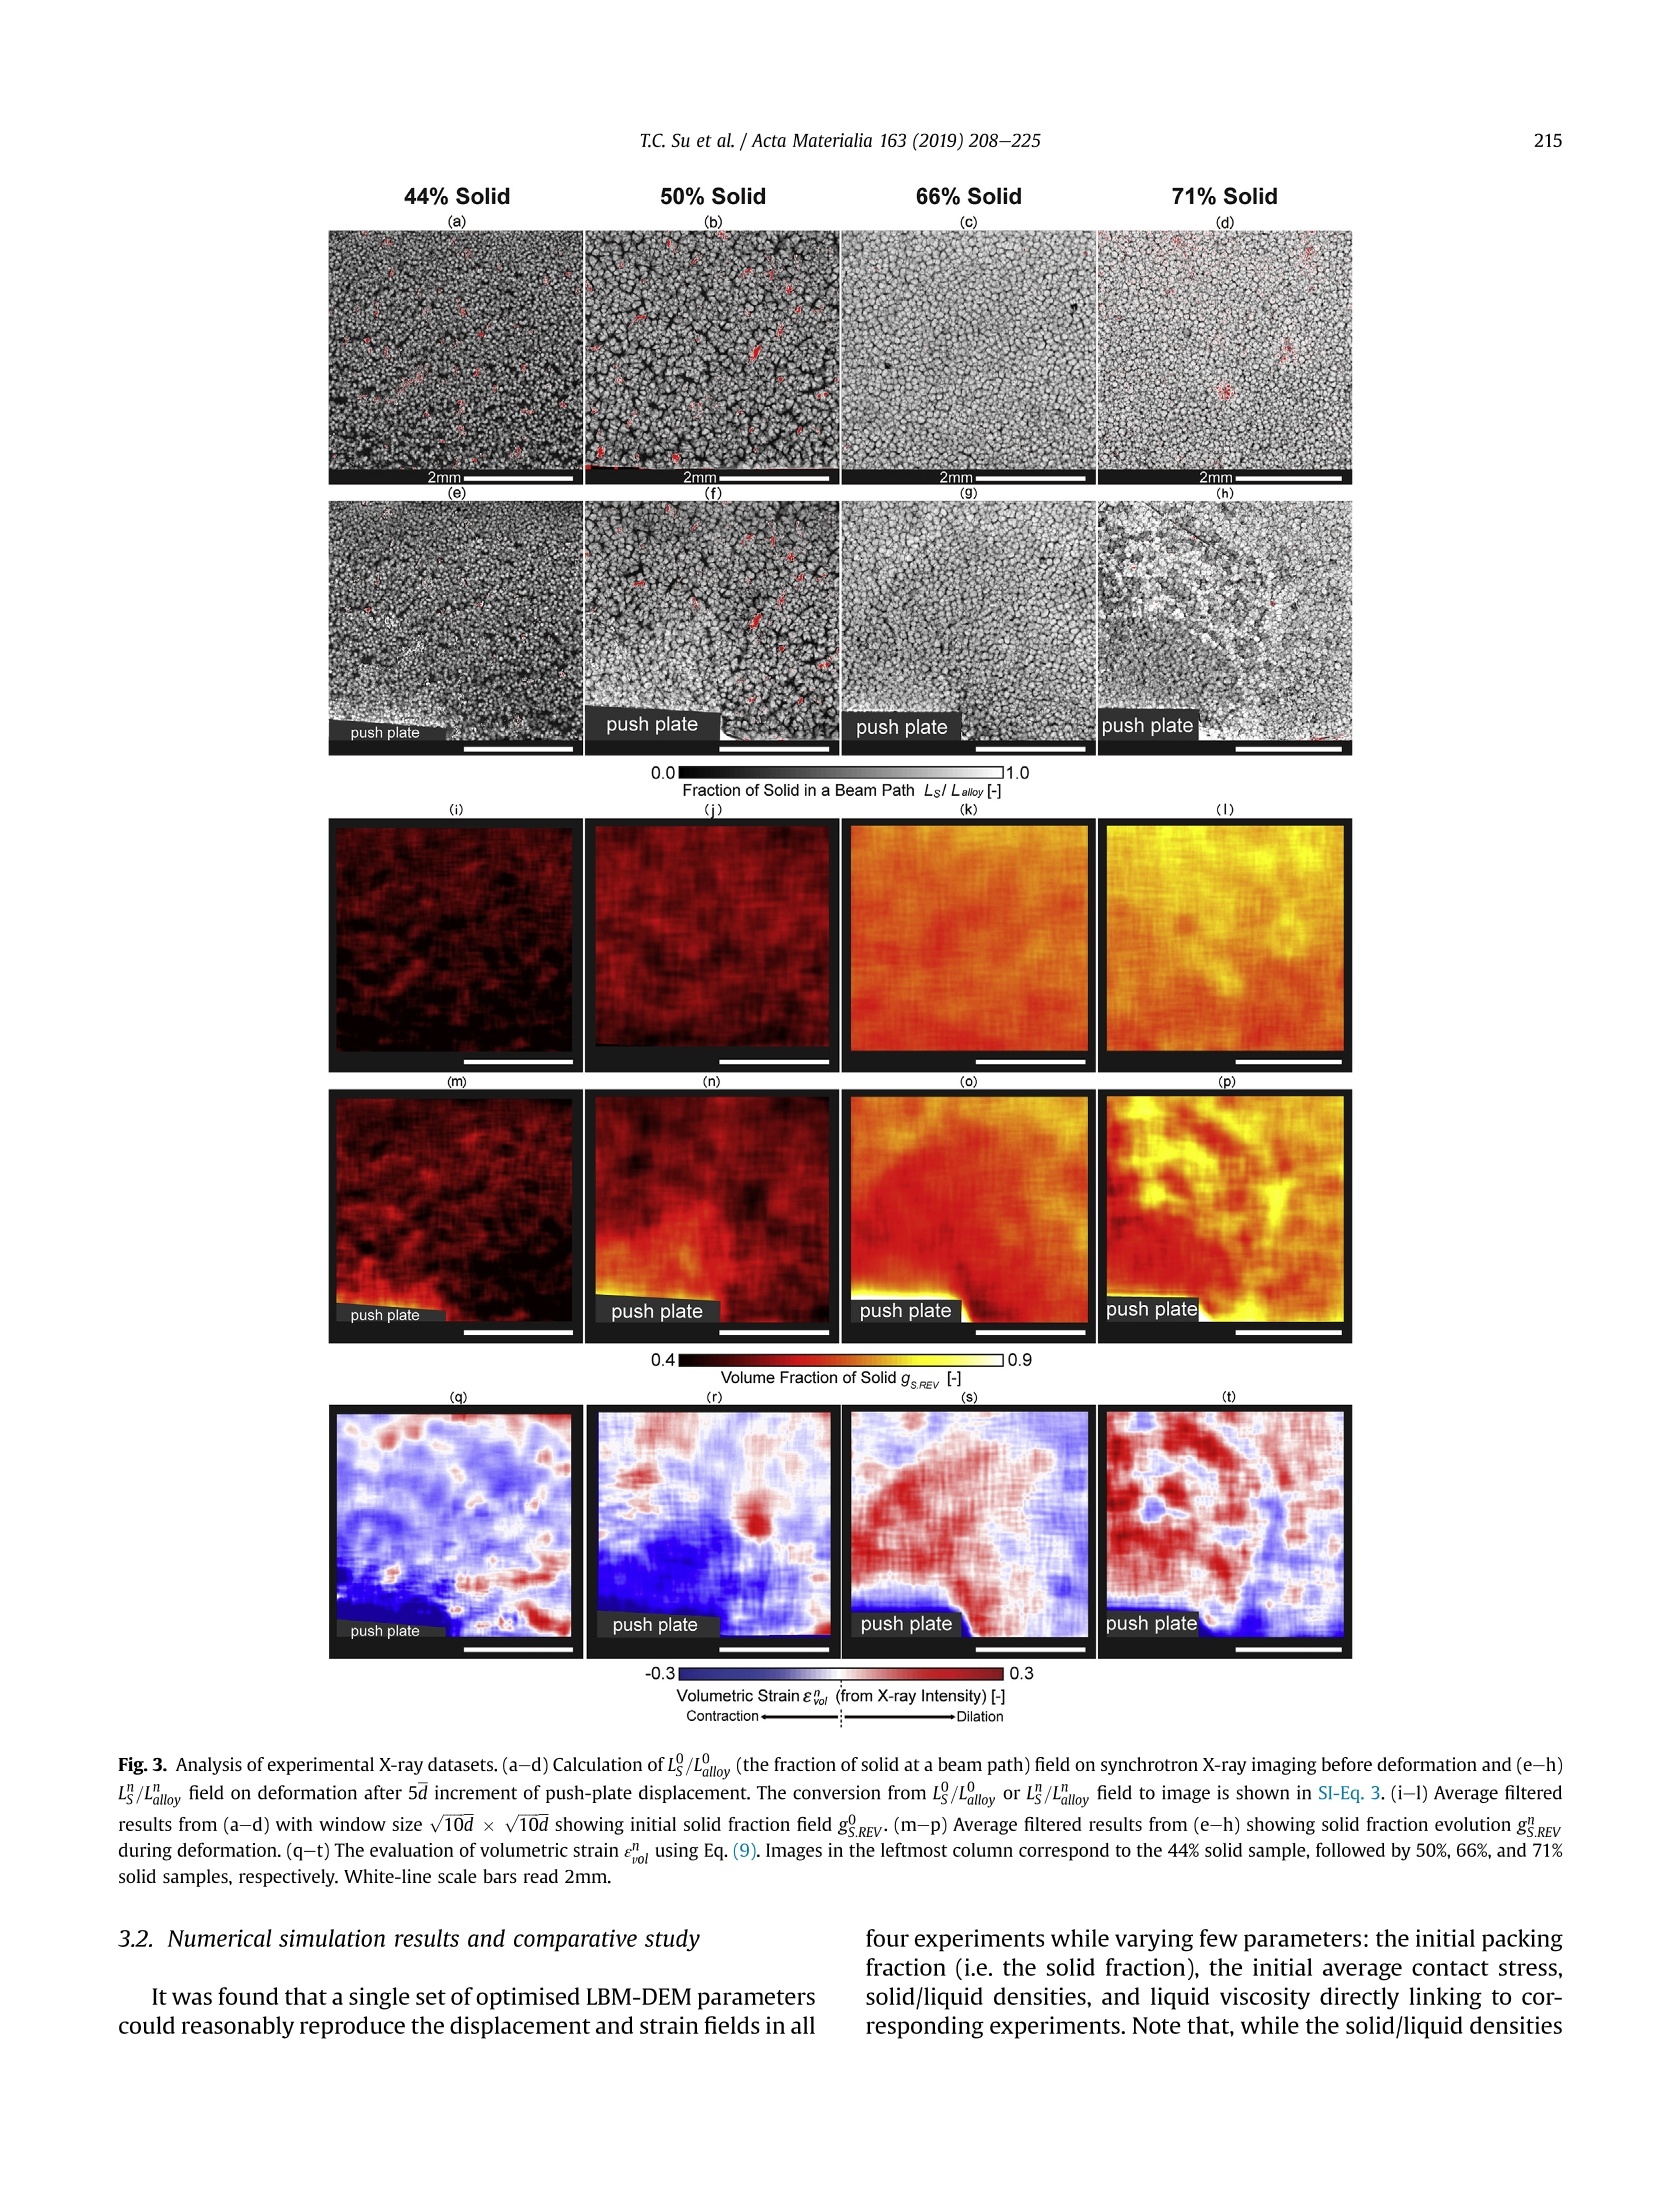
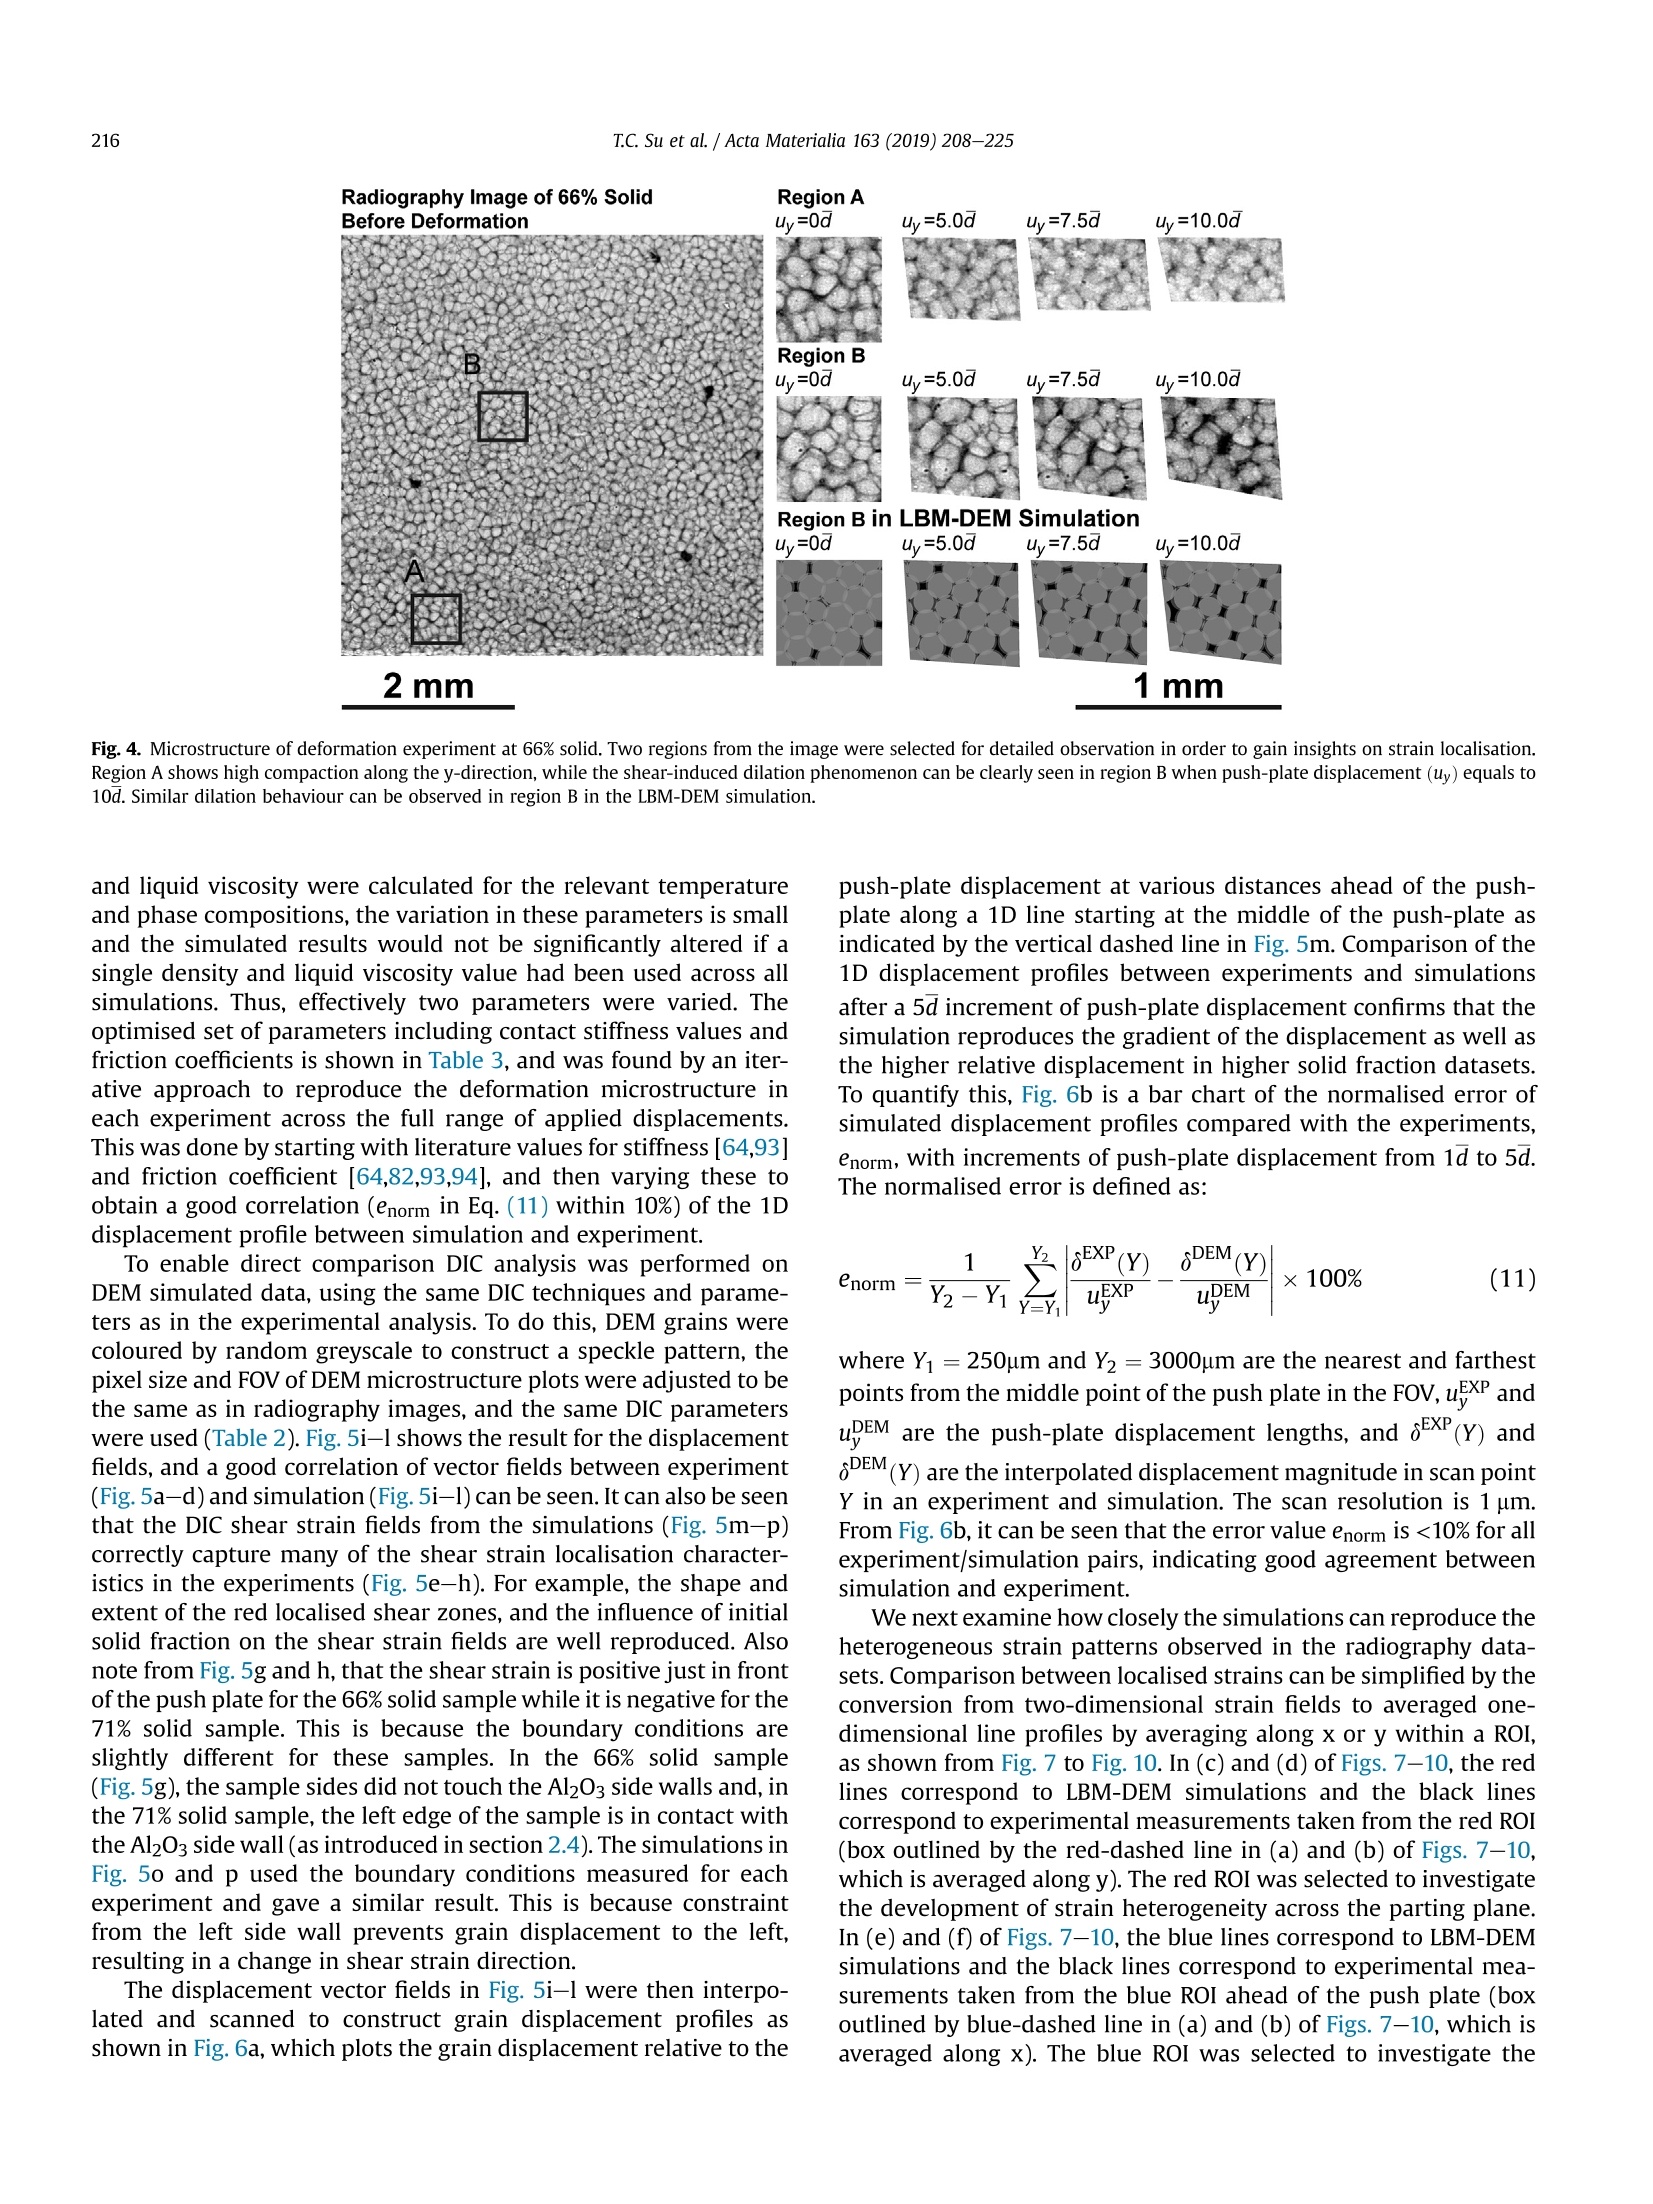
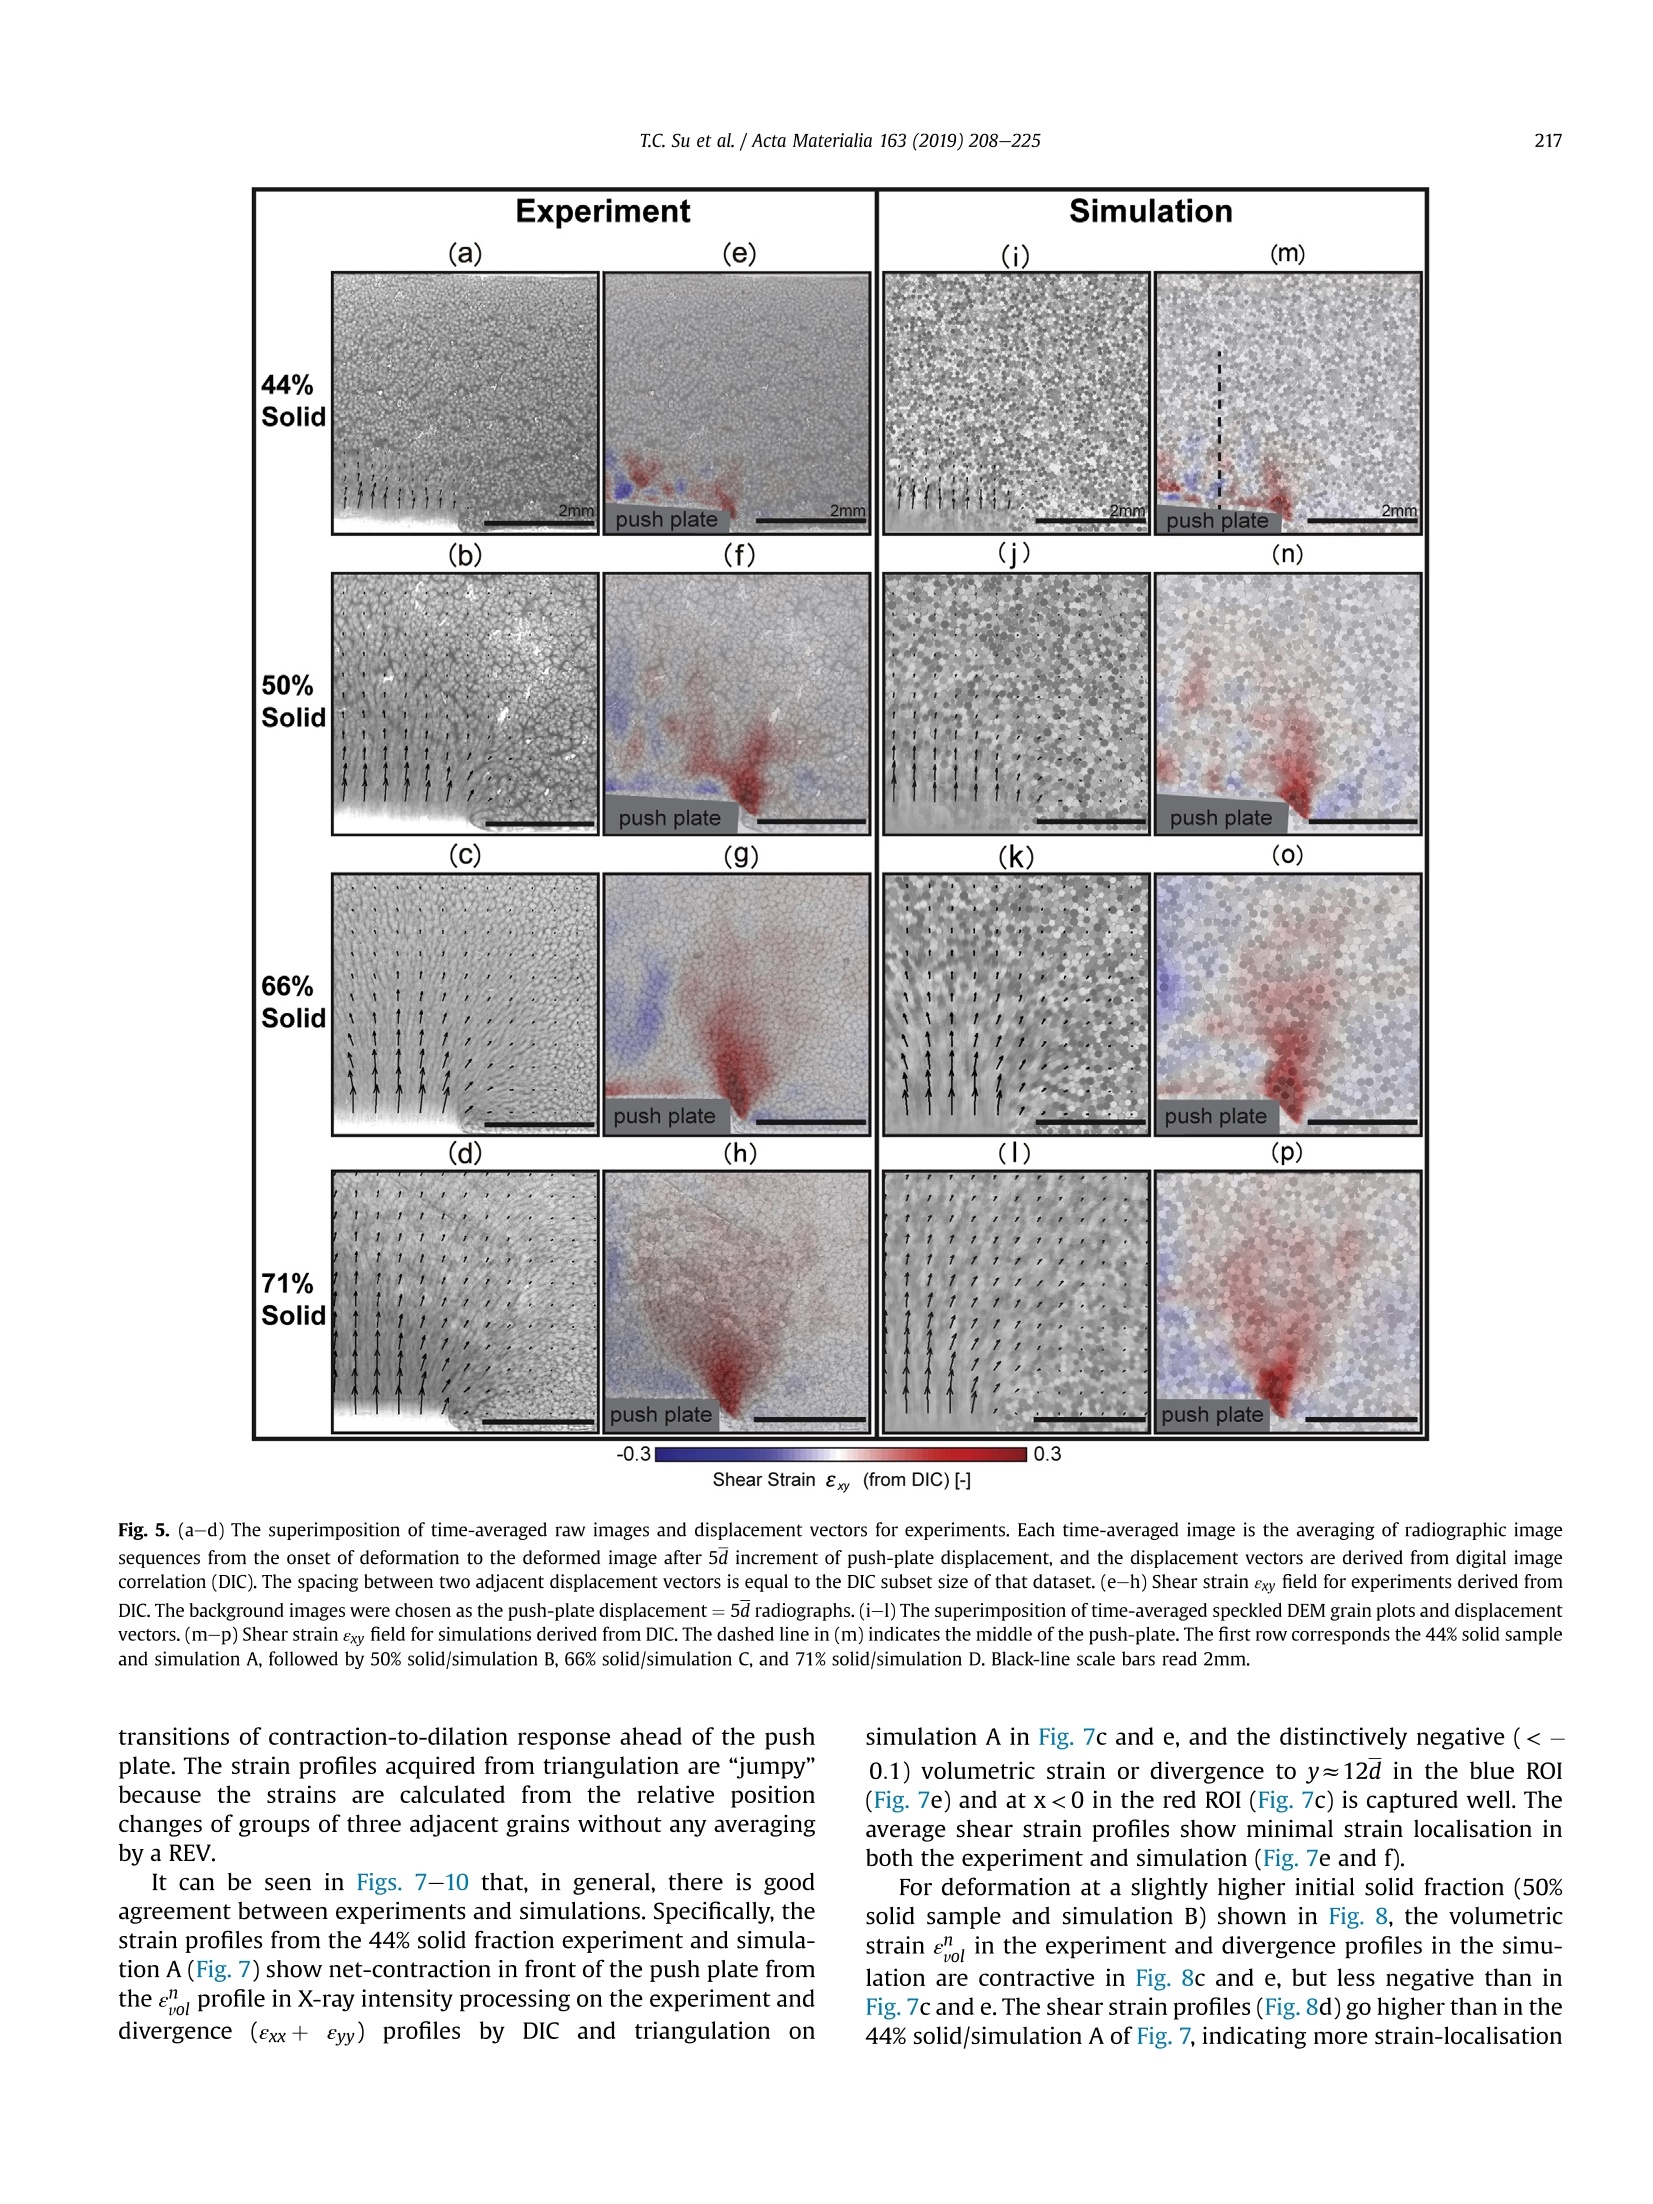
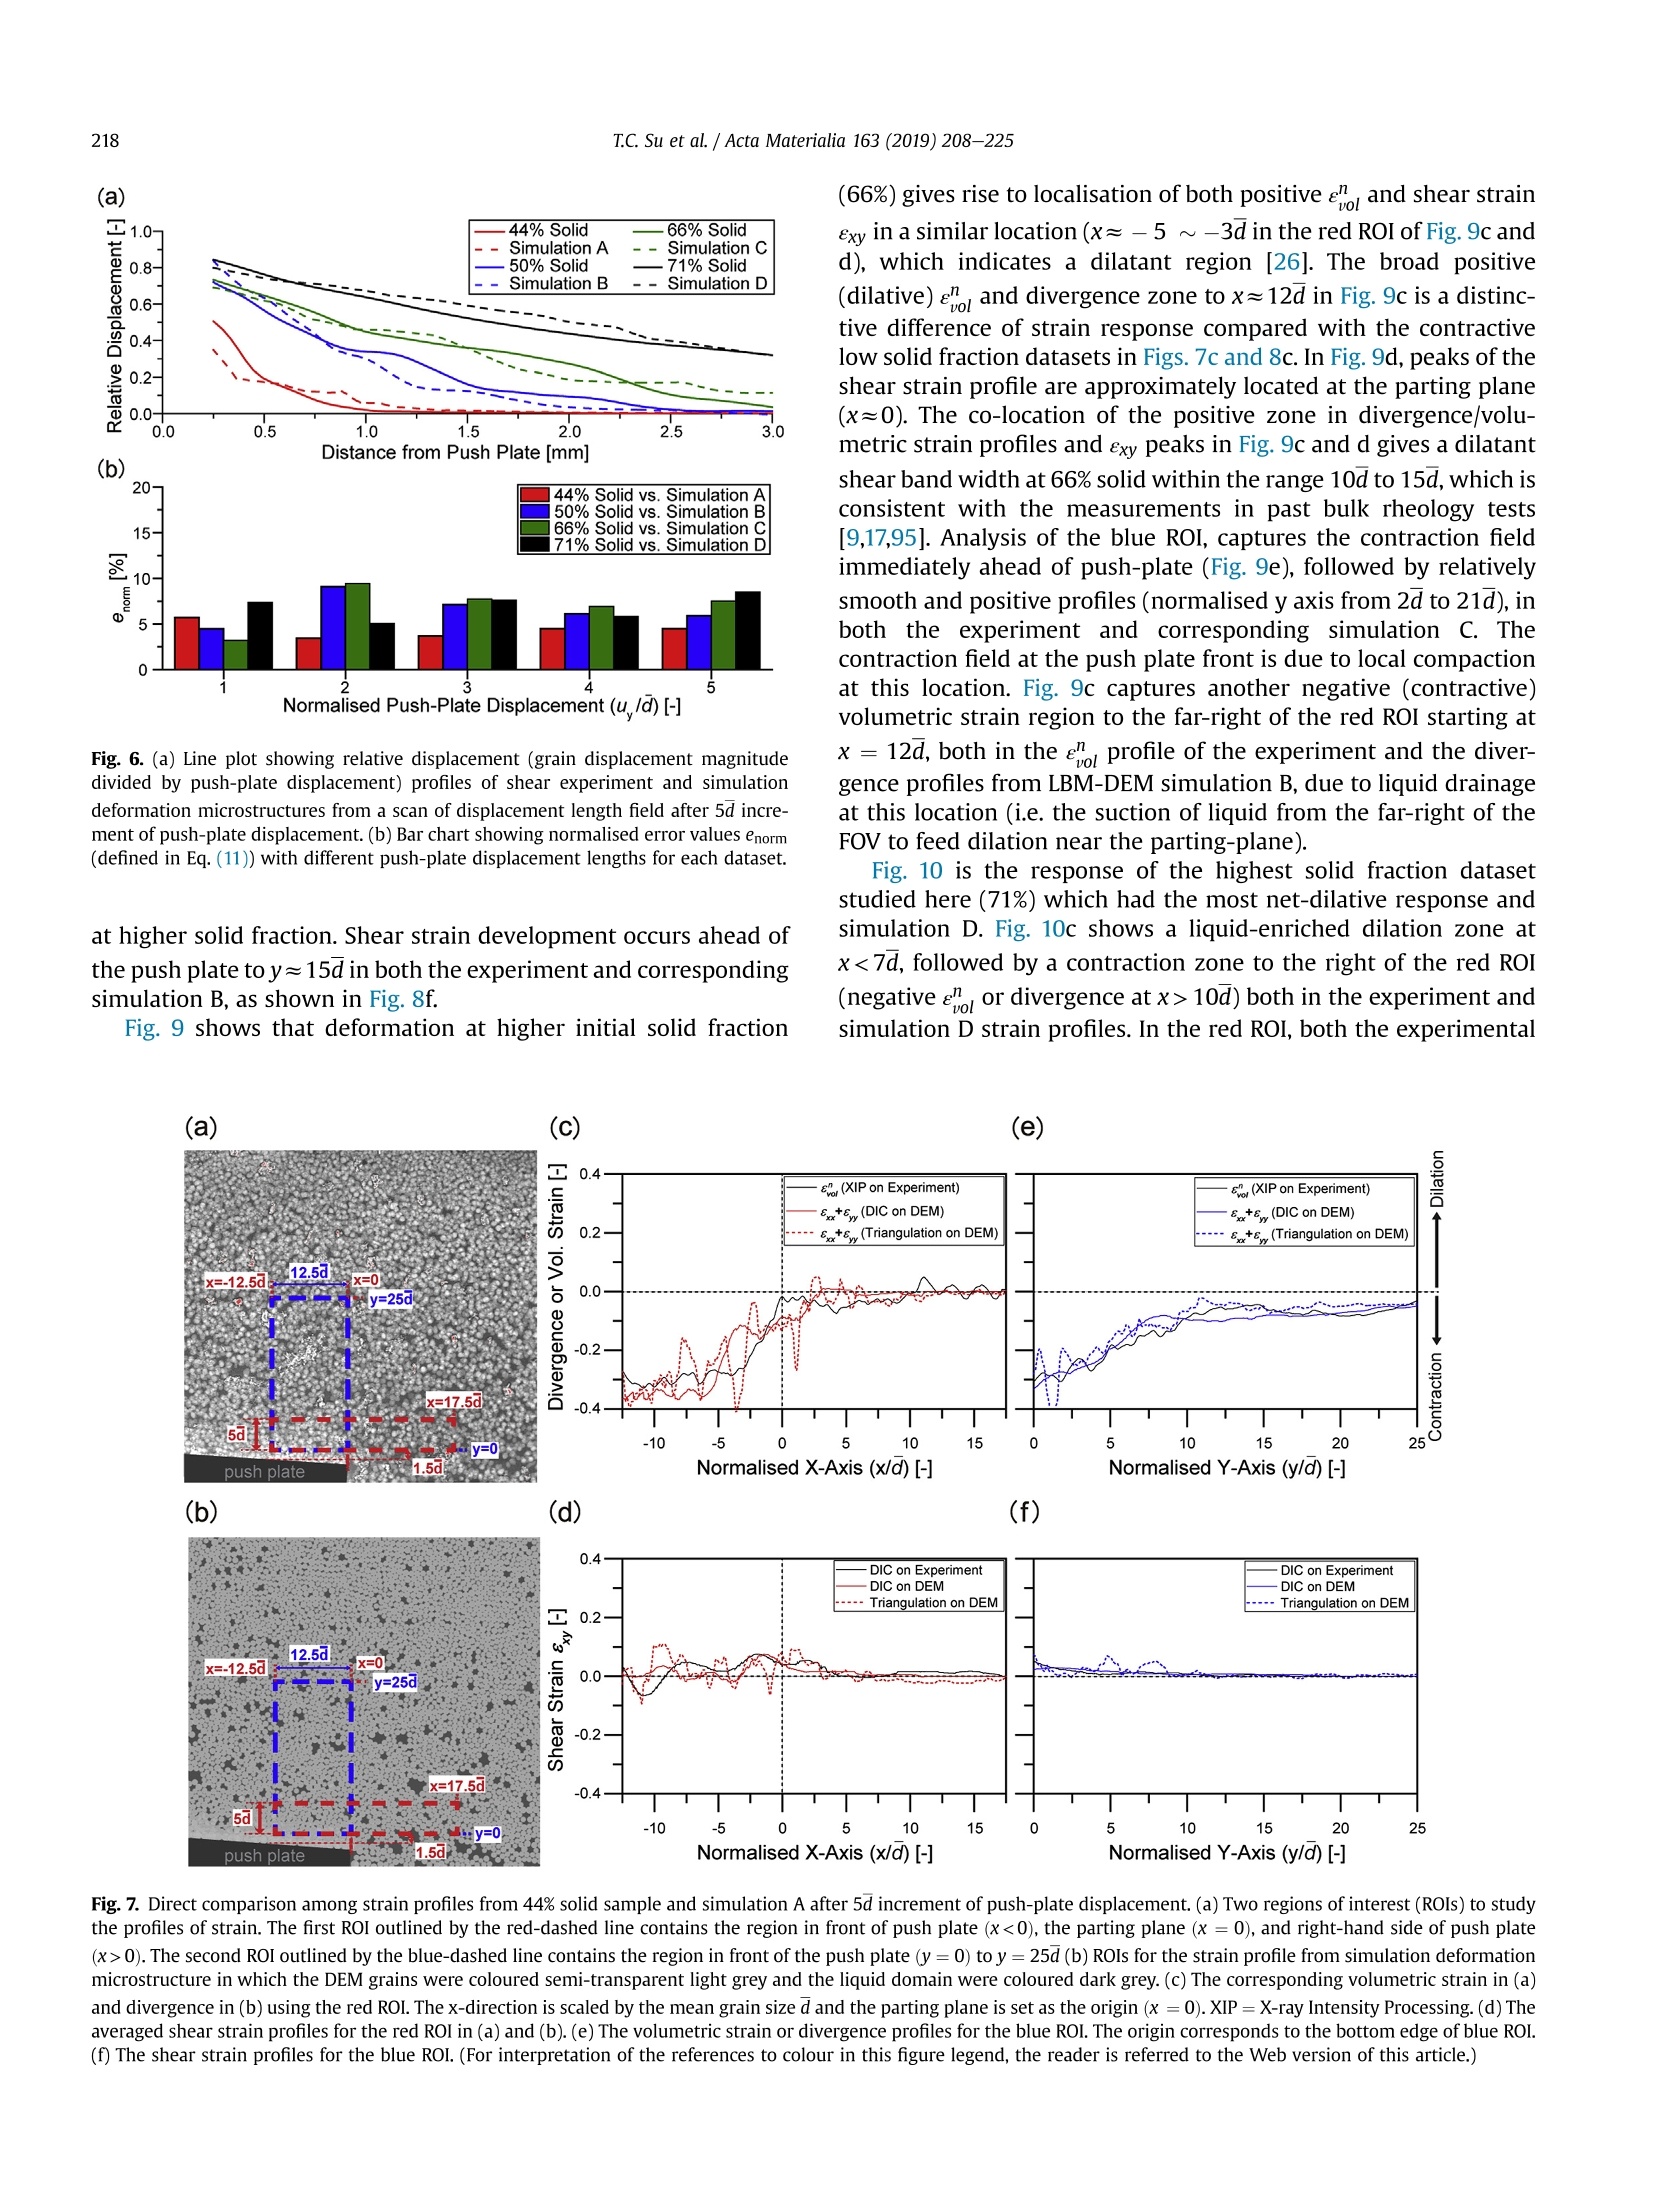
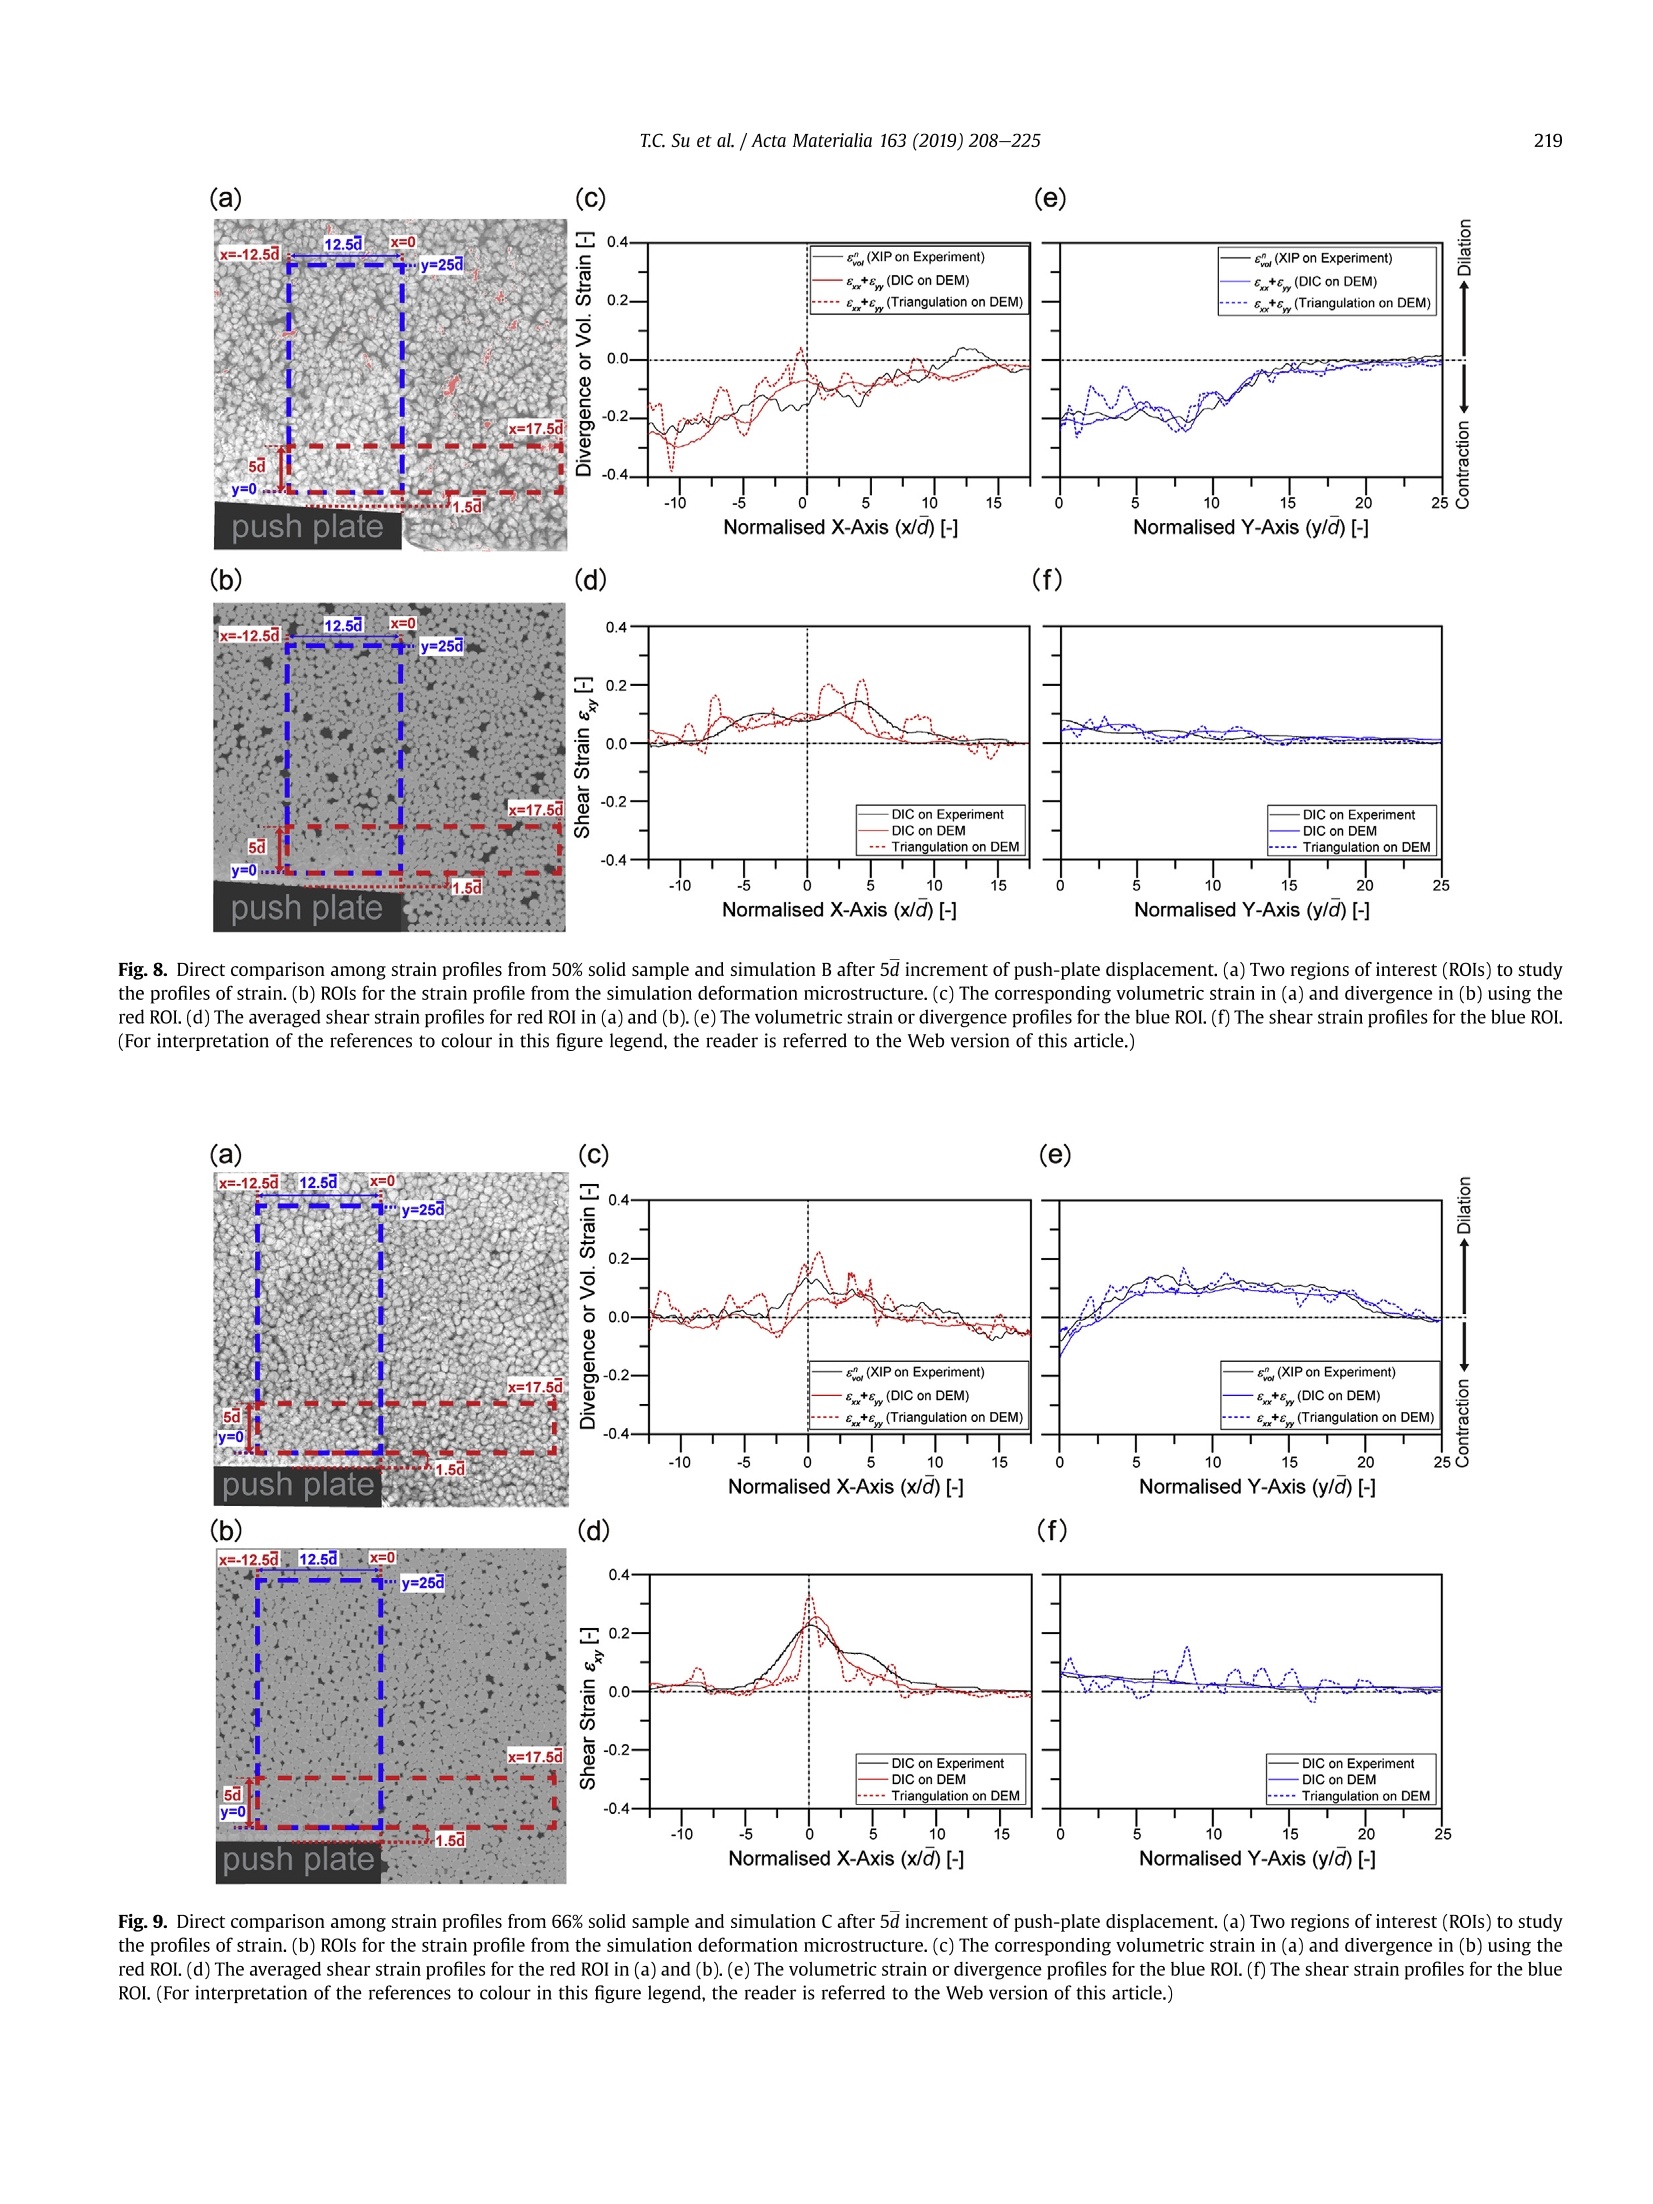
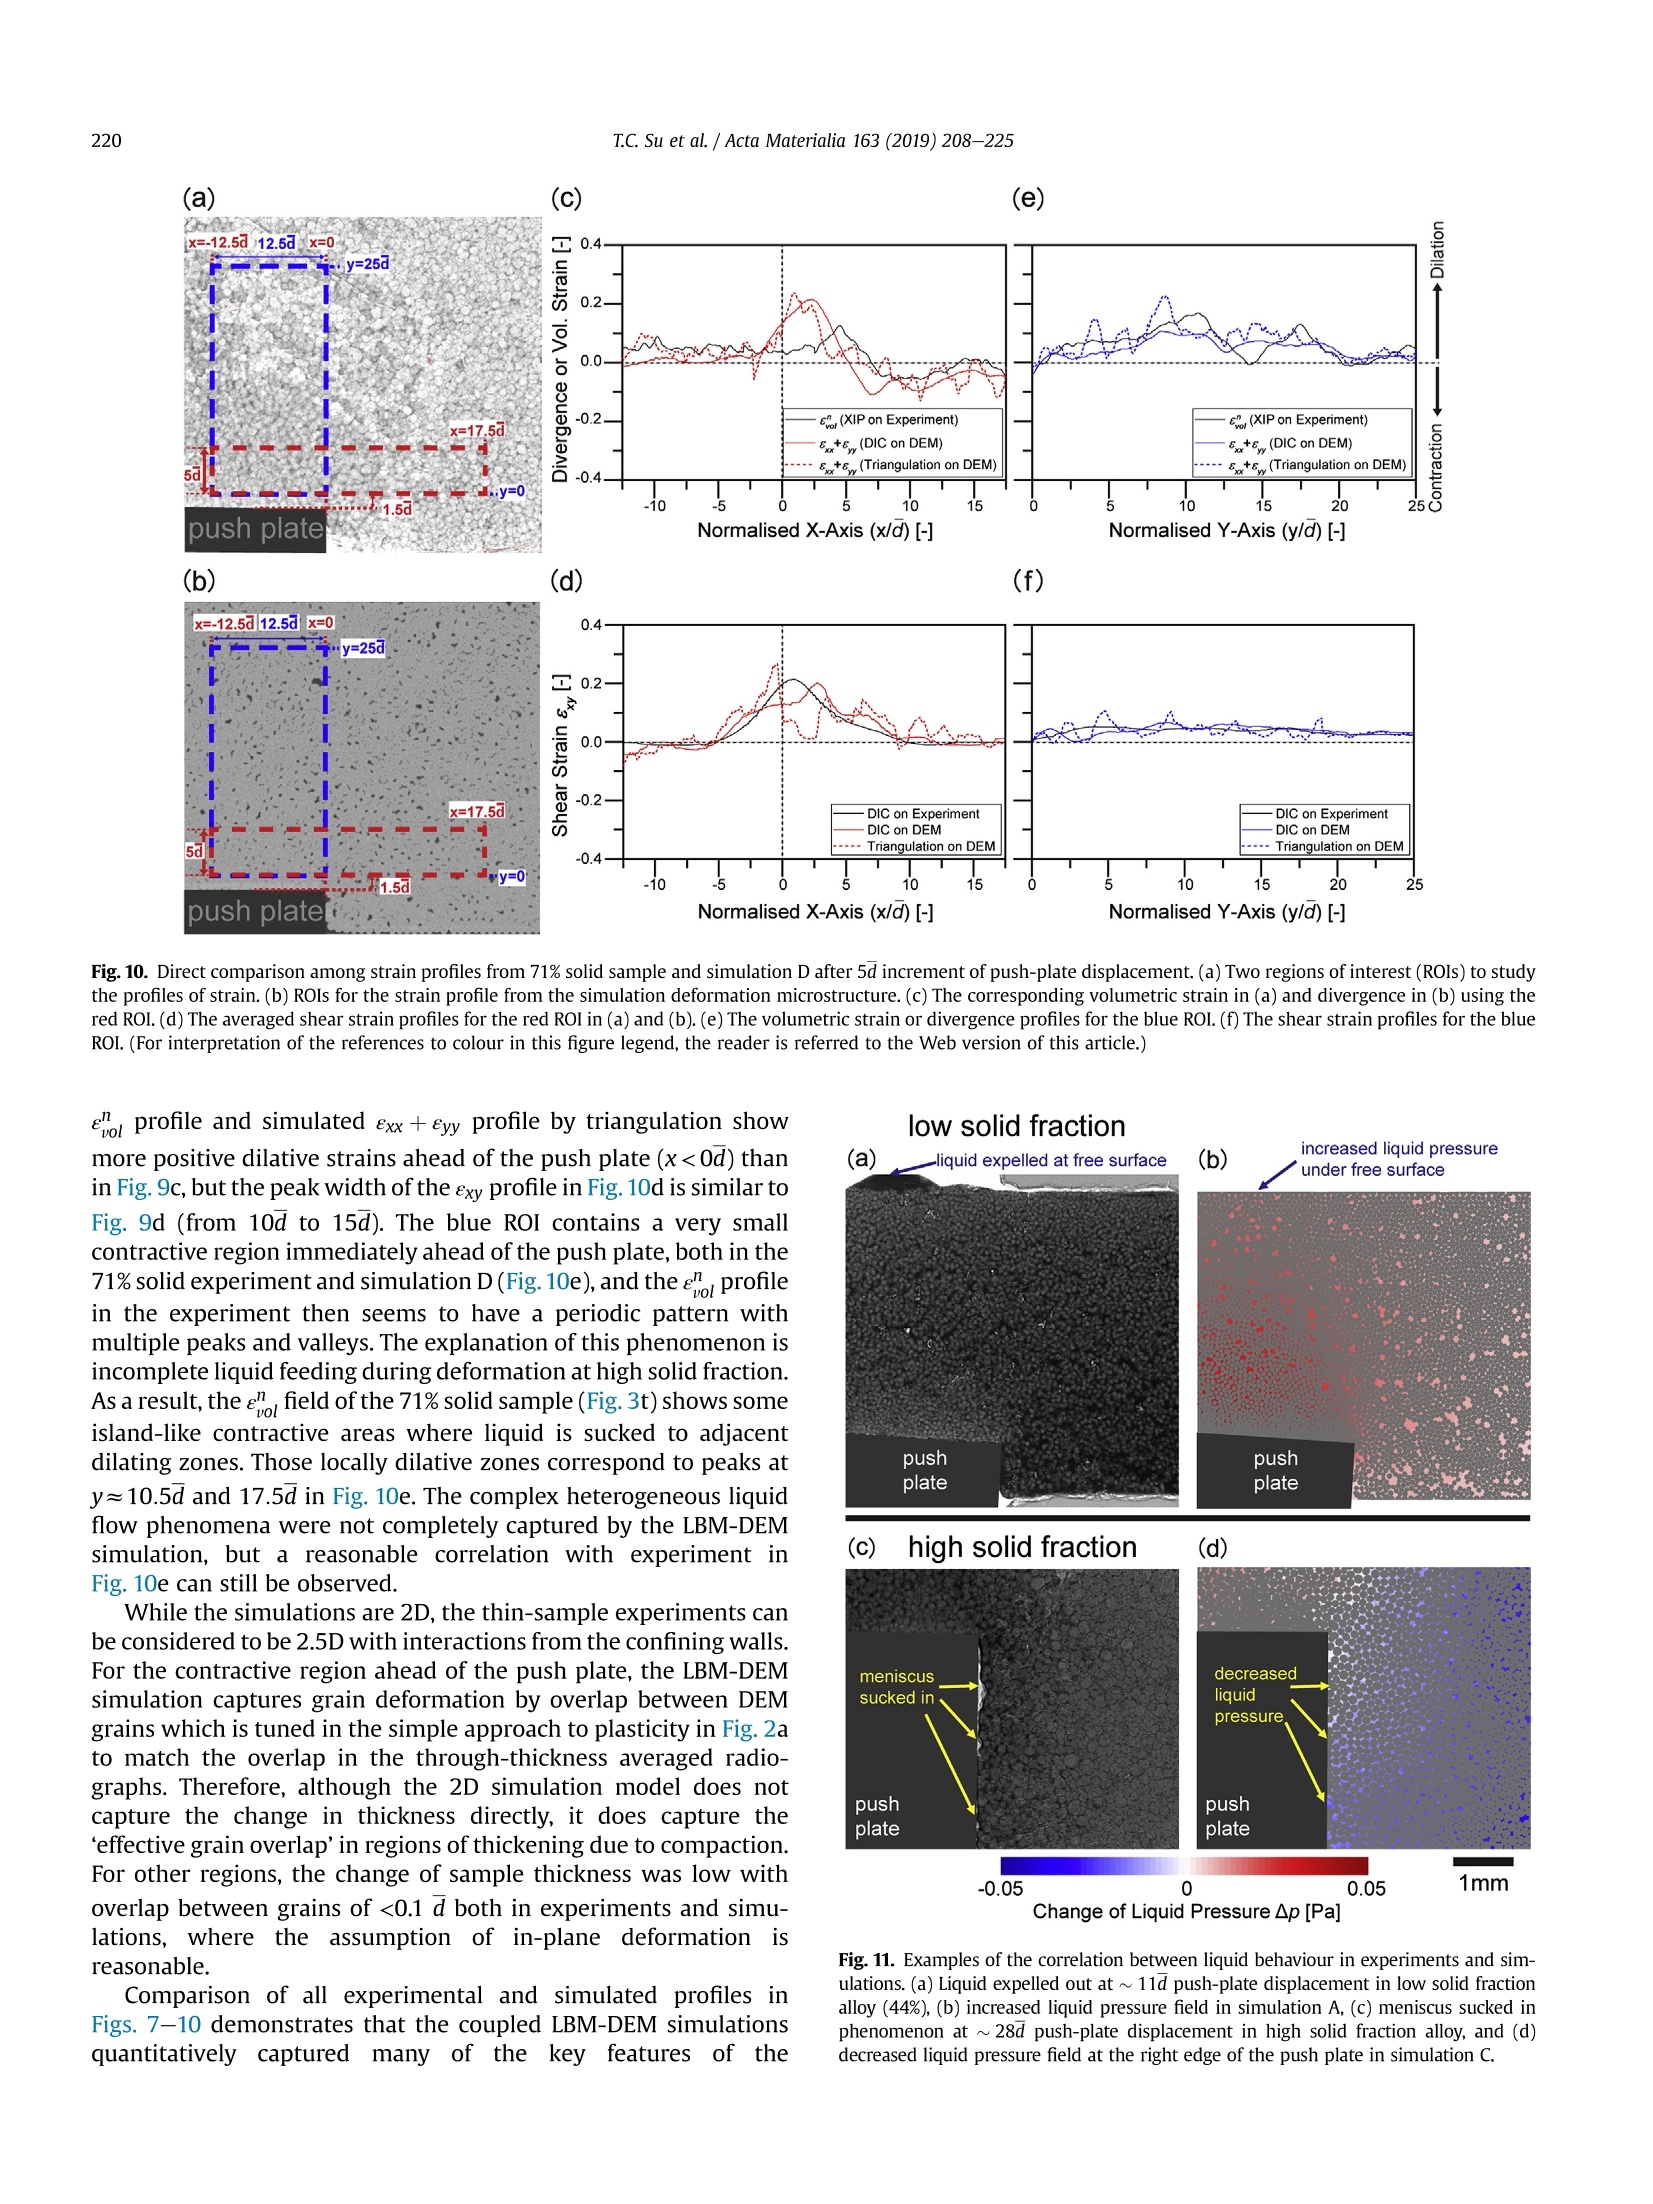
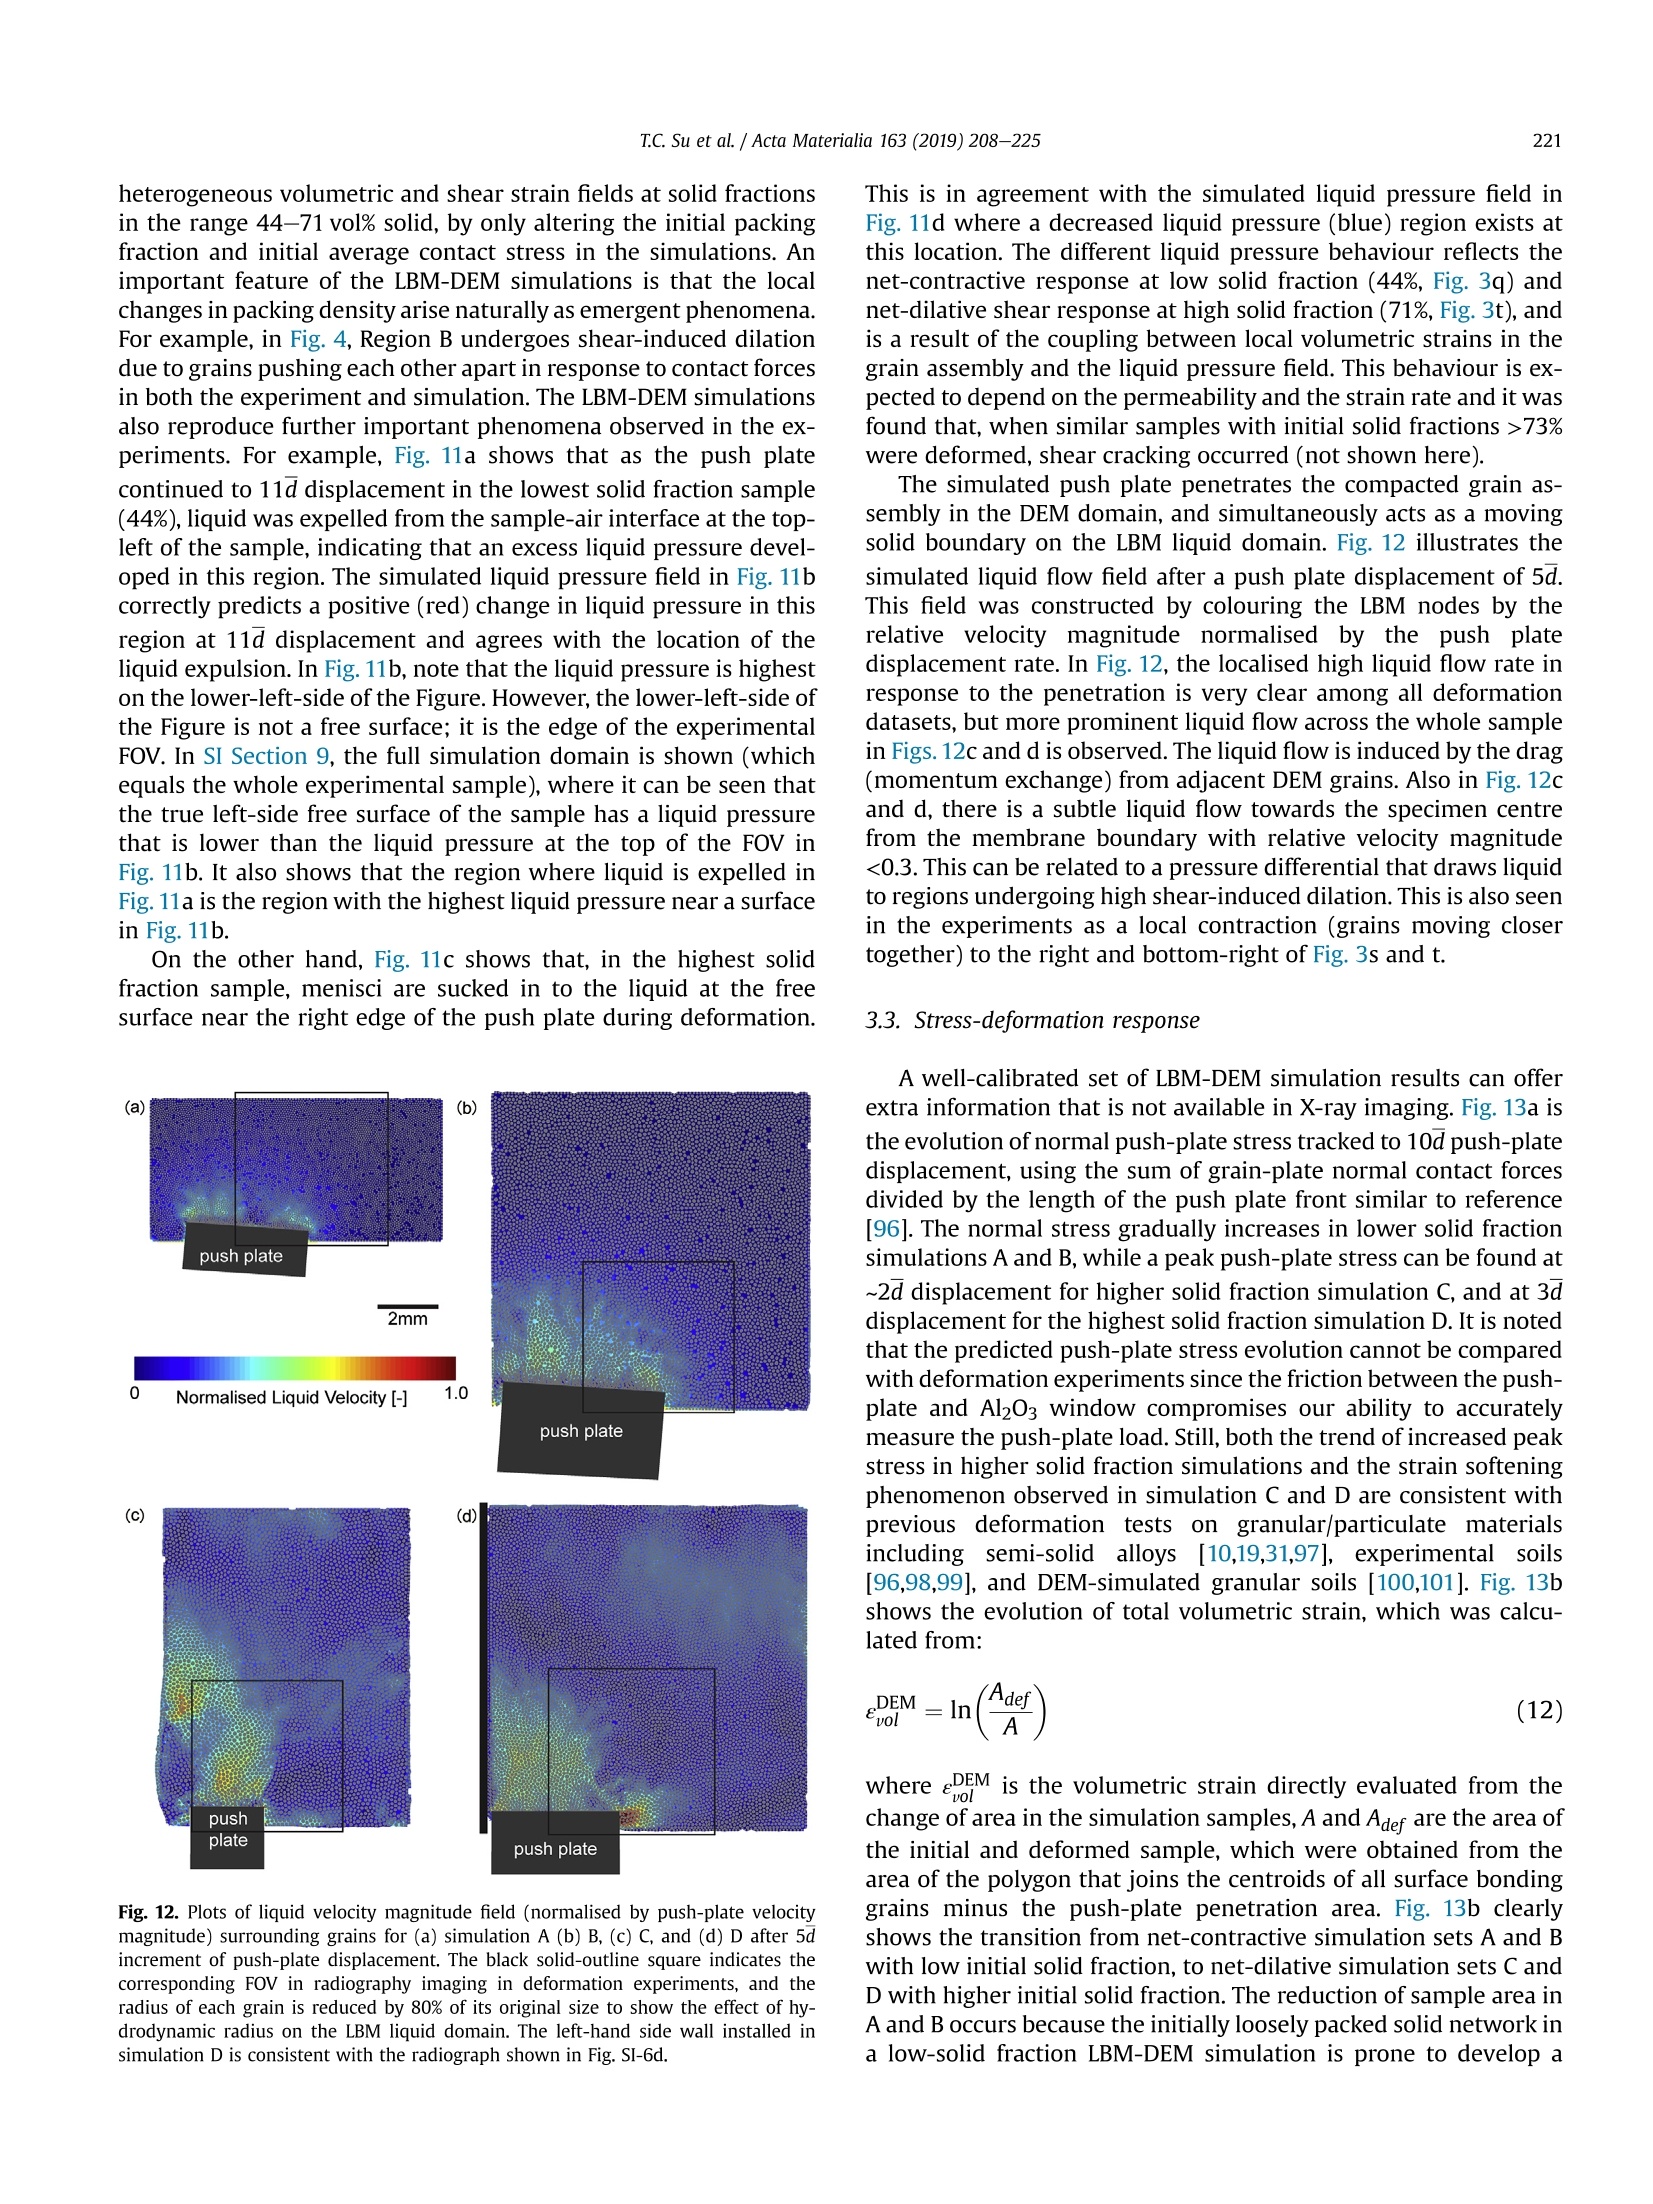
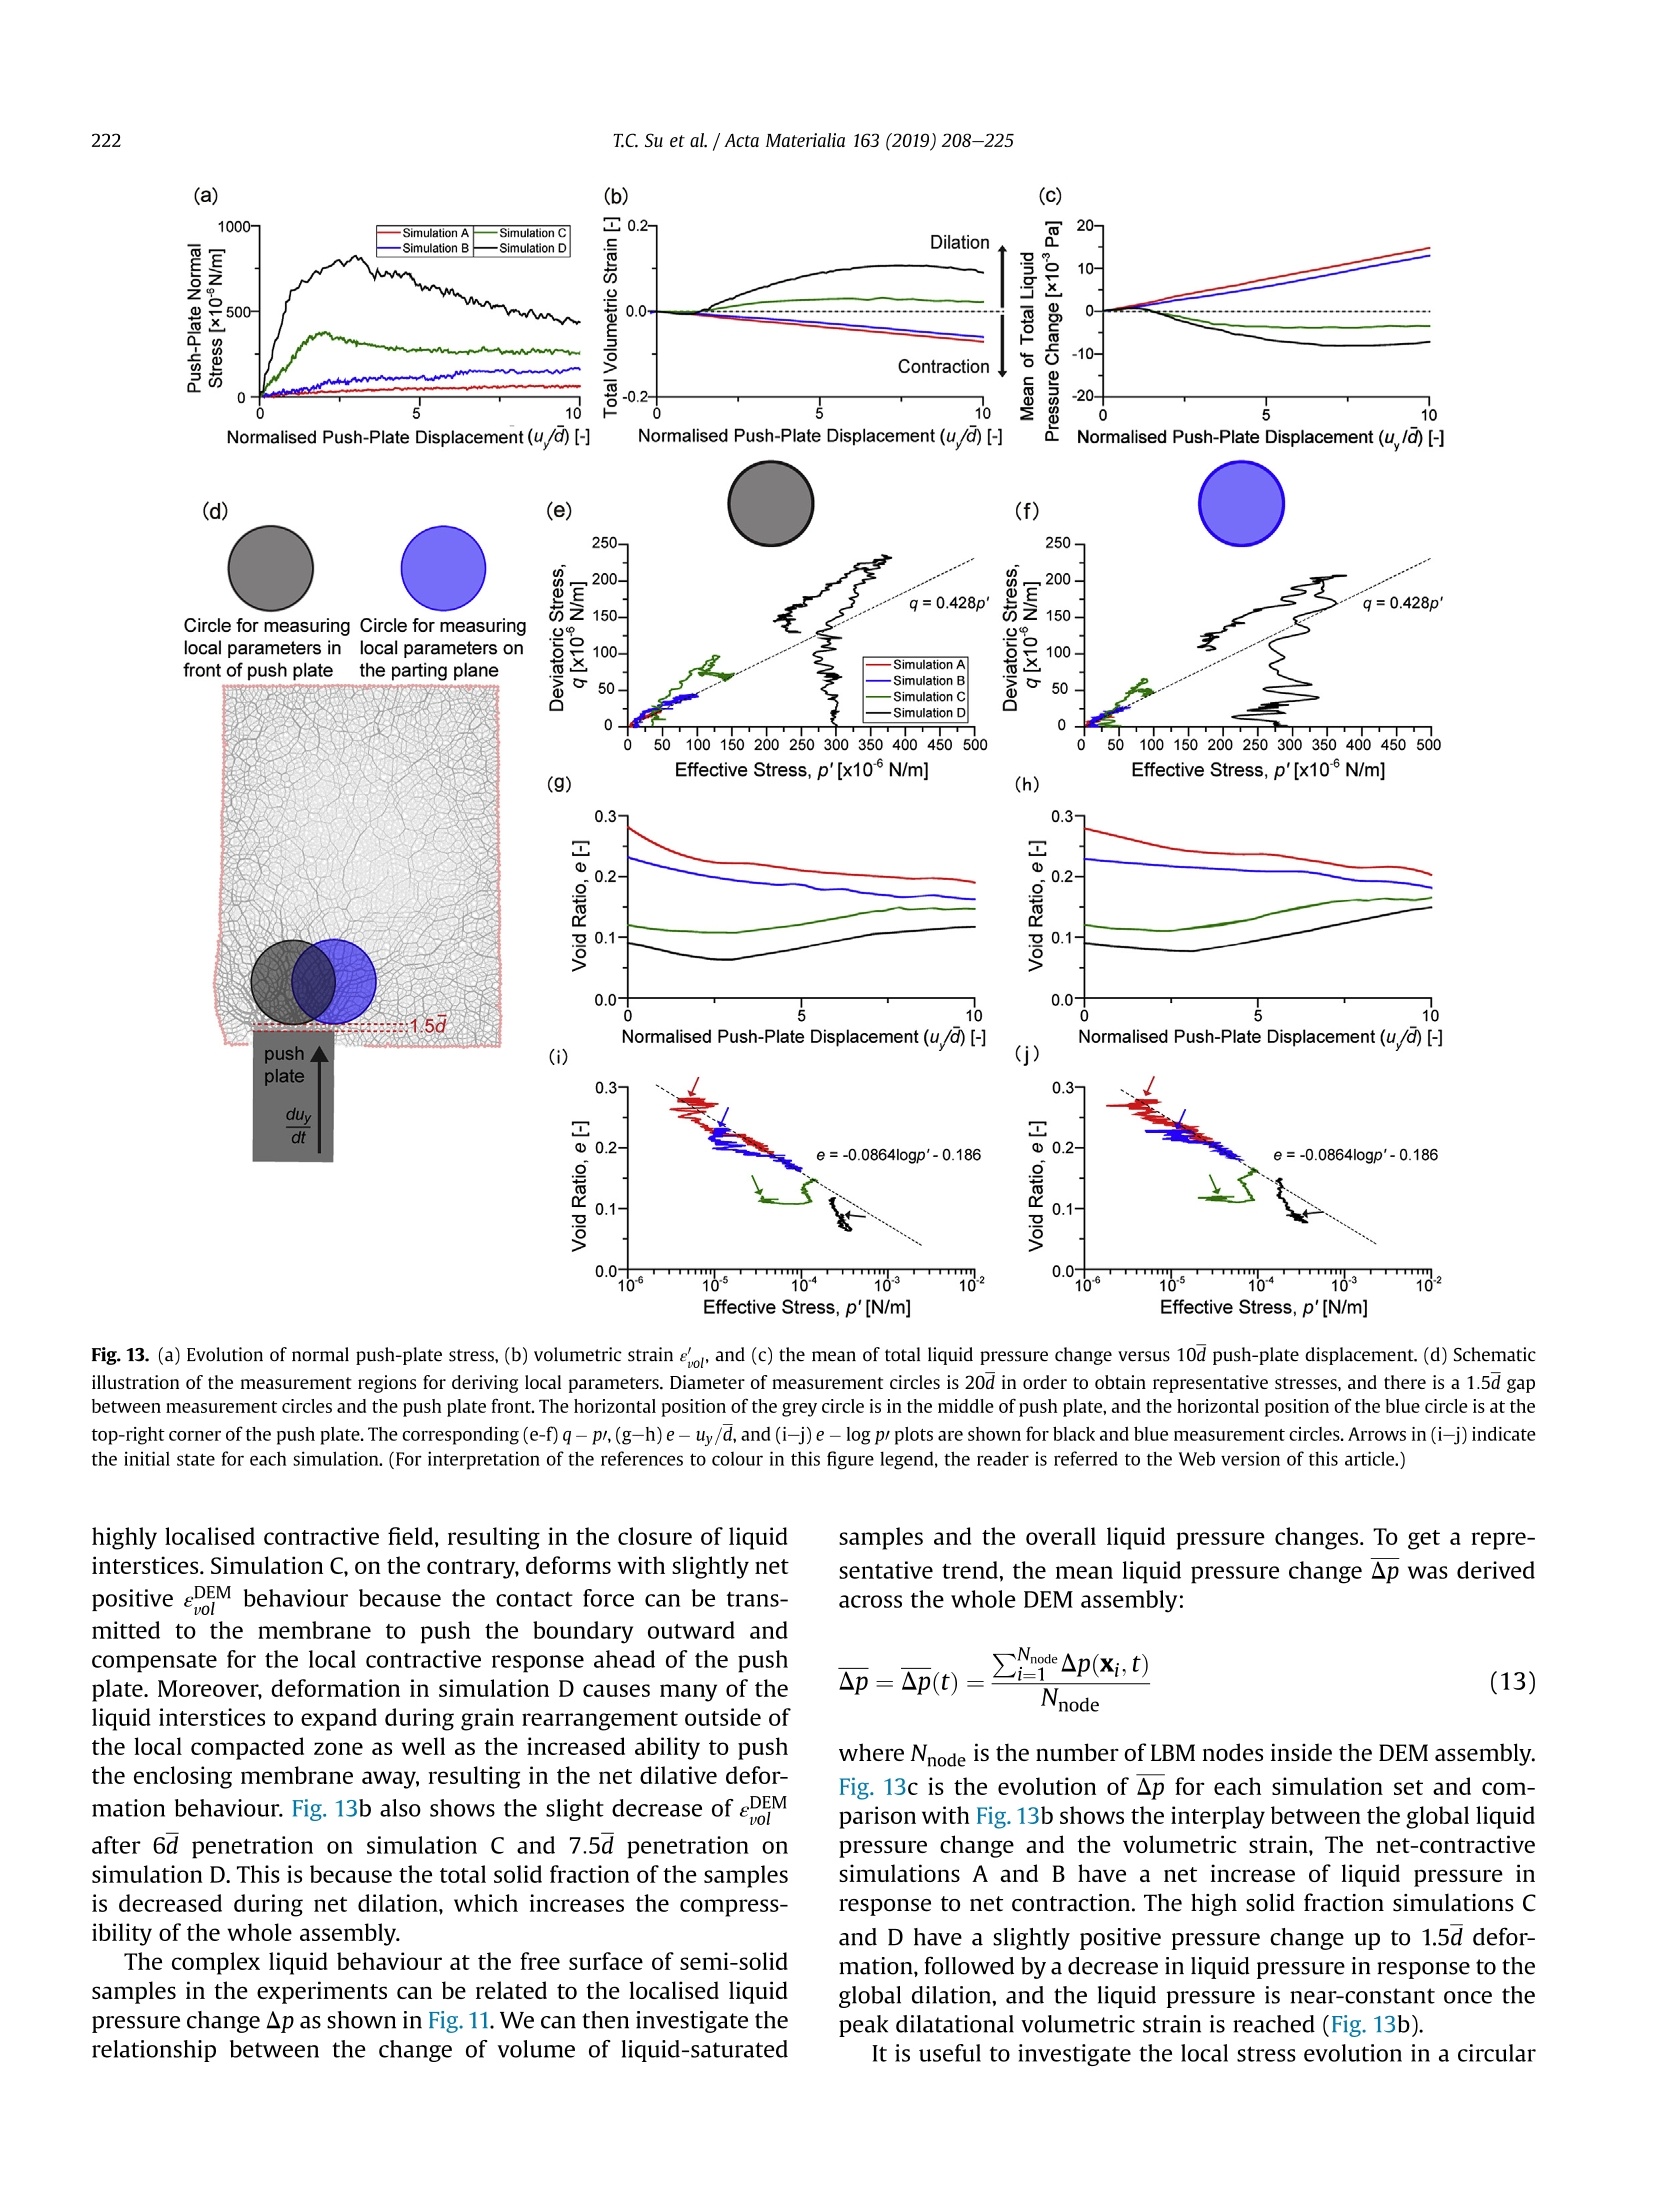
还剩16页未读,是否继续阅读?

产品配置单


北京欧兰科技发展有限公司为您提供《铝铜合金中形变,应变检测方案(其它无损检测仪器/设备)》,该方案主要用于铜中理化分析检测,参考标准--,《铝铜合金中形变,应变检测方案(其它无损检测仪器/设备)》用到的仪器有LaVision StrainMaster材料应变形变成像测量系统、LaVision DaVis 智能成像软件平台
推荐专场
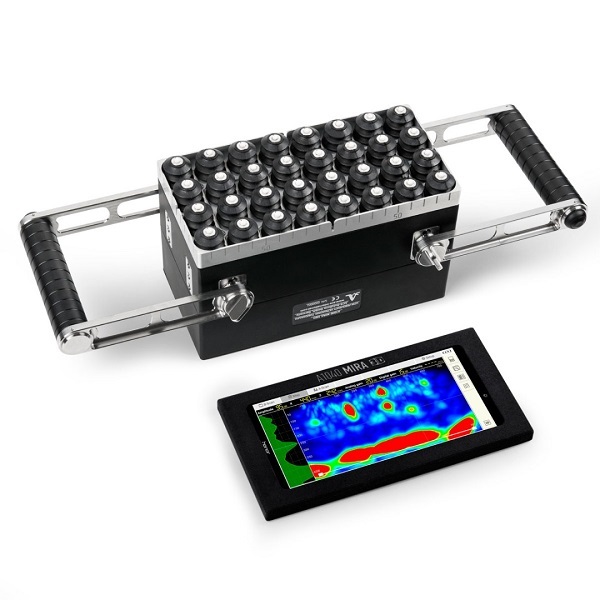
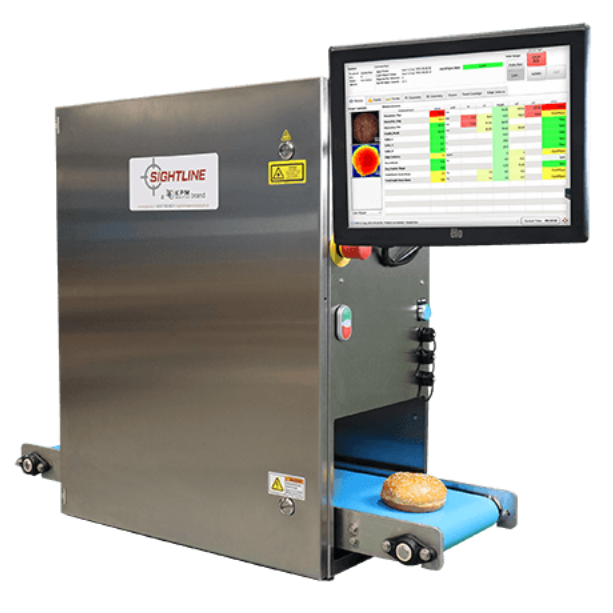


该厂商其他方案
更多