


方案详情
文
采用 Nd:YAG, 532 nm MESA PIV 激光器,SA-Z Photron 20KHz高速相机,LaVision的DaVis8.4软件系统以及功能特别强大的可编程时间控制单元。尤其是其可针对不同被测速度,改变双帧时间间隔的测量模式,有效第测量了定容燃烧中的流场。
方案详情

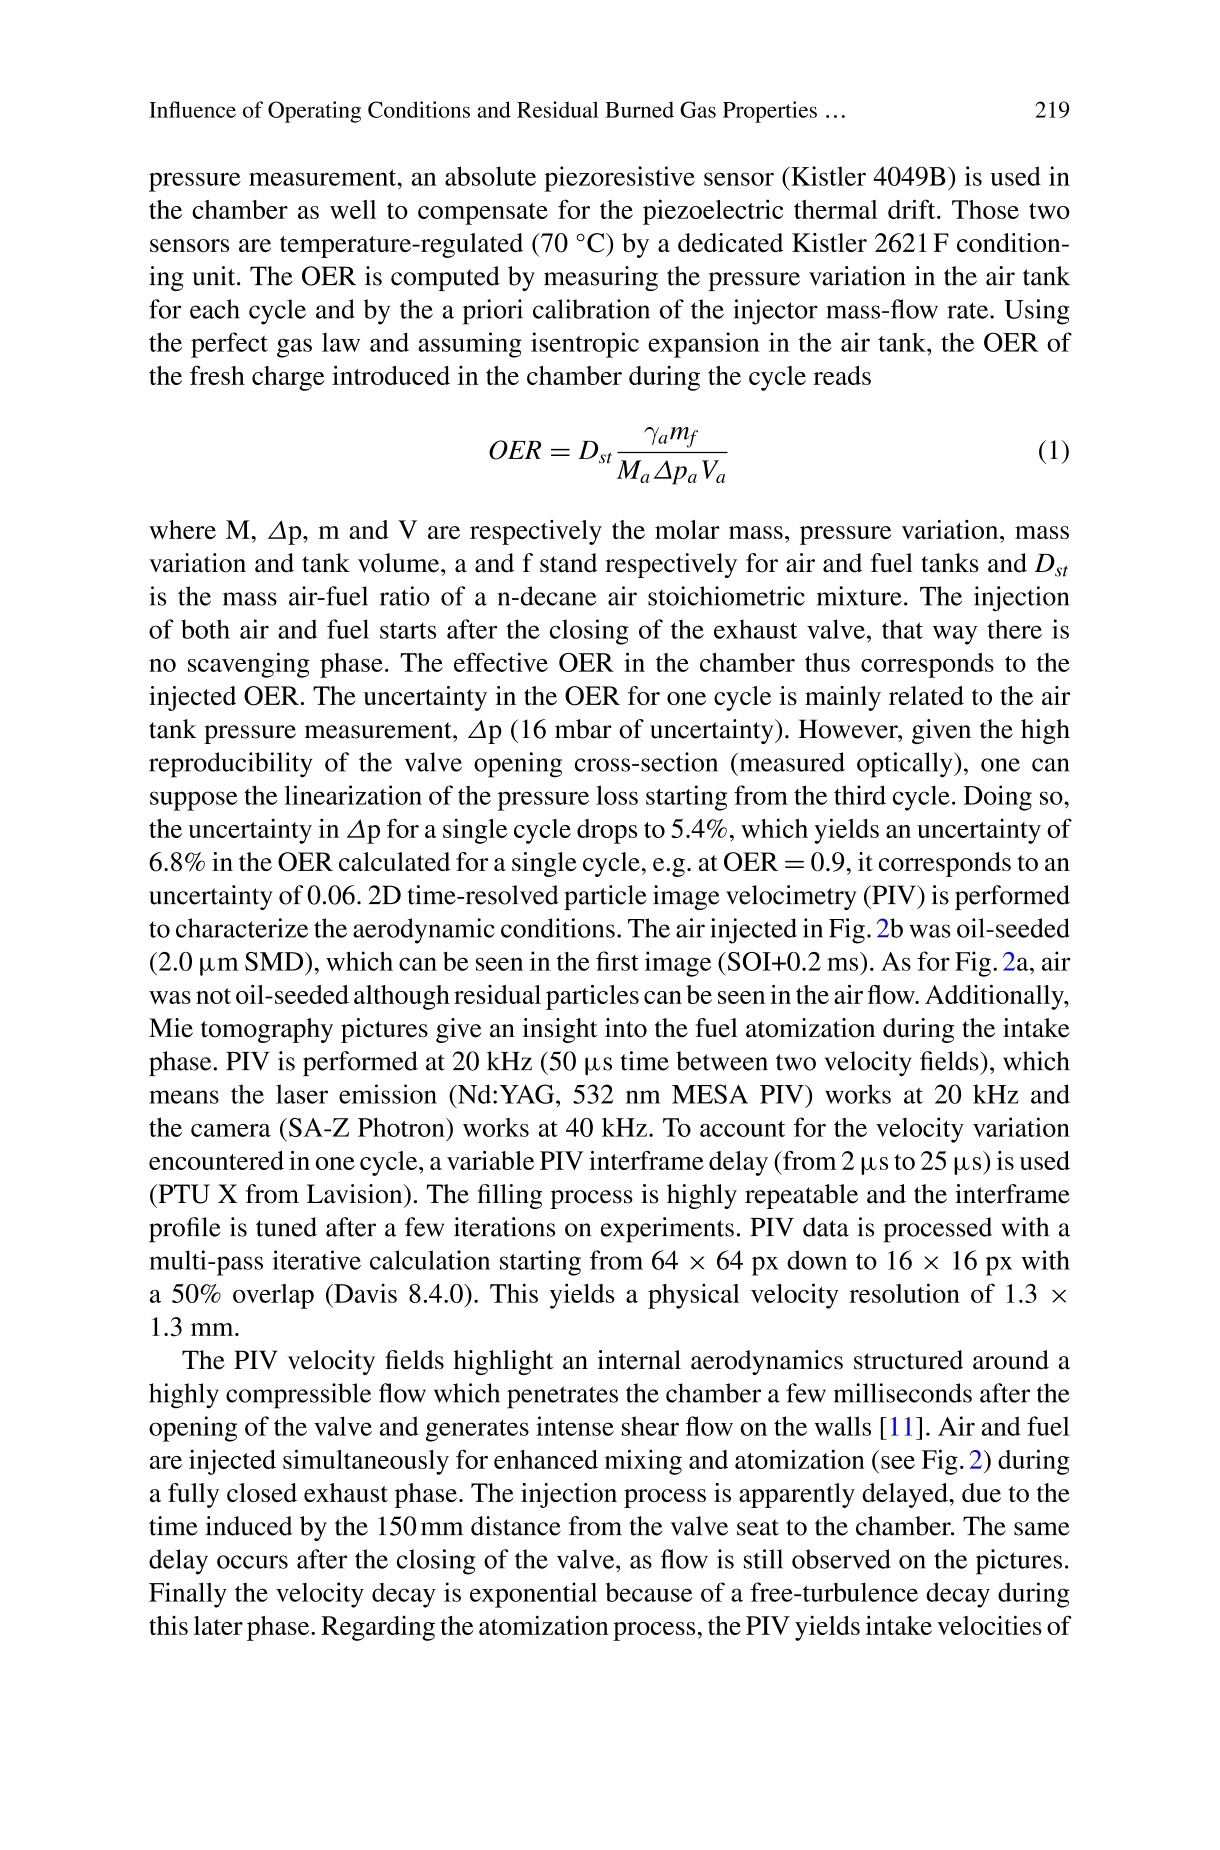
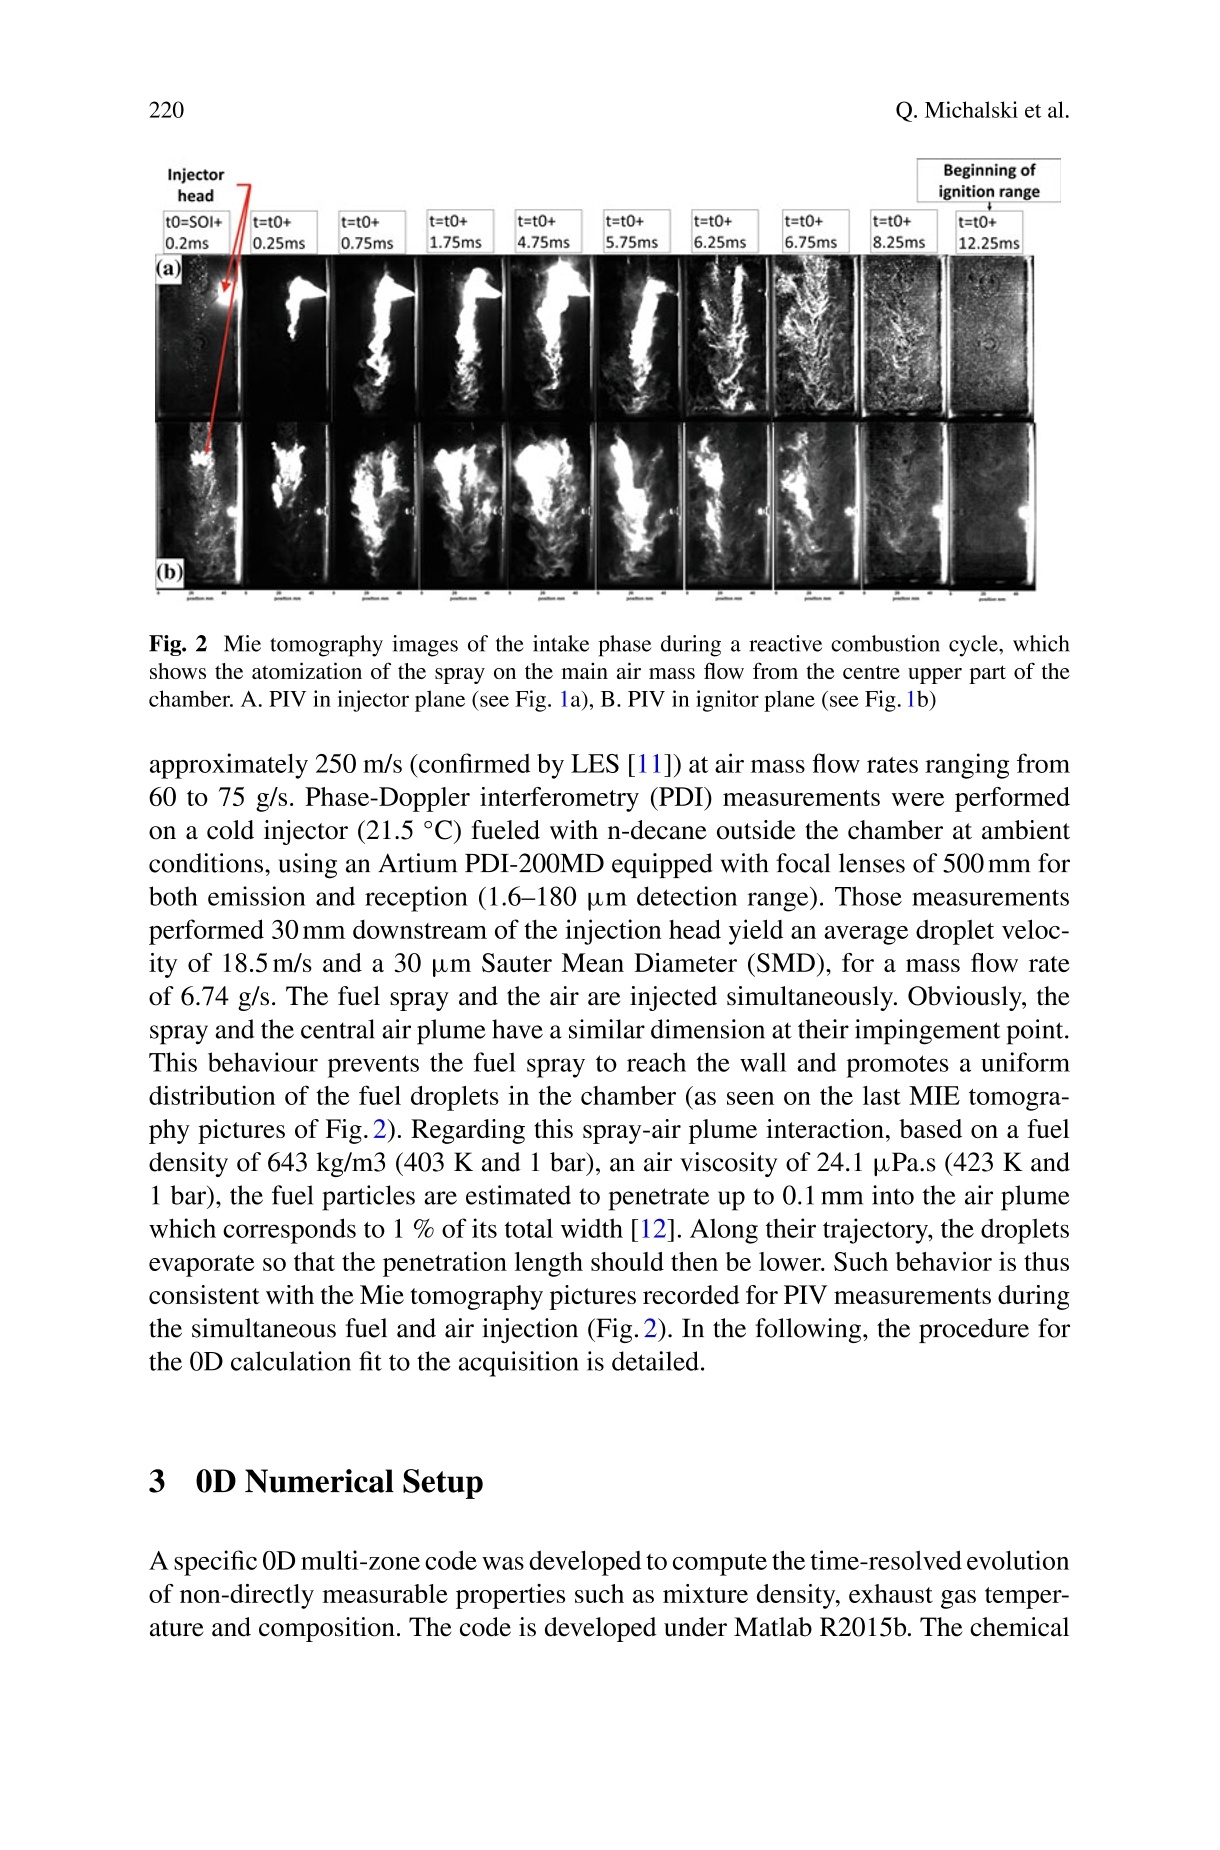
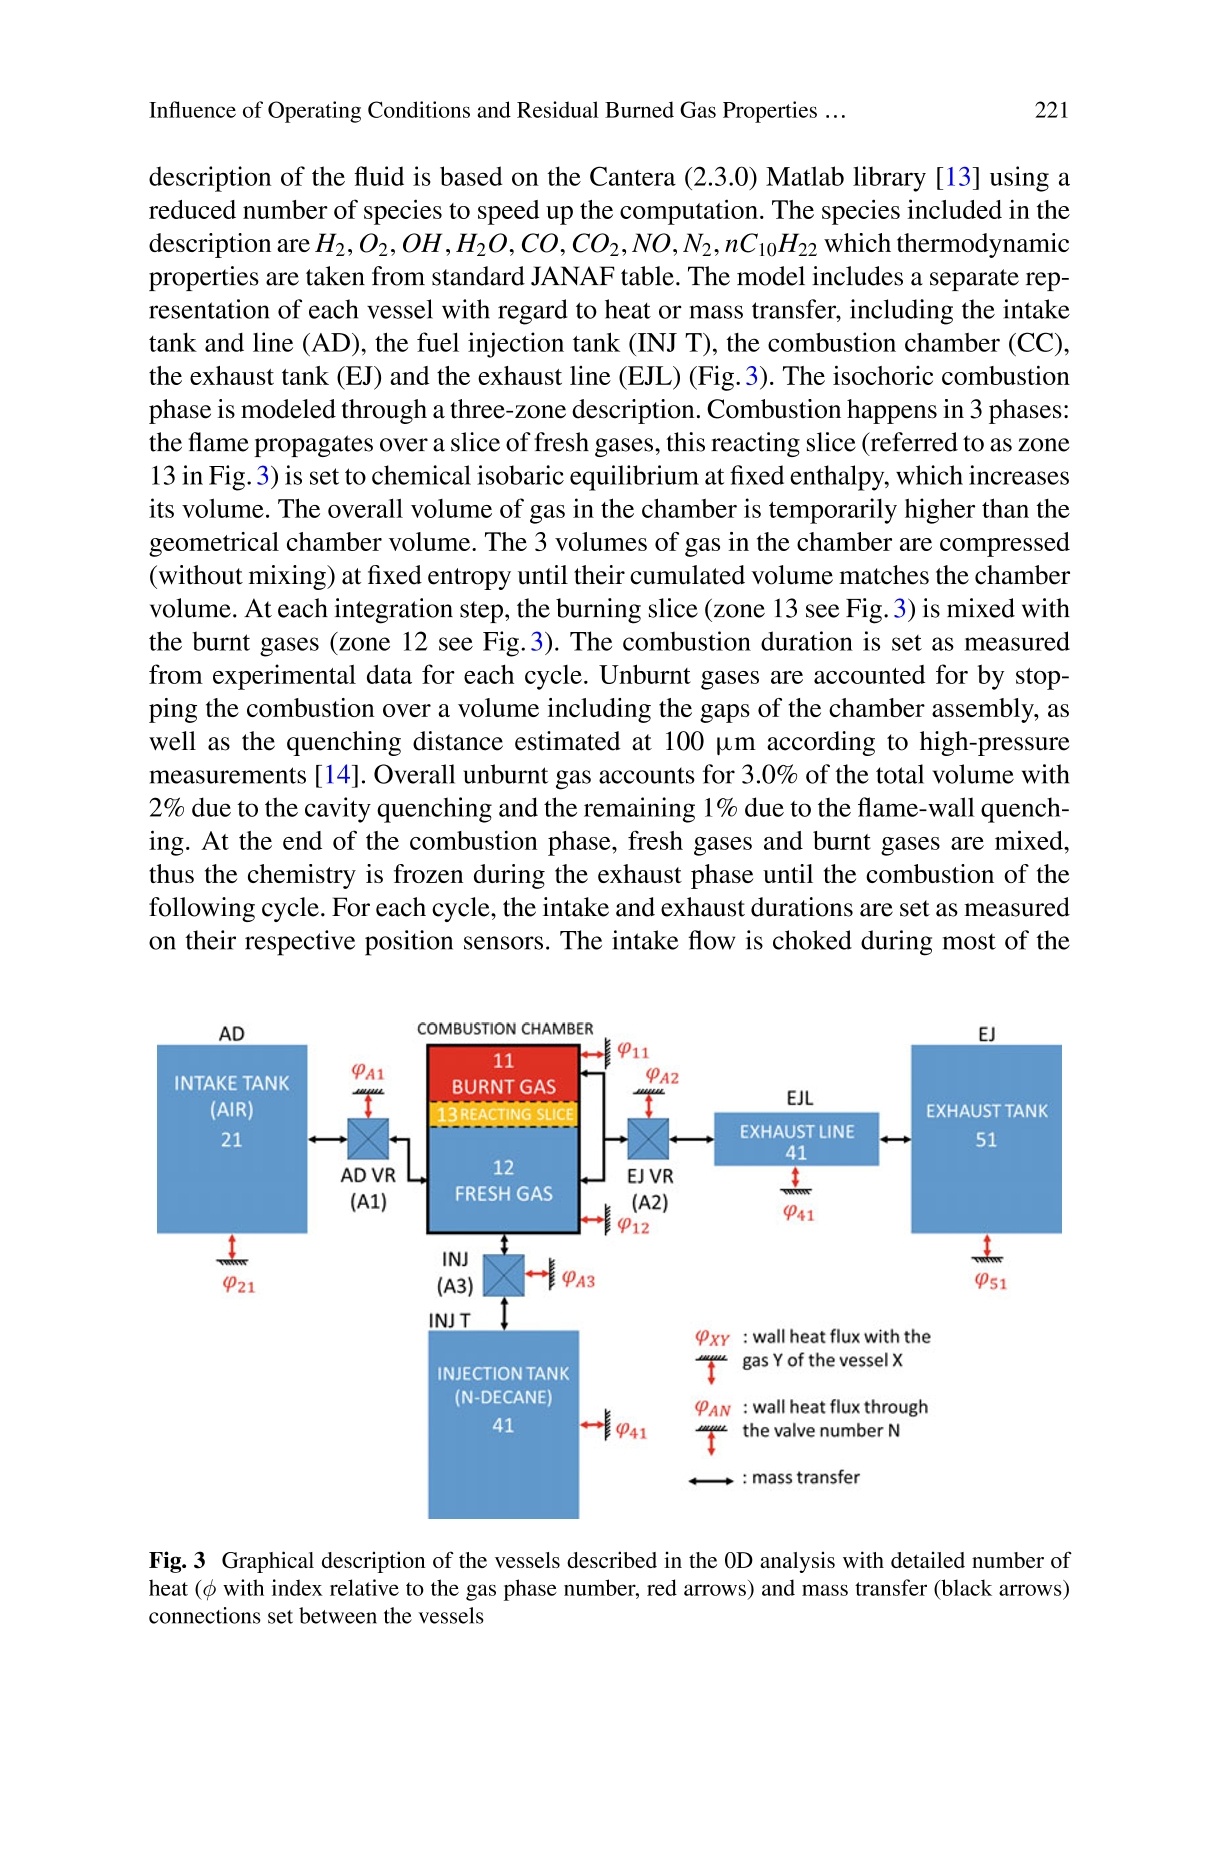
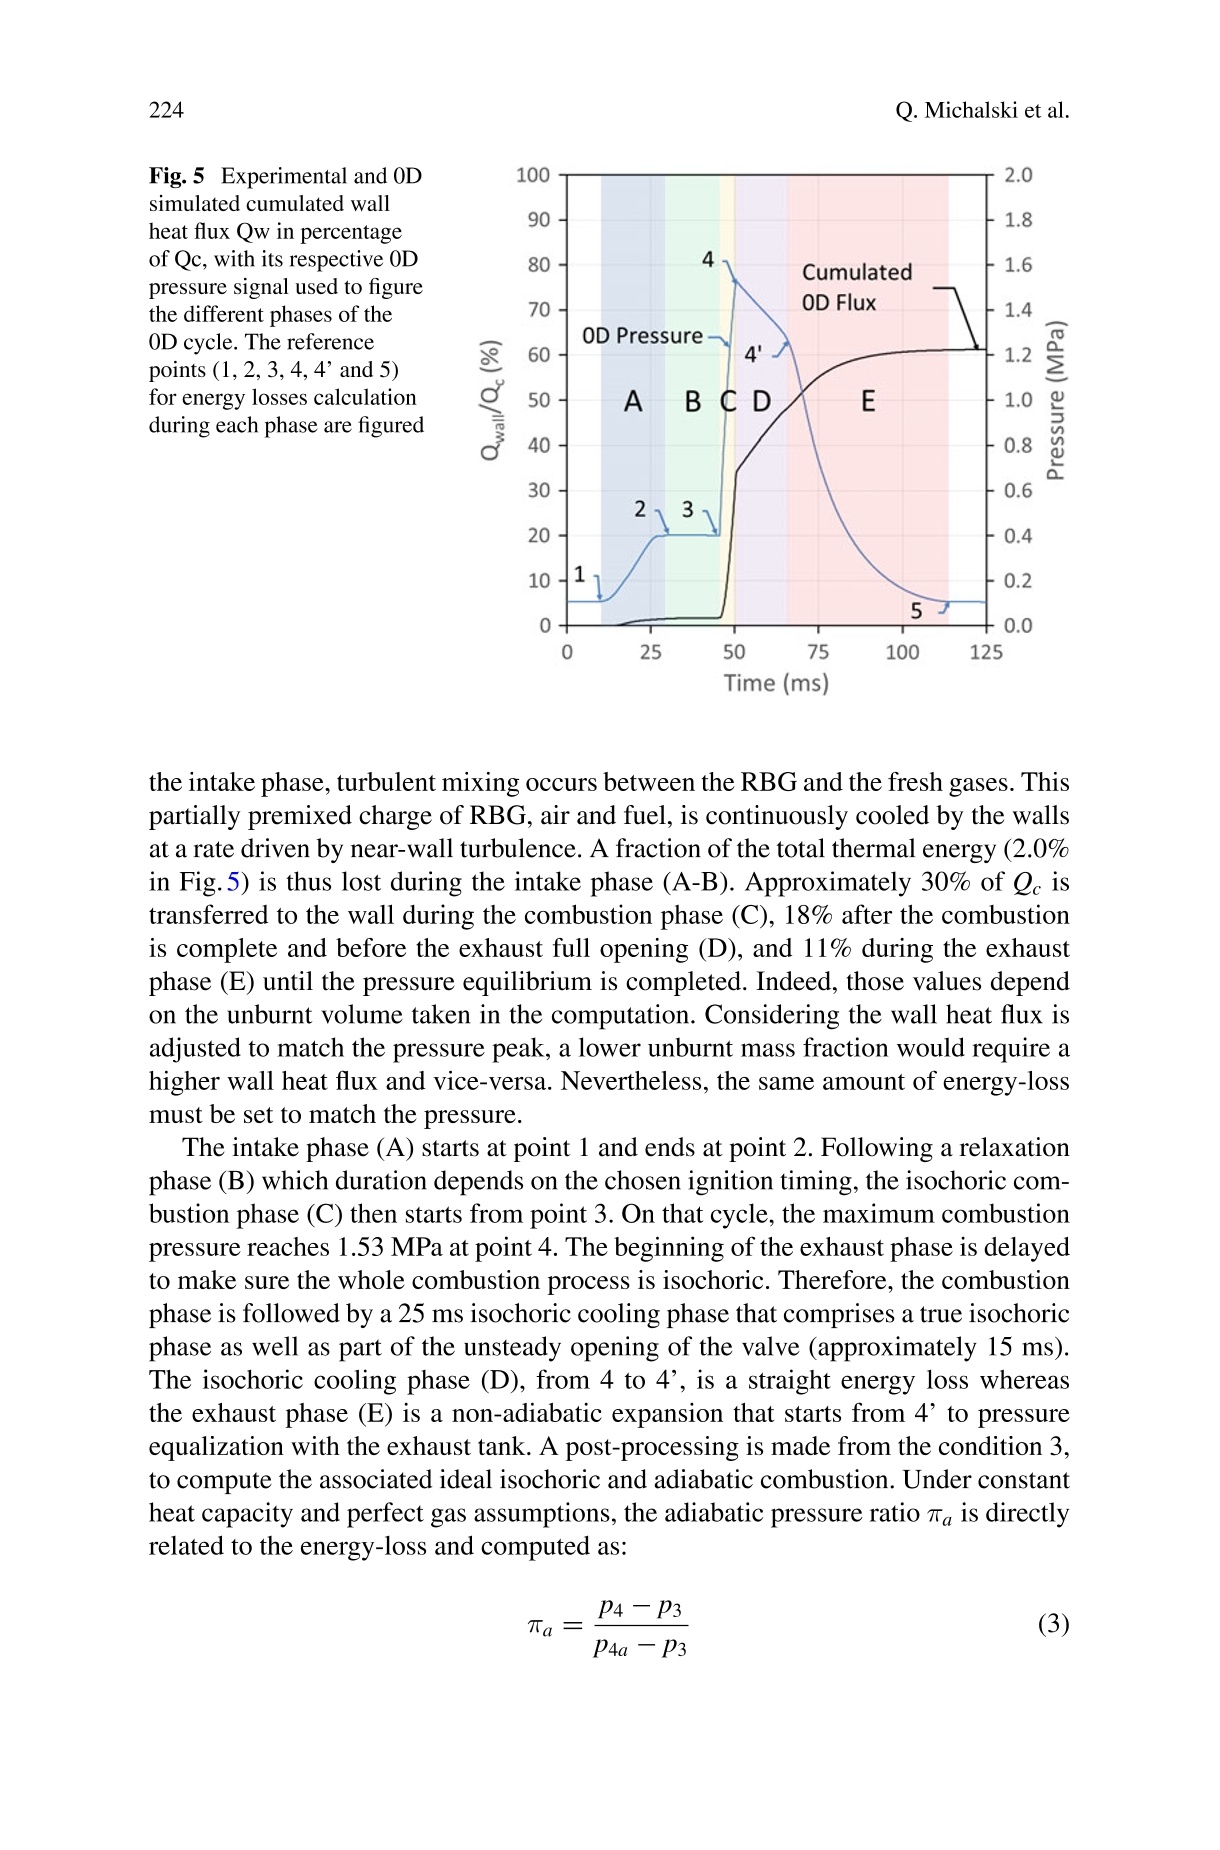
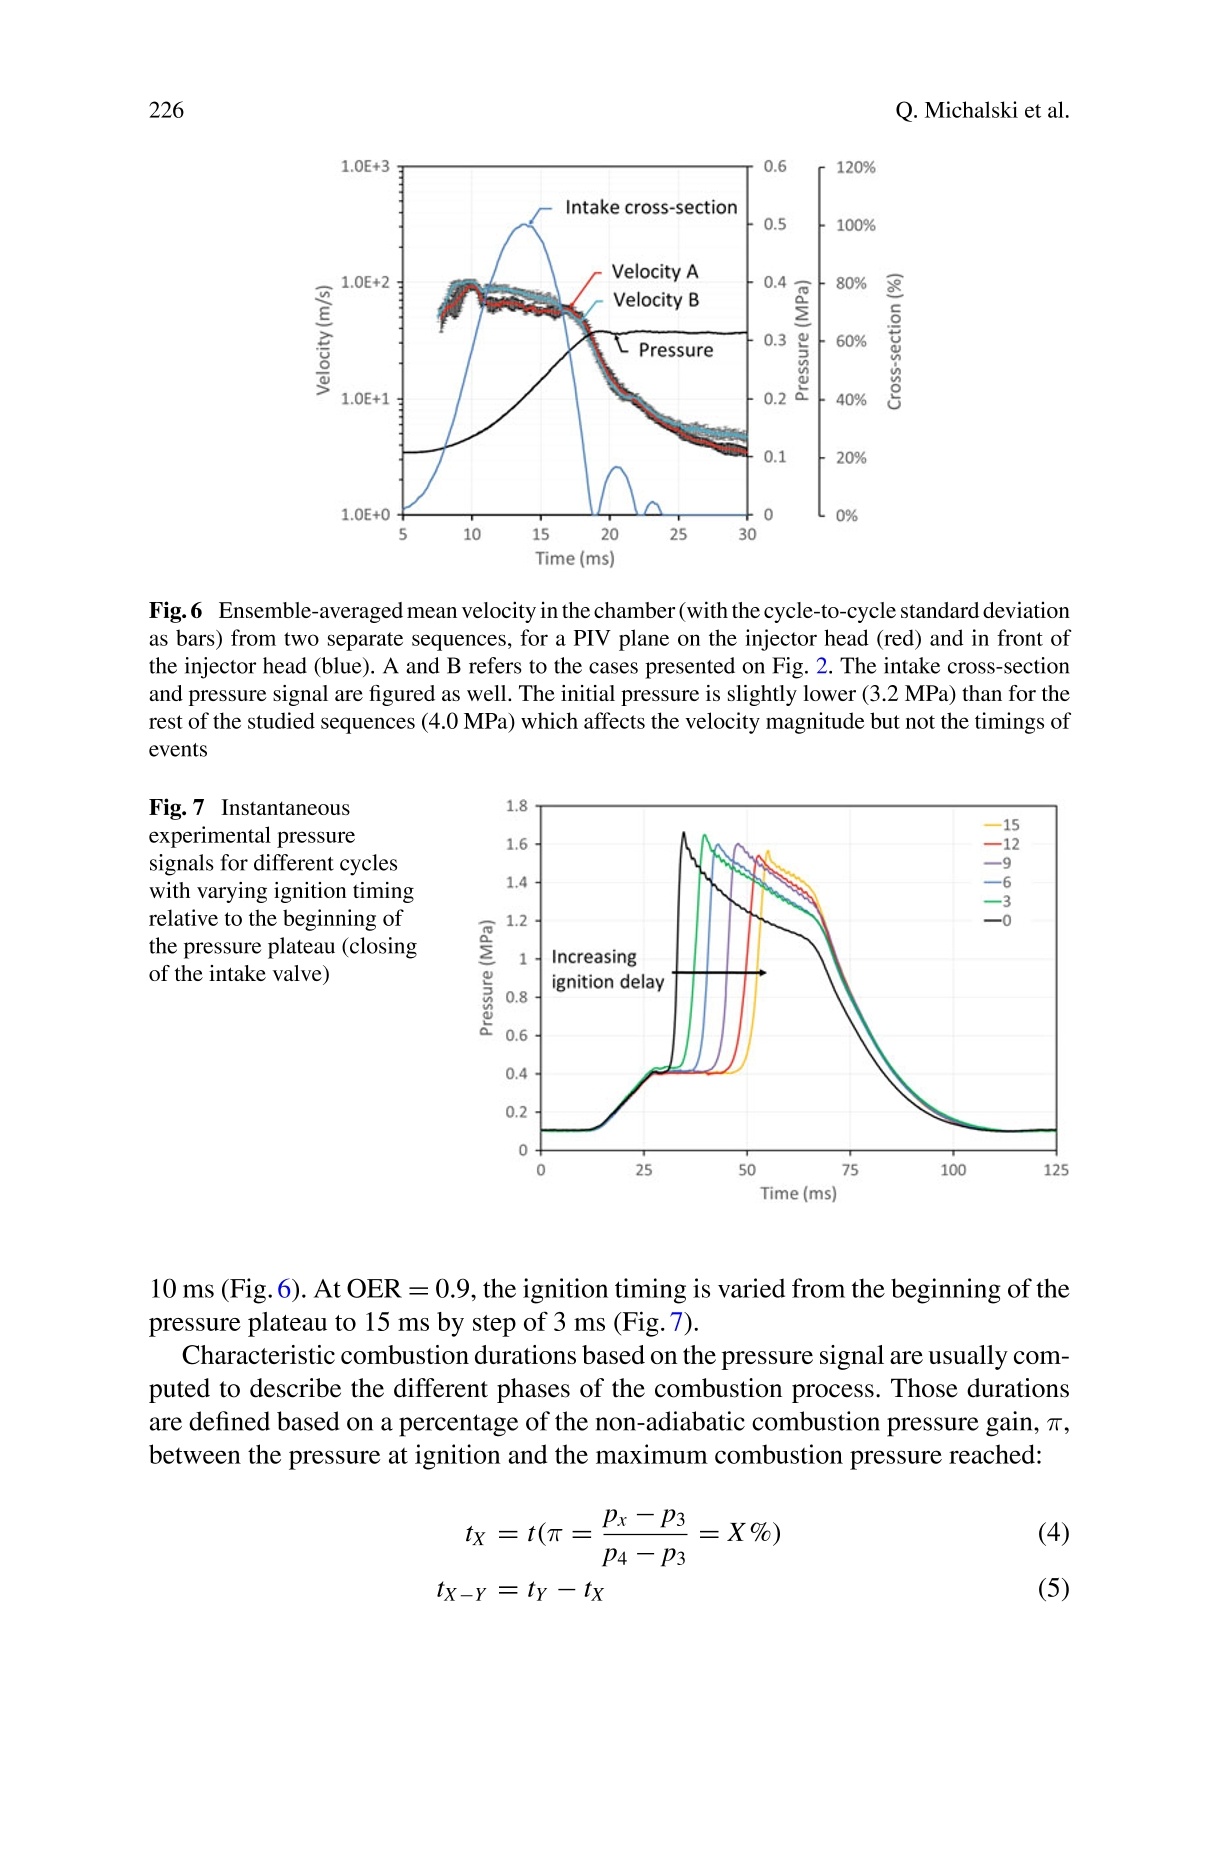
Q. Michalski et al.216 Influence of Operating Conditions and Residual Burned Gas Properties ...217 M. Bellenouee-mail: marc.bellenoue@ensma.frO Springer Nature Switzerland AG 2019Notes on Numerical Fluid Mechanics and Multidisciplinary Design 141,https://doi.org/10.1007/978-3-319-98177-2_14 Influence of Operating Conditionsand Residual Burned Gas Propertieson Cyclic Operation of Constant-VolumeCombustion Quentin Michalski, Bastien Boust and Marc Bellenoue Abstract The pressure-gain combustion concept is a solution envisioned to increasethe thermodynamic efficiency of gas turbines. This article addresses the behaviourof piston-less constant-volume combustion in relevant conditions of engine applica-tion. For this purpose, a lab-scale combustion vessel(0.3 L) is run in cyclic operation(10 Hz) with an improved control over the boundary conditions. This facility featuresthe spark-ignited, turbulent combustion of n-decane directly injected in preheated air(423 K, 0.4 MPa), with an overall equivalence ratio of 0.9. Solenoid valves are usedto perform the air intake and burnt gas exhaust. A OD analysis is developed andused to compute the gas thermodynamic evolution based on the experimental pres-sure traces. The effect of the main operating parameters on the combustion processis discussed: ignition delay, exhaust pressure and wall temperature. The vessel isoperated without scavenging, hence the exhaust pressure drives the amount and thetemperature of residual burnt gas (16-39% according to the 0D analysis). Highlydiluted cycles (exhaust pressure 0.2MPa) exhibit a higher combustion efficiency,but have a longer combustion duration (3 times more) than those of low dilution(exhaust pressure 0.07 MPa). For a higher wall temperature representative of enginecombustor (1000 K), the heat losses are directly reduced, which affects the residualburnt gas properties. This also influences the residual gas temperature (870-1030K)as well as dilution (10-26%). KeywordsFPressure-gain combustion· Thermodynamic analysisCycle optimization ( Q.Michalski (区)· B. Boust·M. Bellenoue ) ( Institut Pprime, (CNRS, ISAE-ENSMA, Universite de Poitiers), ) ( 1 Avenue Clement Ader, Teleport 2, B P 40109, 86961 Fut u roscope Chas s eneuil, France e-mail: quentin.michalski@ensma.fr ) 215 ( R. King (ed.), Active Flow and Combustion Control 2018, ) Introduction Future turbomachine generation requires multiple breakthrough to achieve the tar-gets decided for 2050 [1]. Pressure-gain combustion is a direct way to improve thethermal efficiency of aircraft combustor. Different technical solutions are currentlydeveloped such as pulsed or rotating detonation, controlled auto-ignition and con-fined deflagration. The latter, which is referred to as “constant-volume combustion”(CVC) was among the first solutions implemented on ground-based turbomachinesthrough the work of Holzwarth [2]. At the time, large 200L chambers were fedby an external compressor at 1 to 1.5 bar of initial pressure for a constant-volumecombustion working up to 1 Hz with an overall efficiency reported as high as 20%(which is significantly high given the reported operating initial pressure is 1 atm).Recently a simplified prototype of deflagrative chamber with rotating valves, aimedat aircraft application, was operated at higher frequency (25 to 60 Hz) and smallervolume (0.65 L) for improved power density [3] and its combustion stability wasinvestigated [4]. On such device (as on other devices based on deflagration such aswave rotors [5]), a minimum operating frequency is of importance mainly becauseit reduces the leaks at the clearance gaps between the rotating parts. Regarding thecombustor thermodynamic efficiency, several studies discuss the ideal performancesof pressure-gain thermodynamic cycles (for detonation as well as for deflagration[5-7]). However few studies performed on real-operated devices discuss non-idealperformances based on energy losses analysis [8]. The pressure rise is intrinsicallyrelated to the initial density and dilution of the fresh mixture. For piston-less combus-tors the exhaust happens at peak pressure and thus follows an adiabatic expansionat constant volume and decreasing mass. The expansion must start directly at theend of combustion. Consequently, the residual burnt gas (RBG) temperature canbe considerably higher than that found on four-stroke internal combustion engines(ICE) and close to that found on two-stroke ICE. Since such devices should operateupstream of a turbine, the RBG pressure should also be higher, thus directly affectingthe RBG mass (amount and temperature) as well as the expansion ratio. To pursuethe investigation of such conditions, a new facility referred to as CV2 was designed.It allows for a simplified operation, a study of performances and a detailed analysisof key processes found in such combustors. Two solenoid valves handle the intakeand exhaust, and ensure negligible leaks during combustion. Such choice of technol-ogy involves a limited operating frequency (approximately 10 Hz) but allows for aflexible control over cycles time charts. Two dedicated tanks allow for acontrol overthe inlet and exhaust boundary conditions, e.g. exhaust pressure, intake temperatureand pressure. Moreover, a 0D multi-zone model is developed to perform the ther-modynamic analysis of the experimental combustion cycles. A previous study basedon direct injection of gaseous propane evidenced ignition stability issues that wereshown to be statistically related to the velocity at ignition [9]. For more representativeconditions of practical aircraft combustor application, direct injection (DI) of liquidn-decane is used. Air is preheated up to 423 K and pressure in the chamber is setto 0.4 MPa prior to combustion. In this article, the effect of two crucial boundary conditions is investigated, namely the exhaust pressure and the wall temperature.Their influence on the thermodynamic efficiency is discussed with respect to thedifferent energy loss phenomena evidenced in the cycle. Selected operating pointsare optimized and the energy losses related to the different phases of the cycle arecompared. 2 Experimental Setup The CV2 rig is designed to produce cyclic CVC conditions representative of an air-breathing application. The rig is composed of a dedicated intake and exhaust systemconnected to a single combustion vessel (see Fig. 1). The conditions of intake andexhaust are set in dedicated tanks where the gas composition, pressure and tem-perature are measured and regulated. Intake and exhaust control systems consistin high-speed valves (COAX MK10) equipped with position sensors (5 kHz). Theirresponse time and transient behaviour were carefully characterized and tabulated (seecross-section in Fig. 4). The thermal load on the exhaust valve, due to burnt gasesflowing through, increases its response time. To limit this thermal drift and ensure therepeatability between consecutive sequences, the exhaust valve temperature is regu-lated at 40 °C (Kistler 2621 F conditioning unit). During an experimental sequence,from the first cycle to the twelfth one, it corresponds to a 3-4 ms maximum delay atopening.The valve is spring-loaded, thus the closing is not affected by the thermalload. Consequently, the exhaust duration is reduced by the same amount of timefollowing the opening delay. This drift is recorded by the position sensors and takeninto account in the following analysis. The tanks are connected to the valves through Fig. 1 CV2 in theconfiguration of interest: a combustion chamber and key components; b constant-volume parts of the chamber and connections highlighted in red. The wall thermocouple is symmet-rically positioned relatively to the cut-plane to the second pressure sensor (in green). c High-speedvalve where the constant-volume part is highlighted in red. d The two configurations (i) and (ii) ofthe laser sheet and camera: (i) the laser sheet is in the injector symmetry plane, (ii) the laser sheetis in the ignitor plane flexible hoses of internal diameter 16 mm, length 1 m. The chamber is rectangularwith internal dimensions of 50 ×50 ×100 mm. Its aspect ratio入 (length/width) isequal to 2, therefore internal wave dynamics is not as dominant as in wave rotor (=13 in [8]). In the present configuration, the closed volume ranges from the intake tothe exhaust valve seat, including the connection tubes of internal diameter 12 mm.Overall those volumes account for an additional 0.05 L (see Fig.1b, c). The com-plete volume, measured precisely with water, is 0.32 L (0.5% uncertainty) includingdead cavities. Intake air is supplied by a 20.76 L (0.3% uncertainty) intake tank at apressure of 1.0 MPa (0.2% uncertainty). Its volume, including the connecting hoseand connecting parts, was precisely measured by weighing the mass variation ofa 50L air bottle while pressurizing the tank. The fuel is injected directly into thechamber through one liquid injector (Bosch 0 261 500029: 7 holes, 15° bias angle)fitted to the wall. The injector is fed with liquid n-decane pressurized at 5.0 MPa.The injector mass flow rate was measured separately, at atmospheric pressure, byweighing the fuel quantity injected for different injection durations, which yields alinearized effective mass flow rate of 6.74 mg per ms of injection (1.1% uncertainty).The initial pressure in the chamber as well as the fuel quantity injected are controlledby varying respectively the intake and injection durations. Ignition is triggered by anon-resistive sparkplug topped with a conventional ignition coil charged up to 2.5 ms(maximum charge), thus delivering an inductive discharge of approximately 40 ±10 mJ lasting for 2.5 ms. The command, synchronization and acquisition are handledby a National Instrument controller (PXIe-8820 with a PXIe-6363) working up to100 kHz for fast sensors and 10 kHz for slow sensors. The intake system is ther-mally insulated and its temperature is regulated by PID-controlled heating collars.The intake hose has its own integrated heating system regulated by its own PID. Thechamber is non-insulated and heated with standard cartridge heaters fitted into thewalls of the vessel; its temperature is PID-regulated based on the eroding junctionthermocouple (Nanmac) used for the local measurement of wall surface tempera-ture. Each experimental sequence is a finite series of twelve cycles. The pressuredecrease in the fuel injection tank is negligible, whereas the pressure decrease inthe air intake tank is approximately 0.7% per cycle, thus a total 8% of variation for12 cycles. The overall equivalence ratio (OER) injected during each cycle is keptconstant. This is achieved by reducing the fuel injection duration, by a maximumof 1-2 ms from the first cycle to the last cycle depending on the experimental con-ditions selected. Such variation requires a preliminary calibration of fuel injectionduration for each operating point. A broadband oxygen sensor (lambda sensor LSU4.9) is installed at the exhaust, directly downstream of the exhaust valve. It gives ameasurement of the oxygen concentration in the burnt gases and is used to verifythat the oxygen concentration found in the exhaust gas matches the one associatedwith the injected OER. An absolute piezoresistive sensor (Kistler 4049B, 60 kHzbandwidth) is positioned near the oxygen sensor for transient pressure recording.This measurement is used to compensate the lambda measurement as the exhaustpressure varies [10].A piezoelectric sensor (Kistler 6067C, 90 kHz bandwidth) isused for pressure recording in the combustion vessel. A silicon layer is depositedon its surface, approximately 1 mm thick, to prevent thermal drift. For combustion pressure measurement, an absolute piezoresistive sensor (Kistler 4049B) is used inthe chamber as well to compensate for the piezoelectric thermal drift. Those twosensors are temperature-regulated (70 °C) by a dedicated Kistler 2621 F condition-ing unit. The OER is computed by measuring the pressure variation in the air tankfor each cycle and by the a priori calibration of the injector mass-flow rate. Usingthe perfect gas law and assuming isentropic expansion in the air tank, the OER ofthe fresh charge introduced in the chamber during the cycle reads where M, Ap, m and V are respectively the molar mass, pressure variation, massvariation and tank volume, a and f stand respectively for air and fuel tanks and Dstis the mass air-fuel ratio of a n-decane air stoichiometric mixture. The injectionof both air and fuel starts after the closing of the exhaust valve, that way there isno scavenging phase. The effective OER in the chamber thus corresponds to theinjected OER. The uncertainty in the OER for one cycle is mainly related to the airtank pressure measurement, Ap (16 mbar of uncertainty). However, given the highreproducibility of the valve opening cross-section (measured optically), one cansuppose the linearization of the pressure loss starting from the third cycle. Doing so,the uncertainty in Ap for a single cycle drops to 5.4%, which yields an uncertainty of6.8% in the OER calculated for a single cycle,e.g. at OER =0.9, it corresponds to anuncertainty of 0.06.2D time-resolved particle image velocimetry (PIV) is performedto characterize the aerodynamic conditions. The air injected in Fig. 2b was oil-seeded(2.0 um SMD),which can be seen in the first image (SOI+0.2 ms). As for Fig.2a, airwas not oil-seeded although residual particles can be seen in the air flow. Additionally,Mie tomography pictures give an insight into the fuel atomization during the intakephase. PIV is performed at 20 kHz (50 us time between two velocity fields), whichmeans the laser emission (Nd:YAG, 532 nm MESA PIV) works at 20 kHz andthe camera (SA-Z Photron) works at 40 kHz. To account for the velocity variationencountered in one cycle, a variable PIV interframe delay (from 2 us to 25 ps) is used(PTU X from Lavision). The filling process is highly repeatable and the interframeprofile is tuned after a few iterations on experiments. PIV data is processed with amulti-pass iterative calculation starting from 64 x 64 px down to 16 × 16 px witha 50% overlap (Davis 8.4.0). This yields a physical velocity resolution of 1.3 x1.3 mm. The PIV velocity fields highlight an internal aerodynamics structured around ahighly compressible flow which penetrates the chamber a few milliseconds after theopening of the valve and generates intense shear flow on the walls [11]. Air and fuelare injected simultaneously for enhanced mixing and atomization (see Fig.2) duringa fully closed exhaust phase. The injection process is apparently delayed, due to thetime induced by the 150 mm distance from the valve seat to the chamber. The samedelay occurs after the closing of the valve, as flow is still observed on the pictures.Finally the velocity decay is exponential because of a free-turbulence decay duringthis later phase. Regarding the atomization process, the PIV yields intake velocities of Fig. 2 Mie tomography images of the intake phase during a reactive combustion cycle, whichshows the atomization of the spray on the main air mass flow from the centre upper part of thechamber. A. PIV in injector plane (see Fig.1a), B. PIV in ignitor plane (see Fig.1b) approximately 250 m/s (confirmed by LES [11]) at air mass flow rates ranging from60 to 75 g/s. Phase-Doppler interferometry (PDI) measurements were performedon a cold injector (21.5 C) fueled with n-decane outside the chamber at ambientconditions, using an Artium PDI-200MD equipped with focal lenses of 500 mm forboth emission and reception (1.6-180 um detection range). Those measurementsperformed 30 mm downstream of the injection head yield an average droplet veloc-ity of 18.5 m/s and a 30 um Sauter Mean Diameter (SMD), for a mass flow rateof 6.74 g/s. The fuel spray and the air are injected simultaneously. Obviously, thespray and the central air plume have a similar dimension at their impingement point.This behaviour prevents the fuel spray to reach the wall and promotes a uniformdistribution of the fuel droplets in the chamber (as seen on the last MIE tomogra-phy pictures of Fig.2). Regarding this spray-air plume interaction, based on a fueldensity of 643 kg/m3 (403K and 1 bar), an air viscosity of 24.1 pPa.s (423 K and1 bar), the fuel particles are estimated to penetrate up to 0.1 mm into the air plumewhich corresponds to 1 % of its total width [12]. Along their trajectory, the dropletsevaporate so that the penetration length should then be lower. Such behavior is thusconsistent with the Mie tomography pictures recorded for PIV measurements duringthe simultaneous fuel and air injection (Fig. 2). In the following, the procedure forthe 0D calculation fit to the acquisition is detailed. 30D Numerical Setup A specific 0D multi-zone code was developed to compute the time-resolved evolutionof non-directly measurable properties such as mixture density, exhaust gas temper-ature and composition. The code is developed under Matlab R2015b. The chemical description of the fluid is based on the Cantera (2.3.0) Matlab library [13] using areduced number of species to speed up the computation. The species included in thedescription are H2,02,OH,H2O,CO,CO2,NO,N2,nC10H22 which thermodynamicproperties are taken from standard JANAF table. The model includes a separate rep-resentation of each vessel with regard to heat or mass transfer, including the intaketank and line (AD), the fuel injection tank (INJ T), the combustion chamber (CC),the exhaust tank (EJ) and the exhaust line (EJL)(Fig.3). The isochoric combustionphase is modeled through a three-zone description. Combustion happens in 3 phases:the flame propagates over a slice of fresh gases, this reacting slice (referred to as zone13 in Fig. 3) is set to chemical isobaric equilibrium at fixed enthalpy, which increasesits volume. The overall volume of gas in the chamber is temporarily higher than thegeometrical chamber volume. The 3 volumes of gas in the chamber are compressed(without mixing) at fixed entropy until their cumulated volume matches the chambervolume. At each integration step, the burning slice (zone 13 see Fig.3) is mixed withthe burnt gases (zone 12 see Fig.3). The combustion duration is set as measuredfrom experimental data for each cycle. Unburnt gases are accounted for by stop-ping the combustion over a volume including the gaps of the chamber assembly, aswell as the quenching distance estimated at 100 um according to high-pressuremeasurements [14]. Overall unburnt gas accounts for 3.0% of the total volume with2% due to the cavity quenching and the remaining 1% due to the flame-wall quench-ing. At the end of the combustion phase, fresh gases and burnt gases are mixed,thus the chemistry is frozen during the exhaust phase until the combustion of thefollowing cycle. For each cycle, the intake and exhaust durations are set as measuredon their respective position sensors. The intake flow is choked during most of the Fig.3 Graphical description of the vessels described in the 0D analysis with detailed number ofheat (dwith index relative to the gas phase number, red arrows) and mass transfer (black arrows)connections set between the vessels intake phase, a constant discharge coefficient is thus set until the mass drop measuredexperimentally in the intake tank matches the 0D simulated one that sets the mass ofair injected per cycle into the chamber. During the first cycle, the sensible enthalpyloss is set for the air that flows through the valve (which internal temperature is lowerthan the pre-heated air) until the initial pressure in the chamber is matched. Wall heattransfer coefficient h (in W/m/K) is modeled using Hohenberg’s correlation [15] where Vee is the volume of the chamber,pix and Tix are the pressure and temperatureof the gas phase for X =1 or 2 (either fresh or burnt gases). The representativevelocity u is computed based on the chamber cross-section and on the instantaneousmass-flow rate. The experimental increase in wall temperature is less than 10 Kduring combustion (see Fig.4); there is enough time for heat conduction betweeneach cycle, so that the cumulated wall temperature rise at the end of the 12th cycleis of 28 K. The wall temperature for the 0D calculation is thus considered constantover a complete sequence. The overall pressure shape is matched for the combustionphase and the exhaust phase on most cycles by adjusting the velocity (during the Fig. 4a Comparison between numerical 0D pressure (in blue) and experimental pressure signal (inred) for a single sequence (12 cycles) with intake (black), fuel injection (orange) and exhaust (blue)cross-sections. b Best fitted cycle selected for detailed analysis, the specific volume is figured aswell. The different phases of the experimental cycle are figured in color (A the intake, B the relaxingphase, C the combustion, D the isochoric cooling and E the exhaust). The wall temperature is figured1n green combustion and the isochoric cooling phase) and the exhaust discharge coefficient.Only experimental conditions with consecutive successful ignitions are analyzed. Inthe present cases, the cycle-to-cycle variation is low enough so that one cycle can beconsidered as representative of the whole set. 4Detailed Analysis on One Operating Point More details are given on the comparison between the experimental pressure signaland its respective computed 0D value. The pressure signal is well matched during the intake phase until the opening ofthe exhaust (Fig.4). The exhaust is more complex to simulate for several reasons.First the flow is only choked for part of its duration and the stagnation pressure andtemperature vary during the exhaust phase. Also, the temperature of the exhaust gas,higher than that of the intake, increases the volume flow rate. Even with the largeexhaust pipes (16 mm inner diameter), the pressure rises slightly in their residualvolume. This effect is accounted for by using an intermediate volume EJL betweenthe exhaust tank and the chamber. The unburnt gas influence is quantified as follows.From the conditions of Fig.4b cycle, the unburnt volume is varied from 0 to 6.0%. Themass fraction of unburnt gas depends on the maximum pressure reached. At 3.0%unburnt volume, up to 8.7% of the end-compression gases remain unburnt whichaccounts for a 0.10 MPa straight pressure loss (reference value of 0 MPa in Table 1).If this unburnt volume is brought to 0%, the resulting maximum pressure is thusraised by 0.1 MPa (hence with a positive sign in Table 1). Such unburnt volume canindeed be avoided by optimizing the chamber design. The assembly gaps (requiredin our modular conception) can be avoided in the case of real application designs,possibly made by additive manufacturing. As well, fuel-charge stratification can limitthe effect of flame-wall interaction by isolating the combustion in the centre of thechamber, thus reducing the amount of unburnt gas due to quenching. A constant value of 3.0% of unburnt gases in volume (among which 1.0% isdue to quenching distance) corresponding to our estimation is considered in thefollowing analysis. Onceproperly tuned, from one sequence to another with differentexperimental settings, e.g. varying exhaust pressure or ignition timing, only smalladjustments to the heat transfer model parameters are made to match the pressuretraces. The heat lost to the wall is then compared to the ideal heat of combustionQe=AmfIp, with I, =44.2 MJ/kg being the lower heating value of n-decane. During Percentage of unburnt volume (%) 0 3.0 6.0 Unburnt mass (%) 0 8.7 16.5 Induced relative pressure variation (MPa) +0.10 0 -0.09 Fig.5 Experimental and 0Dsimulated cumulated wallheat flux Qw in percentageof Qc, with its respective 0Dpressure signal used to figurethe different phases of the0D cycle. The referencepoints (1, 2,3, 4, 4'and 5)for energy losses calculationduring each phase are figured the intake phase, turbulent mixing occurs between the RBG and the fresh gases. Thispartially premixed charge of RBG, air and fuel, is continuously cooled by the wallsat a rate driven by near-wall turbulence. A fraction of the total thermal energy (2.0%in Fig.5) is thus lost during the intake phase (A-B). Approximately 30% of Oc istransferred to the wall during the combustion phase (C), 18% after the combustionis complete and before the exhaust full opening (D), and 11% during the exhaustphase (E) until the pressure equilibrium is completed. Indeed, those values dependon the unburnt volume taken in the computation. Considering the wall heat flux isadjusted to match the pressure peak, a lower unburnt mass fraction would require ahigher wall heat flux and vice-versa. Nevertheless, the same amount of energy-lossmust be set to match the pressure. The intake phase (A) starts at point 1 and ends at point 2. Following a relaxationphase (B) which duration depends on the chosen ignition timing, the isochoric com-bustion phase (C) then starts from point 3. On that cycle, the maximum combustionpressure reaches 1.53 MPa at point 4. The beginning of the exhaust phase is delayedto make sure the whole combustion process is isochoric. Therefore, the combustionphase is followed by a 25 ms isochoric cooling phase that comprises a true isochoricphase as well as part of the unsteady opening of the valve (approximately 15 ms).The isochoric cooling phase (D), from 4 to 4', is a straight energy loss whereasthe exhaust phase (E) is a non-adiabatic expansion that starts from 4’to pressureequalization with the exhaust tank. A post-processing is made from the condition 3,to compute the associated ideal isochoric and adiabatic combustion. Under constantheat capacity and perfect gas assumptions, the adiabatic pressure ratio na is directlyrelated to the energy-loss and computed as: Table 2 Cycle thermodynamic properties and detailed balance of energy losses. The dilution isgiven in mass percentage relative to the mass at ignition Unburnt volume (%) Maximumpressure(MPa) RBG Dilution(%) Residual temperaturebefore intake(K) Temperature after intake (K) Cycle properties 3.0 1.53 22.0 500 434 Intake losses Unburnt gases Combustionlosses Isochoriccooling heatlosses Exhaust heat IOSS Energy lossQ/Qc (%) 1.8 8.7 32.4 12.6 14.5 where p4a is the adiabatic and isochoric combustion pressure. In Fig.5, this pressureratio is 67% which is consistent with the 41 % energy-loss simulated during thecombustion phase from point 3 to 4 (see Table2): 8.7% corresponding to unburntgases and 32.4% to heat losses. In the following, this energy-loss balance is usedto evaluate the effect of initial conditions (at point 3) on combustion through RBGdilution, both in mass and temperature. At fixed boundary conditions, the influenceof the ignition timing is discussed by combining experiments and 0D simulationanalysis. 5Influence of the Ignition Timing on the CyclePerformances To improve the power density, high operating frequency is required. Consequently,combustion cycles need to be as short as possible. For combustion to be as fast aspossible after ignition, one requires both high turbulence as well as favourable localmixture conditions in equivalence ratio and dilution to promote ignition successand flame velocity. The local variation of those properties has a direct impact on theignition probability and on the ignition kernel growth towards the rest of the chamber.A previous study in direct gaseous injection with non-preheated air evidenced thesensitivity of ignition success to the local velocity properties; for a given dilution andequivalence ratio, statistical limits for the velocity were evidenced [9]. Only stableconditions are considered in the following. For that purpose, the overall equivalenceratio selected is 0.90 ± 0.05, and the exhaust backpressure is set to 1 bar to limit theRBG dilution to approximately 20%.The ignition timing is varied from the end ofthe intake phase, to 15 ms later (12% of total cycle duration). During that time, the mean velocity in the chamber drops from approximately50 m/s, at the beginning of the pressure plateau, to 15 m/s in 3 ms, at the end ofthe first rebound, and then decays from 15 m/s to less than 5 m/s in the following Fig.6 Ensemble-averaged mean velocity in the chamber (with the cycle-to-cycle standard deviationas bars) from two separate sequences, for a PIV plane on the injector head (red) and in front ofthe injector head (blue). A and B refers to the cases presented on Fig. 2. The intake cross-sectionand pressure signal are figured as well. The initial pressure is slightly lower (3.2 MPa) than for therest of the studied sequences (4.0 MPa) which affects the velocity magnitude but not the timings ofevents Fig.7 Instantaneousexperimental pressuresignals for different cycleswith varying ignition timingrelative to the beginning ofthe pressure plateau (closingof the intake valve) 10 ms (Fig.6). At OER=0.9, the ignition timing is varied from the beginning of thepressure plateau to 15 ms by step of 3 ms (Fig.7). Characteristic combustion durations based on the pressure signal are usually com-puted to describe the different phases of the combustion process. Those durationsare defined based on a percentage of the non-adiabatic combustion pressure gain, T,between the pressure at ignition and the maximum combustion pressure reached: Table 3 Combustion characteristic average times with their respective standard deviation givenfor varying ignition delays as well as RBG dilution properties Ignition delay 15 ms 12 ms 9 ms 6 ms 3 ms 0 ms to-10 (ms) 7.4十0.6 6.8±0.4 6.5±0.4 5.5±0.4 4.7±0.5 3.3±0.6 t10-90 (ms) 4.2±0.4 3.8±0.6 3.4±0.2 2.9±0.2 2.7±0.3 1.8±0.5 t90-100(ms) 1.5±0.4 1.3±0.3 1.2±0.4 1.1±0.4 0.7±0.4 0.7±0.2 RBG Tem-perature (K) 527 514 512 497 486 460 RBG Dilution 21.4 21.7 22.0 22.4 22.2 23.0 (%) p4 (MPa) 1.54 1.52 1.59 1.59 1.61 1.66 Expansionratio (-) 12.8 12.4 11.9 11.4 11.2 10.5 According to these formulas, the duration to-10 can be considered as representative ofthe time taken for ignition kernel growth to free flamepropagation, t10-90 correspondsto free flame propagation and t90-100 corresponds to the end of propagation at whichthe flame-wall interaction is maximum (Table3). For every ignition timing, the exhaust timing is kept constant. The overall combus-tion duration is strictly decreasing (reduced by almost a factor of 2) towards earlierignition timing. At a given OER and almost constant RBG dilution rate, the flamevelocity depends on the turbulent velocity fluctuation, in first-order approximation[3, 16]. At the closing of the intake valve, turbulent velocity rapidly decays follow-ing the mean velocity evolution (Fig.6). Earlier ignition yields higher flame velocity,which thus results in shorter combustion duration. The following isochoric coolingphase duration then increases for earlier ignition, which in turn increases the heatlosses. The consequence is a lower initial pressure for the exhaust expansion, whichcan be seen directly on the pressure signal (Fig.7). At the earliest ignition timing(0 ms), 33% of the fuel energy is lost to the wall during the isochoric cooling phase.Those losses drop to 8.6% for the latest ignition (15 ms). As the peak combustionpressure is almost the same (1.54 MPa at 15 ms to 1.66 MPa at 0 ms), the more cool-ing there is during that phase, the lesser the initial exhaust pressure, the less efficientthe cycle will be by lowering the potential for work recovery. However, higher initialpressure prior to expansion means higher velocity and temperature at the opening ofthe exhaust valve, which yields slightly higher heat losses during the exhaust phase.Considering any actuator used to control the isochoric phase will have their own timeresponse, a trade-off must be found between the isochoric cooling phase losses anda fully isochoric combustion for optimal work recovery. Following Fourier’s law, infirst-order approximation, the heat losses are directly related to the wall tempera-ture. The rig is not designed to reproduce stationary thermal equilibrium conditions.Therefore, the wall temperature is much lower than what could be expected in indus- trial applications, hence higher heat losses. In the following, we discuss the influenceof the boundary conditions on the combustion properties through an experimentalvariation of the exhaust pressure. The effect of the wall temperature is also discussedthrough the 0D simulation. 6Influence of the Boundary Conditions on ExperimentalCycle Performances In turbomachines, the combustor backpressure is a design parameter that can becontrolled by the cross-section of the turbine first stage diffuser. Turbine efficiencyis related to its pressure expansion ratio, and choked conditions are usually set atthe first stage diffuser for best efficiency. In piston-less CVC processes, the exhaustback-pressure directly drives the expansion ratio from the pressure at the beginningof the exhaust (point 4'), to the exhaust backpressure (point 5). The expansion ratio,in turn, affects the RBG density through the resulting pressure and temperature atthe end of exhaust phase. The operating points experimentally investigated start atan initial pressure of 4.0 MPa for a constant OER=0.9. With increasing backpres-sure, an increased mass of RBG is trapped into the chamber and a lower air massis introduced into the chamber. This is achieved through a reduction in intake valveopening duration (1 ms of opening corresponds to an increase of 250 mbar). Theenergy density is thus reduced for higher backpressure. The ignition timing (12 ms)as well as the exhaust opening duration are kept the same (see Fig. 8). Under thoseconditions, the higher the dilution, the slower the combustion, so that combustionduration is affected by a factor of 2.8 between an exhaust pressure of 0.07 MPa and0.21 MPa (Table4). Given the exhaust valve is opened at the same timing for eachoperating point, the isochoric cooling phase is long enough for each operating point Fig. 8 Experimental pressure signals of single cycles with the same ignition timing (12 ms) forthe 4 different backpressure investigated, 0.07 MPa (blue), 0.11 MPa (red), 0.16 MPa (green) and0.21 MPa (black). The two extreme traces of intake (imposed) and exhaust (thermal drift) cross-sections are represented following the colour code as the one for their associated backpressure to have the same initial exhaust expansion pressure (1.3 MPa). The expansion ratiodecreases with the exhaust pressure from 18 to 6.3, hence higher temperature forhigher exhaust backpressure. The trapped residual mass is influenced by the residualdensity through the expansion ratio and the initial exhaust pressure.Under thoseconditions, the exhaust gas quantity increases by 16.6% in mass every 0.1 MPa ofbackpressure. The fundamental flame velocity is known to decrease with increasingdilution (see [17]) for experimental measurements on diluted iso-octane/air flame)and to increase with the temperature. However, considering the important cooling ofthe exhaust gases, both during combustion (Fig. 9) and exhaust (Table 4), the increasein initial temperature (after mixing with the fresh mixture) is not high enough to com-pensate for the increase in dilution, hence a lower fundamental flame velocity. Theenergy density for diluted cycles is lower. They exhibit lower maximum pressure,and slightly lower combustion temperatures. The final density in the fresh gas whencombustion stops (see point 4 on Fig. 5) is thus lower, which yields a reduced unburntmass fraction and a higher combustion efficiency. In the present experiments, the heatlosses are high because of the low wall temperature (423 K). In turbojet engines, thethermal management of the combustor is based on compressed air bypassed fromthe compressor stages. That means higher working temperatures are envisioned. Thesame cycle is simulated keeping the heat loss coefficient, combustion duration (as thereal duration is difficult to estimate) and intake gas temperature constant, but at a walltemperature of 1000 K (which is compatible with most Inconel alloys). This lowersthe combustion losses by 10% and isochoric cooling phase losses by a few percent(at which the temperature difference is maximum). The temperature of the cycle isoverall higher, heat is gained by the charge during the intake, and the heat lossesduring the exhaust are lower, hence a higher initial temperature (Table5). The flamevelocity should thus be higher, which should reduce the heat losses during combus-tion (as seen with the variation of ignition timing). The increase of wall temperatureincreases the gas temperature in each phase of the cycle. In the present conditions, anincrease of the exhaust pressure yields spontaneous re-ignition during fuel injection Table 44 Combustion characteristic conditions (exhaust expansion ratio, RBG dilution of the mix-ture, the initial residual temperature, initial temperature of the cycle fresh mixture) and averagetimes with their respective standard deviation given for varying backpressure Exhaust backpressure 0.21 (MPa) 0.16 (MPa) 0.11 (MPa) 0.07 (MPa) Wall temperature (K) 423 Dilution (%) 38.7 31.3 22 15.8 Expansion ratio (-) 6.3 7.9 12.3 18 Residual temperature (point 5) (K) 577 547 500 469 Initial temperature (point 2) (K) 439 436 434 436 to-10(ms) 14.1±1.1 10.2±1.1 6.7±0.6 5.1±0.3 t10-90(ms) 7.3±0.6 5.4±0.6 4.0±0.6 2.7±0.3 t90-100 (ms) 2.6±0.7 2.2±0.7 1.2±0.6 0.8±0.6 Fig. 9 a Energy balance during the combustion phase with heat losses (coloured background)and unburnt gas losses, for 4 different backpressures corresponding to the experimental boundaryconditions (Tw =423 K). b Same energy balance for a 0D simulation at Tw = 1000K [18]. This behaviour is closely related to the RBG temperature, hence spark-ignitedcycles operating at wall thermal equilibrium conditions would certainly evidencesuch phenomena. Moreover, it would start at a lower exhaust backpressure, sincethe vessel is operated without scavenging. In other pressure-gain combustion appli-cations, this behaviour is also under consideration, in order to avoid pre-ignition inhigh-frequency PDE (relative to spark-ignition) [19] or to control it in pulsed com-bustor [20]. The optimization of such cycles requires the reduction of the isochoriccooling phase duration to a minimum. This requires an optimization of the opening ofthe exhaust valve. An early opening of the exhaust valve yields a truncated pressureat the end of combustion which is then isobaric (although occurring at final pressure).For an ignition timing of 3.0 ms (Table3), an optimization is made on the exhausttiming (Fig.10a). The cycle duration is adjusted (reduced by 25 ms) to avoid furtherheat losses after the expansion, while still avoiding scavenging. For the two comparedcycles (Fig.10a), the OER (0.87) is the same with a slightly higher initial pressurefor the unoptimized cycle (0.43 MPa) compared to the optimized cycle (0.40 MPa).In both cases, the dilution is identical (0.3% difference). With the optimization, theisochoric cooling phase is shorter, resulting in a 3.4% isochoric cooling loss com-pared to 21.0% for the unoptimized cycle. As the pressure ratio is higher, the massflow rate increases, hence higher exhaust velocities that result in higher heat fluxes.The same optimized cycle is processed with an increased 1000 K wall temperature(same as Fig.9b).Doing so, the combustion heat losses are 9% lower, the unburntgas mass is 2% lower; but as for unoptimized conditions, the heat losses during theisochoric phase remain the same. Working in partially premixed conditions, the burntgases at the end of combustion are directly exposed to the chamber walls,hence ahigh temperature gradient (still approximately a 1000 K difference) once the flame Fig. 10 a Comparison of experimental pressure signals for a cycle with optimized cycle (blue), withalmost no isochoric phase and shorter cycle duration (100 ms instead of 125 ms) and unoptimizedcycle (red). The different phases for the two cycles are figured as in Fig. 5. The ignition timing beingearly (at 31 ms), there is no relaxation phase"b Table 5 Combustion characteristic conditions (exhaust expansion ratio, RBG dilution of the mix-ture, the initial residual temperature, initial temperature of the cycle fresh mixture) for the extrap-olation at Tw = 1000K Exhaust backpressure 0.21 (MPa) 0.16 (MPa) 0.11 (MPa) 0.07 (MPa) Wall temperature (K) 1000 Dilution (%) 26.4 20.7 13.8 10.2 Expansion ratio (-) 7.2 9.3 15 21.1 Residual temperature (point 5) (K) 1028 975 911 871 Initial temperature (point 2) (K) 756 708 677 652 reaches the wall, which yields high heat flux. Such behaviour can be avoided byusing a convenient air-fuel stratification strategy similar to spark-ignited ICE, wherethe mixture is fuel-rich at the centre of the cylinder and fuel-lean near the walls. 7Conclusion A constant-volume combustion chamber is operated with pre-heated air (423 K atan initial pressure of 0.4 MPa) and a directly injected liquid n-decane with a cyclicoperation reaching up to 12 cycles. The combustion characteristics are shown tobe strongly dependent on the residual burnt gas properties. Those properties areinfluenced by the two main boundary conditions of the cycle, namely the exhaustpressure and the wall temperature. In the current setup, the walls are heated up to423 K which is sufficient to prevent the condensation of n-decane but is far too low to be representative of thermal equilibrium, thus allowing for an important coolingof the burnt gases. The expansion ratio is varied by a factor of 3 mostly by varyingthe exhaust backpressure. With higher backpressure, the dilution as well as the RBGtemperature are increased. Nevertheless, due to an important cooling of those burntgases during the exhaust phase, and due to the addition of the fresh charge, theresulting initial temperature is not affected. This results in a slower combustion, asthe characteristic combustion time increases by a factor of 2.8 as the RBG dilutionincreases from 15.8% to 38.7%. In the case of a higher wall temperature, the coolingof RBG is reduced hence an increased temperature and a reduced mass fraction ofresidual burnt gases. As a result, the initial gas temperature increases with increasingexhaust backpressure. Among the losses which are accounted for on the presentdevice, a certain amount is expected to be easily reduced further in an industriallydesigned chamber. Premixed combustion in internal combustion engines leads tohigher heat losses as the burnt gases and the flame are directly in contact with thewalls. Stratified combustion would thus help reduce both the heat losses during thecombustion and the unburnt gas generated by quenching to the walls and insidemechanical gaps; hence leading to higher combustion efficiency. Acknowledgements This work is part of the CAPA Chair research program on Alternative Com-bustion modes for Air-breathing Propulsion supported by SAFRAN Tech, MBDA France and ANR(French National Research Agency). References 1. European Commissio: Flighpath 2050-Europe’s Vision for Aviation (2011). https://doi.org/10.2777/50266 2. Holzwarth, H.: The gas turbine: theory, construction and records of the results obtained fromtwo actual machines (1912) 3. Boust,B.,Michalski, Q., Bellenoue, M.: Experimental investigation of ignition and combustionprocesses in a constant volume combustion chamber for airbreathing propulsion. In: AIAA(2016). https://doi.org/10.2514/6.2016-4699 ( 4. L abarrere, L ., e t al.: Experimental a nd n u merical st u dy of cyclic va r iations in a c onstantvolume combustion chamber. Combust. Flame 172, 49-61 (2016). https: //doi.org/10.1016/ i.combustflame.2016.06.027 ) ( 5. A kbari, P ., Nalim, M .R., D onovan, E . S., Snyder, P.H.: Leakage assessment of pressure-exchange wave rotors. J.Propul. Power 24(4) (2008). htt ps://doi.org/10.2514/1.31725 ) ( Z ockel, M.: The constant volume gas turbine-a thermodynamic assessment. In: ASME (1974) ) ( W intenberger,E.,Shepherd, J.E.: Thermodynamic cycle analysis for propagating detonations.J.Propuls. P ower 22(3), 694-698 (2006). htt ps://doi.org/10.2514/1.12775 ) ( 8. 5. N 1 alim,M.R.,Snyder,P.H., Kowalkowski, M.: Experimental test, model validation, and viabilityassessment of a wave-rotor constant-volume combustor. J. Propuls. Power 33(1) (2017). htt ps://doi.org/10.2514/1.B36174 ) 9. Michalski,Q., Boust, B., Bellenoue, M.: In Revision. Experimental investigation of ignitionstability in a cyclic constant-volume combustion chamber featuring relevant conditions forair-breathing propulsion. Flow Turbul Combust 11. Michalski,Q. et al.: Joint numerical and experimental characterization of the turbulent reactiveflow within a constant volume vessel. In: AIAA JPC (2018) 12. Rudinger, G.: Penetration of particles injected into a constant cross flow. AIAAJ.12(8),1138-1140 (1974). https://doi.org/10.2514/3.49429 13. Goodwin, D.G., Moffat, H.K., Speth, R.L.: Cantera: An object-oriented software toolkit forchemical kinetics, thermodynamics, and transport processes. Version 2.3.0. (2017). http://cantera.org 14.L]abuda, S., Karrer, M., Sotton, J., Bellenoue, M.: Experimental study of single-wal flamequenching at high pressures. Combust. Sci. Tech. 183(5), 409-426 (2010). https://doi.org/10.1080/00102202.2010.528815 15. Hohenberg,H.: Advanced approaches for heat transfer calculations. SAE Tehnical Paper, Issue790825 (1979).https://doi.org/10.4271/790825 16. Lipatnikov, A.N., Chomiak, J.: Turbulent flame speed and thickness: phenomenology,evalua-tion, and application in multi-dimensional simulations. Prog. Energy Combust. Sci. 28, 1-74(2002) 17. Endouard, C., Halter, F., Chauveau, C., Foucher, F.: Effect of CO2, H2O, and exhaust gasrecirculation dilution on laminar burning velocities and markstein lengths of iso-octane/airmixtures. Combust. Sci. Tech. (2016).https://doi.org/10.1021/ef101482d 18. Michalski, Q., Boust, B., Bellenoue, M.: Toward a cyclic self-ignited constant-volume combus-tion for airbreathing propulsion applications. In: AIAA—Joint Propulsion Conference (2018) l9. Mastuoka, K., Takagi, S., Kasahara, J.: Validation of pulse-detonation operation in low-ambient-pressure environnement. J. Propuls. Power 34(1), 116-124 (2018).https://doi.org/10.2514/1.B36401 20. Yungster, S., Paxson, D.E., Perkins, H.D.: Effect of fuel injection and mixing characteristicson pulse-combustor performance at high-pressure. In: AIAA Propulsion and Energy Forum(2014). https://doi.org/10.2514/6.2014-3728 The pressure-gain combustion concept is a solution envisioned to increase the thermodynamic efficiency of gas turbines. This article addresses the behaviour of piston-less constant-volume combustion in relevant conditions of engine application. For this purpose, a lab-scale combustion vessel (0.3 L) is run in cyclic operation (10 Hz) with an improved control over the boundary conditions. This facility features the spark-ignited, turbulent combustion of n-decane directly injected in preheated air (423 K, 0.4 MPa), with an overall equivalence ratio of 0.9. Solenoid valves are used to perform the air intake and burnt gas exhaust. A 0D analysis is developed and used to compute the gas thermodynamic evolution based on the experimental pressure traces. The effect of the main operating parameters on the combustion process is discussed: ignition delay, exhaust pressure and wall temperature. The vessel isoperated without scavenging, hence the exhaust pressure drives the amount and the temperature of residual burnt gas (16–39% according to the 0D analysis). Highly diluted cycles (exhaust pressure 0.2 MPa) exhibit a higher combustion efficiency, but have a longer combustion duration (3 times more) than those of low dilution (exhaust pressure 0.07 MPa). For a higher wall temperature representative of engine combustor (1000 K), the heat losses are directly reduced, which affects the residual burnt gas properties. This also influences the residual gas temperature (870–1030 K) as well as dilution (10–26%).
确定

还剩17页未读,是否继续阅读?

产品配置单


北京欧兰科技发展有限公司为您提供《定容燃烧中速度矢量场检测方案(CCD相机)》,该方案主要用于其他中速度矢量场检测,参考标准--,《定容燃烧中速度矢量场检测方案(CCD相机)》用到的仪器有LaVision HighSpeedStar 高帧频相机、时间分辨粒子成像测速系统(TR-PIV)、LaVision DaVis 智能成像软件平台
推荐专场
CCD相机/影像CCD
更多


相关方案
更多
该厂商其他方案
更多