


方案详情
文
利用LaVision的粒子成像测速(PIV)系统,对海水淡化装置中经场采用的中空纤维膜组件的壳程流体力学减租特性进行了研究
方案详情

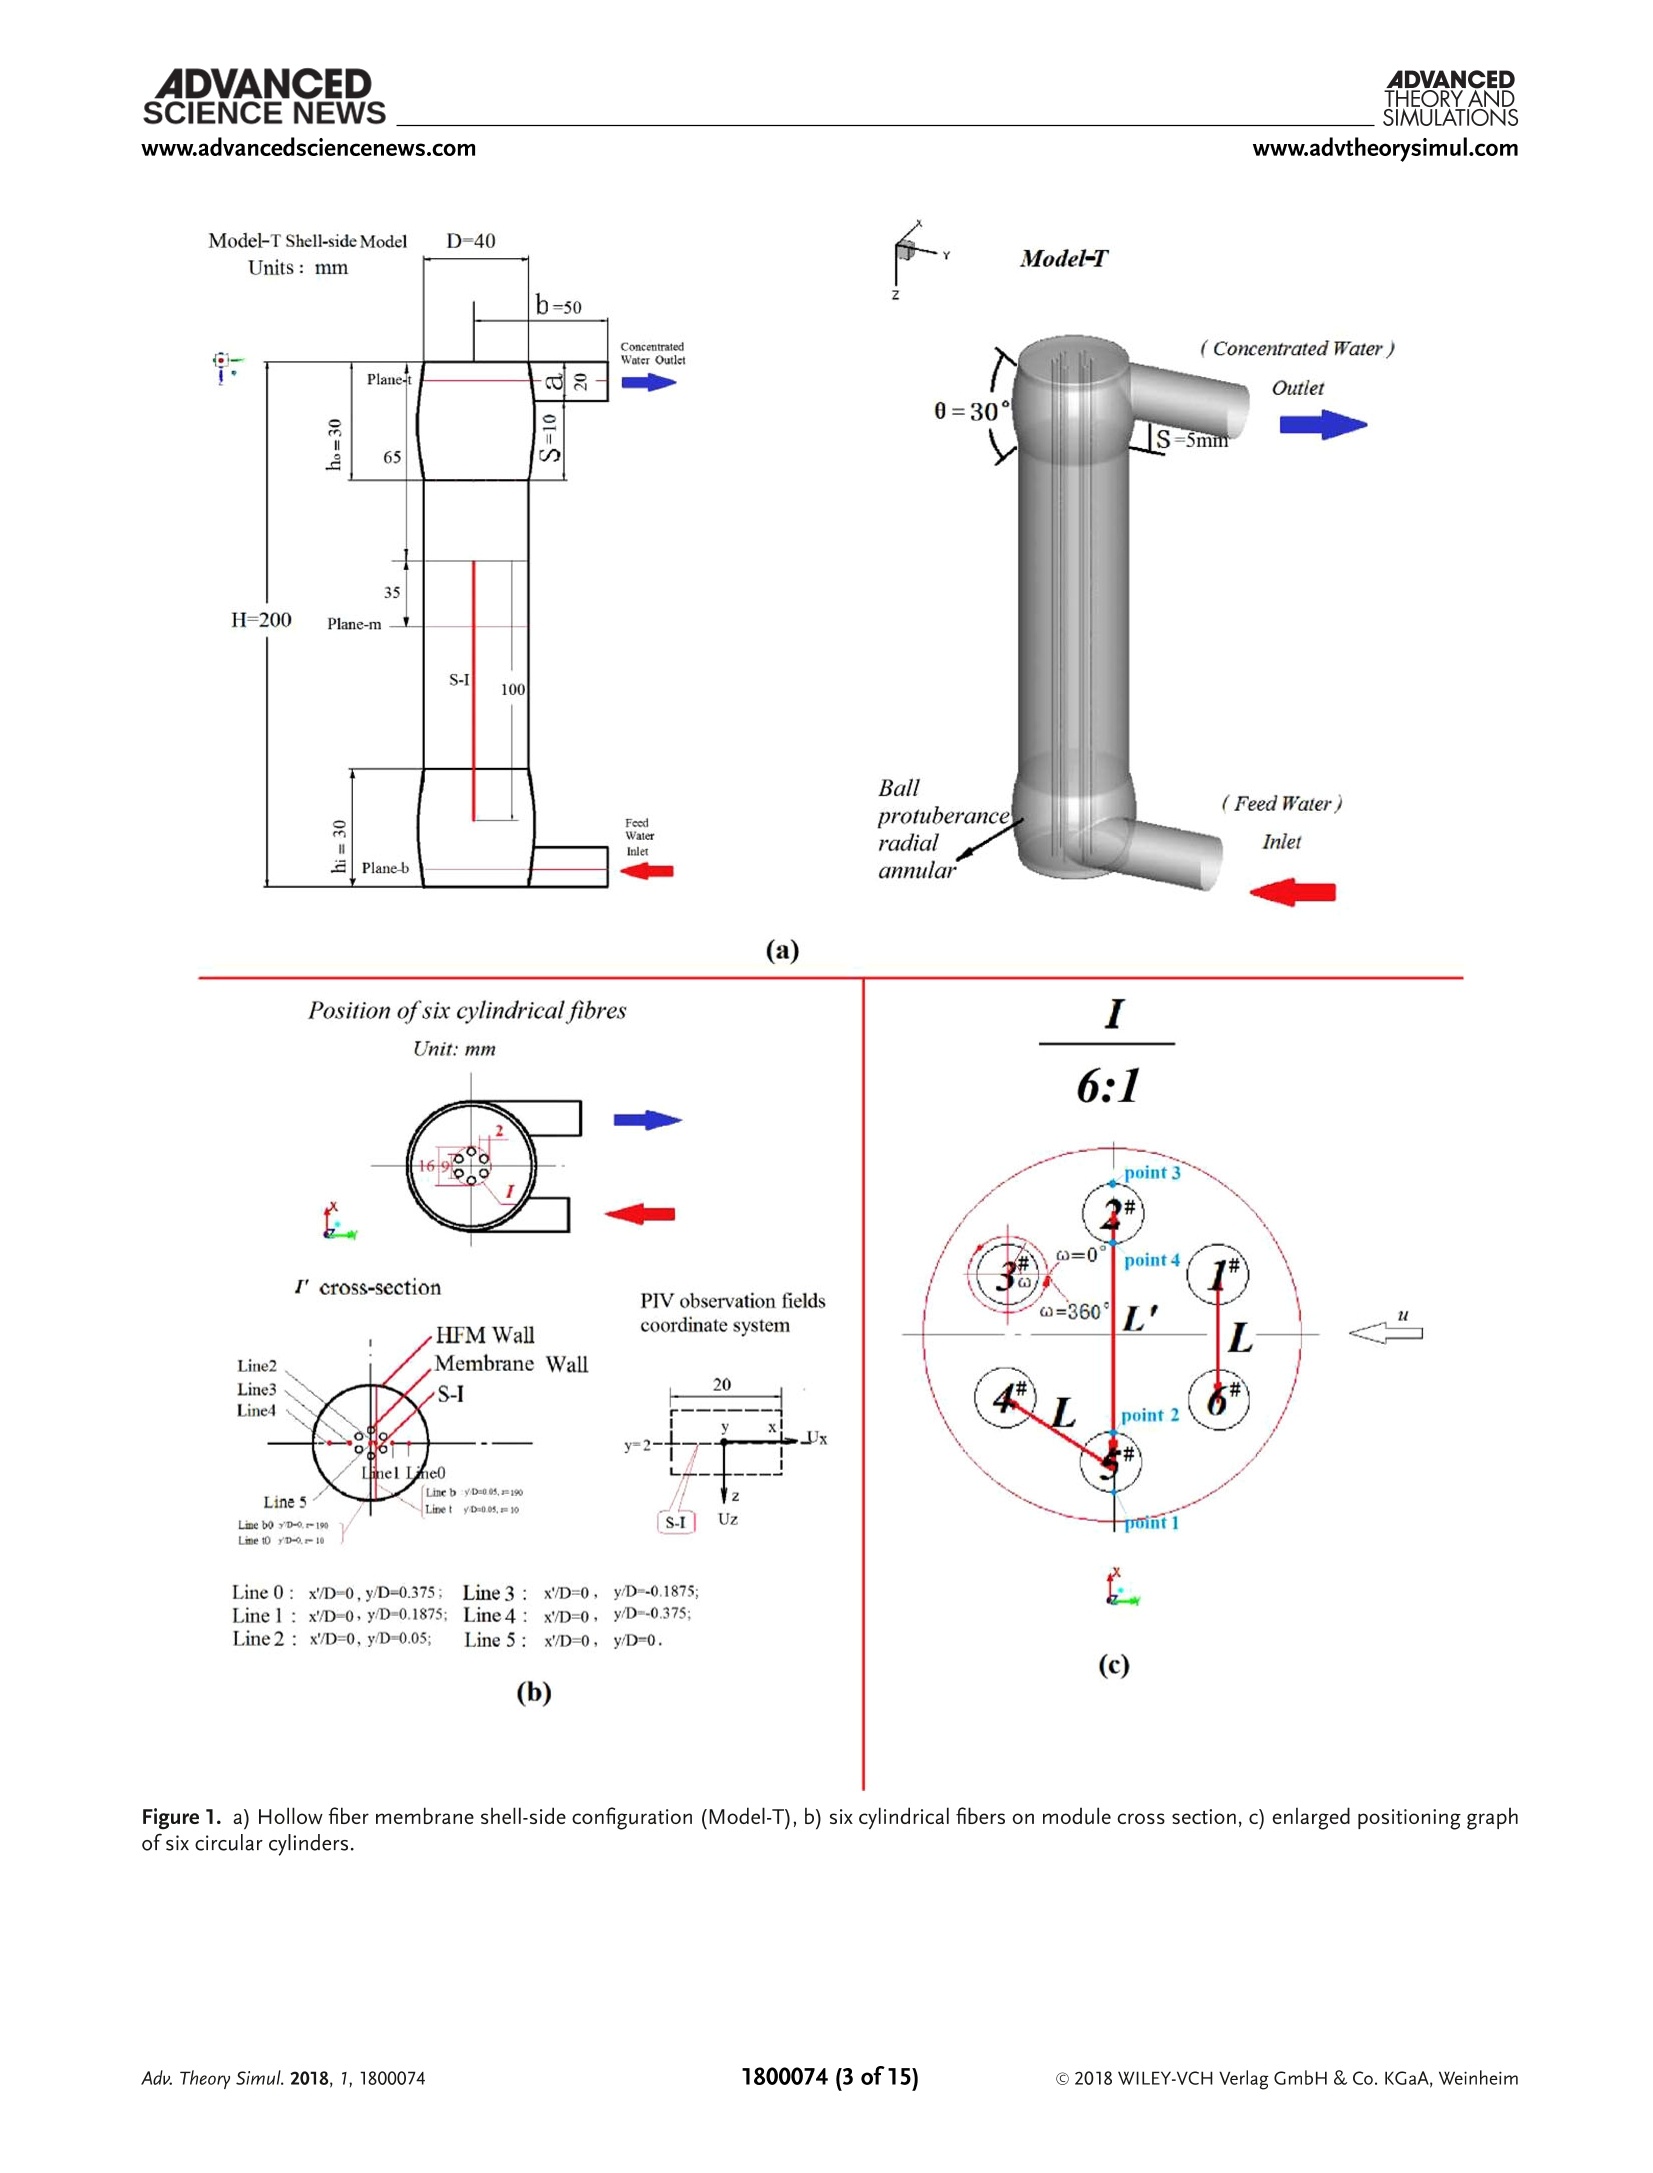
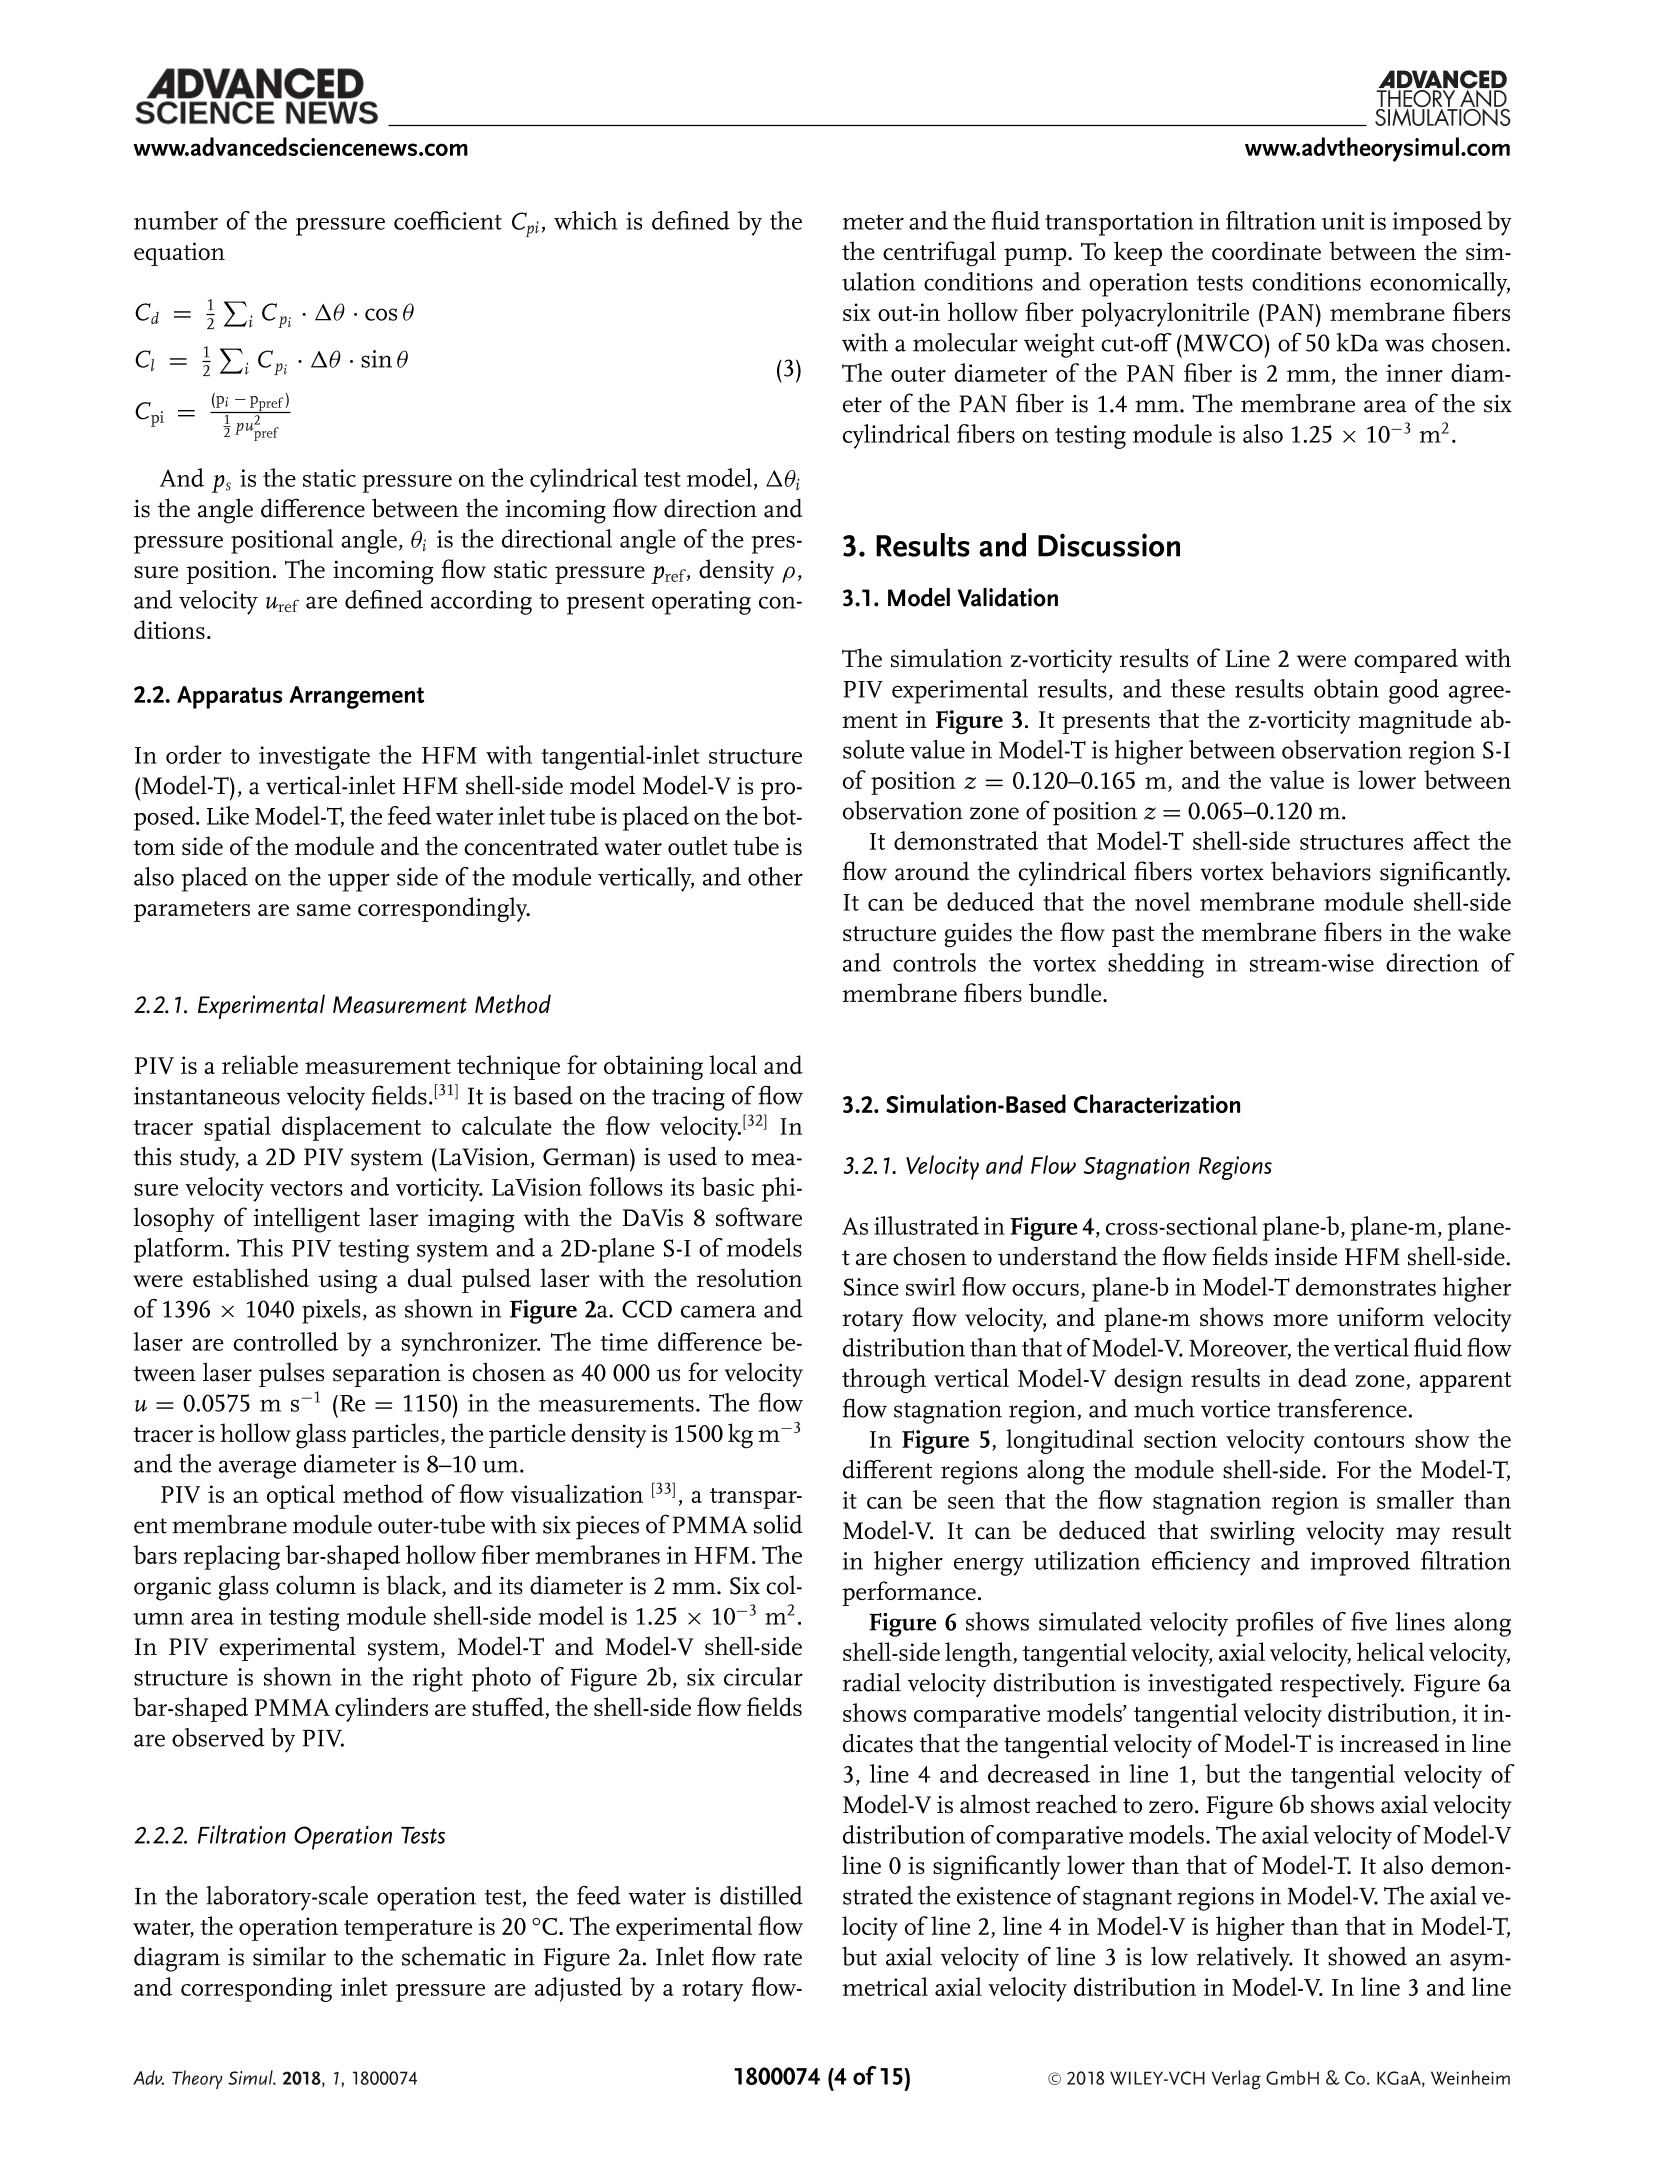
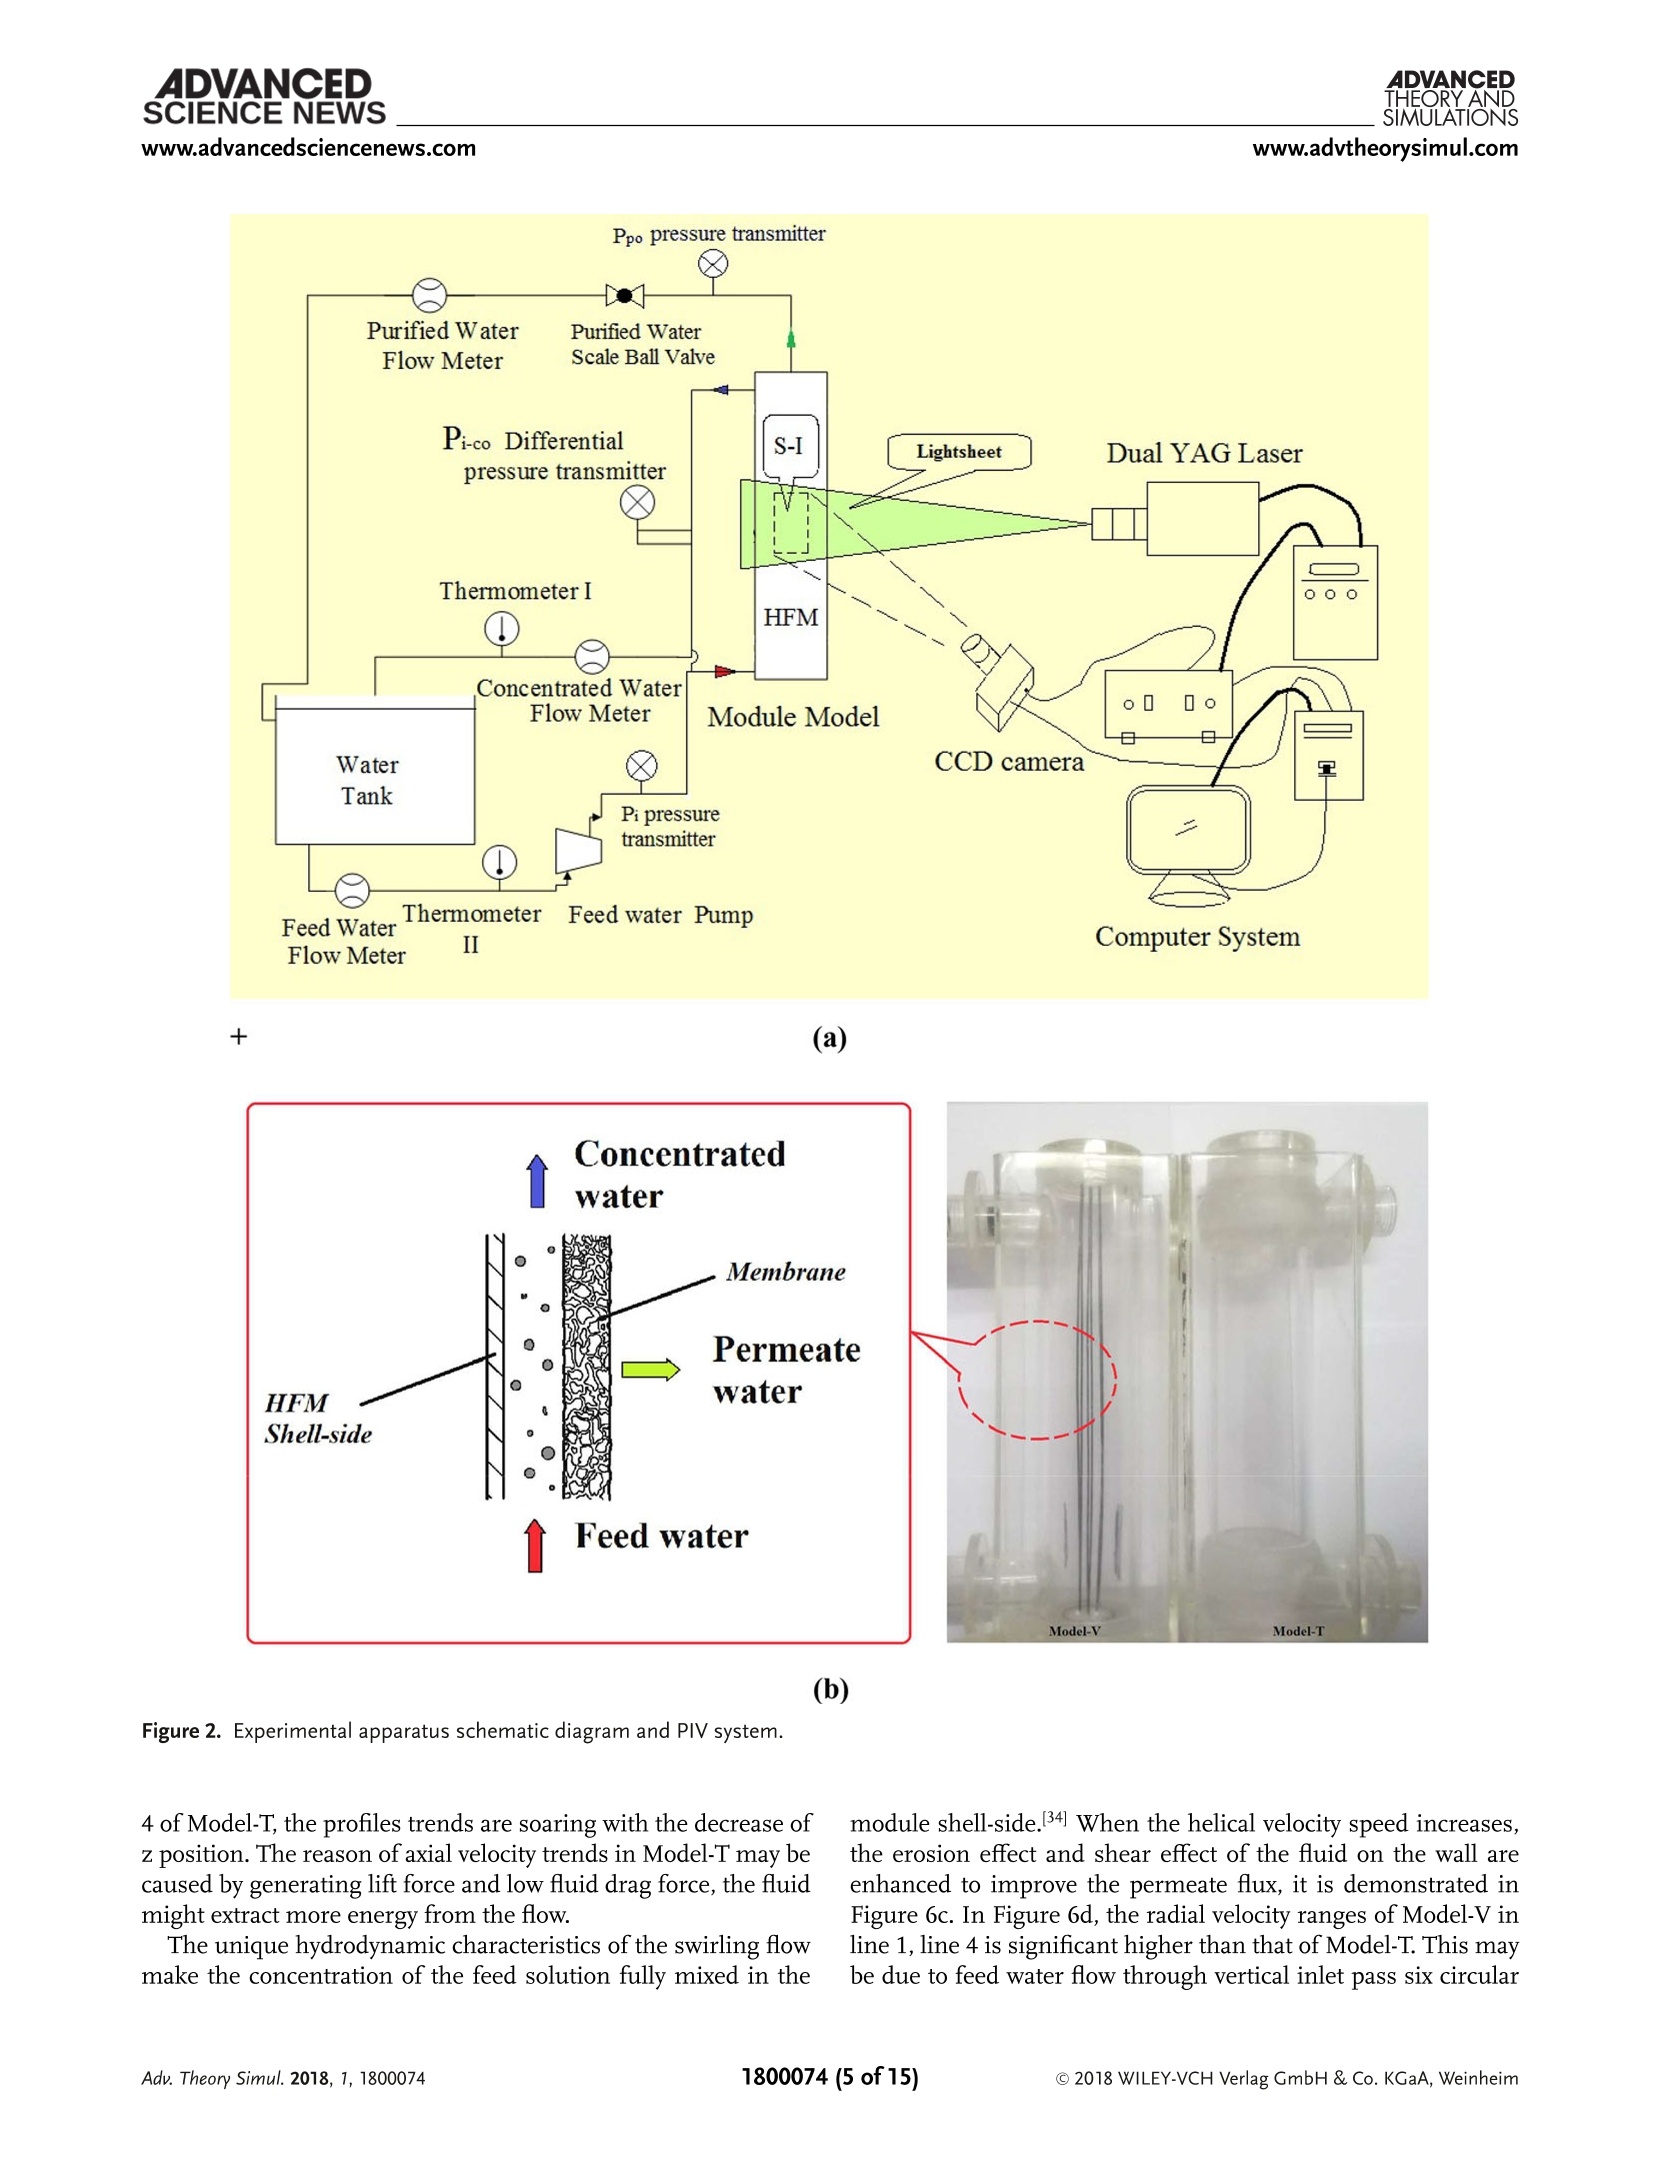
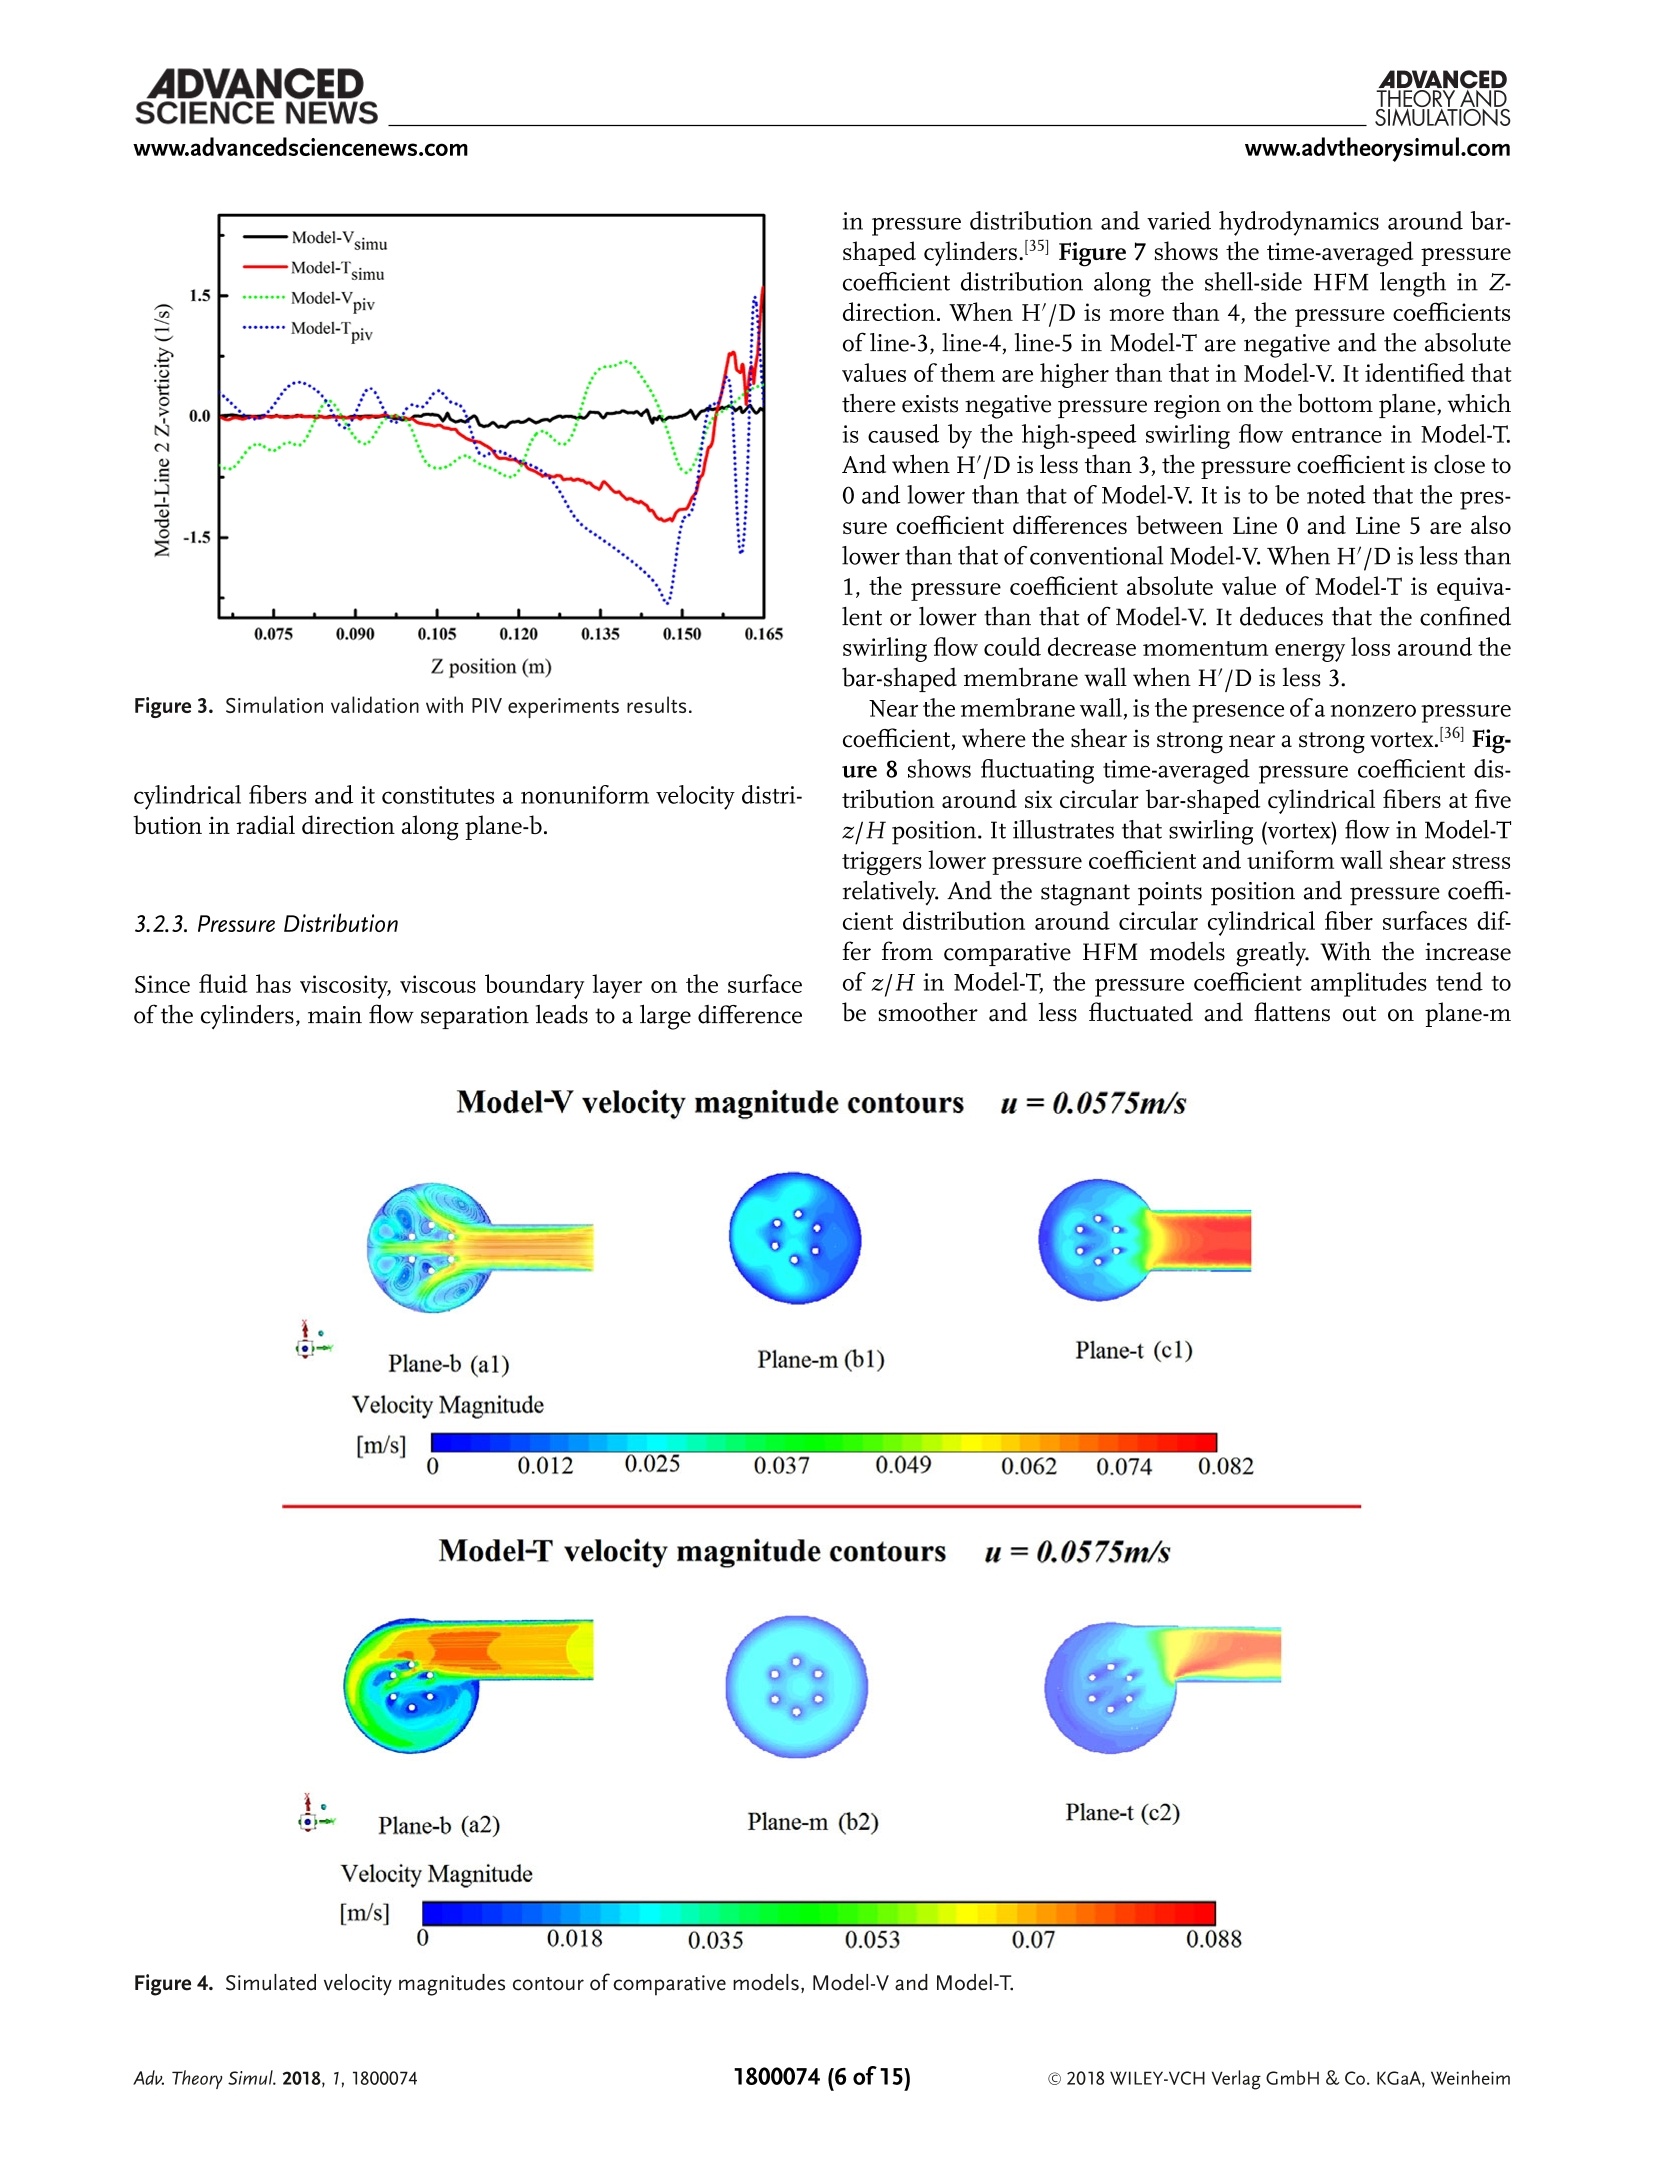
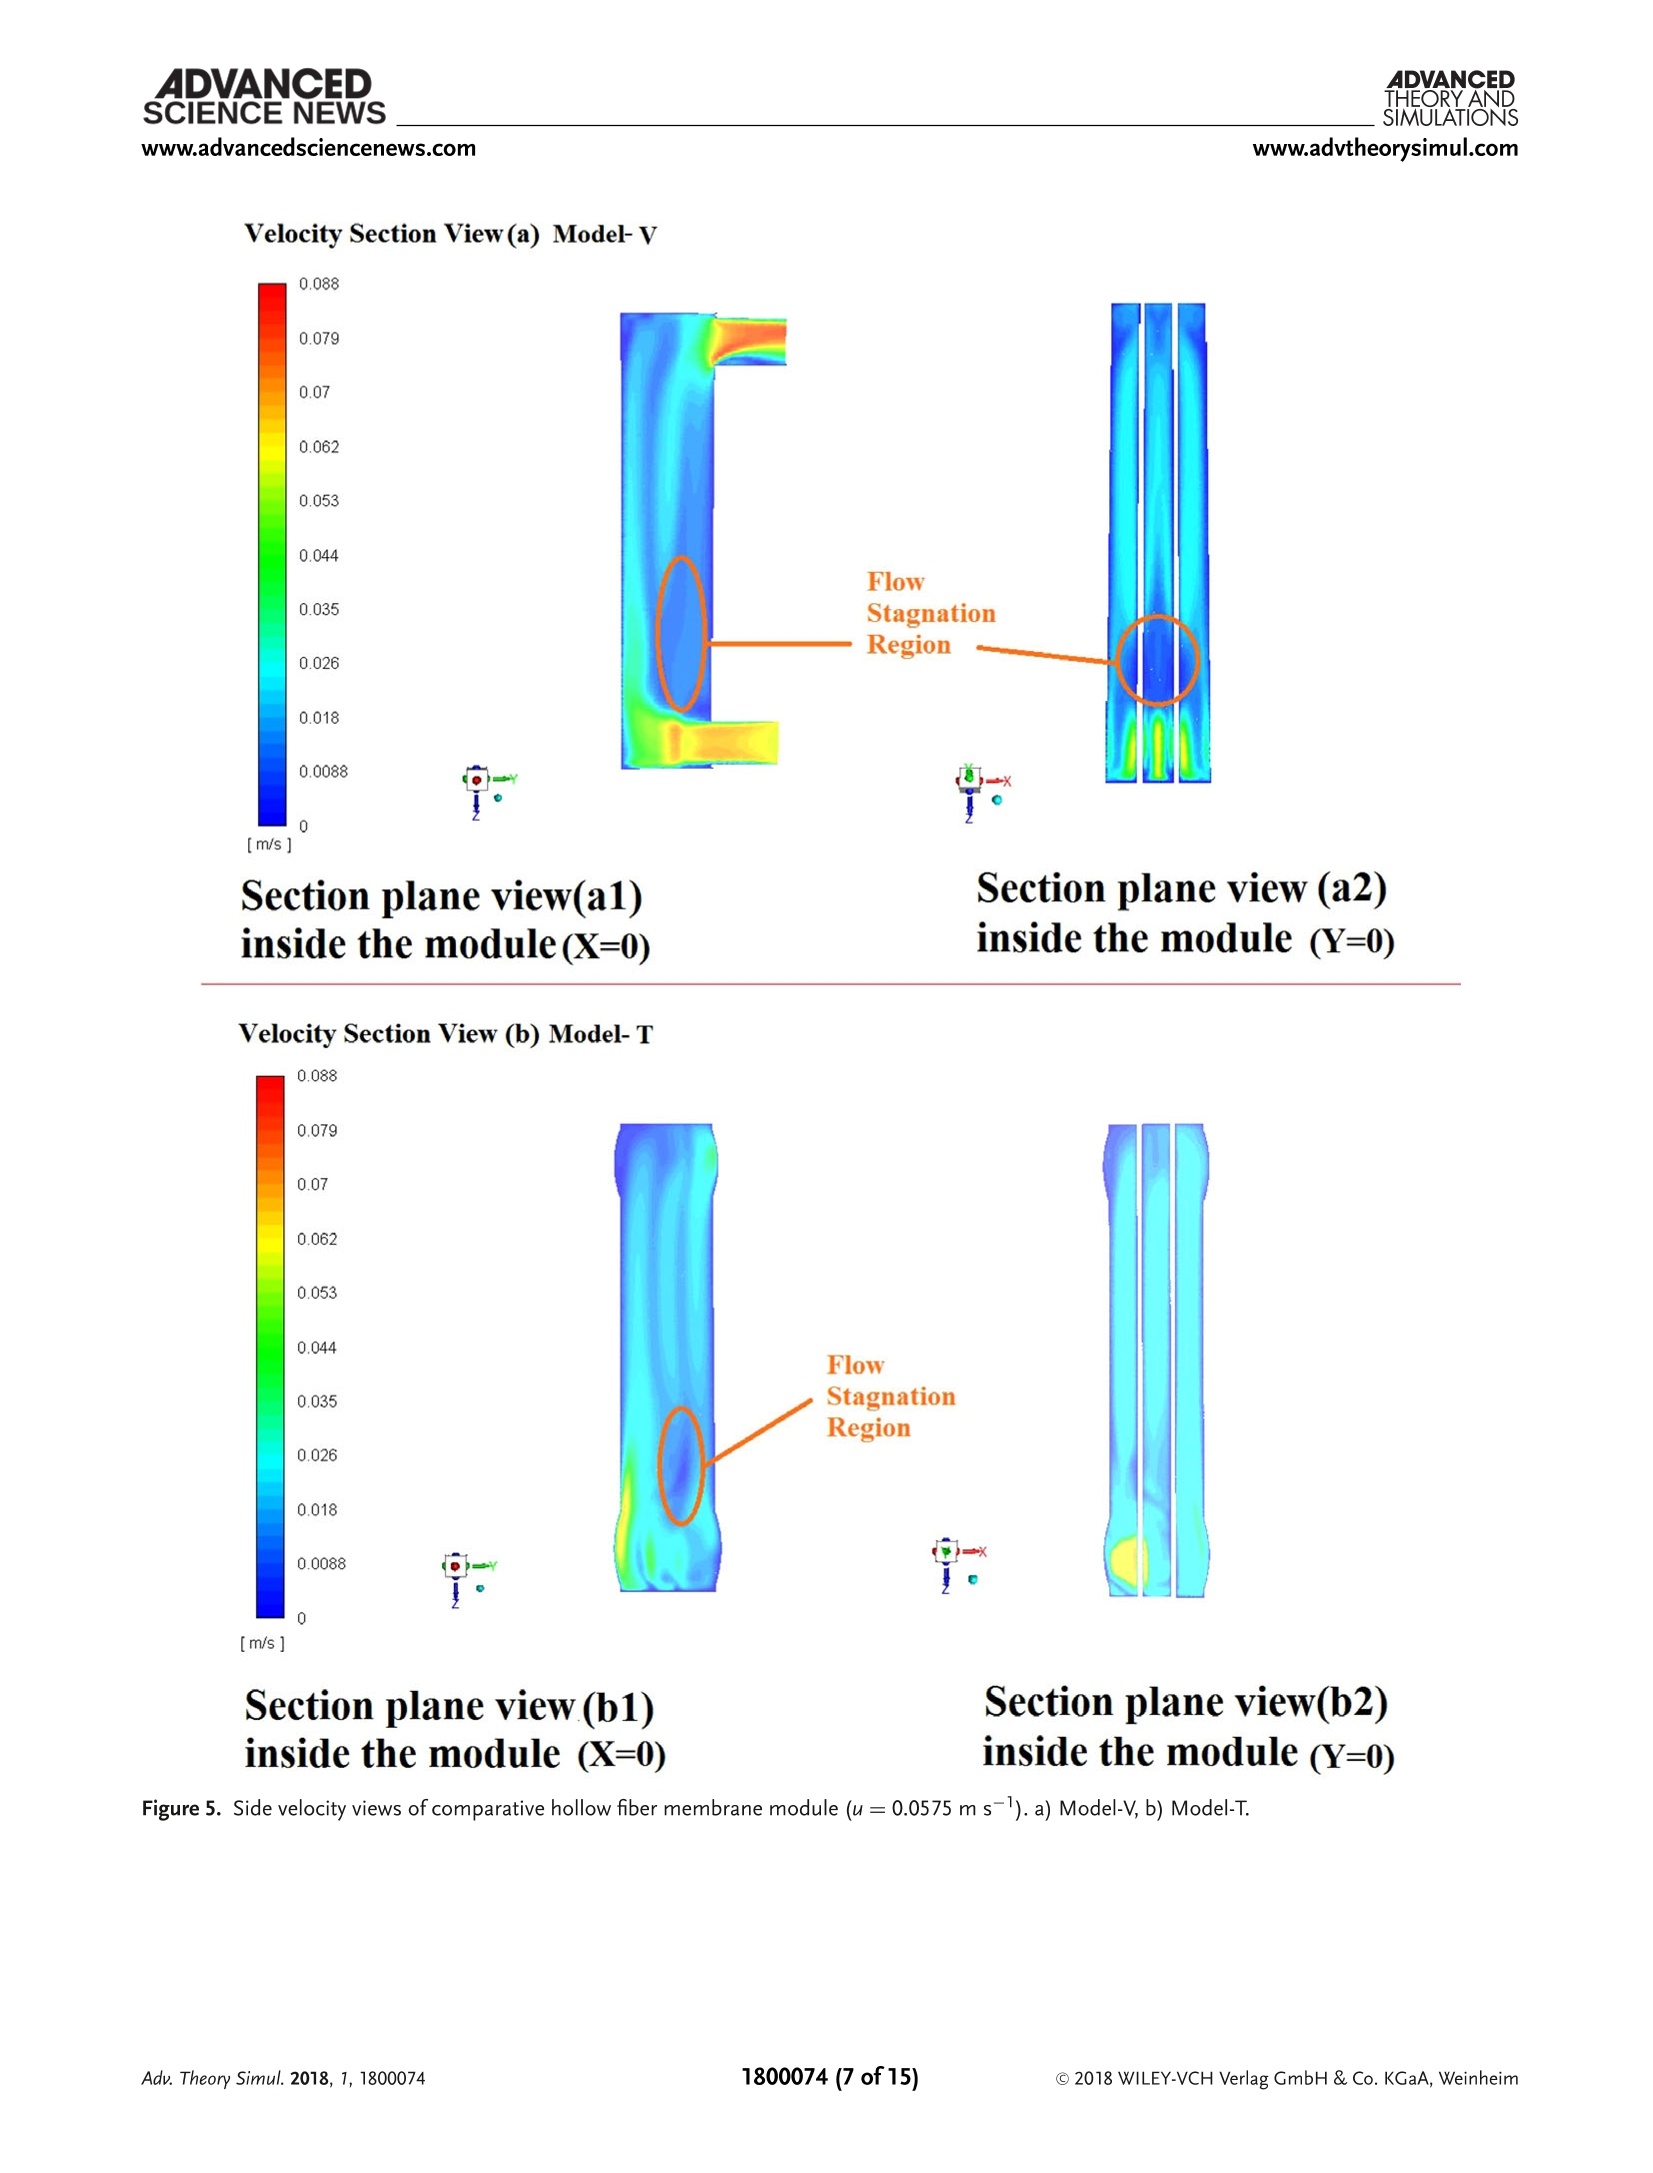
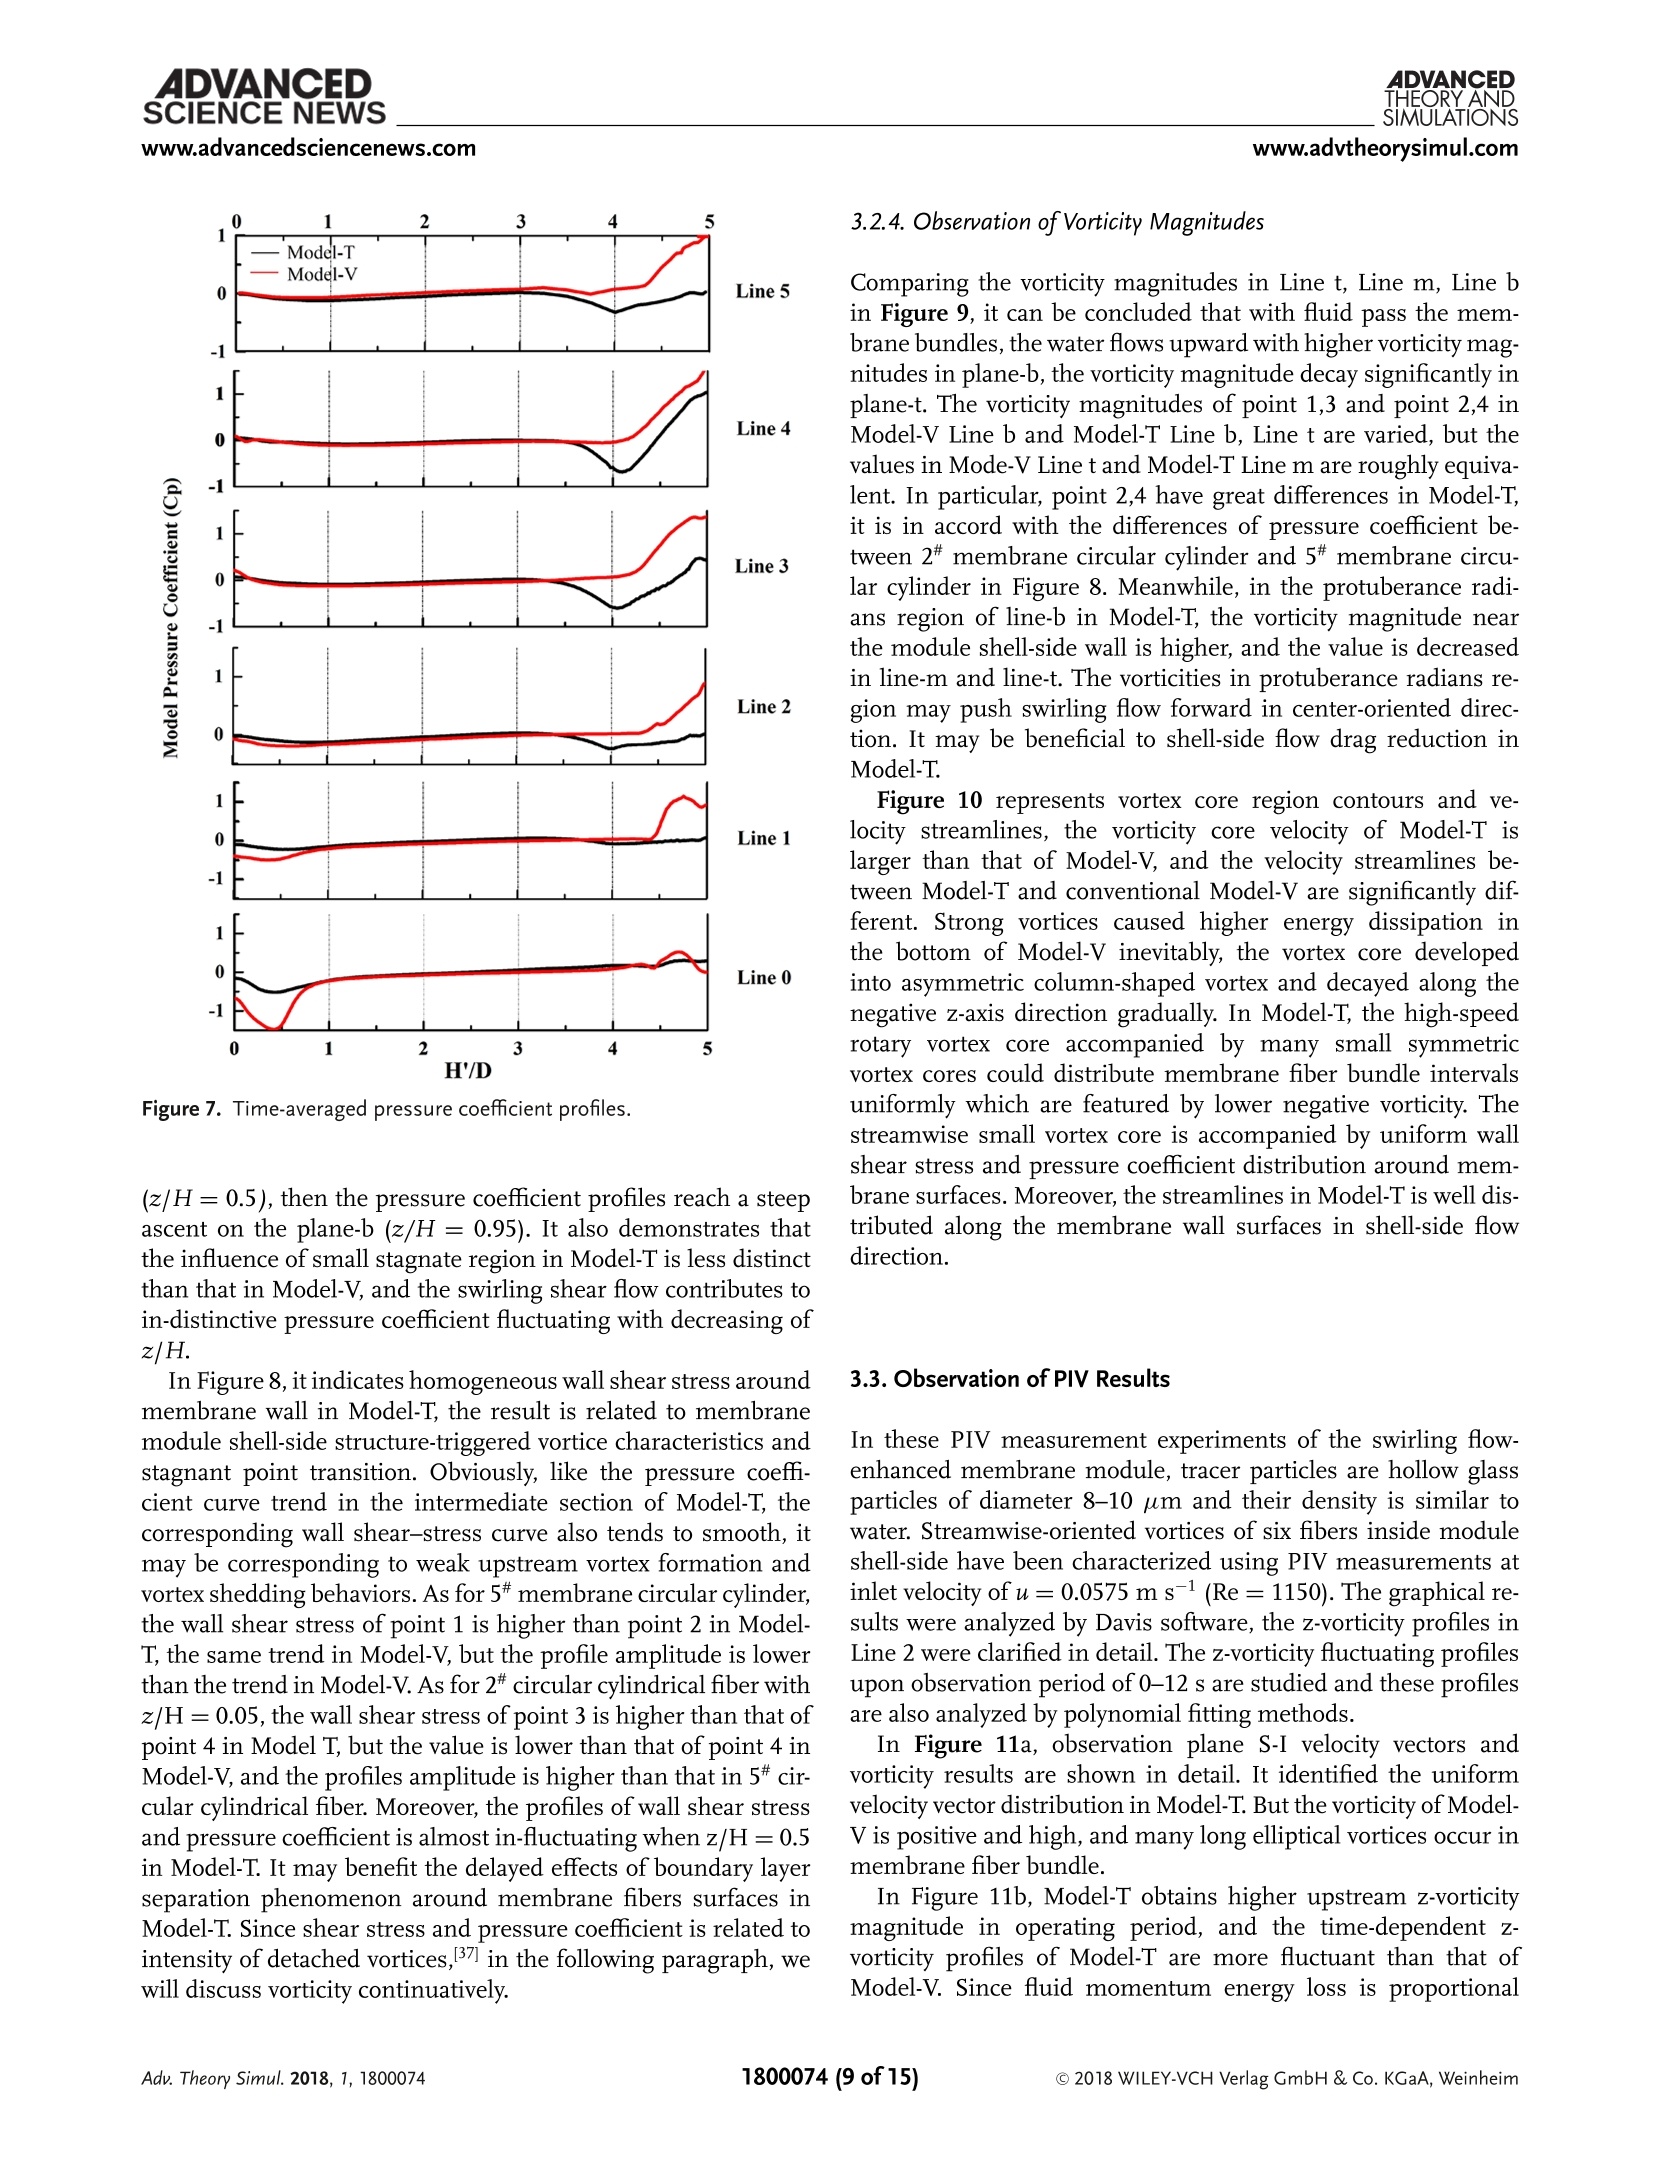
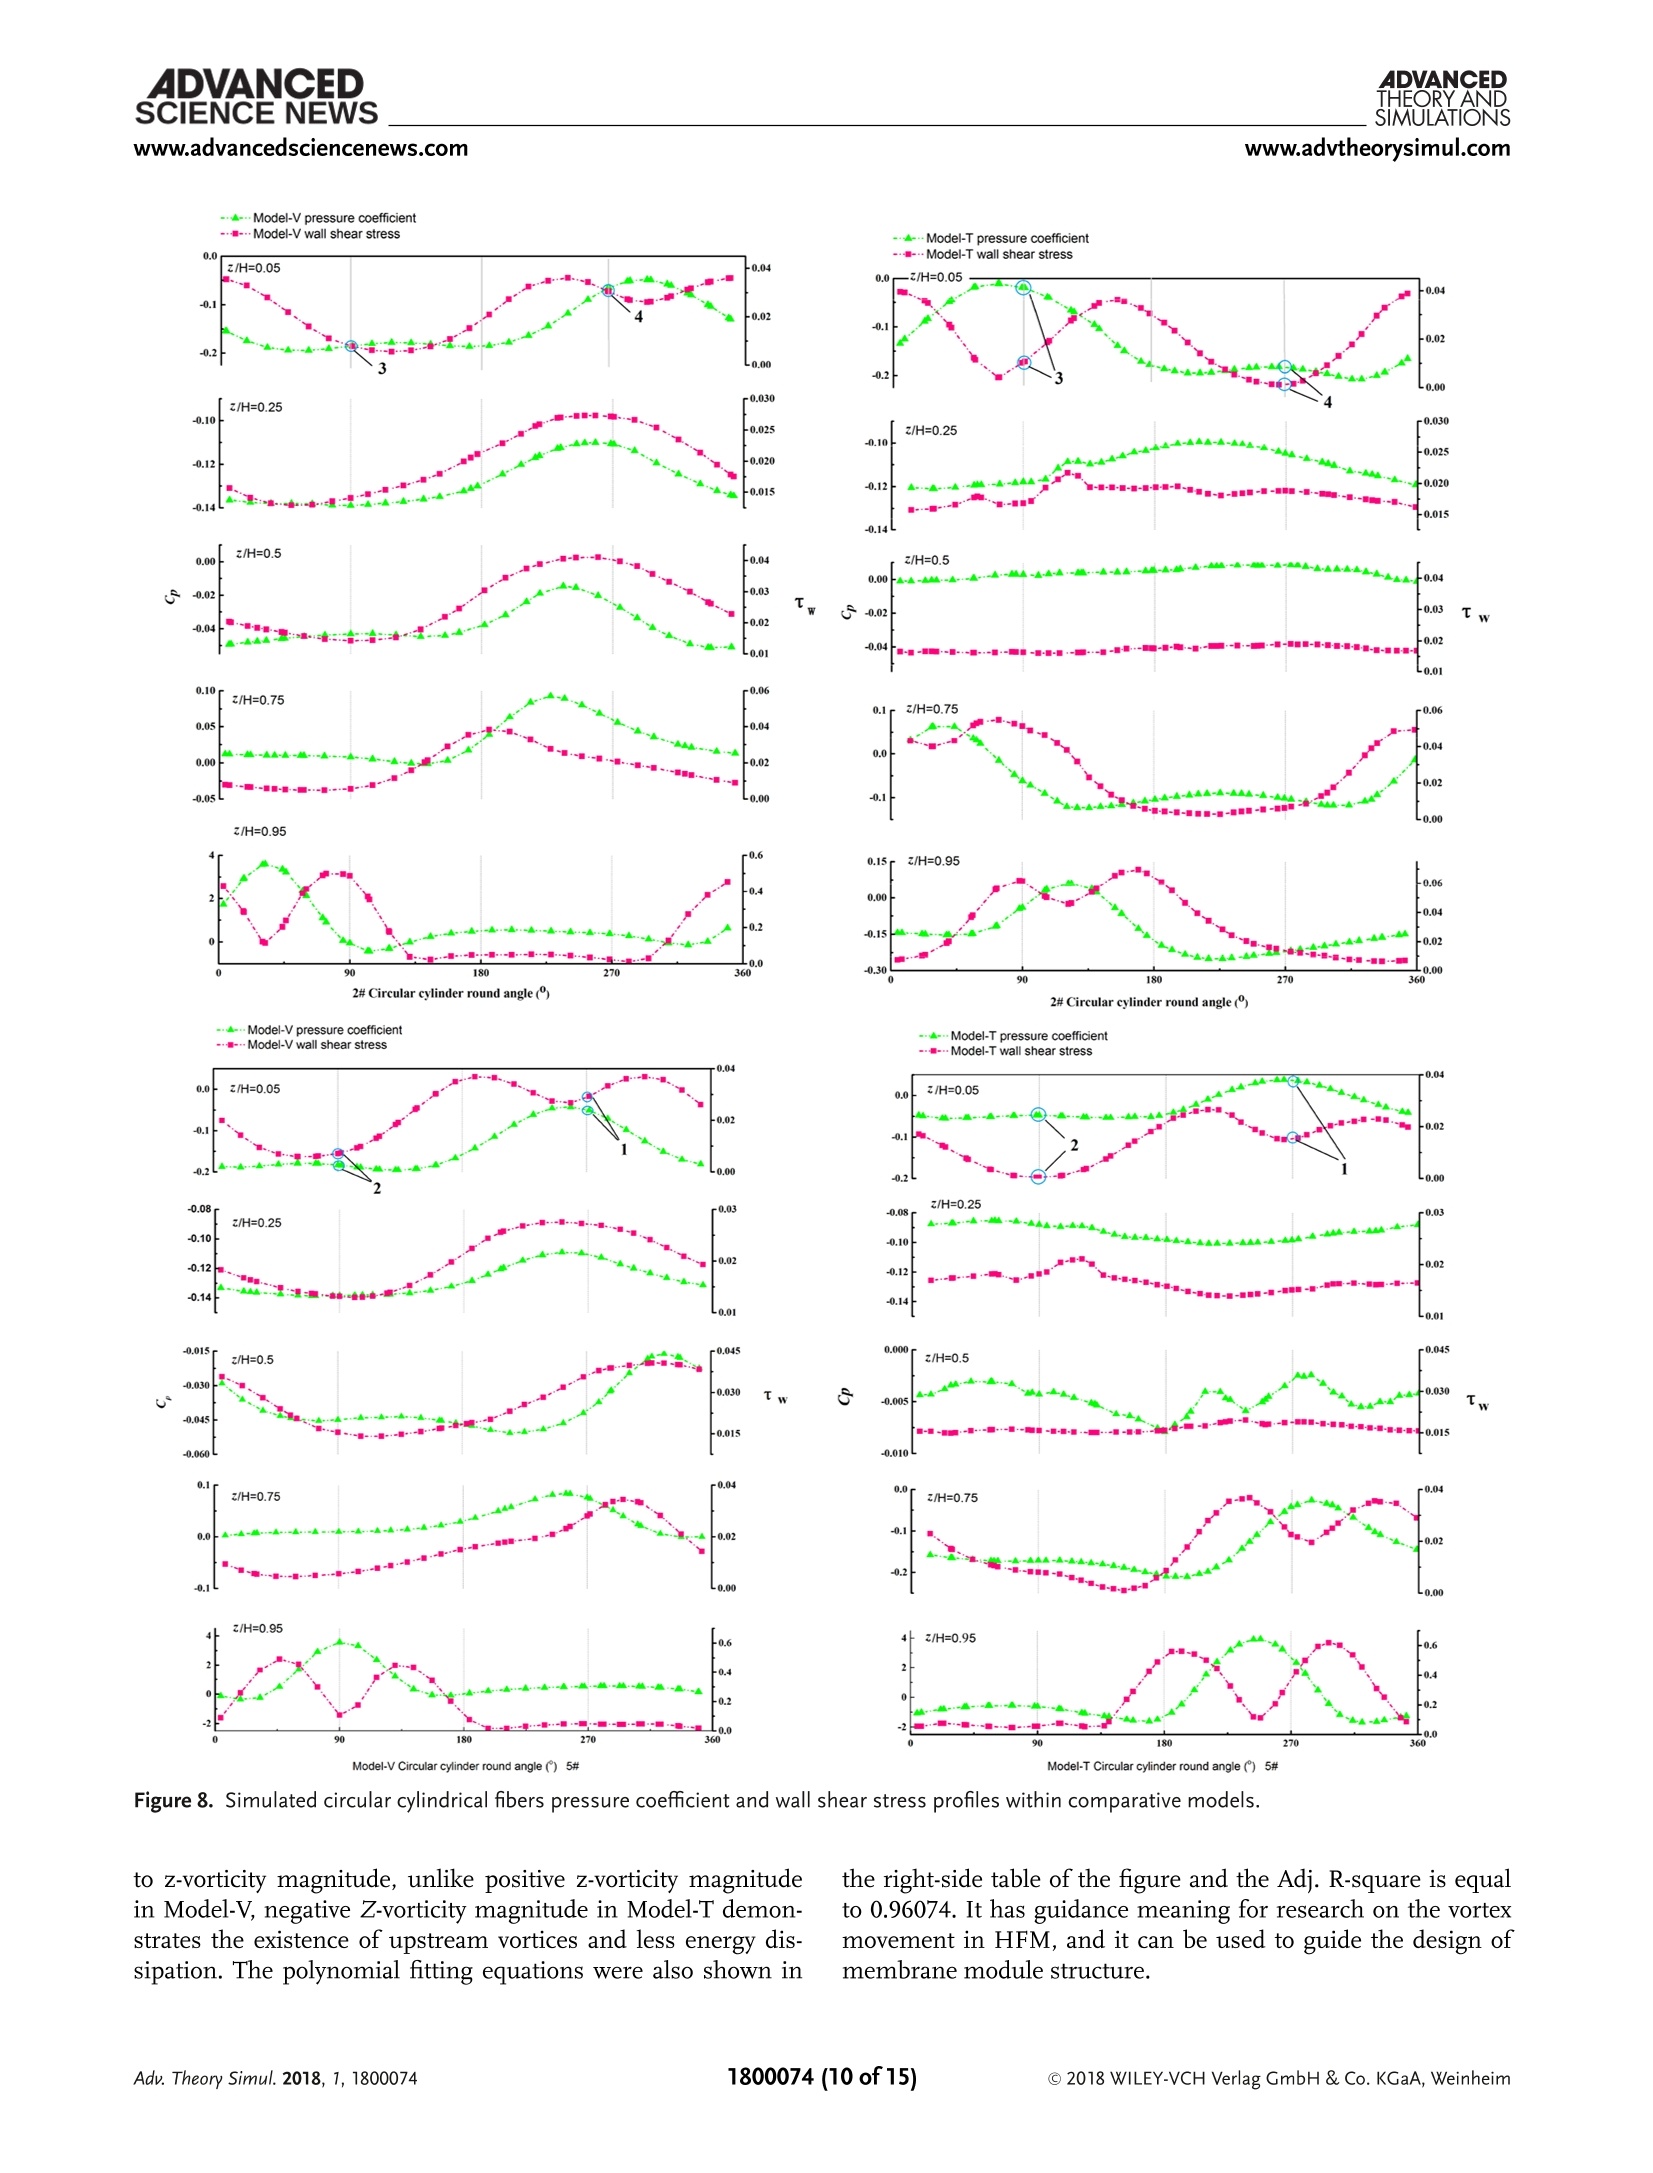
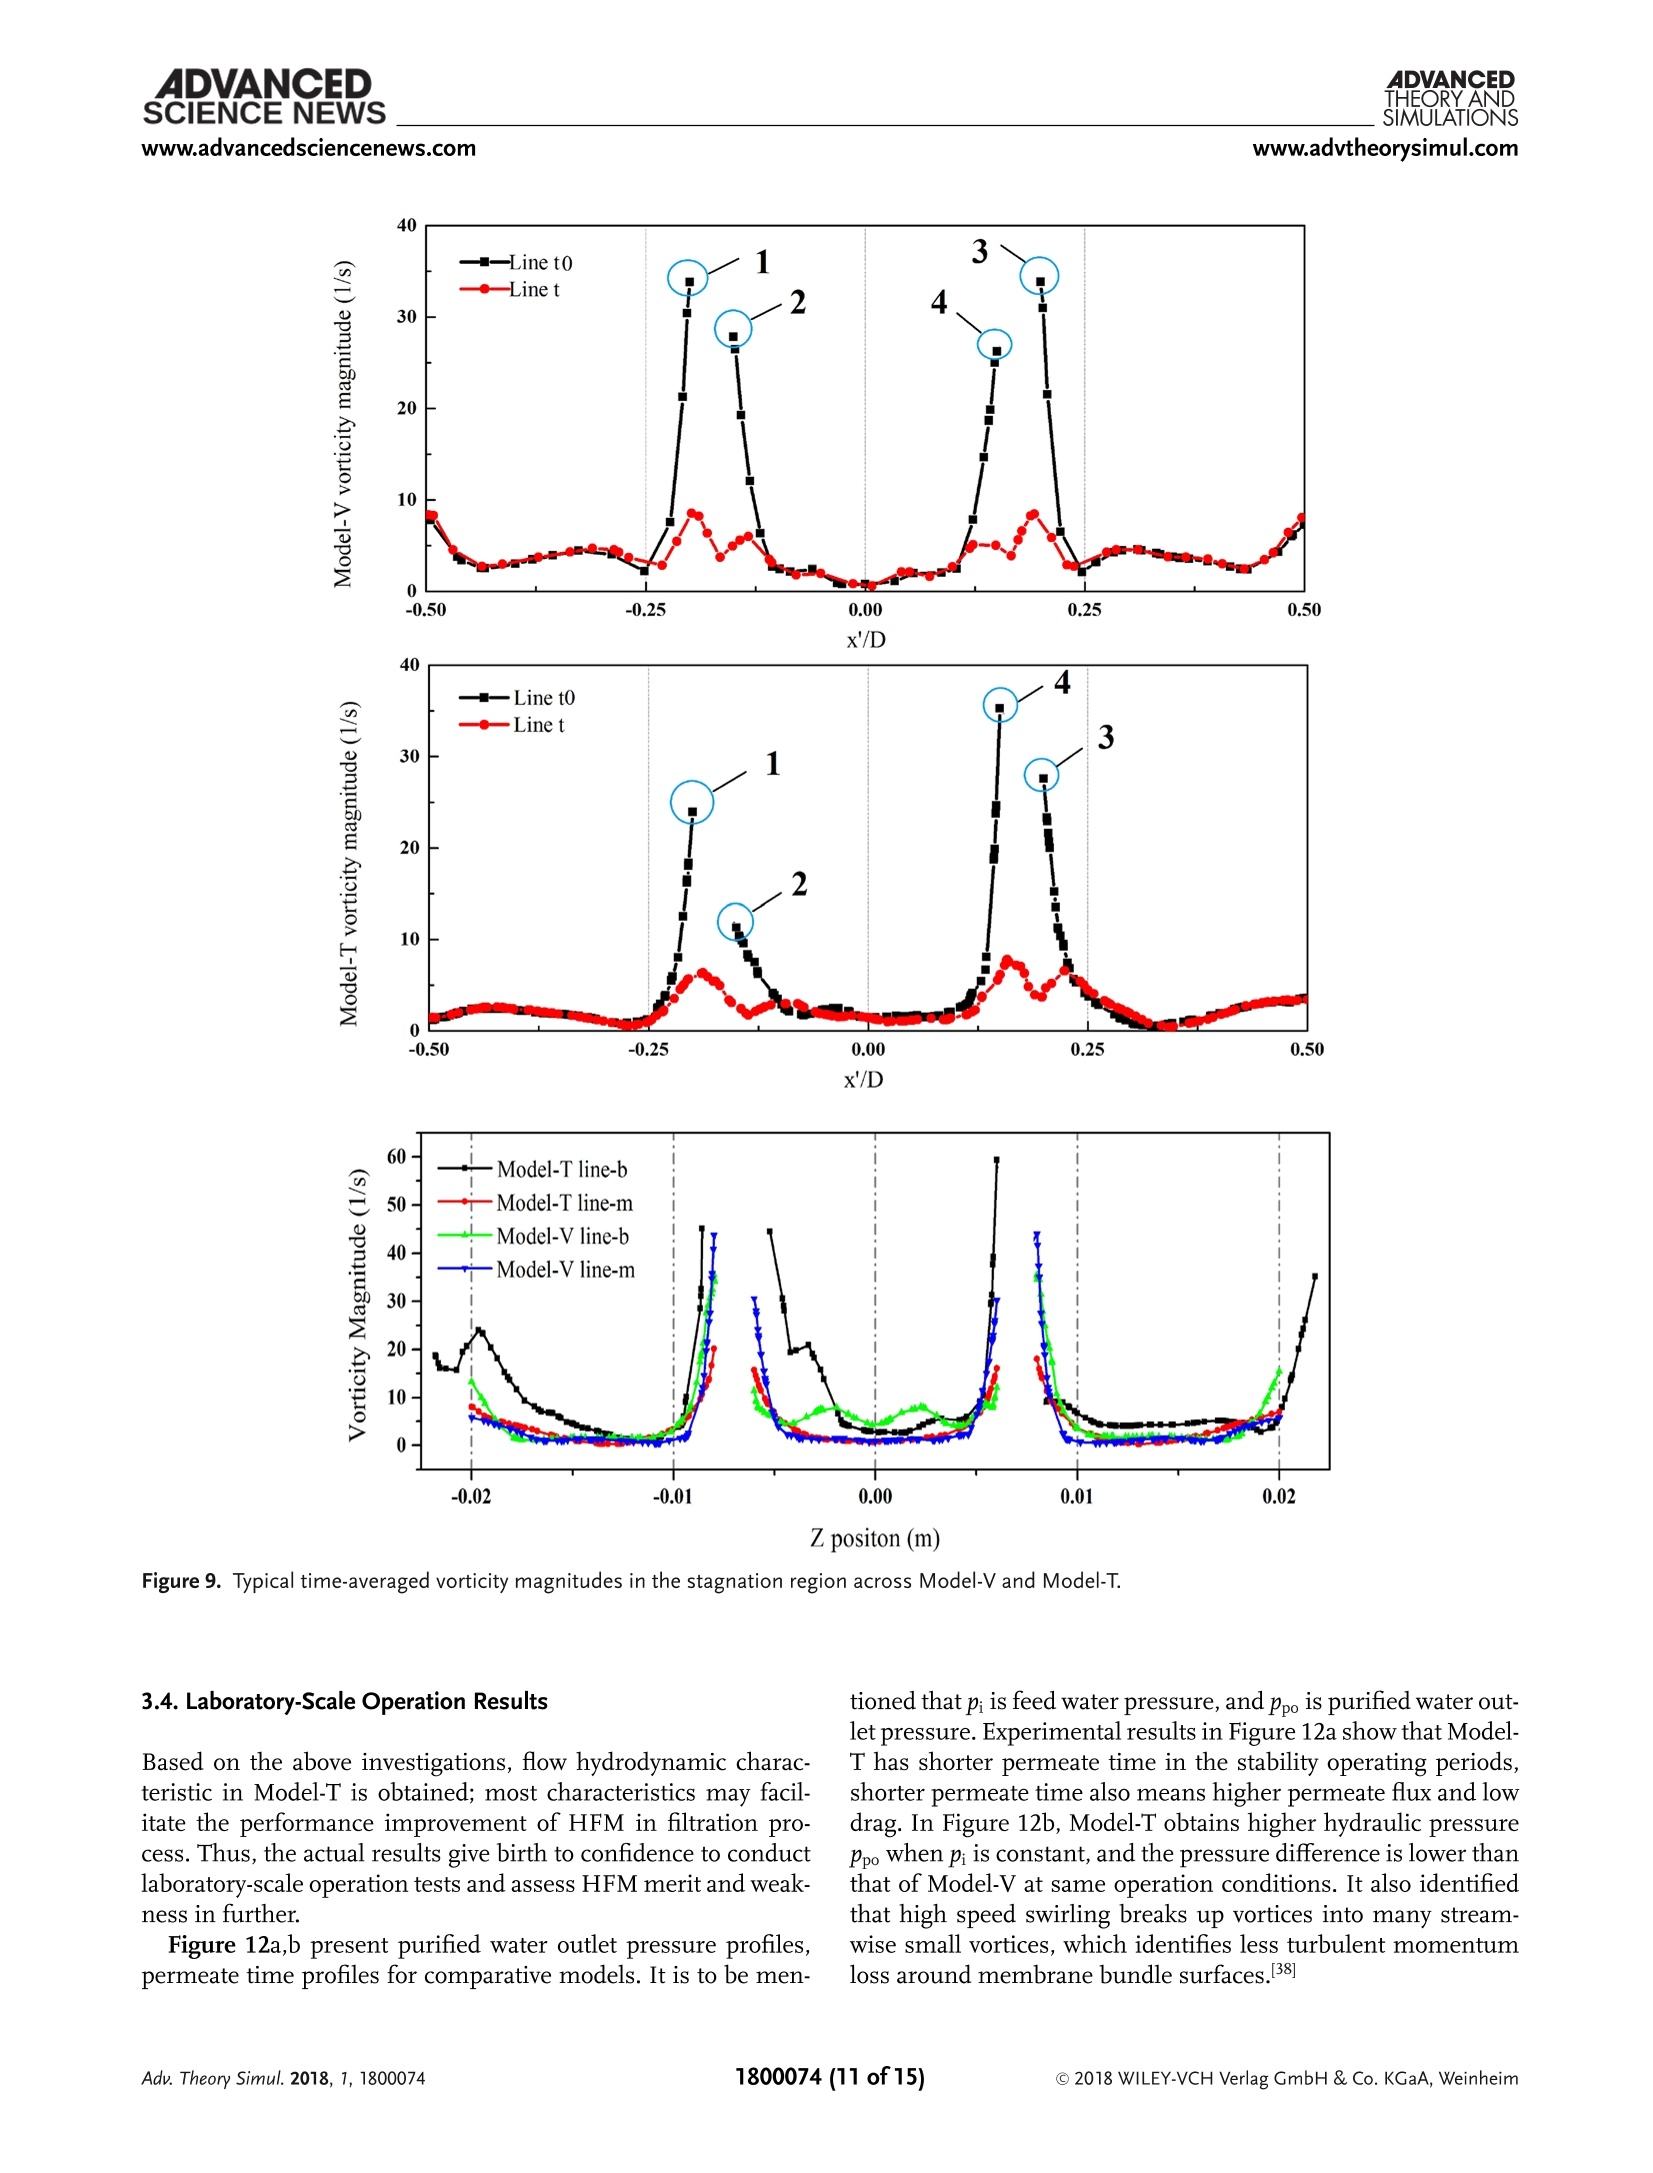
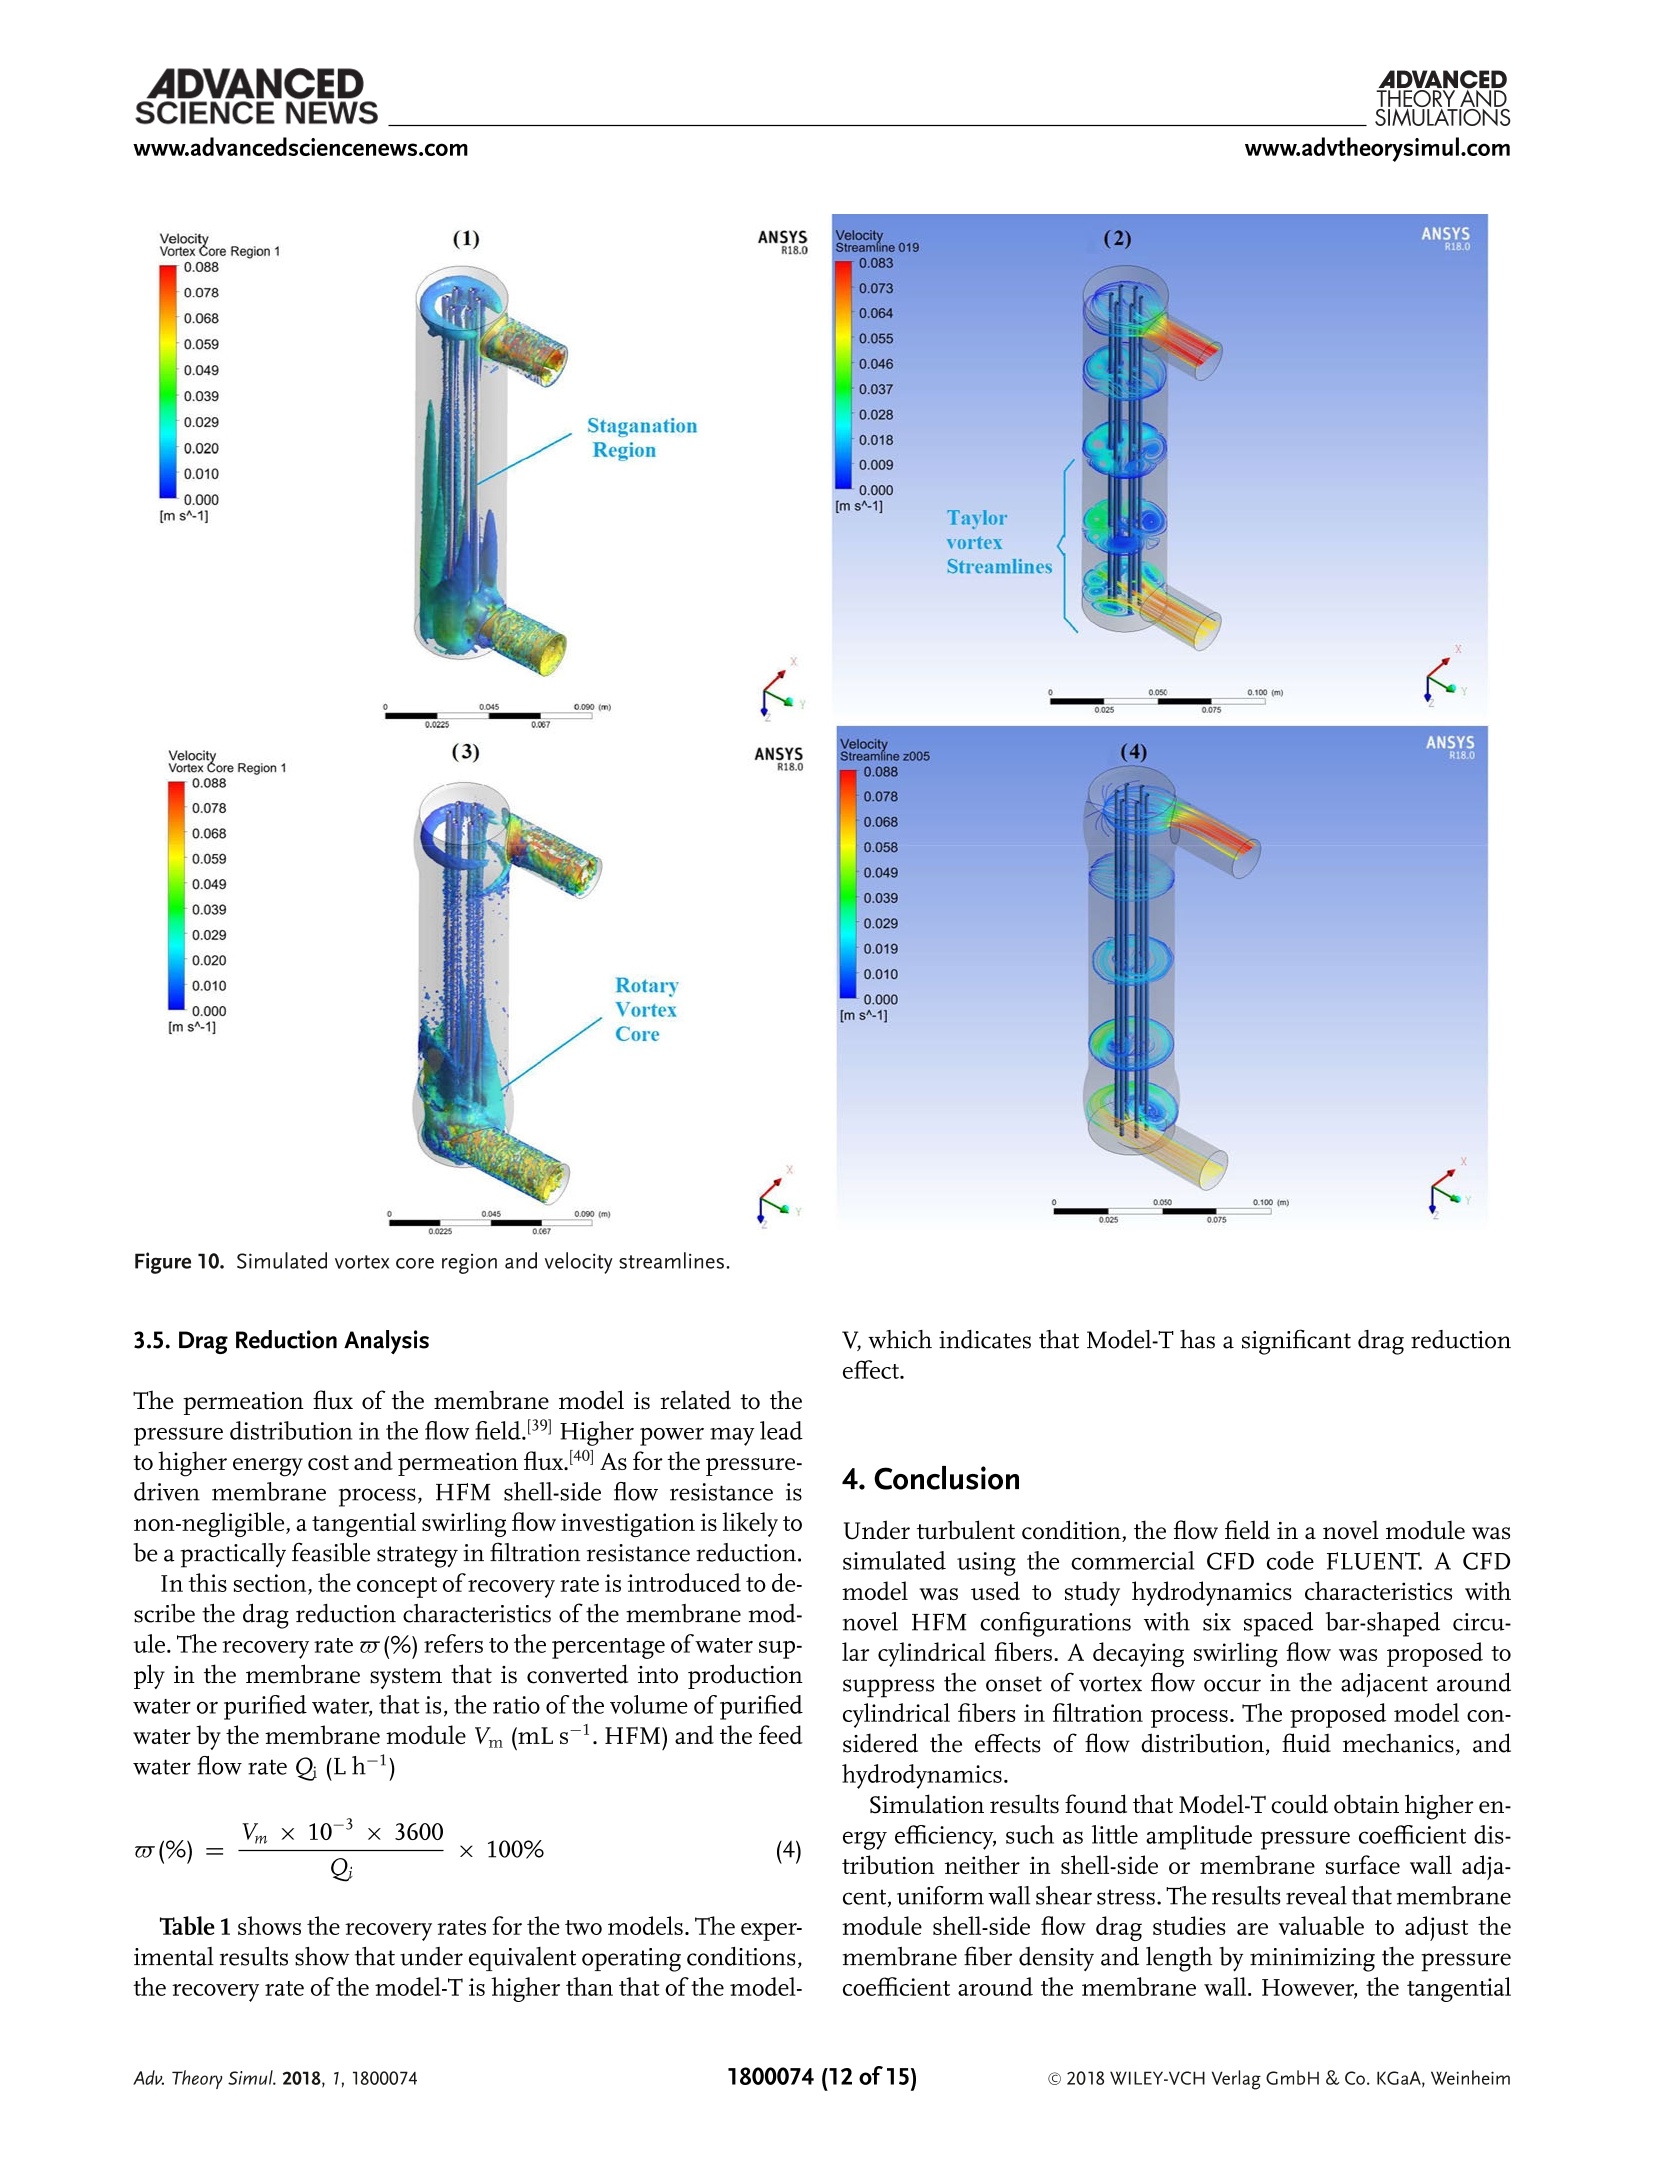
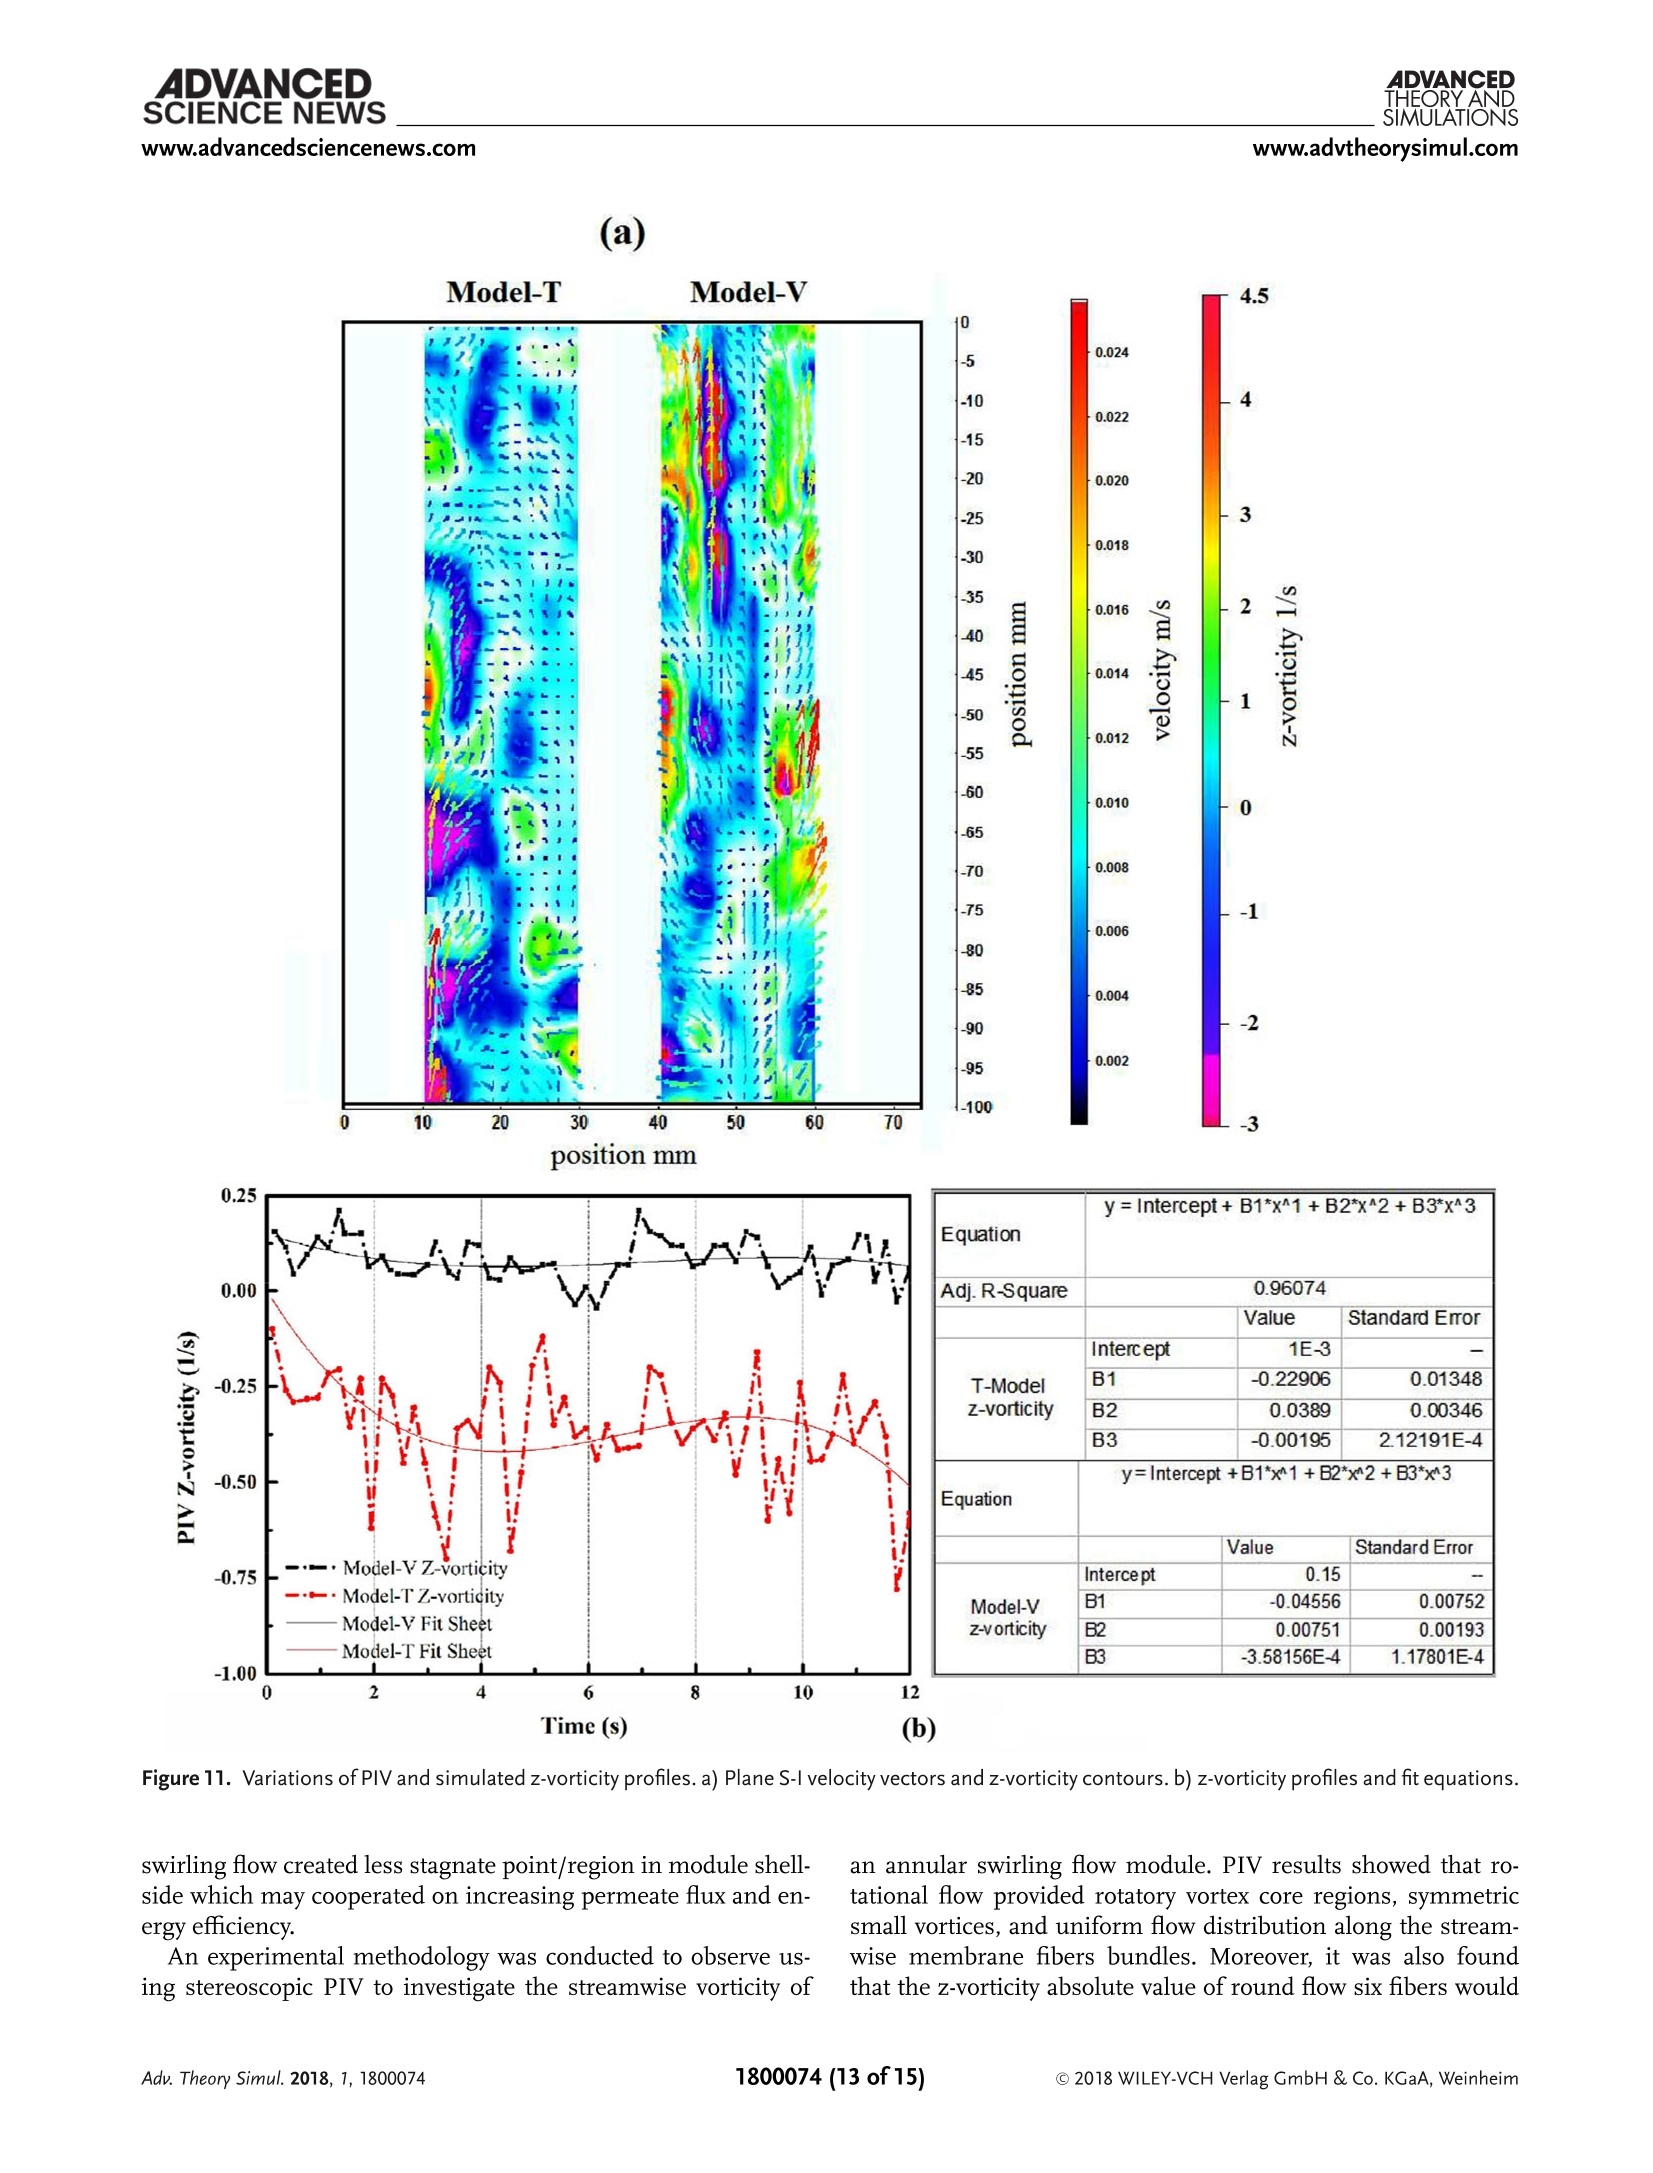
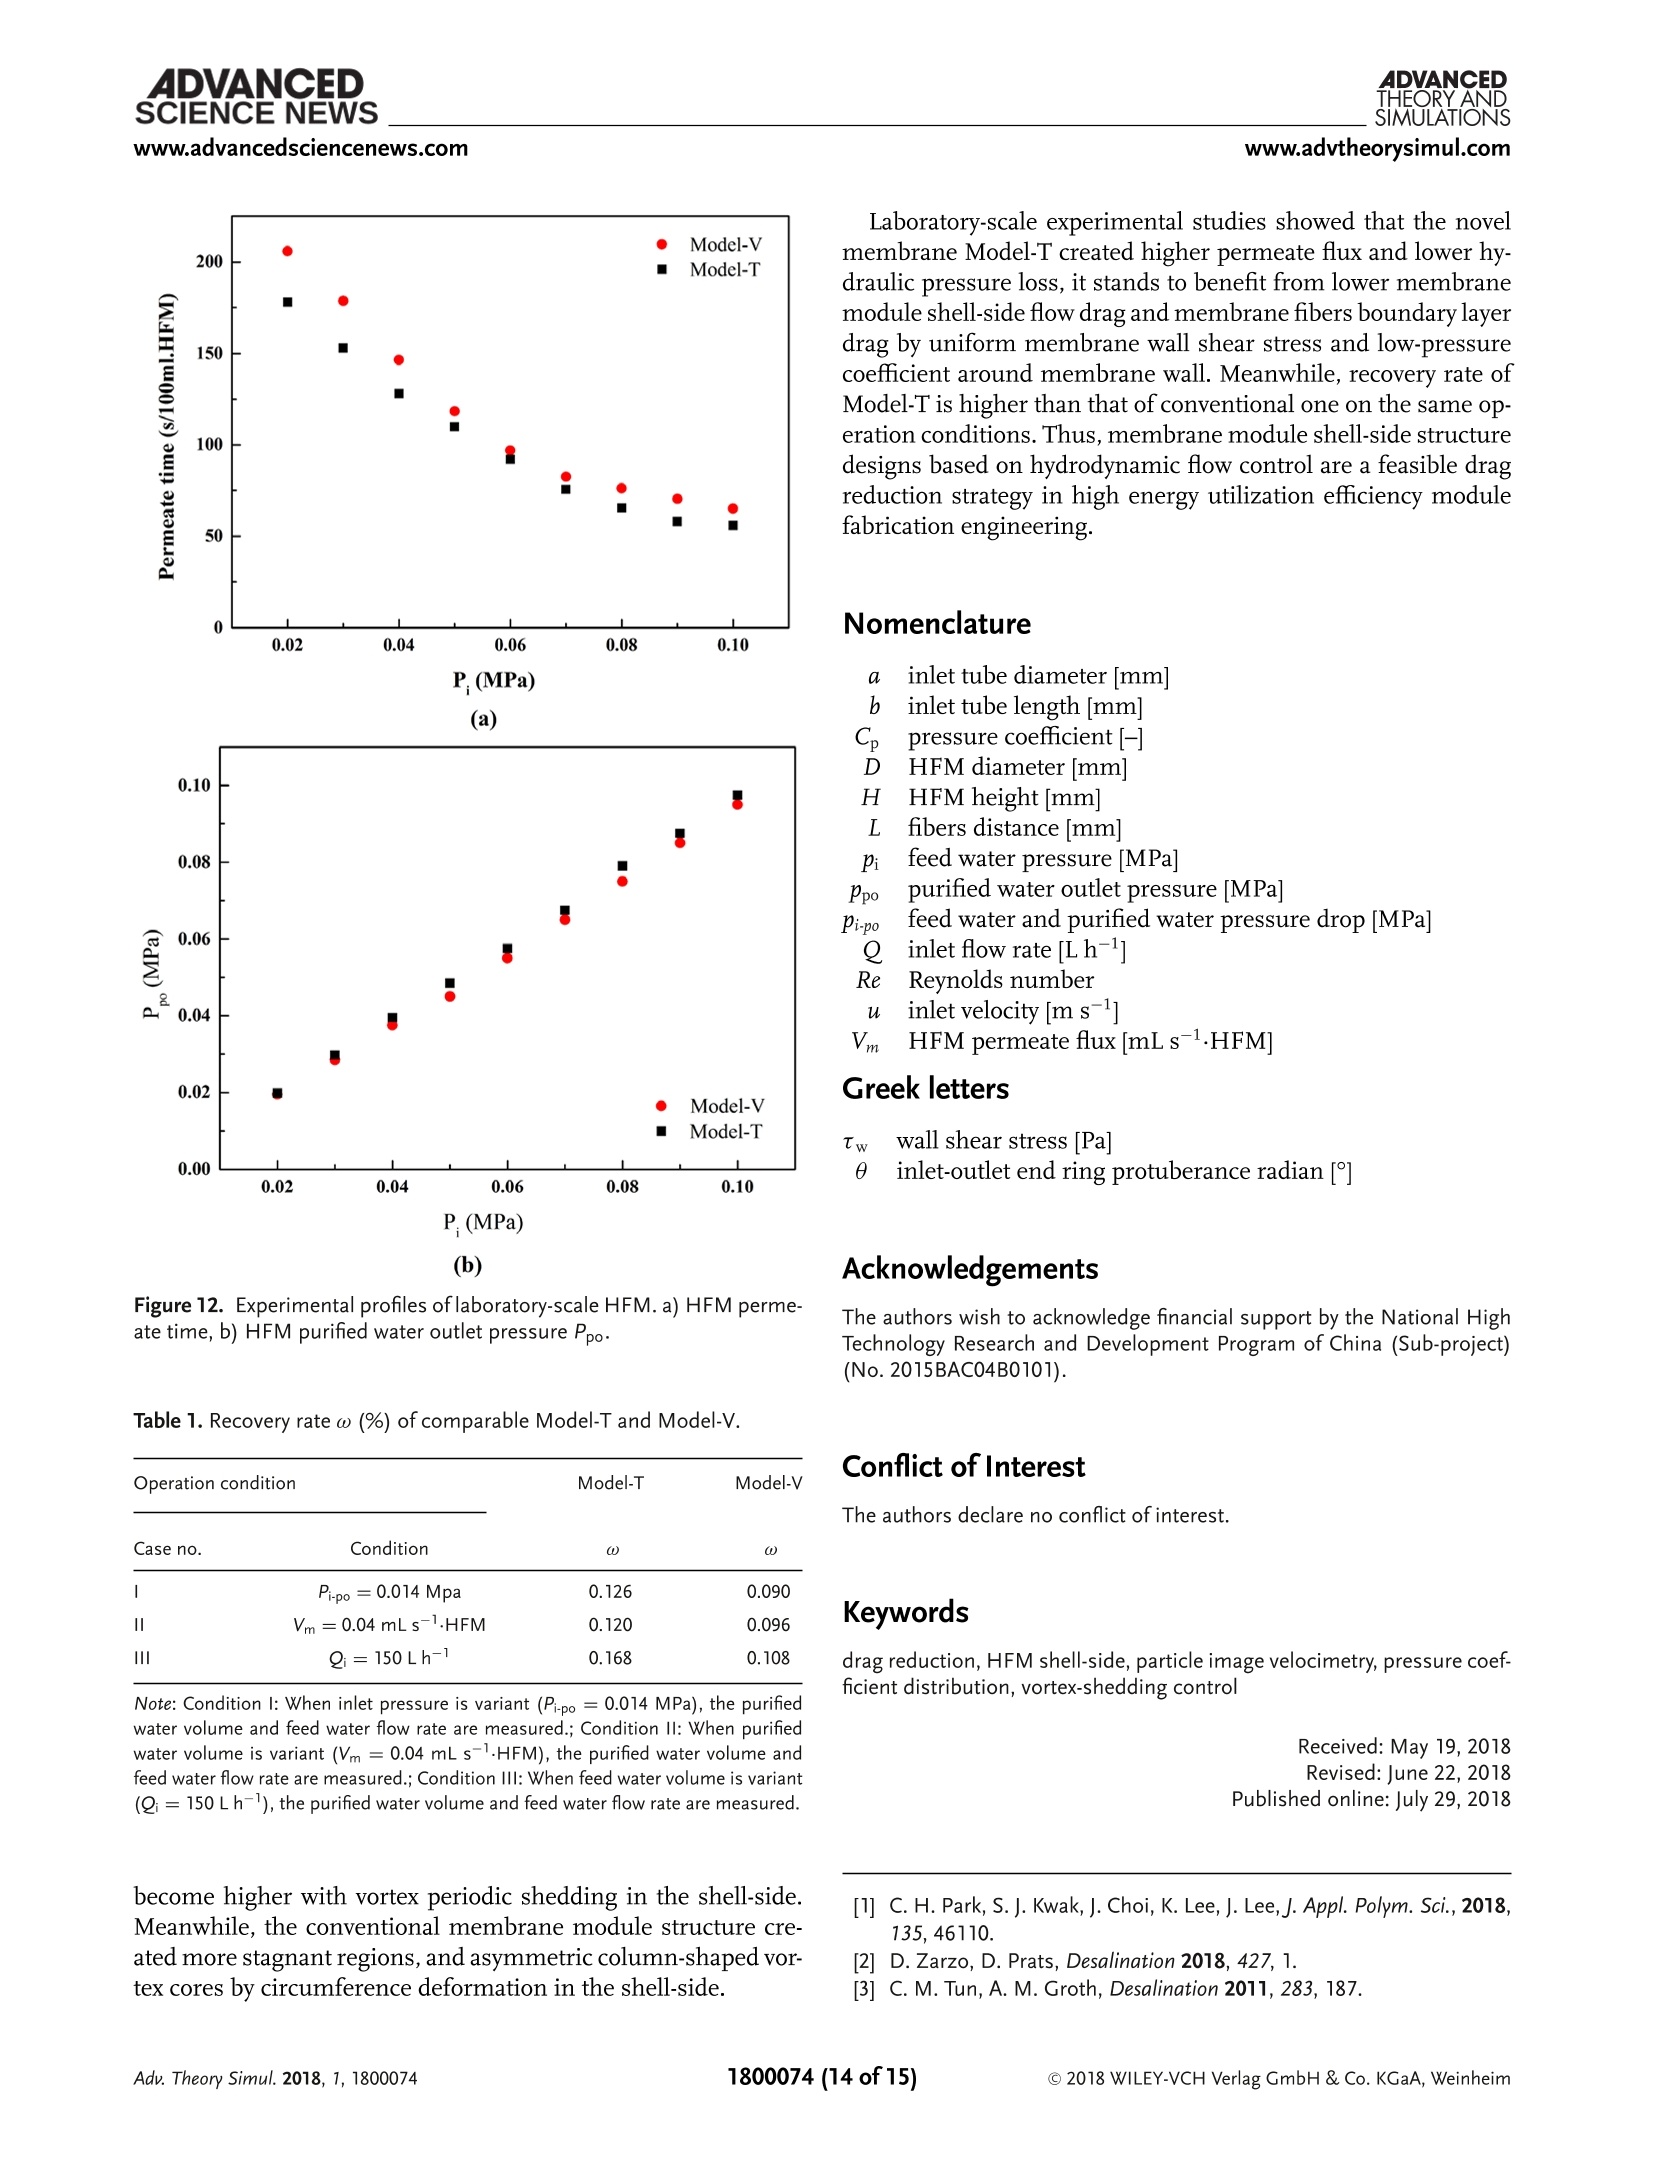
ADVANCEDTHEORY ANDSIMULATION:FULL PAPERwww.advtheorysimul.con. ADVANCEDADVANCEDTHEORY ANDSIMULATIONSSCIENCE NEWSwww.advancedsciencenews.comwww.advtheorysimul.com Investigation on Drag Reduction Characteristicsand Shell-Side Hydrodynamics in Hollow FiberMembrane Modules Ting Zhang, Kai Guo, Chuanxi Li, Yue Li, and Chunjiang Liu* A novel hollow fiber membrane module shell-side model is fabricated,simulated, tested, and analyzed. The mathematical model consistsof a six spaced bar-shaped fiber and a vortex-control tangential entrancewith protuberance radians. The vortex shedding behavior is capturedby the digital particle image velocimetry technique. The velocity vectors andvorticity fields are analyzed experimentally. Meanwhile, the k -e turbulentmodel is established to identify the flow stagnate point/region transformation.Investigation of wall shear stress and surface pressure distributions aroundcircular cylindrical fibers illustrate the mechanism of drag reduction tentatively.Afterward, the novel optimization module produces higher recoveryrates of up to 1.56 times as compared to that of a conventional module inequivalent filtration condition. It indicates that by means of a hydrodynamicsflow control strategy,the fabricated membrane module structurecould potentially improve energy utilization efficiency in filtration processes. It is a multidisciplinary strategy of hydro-dynamics, fluid mechanics, and computingscience. However, the development of effective membrane modules design methodis always constrained by commercializa-tion technology secret protection.I8,9 Knowl-edge and experiences in novel membranemodules fabrication engineering remainlimited in the open literature.[10] Recently,some scholars identified that, hydrodynam-ics flow control in HFM shell-side canchange the flow drag over the boundary sur-face of the circular cylindrical fibers wall[11-13] and can improve energy utilizationefficiency in separation process.[14 Yanget al. optimized the membrane modulecomplicated shell-side fluid flow by shell-side design.[15] They also found that non-paralleled membrane fibers with transverseflow eliminate filtration stagnate region. 1.Introduction As a pressure-driven separation process, membrane-based seawater desalination module is a crucial device of industrialprocesses. Yet, it suffers from the issue of energy consump-tion (represents >50-60% of total costs),2 since the separationperformance cannot be significantly increased and even a smallincrease in separation efficiency results in great energy losses.Many researchers made efforts to fabricate hollow fiber mem-brane material structures to decrease membrane resistance, suchas optimized fiber porosity, fiber woven type, and fiber sieve spac-ers, etc.4 However, there is a flow drag characteristics in hollowfiber membrane module shell-side and membrane fiber surfaceswhich has usually been neglected to a certain extent.5] Optimizing the design of various arrangements in the filterchannelis crucial to industrial membrane module fabrication en-gineering for creating turbulence to reduce flow drag forces. ( Dr. T. Zhang, Dr. K. G uo, D r . C . L i , Y. LI, Prof. C. LiuSchool o f Chemical Engineering and Technology T ianjin University ) Tianjin 300072, P.R. China E-mail: cjliu@tju.edu.cn Dr. T. Zhang,Dr. K. Guo, Dr. C. Li, Y. LI, Prof. C. LiuState Key Laboratory of Chemical EngineeringTianjin UniversityTianjin 300072, P.R. China DOI: 10.1002/adts.201800074 Moreover, flowing shell-side water is featured by continuousenergy source. 16 Flow energy behind circular fibers is "con-centrated" in the wake region, 17 a common guiding ideologyadopted in fluid drag reduction is to suppress or even avoid gen-eration ofthe asymmetric vortex shedding around cylinders. 18,19Zhou et al.l20] studied circular cylinder with dimpled surfaceround flow in the Reynolds number= 7.43 ×10-1.798× 10*.The study showed that the cylinder with uniform dimples coulddecrease 10% drag coefficient compared with a smooth cylin-der. Flow structures obtained by digital particle image velocime-try (PIV) identified that dimples contribute to vortex sheddingstrength around the cylinder. But to reduce the flow drag in HFMshell-side free stream, it might be able to control vortex shed-ding in the module shell-side to decrease stagnate points/regionsand delay boundary layer separation around bar-shaped cylindri-cal membrane fibers surfaces. Generally, using a high shear regime to suppress energy lossand cut off module production cost is a moderate module en-hancement technique.21 Inducing of swirling flow mode (vortexflow mode) can not only strengthen filtration performance sig-nificantly by the mechanism of shear, but also can change vortexshedding behaviors, thus it could affect a change of flow dragand decrease membrane energy loss.[22 Wang et al. studied thegeometric parameter design and the optimization of the tubu-lar membrane module in tangential swirling flow.23] They iden-tified the optimized rotary structure can improve the form of ve-locity field distribution in the separator and increase membrane permeate flux. Recep et al. studied the relationship among theinlet-outlet type, the wall shear stress on all membrane moduleshell-side, and the pressure drop, and they reported that the ef-fects of membrane permeate flux and fiber inner fluid flow onshell-side fluid field are negligible upon the shell-side simula-tion investigation.[24] They disclosed that tangential inlet-outlettype has swirling flow characteristics, the velocity distribution ofmodule shell-side is uniform, and the dynamic (hydraulic) pres-sure drop is similar to that of conventional type. However, theeffects of wall shear stress and pressure coefficient distributionaround membrane fiber surfaces and vorticity in fiber bundle in-tervals which are related to flow drag reduction mechanism arenot illustrated. In this study, a swirling flow membrane module shell-sidemodel with a ball protuberance radial annular zone was pro-posed, and the investigation’s aim was to contribute towarddrag reduction module fabricating engineering and overcome thenonuniform flow distribution problems in module shell-side. Be-sides, in this study, six spaced cylindrical bar-shaped membranefibers were constituted, and the drag and wall shear stress dis-tribution around membrane fibers wall surfaces were analyzedcarefully. The present work explored hydrodynamic characteristics inHFM shell-side by both PIV and computational fluid dynamics(CFD) numerical techniques. First, the velocity field, pressurecoefficient, and wall shear stress distribution were studiedby establishing a CFD model.Detailed flow fields simulationis conducted to investigate the drag reduction characteristicsaround a circular fibers group along the upstream direction.Secondly, vortex shedding behaviors and vorticity distributionwere measured by PIV experiment measurement method.Finally, laboratory-scale filtration experiments were conductedto assess hydrodynamic merits and recovery rate of the novelstructural membrane module. The mechanism of drag reduc-tion for the fabricated membrane module structure is analyzedtentatively. 2. Experimental Section 2.1. Mathematical Model and Simulation Approach A simplified HFM shell-side model could predict membranemodule shell-side hydrodynamics performance and drag reduc-tion characteristics; it is meaningful to guide membrane moduledesign. Figure 1a shows a novel HFM shell-side model. It includesa ball protuberance radial annular zone, tangential inlet/outlet,and a cylinder group by six circular cylindrical fibers with spe-cific packing density. The feed water inlet tube is placed on thebottom side of the module and the concentrated water outlet tubeis placed on the upper side of the module. The PIV observation re-gion S-I and lines list of the module, a top view of shell-side inlet-outlet configuration design are shown in Figure 1b. The diameterof inlet-outlet tube equals to each other and the inlet/outlet tubeare located over the ball protuberance radial annular respectively.Figure 1c indicates the six cylindrical fibers positioning and num-bering diagram, fiber distance L equals 9 mm, fibers distance L’equals 16 mm, and single fiber diameter equals 2 mm. For in- vestigating the fluid field characteristic, six different lines (Line0-5) in Z-direction and four different lines (Line t, Line t0, Lineb, Line m) in X-direction were defined. The governing equations for simulation is based on Newto-nian and Navier-Stokes equations.25] As for turbulence model,the well-known RNGk-e model is used in the study, and thekinematic eddy viscosity, turbulence kinetic energy, and dissipa-tion rate are deduced by The closure condition and coefficients are computed by The RNG k-e turbulent model is employed for its accu-rate prediction of the rotating and swirling flows.[26 The soft-ware package (FLUENT 18.0) is used for CFD simulation, andthe RNG option includes swirl-dominated flow by unsteady sim-ulation, the time step size is 0.001 s, the simulation step is10 000. Enhanced wall treatment for the k - e equation is cho-sen to resolve the viscous sublayer in low Reynold number situ-ation. The pressure-velocity coupling is employed via the SIM-PLEC algorithm, and the convective terms are discrete by asecond-order upwind scheme. And the ICEM CFD 18.0 softwarewas used to mesh comparative models, tetrahedral unstructuredgrids were refined around the six bar-shaped circle cylindricalfibers. In the simulation study, liquid type is water and liquid den-sity is pw = 998.2 kg m-, and inlet flow velocity is equalto u=0.00575 m s-(Re = oua一=998.2×0.0575x0.02 = 1150),1×10'Through mesh independence validation, the overall grid nodenumber was about 5 000 000, and we recognized the operat-ing time is from 0 s to 12 s. In Re = 1150, the operationperiod ensures the feed flow discharge to the upper outlet inshell-side, and thus reliable flow hydrodynamic results could beobtained. When fluid flow passes circular cylindrical fibers, unilateralfibers constitute turbulent vortices backwardly.271 And stochas-tic vortices formation and shedding increase the fluctuates ofpressure coefficient, and unstable boundary layer results in fluidmomentum energy losses gradually.28] Considering the existenceof vortex core was due to the presence of a static pressure peakaround a cylinder, it would be necessary to determine the effect ofvortex shedding on the fluctuating pressure field. 29 In the study,the pressure coefficient can be used to explain some of the char-acteristics of the fluctuating pressure fields and vortex character-istics which are related to flow drag. Chen et al. [30] estimated the coefficients of the lift Ci anddrag forces Ca acting on the cylinder based on a dimensionless Figure 1. a) Hollow fiber membrane shell-side configuration (Model-T), b) six cylindrical fibers on module cross section, c) enlarged positioning graphof six circular cylinders. number of the pressure coefficient Cpi, which is defined by theequation zpupref And p, is the static pressure on the cylindrical test model, A0;is the angle difference between the incoming flow direction andpressure positional angle, O; is the directional angle of the pres-sure position. The incoming flow static pressure pref, density p,and velocity Uref are defined according to present operating con-ditions. 2.2. Apparatus Arrangement In order to investigate the HFM with tangential-inlet structure(Model-T), a vertical-inlet HFM shell-side model Model-V is pro-posed. Like Model-T, the feed water inlet tube is placed on the bot-tom side of the module and the concentrated water outlet tube isalso placed on the upper side of the module vertically, and otherparameters are same correspondingly. 2.2.1. Experimental Measurement Method PIV is a reliable measurement technique for obtaining local andinstantaneous velocity fields. 31 It is based on the tracing of flowg02tracer spatial displacement to calculate the flow velocity.32 Inthis study, a 2D PIV system (LaVision, German) is used to mea-sure velocity vectors and vorticity. LaVision follows its basic phi-losophy of intelligent laser imaging with the DaVis 8 softwareplatform. This PIV testing system and a 2D-plane S-I of modelswere established using a dual pulsed laser with the resolutionof 1396 ×1040 pixels, as shown in Figure 2a. CCD camera andlaser are controlled by a synchronizer. The time difference be-tween laser pulses separation is chosen as 40 000 us for velocityu=0.0575 m s- (Re =1150) in the measurements. The flowtracer is hollow glass particles, the particle density is 1500 kg m-and the average diameter is 8-10 um. PIV is an optical method of flow visualization B33], a transpar-ent membrane module outer-tube with six pieces of PMMA solidbars replacing bar-shaped hollow fiber membranes in HFM. Theorganic glass column is black, and its diameter is 2 mm. Six col-umn area in testing module shell-side model is 1.25 ×10-m².In PIV experimental system, Model-T and Model-V shell-sidestructure is shown in the right photo of Figure 2b, six circularbar-shaped PMMA cylinders are stuffed, the shell-side flow fieldsare observed by PIV. 2.2.2.Filtration Operation Tests In the laboratory-scale operation test, the feed water is distilledwater, the operation temperature is 20 °C. The experimental flowdiagram is similar to the schematic in Figure 2a. Inlet flow rateand corresponding inlet pressure are adjusted by a rotary flow- meter and the fluid transportation in filtration unit is imposed bythe centrifugal pump. To keep the coordinate between the sim-ulation conditions and operation tests conditions economically,six out-in hollow fiber polyacrylonitrile (PAN) membrane fiberswith a molecular weight cut-off (MWCO) of 50 kDa was chosen.The outer diameter of the PAN fiber is 2 mm, the inner diam-eter of the PAN fiber is 1.4 mm. The membrane area of the sixcylindrical fibers on testing module is also 1.25×10-m2. 3. Results and Discussion 3.1. Model Validation The simulation z-vorticity results of Line 2 were compared withPIV experimental results, and these results obtain good agree-ment in Figure 3. It presents that the z-vorticity magnitude ab-solute value in Model-T is higher between observation region S-Iof position z=0.120-0.165 m, and the value is lower betweenobservation zone of position z=0.065-0.120 m. It demonstrated that Model-T shell-side structures affect theflow around the cylindrical fibers vortex behaviors significantly.It can be deduced that the novel membrane module shell-sidestructure guides the flow past the membrane fibers in the wakeand controls the vortex shedding in stream-wise direction ofmembrane fibers bundle. 3.2.Simulation-Based Characterization 3.2.1. Velocity and Flow Stagnation Regions As illustrated in Figure 4, cross-sectional plane-b, plane-m, plane-t are chosen to understand the flow fields inside HFM shell-side.Since swirl flow occurs, plane-b in Model-T demonstrates higherrotary flow velocity, and plane-m shows more uniform velocitydistribution than that of Model-V. Moreover, the vertical fluid flowthrough vertical Model-V design results in dead zone, apparentflow stagnation region, and much vortice transference. In Figure 5, longitudinal section velocity contours show thedifferent regions along the module shell-side. For the Model-T,it can be seen that the flow stagnation region is smaller thanModel-V. It can be deduced that swirling velocity may resultin higher energy utilization efficiency and improved filtrationperformance. Figure 6 shows simulated velocity profiles of five lines alongshell-side length, tangential velocity, axial velocity, helical velocity,radial velocity distribution is investigated respectively. Figure 6ashows comparative models' tangential velocity distribution, it in-dicates that the tangential velocity of Model-T is increased in line3, line 4 and decreased in line 1, but the tangential velocity ofModel-V is almost reached to zero. Figure 6b shows axial velocitydistribution of comparative models. The axial velocity of Model-Vline 0 is significantly lower than that of Model-T. It also demon-strated the existence of stagnant regions in Model-V.The axial ve-locity of line 2, line 4 in Model-V is higher than that in Model-T,but axial velocity of line 3 is low relatively. It showed an asym-metrical axial velocity distribution in Model-V. In line 3 and line + (a) (b) Figure 2. Experimental apparatus schematic diagram and PIV system. 4 of Model-T, the profiles trends are soaring with the decrease ofz position. The reason of axial velocity trends in Model-T may becaused by generating lift force and low fluid drag force, the fluidmight extract more energy from the flow. The unique hydrodynamic characteristics of the swirling flowmake the concentration of the feed solution fully mixed in the module shell-side.[34] When the helical velocity speed increases,the erosion effect and shear effect of the fluid on the wall areenhanced to improve the permeate flux, it is demonstrated inFigure 6c. In Figure 6d, the radial velocity ranges of Model-Vinline 1, line 4 is significant higher than that of Model-T. This maybe due to feed water flow through vertical inlet pass six circular Figure 3. Simulation validation with PIV experiments results. cylindrical fibers and it constitutes a nonuniform velocity distri-bution in radial direction along plane-b. 3.2.3. Pressure Distribution Since fluid has viscosity, viscous boundary layer on the surfaceof the cylinders, main flow separation leads to a large difference in pressure distribution and varied hydrodynamics around bar-shaped cylinders.[35] Figure 7 shows the time-averaged pressurecoefficient distribution along the shell-side HFM length in Z-direction. When H'/D is more than 4, the pressure coefficientsof line-3, line-4, line-5 in Model-T are negative and the absolutevalues of them are higher than that in Model-V. It identified thatthere exists negative pressure region on the bottom plane, whichis caused by the high-speed swirling flow entrance in Model-T.And when H'/D is less than 3, the pressure coefficient is close to0 and lower than that of Model-V. It is to be noted that the pres-sure coefficient differences between Line 0 and Line 5 are alsolower than that of conventional Model-V. When H’/D is less than1, the pressure coefficient absolute value of Model-T is equiva-lent or lower than that of Model-V. It deduces that the confinedswirling flow could decrease momentum energy loss around thebar-shaped membrane wall when H’'/D is less 3. Near the membrane wall, is the presence of anonzero pressurecoefficient, where the shear is strong near a strong vortex.36 Fig-is.ure 8 shows fluctuating time-averaged pressure coefficient dis-tribution around six circular bar-shaped cylindrical fibers at fivez/H position. It illustrates that swirling (vortex) flow in Model-Ttriggers lower pressure coefficient and uniform wall shear stressrelatively. And the stagnant points position and pressure coeffi-cient distribution around circular cylindrical fiber surfaces differ from comparative HFM models greatly. With the increaseof z/H in Model-T, the pressure coefficient amplitudes tend tobe smoother and less fluctuated and flattens out on plane-m Model-V velocity magnitude contours u=0.0575m/s [m/s] 0 0.018 0.035 0.053 0.07 0.088 Figure 4. Simulated velocity magnitudes contour of comparative models, Model-V and Model-T. Velocity Section View(a) Model-V 0.088 0.079 0.07 0.062 0.053 0.044 0.035 0.026 0.018 D 0.0088 [m/s] Section plane view(a1)inside the module(X=0) Section plane view (a2)inside the module (Y=0) Velocity Section View (b) Model-T Flow Stagnation Region Section plane view (b1)inside the module (X=0) Section plane view(b2)inside the module (Y=0) Figure 5. Side velocity views of comparative hollow fiber membrane module (u=0.0575 m s-). a) Model-V, b) Model-T. Model-V Model-T (d1) (d2) Figure 6. Simulation profiles with axial distance. a) Tangential velocity, b) axial velocity, c) helical velocity, d) radial velocity. Figure 7. Time-averaged pressure coefficient profiles. (z/H=0.5), then the pressure coefficient profiles reach a steepascent on the plane-b (z/H=0.95). It also demonstrates thatthe influence of small stagnate region in Model-T is less distinctthan that in Model-V, and the swirling shear flow contributes toin-distinctive pressure coefficient fluctuating with decreasing ofz/H. In Figure 8, it indicates homogeneous wall shear stress aroundmembrane wall in Model-T, the result is related to membranemodule shell-side structure-triggered vortice characteristics andstagnant point transition. Obviously, like the pressure coeffi-cient curve trend in the intermediate section of Model-T, thecorresponding wall shear-stress curve also tends to smooth, itmay be corresponding to weak upstream vortex formation andvortex shedding behaviors. As for 5# membrane circular cylinder,the wall shear stress of point 1 is higher than point 2 in Model-T, the same trend in Model-V,but the profile amplitude is lowerthan the trend in Model-V. As for 2# circular cylindrical fiber withz/H=0.05, the wall shear stress of point 3 is higher than that ofpoint 4 in Model T, but the value is lower than that of point 4 inModel-V, and the profiles amplitude is higher than that in 5# cir-cular cylindrical fiber. Moreover, the profiles of wall shear stressand pressure coefficient is almost in-fluctuating when z/H=0.5in Model-T. It may benefit the delayed effects of boundary layerseparation phenomenon around membrane fibers surfaces inModel-T. Since shear stress and pressure coefficient is related tointensity of detached vortices,B7 in the following paragraph, wewill discuss vorticity continuatively. 3.2.4. Observation of Vorticity Magnitudes Comparing the vorticity magnitudes in Line t, Line m, Line bin Figure 9, it can be concluded that with fluid pass the mem-brane bundles, the water flows upward with higher vorticity mag-nitudes in plane-b, the vorticity magnitude decay significantly inplane-t. The vorticity magnitudes of point 1,3 and point 2,4 inModel-V Line b and Model-T Line b, Line t are varied, but thevalues in Mode-V Line t and Model-T Line m are roughly equiva-lent. In particular, point 2,4 have great differences in Model-T,it is in accord with the differences of pressure coefficient be-tween 2# membrane circular cylinder and 5# membrane circu-lar cylinder in Figure 8. Meanwhile, in the protuberance radi-ans region of line-b in Model-T, the vorticity magnitude nearthe module shell-side wall is higher, and the value is decreasedin line-m and line-t. The vorticities in protuberance radians re-gion may push swirling flow forward in center-oriented direc-tion. It may be beneficial to shell-side flow drag reduction inModel-T. Figure 10 represents vortex core region contours and ve-locity streamlines, the vorticity core velocity of Model-T islarger than that of Model-V, and the velocity streamlines be-tween Model-T and conventional Model-V are significantly dif-ferent. Strong vortices caused higher energy dissipation inthe bottom of Model-V inevitably, the vortex core developedinto asymmetric column-shaped vortex and decayed along thenegative z-axis direction gradually. In Model-T, the high-speedrotary vortex core accompanied by many small symmetricvortex cores could distribute membrane fiber bundle intervalsuniformly which are featured by lower negative vorticity. Thestreamwise small vortex core is accompanied by uniform wallshear stress and pressure coefficient distribution around mem-brane surfaces. Moreover, the streamlines in Model-T is well dis-tributed along the membrane wall surfaces in shell-side flowdirection. 3.3. Observation of PIV Results In these PIV measurement experiments of the swirling flow-enhanced membrane module, tracer particles are hollow glassparticles of diameter 8-10 um and their density is similar towater. Streamwise-oriented vortices of six fibers inside moduleshell-side have been characterized using PIV measurements atinlet velocity of u=0.0575 ms-(Re=1150). The graphical re-sults were analyzed by Davis software, the z-vorticity profiles inLine 2 were clarified in detail. The z-vorticity fluctuating profilesupon observation period of 0-12 s are studied and these profilesare also analyzed by polynomial fitting methods. In Figure 11a, observation plane S-I velocity vectors andvorticity results are shown in detail. It identified the uniformvelocity vector distribution in Model-T. But the vorticity of Model-V is positive and high, and many long elliptical vortices occur inmembrane fiber bundle. In Figure 11b, Model-T obtains higher upstream z-vorticitymagnitude in operating period, and the time-dependent z-vorticity profiles of Model-T are more fluctuant than that ofModel-V. Since fluid momentum energy loss is proportional -Model-V pressure coefficient 0-·Model-V wall shear stress z/H=0.05 Model-V Circular cylinder round angle() 5# Figure 8. Simulated circular cylindrical fibers pressure coefficient and wall shear stress profiles within comparative models. A--…Model-T pressure coefficient …Model-T wall shear stress1s Model-T Circular cylinder round angle ()5# to z-vorticity magnitude, unlike positive z-vorticity magnitudein Model-V, negative Z-vorticity magnitude in Model-T demon-strates the existence of upstream vortices and less energy dis-sipation. The polynomial fitting equations were also shown in the right-side table of the figure and the Adj. R-square is equalto 0.96074. It has guidance meaning for research on the vortexmovement in HFM, and it can be used to guide the design ofmembrane module structure. 40 -0.02 -0.01 0.00 0.01 0.02 Z positon (m) Figure 9. Typical time-averaged vorticity magnitudes in the stagnation region across Model-V and Model-T. 3.4. Laboratory-Scale Operation Results Based on the above investigations, flow hydrodynamic charac-teristic in Model-T is obtained; most characteristics may facil-itate the performance improvement of HFM in filtration pro-cess. Thus, the actual results give birth to confidence to conductlaboratory-scale operation tests and assess HFM merit and weak-ness in further. Figure 12a,b present purified water outlet pressure profiles,permeate time profiles for comparative models. It is to be men- tioned that p is feed water pressure, and ppo is purified water out-let pressure. Experimental results in Figure 12a show that Model-T has shorter permeate time in the stability operating periods,shorter permeate time also means higher permeate flux and lowdrag. In Figure 12b, Model-T obtains higher hydraulic pressureppo when p is constant, and the pressure difference is lower thanthat of Model- at same operation conditions. It also identifiedthat high speed swirling breaks up vortices into many stream-wise small vortices, which identifies less turbulent momentumloss around membrane bundle surfaces.[38] Figure 10. Simulated vortex core region and velocity streamlines. 3.5. Drag Reduction Analysis The permeation flux of the membrane model is related to thepressure distribution in the flow field. 39 Higher power may leadto higher energy cost and permeation flux. 40] As for the pressure-driven membrane process, HFM shell-side flow resistance isnon-negligible, a tangential swirling flow investigation is likely tobe a practically feasible strategy in filtration resistance reduction. In this section, the concept of recovery rate is introduced to de-scribe the drag reduction characteristics of the membrane mod-ule. The recovery rate w (%) refers to the percentage of water sup-ply in the membrane system that is converted into productionwater or purified water, that is, the ratio of the volume of purifiedwater by the membrane module Vm (mLs-1.HFM) and the feedwater flow rate Q (Lh-) Table1 shows the recovery rates for the two models. The exper-imental results show that under equivalent operating conditions,the recovery rate of the model-T is higher than that of the model- V, which indicates that Model-T has a significant drag reductioneffect. 4.Conclusion Under turbulent condition, the flow field in a novel module wassimulated using the commercial CFD code FLUENT. A CFDmodel was used to study hydrodynamics characteristics withnovel HFM configurations with six spaced bar-shaped circu-lar cylindrical fibers. A decaying swirling flow was proposed tosuppress the onset of vortex flow occur in the adjacent aroundcylindrical fibers in filtration process. The proposed model con-sidered the effects of flow distribution, fluid mechanics, andhydrodynamics. Simulation results found that Model-T could obtain higher en-ergy efficiency, such as little amplitude pressure coefficient dis-tribution neither in shell-side or membrane surface wall adja-cent, uniform wall shear stress. The results reveal that membranemodule shell-side flow drag studies are valuable to adjust themembrane fiber density and length by minimizing the pressurecoefficient around the membrane wall. However, the tangential (a) Model-T Model-V position mm Equation y=Intercept+ B1*x^1+B2*X^2+B3*x^3 Adj.R-Square 0.96074 Value Standard Error T-Modelz-vorticity Intercept 1E-3 B1 -0.22906 0.01348 B2 0.0389 0.00346 B3 -0.00195 2.12191E-4 Equation y=Intercept+B1*x^1+B2*x*2+B3*x3 Value Standard Error Model-Vz-vorticity Intercept 0.15 B1 -0.04556 0.00752 B2 0.00751 0.00193 B3 -3.58156E-4 1.17801E-4 Time(S) (b) Figure 11. Variations of PIV and simulated z-vorticity profiles. a) Plane S-I velocity vectors and z-vorticity contours. b) z-vorticity profiles and fit equations. swirling flow created less stagnate point/region in module shell-side which may cooperated on increasing permeate flux and en-ergy efficiency. An experimental methodology was conducted to observe us-ing stereoscopic PIV to investigate the streamwise vorticity of an annular swirling flow module. PIV results showed that ro-tational flow provided rotatory vortex core regions, symmetricsmall vortices, and uniform flow distribution along the stream-wise membrane fibers bundles. Moreover, it was also foundthat the z-vorticity absolute value of round flow six fibers would Laboratory-scale experimental studies showed that the novelmembrane Model-T created higher permeate flux and lower hy-draulic pressure loss, it stands to benefit from lower membranemodule shell-side flow drag and membrane fibers boundary layerdrag by uniform membrane wall shear stress and low-pressurecoefficient around membrane wall. Meanwhile, recovery rate ofModel-T is higher than that of conventional one on the same op-eration conditions. Thus, membrane module shell-side structuredesigns based on hydrodynamic flow control are a feasible dragreduction strategy in high energy utilization efficiency modulefabrication engineering. Nomenclature ainlet tube diameter [mm] binlet tube length [mm]H pressure coefficient [-1 HFM diameter [mml HFM height [mm] fibers distance [mm] Pi feed water pressure [MPa] Ppo purified water outlet pressure [MPa] Pi-pofeed water and purified water pressure drop [MPa] inlet flow rate [L h-] Reynolds number inlet velocity [m s-l] Vm HFM permeate flux [mL s-·HFM] Greek letters wall shear stress [Pa] inlet-outlet end ring protuberance radian [°] Acknowledgements Figure 12. Experimental profiles oflaboratory-scale HFM. a) HFM perme-ate time, b) HFM purified water outlet pressure Ppo. The authors wish to acknowledge financial support by the National HighTechnology Research and Development Program of China (Sub-project)(No.2015BAC04B0101). Table 1. Recovery ratew (%)of comparable Model-T and Model-V. Conflict of Interest Operation condition Model-T Model-V Case no. Condition Pi-po=0.014 Mpa 0.126 0.090 ll Vm =0.04mLs-1-HFM 0.120 0.096 ill Qi=150Lh-1 0.168 0.108 The authors declare no conflict of interest. Keywords drag reduction, HFM shell-side, particle image velocimetry, pressure coef-ficient distribution, vortex-shedding control Note: ConditionI:When inlet pressure is variant (P.po =0.014 MPa), the purifiedwater volume and feed water flow rate are measured.; Condition II: When purifiedwater volume is variant (Vm=0.04 mL s-1.HFM), the purified water volume andfeed water flow rate are measured.; Condition ⅢI: When feed water volume is variant(Q=150 L h-1), the purified water volume and feed water flow rate are measured. Received: May 19, 2018 Revised:June 22, 2018 Published online: July 29, 2018 become higher with vortex periodic shedding in the shell-side.Meanwhile, the conventional membrane module structure cre-ated more stagnant regions, and asymmetric column-shaped vor-tex cores by circumference deformation in the shell-side. [1]C. H. Park, S. J. Kwak, J. Choi, K. Lee, J. Lee,J. Appl. Polym. Sci., 2018,135,46110. ( [2] D. Z arzo, D . Prats, D e salination 2018, 427, 1. ) ( [ 3 ] C. M. Tun, A . M. G roth, D esalination 2 011, 2 83, 18 7. ) ( [4] A. H . H aidari, S . G . J. Heijman, W. G . J. van d e r Meer, Se p . Pu r if. Technol.2018, 199,9. ) ( [5] S. E. Wu, Y . C. Lin, K. J . Hwang, T. W. Cheng, K. L . Tung, Chemical E ngineering and Pr o cessing-Process Int e nsification 2018, 125 , 87. ) ( [6 ] S $ .-H . Seo, C . -D. Nam,J.-Y. Han, C.-H. Hong,J. Fluid Eng. 2013, 135, 1 11202-1-10. ) ( [7] G ( . Han, P . Wang, T.S. C h ung, Environ. Sci. Te c hnol. 2013, 47 , 8070. ) ( [8] ( C . F . Wan, T. S . Yang, G . G. Lipscomb, D. J. Stookey, T. S. Chung,J. Membr. Sci. 2017,538,96. ) ( [9] X . Y ang, R. Wang, A. G. Fane, I. G. Wenten, Desalin. Water Treat. 2013, 51,3604. ) ( [10] C . F . Wan, B. F. L i, T. S. Yang, T. S. Chung, Sep. P uri. Technol. 2017, 172,32. ) ( [11] K . Aoki, K. Muto, H. Okanaga,J. Flui d Sci. Technol. 2012, 7, 1 . ) ( [12] X . Yang, R. Wang, A. G. F ane, C. Y. Tang, I.G. Wenten, Desalin. Water T reat., 2013, 5 1, 1 6. ) ( [13] J . Wu, V. Chen,J. Membr. Sci.20 0 0, 172, 59. ) ( [14 4 ] ] C ( . L iu, L. Z. Wang, Q. S. Liu, Chem. Eng. Technol.2006,29,495. ) ( [15] Y . Yang, B. G. Wang, Y.Peng,J. Chem. Ind . Eng. 2008, 59, 197 9 . ) ( [16] S . Li, Z. Q. Sun, Energy 2015, 8 8,783. ) ( S . M uddada, B. Patnaik, E u r. J. Mech.-B/Fluids 2 010, 29, 93. ) ( M. Silva- O rtega, G . R . S. A ssi, E xp. T hermal. F luid S ci. 2017, 8 5, 354. ) ( [19] D [ . L. Gao, W. L. Chen, H. L i , H . Hu, E xp. Thermal. F l uid Sci. 2 017, 82, 287. ) ( [20] B E . Zhou, X. Wang, W . G u o, W. M. Gho, S. K. Ta n , Exp. Ther. Fluid Sci. 2015, 6 9,19. ) ( [21] N M . Mulder, M e mbrane Tec h nology Basic Principle, 2 n d ed., TsinghuaUniversity Press, B eijing, 1997. ) ( [22] E E . S. Tarleton, R. J. Wakeman, Solid/Liquid Separation. Web. 2007, 1. ) ( [23] C. D. Wang, W. M . Chen, Ph.D. Thesis, Sichuan U niversity, Chengdu, 2001. ) ( [24] R . K aya, G. D e veci, T. Turken, R. Sengur, S. Guclu, D. Y . Kos e oglu-Imer, I . Koyuncu, Desalination 2014, 351, 109. ) ( [25] A nsys Fluent User’s Guide 18.0, SAS I P , Inc. ) ( [26] C . K. Mangrulkar, A. S . Dohoble, S. G . Chakrabarty, Int. J .Heat Mass T ransfer 2017, 1 04, 9 64. ) ( [27] M.M. Zdravkovich, Flo w Around Circ u lar Cylinders, Vol. 1: F u ndamen- tals, Oxford University Press, N ew York, 2 0 03. ) ( [28] M .M.Zdravkovich, Flow Around Circular Cylinders, Vol. 2: Applications, Oxford S cience P ublications, New York, 2003. ) ( [29] Y . Z. Liu, Ph.D. Thesis, Shanghai Jiaotong University, Shanghai, 2000. [30] W. L. Chen, H. Li, H. H u, Exp. Fluids 2014,55, 1. ) ( [31] T .Saito, K . Sakakibra, Y. Miyamoto, M . Y a mada,J.Chem. Eng. 2018, 158,39. ) ( [ 32] X. X ie, N. Dietrich,L.Filaudeau, C. Le Men, P. Schmitz,A. Line, Chem. Eng. R es. Des. 2018, 132, 9 54. ) ( [33] S. Kumar, R . B. Grover, H. Yadav, P . K. Vijayan, U. Kannan, A. Agrawal, Appl. Thermal Eng. 2018, 138, 686. ) ( [34] O. M. Thomas, C. Lelievre, N. R ossignol, P. Legentilhomme,Can. J.Chem.E n g. 2000, 78,248. ) [35] 1. Kowalska, Environ. Prot. Eng.2008,34,105. ( [36] D C . F. Young, B. R. Munson, T. H. Okllshi, W. W. H uebsch, Introductionto Fluid Mechanics, 5th ed., John Wiley & Sons, Hoboken, Ne w Jersey, 2012. ) ( [37] M. S ilva-Ortega, The D igital Library of Thesis and Dissertations ofthe U niversity of S ao Paulo, www.teses.usp.br/teses/disponiveis/ 3/3135/tde-15072016-152949/en.php 2015. ) ( [38] SS. Dong, G. S . Triantafyllou, G. E . Karniadakis, Phys. Rev. L ett. 2008, 100,201. ) ( [39] D C . Attarde, M , Jain, P . K. Sigh, S. K. Gupta, Desalination 2017, 413, 86. ) ( [ 40] G. A my,N. Ghaffour, Z. Y . L i, L. F r ancis , R. Valladares, T . Missimer, S. Lattemann, D esalination 2017, 401,16. ) ( of Adv. Theory Simul. ,WILEY-VCH Verlag GmbH & Co. KGaA, Weinheim ( of WILEY-VCH Verlag GmbH & Co. KGaA, WeinheimAdv. Theory Simul. , A novel hollow fiber membrane module shell-side model is fabricated,simulated, tested, and analyzed. The mathematical model consists of a six spaced bar-shaped fiber and a vortex-control tangential entrance with protuberance radians. The vortex shedding behavior is captured by the digital particle image velocimetry technique. The velocity vectors and vorticity fields are analyzed experimentally. Meanwhile, the k − ε turbulent model is established to identify the flow stagnate point/region transformation. Investigation of wall shear stress and surface pressure distributions around circular cylindrical fibers illustrate the mechanism of drag reduction tentatively. Afterward, the novel optimization module produces higher recoveryrates of up to 1.56 times as compared to that of a conventional module in equivalent filtration condition. It indicates that by means of a hydrodynamics flow control strategy, the fabricated membrane module structure could potentially improve energy utilization efficiency in filtration processes.
确定

还剩13页未读,是否继续阅读?

产品配置单


北京欧兰科技发展有限公司为您提供《中空纤维膜组件中流体力学减租特性研究检测方案(CCD相机)》,该方案主要用于其他中其他检测,参考标准--,《中空纤维膜组件中流体力学减租特性研究检测方案(CCD相机)》用到的仪器有德国LaVision PIV/PLIF粒子成像测速场仪、LaVision DaVis 智能成像软件平台
推荐专场


相关方案
更多
该厂商其他方案
更多