


方案详情
文
谈到温度测量,人们自然会想到温度计,热电偶,红外热像仪等装置。但这些方法要么是介入式测量,要么是近似的,难以严格定量的测量。红外热像仪用的很多,但红外热像仪的问题在于只能测量物体表面的温度,并且因其测量原理基于普朗克黑体辐射定律,所以定量测量的准确度和被测对象的材料属性高度相关,需要复杂的标定修正过程。故这些方法,一般难于用到燃烧,流体等空气动力学研究对象的温度场测量中。气体温度场的光学非介入式测量具有广泛的应用需求。
方案详情

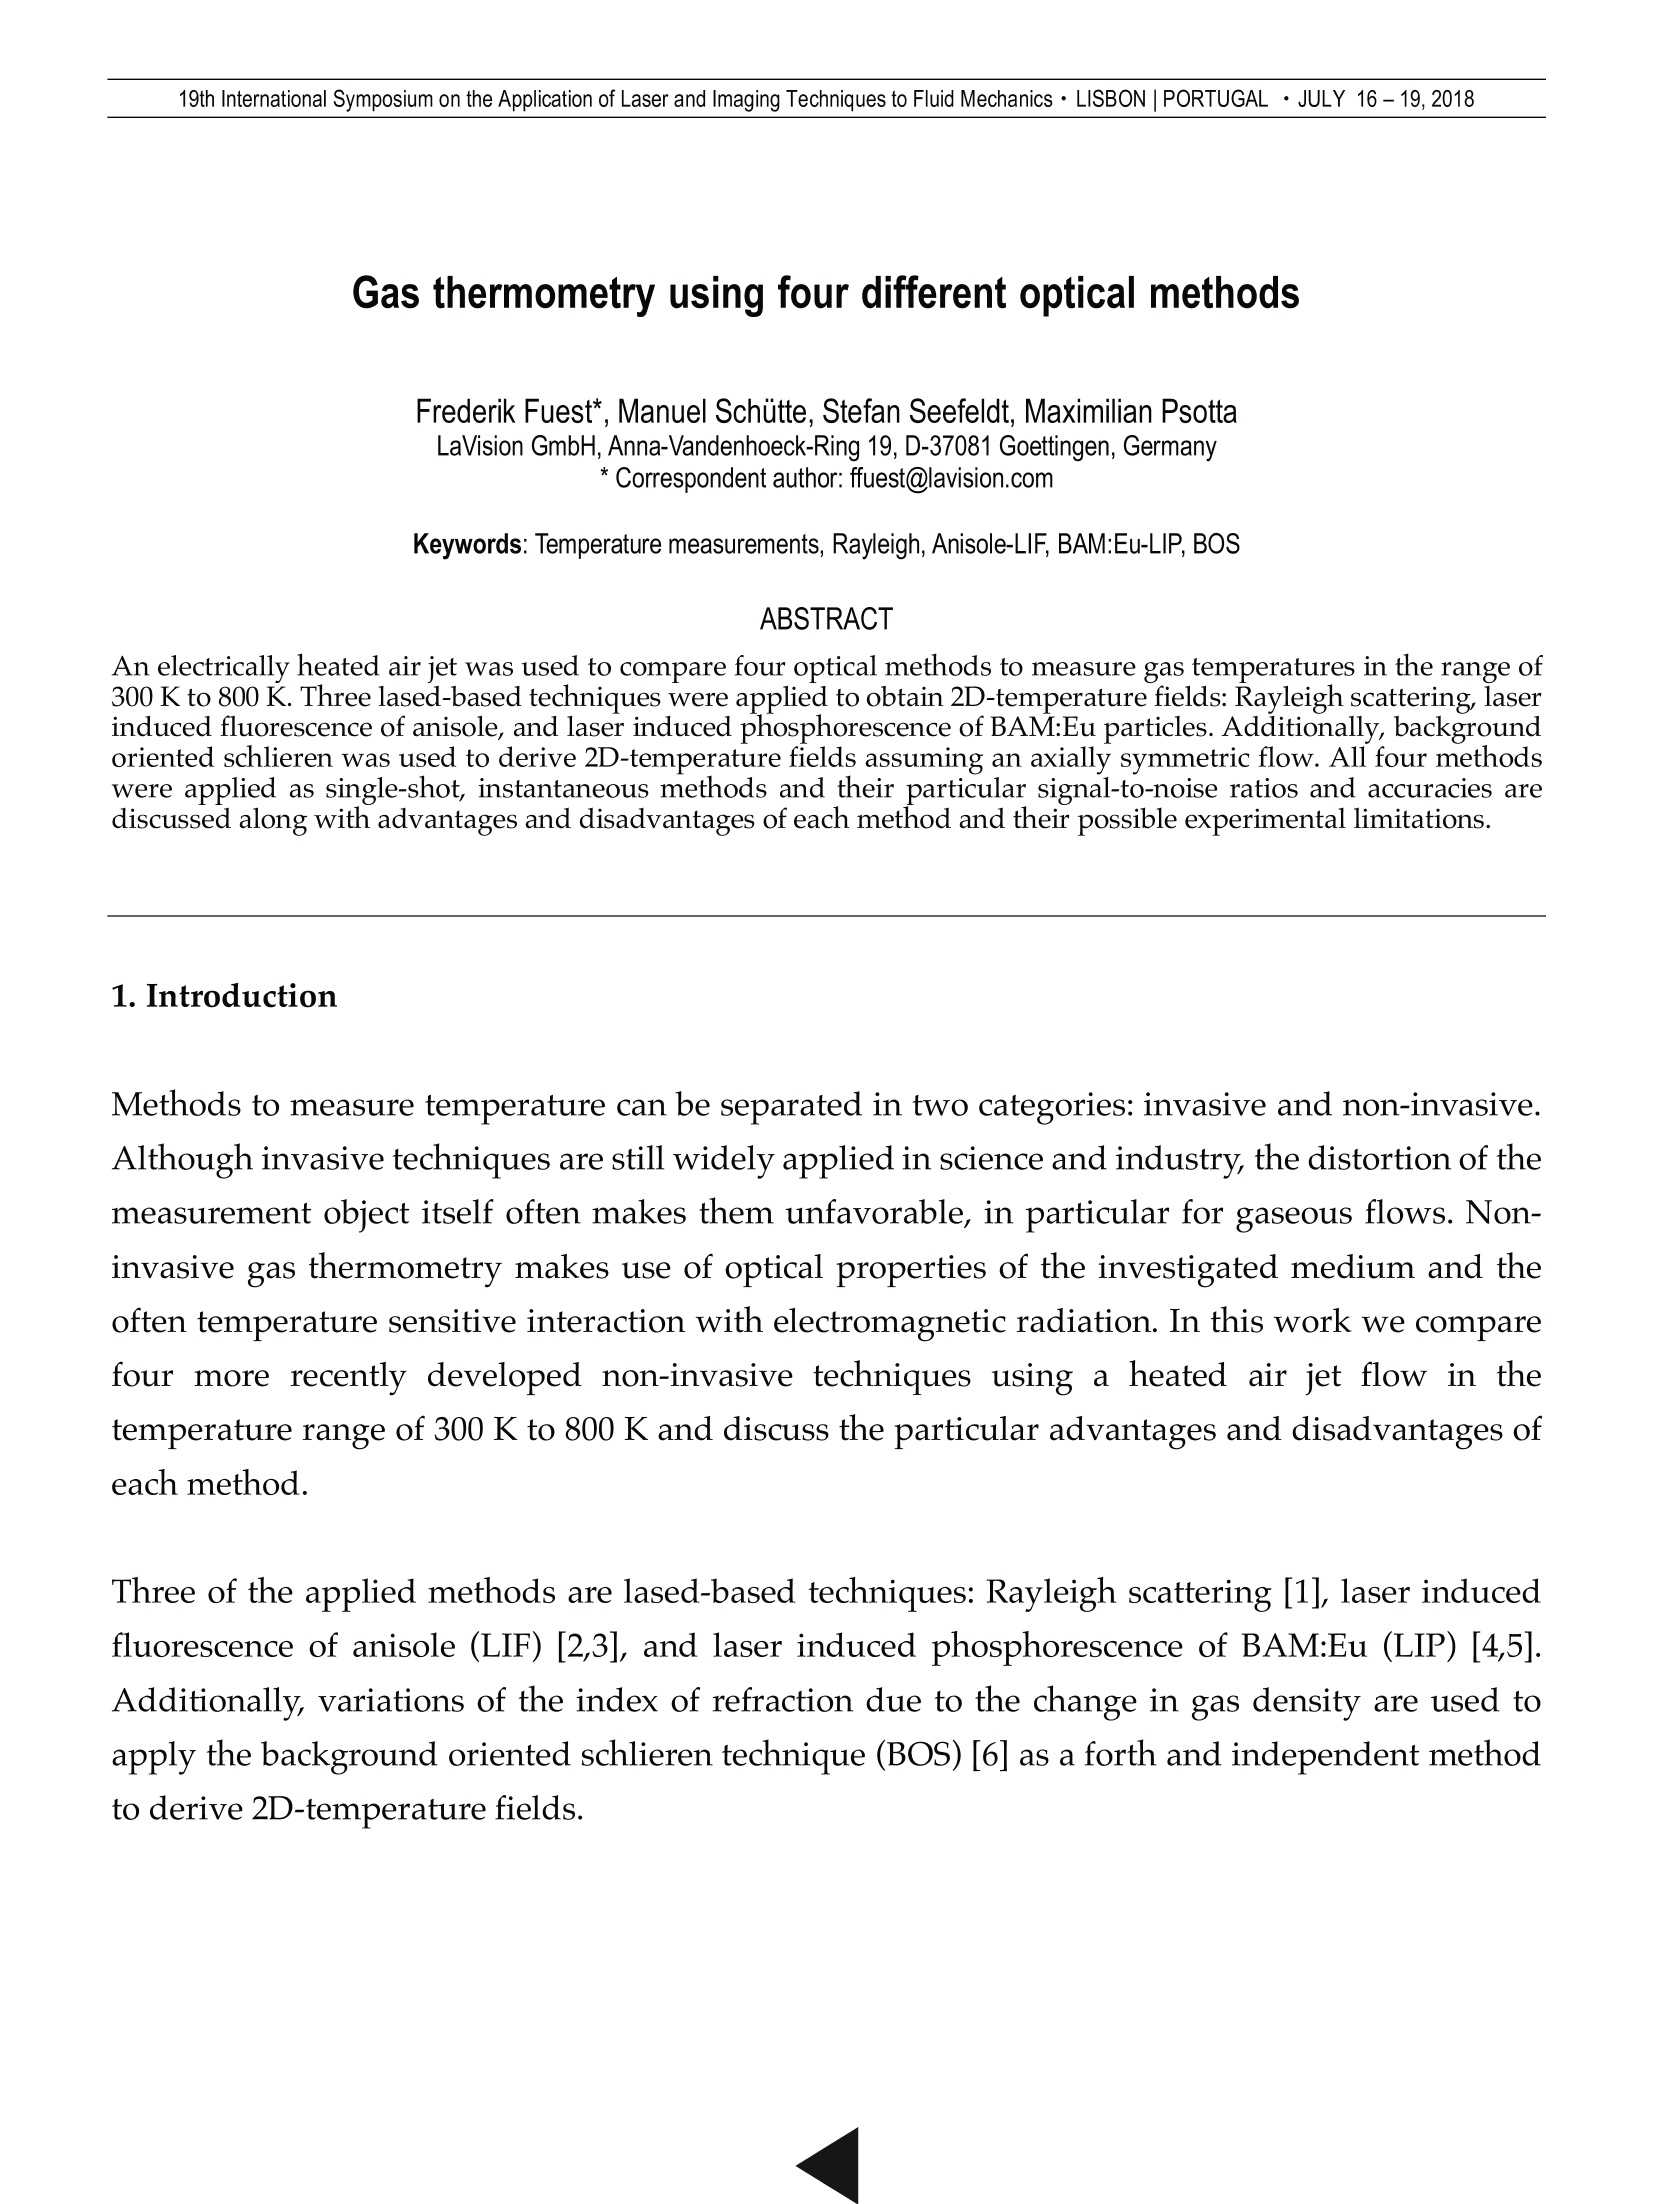
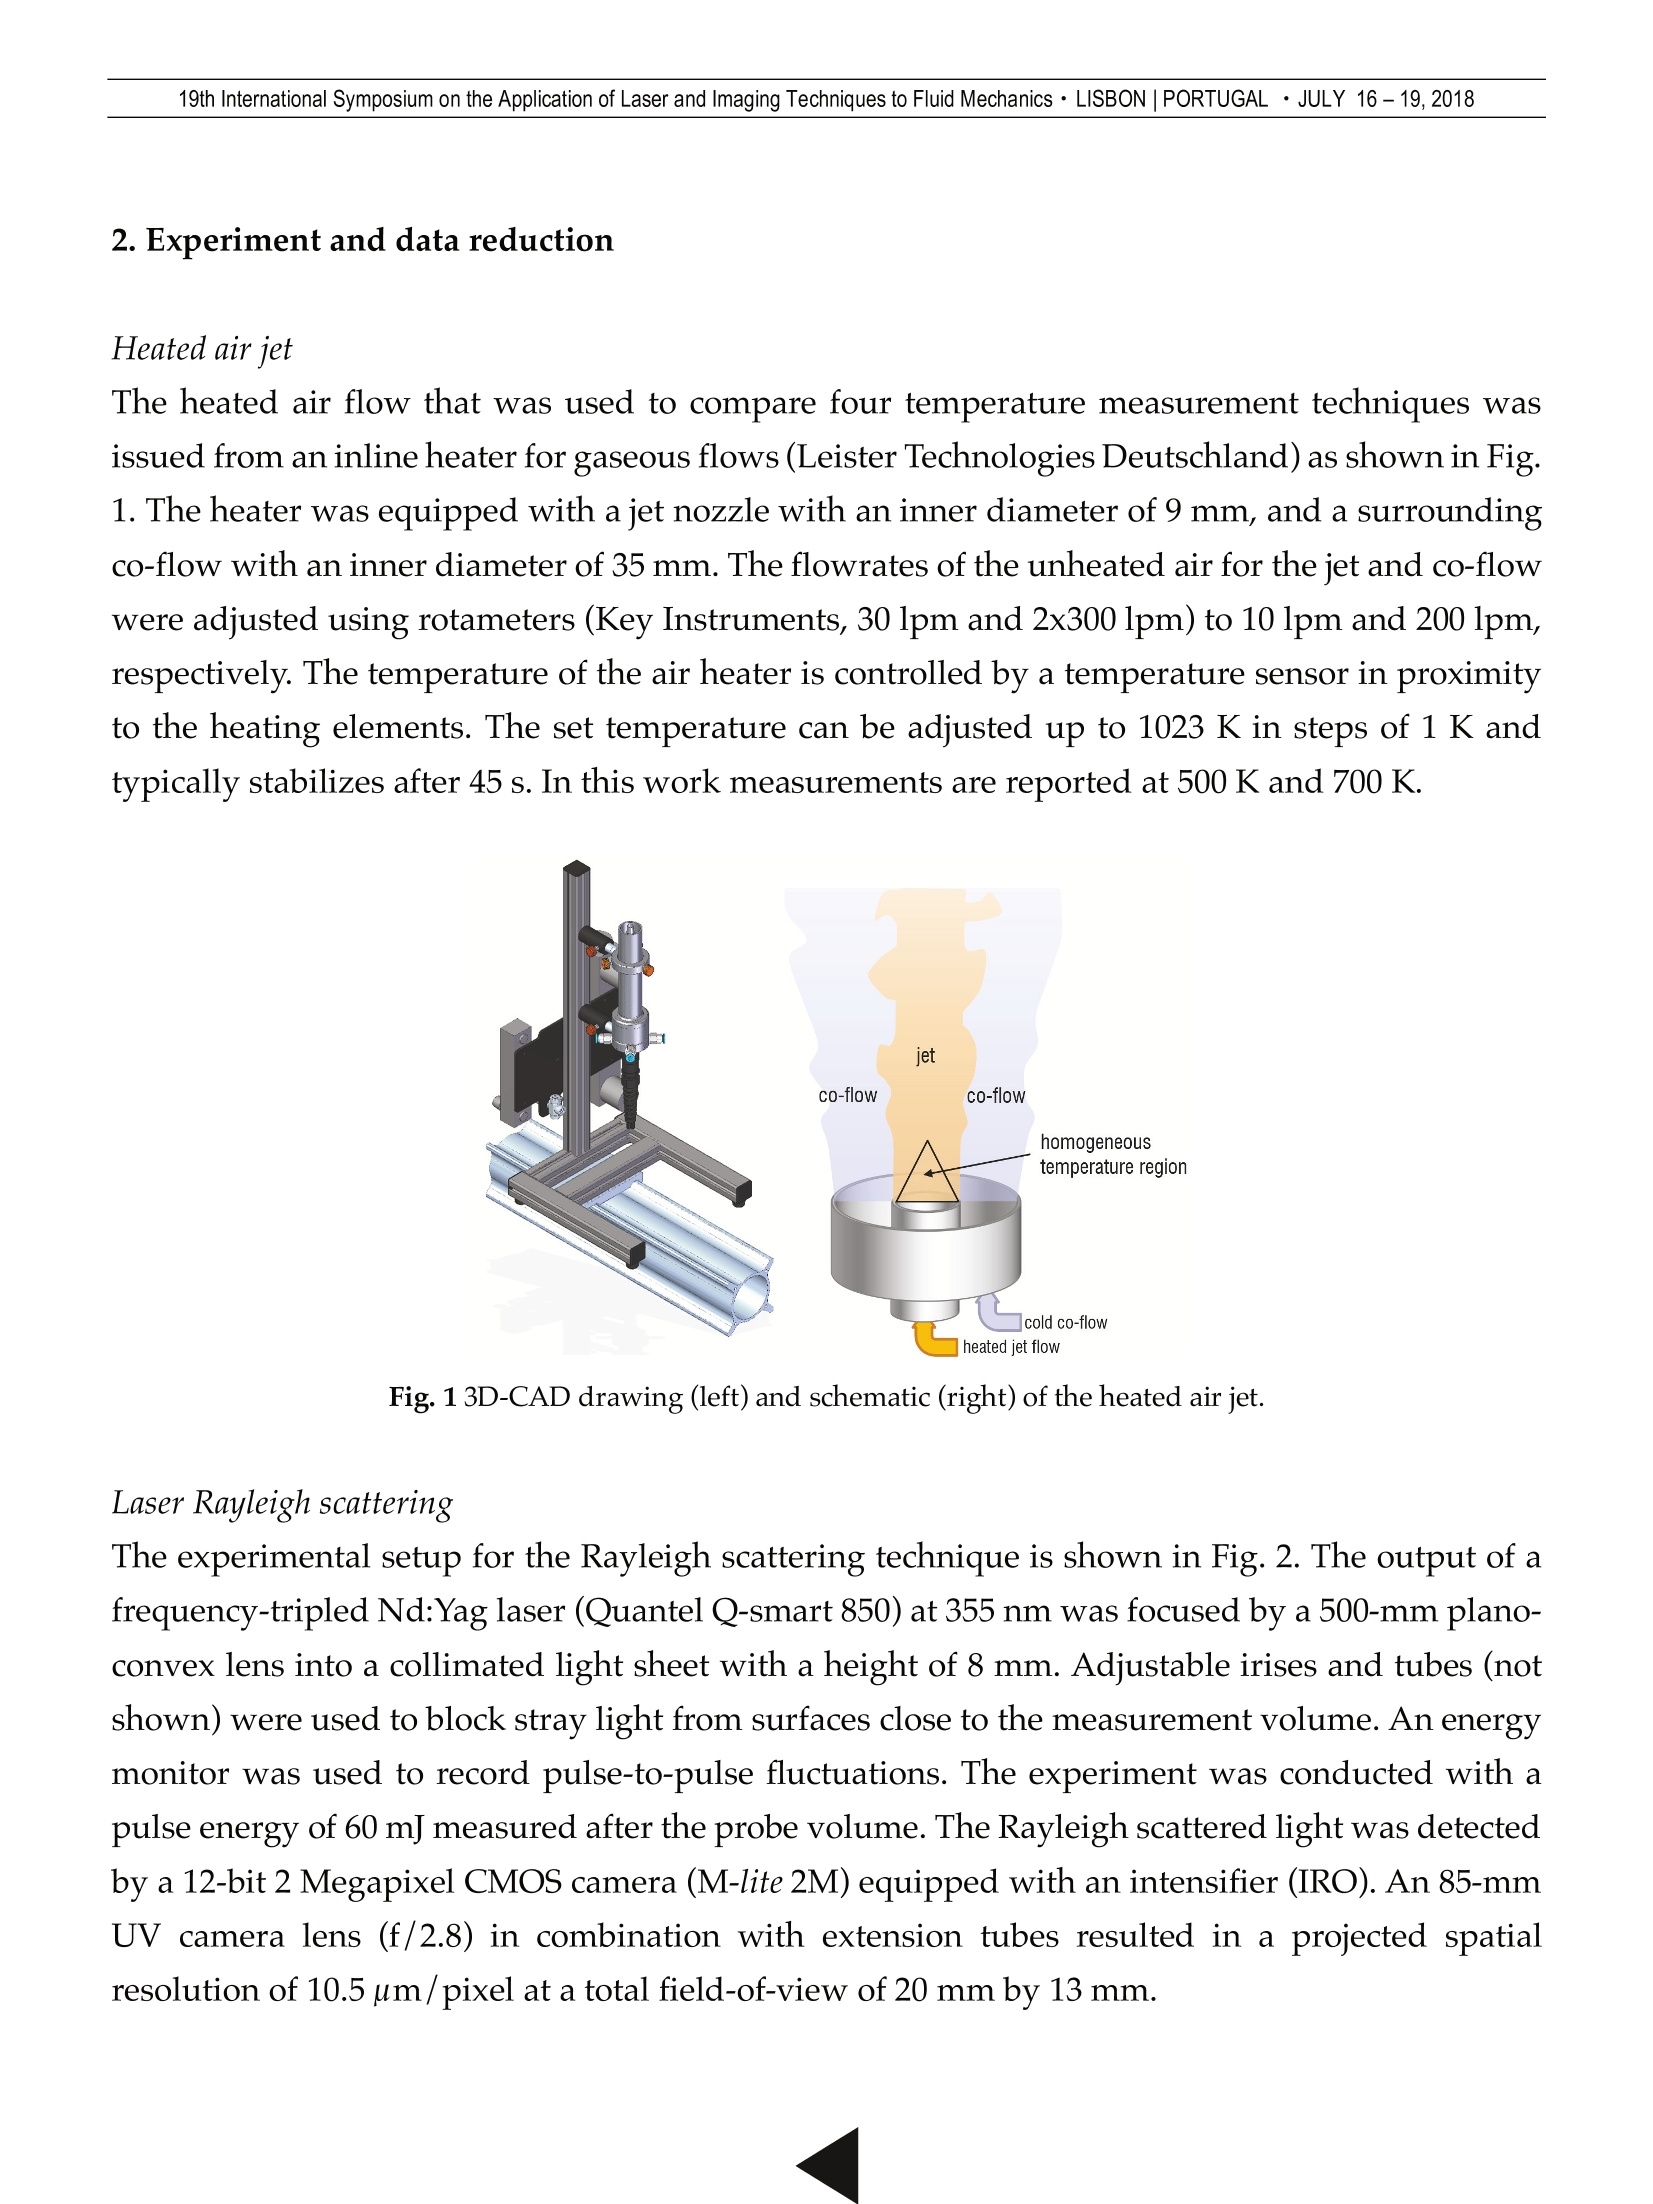
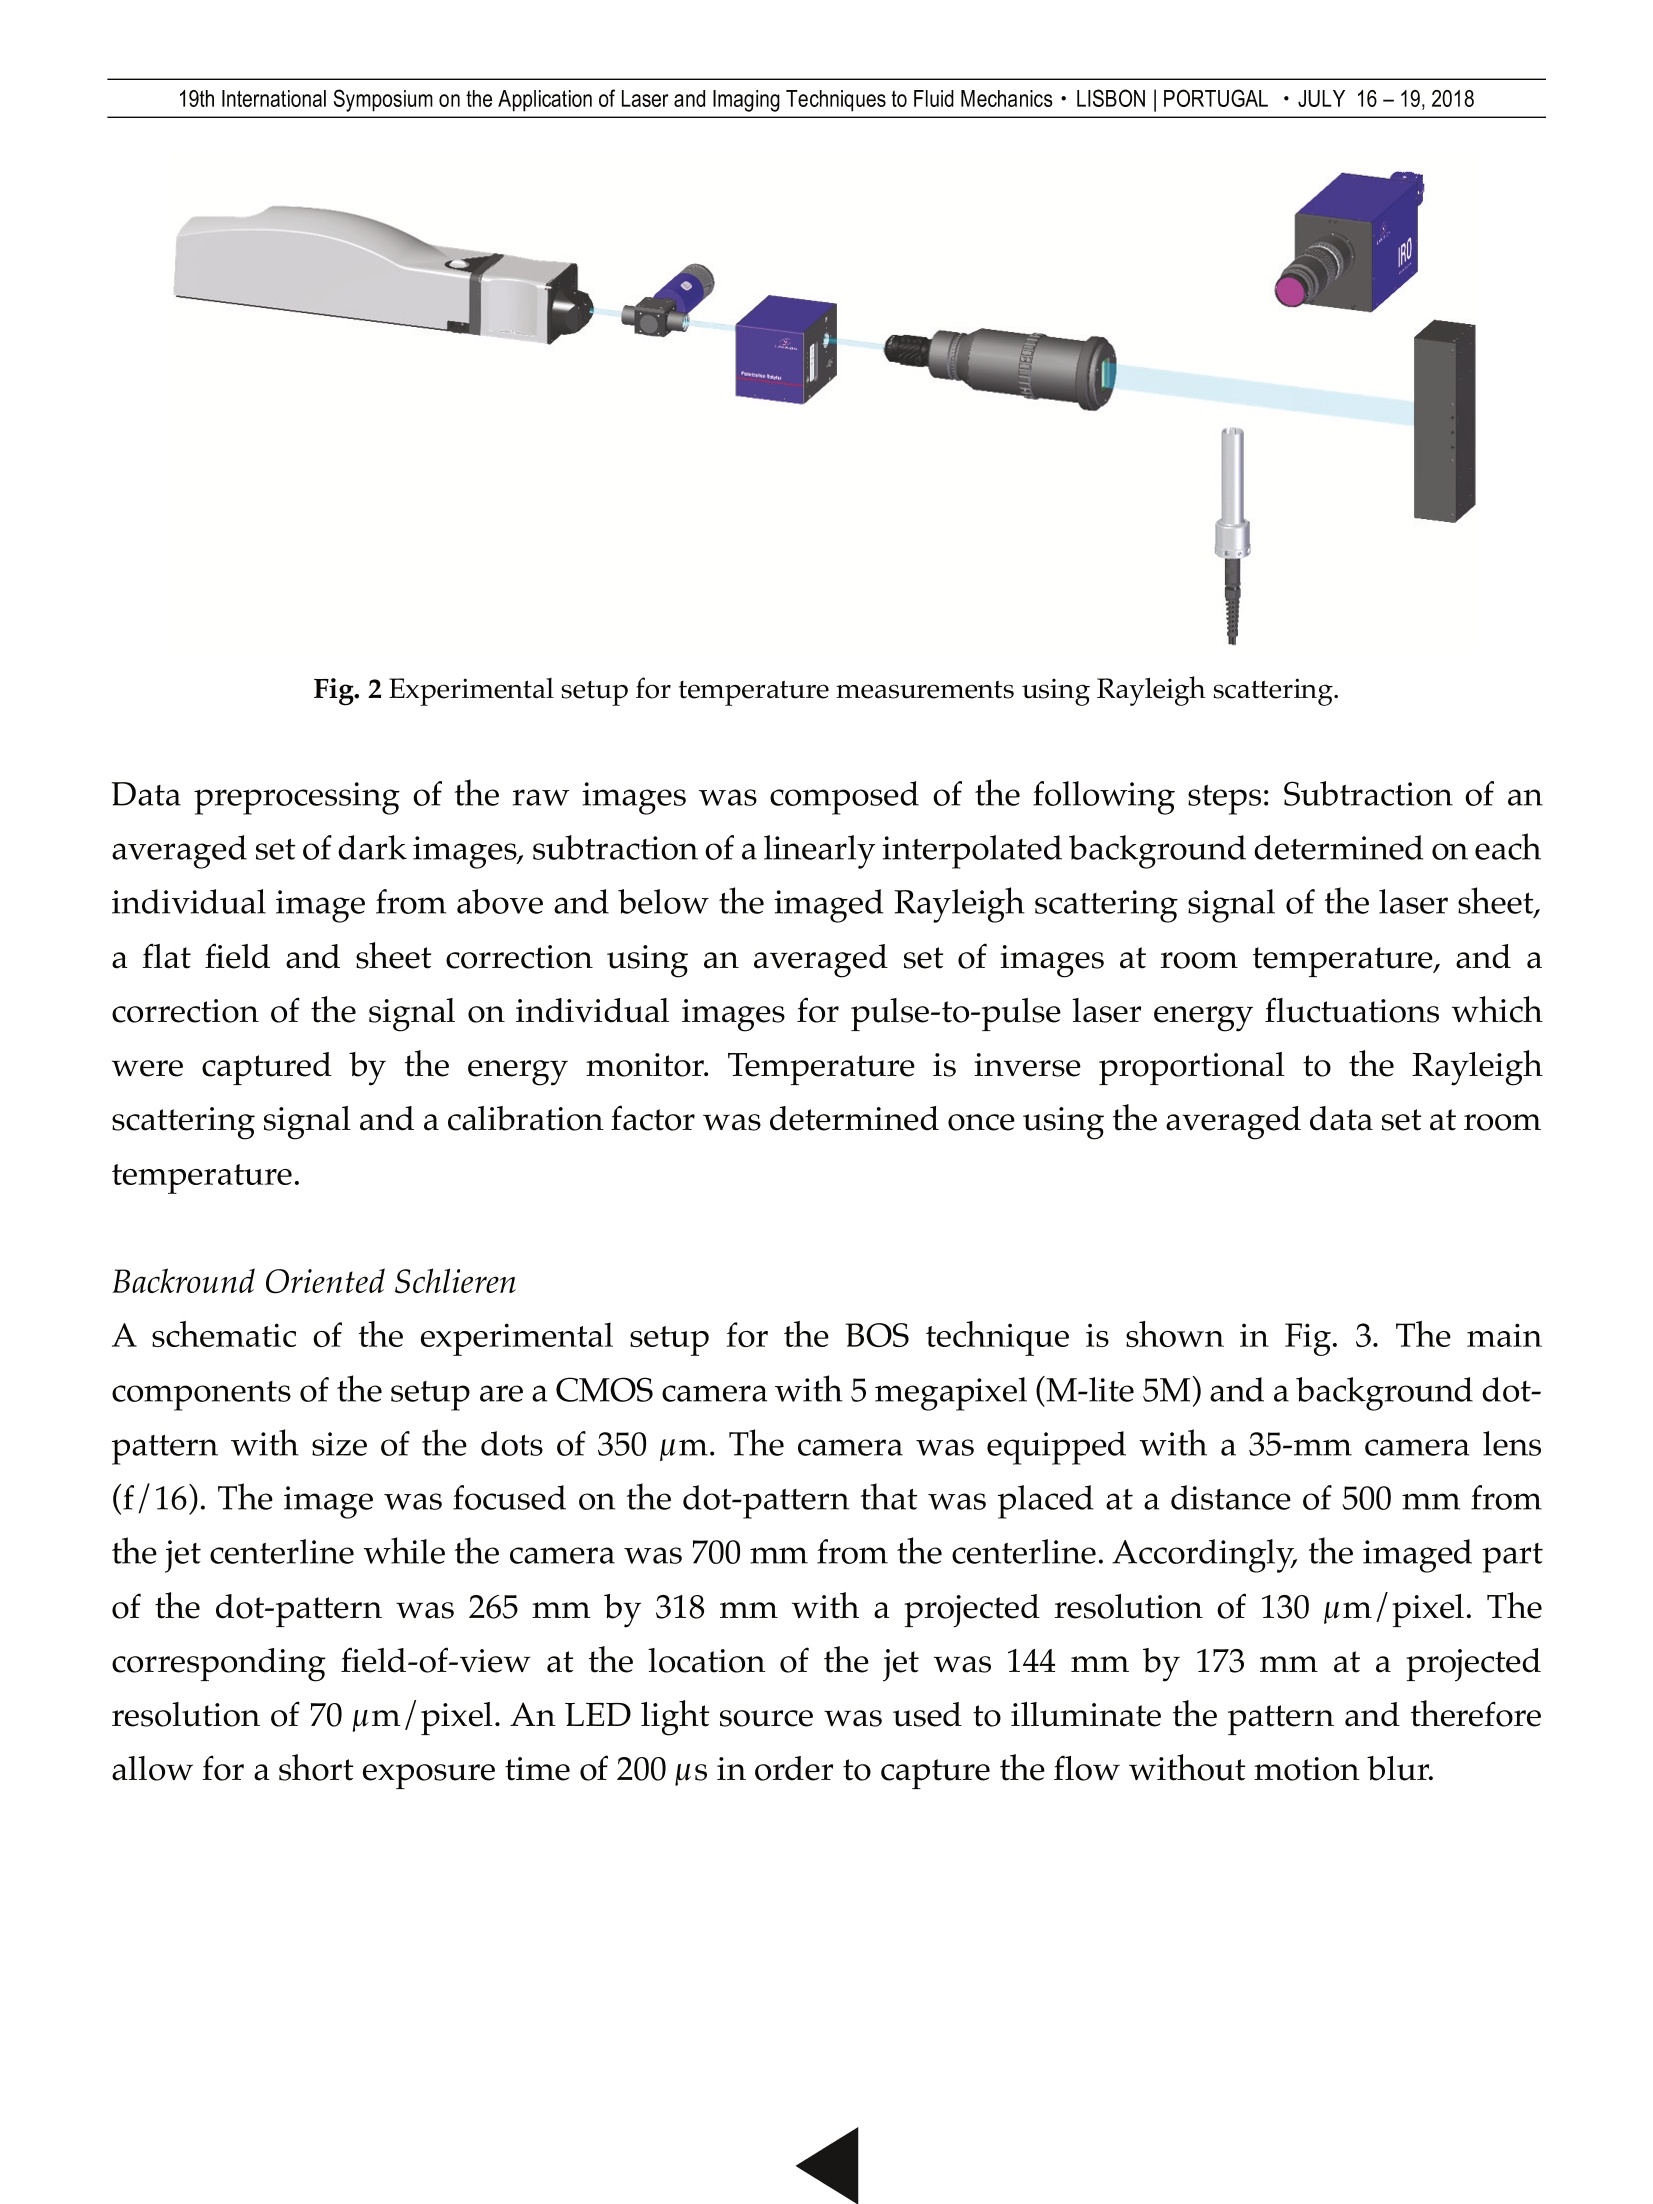
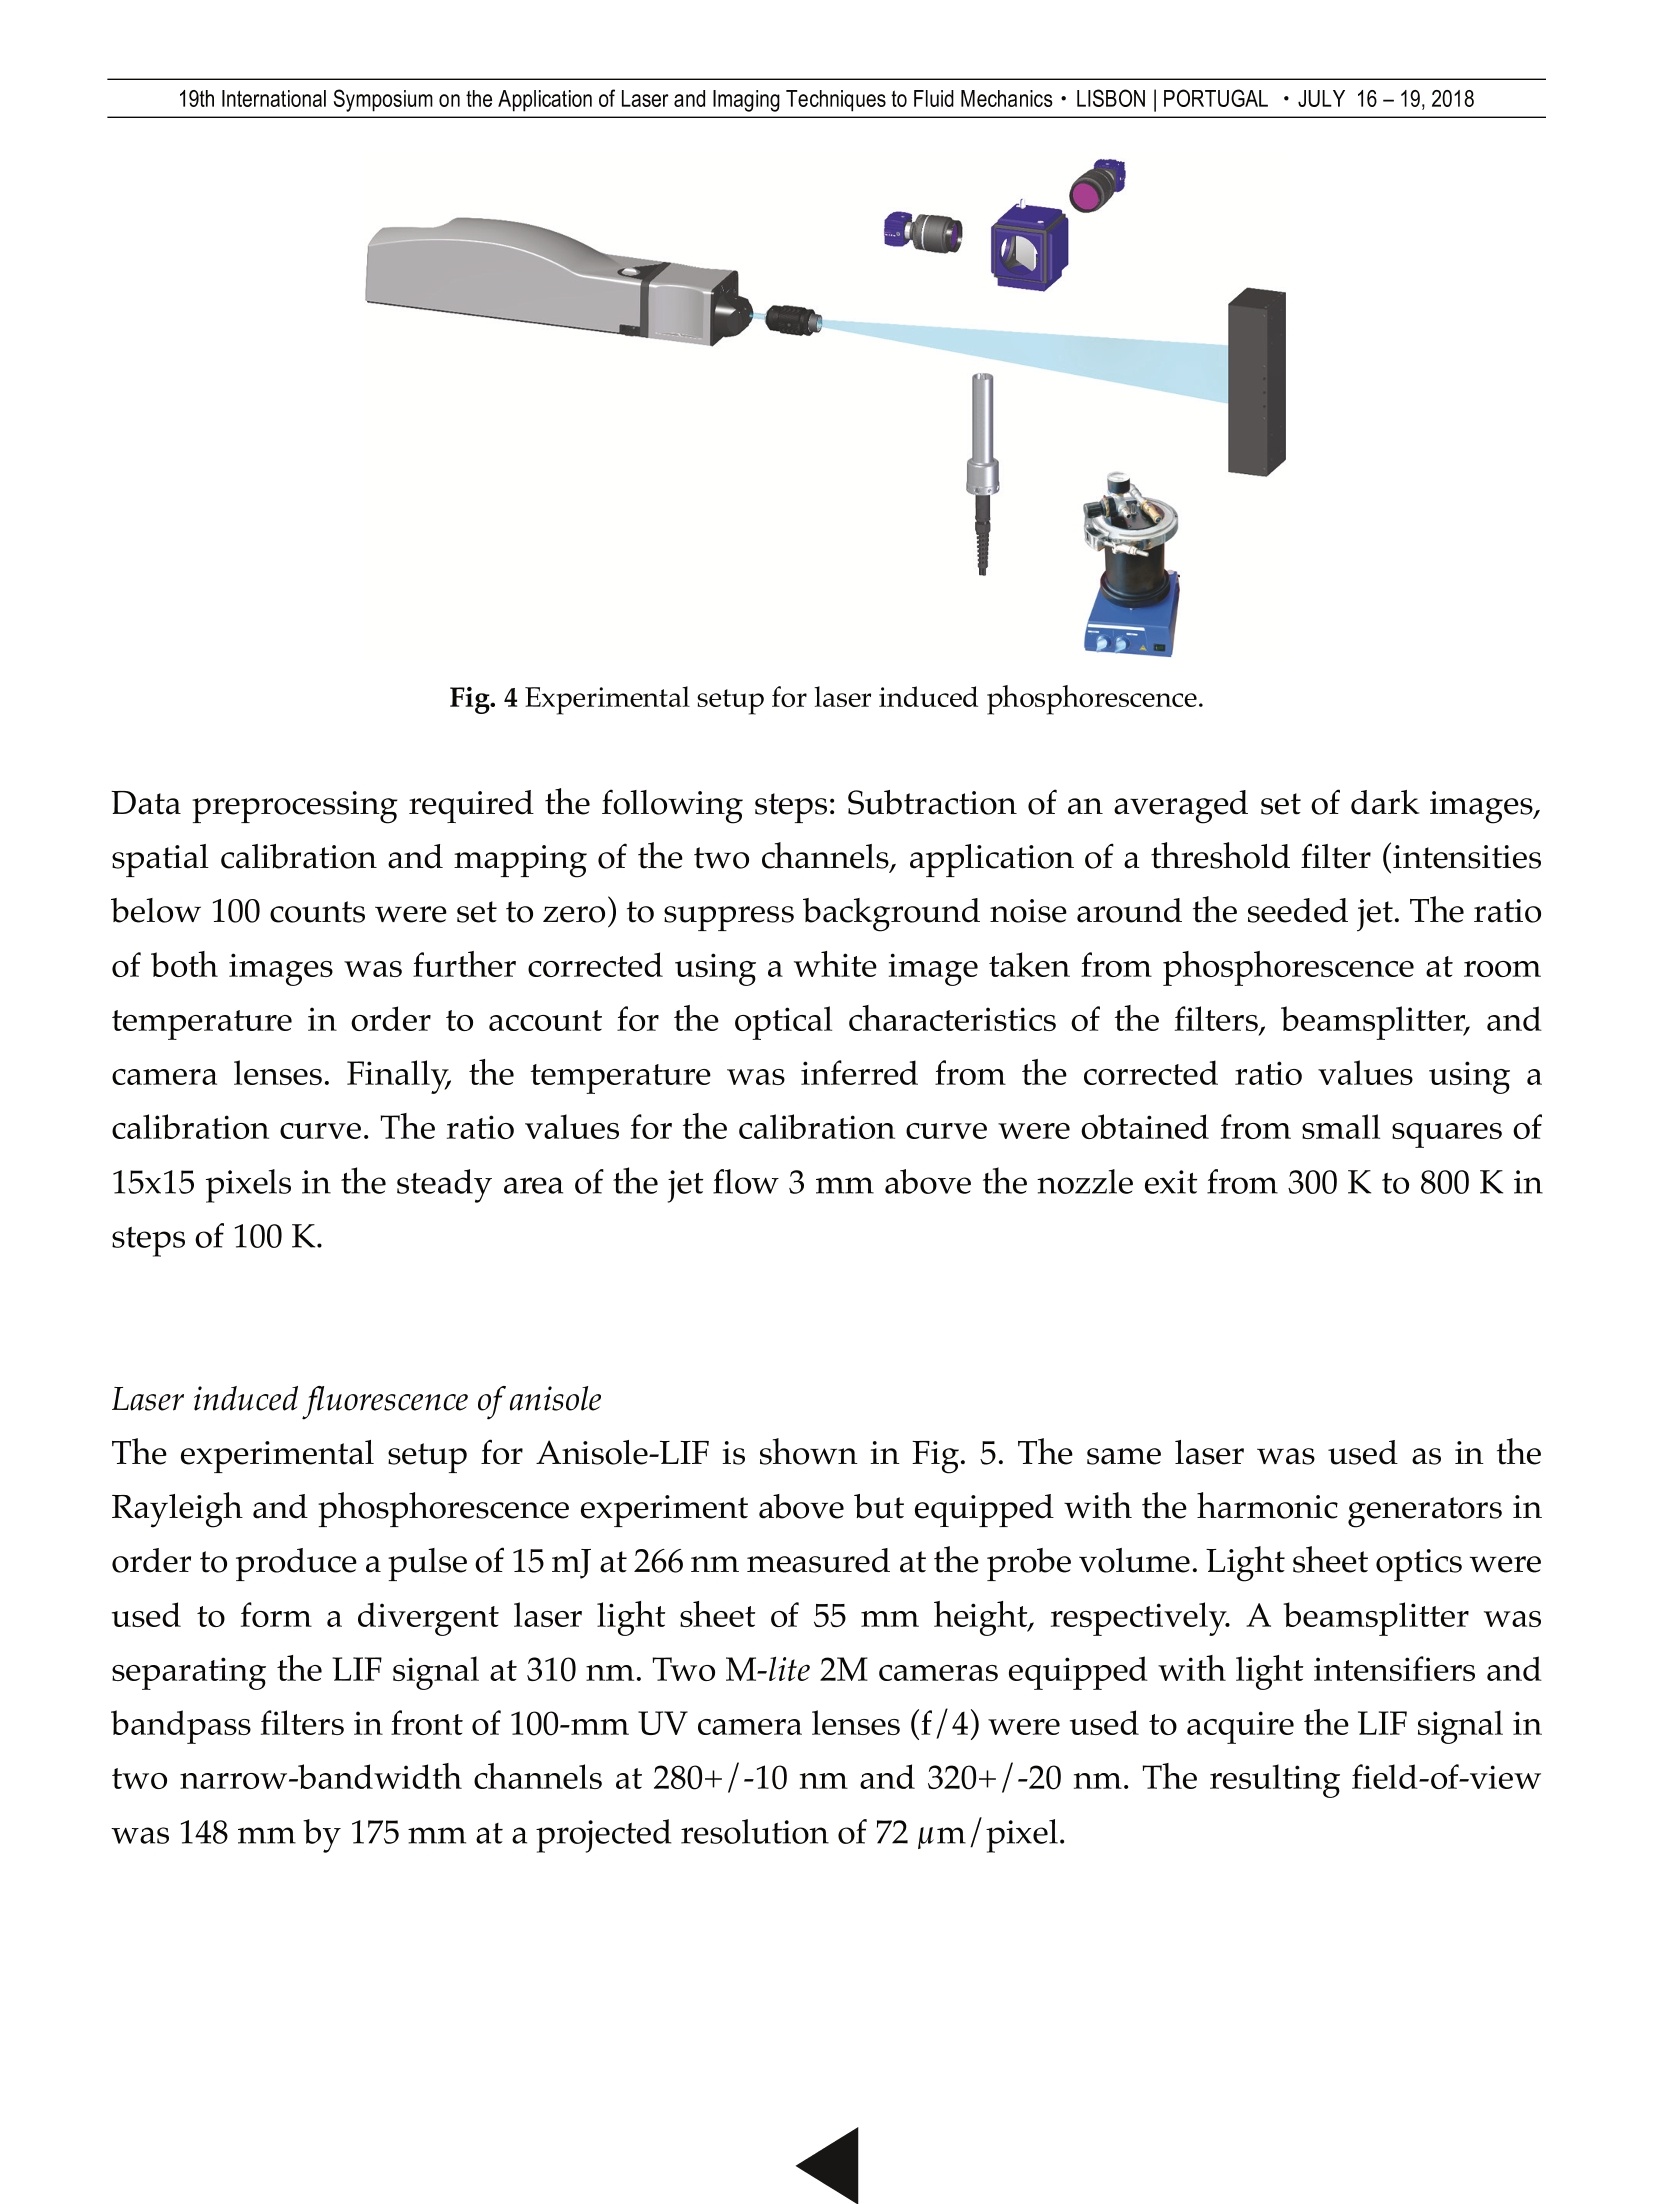
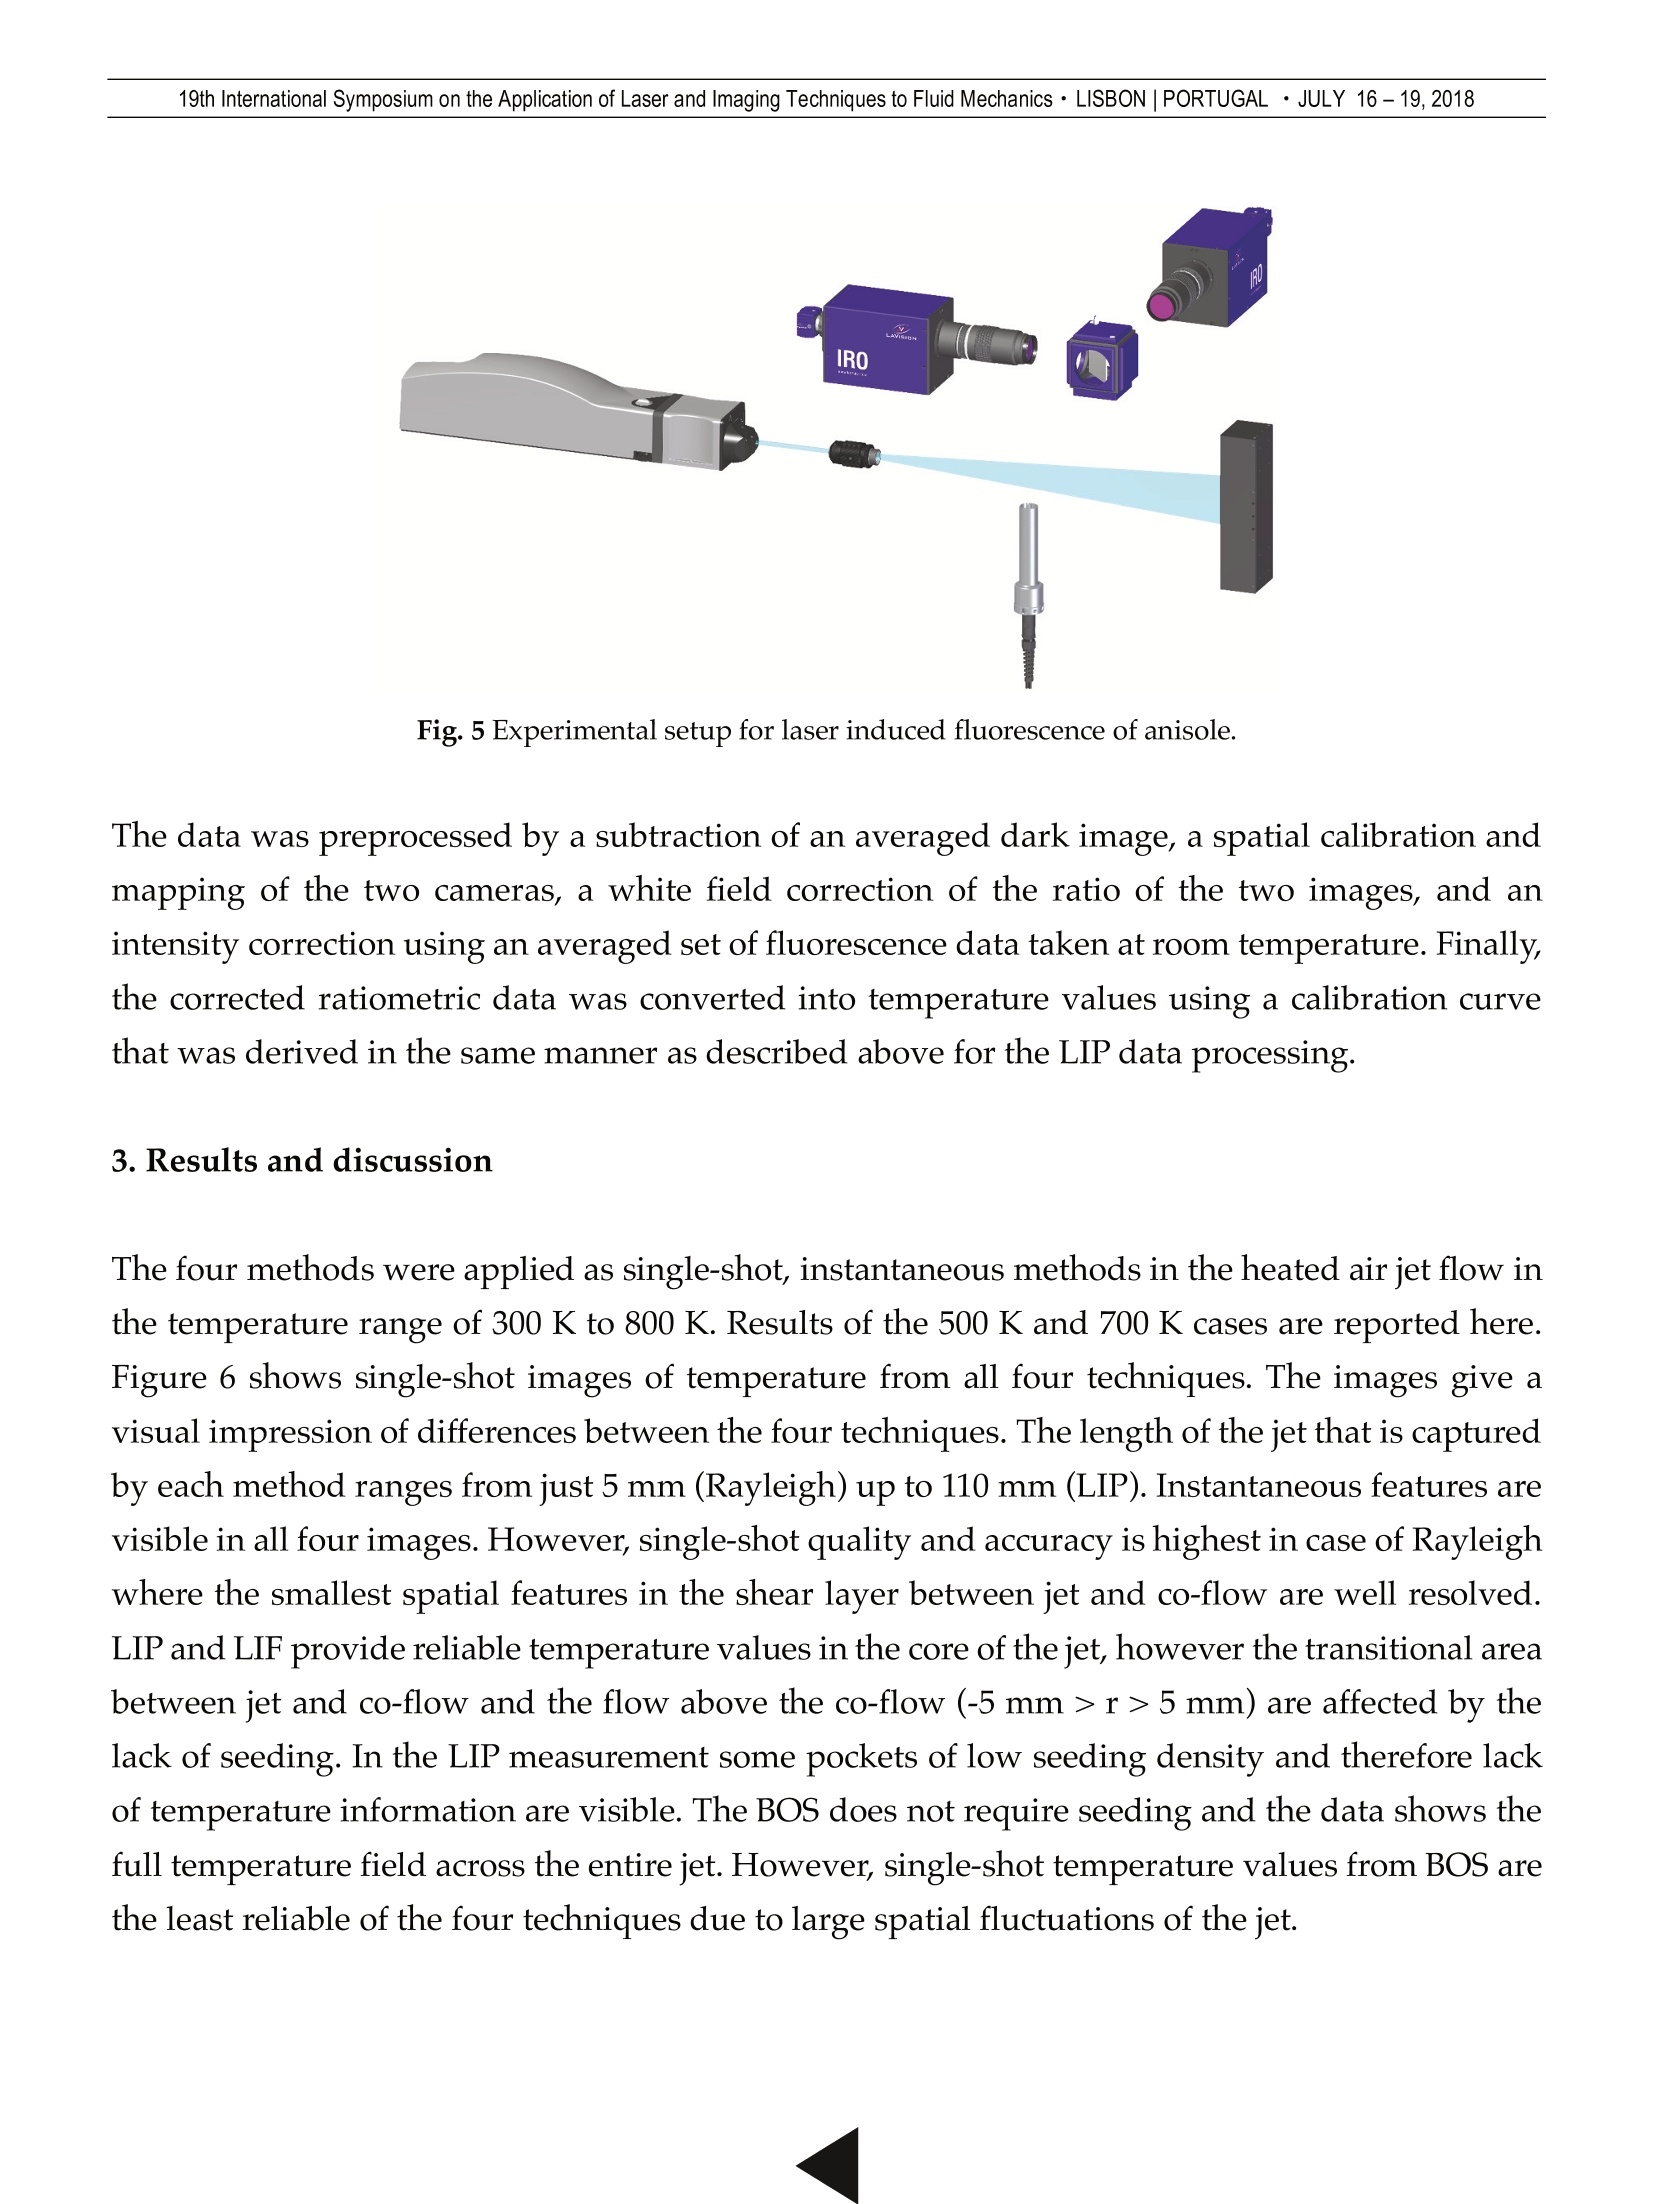
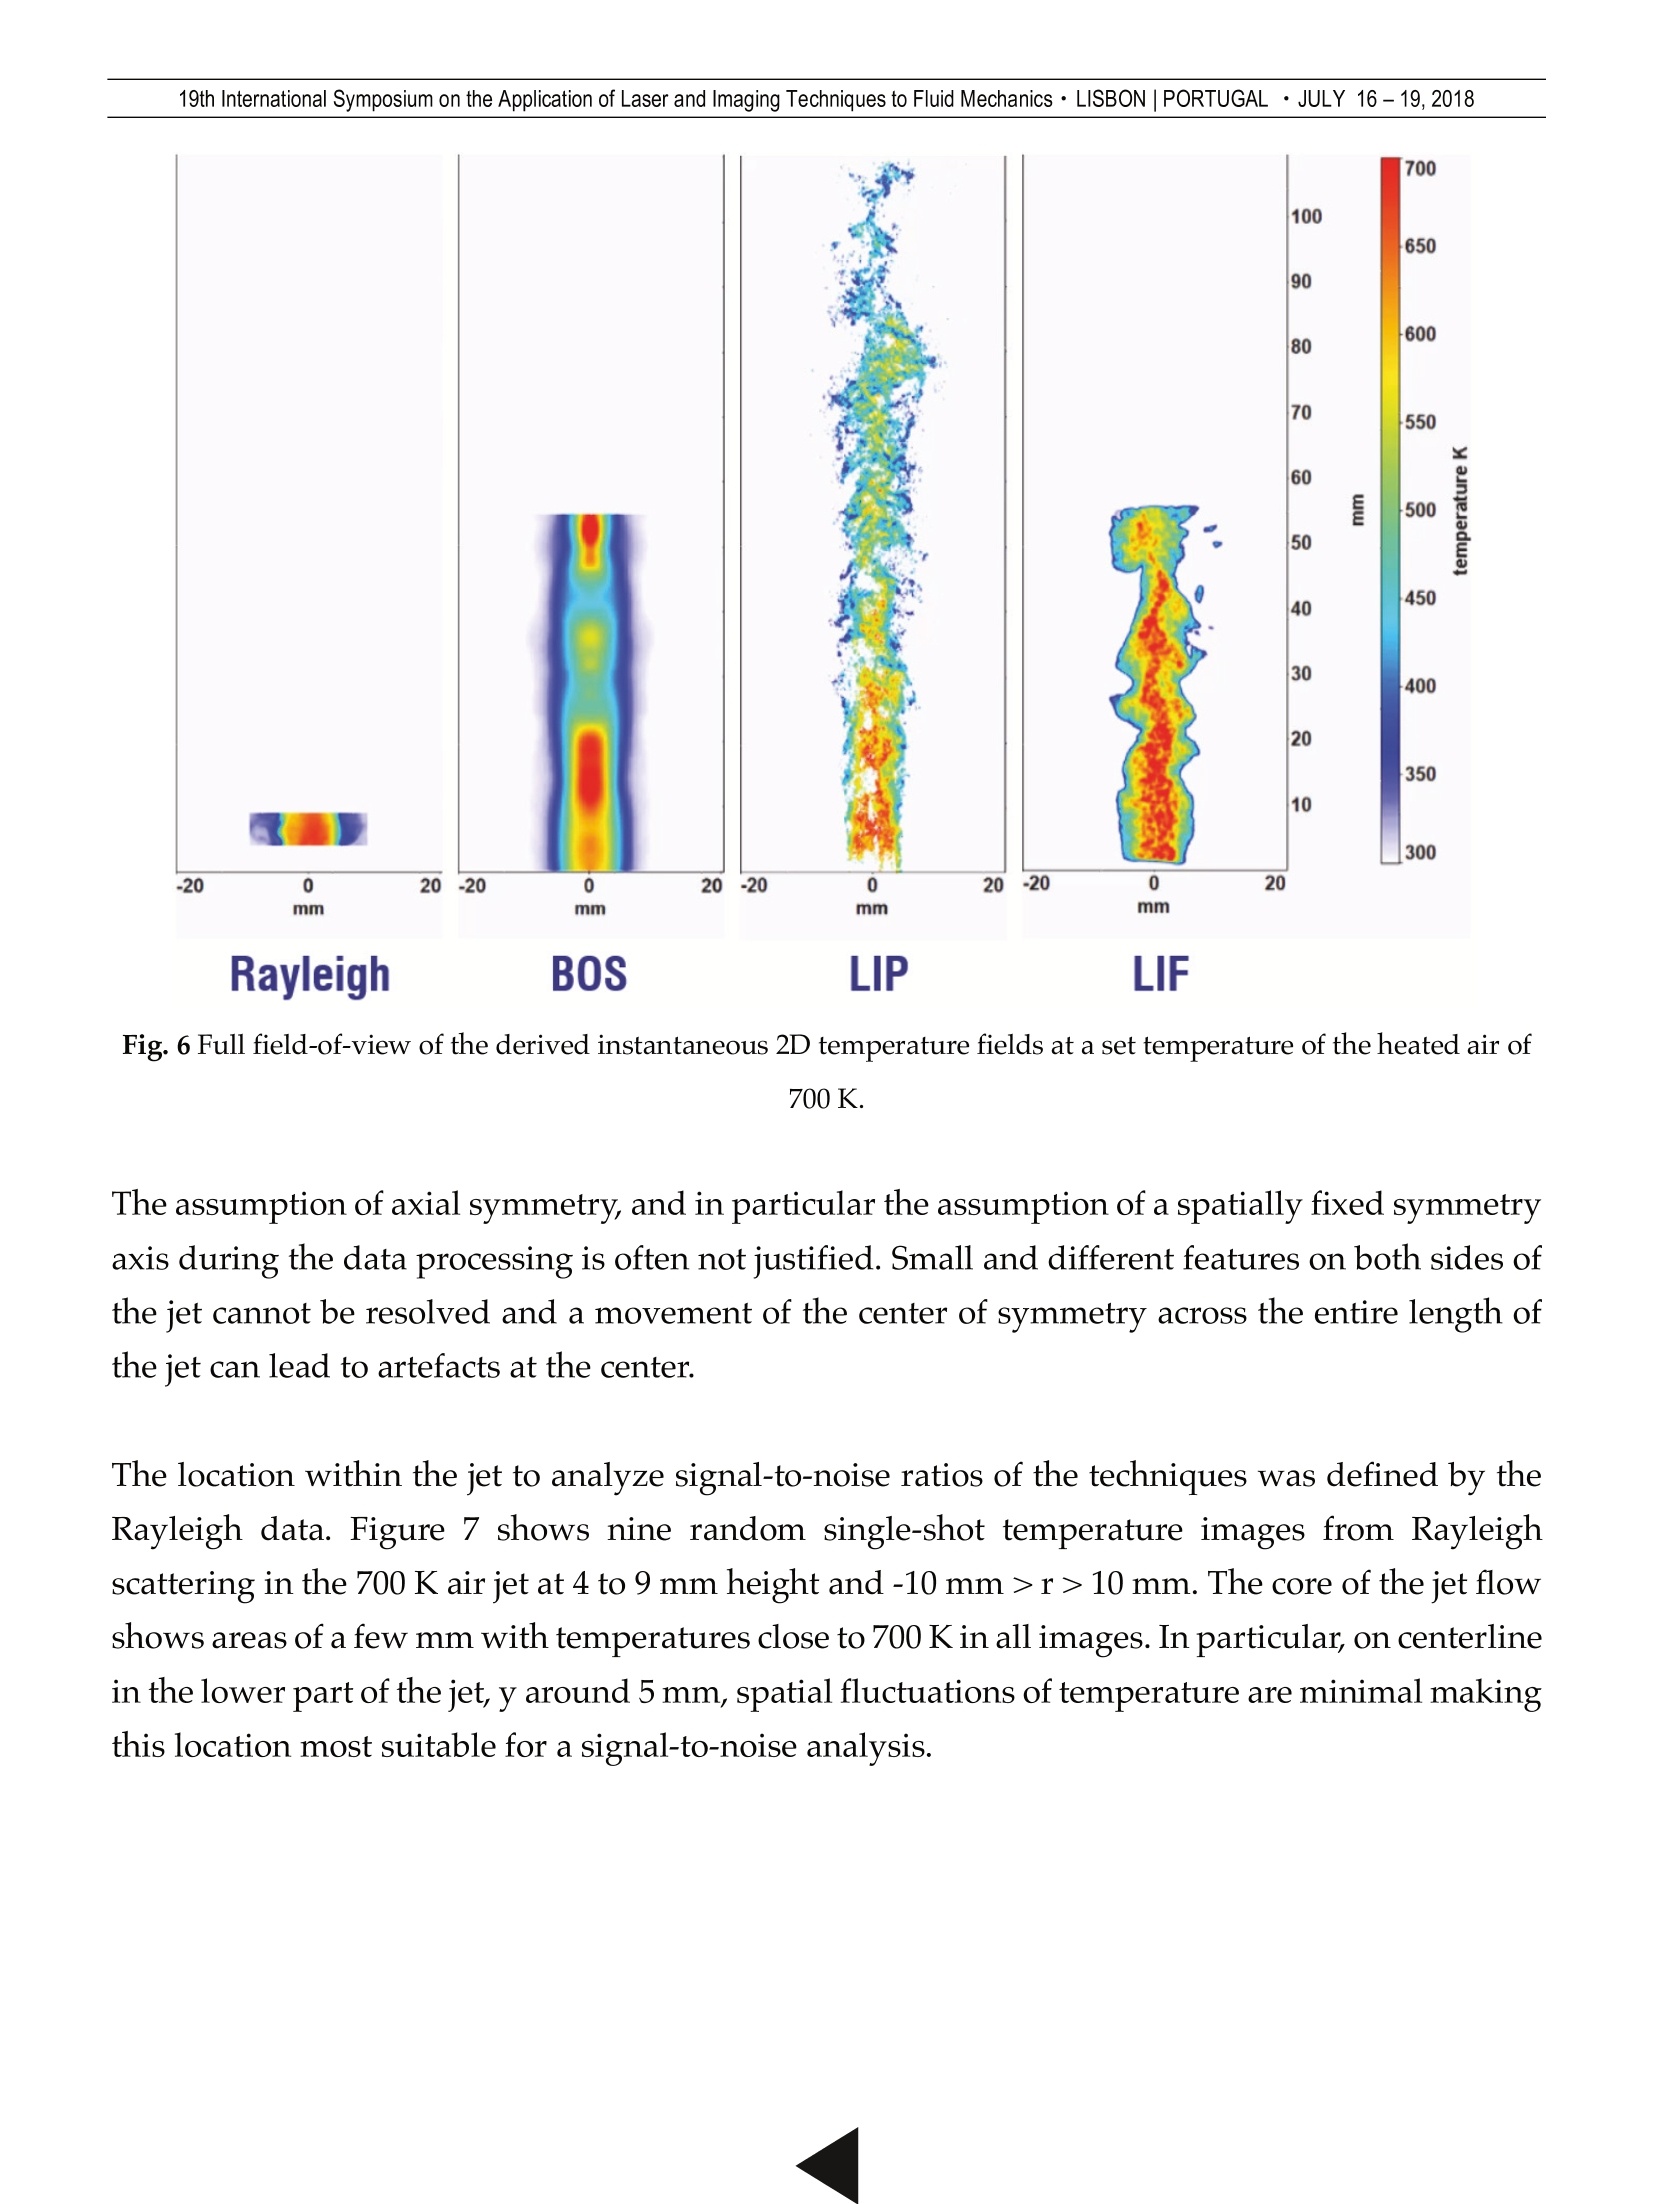
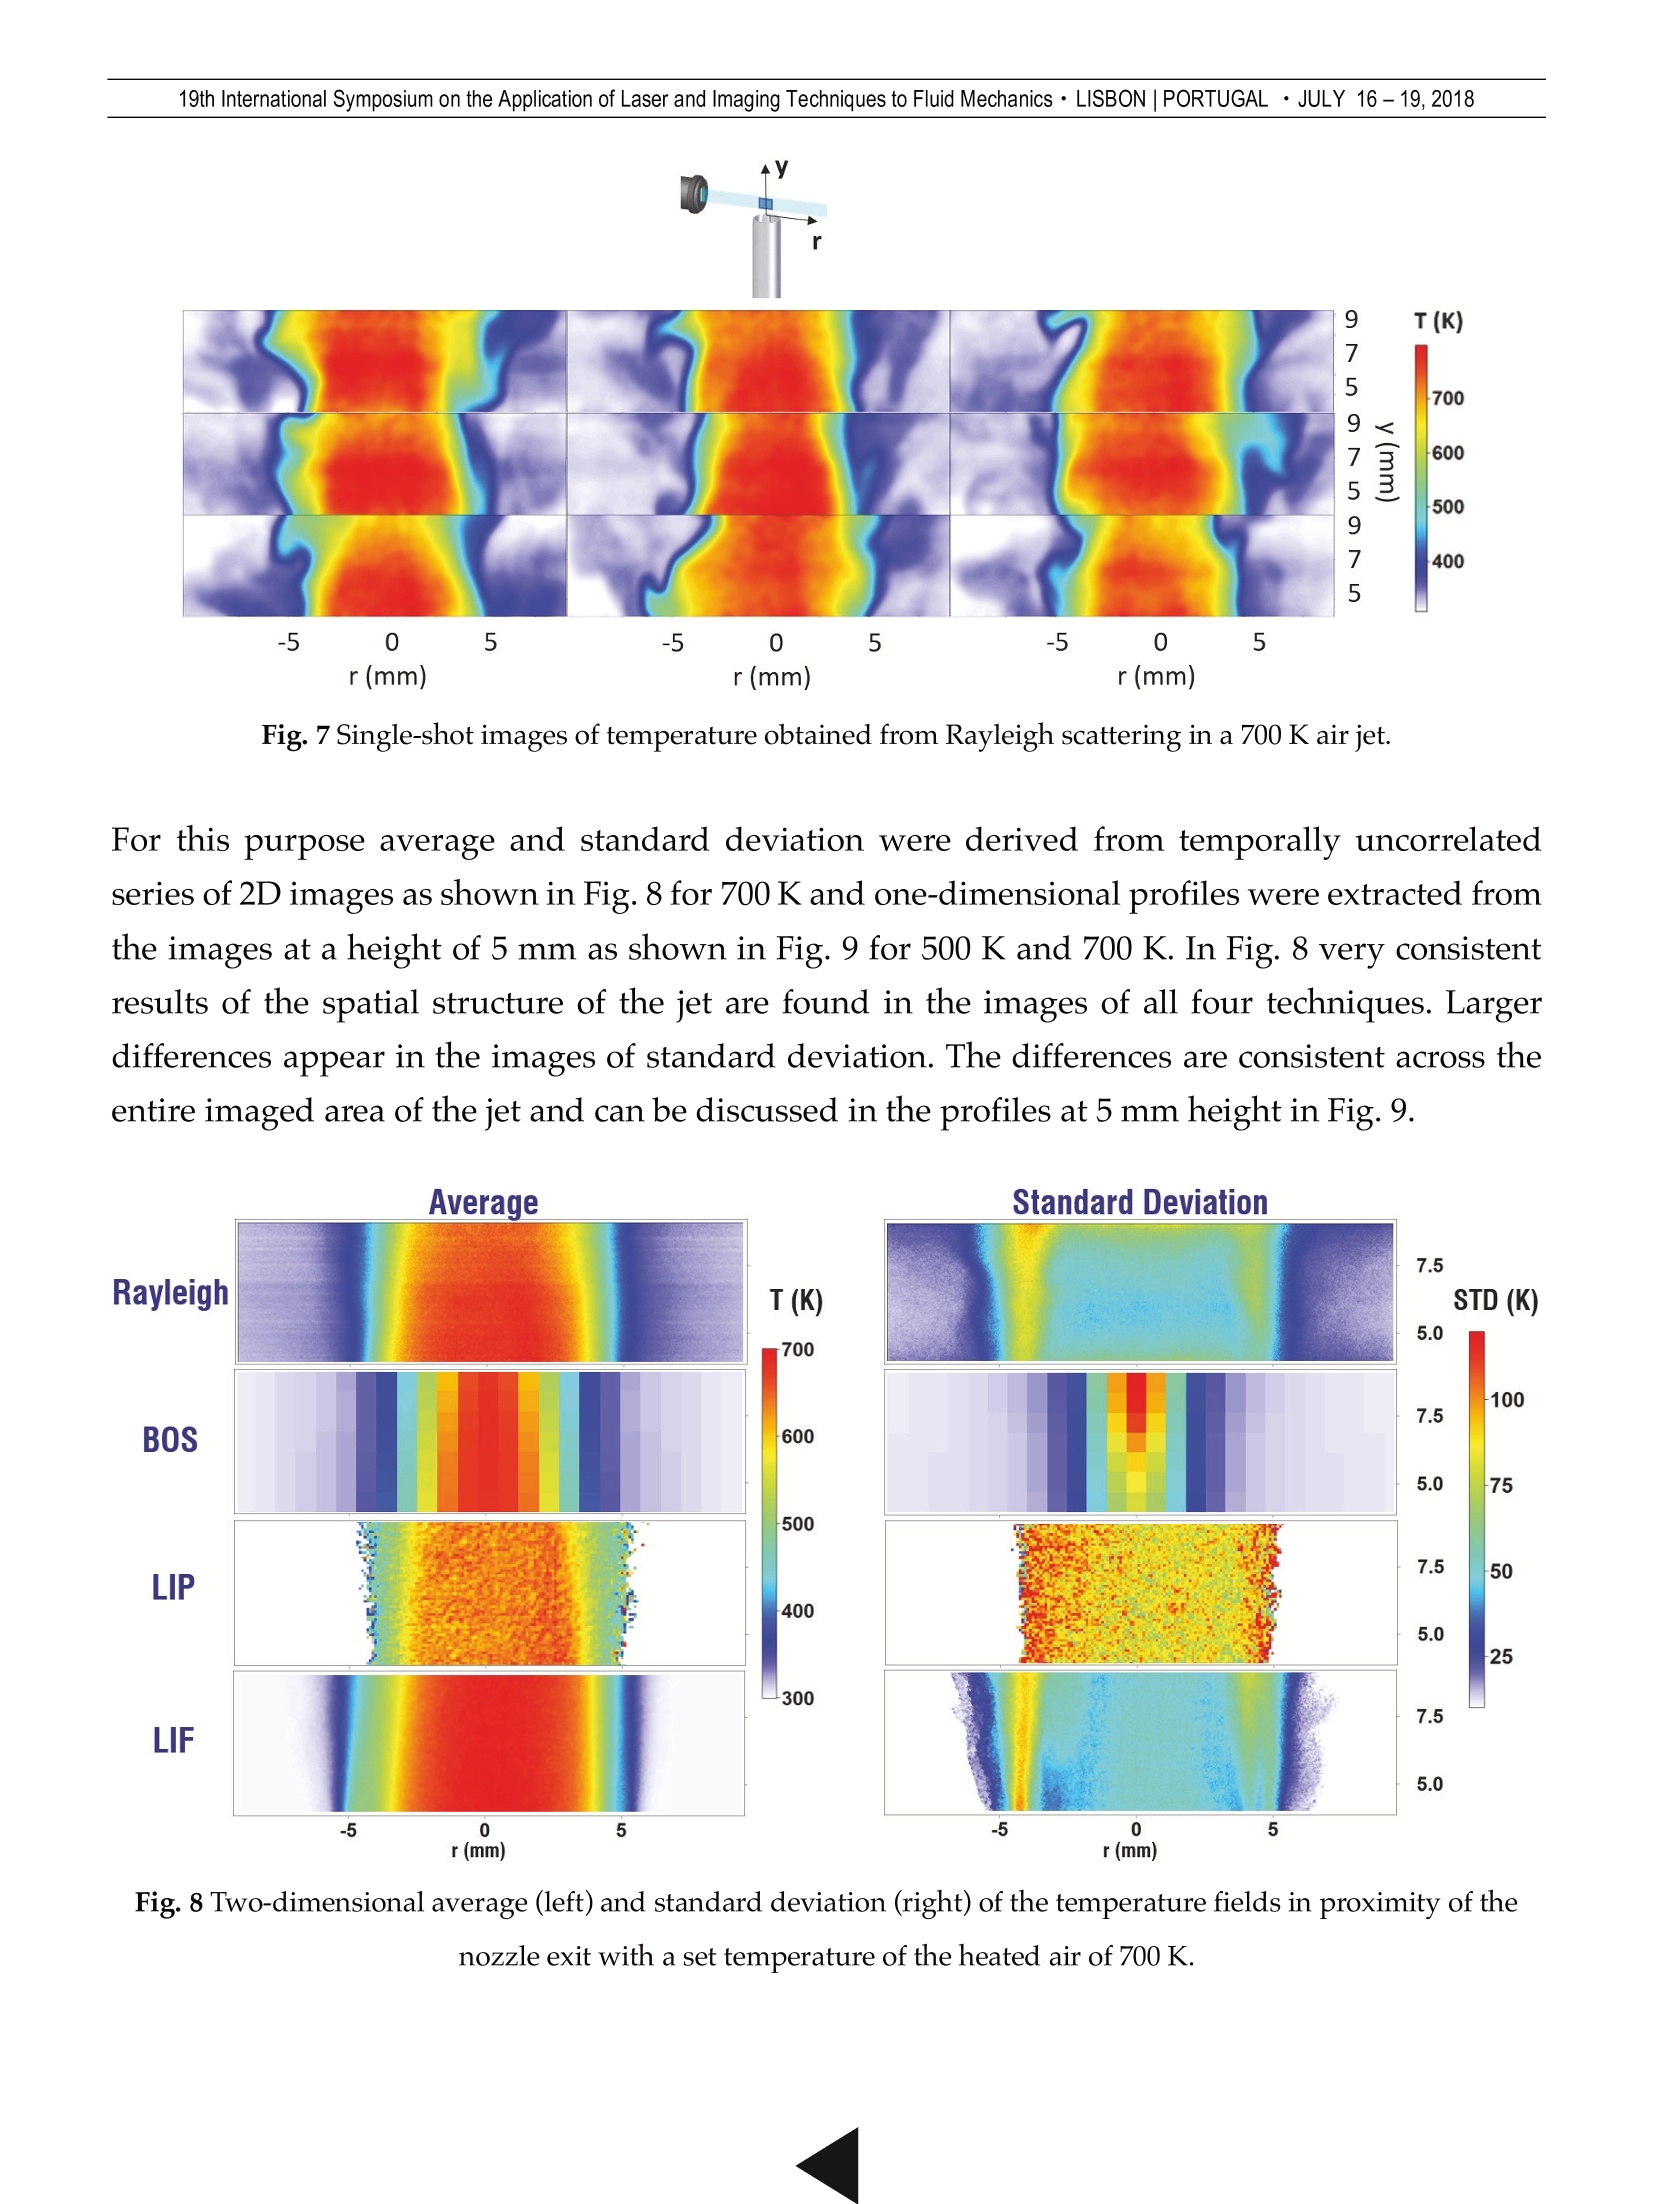
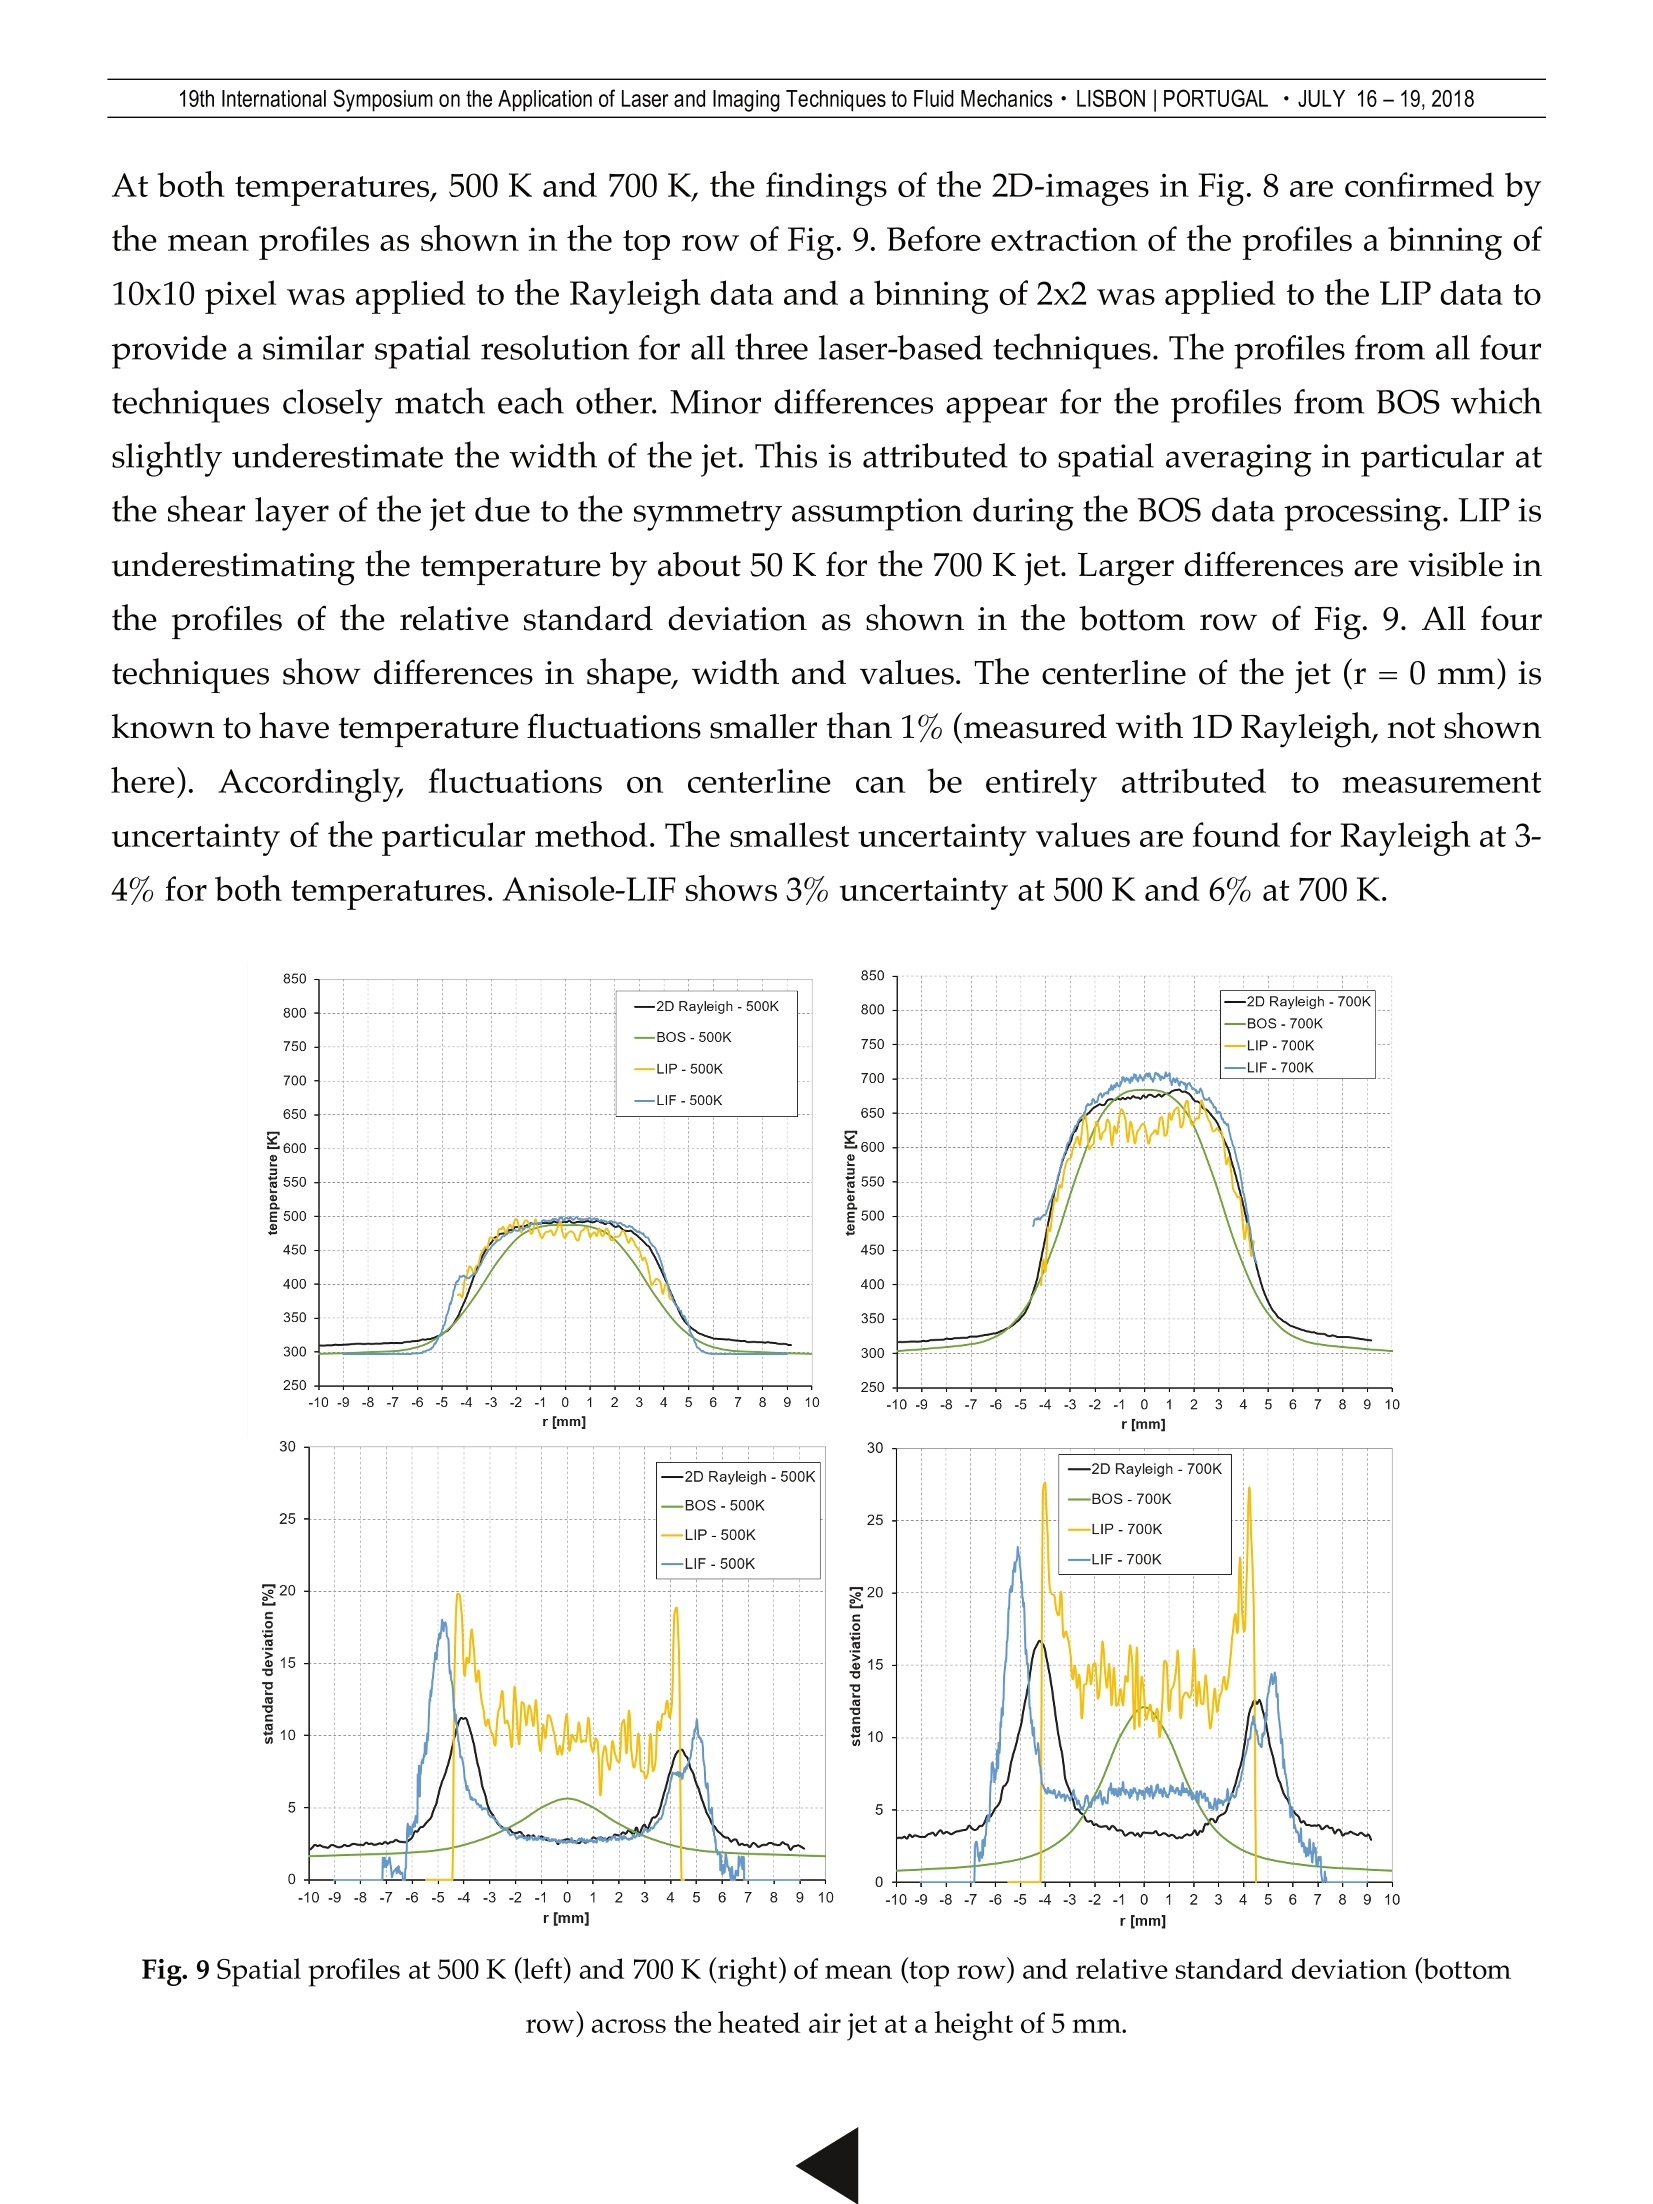
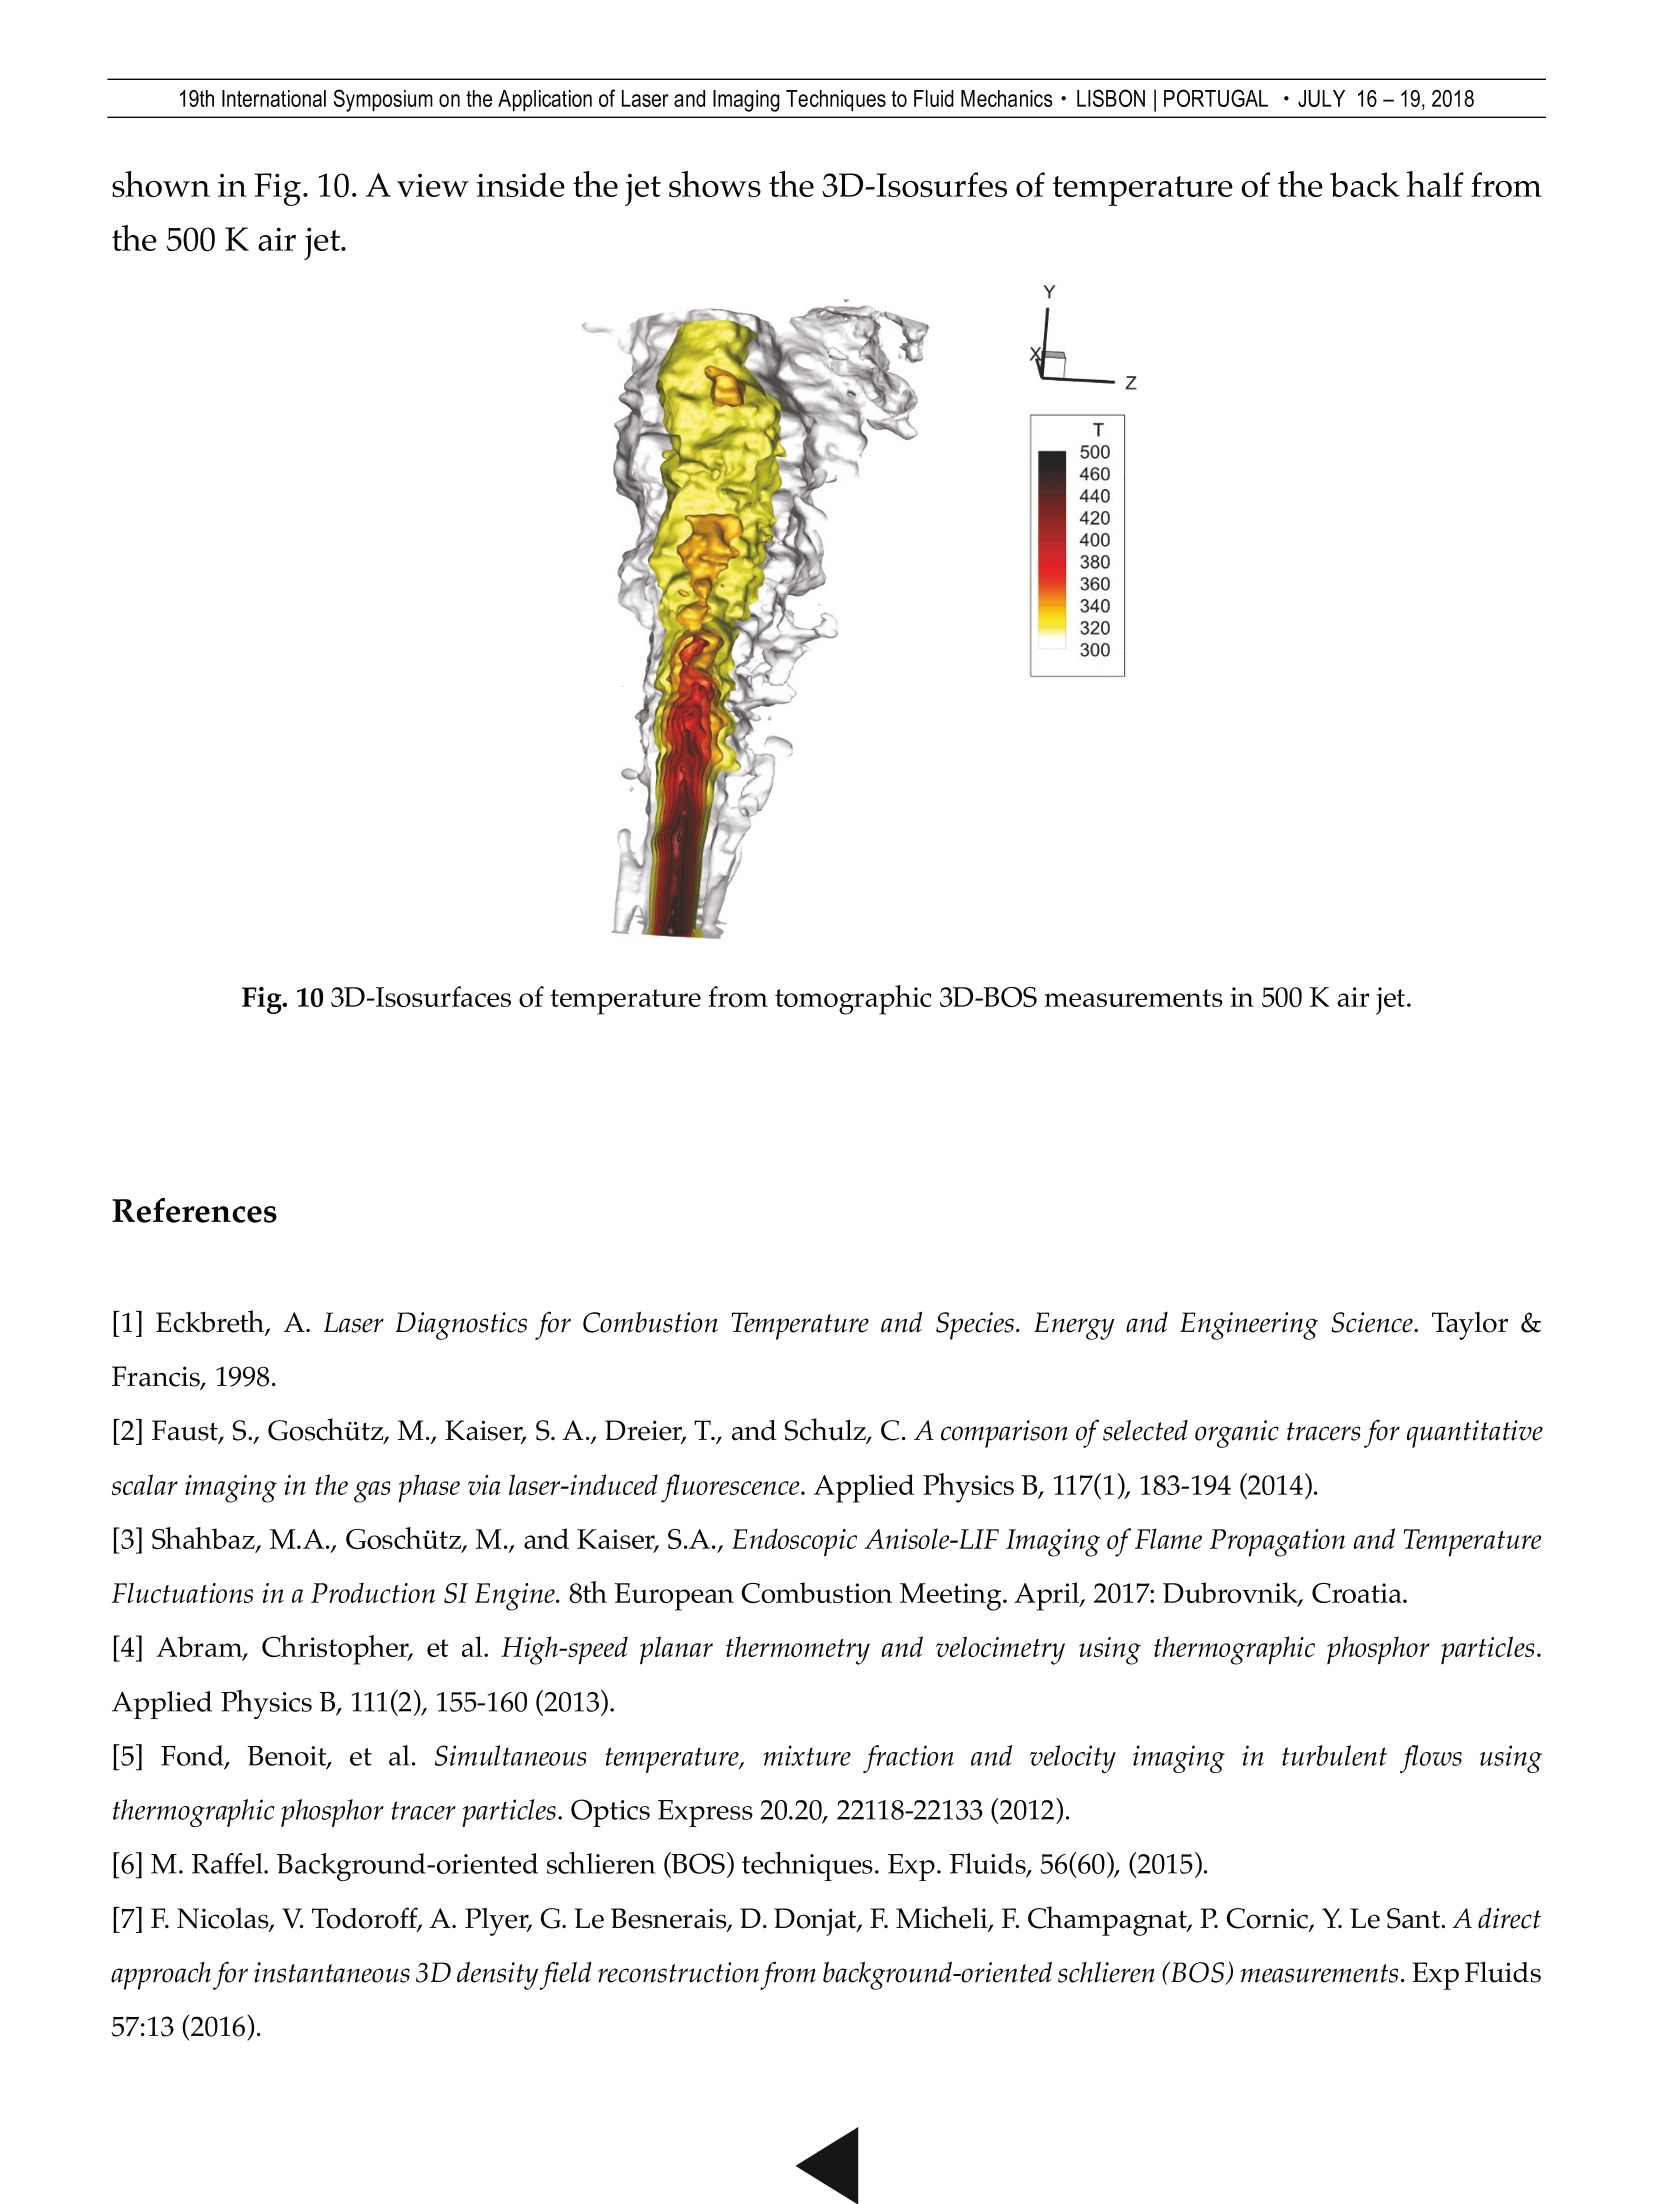
19th International Symposium on the Application of Laser and Imaging Techniques to Fluid Mechanics· LISBON |PORTUGAL· JULY 16-19,2018 Gas thermometry using four different optical methods Frederik Fuest*, Manuel Schutte, Stefan Seefeldt, Maximilian Psotta LaVision GmbH,Anna-Vandenhoeck-Ring 19, D-37081 Goettingen, Germany * Correspondent author: ffuest@lavision.com Keywords: Temperature measurements, Rayleigh, Anisole-LIF, BAM:Eu-LIP, BOS ABSTRACT An electrically heated air jet was used to compare four optical methods to measure gas temperatures in the range of300 K to 800 K. Three lased-based techniques were applied to obtain 2D-temperature fields: Rayleigh scattering, laserinduced fluorescence of anisole, and laser induced phosphorescence of BAM:Eu particles. Additionally, backgroundoriented schlieren was used to derive 2D-temperature fields assuming an axially symmetric flow. All four methodswere applied as single-shot, instantaneous methods and their particular signal-to-noise ratios and accuracies arediscussed along with advantages and disadvantages of each method and their possible experimental limitations. 1. Introduction Methods to measure temperature can be separated in two categories: invasive and non-invasive.Although invasive techniques are still widely applied in science and industry, the distortion of themeasurement object itself often makes them unfavorable, in particular for gaseous flows. Non-invasive gas thermometry makes use of optical properties of the investigated medium and theoften temperature sensitive interaction with electromagnetic radiation. In this work we comparefour more recently developed non-invasive techniques using a heated air jet flow in thetemperature range of 300 K to 800 K and discuss the particular advantages and disadvantages ofeach method. Three of the applied methods are lased-based techniques: Rayleighscattering [1], laser inducedfluorescence of anisole (LIF) [2,3], and laser induced phosphorescence of BAM:Eu (LIP) [4,5].Additionally, variations of the index of refraction due to the change in gas density are used toapply the background oriented schlieren technique (BOS) [6] as a forth and independent methodto derive 2D-temperature fields. 2. Experiment and data reduction Heated air jet The heated air flow that was used to compare four temperature measurement techniques wasissued from an inline heater for gaseous flows (Leister Technologies Deutschland)as shown in Fig.1. The heater was equipped with a jet nozzle with an inner diameter of 9 mm, and a surroundingco-flow with an inner diameter of 35 mm. The flowrates of the unheated air for the jet and co-flowwere adjusted using rotameters (Key Instruments, 30 lpm and 2x300 lpm) to 10 lpm and 200 lpm,respectively. The temperature of the air heater is controlled by a temperature sensor in proximityto the heating elements. The set temperature can be adjusted up to 1023 K in steps of 1 K andtypically stabilizes after 45 s. In this work measurements are reported at 500 K and 700 K. Fig. 13D-CAD drawing (left) and schematic (right) of the heated air jet. Laser Rayleigh scattering The experimental setup for the Rayleigh scattering technique is shown in Fig. 2. The output of afrequency-tripled Nd: Yag laser (Quantel Q-smart 850) at 355 nm was focused by a 500-mm plano-convex lens into a collimated light sheet with a height of 8 mm. Adjustable irises and tubes (notshown) were used to block stray light from surfaces close to the measurement volume. An energymonitor was used to record pulse-to-pulse fluctuations. The experiment was conducted with apulse energy of 60 mJ measured after the probe volume. The Rayleigh scattered light was detectedby a 12-bit 2 Megapixel CMOS camera (M-lite 2M) equipped with an intensifier (IRO). An 85-mmUV camera lens (f/2.8) in combination with extension tubes resulted in a projected spatialresolution of 10.5 um/ pixel at a total field-of-view of 20 mm by 13 mm. Fig. 2 Experimental setup for temperature measurements using Rayleigh scattering. Data preprocessing of the raw images was composed of the following steps: Subtraction of anaveraged set of dark images, subtraction of a linearly interpolated background determined on eachindividual image from above and below the imaged Rayleigh scattering signal of the laser sheet,a flat field and sheet correction using an averaged set of images at room temperature, and acorrection of the signal on individual images for pulse-to-pulse laser energy fluctuations whichwere captured by the energy monitor. Temperature is inverse proportional to the Rayleighscattering signal and a calibration factor was determined once using the averaged data set at roomtemperature. Backround Oriented Schlieren A schematic of the experimental setup for the BOS technique is shown in Fig. 3. The maincomponents of the setup are a CMOS camera with 5 megapixel (M-lite 5M) and a background dot-pattern with size of the dots of 350 um. The camera was equipped with a 35-mm camera lens(f/16). The image was focused on the dot-pattern that was placed at a distance of 500 mm fromthe jet centerline while the camera was 700 mm from the centerline. Accordingly, the imaged partof the dot-pattern was 265 mm by 318 mm with a projected resolution of 130 um/pixel. Thecorresponding field-of-view at the location of the jet was 144 mm by 173 mm at a projectedresolution of 70 um/pixel. An LED light source was used to illuminate the pattern and thereforeallow for a short exposure time of 200 us in order to capture the flow without motion blur. 19th International Symposium on the Application of Laser and Imaging Techniques to Fluid Mechanics· LISBON |PORTUGAL ·JULY 16-19,2018 Fig.3 Experimental setup for the background oriented schlieren technique. Data processing required a spatial calibration at the location of the dot-pattern, and the definitionof a reference image of the dot-pattern taken without the jet flow. A least-square-matchingalgorithm was used to determine the displacement of subsets of 41x41 pixels on the images of theheated air flow as compared to the reference image. The subset size with 2/3 of overlap resultedin a resolution of the displacement field of 900 um/pixel. The displacement in horizontal directionwas further processed using a subroutine from DLR Gottingen to compute the index of refractionfield. The routine required the definition of temperature and pressure at the side of the jet flow,the distance of the jet centerline to the dot-pattern, and the definition of the centerline of the jet onthe image. Assuming rotational symmetry of the flow the code iteratively derived the index ofrefraction field from integration starting outside of the jet towards the centerline. Finally, the jetcoordinate system was adapted by a second spatial calibration at the location of the jet andtemperature was computed from the index of refraction field using the Lorentz-Lorenz equation. Laser induced phosphorescence of BAM:Eu The experimental setup for laser induced phosphorescence of BAM:Eu particles is shown in Fig.4. The same laser as in the Rayleigh experiment provided a 80 mJ/pulse excitation at 355 nm forthe phosphorescence process at the location of the jet. Light sheet optics were used to form adivergent laser sheet of an average height of 150 mm. A seeding device was incorporated into theair supply before the heater in order to realize a particle-seeded jet flow. A beamsplitter reflectedlight with shorter wavelengths than 440 nm into the first camera and light with larger wavelengthswas transmitted into the second camera (both M-lite 2M). Bandpass filters at 425+/-25 nm and466+/-20 nm were used in front of 50-mm camera lenses (f/1.2). The configuration resulted in aprojected pixel resolution of 92 um/pixel and a total field-of-view of 180 mm by 113 mm. 19th International Symposium on the Application of Laser and Imaging Techniques to Fluid Mechanics· LISBON |PORTUGAL · JULY 16-19, 2018 Fig.4 Experimental setup for laser induced phosphorescence. Data preprocessing required the following steps: Subtraction of an averaged set of dark images,spatial calibration and mapping of the two channels, application of a threshold filter (intensitiesbelow 100 counts were set to zero) to suppress background noise around the seeded jet. The ratioof both images was further corrected using a white image taken from phosphorescence at roomtemperature in order to account for the optical characteristics of the filters, beamsplitter, andcamera lenses. Finally, the temperature was inferred from the corrected ratio values using acalibration curve. The ratio values for the calibration curve were obtained from small squares of15x15 pixels in the steady area of the jet flow 3 mm above the nozzle exit from 300 K to 800 K insteps of 100 K. Laser induced fluorescence ofanisole The experimental setup for Anisole-LIF is shown in Fig. 5. The same laser was used as in theRayleigh and phosphorescence experiment above but equipped with the harmonic generators inorder to produce a pulse of 15 mJ at 266 nm measured at the probe volume. Light sheet optics wereused to form a divergent laser light sheet of 55 mm height, respectively. A beamsplitter wasseparating the LIF signal at 310 nm. Two M-lite 2M cameras equipped with light intensifiers andbandpass filters in front of 100-mm UV camera lenses (f/4) were used to acquire the LIF signal intwo narrow-bandwidth channels at 280+/-10 nm and 320+/-20 nm. The resulting field-of-viewwas 148 mm by 175 mm at a projected resolution of 72 um/pixel. Fig. 5 Experimental setup for laser induced fluorescence of anisole. The data was preprocessed by a subtraction of an averaged dark image, a spatial calibration andmapping of the two cameras, a white field correction of the ratio of the two images, and anintensity correction using an averaged set of fluorescence data taken at room temperature. Finally,the corrected ratiometric data was converted into temperature values using a calibration curvethat was derived in the same manner as described above for the LIP data processing. 3. Results and discussion The four methods were applied as single-shot, instantaneous methods in the heated air jet flow inthe temperature range of 300 K to 800 K. Results of the 500 K and 700 K cases are reported here.Figure 6 shows single-shot images of temperature from all four techniques. The images give avisual impression of differences between the four techniques. The length of the jet that is capturedby each method ranges from just 5 mm (Rayleigh) up to 110 mm (LIP). Instantaneous features arevisible in all four images. However, single-shot quality and accuracy is highest in case of Rayleighwhere the smallest spatial features in the shear layer between jet and co-flow are well resolved.LIP and LIF provide reliable temperature values in the core of the jet, however the transitional areabetween jet and co-flow and the flow above the co-flow (-5 mm> r>5 mm) are affected by thelack of seeding. In the LIP measurement some pockets of low seeding density and therefore lackof temperature information are visible. The BOS does not require seeding and the data shows thefull temperature field across the entire jet. However, single-shot temperature values from BOS arethe least reliable of the four techniques due to large spatial fluctuations of the jet. Rayleigh BOS LIP LIF Fig.6 Full field-of-view of the derived instantaneous 2D temperature fields at a set temperature of the heated air of700 K. The assumption of axial symmetry, and in particular the assumption of a spatially fixed symmetryaxis during the data processing is often not justified. Small and different features on both sides ofthe jet cannot be resolved and a movement of the center of symmetry across the entire length ofthe jet can lead to artefacts at the center. The location within the jet to analyze signal-to-noise ratios of the techniques was defined by theRayleigh data. Figure 7 shows nine random single-shot temperature images from Rayleighscattering in the 700 K air jet at 4 to 9 mm height and -10 mm >r>10 mm. The core of the jet flowshows areas of a few mm with temperatures close to 700 K in all images. In particular, on centerlinein the lower part of the jet, y around 5 mm, spatial fluctuations of temperature are minimal makingthis location most suitable for a signal-to-noise analysis. Fig.7 Single-shot images of temperature obtained from Rayleigh scattering in a 700 K air jet. For this purpose average and standard deviation were derived from temporally uncorrelatedseries of 2D images as shown in Fig. 8 for 700 K and one-dimensional profiles were extracted fromthe images at a height of 5 mm as shown in Fig. 9 for 500 K and 700 K. In Fig. 8 very consistentresults of the spatial structure of the jet are found in the images of all four techniques. Largerdifferences appear in the images of standard deviation. The differences are consistent across theentire imaged area of the jet and can be discussed in the profiles at 5 mm height in Fig. 9. Average Standard Deviation 7.5 STD (K) 5.0 100 7.5 5.0 75 7.5 50 5.0 25 7.5 5.0 -5 0 5 r(mm) Fig. 8 Two-dimensional average (left) and standard deviation (right) of the temperature fields in proximity of thenozzle exit with a set temperature of the heated air of 700 K. At both temperatures, 500 K and 700 K, the findings of the 2D-images in Fig. 8 are confirmed bythe mean profiles as shown in the top row of Fig. 9. Before extraction of the profiles a binning of10x10 pixel was applied to the Rayleigh data and a binning of 2x2 was applied to the LIP data toprovide a similar spatial resolution for all three laser-based techniques. The profiles from all fourtechniques closely match each other. Minor differences appear for the profiles from BOS whichslightly underestimate the width of the jet. This is attributed to spatial averaging in particular atthe shear layer of the jet due to the symmetry assumption during the BOS data processing. LIP isunderestimating the temperature by about 50 K for the 700 K jet. Larger differences are visible inthe profiles of the relative standard deviation as shown in the bottom row of Fig. 9. All fourtechniques show differences in shape, width and values. The centerline of the jet (r=0 mm) isknown to have temperature fluctuations smaller than 1%(measured with 1D Rayleigh, not shownhere). Accordingly, fluctuations on centerline can be entirely attributed to measurementuncertainty of the particular method. The smallest uncertainty values are found for Rayleigh at 3-4% for both temperatures. Anisole-LIF shows 3% uncertainty at 500 K and 6% at 700K. r[mm] r[mm] Fig. 9 Spatial profiles at 500 K (left) and 700 K (right) of mean (top row) and relative standard deviation (bottomrow) across the heated air jet at a height of 5 mm. This increase is attributed to the decreasing temperature-sensitivity of anisole towards largertemperatures. 10% and 13% uncertainty are found for the LIP method. Due to the line-of-sightnature of the BOS technique, the standard deviation values from BOS on centerline are caused byline-of-sight integrated fluctuations of the jet on centerline. Therefore, they cannot directly be usedto deduce an independently valid measurement uncertainty of the technique. However, the valueis a sensitive quantity and parameter variations of spatial averaging in the experiment and dataprocessing, i.e.f-number and subset-size, have shown that this value is a useful indication of thededuced mean temperature being reliable or not. For reliable average data it should be smallerthan 20%.At-5 mm>r>5 mm the standard deviation profiles of LIF and LIP are affected by thelack of seeding.However, this is not a general disadvantage, since LIF experiments with a seededco-flow have shown that the differences at these radial locations to the Rayleigh profiles vanish. 4. Conclusions and Outlook Rayleigh scattering provides to most accurate and precise temperature results of the four methods.Up to temperatures of 500 K LIF produces very similar results. LIF and LIP are limited in theirtemperature range and cannot be applied above 800 K while Rayleigh and BOS are not limited inmaximum temperature. The best spatial resolutions of less than 100 um are achieved usingRayleigh or LIF. BOS in particular convinces by the simplicity and low cost of the experimentalsetup. Temperature calibration is straightforward for Rayleigh and BOS, but requires a fulltemperature range calibration for LIF and LIP. It should be noted that Rayleigh generally relies onthe knowledge of the local relative Rayleigh scattering cross section in the probe volume. This candecrease the accuracy if applied to mixing processes of different species or reacting flows. Anadvantage of LIF and LIP is their ratiometric nature. Laser sheet and energy fluctuations arecancelling in the division of the images. Additionally, the detection through narrow bandpathfilters at different wavelengths than the excitation wavelength makes the signal much less proneto errors from straylight. LIF, LIP, and BOS can be applied to large field-of-views while theweakness of the Rayleigh scattering process limits typical laser sheet heights to a few centimeters. In order to overcome limitations that come along with the necessary symmetry assumption in 2D-BOS temperature measurements recent advances havesuccessfullydemonstratedtomographically reconstructed 3D-BOS measurements using multiple camera setups, e.g. Nicolaet al. [7]. A first result from a collaboration between LaVision, Gottingen and ONERA, France is shown in Fig. 10. A view inside the jet shows the 3D-Isosurfes of temperature of the back half fromthe 500 K air jet. -Z Fig. 10 3D-Isosurfaces of temperature from tomographic 3D-BOS measurements in 500 K air jet. ( References ) ( [1] Eckbreth, A . Laser Diagnostics f o r Combustion Temperature and Spec i es. Energy and Engineering Science. Taylor & Francis, 1998. ) ( [2] Faust, S ., Goschiitz, M., K a iser, S. A . , D r eier, T. , and Schulz, C. A c o mparison of se l ected organic trace r s for quantitativescalar imaging in the gas phase via laser-induced fluorescence. Applied Ph y sics B, 1 17 ( 1), 183-194 (2014). ) ( [3] Shahbaz, M.A., Goschiitz, M., a nd Kaiser, S.A., Endoscopic Anisole-LIF Imaging of Flame Propagation and TemperatureFluctuations in a Production SI Engin e . 8th European Combustion M eeting. April, 2017: Dubrovnik, Croatia. ) ( [4] Abram, C h ristopher, et al. High-speed planar the r mometry and veloc i metry using thermo g raphic phosphor particles.Applied Physics B, 111(2), 155-160(2013). ) ( [5] Fond, B enoit, e t a l. Simultaneous t emperature, m ixture f raction and velocity imaging in turbulent flows usingthermographic phosphor tracer particles. Optics Express 20.20, 22118-22133 (2012). ) ( [6]M. Raffel. Background-oriented schlieren (BOS) techniques. Exp. Fluids, 56(60), ( 2015). ) ( [7]F. Nicolas, V. Todoroff, A. Plyer, G. Le Besnerais, D. Donjat, F. M icheli, F. Champagnat, P. Cor n ic, Y. Le S ant. A directapproach for instantaneous 3D density field reconstruction from background-oriented schlieren (BOS)measurements. Exp Fluids 57:13(2016). ) 谈到温度测量,人们自然会想到温度计,热电偶,红外热像仪等装置。但这些方法要么是介入式测量,要么是近似的,难以严格定量的测量。红外热像仪用的很多,但红外热像仪的问题在于只能测量物体表面的温度,并且因其测量原理基于普朗克黑体辐射定律,所以定量测量的准确度和被测对象的材料属性高度相关,需要复杂的标定修正过程。故这些方法,一般难于用到燃烧,流体等空气动力学研究对象的温度场测量中。气体温度场的光学非介入式测量具有广泛的应用需求。 这里概要介绍四种非介入式温度场测量方法--瑞利散射测温(Rayleigh),激光诱导苯甲醚荧光(LIF),激光诱导BAM:Eu磷光(LIP)和背景指向纹影(BOS)。实验测量对象如下图所示加热空气喷射: 该喷嘴的加热空气温度范围在300-800K。实验在500K和800K两个温度上进行。1.激光瑞利散射测温:测量装置如下图所示: 激光照明采用Quantel Q-smart 850型三倍频355 nm 输出。采用在线能量监视器实时监测激光能量。相机采用12比特2百万像素的CMOS相机(M-lite 2M)。配备25毫米大孔径图像增强器(IRO)。镜头选用85毫米焦距高分辨率紫外镜头。数值孔径2.8。成像测量视场为20mmX13mm。空间分辨率为10.5微米/像素。成像测量结果需经过消除暗背景,片光畸变矫正,平场修正,脉冲间能量起伏修正,最后经过求倒数,获得和温度成正比的相对温度场图像,再经过标定获得定量温度场。下图为测量结果:2.背景指向纹影(BOS)下图为BOS测量装置示意图: 测量的核心部件为一台5百万像素的M-lite 5M型CMOS相机和一块具有随机分布点阵图案的背景板。成像视场为144mmX173mm。空间分辨率为70 微米/像素。采用脉冲宽度为200微秒的LED光照明以避免图像模糊。 数据处理过程包括点阵位置空间比例尺标定,用最小二乘法匹配(LSM)算法,问询域设置为41x41个像素,进行点阵偏移变形量追踪计算。通过偏移变形量,计算折射率场。最后通过折射率场,和二次空间标定并利用洛伦兹-洛伦茨方程求出温度。3. 激光诱导BAM:Eu磷光(LIP)测量装置如下图所示: 激光光源采用和瑞利散射测温相同的激光器型号。输出激光波长355nm。单脉冲能量80毫焦/脉冲。需要一台粒子发生器将粒子注入到被测空气流中。用一台分光器,将波长短于440nm的光分量反射到一台相机中,长于这个波长的光分量进入到另外一台相机中。两台相机的型号都是M-Lite2M。测量视场为180mm x113mm。空间分辨率92μm/像素。 数据处理过程包括,消除暗背景。两通道图像空间标定,应用阈值滤波,白图像修正。最后经过温度曲线标定,得到温度场分布。4.激光诱导苯甲醚荧光测温测量装置如下图所示: 测量装置和LIP方法很类似,依然用的是相同的脉冲激光器,但选用的是其4倍频266nm输出。单脉冲输出能量15毫焦@266nm。两台M-lite 2M 相机测量分光片分开的两个波段的苯甲醚荧光信号。测量视场为148 mm X 175 mm。空间分辨率72 微米/像素。 数据处理包含暗背景消除,双相机图像空间标定,白场修正,荧光室温本地修正以及温度标定过程。四种测量方法所得结果比较:空气喷嘴温度设置为700K时,四种测量方法给出的全场2D温度分布温度700K空气喷嘴近喷口区域两维平均温度场(左)和均方根偏差图(右) 温度500 K (左) 和 700 K (右),平均值 (上行) 和相对标准偏差(下行)在距离喷嘴上方5毫米处穿过喷嘴的空间分布曲线。总结及展望: 瑞利方法能给出精确的结果。LIF方法和LIP方法可以有效应用在温度不高于500K的场合。瑞利方法和BOS方法对测温上限无限制。瑞利和LIF方法均可给出优于100微米的测量空间分辨率。但BOS方法的最大特点是简单,设备造价低,易于实现。 在标定方面,瑞利和BOS方法的标定简单而直接。但瑞利方法在有混合过程,多种组分和反应过程的时候,其标定变得复杂。LIF和LIP方法则需要对测量的全部温度范围进行标定。 LIF,BOS和LIP都可以测量较大视场,但瑞利散射方法由于其信号特别微弱,所以只能测量几个厘米宽的光带上的信号。 BOS方最新的进展是采用多台相机从多个角度获得多个BOS成像结果,并利用层析重构原理,得到非对称体视温度场分布。下面图像显示的是LaVision公司和法国的ONERA合作所获得的初步结果:层析3D-BOS测量500K空气喷嘴的3D-等温面图
确定
还剩9页未读,是否继续阅读?

产品配置单


北京欧兰科技发展有限公司为您提供《气体中温度场检测方案(工作站及软件)》,该方案主要用于空气中温度场检测,参考标准--,《气体中温度场检测方案(工作站及软件)》用到的仪器有LaVision DaVis 智能成像软件平台、德国LaVision PIV/PLIF粒子成像测速场仪、PLIF平面激光诱导荧光火焰燃烧检测系统
推荐专场


相关方案
更多
该厂商其他方案
更多