


方案详情
文
Low-rise buildings located in the urban areas are generally surrounded by buildings of similar
size. The interference of surrounding buildings has been found to be significant on wind loads in
straight-line winds. In this study, systematic experiments of tornado-induced wind loads and flow
patterns around a typical low-rise gable-roof building with different layouts of surrounding
buildings were carried out in a laboratory. Effects of spacing, height ratios of the surrounding
buildings to the test building and specific building orientations were considered. The results
indicate that the reduction of the horizontal load is caused by sheltering effect from the
surrounding buildings. The uplift load, however, could increase or decrease dependent on
building orientation, layout and the type of the surrounding buildings. The complicated flow
patterns around the test building are discussed and correlated to the wind loads. This study
would improve the understanding of tornado-induced loads on a low-rise gable-roof building
方案详情

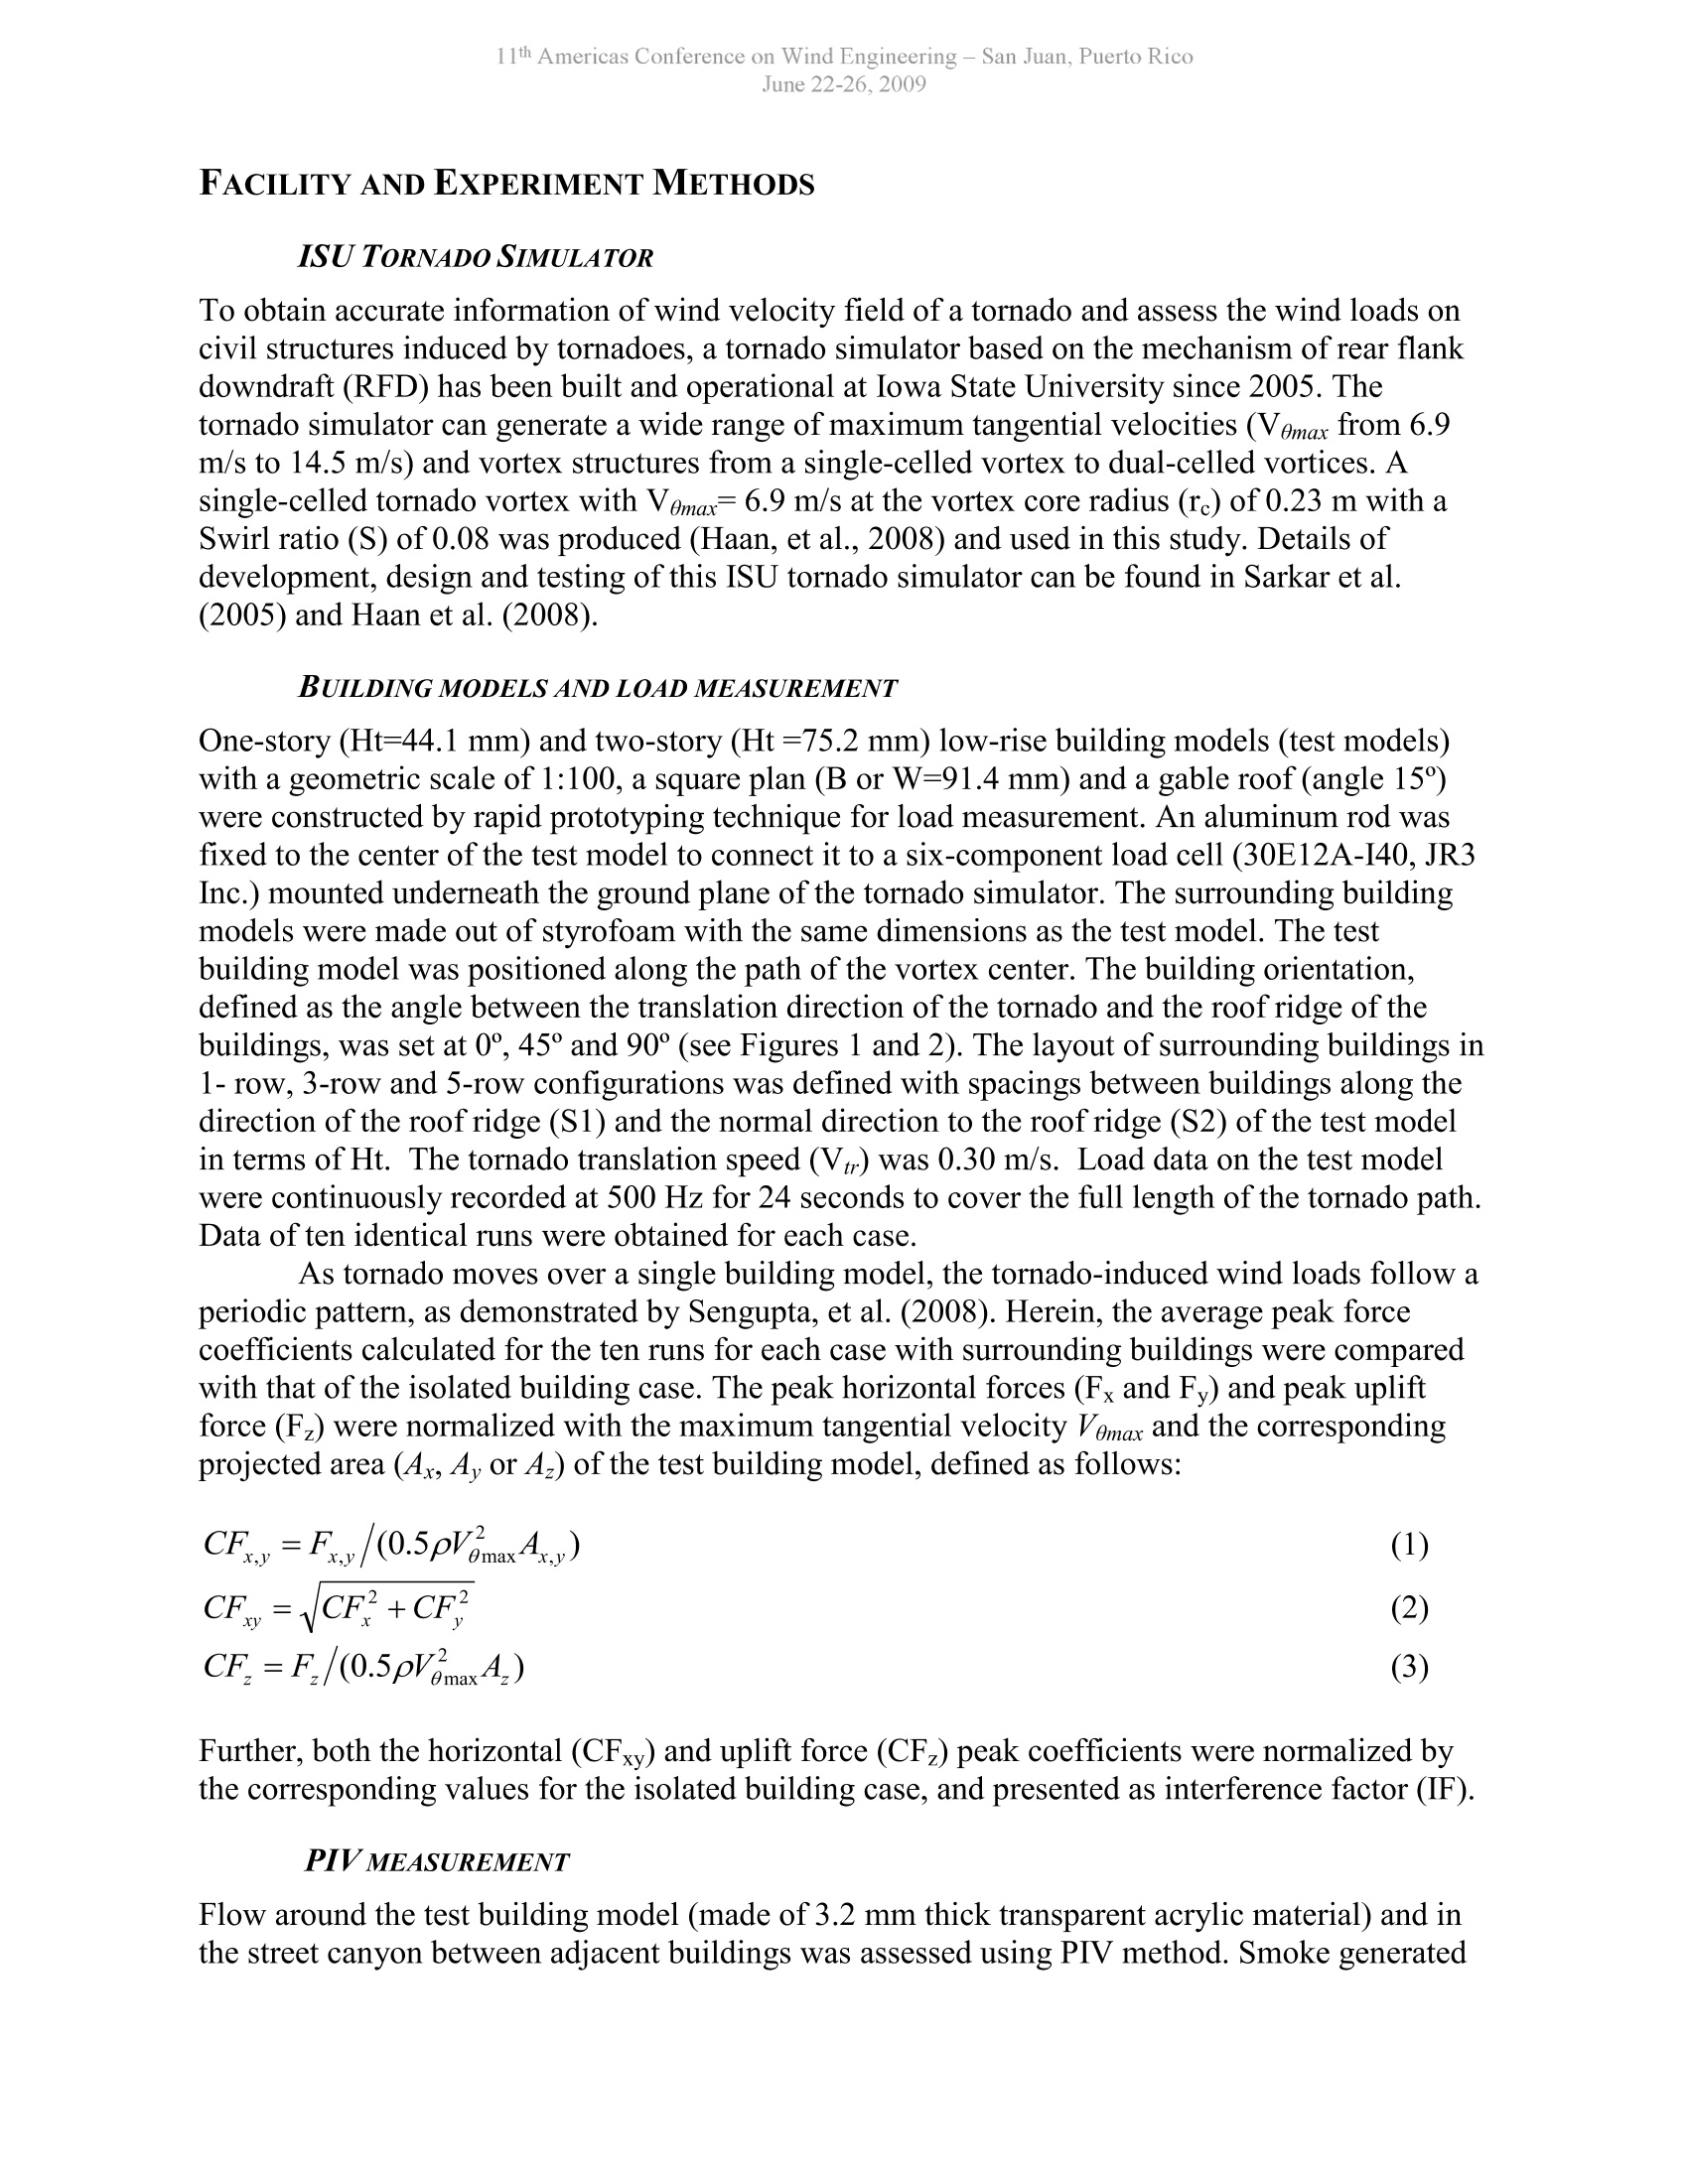
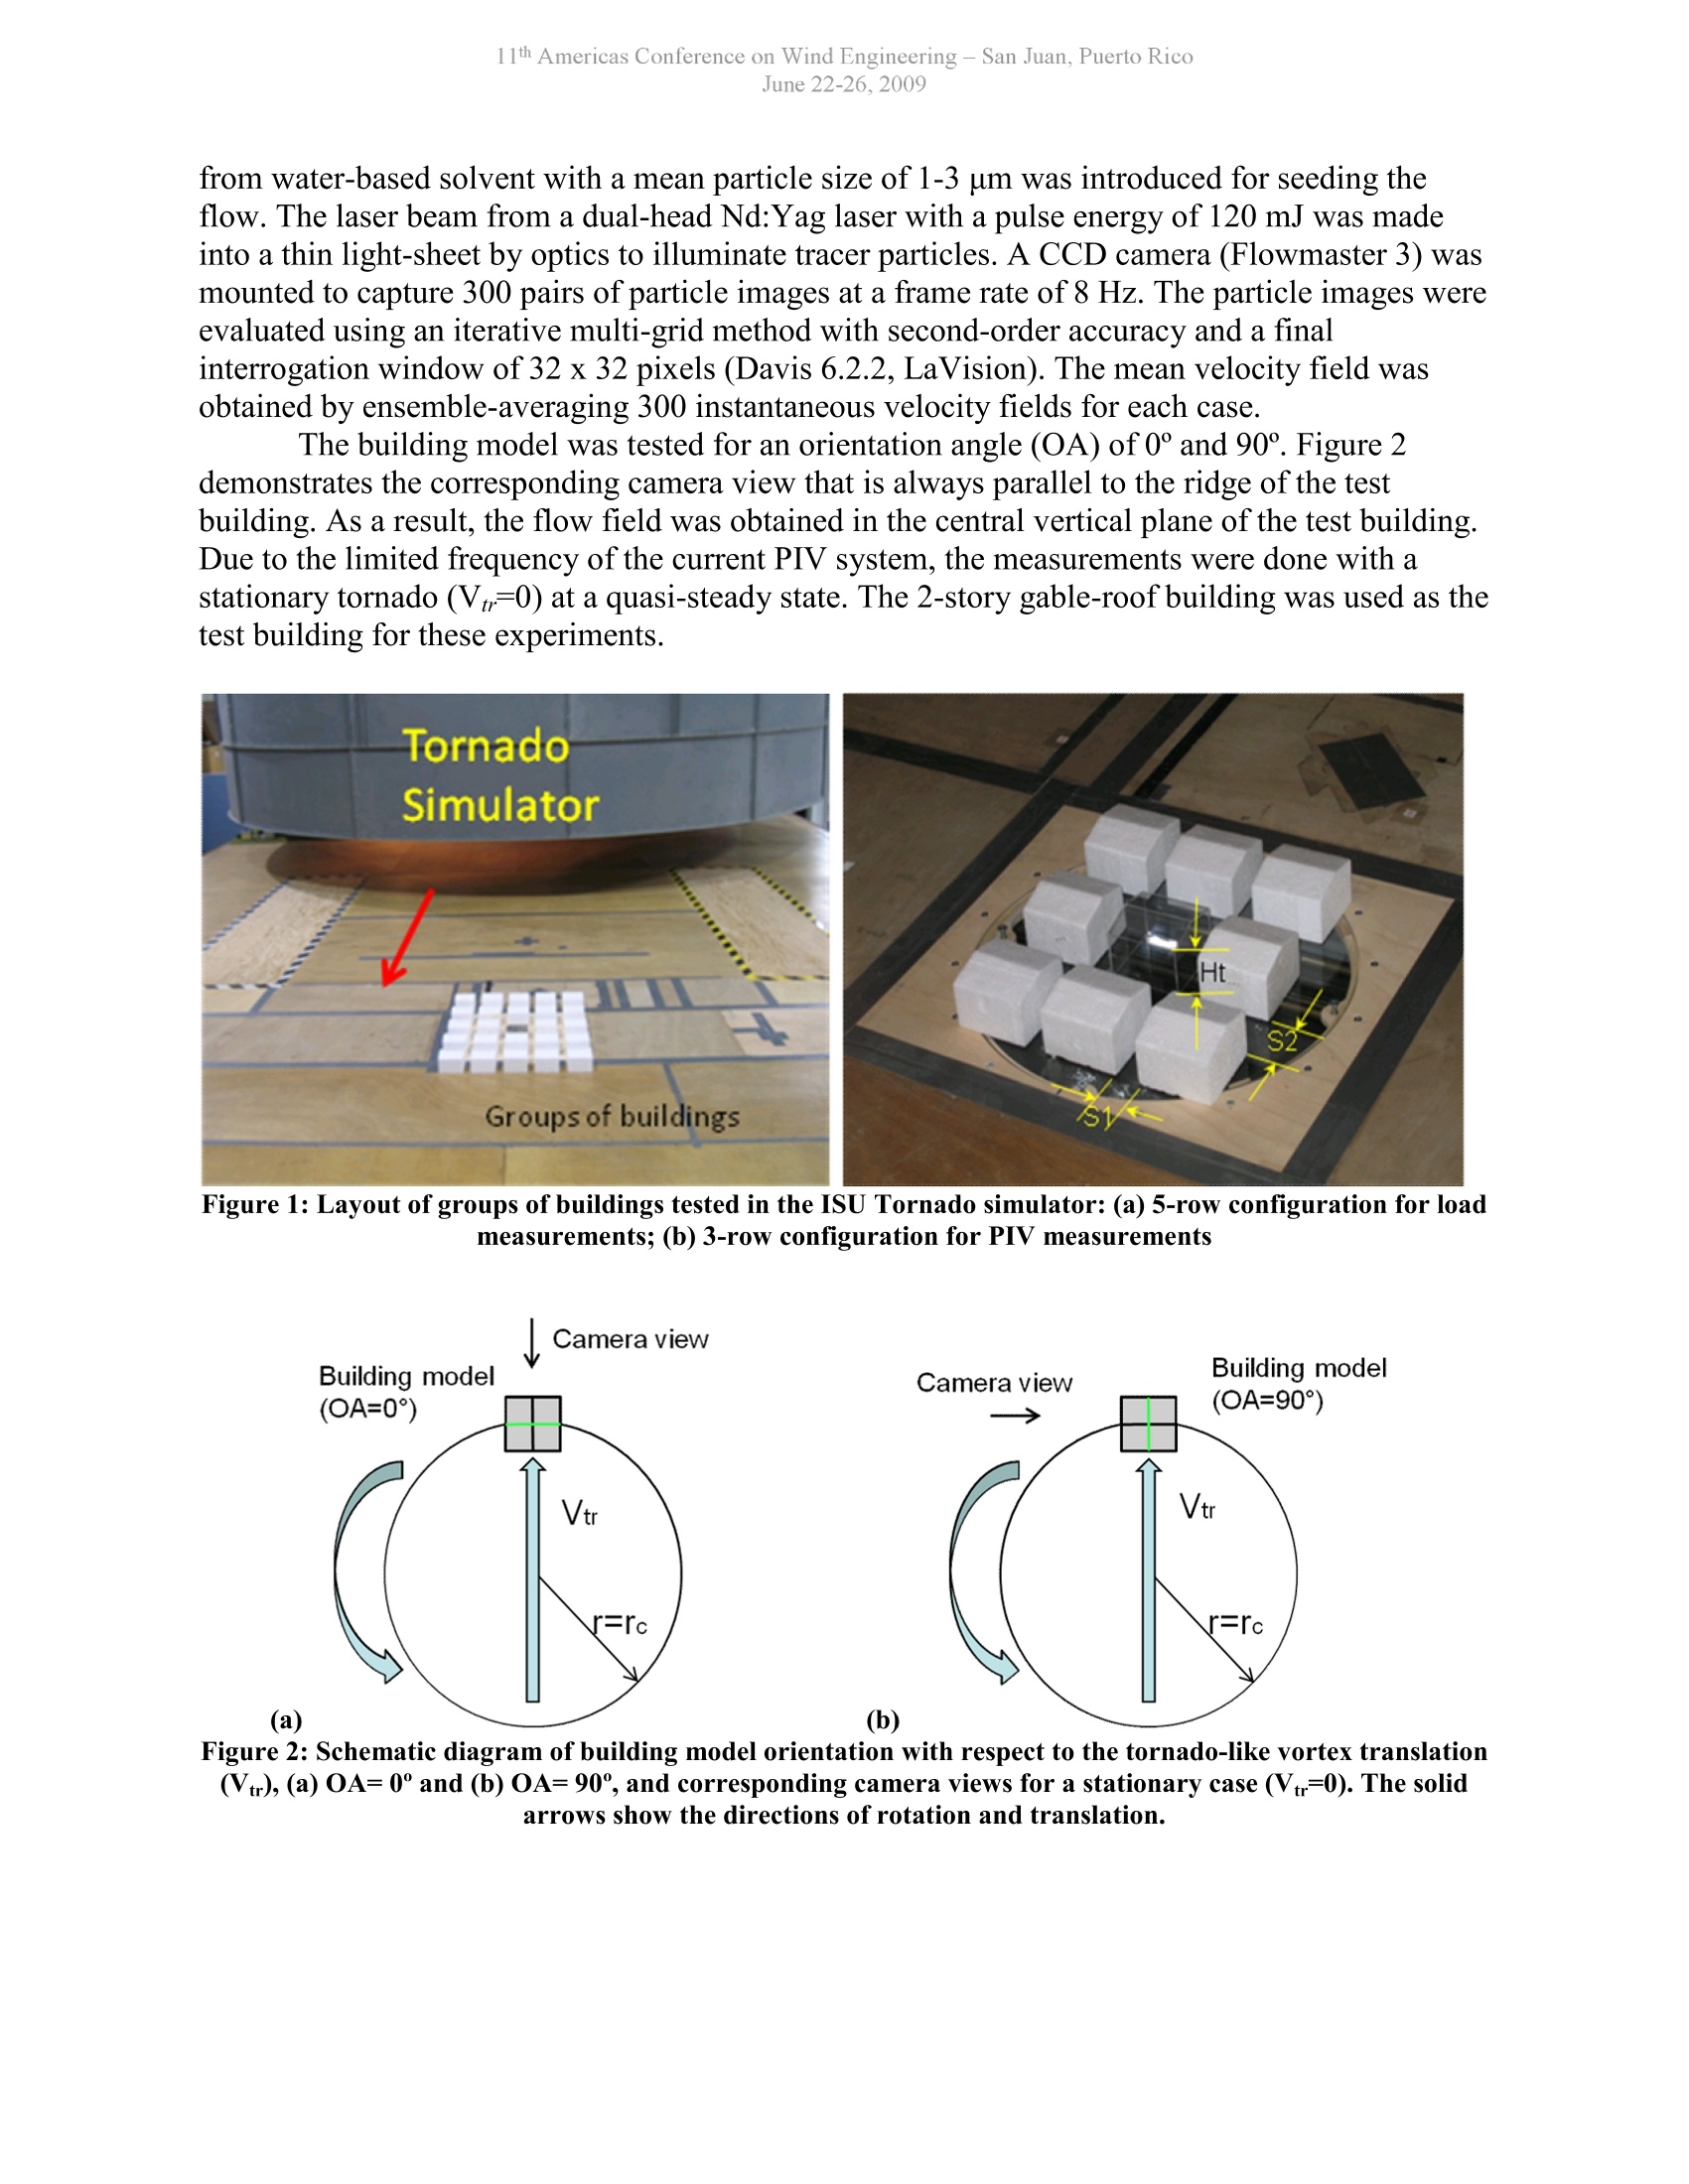
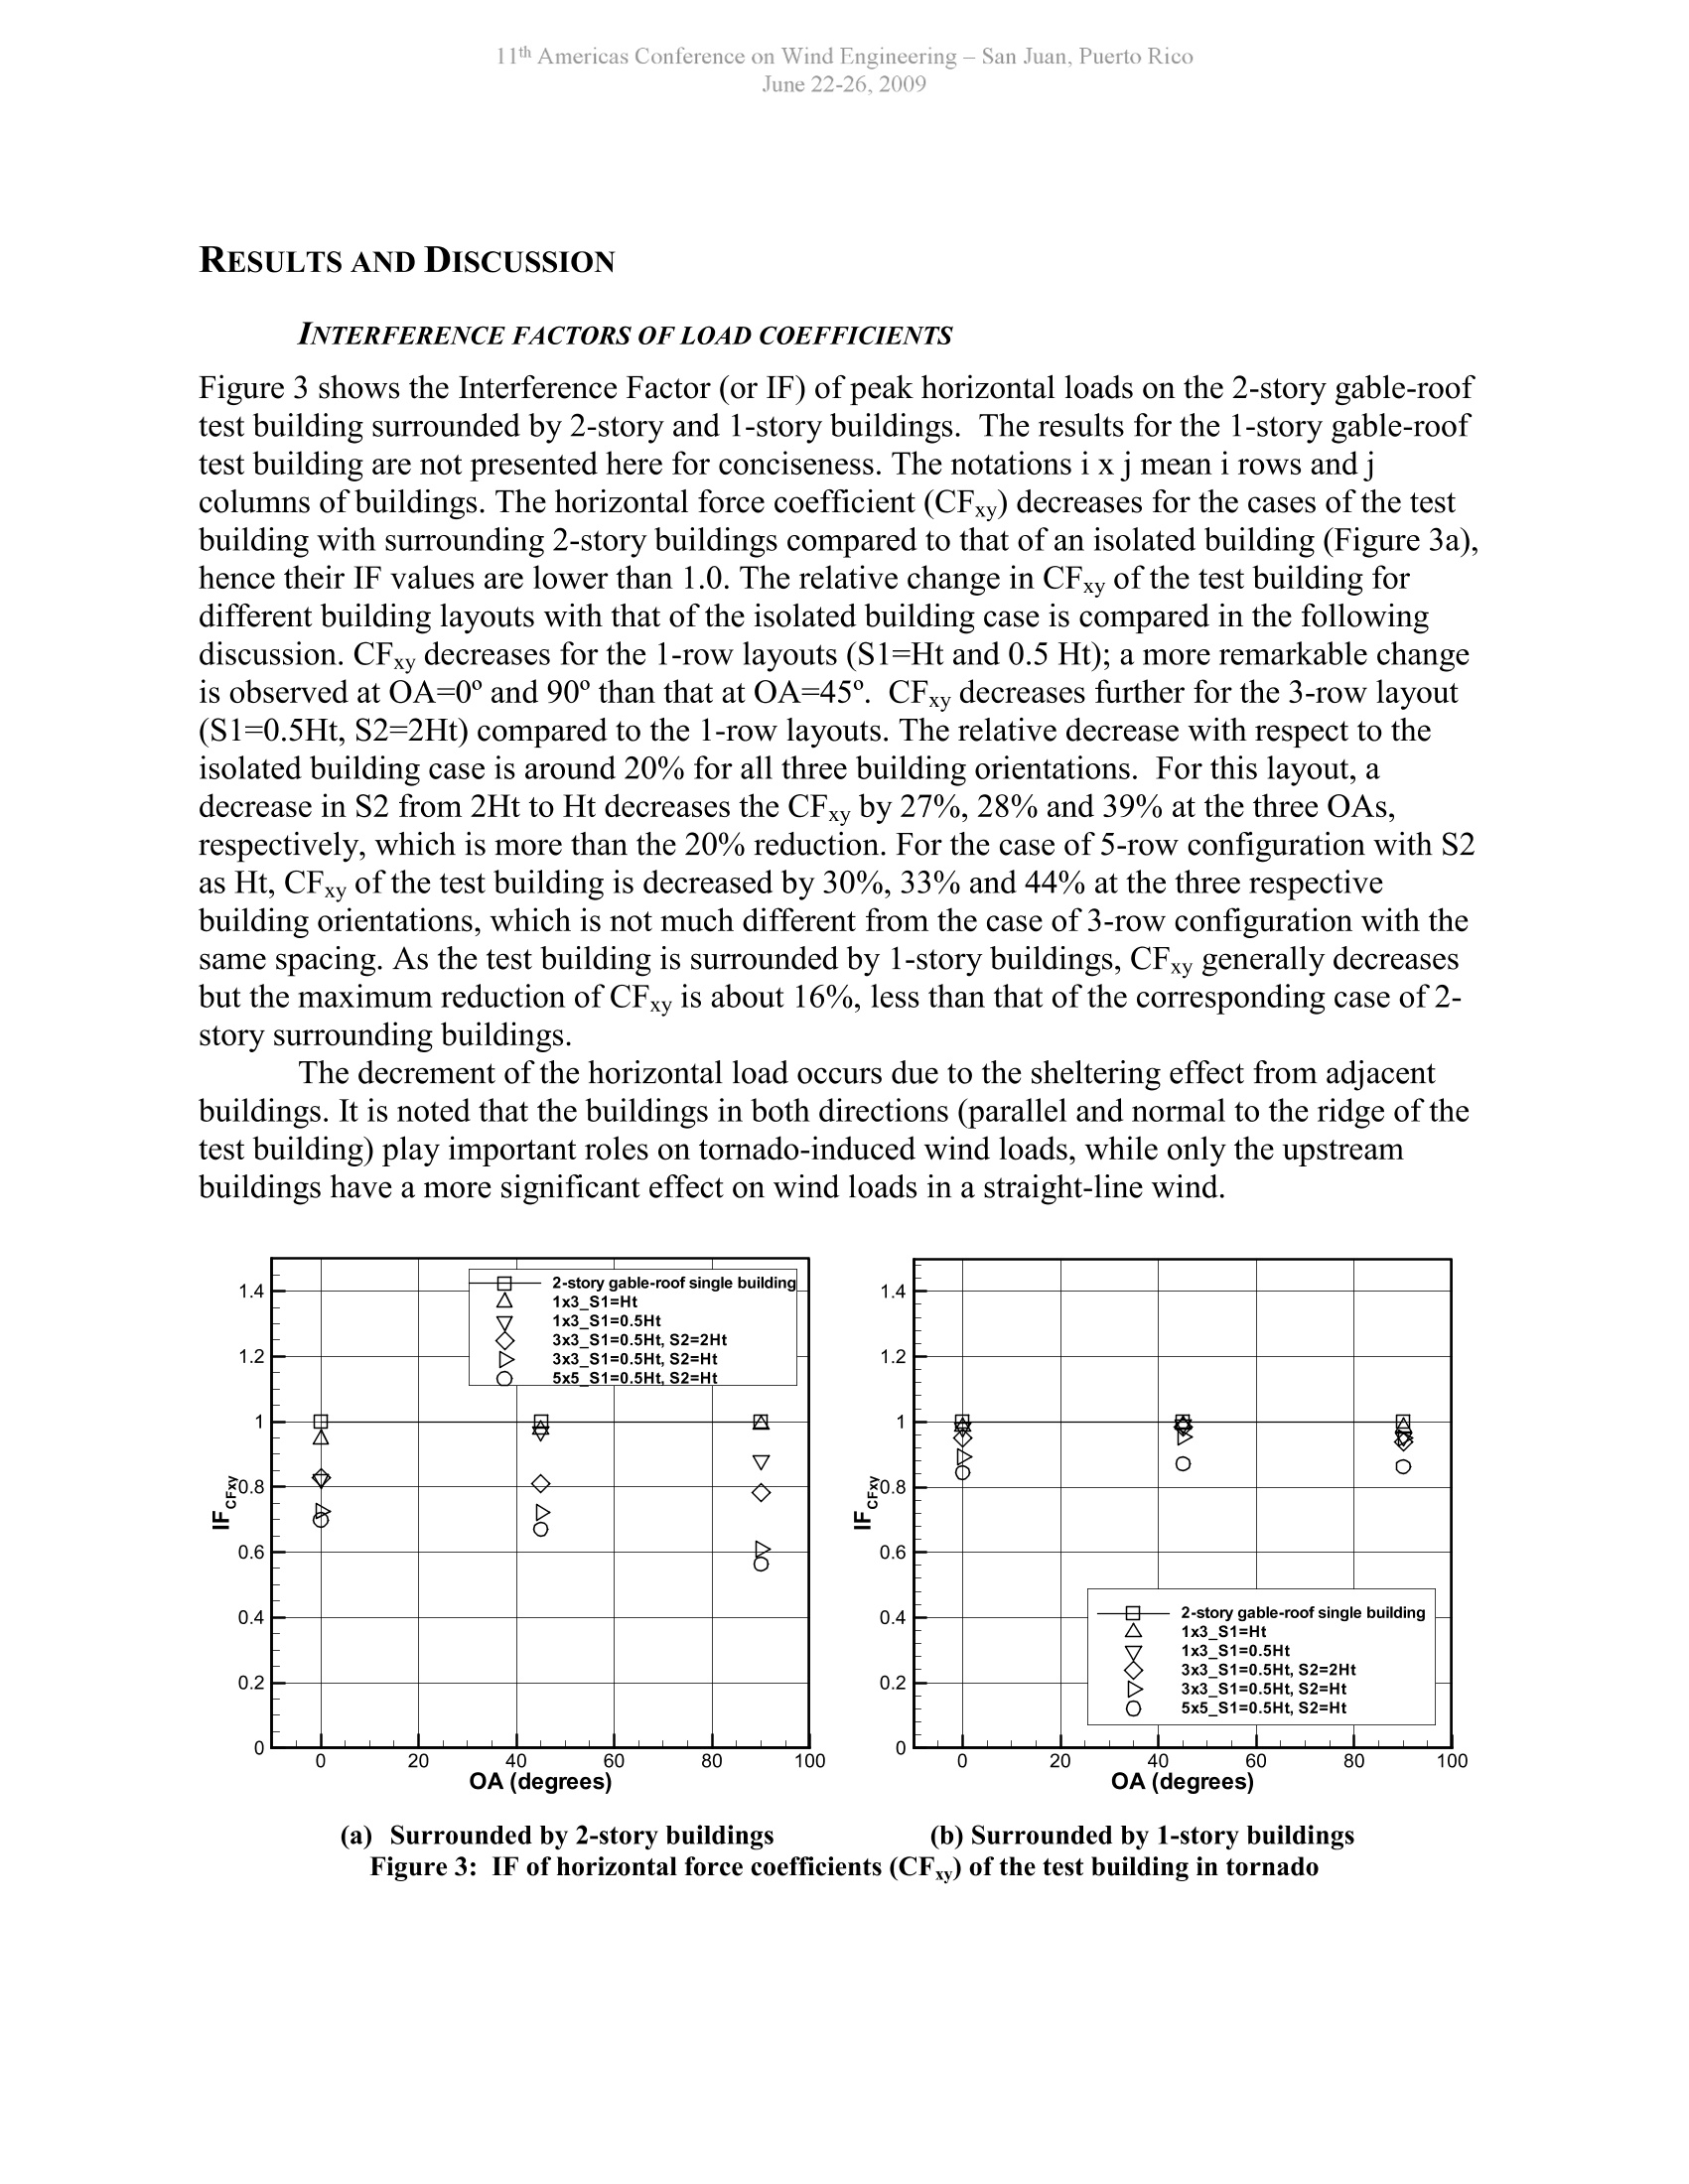
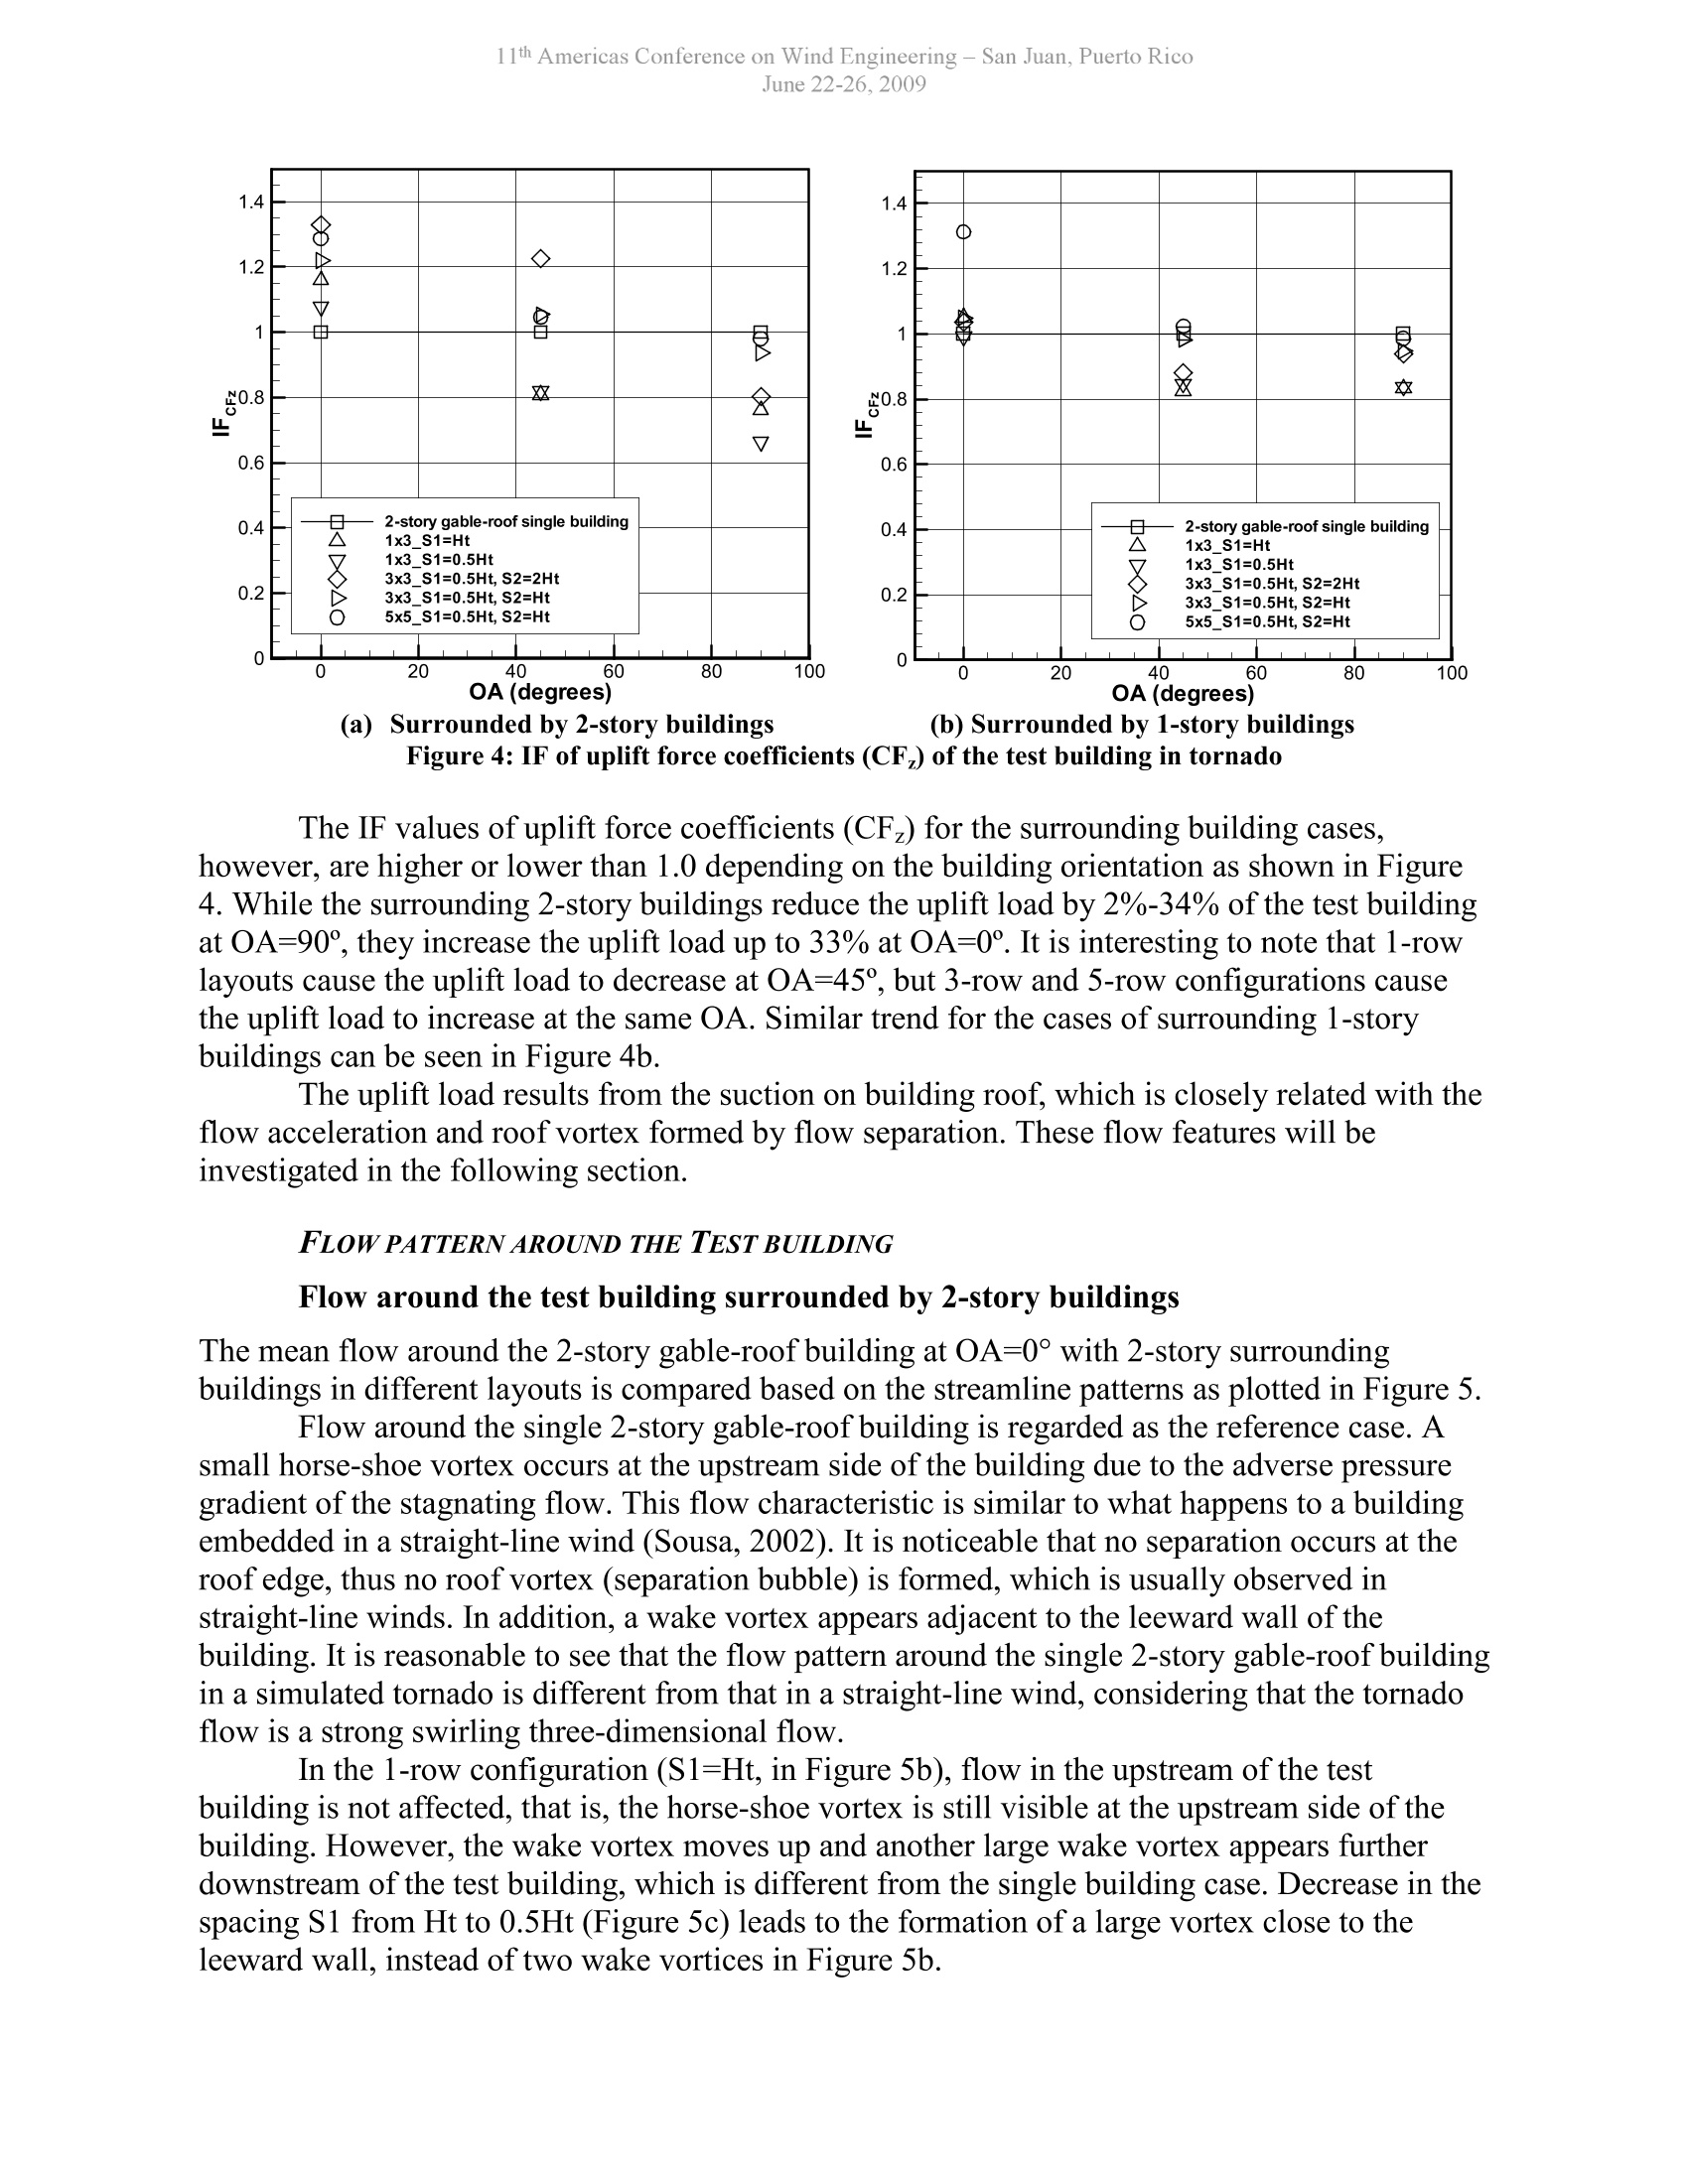
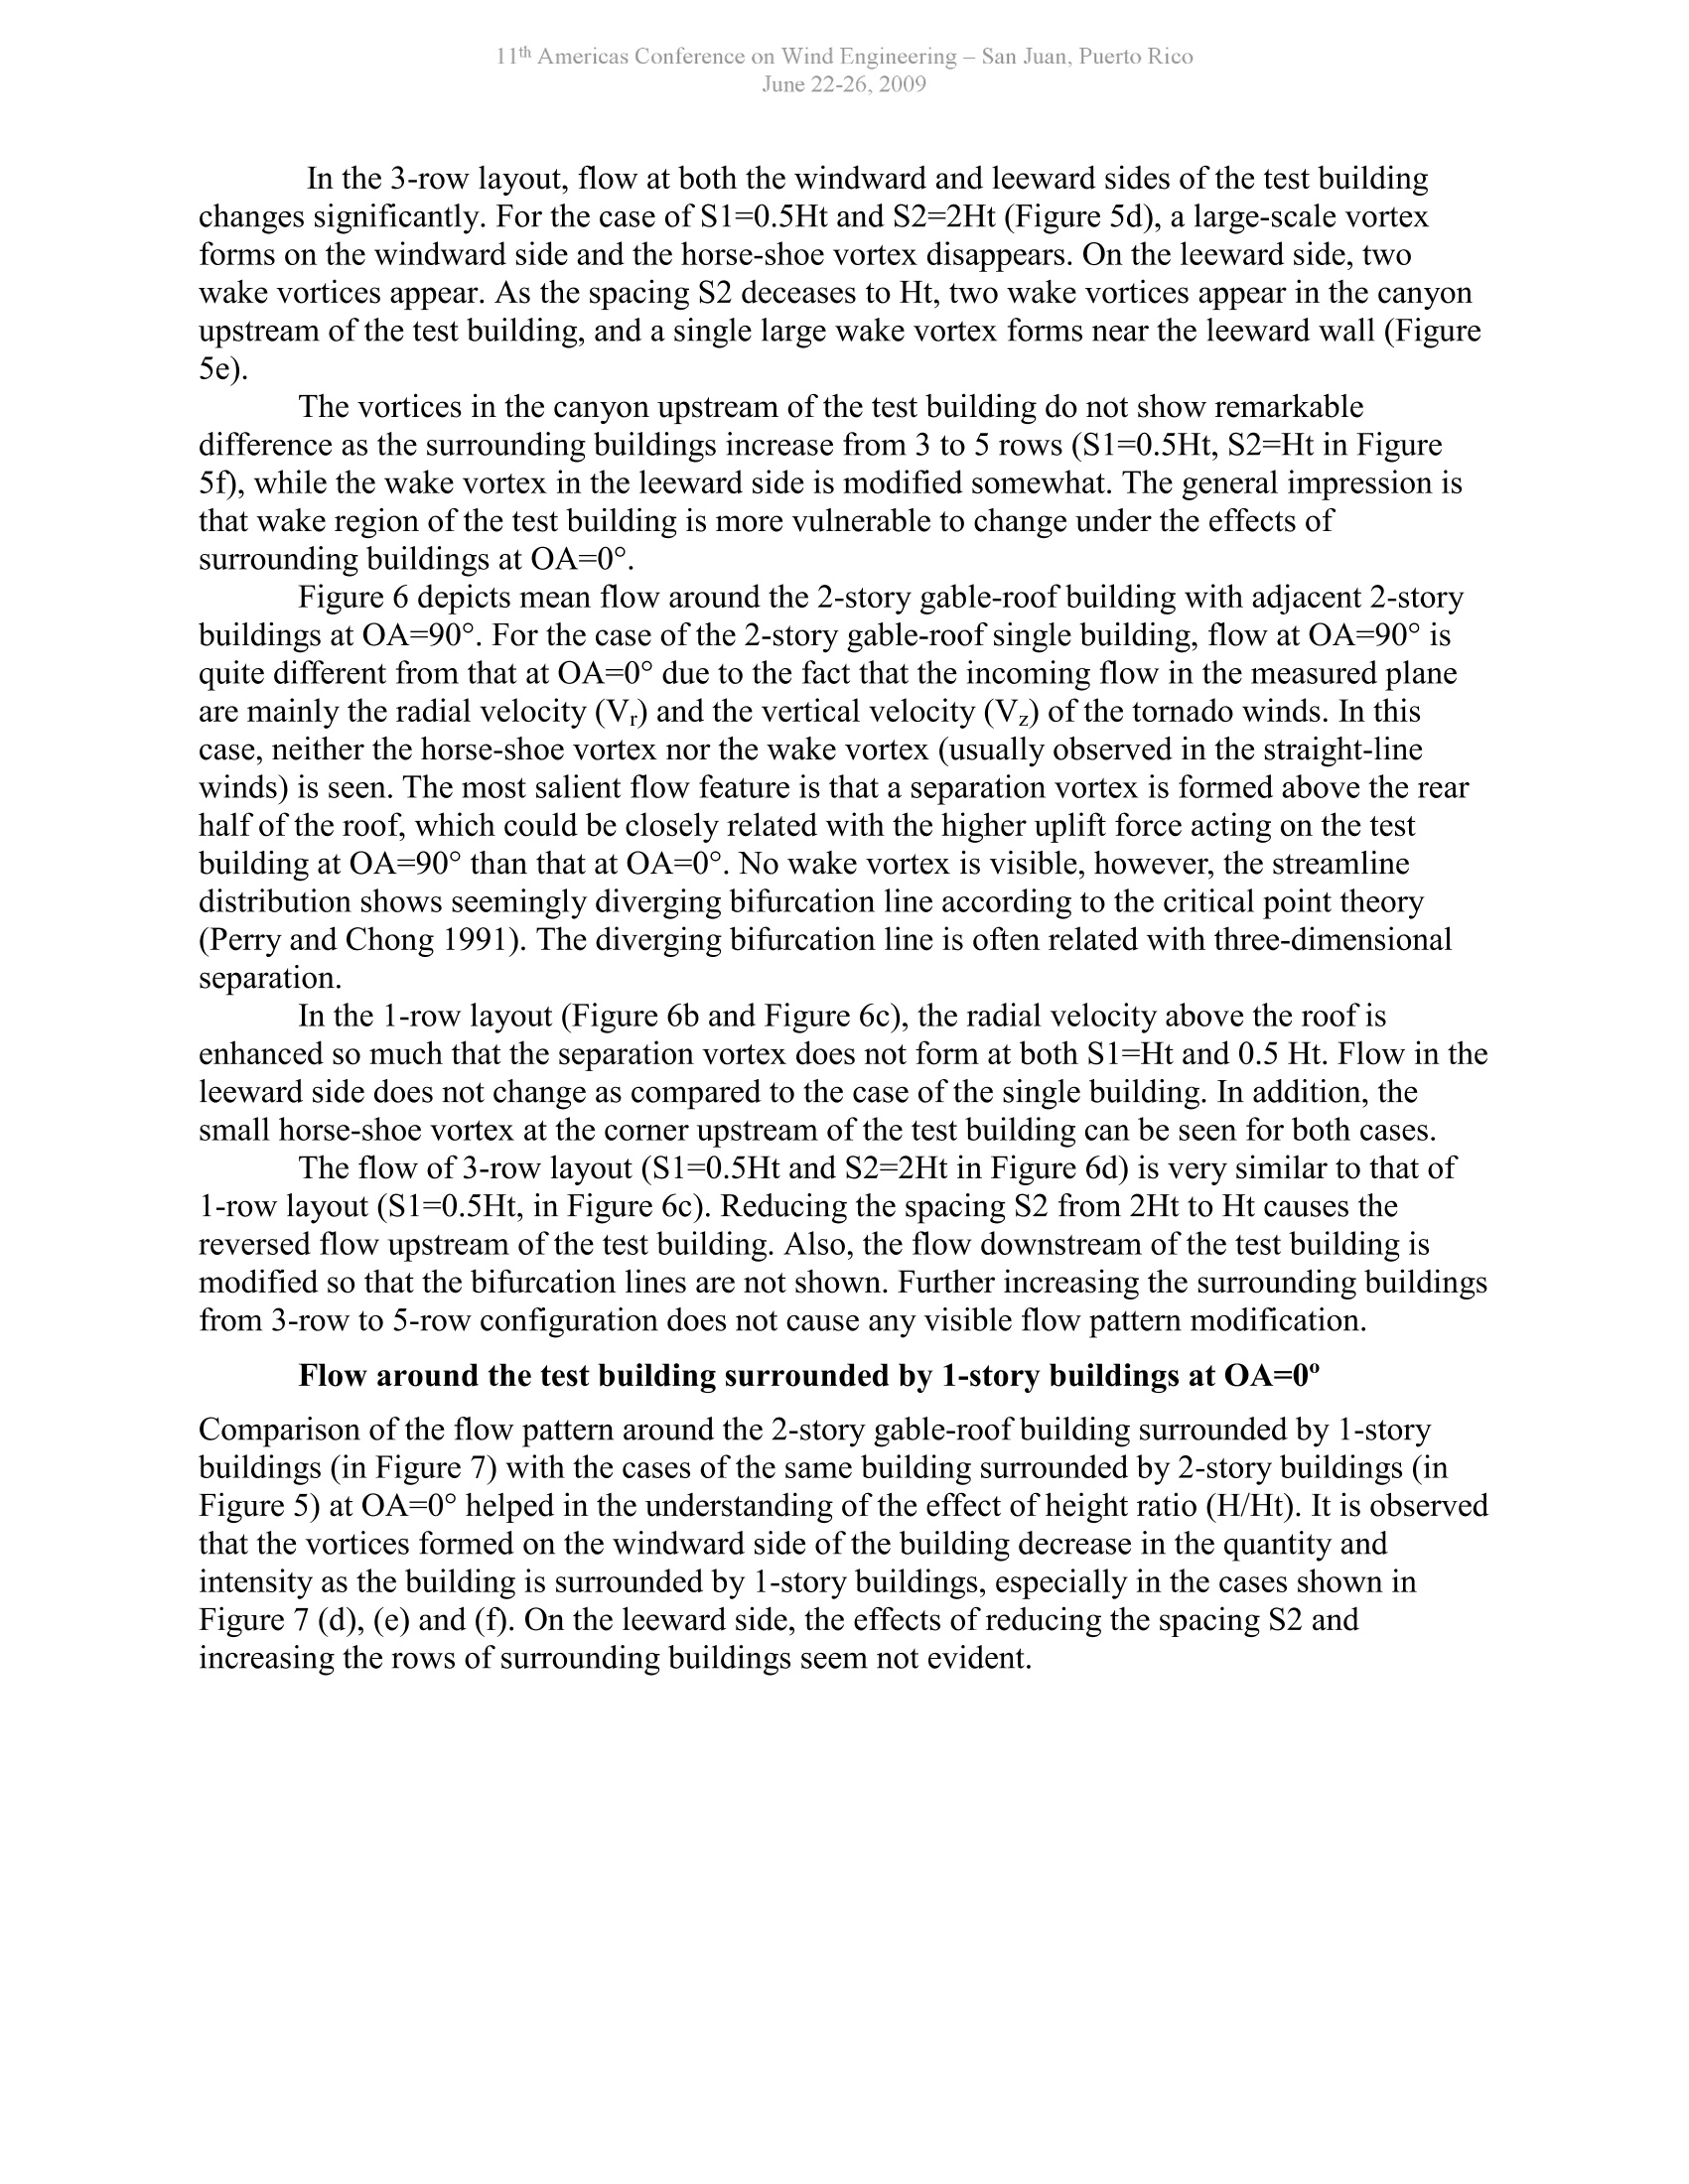
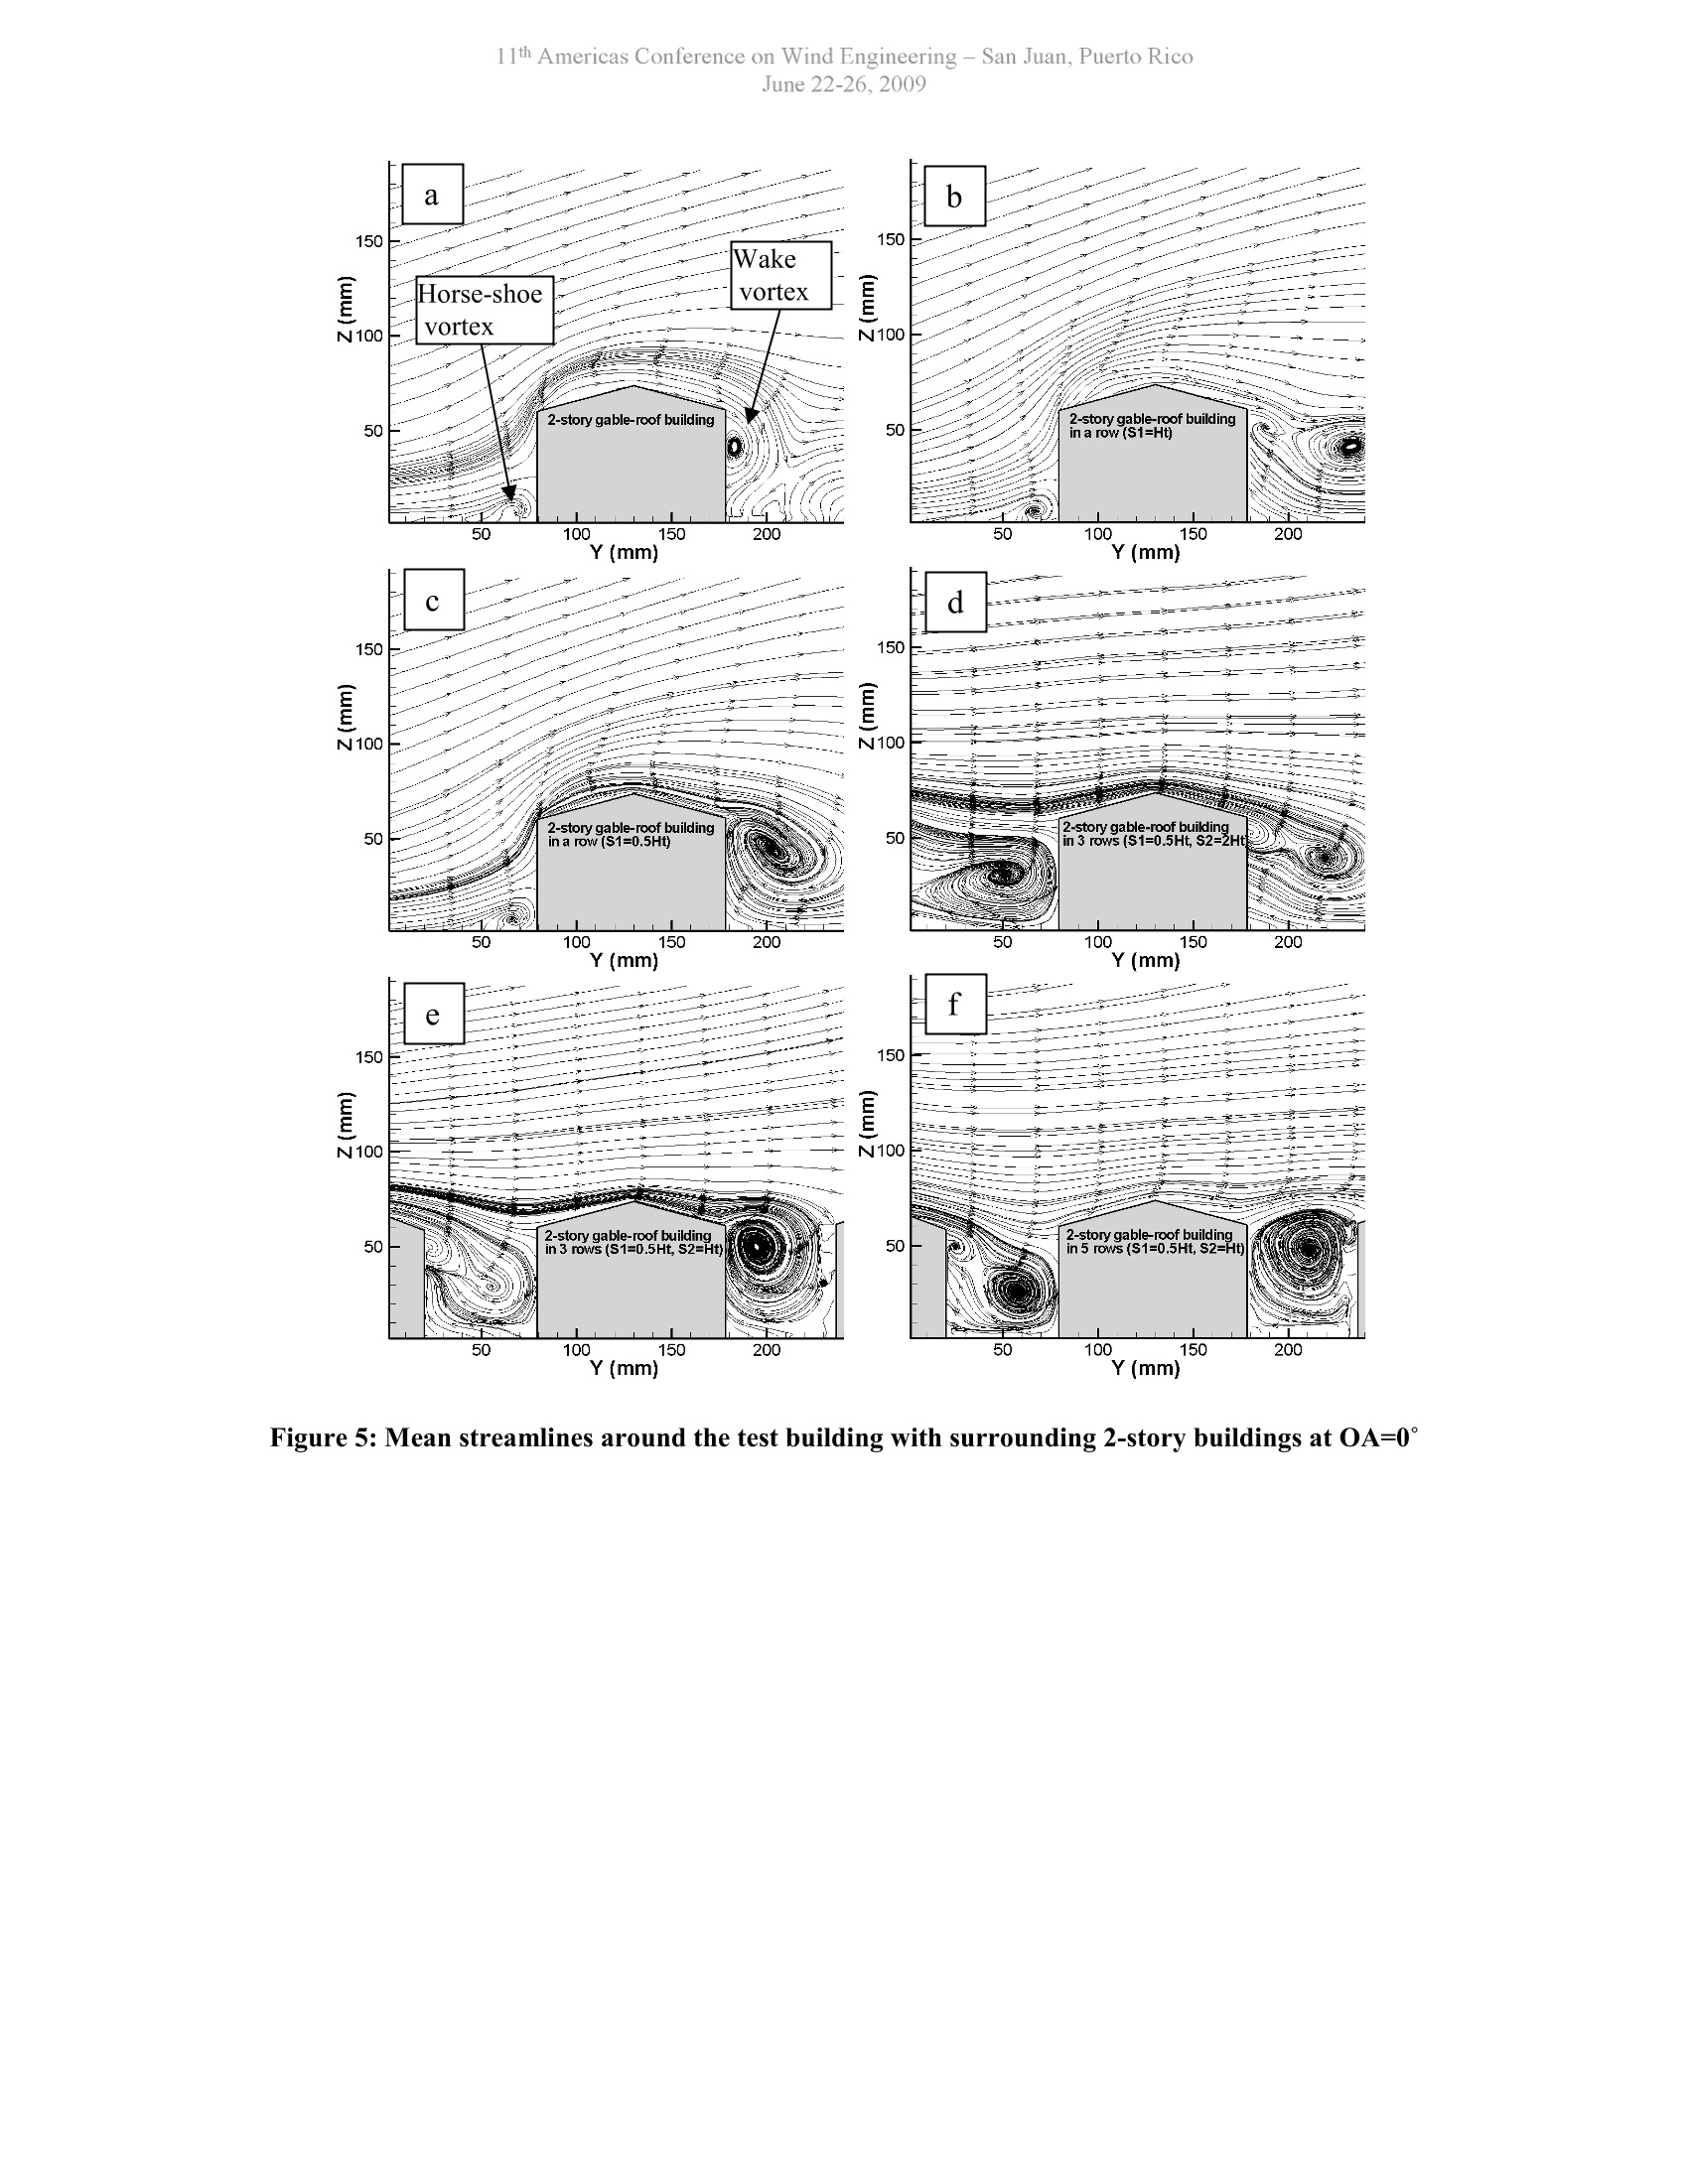
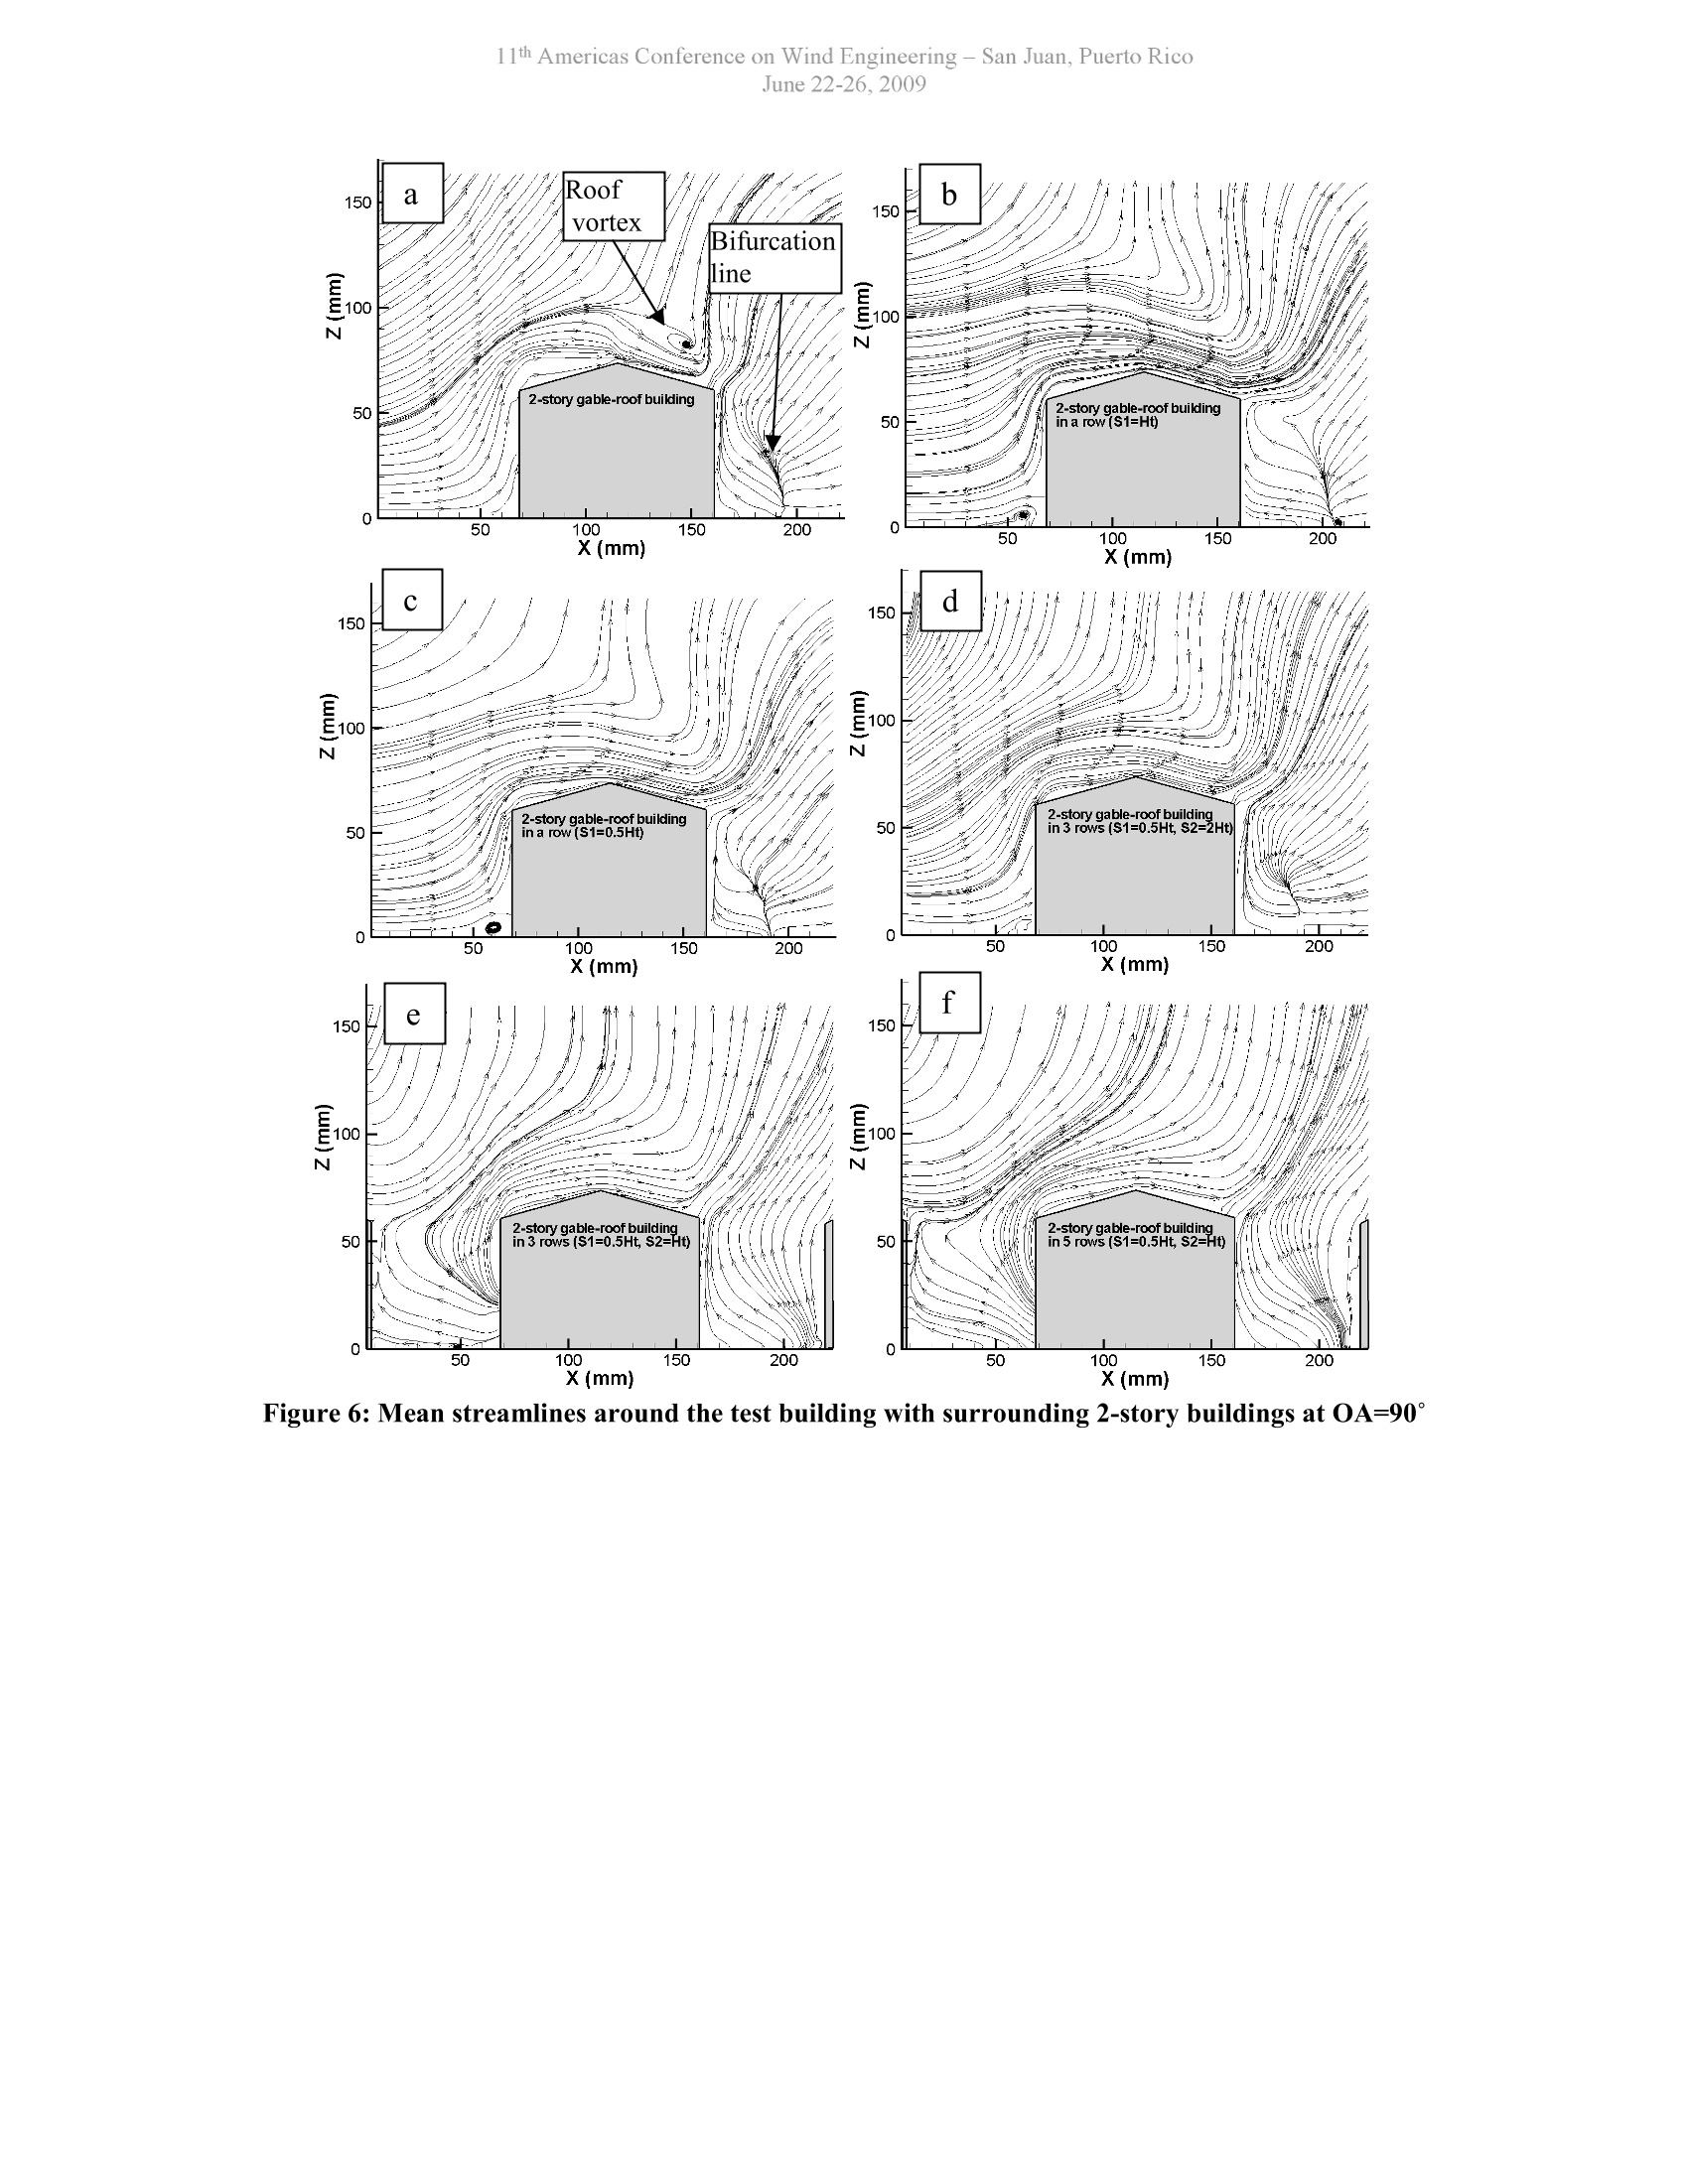
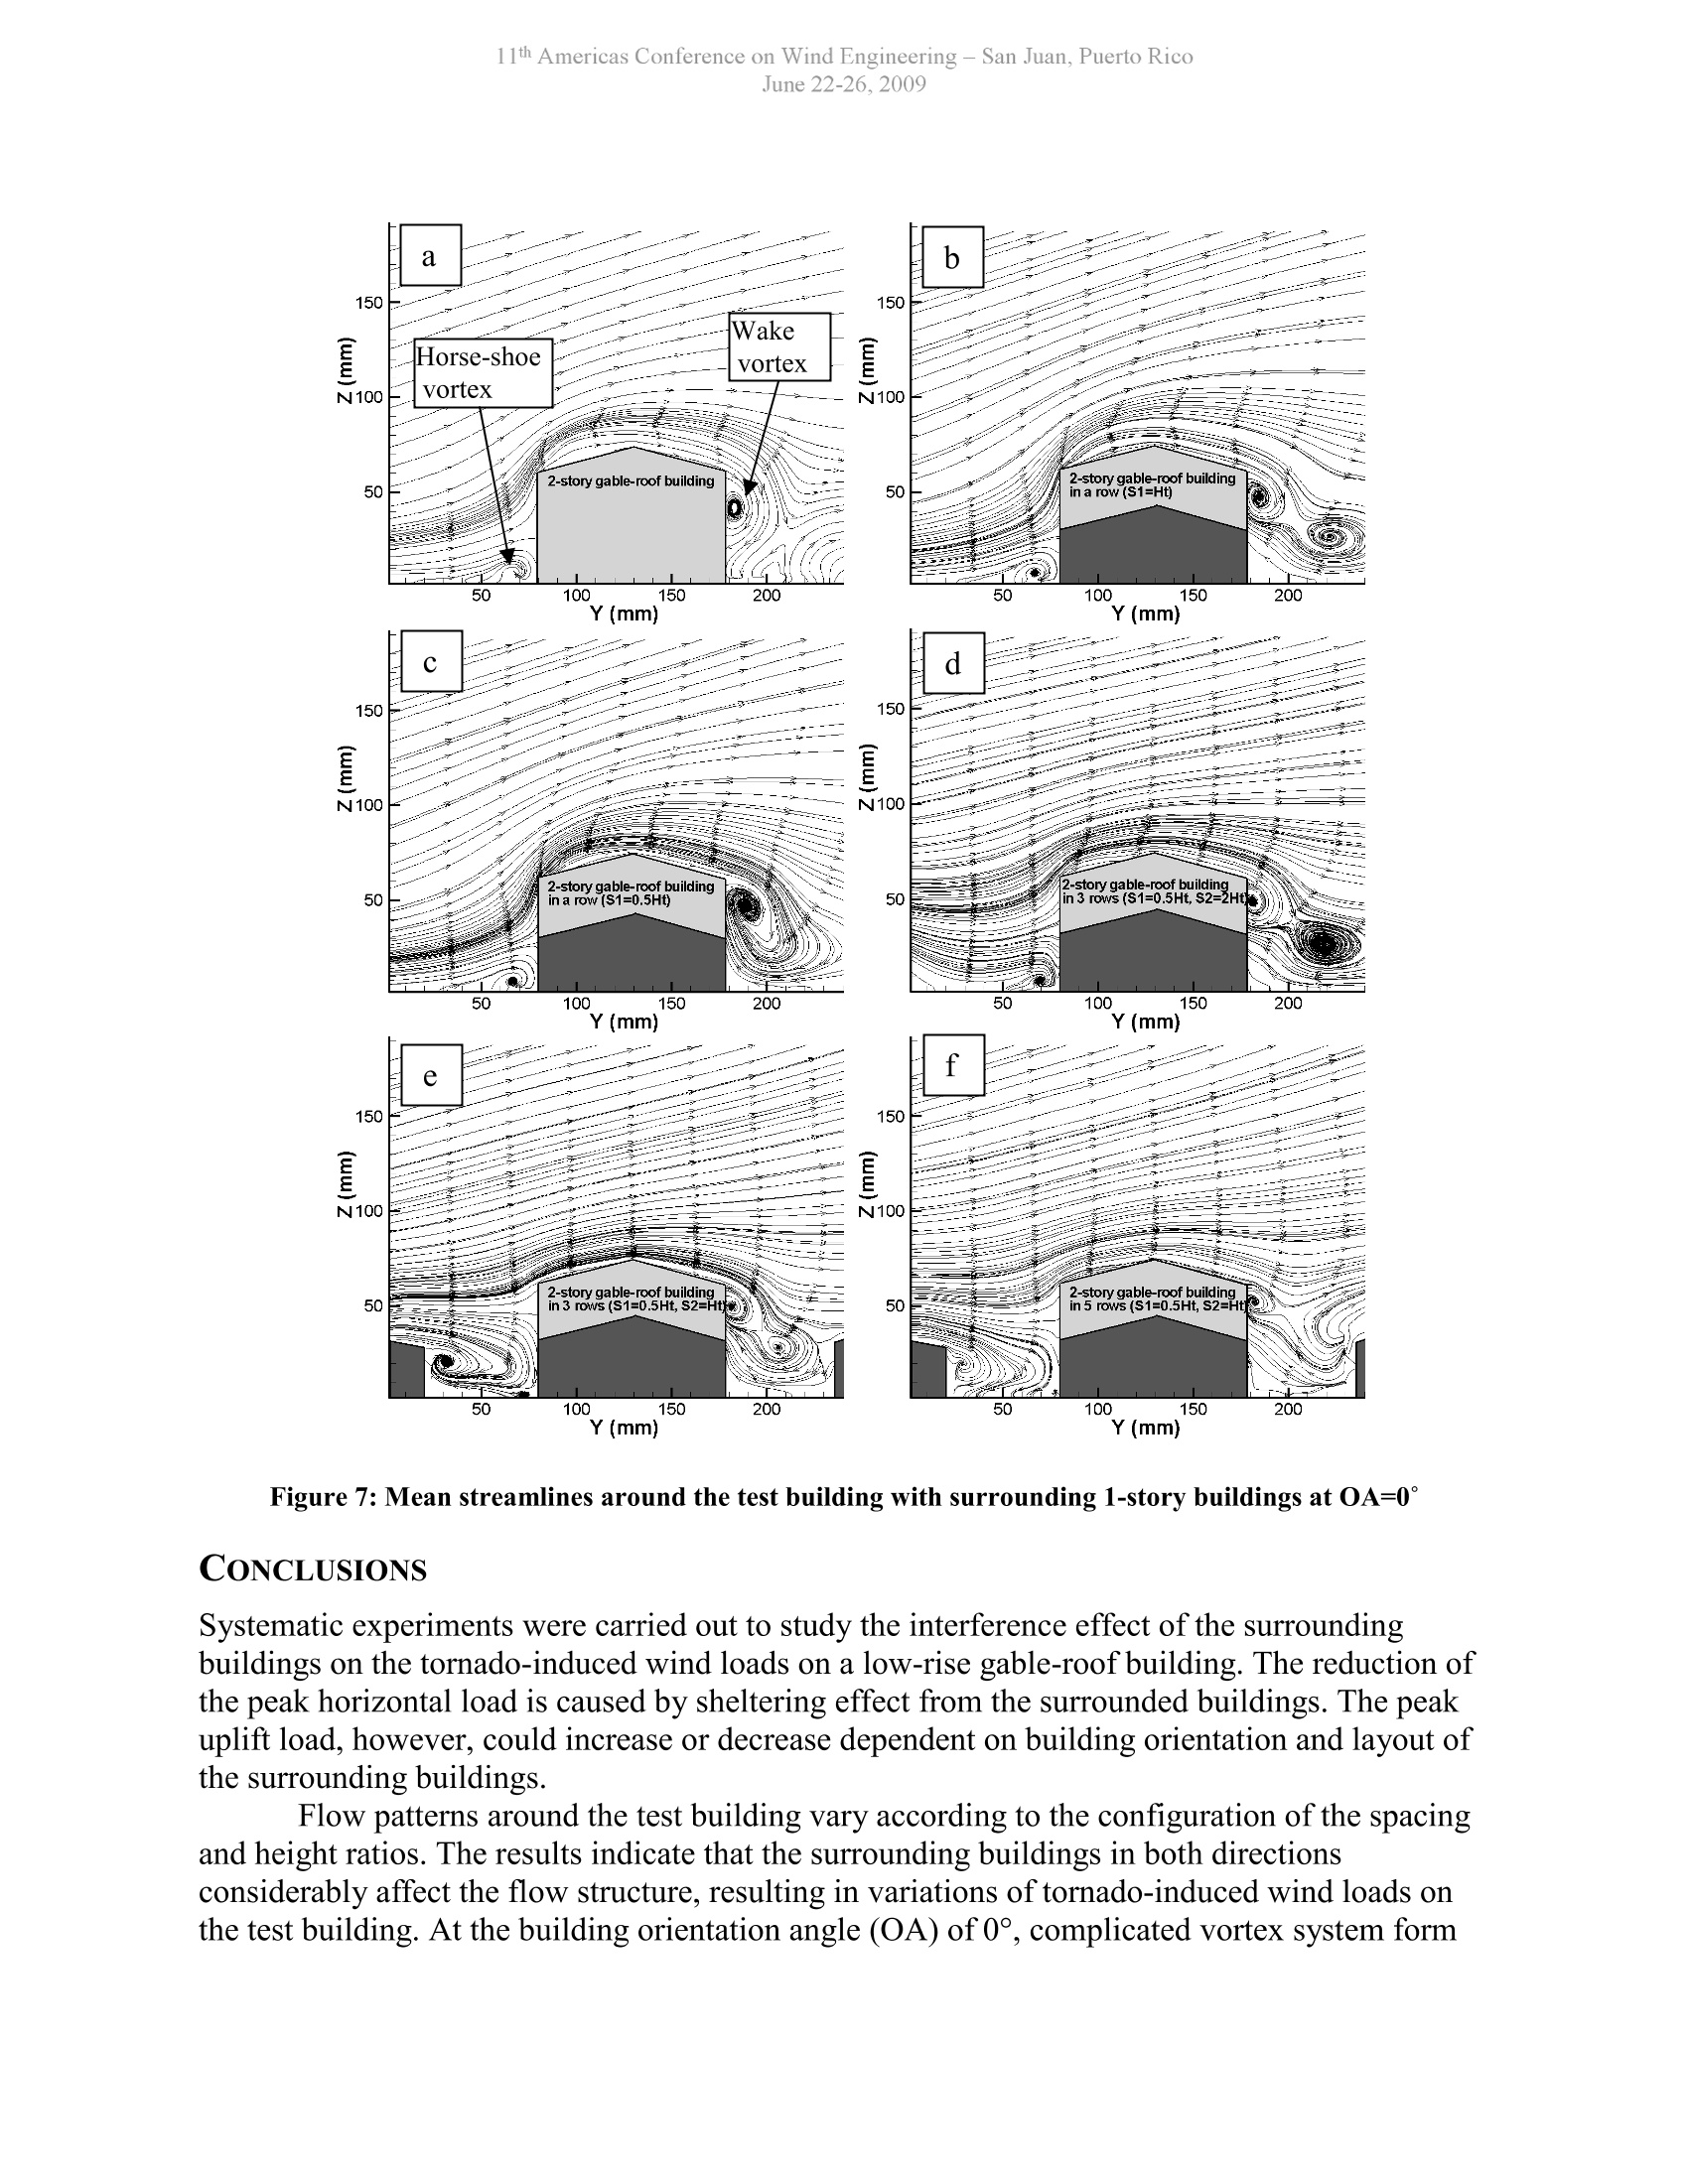
11th Americas Conference on Wind Engineering- San Juan, Puerto RicoJune 22-26.2009 Influence of Surrounding Buildings on Tornado-Induced Wind Loads ofA Low-Rise Building Wei Zhang , Partha P. Sarkar Postdoc, Aerospace Engineering, Iowa State Univ., Ames, IA, USA, weizhang@iastate.eduProfessor,Aerospace Engineering, Iowa State Univ., Ames, IA, USA, ppsarkar@iastate.edu ABSTRACT Low-rise buildings located in the urban areas are generally surrounded by buildings ofsimilarsize. The interference ofsurrounding buildings has been found to be significant on wind loads instraight-line winds. In this study, systematic experiments oftornado-induced wind loads and flowpatterns around a typical low-rise gable-roof building with different layouts of surroundingbuildings were carried out in a laboratory. Effects of spacing,height ratios ofthe surroundingbuildings to the test building and specific building orientations were considered.The resultsindicate that the reduction of the horizontal load is caused by sheltering effect from thesurrounding buildings. The uplift load, however, could increase or decrease dependent onbuilding orientation, layout and the type of the surrounding buildings. The complicated flowpatterns around the test building are discussed and correlated to the wind loads. This studywould improve the understanding oftornado-induced loads on a low-rise gable-roof building. INTRODUCTION Low-rise buildings are seldom isolated. They are usually surrounded by similar buildings whichcould influence their design wind loads as specified in building codes for an isolated building.There exist only a limited number of studies on interference effects of surrounding or adjacentbuildings on a low-rise building in a straight-line wind (Khanduri et al. 1997; Sun et al. 2008,etc.). Some of these studies involve measurements of load or surface pressure. For example,Ahmad and Kumar (2001) examined interference effects of one and three similar buildingsplaced at upstream side of a hip roof building at fifteen locations in an atmospheric boundarylayer wind tunnel. Remarkable effects on the surface pressure distribution were observed atcritical roof positions of the test building (Ahmad and Kumar 2001). Other studies focus onsimulating flow in different building arrangement or blocks by means of computational fluiddynamics (CFD) (He et al. 1997; Lien et al. 2004; Zhang et al. 2005), with the purpose ofvalidating the numerical modeling and understanding the interference effects of surroundinggroups of buildings. These studies indicate that the upstream buildings play a significant role onwind loads and flow structures of the test building in straight-line winds. To the authors’bestknowledge, there is no such study carried out regarding tornado-induced wind loads and flowpatterns. To quantify the interference effect on tornado-induced wind loads, systematicexperiments were carried out in the Iowa State University (ISU) Tornado Simulator with typicalconfigurations of a group of low-rise buildings. Wind loads on a low-rise gable-roof buildingmodel were first measured by varying the layout of surrounding buildings and compared withthose of the isolated single building. Next, the flow structures in typical cases were visualized byParticle Image Velocimetry (PIV) technique. The purpose of flow study was to correlate the flowdistribution around the test building model and in the street canyon surrounding the model withthe resulting wind loads, and to better understand the mechanism of the interference effects. FACILITY AND EXPERIMENT METHODS ISU TORNADO SIMULATOR To obtain accurate information of wind velocity field of a tornado and assess the wind loads oncivil structures induced by tornadoes, a tornado simulator based on the mechanism of rear flankdowndraft (RFD) has been built and operational at Iowa State University since 2005. Thetornado simulator can generate a wide range of maximum tangential velocities (Vemax from 6.9m/s to 14.5 m/s) and vortex structures from a single-celled vortex to dual-celled vortices. Asingle-celled tornado vortex with V0max= 6.9 m/s at the vortex core radius (re) of 0.23 m with aSwirl ratio (S) of 0.08 was produced (Haan, et al., 2008) and used in this study. Details ofdevelopment, design and testing of this ISU tornado simulator can be found in Sarkar et al.(2005) and Haan et al. (2008). BUILDING MODELS AND LOAD MEASUREMENT One-story (Ht=44.1 mm) and two-story (Ht=75.2 mm) low-rise building models (test models)with a geometric scale of 1:100, a square plan (B or W=91.4 mm) and a gable roof (angle 15°)were constructed by rapid prototyping technique for load measurement. An aluminum rod wasfixed to the center of the test model to connect it to a six-component load cell (30E12A-I40, JR3Inc.) mounted underneath the ground plane of the tornado simulator. The surrounding buildingmodels were made out of styrofoam with the same dimensions as the test model. The testbuilding model was positioned along the path of the vortex center. The building orientation,defined as the angle between the translation direction of the tornado and the roof ridge of thebuildings, was set at 0°, 45° and 90° (see Figures 1 and 2). The layout of surrounding buildings in1- row, 3-row and 5-row configurations was defined with spacings between buildings along thedirection of the roof ridge (S1) and the normal direction to the roof ridge (S2) of the test modelin terms of Ht. The tornado translation speed (V) was 0.30 m/s. Load data on the test modelwere continuously recorded at 500 Hz for 24 seconds to cover the full length of the tornado path.Data of ten identical runs were obtained for each case. As tornado moves over a single building model, the tornado-induced wind loads follow aperiodic pattern, as demonstrated by Sengupta, et al. (2008). Herein, the average peak forcecoefficients calculated for the ten runs for each case with surrounding buildings were comparedwith that of the isolated building case. The peak horizontal forces (Fx and Fy) and peak upliftforce (Fz) were normalized with the maximum tangential velocity Vemax and the correspondingprojected area (Ax, Ay or Az) of the test building model, defined as follows: Further, both the horizontal (CFxy) and uplift force (CFz) peak coefficients were normalized bythe corresponding values for the isolated building case, and presented as interference factor (IF). PIVMEASUREMENT Flow around the test building model (made of 3.2 mm thick transparent acrylic material) and inthe street canyon between adjacent buildings was assessed using PIV method. Smoke generated from water-based solvent with a mean particle size of 1-3 um was introduced for seeding theflow. The laser beam from a dual-head Nd: Yag laser with a pulse energy of 120 mJ was madeinto a thin light-sheet by optics to illuminate tracer particles. A CCD camera (Flowmaster 3) wasmounted to capture 300 pairs of particle images at a frame rate of 8 Hz. The particle images wereevaluated using an iterative multi-grid method with second-order accuracy and a finalinterrogation window of 32 x 32 pixels (Davis 6.2.2, LaVision). The mean velocity field wasobtained by ensemble-averaging 300 instantaneous velocity fields for each case. The building model was tested for an orientation angle (OA) of 0° and 90°. Figure 2demonstrates the corresponding camera view that is always parallel to the ridge of the testbuilding. As a result, the flow field was obtained in the central vertical plane ofthe test building.Due to the limited frequency of the current PIV system, the measurements were done with astationary tornado (Vr=0) at a quasi-steady state. The 2-story gable-roof building was used as thetest building for these experiments. Figure 1: Layout of groups of buildings tested in the ISU Tornado simulator: (a) 5-row configuration for loadmeasurements; (b) 3-row configuration for PIV measurements Figure 2: Schematic diagram of building model orientation with respect to the tornado-like vortex translation(Vtr), (a)OA=0°and (b) OA=90°, and corresponding camera views for a stationary case (Vr=0). The solidarrows show the directions of rotation and translation. RESULTS AND DISCUSSION INTERFERENCE FACTORS OF LOAD COEFFICIENTS Figure 3 shows the Interference Factor (or IF) of peak horizontal loads on the 2-story gable-rooftest building surrounded by 2-story and 1-story buildings. The results for the 1-story gable-rooftest building are not presented here for conciseness. The notations i x j mean i rows and jcolumns of buildings. The horizontal force coefficient (CFxy) decreases for the cases of the testbuilding with surrounding 2-story buildings compared to that of an isolated building (Figure 3a),hence their IF values are lower than 1.0. The relative change in CFxy of the test building fordifferent building layouts with that of the isolated building case is compared in the followingdiscussion. CFxy decreases for the 1-row layouts (S1=Ht and 0.5 Ht); a more remarkable changeis observed at OA=0° and 90° than that at OA=45°. CFxy decreases further for the 3-row layout(S1=0.5Ht, S2=2Ht) compared to the 1-row layouts. The relative decrease with respect to theisolated building case is around 20% for all three building orientations. For this layout, adecrease in S2 from 2Ht to Ht decreases the CFxy by 27%, 28% and 39% at the three OAs,respectively, which is more than the 20% reduction. For the case of 5-row configuration with S2as Ht, CFxy of the test building is decreased by 30%, 33% and 44% at the three respectivebuilding orientations, which is not much different from the case of 3-row configuration with thesame spacing. As the test building is surrounded by 1-story buildings, CFxy generally decreasesbut the maximum reduction of CFxy is about 16%, less than that of the corresponding case of 2-story surrounding buildings. The decrement of the horizontal load occurs due to the sheltering effect from adjacentbuildings. It is noted that the buildings in both directions (parallel and normal to the ridge of thetest building) play important roles on tornado-induced wind loads, while only the upstreambuildings have a more significant effect on wind loads in a straight-line wind. (a) Surrounded by 2-story buildings (b) Surrounded by 1-story buildings Figure 3: IF of horizontal force coefficients (CFxy) of the test building in tornado (b) Surrounded by 1-story buildings Figure 4: IF of uplift force coefficients (CF,) of the test building in tornado The IF values of uplift force coefficients (CFz) for the surrounding building cases,however, are higher or lower than 1.0 depending on the building orientation as shown in Figure4. While the surrounding 2-story buildings reduce the uplift load by 2%-34% of the test buildingat OA=90°, they increase the uplift load up to 33% at OA=0°. It is interesting to note that 1-rowlayouts cause the uplift load to decrease at OA=45°, but 3-row and 5-row configurations causethe uplift load to increase at the same OA. Similar trend for the cases of surrounding 1-storybuildings can be seen in Figure 4b. The uplift load results from the suction on building roof, which is closely related with theflow acceleration and roof vortex formed by flow separation. These flow features will beinvestigated in the following section. FLOW PATTERN AROUND THE TEST BUILDING Flow around the test building surrounded by 2-story buildings The mean flow around the 2-story gable-roof building at OA=0°with 2-story surroundingbuildings in different layouts is compared based on the streamline patterns as plotted in Figure 5. Flow around the single 2-story gable-roof building is regarded as the reference case. Asmall horse-shoe vortex occurs at the upstream side of the building due to the adverse pressuregradient of the stagnating flow. This flow characteristic is similar to what happens to a buildingembedded in a straight-line wind (Sousa, 2002). It is noticeable that no separation occurs at theroof edge, thus no roof vortex (separation bubble) is formed, which is usually observed instraight-line winds. In addition, a wake vortex appears adjacent to the leeward wall of thebuilding. It is reasonable to see that the flow pattern around the single 2-story gable-roof buildingin a simulated tornado is different from that in a straight-line wind, considering that the tornadoflow is a strong swirling three-dimensional flow. In the 1-row configuration (S1=Ht, in Figure 5b), flow in the upstream of the testbuilding is not affected, that is, the horse-shoe vortex is still visible at the upstream side of thebuilding. However, the wake vortex moves up and another large wake vortex appears furtherdownstream of the test building, which is different from the single building case. Decrease in thespacing S1 from Ht to 0.5Ht (Figure 5c) leads to the formation of a large vortex close to theleeward wall, instead of two wake vortices in Figure 5b. In the 3-row layout, flow at both the windward and leeward sides of the test buildingchanges significantly. For the case of S1=0.5Ht and S2=2Ht (Figure 5d), a large-scale vortexforms on the windward side and the horse-shoe vortex disappears. On the leeward side, twowake vortices appear. As the spacing S2 deceases to Ht, two wake vortices appear in the canyonupstream of the test building, and a single large wake vortex forms near the leeward wall (Figure5e). The vortices in the canyon upstream of the test building do not show remarkabledifference as the surrounding buildings increase from 3 to 5 rows (S1=0.5Ht, S2=Ht in Figure5f), while the wake vortex in the leeward side is modified somewhat. The general impression isthat wake region of the test building is more vulnerable to change under the effects ofsurrounding buildings at OA=0°. Figure 6 depicts mean flow around the 2-story gable-roof building with adjacent 2-storybuildings at OA=90°. For the case of the 2-story gable-roof single building, flow at OA=90° isquite different from that at OA=0° due to the fact that the incoming flow in the measured planeare mainly the radial velocity (Vr) and the vertical velocity (Vz) of the tornado winds. In thiscase,neither the horse-shoe vortex nor the wake vortex (usually observed in the straight-linewinds) is seen. The most salient flow feature is that a separation vortex is formed above the rearhalf of the roof, which could be closely related with the higher uplift force acting on the testbuilding at OA=90° than that at OA=0°. No wake vortex is visible, however, the streamlinedistribution shows seemingly diverging bifurcation line according to the critical point theory(Perry and Chong 1991). The diverging bifurcation line is often related with three-dimensionalseparation. In the 1-row layout (Figure 6b and Figure 6c), the radial velocity above the roof isenhanced so much that the separation vortex does not form at both S1=Ht and 0.5 Ht. Flow in theleeward side does not change as compared to the case of the single building. In addition, thesmall horse-shoe vortex at the corner upstream of the test building can be seen for both cases. The flow of 3-row layout (S1=0.5Ht and S2=2Ht in Figure 6d) is very similar to that of1-row layout (S1=0.5Ht, in Figure 6c). Reducing the spacing S2 from 2Ht to Ht causes thereversed flow upstream of the test building. Also, the flow downstream of the test building ismodified so that the bifurcation lines are not shown. Further increasing the surrounding buildingsfrom 3-row to 5-row configuration does not cause any visible flow pattern modification. Flow around the test building surrounded by 1-story buildings at OA=0° Comparison of the flow pattern around the 2-story gable-roof building surrounded by 1-storybuildings (in Figure 7) with the cases of the same building surrounded by 2-story buildings (inFigure 5) at OA=0° helped in the understanding of the effect of height ratio (H/Ht). It is observedthat the vortices formed on the windward side of the building decrease in the quantity andintensity as the building is surrounded by 1-story buildings, especially in the cases shown inFigure 7 (d), (e) and (f). On the leeward side, the effects of reducing the spacing S2 andincreasing the rows of surrounding buildings seem not evident. Figure 5: Mean streamlines around the test building with surrounding 2-story buildings at OA=0° X (mm) Figure 6: Mean streamlines around the test building with surrounding 2-story buildings at OA=90° Figure 7: Mean streamlines around the test building with surrounding 1-story buildings at OA=0° CONCLUSIONS Systematic experiments were carried out to study the interference effect of the surroundingbuildings on the tornado-induced wind loads on a low-rise gable-roof building. The reduction ofthe peak horizontal load is caused by sheltering effect from the surrounded buildings. The peakuplift load, however, could increase or decrease dependent on building orientation and layout ofthe surrounding buildings. Flow patterns around the test building vary according to the configuration of the spacingand height ratios. The results indicate that the surrounding buildings in both directionsconsiderably affect the flow structure, resulting in variations of tornado-induced wind loads onthe test building.At the building orientation angle (OA) of 0°, complicated vortex system form and the wake region of the test building is more vulnerable to change under effects ofsurrounding buildings. At OA=90°, no distinctive vortex system is observed in the measuredplane. However, bifurcation lines may be the clues of three-dimensional separation and vortexstructures detectable in the orthogonal plane. For both building orientations, increment ofadjacent buildings from 3-row to 5-row configuration plays minor effects on the flow patternsand the tornado-induced wind loads. Further study on turbulence characteristics of the flow around the test building, inparticular kinetic energy transfer between the mean flow and the fluctuations, will be performedto address the correlation of the flow patterns and tornado-induced wind loads. ACKNOWLEDGEMENT The authors gratefully acknowledge the support of this work by NOAA (Award NumbersNA06OAR4600230 and NA08OAR4600887). ( REFERENCES ) [1] A.C. Khanduri, C. Bedard, T. Stathopoulos, Modeling wind-induced interference effects using backpropagation neural networks, J. Wind Eng. Ind. Aerodyn. 72 (1997) 71-79. ( [ 2 2 2 ] 1 Y . Sun, Y. Tamura, Y . Quan, M. Matsui, S. X u, The interference effect of surrounding buildings onwind loads oflow-rise buildings, BBAA VI International Colloquium on Bluff Bodies Aerodynamics &Applications Proceedings, M ilano, Italy, July 20-24, 2008. ) [3] S. Ahmad, K. Kumar, Interference effects on wind loads on low-rise hip roof buildings, EngineeringStructures 23 (2001)1577-1589. [4] P. He, T. Katayama, T. Hayashi, J. Tsutsumi, J. Tanimoto, I. Hosooka, Numerical simulation ofairflow in an urban area with regularly aligned blocks, J. Wind Eng. Ind. Aerodyn. 67&68 (1997) 281-291. [5] F.S. Lien, E. Yeeb, Y. Cheng, Simulation of mean flow and turbulence over a 2D building array usinghigh-resolution CFD and a distributed drag force approach, J. Wind Eng. Ind. Aerodyn. 92 (2004) 117-158. [6] A.S. Zhang, C.L. Gao, L. Zhang, Numerical simulation ofthe wind field around different buildingarrangements,J. Wind Eng. Ind. Aerodyn. 93 (2005) 891-904. [7] P.P. Sarkar, F.L. Haan, W.A. Gallus, L. Kuai, J. Wurman, Velocity measurements in a laboratorytornado simulator and their comparison with numerical and full-scale data, Proceedings of the 37" US-Japan Panel on Wind and Seismic Effects Joint Meeting, Tsukuba, Japan, 2005. [8] F.L. Haan, P.P. Sarkar, W.A. Gallus, Design, construction and performance ofa large tornadosimulator for wind engineering applications, Engineering Structure 30 (2008) 1146-1159. [9] A. Sengupta, F. L. Haan, P.P. Sarkar, V. Balaramudu, Transient loads on buildings in microburst andtornado winds, J. Wind Eng. Ind. Aerodyn. 96 (2008) 2173-2187. [10] J.M.M. Sousa, Turbulent flow around a surface-mounted obstacle using 2D-3C DPIV, Experimentsin Fluids 33 (2002)854-862. [11] A.E. Perry, M.S. Chong, Interpretation offlow visualization, In Flow visualization: techniques andexamples, ed. A.J. Smits, T.T. Lim, Imperial College Press, 2000.
确定
还剩8页未读,是否继续阅读?

产品配置单


北京欧兰科技发展有限公司为您提供《龙卷风中周围建筑物对龙卷风导致的底层建筑物风载荷的影响检测方案(粒子图像测速)》,该方案主要用于空气中其他检测,参考标准--,《龙卷风中周围建筑物对龙卷风导致的底层建筑物风载荷的影响检测方案(粒子图像测速)》用到的仪器有德国LaVision PIV/PLIF粒子成像测速场仪、Imager sCMOS PIV相机、PLIF平面激光诱导荧光火焰燃烧检测系统
推荐专场


CCD相机/影像CCD
更多


相关方案
更多
该厂商其他方案
更多