


Sulfur dioxide is the major environmental contaminant that contributes to smog and soot. The reduction of air pollu-tants is a worldwide goal that has become a focus for sustainable environmental development strategies. As emission standards increase, the waste gas cleaning system will be required to adapt or be upgraded. Wet FGD is character-ized as one of the most reliable and effective SO2 removal techniques, with the added benefit of low operating cost. However, implementation and maintenance is considered high.
Spray towers are essential elements in the emission cleaning system. Control of the droplets throughout the tower geometry is critical to ensuring maximum reduction and minimal scaling. In order to improve the scrubber, nozzle characteristics and placement must be optimized to reduce the cost of the system implementation and mitigate risks of inadequate pollution removal. A series of large flow rate, hydraulic full and hollow cone injectors were investi-gated for this study.
Computational Fluid Dynamics (CFD) simulations were used to examine a standard industrial-size wet scrubber design for injection system optimization. ANSYS Fluent solvers were used with Lagrangian particle tracking meth-od for heat and mass transfer between gas and liquid. The alkaline sorbent material and SO2 reaction was modeled to determine uniformity and efficacy of the system. Surface chemical mechanisms were used to simulate the reaction rate. Drop size, liquid rheology, and injector array layout were examined to achieve SO2 removal above 90%. Wall impingement and flow pattern results were evaluated, due to their impact in minimizing equipment corrosion and plugging.
方案详情

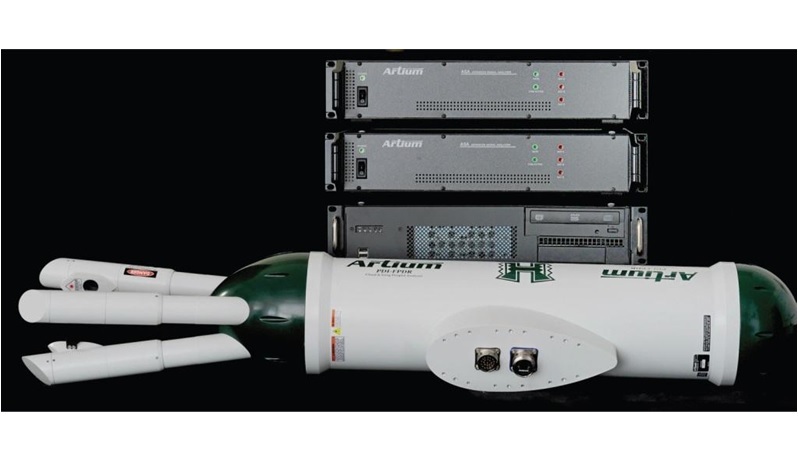
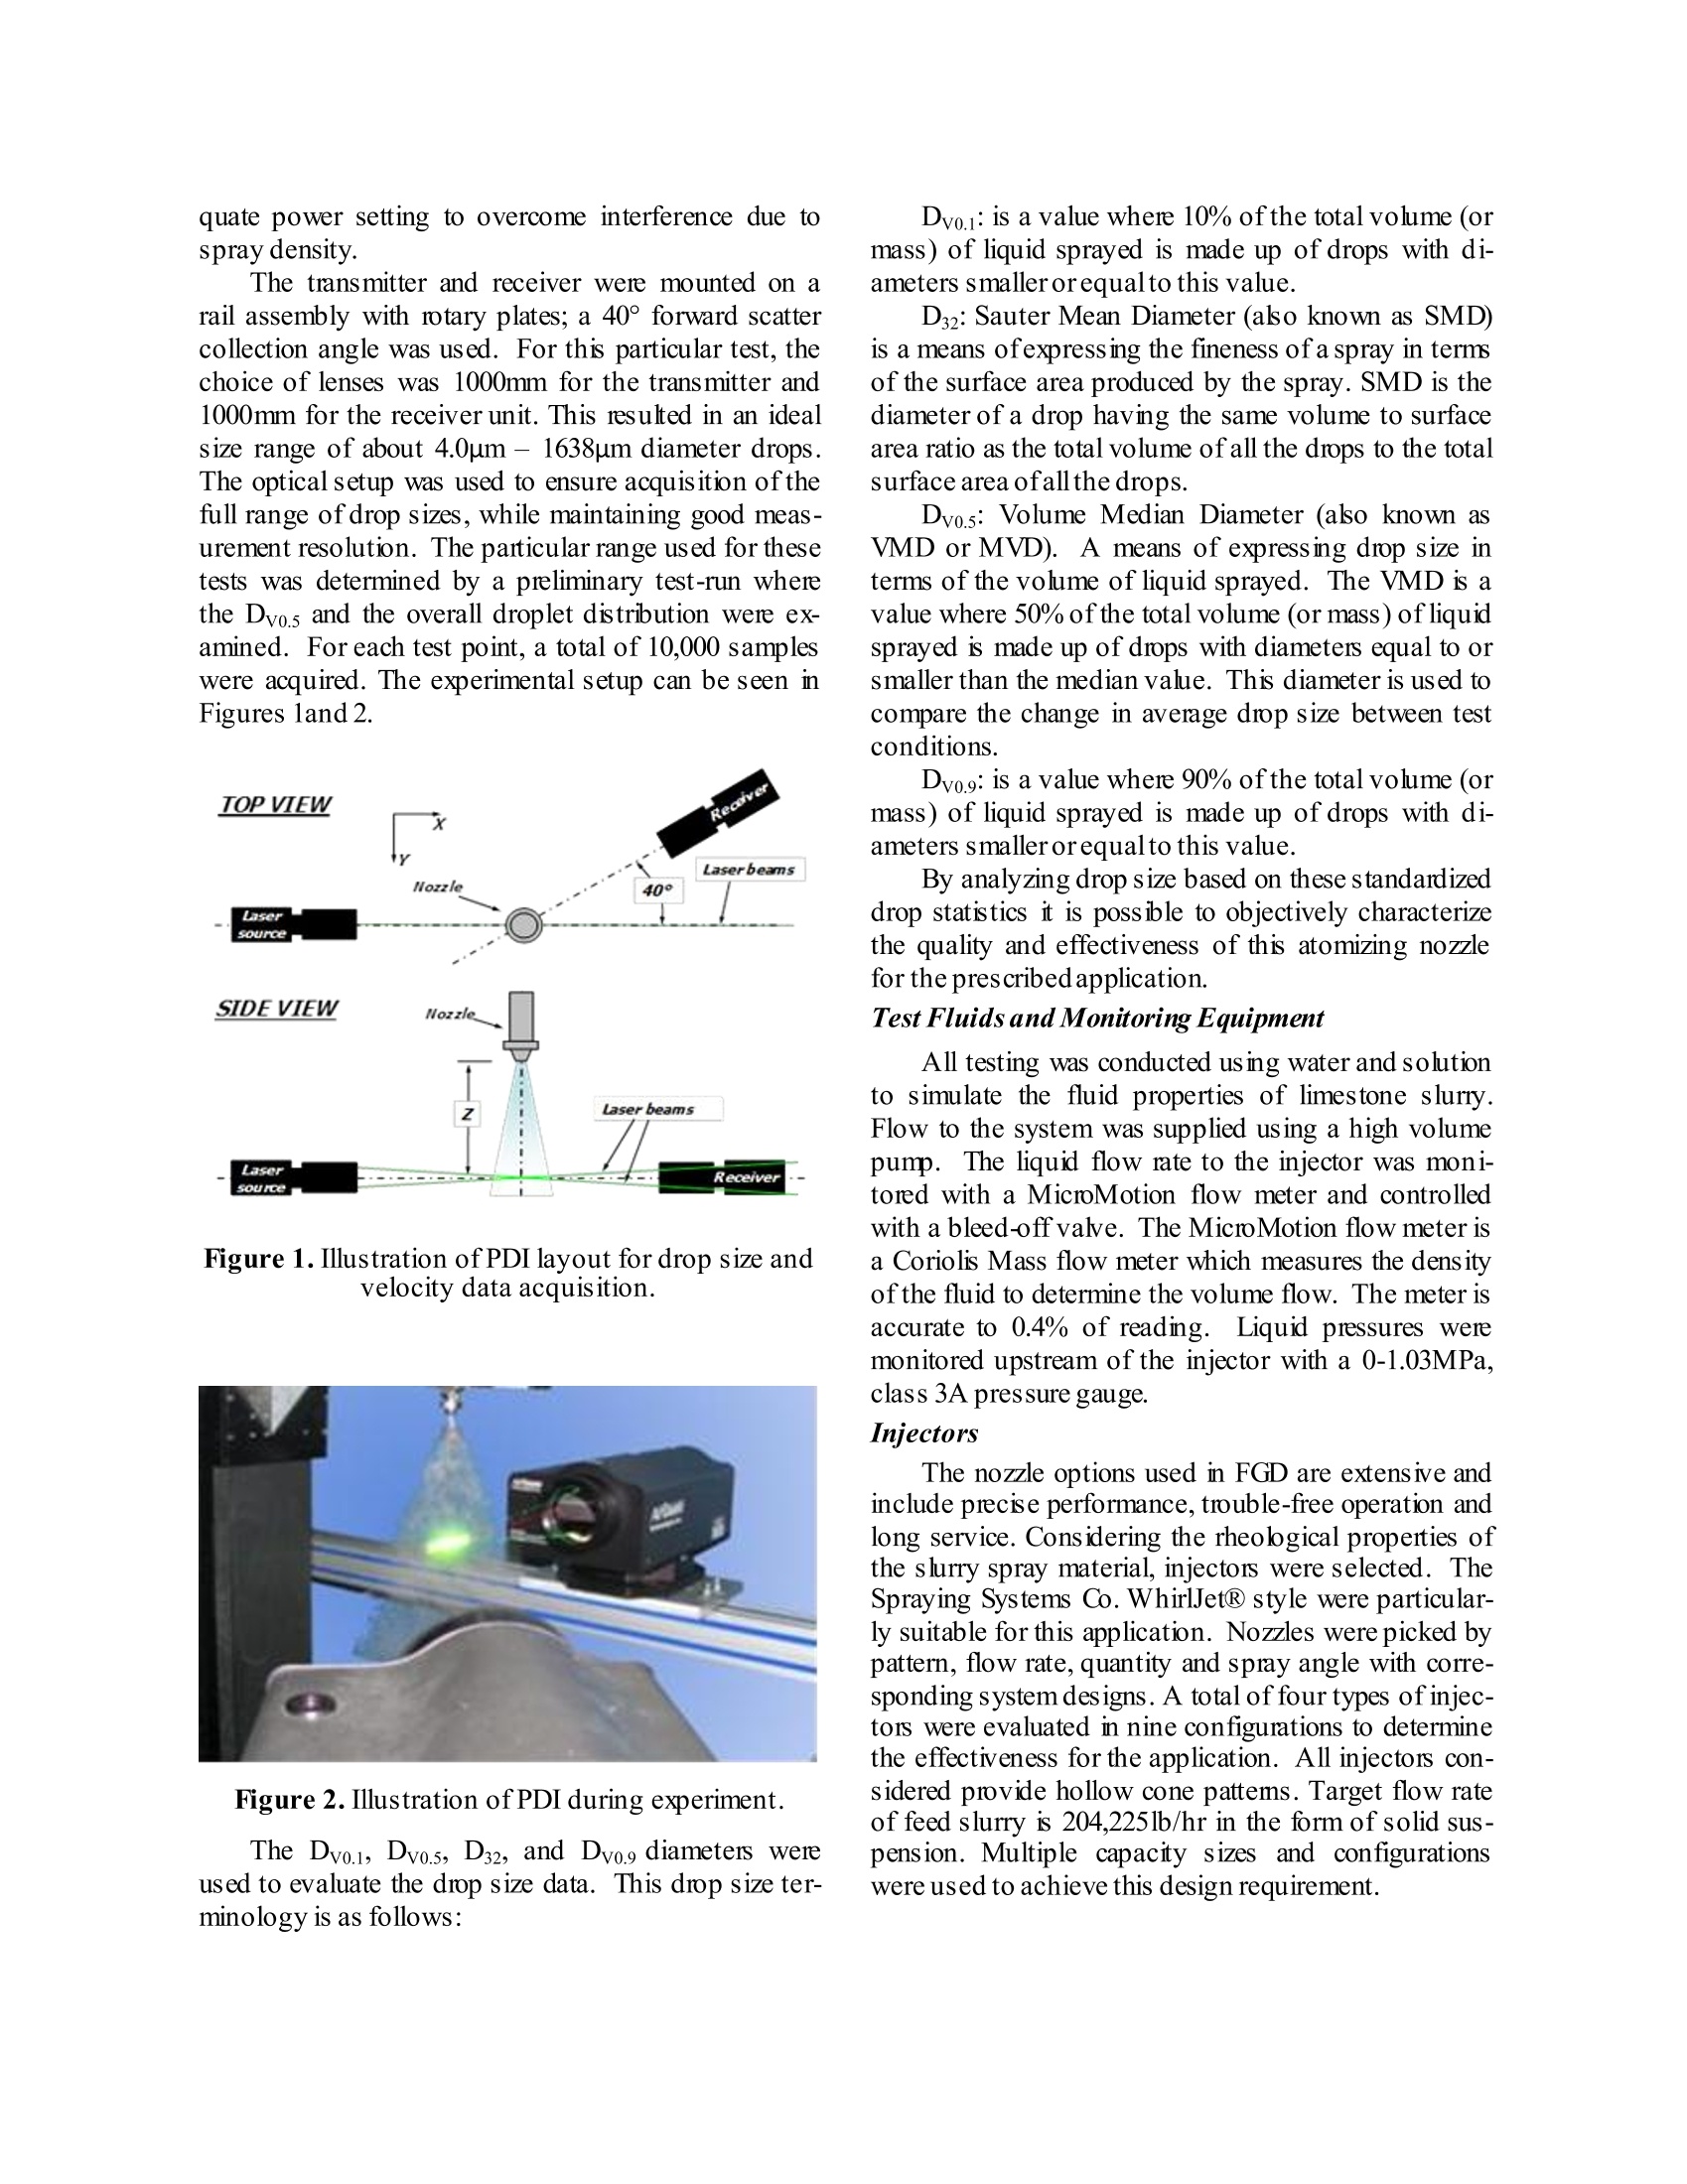
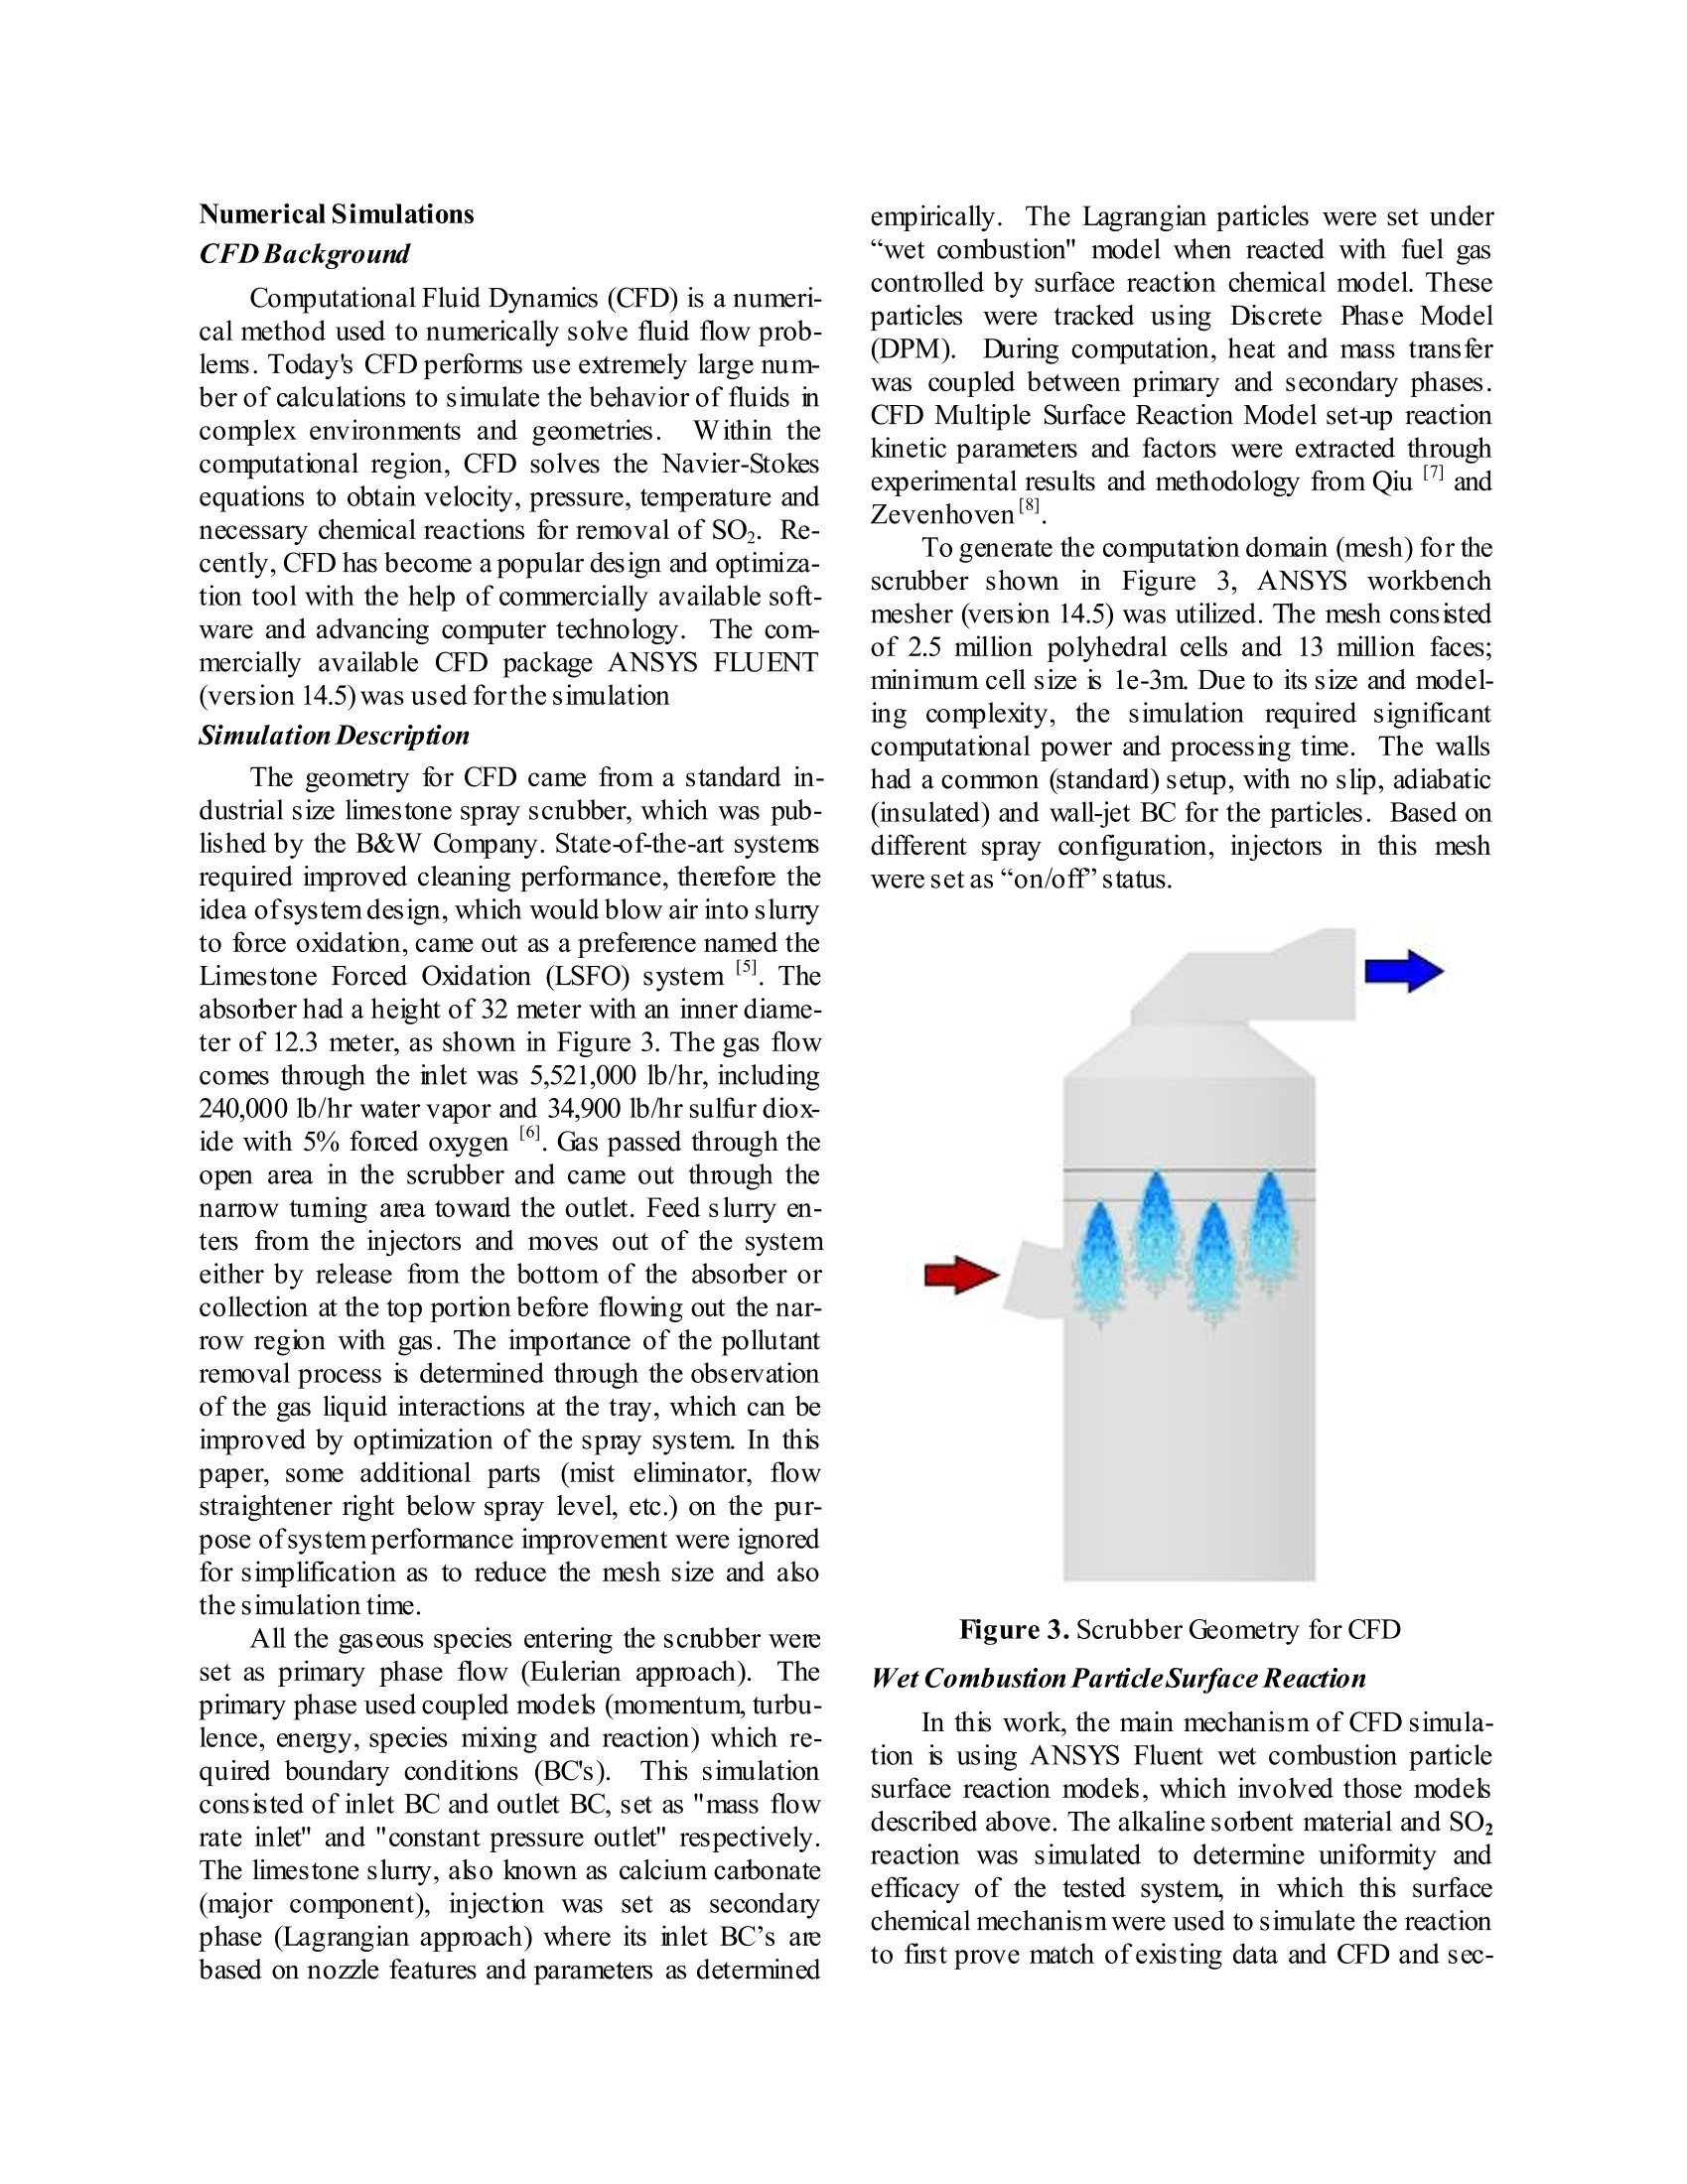
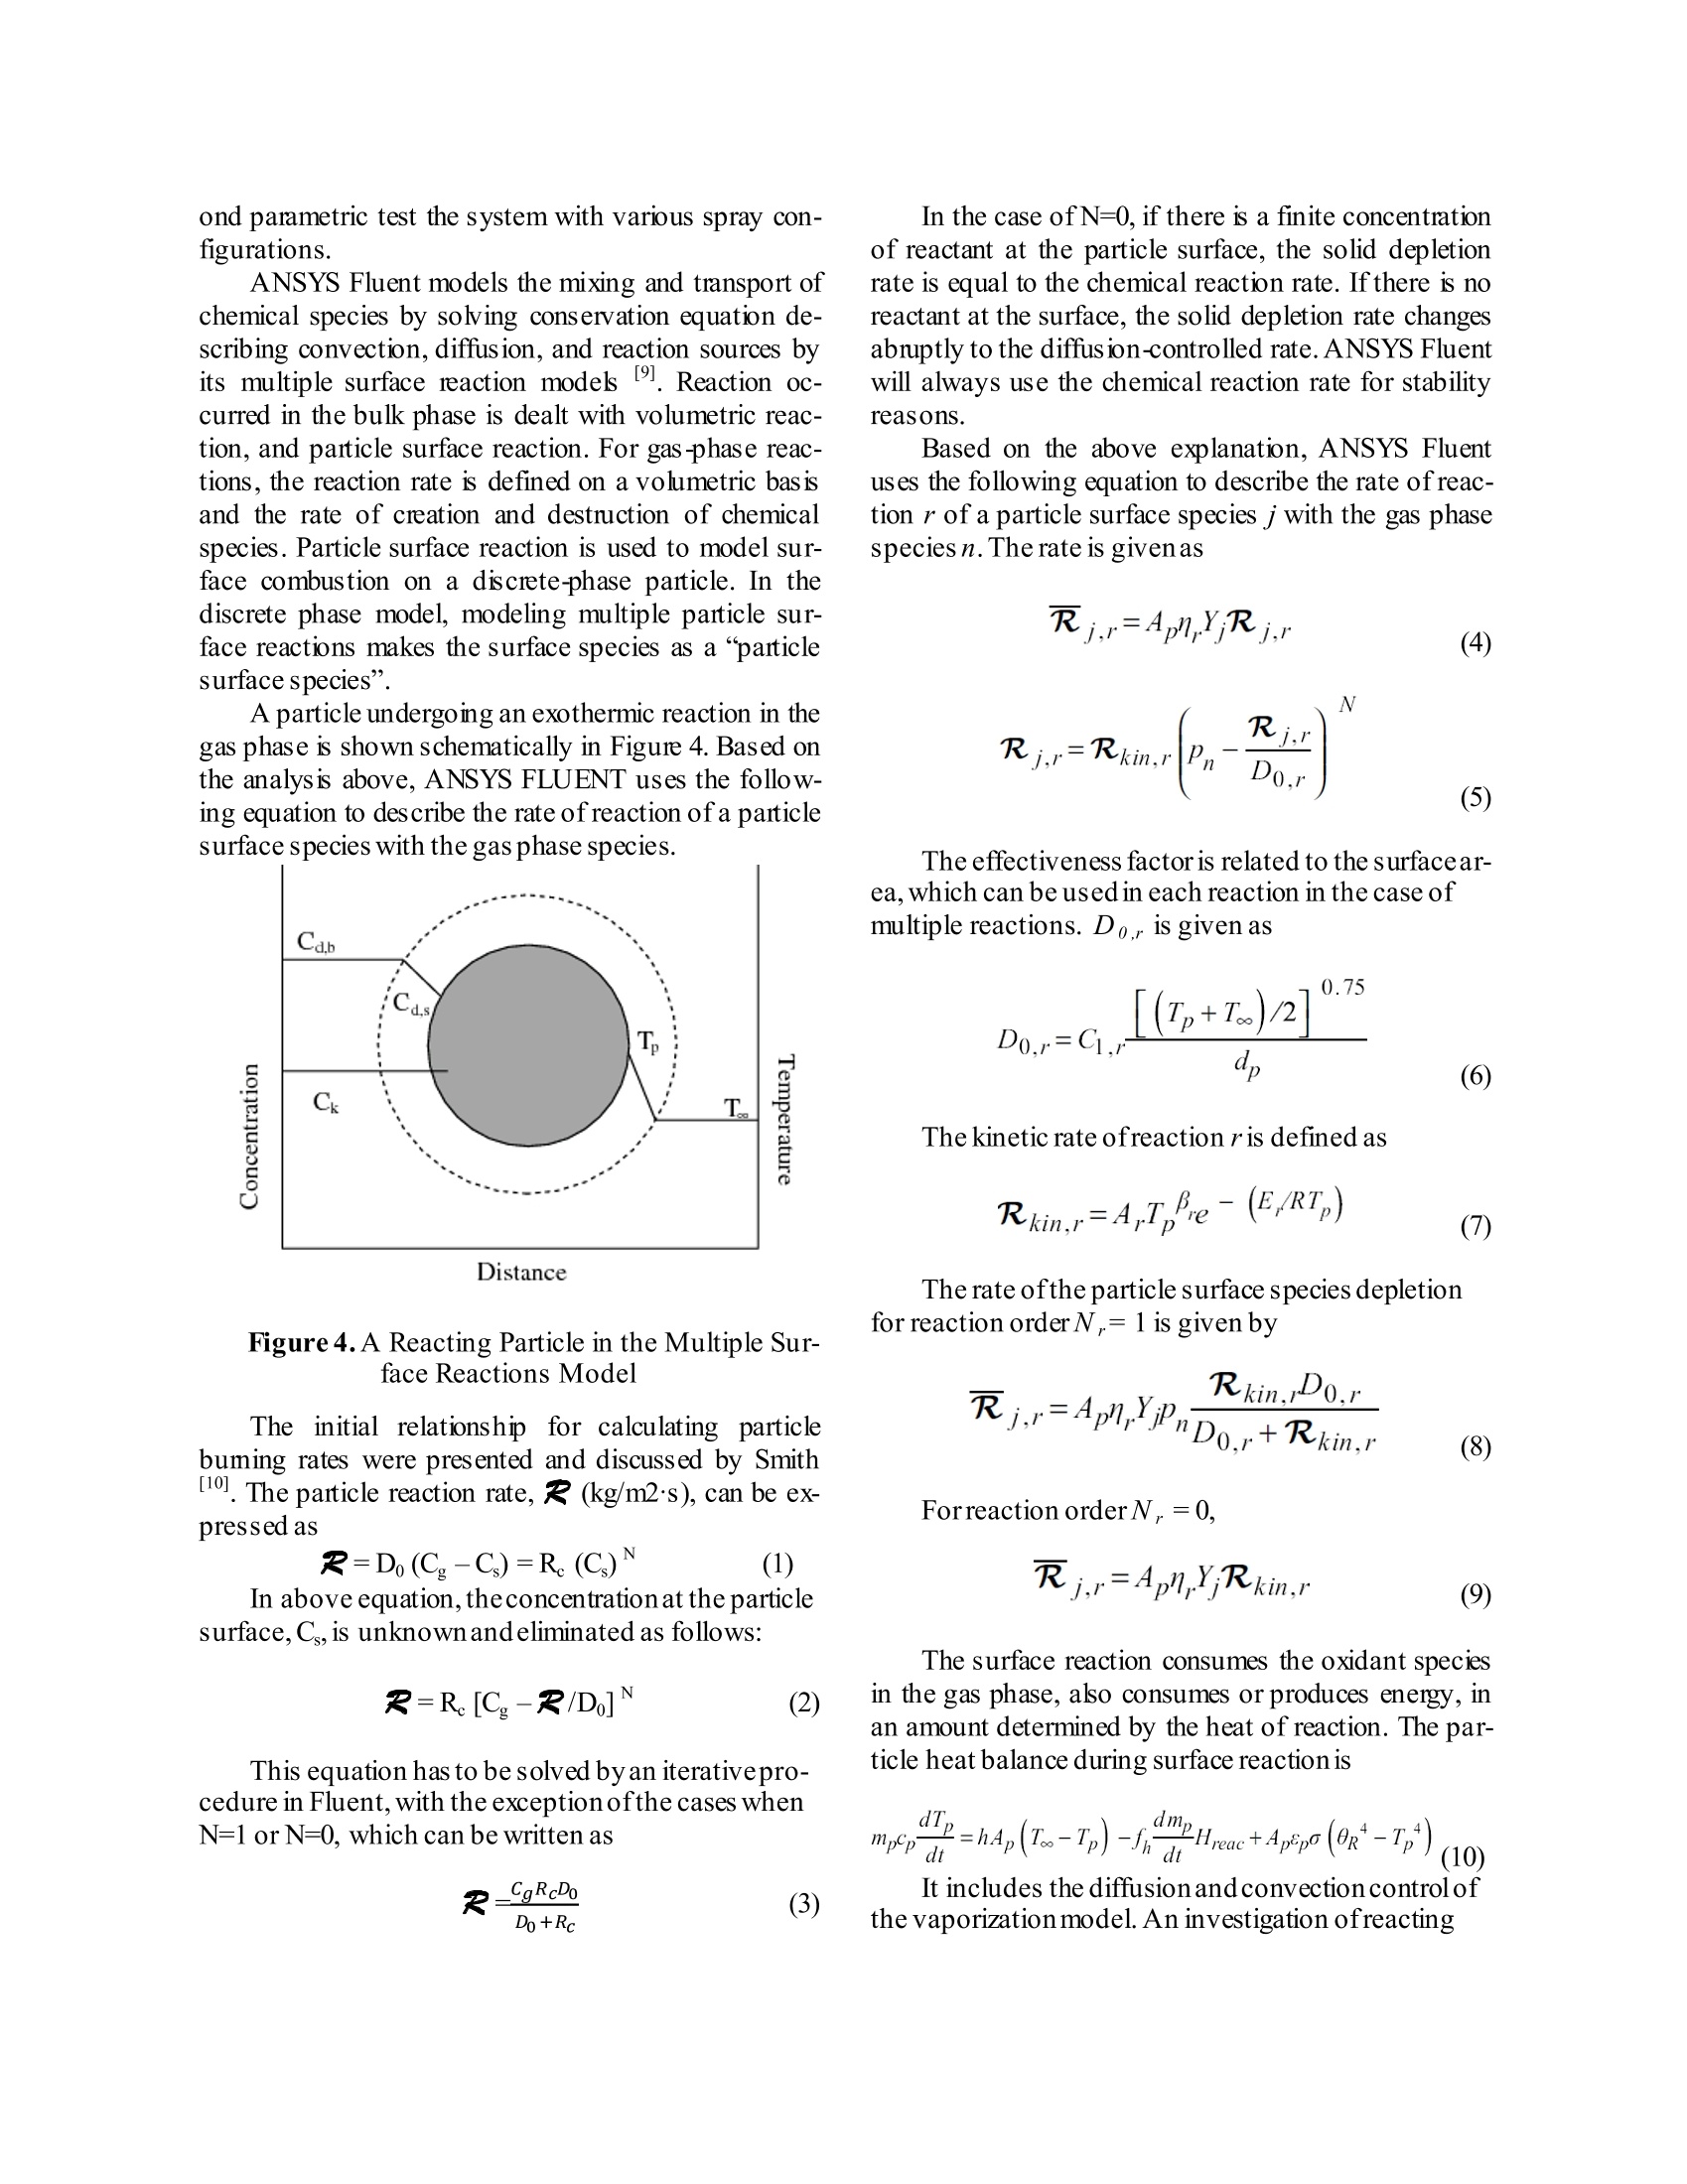
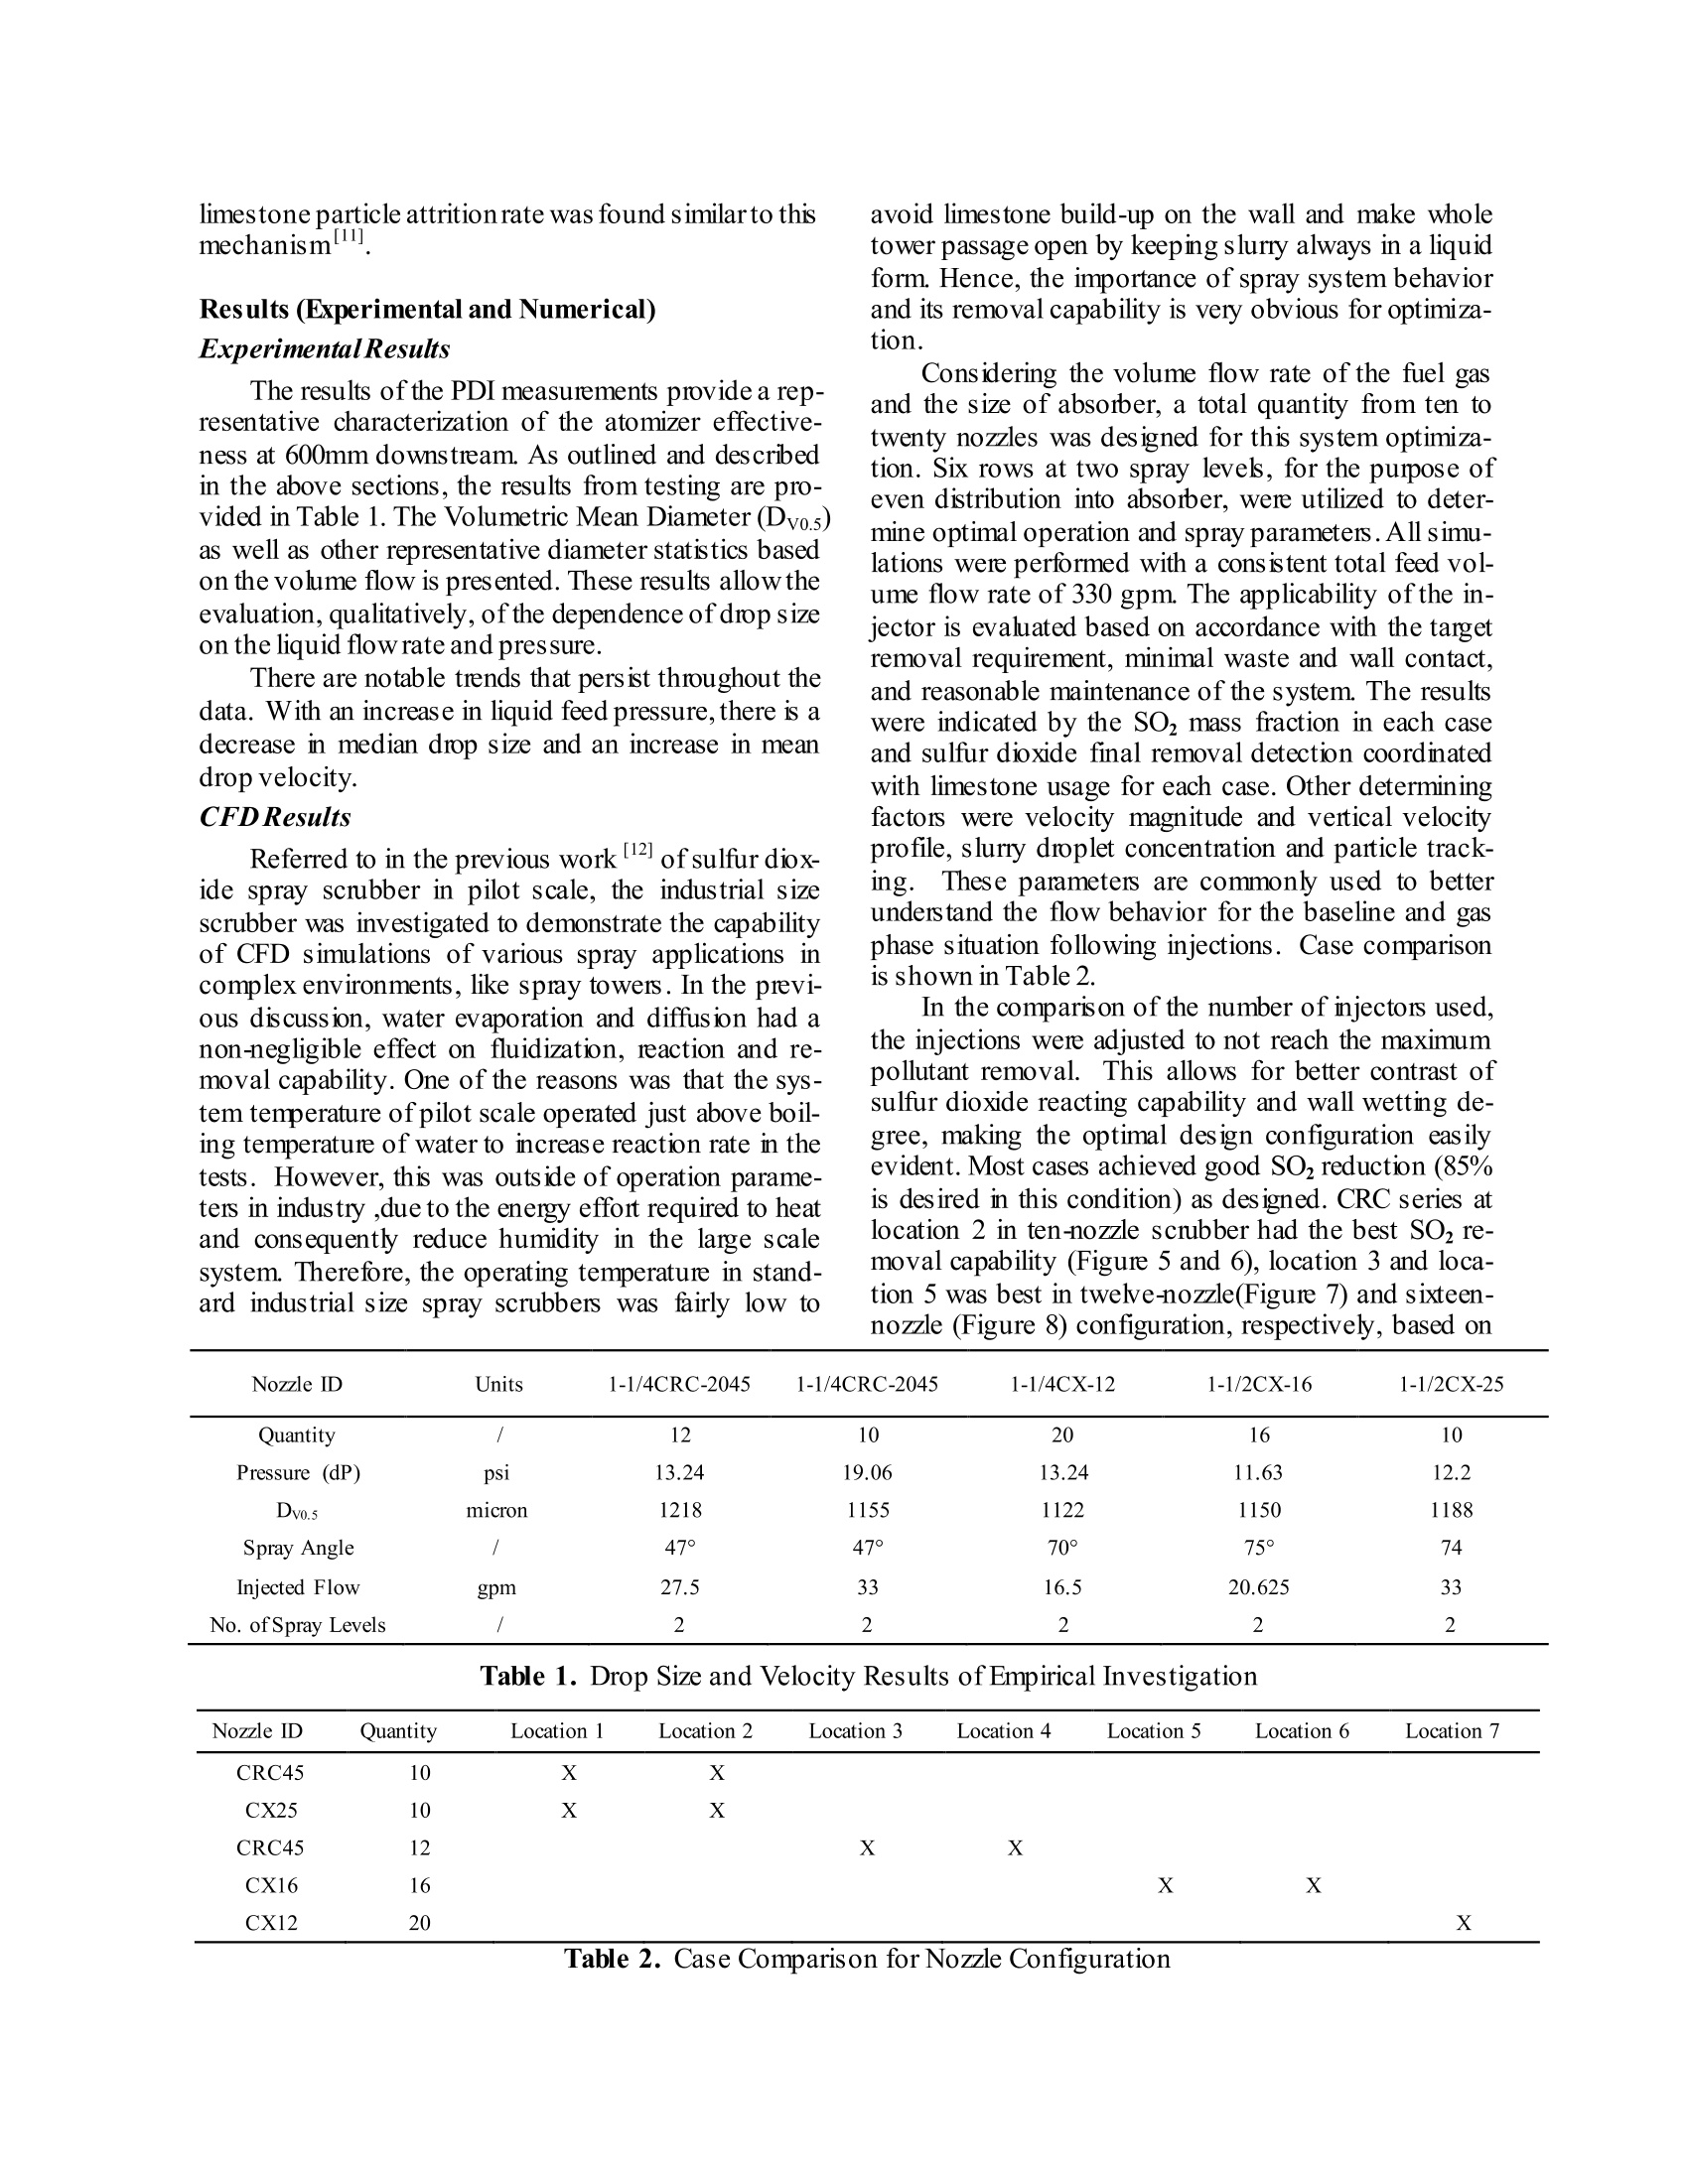
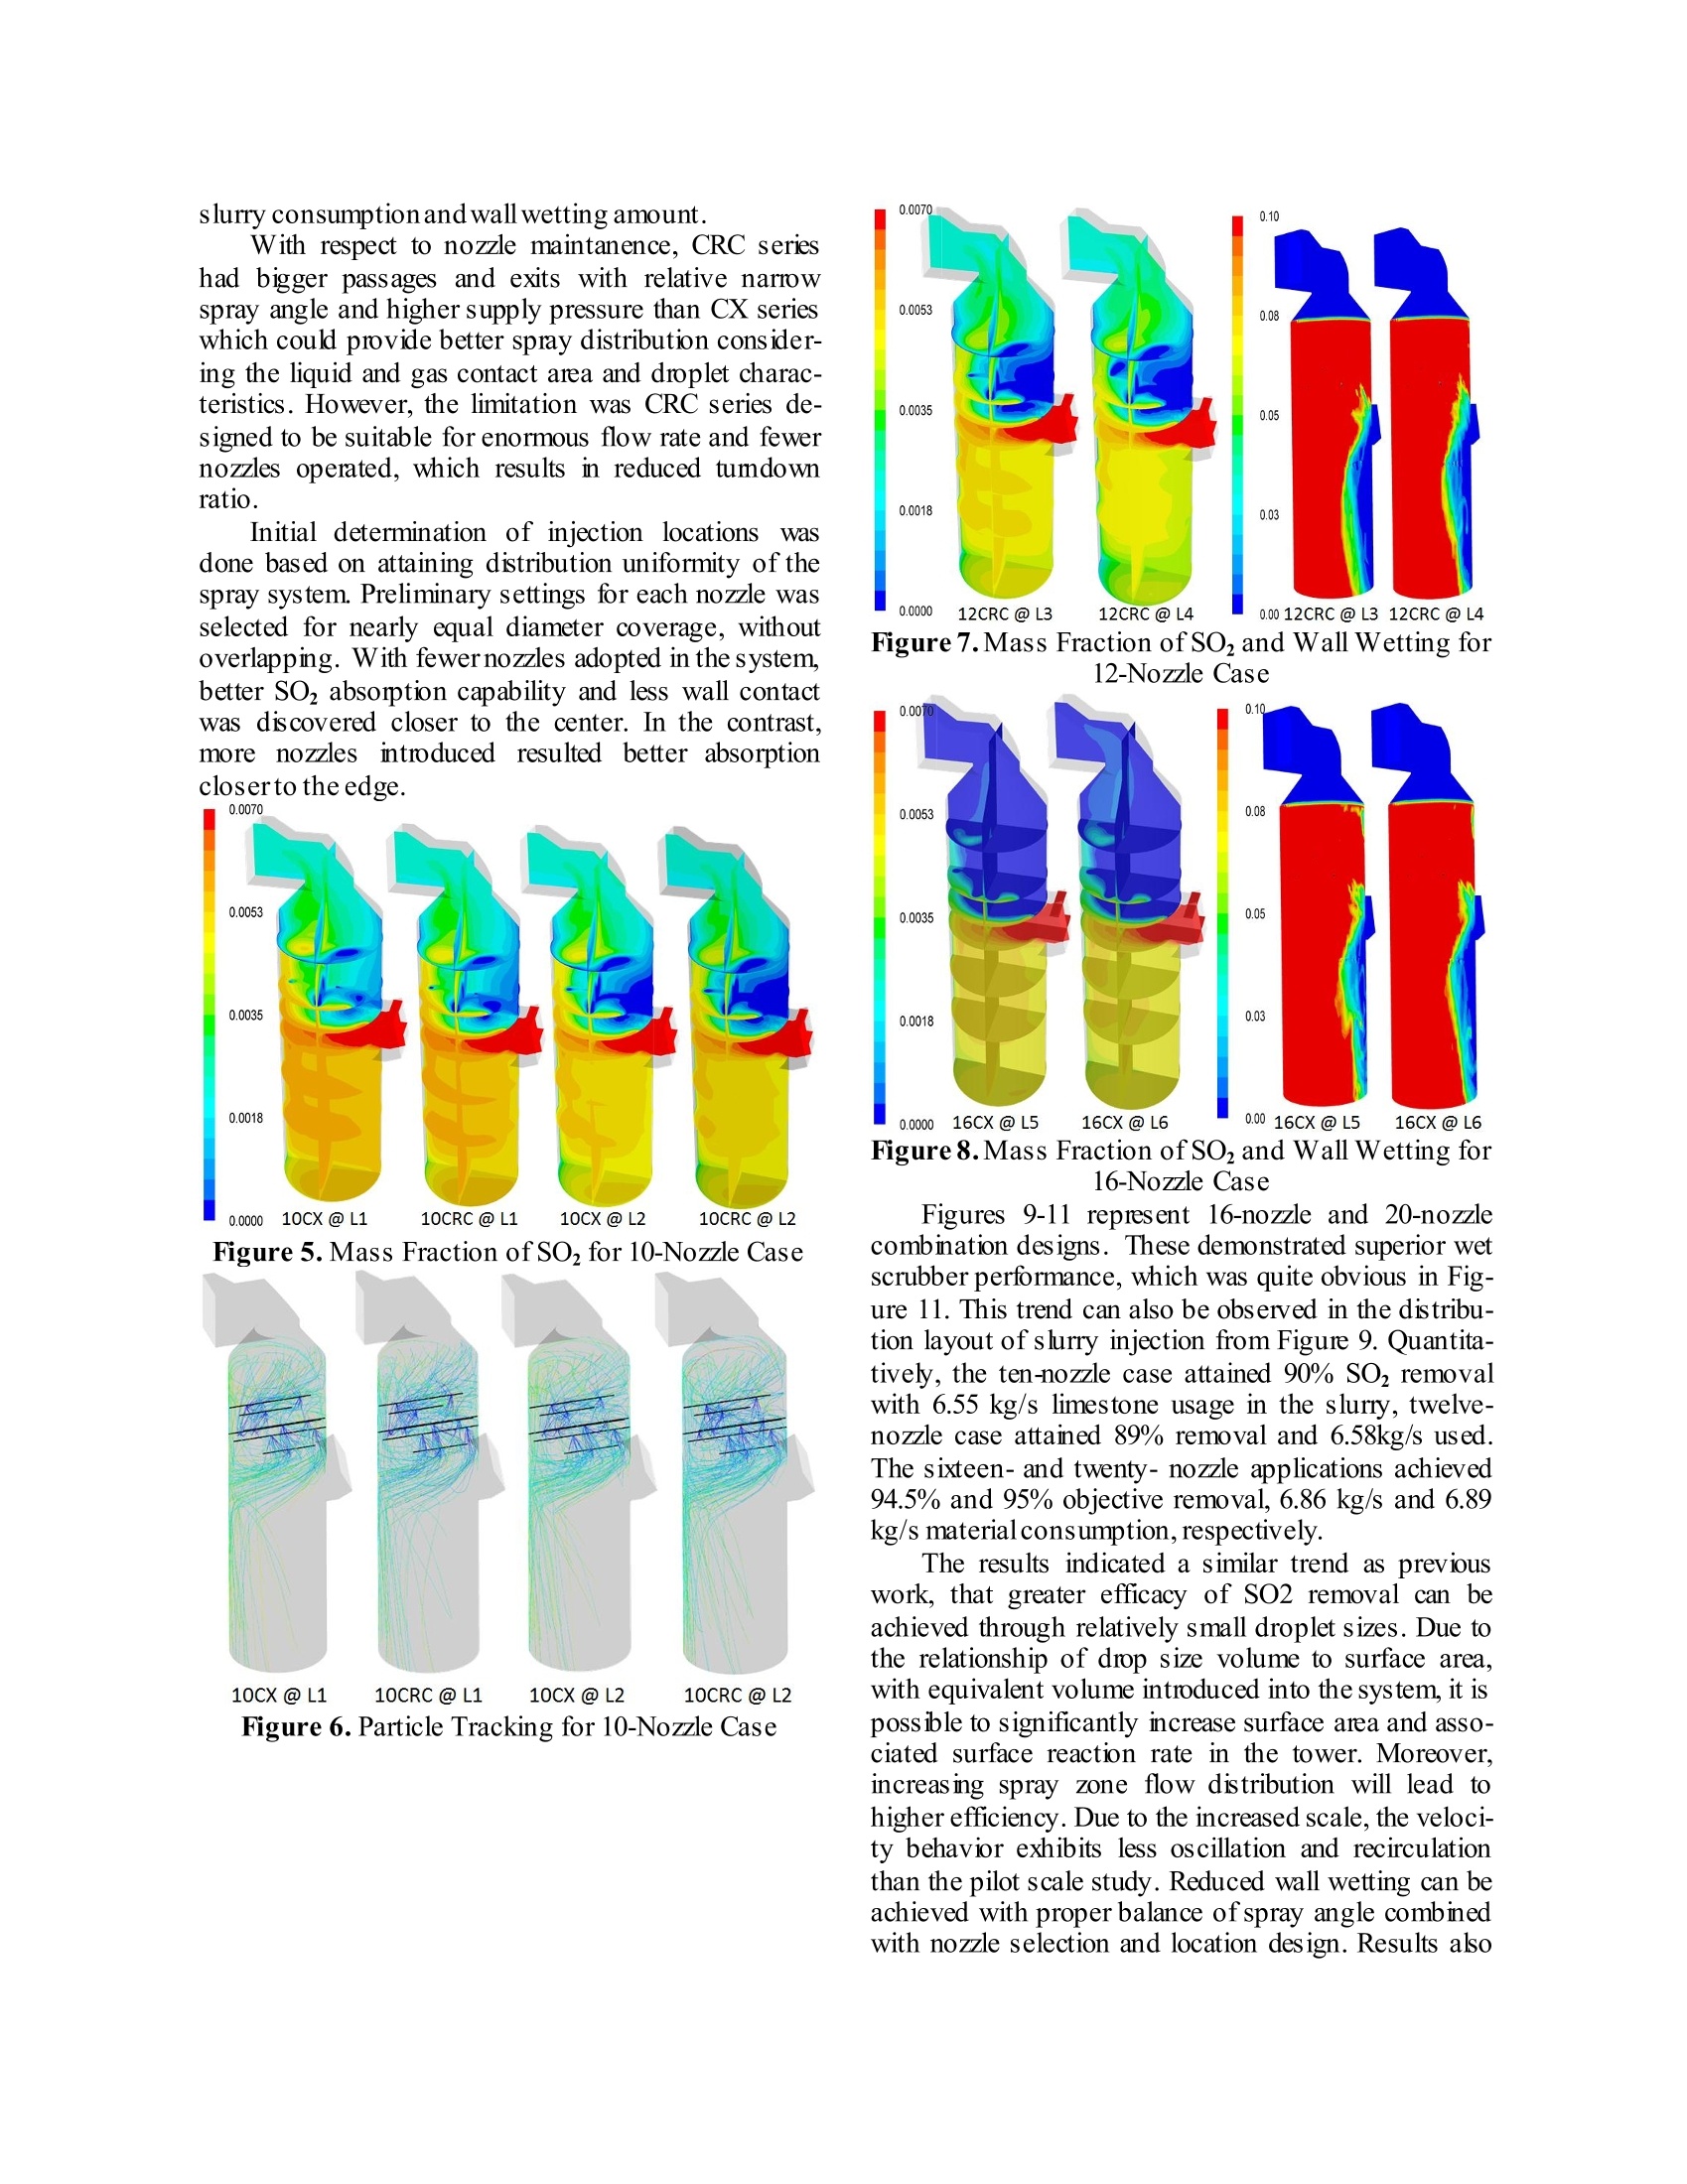
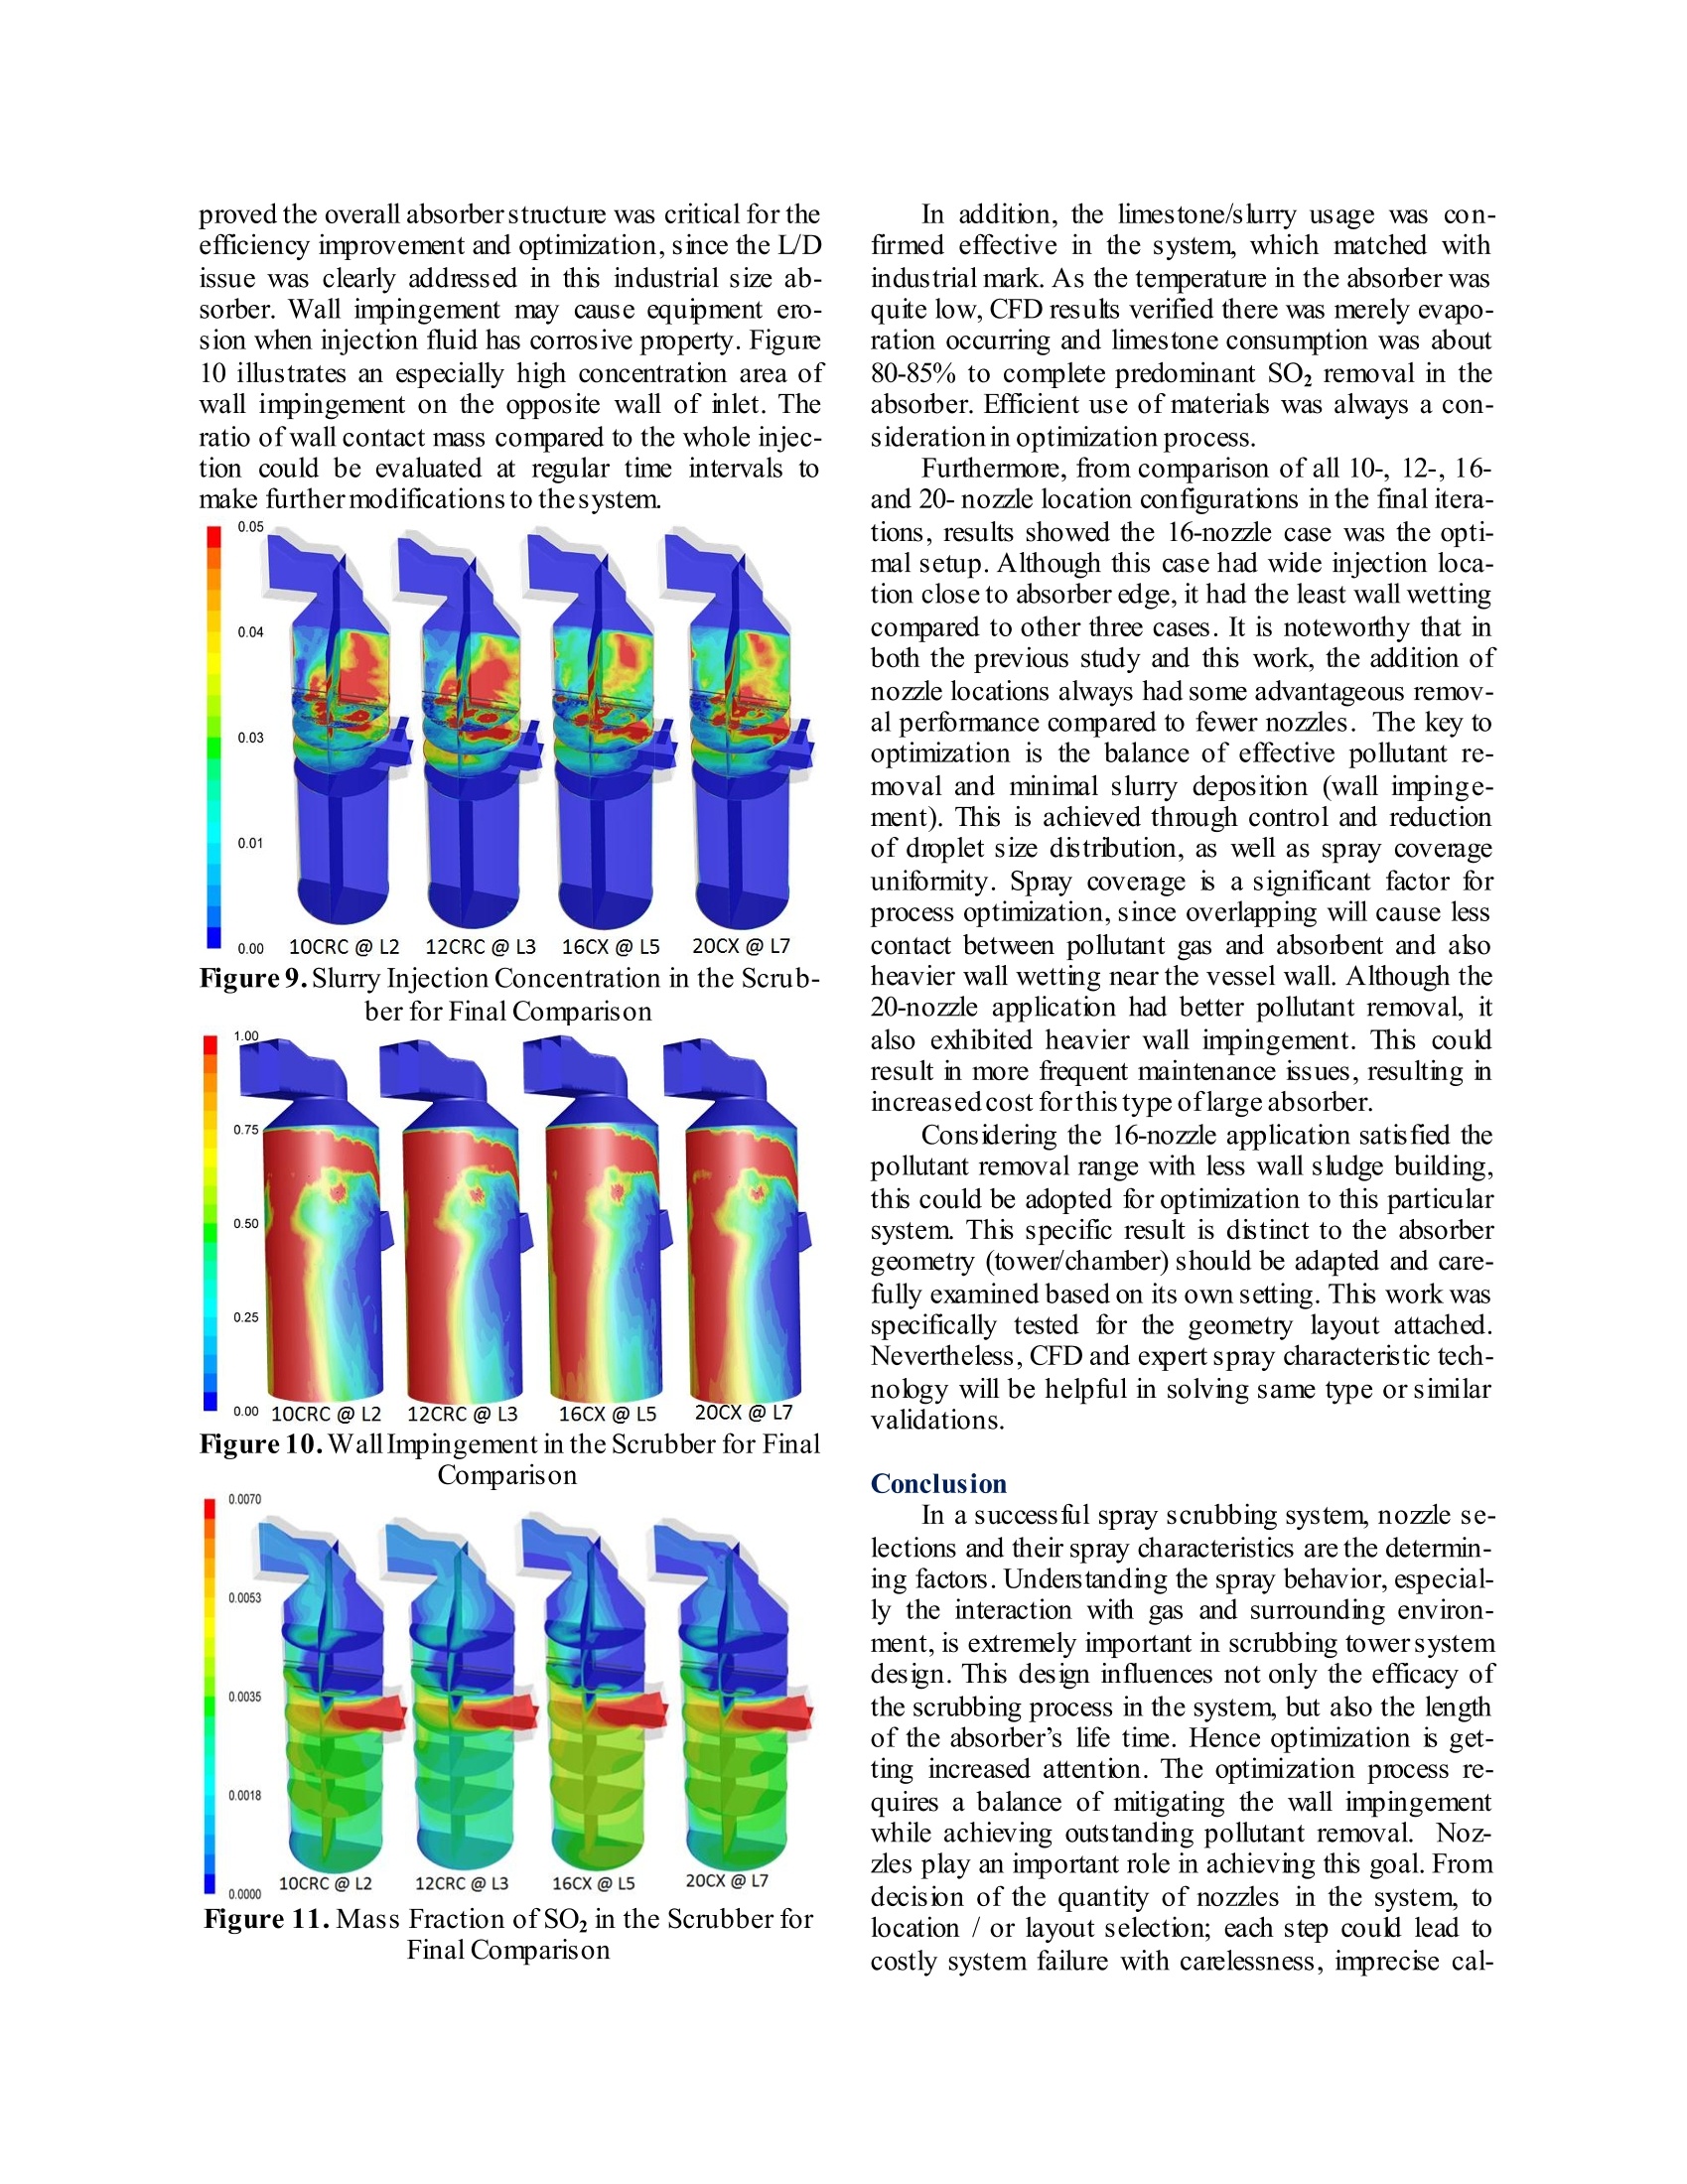
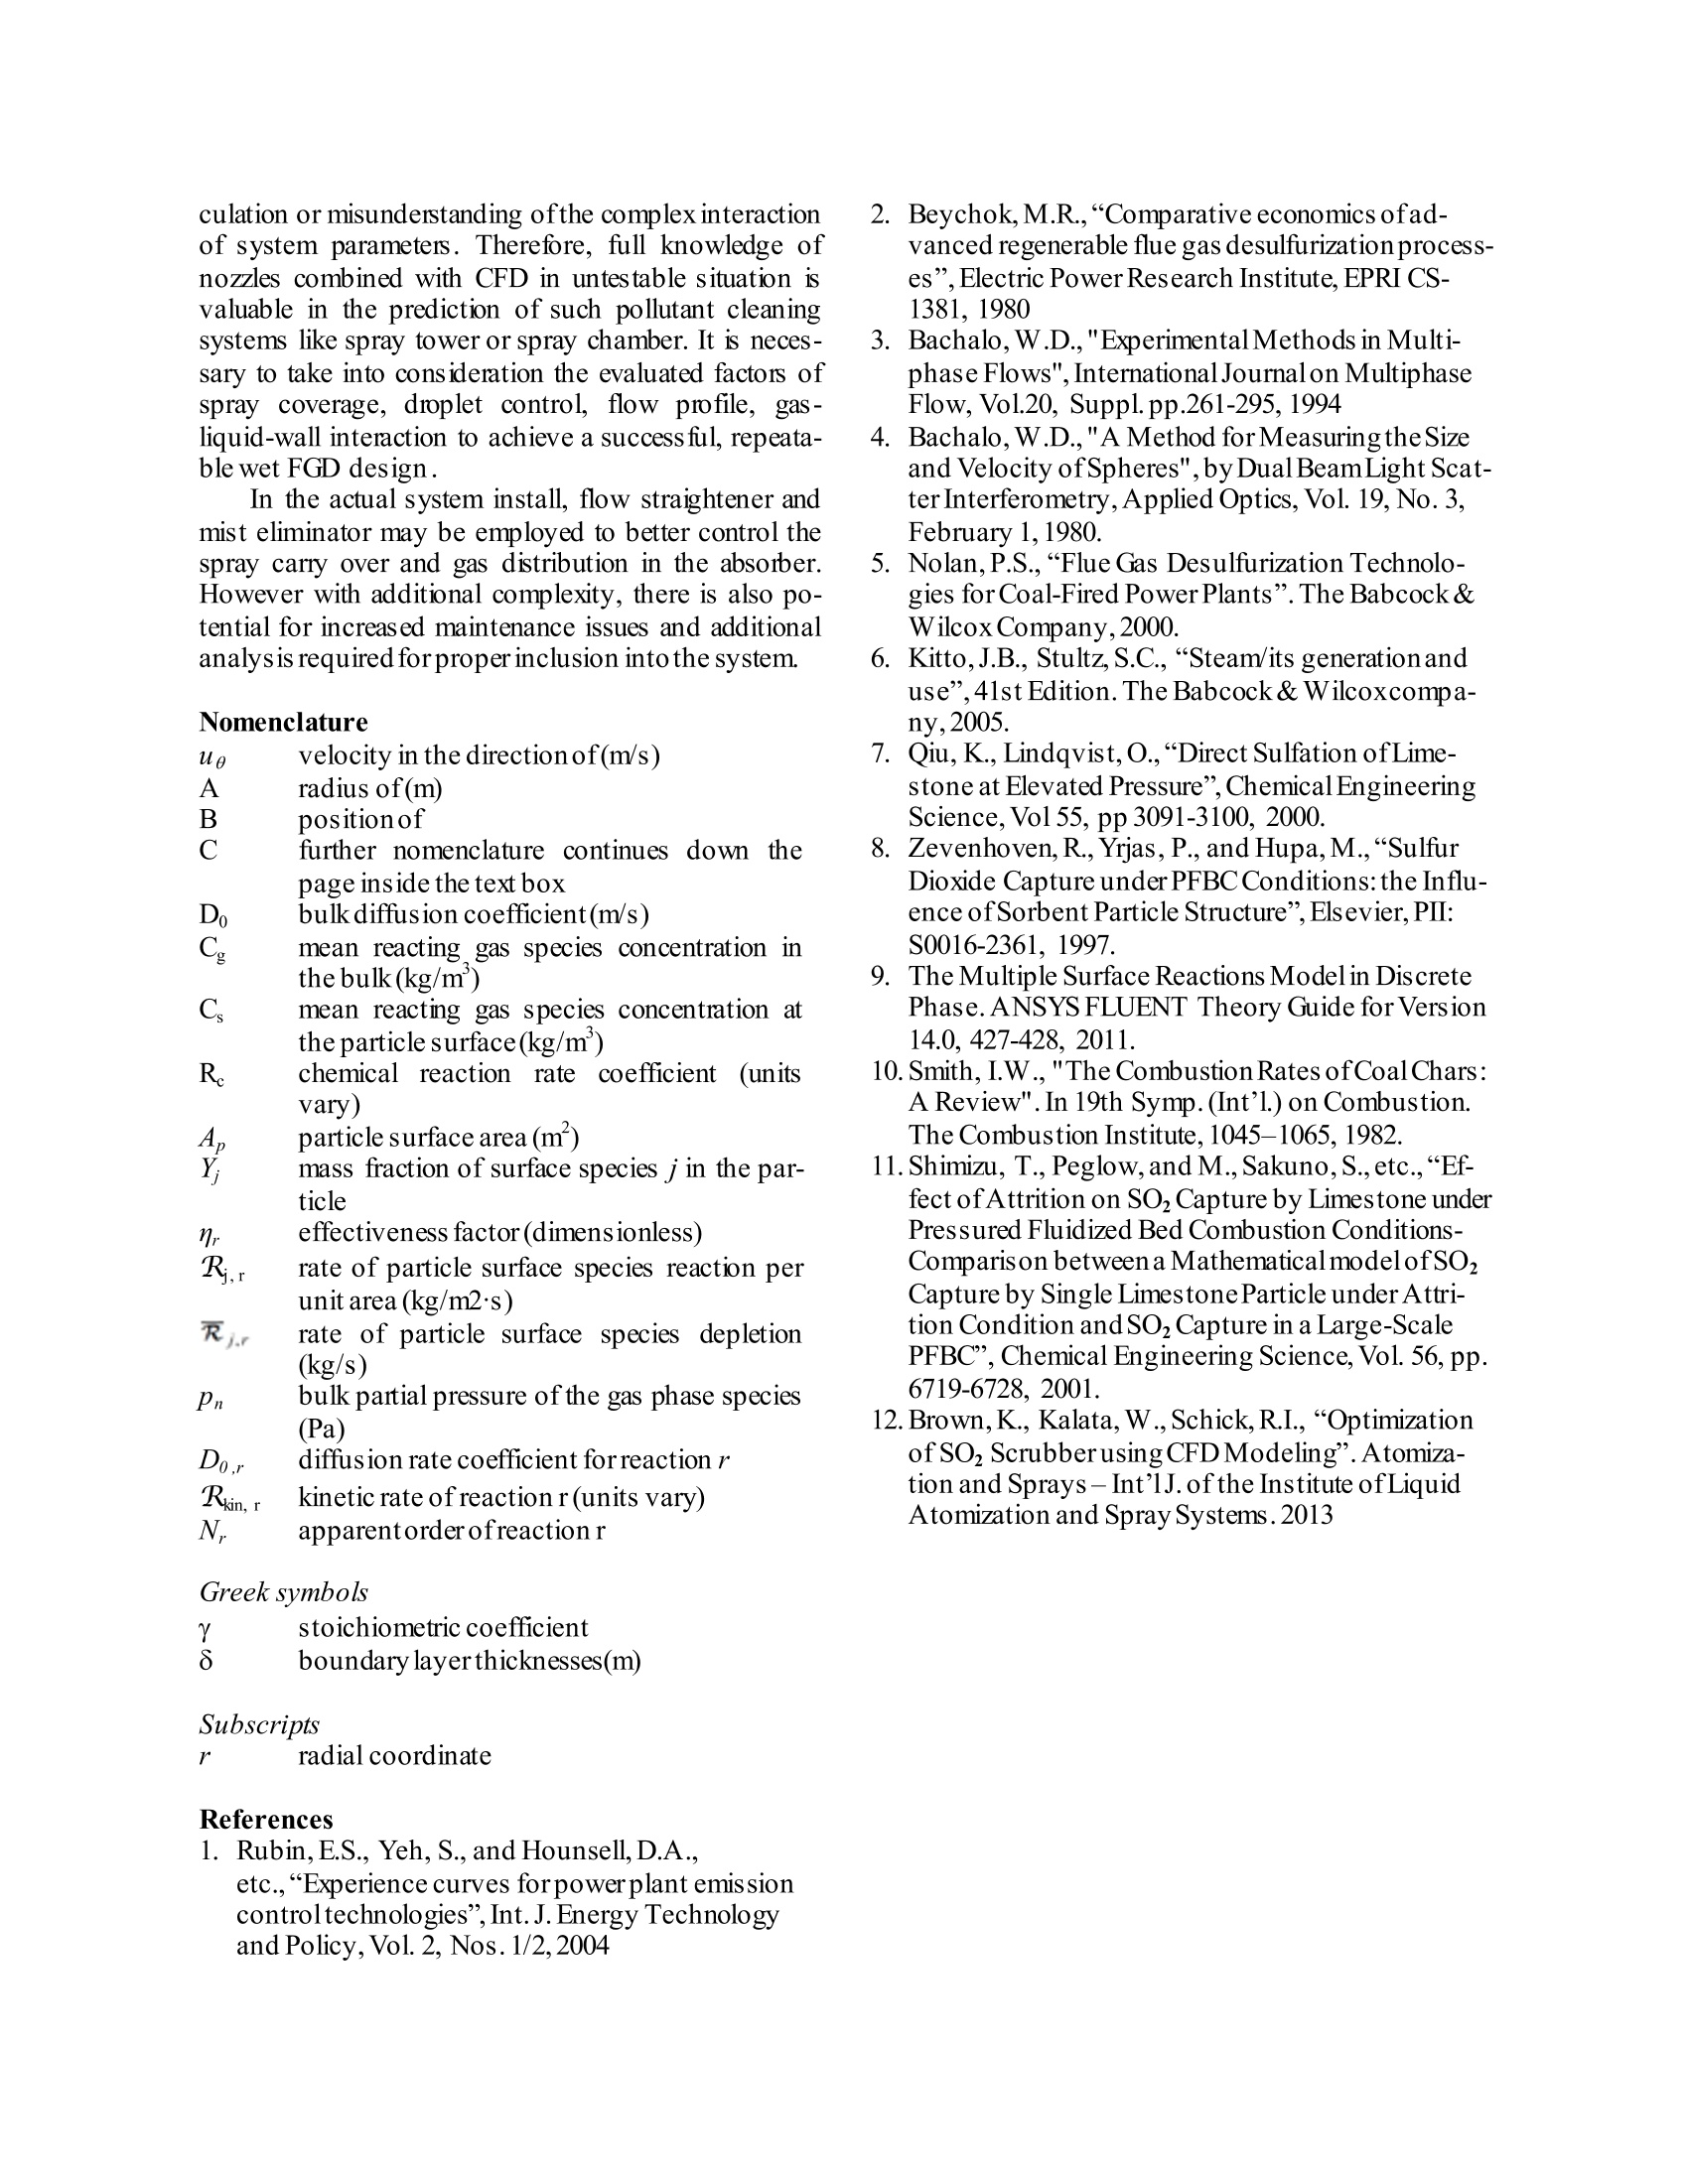
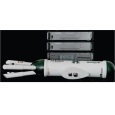
ILASS Americas, 25th Annual Conference on Liquid Atomization and Spray Systems, Pittsburgh, PA, May 2013 Table 2. Case Comparison for Nozzle Configuration Analysis and Optimization of Spray Tower in WFGD F. Li, K. J. Brown, W. Kalata, and R. J. Schick Spraying Systems Company P.O. Box 7900 Wheaton, IL 60187 USA Abstract Sulfur dioxide is the major environmental contaminant that contributes to smog and soot. The reduction of air pollu-tants is a worldwide goal that has become a focus for sustainable environmental development strategies. As emissionstandards increase, the waste gas cleaning system will be required to adapt or be upgraded. Wet FGD is character-ized as one of the most reliable and effective SOz removal techniques, with the added benefit of low operating cost.However, implementation and maintenance is considered high. Spray towers are essential elements in the emission cleaning system. Control of the droplets throughout the towergeometry is critical to ensuring maximum reduction and minimal scaling. In order to improve the scrubber, nozzlecharacteristics and placement must be optimized to reduce the cost of the system implementation and mitigate risksof inadequate pollution removal. A series of large flow rate, hydraulic full and hollow cone injectors were investi-gated forthis study. Computational Fluid Dynamics (CFD) simulations were used to examine a standard industrial-size wet scrubberdesign for injection system optimization. ANSYS Fluent solvers were used with Lagrangian particle tracking meth-od for heat and mass trans fer between gas and liquid. The alkaline sorbent material and SOz reaction was modeled todetermine uniformity and efficacy ofthe system. Surface chemical mechanisms were used to simulate the reactionrate. Drop size, liquid rheology, and injector aray layout were examined to achieve SOz removal above 90%. Wallimpingement and flow pattern results were evaluated, due to their impact in minimizing equipment corrosion andplugging. ( Correspondingauthor: Fang.Li@spray.com ) Introduction Sulfur dioxide (SO) is a chemical substance formof pollutant emitted into atmosphere from volcanicactivity or various industrial processes of fossil fuel astheir energy source. Since sulfur is acommoncompound of coal and petroleum, the combustion oftenproduces sulfur dioxide, except for specific sulfurremoval procedure done before burnt. Sulfur dioxide isa reactive and acrid gas, which in large quantitiesversus small portion ofatmosphere would cause seriousenvironmental impacts, such as smog and soot. As thestrategyof environmental sustainable development gotattentions and commission globally, control of SOemission becomes a subject and focus for industry withfossil-fuel power. As the restrictions for pollutantrelease are highly regulated, all above mentionedindustries, especially power plants, need to adapt orupgrade pollutant control systems to meet the emission Flue gas desulfurization (FGD) is one of the majorapplications in SO2 emission control, which can achieveexpected sulfur dioxide removal from exhaust fluegasess or other emittingprocesses, economically.Among FGD technologies, wet-scrubbing, using slurryof alkaline sorbent, is characterized as one of the mostreliable and effective SO2 removal techniques with lowoperating cost. However.I,implementationaandmaintenance costs are an investigation consideration toreduce the cost of wet FGD as a pollution controloption. Hence, an optimal system or procedure isrequired to improve the situation without any influenceto production. Processimprovementand optimizationiaconstantly ongoing effort. The wet FGD methodiiwidely used and employs limestone/ lime or seawaterslurry as absorbent material to reduce SO2 prior toexhausting process gases to the atmosphere. Herebyspray towers and spray chambers are essential elementsin the pollutant emitting-cleaning systems. Control ofdroplets introduced into the systems is critical to ensuremaximum reduction with minimal scaling. The liquidslurry is known to have density, viscosity and surfacetension values that deviatefromwater spraycharacteristics. Uncontrolleddiitnjection performancecould result in buildup ofslurry on walls and may causecorrosion in areas of wall attachment. To make systemsrelatively71inexpensive for implementation and tomitigate risks of inadequate SO removal, nozzlecharacteristics and placement must be optimized byevaluation and control of the injected slurry, sulfurdioxide removaleffectiveness, and wall impingement. In situ analys is would provide the best assessmentof the spiay’s characteristics in the tower, however, thisis often cost prohibitive or not physically possible. On- site engineers rely heavily on experience and casestudies from past scrubber performance. Contemporarypractices include the application of computational fluiddynamics (CFDicS), which has become very useful bymaking predictive analysis to validate the expectedsystem performance and minimize the risk. Engineerswilbe able to determine system resiliency andoperating limits, as well as assess the spray qualityreferred from results ofsimulation. Spraying Systems Co.has a unique combination oflaboratory equipd computationalI resourcespmmeentannt angrequired to optimize spray applications. The expeitiseallows for a rigorous validation of spray modelingtechniques often used to simulate un-testable situationslike wet FGD. This body of work was performed toprove the ability to simulate and compare the data of astandard industrial-size wet spray scrubber and toanalyze various Spraying Systems Co. injectors forevaluationofefficacy in SO2reduction. Spray analysis and characterization was performedin the laboratory to get real droplet distribution andspray details for the nozzles. This data was combinedwith various models embedded in CFD to provideaccurate input to stait simulation. Comparis on of nozzleselections and locations, operation parameters werepresented as direct results through evaluation offluidization behavior. The results demonstrated theexpected liquid-gas interaction relative to the systemefficiency. Drop size, liquid mheology, and injectorarray layout were examined to achieve SO2 removalabove 90% or 10% higher than original setting byappropriate spray level setup. Wall impingement andflow pattern results were evaluated due to their impactin minimizing equipment corrosion and plugging asrequired for continuous scrubber. Equipment and Methods Test Setup and Data Acquisition For drop sizing, the nozzle was mounted on a fixedplatform in a vertical downward orientation. The datawas acquired at 600mm downstream of the nozzle exitorifice. Drop size and velocity information was col-lected at various operating conditions. Multiple pointsthroughout the spray plume were measured with a massand area weighted average reported for comparisonpurposes. Atwo-dimensional Artium Technologies PDI-200MD 3,4]system was used to acquire drop size andvelocity measurements. The solid state laser systems(green 532 nm and red 660 nm) used in the PDI-200MD are Class 3B las ers and provide 50-60mWattsof power per beam. The lasers were operated at an ade- quate power setting to overcome interference due tospray density. The transmitter and receiver were mounted on arail assembly with rotary plates; a 40°forward scattercollection angle was used. For this particular test, thechoice of lenses was 1000mm for the trans mitter and1000mm for the receiver unit. This resulted in an idealsize range of about 4.0um-1638um diameter drops.The optical setup was used to ensure acquisition of thefull range of drop sizes, while maintaining good meas-urement resolution. The paiticular range used for thesetests was determined by a preliminary test-run wherethe Dyo.5 and the overall droplet distribution were ex-amined. For each test point, a total of 10,000 sampleswere acquired. The experimental setup can be seen inFigures land 2. Figure1. Illustration ofPDI layout for drop size andvelocity data acquisition. Figure 2. Illustration of PDI during experiment. The Dvo.1, Dvo.5, D32, and Dvo. diameters wereused to evaluate the drop size data. This drop size ter-minology is as follows: Dvo.j: is a value where 10% ofthe total volume (ormass) of liquid sprayed is made up of drops with di-ameters smaller orequalto this value. D32: Sauter Mean Diameter (also known as SMD)is a means ofexpress ing the fineness of a spray in termsof the surface area produced by the spray. SMD is thediameter of a drop having the same volume to surfacearea ratio as the total volume ofall the drops to the totalsurface area ofall the drops. Dvo.s: Volume Median Diameter (also known asVMD or MVD). A means of expressing drop size interms of the volume of liquid sprayed. The VMD is avalue where 50% of the total volume (or mass) of liquidsprayed is made up of drops with diameters equal to orsmaller than the median value. This diameter is us ed tocompare the change in average drop size between testconditions. Dvo.9: is a value where 90% of the total volume (ormass) of liquid sprayed is made up of drops with di-ameters smaller orequalto this value. By analyzing drop size based on these standardizeddrop statistics it is possible to objectively characterizethe quality and effectiveness of this atomizing nozzlefor the prescribedapplication. Test Fluids and Monitoring Equipment All testing was conducted us ing water and solutionto simulate the fluid properties of limestone slurry.Flow to the system was supplied using a high volumepump. The liquid flow rate to the injector was moni-tored with a MicroMotion flow meter and controlledwith a bleed-off valve. The MicroMotion flow meter isa Coriolis Mass flow meter which measures the dens ityof the fluid to determine the volume flow. The meter isaccurate to 0.4% of reading. Liquid pressures weremonitored upstream of the injector with a 0-1.03MPa,class 3A pressure gauge. Injectors The nozzle options used in FGD are extensive andinclude precise performance, trouble-free operation andlong service. Considering the rheological properties ofthe slurry spray material, injectors were selected. TheSpraying Systems Co. WhirlJet style were particular-ly suitable for this application. Nozzles were picked bypattern, flow rate, quantity and spray angle with corre-sponding system designs. A total of four types ofinjec-tors were evaluated in nine configurations to determinethe effectiveness for the application. All injectors con-sidered provide hollow cone pattems. Target flow rateof feed slurry is 204,225lb/hr in the form of solid sus-pension. Multiple capacity sizes and configurationswere used to achieve this design requirement. Numerical Simulations CFD Background Computational Fluid Dynamics (CFD) is a numeri-cal method used to numerically solve fluid flow prob-lems. Today's CFD performs use extremely large num-ber of calculations to simulate the behavior of fluids incomplex environments and geometries.Within thecomputational region, CFD solves the Navier-Stokesequations to obtain velocity, pressure, temperature andnecessary chemical reactions for removal of SO2. Re-cently, CFD has become a popular design and optimiza-tion tool with the help of commercially available soft-ware and advancing computer technology. The com-mercially available CFD package ANSYS FLUENT(version 14.5) was used forthe simulation Simulation Description The geometry for CFD came from a standard in-dustrial size limestone spray scrubber, which was pub-lished by the B&W Company. State-of-the-art systemsrequired improved cleaning performance, therefore theidea ofsystem design, which would blow air into slurryto force oxidation, came out as a preference named theLimestone Forced Oxidation (LSFO) system . Theabsorber had a height of 32 meter with an inner diame-ter of 12.3 meter, as shown in Figure 3. The gas flowcomes through the inlet was 5,521,000 lb/hr, including240,000 lb/hr water vapor and 34,900 lb/hr sulfur diox-ide with 5% forced oxygen 16. Gas passed through theopen area in the scrubber and came out through thenarrow tuming area toward the outlet. Feed slurry en-ters from the injectors and moves out of the systemeither by release from the bottom of the absorber orcollection at the top portion before flowing out the nar-row region with gas. The impoitance of the pollutantremoval process is determined through the observationof the gas liquid interactions at the tray, which can beimproved by optimization of the spray system. In this(mist eliminpaper, some additional parts (mist elator, flowstraightener right below spray level, etc.) on the pur-pose ofsystem performance improvement were ignoredfor simplification as to reduce the mesh size and alsothe simulation time. All the gaseous species entering the scrubber wereset as primary phase flow (Eulerian approach). Theprimary phase used coupled models (momentum, turbu-lence, energy, species mixing and reaction) which re-quired boundary conditions (BC's).This simulationcons isted of inlet BC and outlet BC, set as "mass flowrate inlet" and "constant pressure outlet" respectively.The limestone slurry, also known as calcium carbonate(major component), injection was set as secondaryphase (Lagrang ian approach) where its inlet BC’s arebased on nozzle features and parameters as determined empirically. The Lagrangian paiticles were set under“wet combustion" model when reacted with fuel gascontrolled by surface reaction chemical model. Theseparticles were tracked using IDiscrete Phase Model(DPM). During computation, heat and mass trans ferwas coupled between primary and secondary phases.CFD Multiple Surface Reaction Model set-up reactionkinetic parameters and factors were extracted throughexperimental results and methodology from Qiu andZevenhoven[8] To generate the computation domain (mesh) for thescrubber shown1 in Figure3, ANSYS workbenchmesher (version 14.5) was utilized. The mesh cons istedof 2.5 million polyhedral cells and 13 million faces;minimum cell size is le-3m. Due to its size and model-ing complexity, the simulation required significantcomputational power and process ing time. The wallshad a common (standard) setup, with no slip, adiabatic(insulated) and wall-jet BC for the particles. Based ondifferent spray configuration, injectors in this meshwere set as “on/off’status. Figure 3. Scrubber Geometry for CFD Wet Combustion Particle Surface Reaction In this work, the main mechanism of CFD simula-tion is using ANSYS Fluent wet combustion paiticlesurface reaction models, which involved those modelsdescribed above. The alkaline soibent material and SO,reaction was simulated to determine uniformity andefficacy of the tested system, in which this surfacechemical mechanism were used to simulate the reactionto first prove match ofexisting data and CFD and sec- ond parametric test the system with various spray con-figurations. ANSYS Fluent models the mixing and transport ofchemical species by solving conservation equation de-scribing convection, diffusion, and reaction sources byits multiple surface reaction models19. Reaction oc-curred in the bulk phase is dealt with volumetric reac-tion, and paiticle surface reaction. For gas-phase reac-tions, the reaction rate is defined on a volumetric bas isand the rate of creation and destruction of chemicalspecies. Particle surface reaction is used to model sur-face combustion on a discrete-phase paiticle. In thediscrete phase model, modeling multiple paiticle sur-face reactions makes the surface species as a “particlesurface species”. A particle undergoing an exothermic reaction in thegas phase is shown schematically in Figure 4. Based onthe analysis above, ANSYS FLUENT uses the follow-ing equation to describe the rate of reaction of a paiticlesurface species with the gas phase species. Figure 4. A Reacting Particle in the Multiple Sur-face Reactions Model The initial relationship for calculating particlebuming rates were presented and discussed by Smith1101. The paiticle reaction rate, R (kg/m2.s), can be ex-pressed as In above equation, theconcentrationat the particlesurface, Cs, is unknown andeliminated as follows: This equation has to be solved byan iterativepro-cedure in Fluent, with the exception ofthe cases whenN=1 or N=0, which can be written as In the case ofN=0, if there is a finite concentrationof reactant at the particle surface, the solid depletionrate is equal to the chemical reaction rate. If there is noreactant at the surface, the solid depletion rate changesabruptly to the diffusion-controlled rate.ANSYS Fluentwill always use the chemical reaction rate for stabilityreasons. Based on the above explanation,ANSYS Fluentuses the following equation to describe the rate of reac-tion r of a particle surface species j with the gas phasespecies n.The rate is givenas The effectiveness factor is related to the surface ar-ea, which can be used in each reaction in the case ofmultiple reactions. Do, is given as The kinetic rate ofreaction r is defined as The rate ofthe particle surface species depletionfor reaction order N,=1 is given by Forreaction orderN,=0, The surface reaction consumes the oxidant speciesin the gas phase, also consumes or produces energy, inan amount determined by the heat of reaction. The par-ticle heat balance during surface reaction is It includes the diffusionandconvection control ofthe vaporization model. An investigation ofreacting limestone particle attrition rate was found similar to thismechanismn Results (Experimental and Numerical) ExperimentalResults The results of the PDI measurements provide a rep-resentative characterization of the atomizer effective-ness at 600mm downstream. As outlined and describedin the above sections, the results from testing are pro-vided in Table 1. The Volumetric Mean Diameter (Dvo.5)as well as other representative diameter statistics basedon the volume flow is presented. These results allowtheevaluation, qualitatively, of the dependence of drop sizeon the liquid flowrate andpressure. There are notable trends that pers ist throughout thedata. With an increase in liquid feed pressure,there is adecrease in median drop size and an increase in meandrop velocity. CFDResults Referred to in the previous work 12] of sulfur diox-ide spray sciubber in pilot scale, the industrial sizescrubber was investigated to demonstrate the capabilityof CFD simulations of various spray applications incomplex environments, like spray towers. In the previ-ous discussion, water evaporation and diffusion had anon-negligible effect on fluidization, reaction and re-moval capability. One of the reasons was that the sys-tem temperature of pilot scale operated just above boil-ing temperature of water to increase reaction rate in thetests. However, this was outs ide of operation parame-ters in industry ,due to the energy effort required to heatand consequently reduce humidity in the large scalesystem. Therefore, the operating temperature in stand-ard industrial size spray scrubbers wasfairly low to avoid limestone build-up on the wall and make wholetower passage open by keeping slurry always in a liquidform. Hence, the importance of spray system behaviorand its removal capability is very obvious for optimiza-tion. Considering the volume flow rate of the fuel gasand the size of absorber, a total quantity from ten totwenty nozzles was designed for this system optimiza-tion. Six rows at two spray levels, for the purpose ofeven distribution into absorber, were utilized to deter-mine optimal operation and spray parameters. All simu-lations were performed with a cons is tent total feed vol-ume flow rate of 330 gpm. The applicability ofthe in-jector is evaluated based on accordance with the targetremoval requirement, minimal waste and wall contact,and reasonable maintenance of the system. The resultswere indicated by the SOz mass fraction in each caseand sulfur dioxide final removal detection coordinatedwith limestone usage for each case. Other determiningfactors were velocity magnitude and veitical velocityprofile, slurry droplet concentration and particle track-ingTh.ese parameters are commonly used to.f betterunderstand the flow behavior for the baseline and gasphase situation following injections. Case comparisonis shown in Table 2. In the comparis on of the number of injectors used,the injections were adjusted to not reach the maximumpollutant removal. This allows for better contrast ofsulfur dioxide reacting capability and wall wetting de-gree, making the optimal design configuration easilyevident. Most cases achieved good SOz reduction (85%is desired in this condition) as designed. CRC series atlocation 2 in ten-nozzle scrubber had the best SOz re-moval capability (Figure5 and 6), location 3 and loca-tion 5 was best in twelve-nozzle(Figure 7) and sixteen-nozzle (Figure 8) configuration, respectively, based on Nozzle ID Units 1-1/4CRC-2045 1-1/4CRC-2045 1-1/4CX-12 1-1/2CX-16 1-1/2CX-25 Quantity / 12 10 20 16 10 Pressure (dP) psi 13.24 19.06 13.24 11.63 12.2 Dvo.5 micron 1218 1155 1122 1150 1188 Spray Angle / 47° 47° 70° 75° 74 Injected Flow gpm 27.5 33 16.5 20.625 33 No. of Spray Levels / 2 2 2 2 2 Table 1. Drop Size and Velocity Results of Empirical Investigation Nozzle ID Quantity Location 1 Location 2 Location 3 Location 4 Location 5 Location 6 Location 7 CRC45 10 X X CX25 10 X X CRC45 12 X X CX16 16 X X CX12 20 X slurry consumptionand wall wetting amount. With respect to nozzle maintanence, CRC serieshad btigger passages and exits with relative narrowspray angle and higher supply pressure than CX serieswhich could provide better spray distribution consider-ing the liquid and gas contact area and droplet charac-teristics. However, the limitation was CRC series de-signed to be suitable for enormous flow rate and fewernozzles operated, which results in reduced tumdownratio. Initial determination of injection locations wasdone based on attaining distribution uniformity of thespray system. Preliminary settings for each nozzle wasselected for nearly equal diameter coverage, withoutoverlapping. With fewer nozzles adopted in the system,better SOz absorption capability and less wall contactwas discovered closer to the center. In the contrast,more nozzles introduced1 resulted better absorptioncloserto the edge. 0.0070 Figure 5.Mass Fraction of SO, for 10-Nozzle Case Figure 6. Particle Tracking for 10-Nozzle Case Figure 7.Mass Fraction of SOz and Wall Wetting for12-Nozzle Case Figure 8. Mass Fraction of SOz and Wall Wetting for16-Nozzle Case Figures 9-11 represent 16-nozzle and 20-nozzlecombination designs. These demonstrated superior wetscrubber performance, which was quite obvious in Fig-ure 11. This trend can also be observed in the distribu-tion layout of slurry injection from Figure 9. Quantita-tively, the ten-nozzle case attained 90% SOz removalwith 6.55 kg/s limestone usage in the slurry, twelve-nozzle case attained 89% removal and 6.58kg/s used.The sixteen- and twenty-nozzle applications achieved94.5% and 95% objective removal, 6.86 kg/s and 6.89kg/s materialconsumption, respectively. The results indicated a similar trend as previouswork, that greater efficacy of SO2 removal can beachieved through relatively small droplet sizes. Due tothe relationship of drop size volume to surface area,with equivalent volume introduced into the sys tem, it ispossible to significantly increase surface area and asso-ciated surface reaction rate in the tower. Moreover.increas ing spray zone flow distribution will lead tohigher efficiency. Due to the increased scale, the veloci-ty behavior exhibits less oscillation and recirculationthan the pilot scale study. Reduced wall wetting can beachieved with proper balance of spray angle combinedwith nozzle selection and location design. Results also proved the overall absorberstructure was critical for theefficiency improvement and optimization, since the L/Dissue was clearly addressed in this industrial size ab-sorber. Wall impingement may cause equipment ero-sion when injection fluid has corrosive property. Figure10 illustrates an especially high concentration area ofwall impingement on the opposite wall of inlet. Theratio of wall contact mass compared to the whole injec-tion could be evaluated at regular time intervals tomake further modifications to thesystem. Figure 9. Slurry Injection Concentration in the Scrub-ber for Final Comparison Figure 10. Wall Impingement in the Scrubber for FinalComparison 0.0070 Figure 11. Mass Fraction of SOz in the Scrubber forFinal Comparison In addition, the limestone/slurry usage was con-firmed effective in the system, which matched withindustrial mark. As the temperature in the absoiber wasquite low, CFD results verified there was merely evapo-ration occurring and limestone consumption was about80-85% to complete predominant SOz removal in theabsorber. Efficient use of materials was always a con-sideration in optimization process. Furthermore, from comparison of all 10-, 12-, 16-and 20-nozzle location configurations in the final itera-tions, results showed the 16-nozzle case was the opti-mal setup. Although this case had wide injection loca-tion close to absorber edge,it had the least wall wettingcompared to other three cases. It is noteworthy that inboth the previous study and this work, the addition ofnozzle locations always had some advantageous remov-al performance compared to fewer nozzles. The key tooptimization is the balance of effective pollutant re-moval and minimal slurry deposition (wall impinge-ment). This is achieved through control and reductionof droplet size distribution, as well as spray coverageuniformity. Spray coverage is a significant factor forprocess optimization, since overlapping will cause lesscontact between pollutant gas and absorbent and alsoheavier wall wetting near the vessel wall. Although the20-nozzle application had better pollutant removal, italso exhibited heavier wall impingement. This couldresult in more frequent maintenance issues, resulting inincreased cost for this type oflarge absorber. Considering the 16-nozzle application satis fied thepollutant removal range with less wall sludge building,this could be adopted for optimization to this particularsystem. This specific result is distinct to the absorbergeometry (tower/chamber) should be adapted and care-fully examined based on its own setting. This work wasspecifically tested for the geometry layout attached.Nevertheless, CFD and expert spray characteristic tech-nology will be helpful in solving same type or similarvalidations. Conclusion In a successful spray sciubbing system, nozzle se-lections and their spray characteristics are the determin-ing factors. Unders tanding the spray behavior, especial-ly the interaction with gas and sur.rounding environ-.......ment, is extremely important in scrubbing tower systemdesign. This design influences not only the efficacy ofthe scrubbing process in the system, but also the lengthof the absorber’s life time. Hence optimization is get-ting increased attention. The optimization process re-quires a balance of mitigating the wall impingementwhile achieving outstanding pollutant removal. Noz-zles play an important role in achieving this goal. Fromdecision of the quantity of nozzles in the system, tolocation / or layout selection; each step could lead tocostly system failure with carelessness, imprecise cal- culation or misunderstanding ofthe complex interactionof system parameters. Therefore, full knowledge ofnozzles combined with CFD in untestable situation isvaluable in the prediction of such pollutant cleaningsystems like spray tower or spray chamber. It is neces-sary to take into consideration the evaluated factors ofspray coverage, droplet control, flow profile, gas-liquid-wall interaction to achieve a success ful, repeata-ble wet FGD design. In the actual system install, flow straightener andmist eliminator may be employed to better control thespray carry over and gas distribution in the absorber.However with additional complexity, there is also po-tential for increased maintenance issues and additionalanalys is required for proper inclusion into the system. Nomenclature velocity in the directionof(m/s)AB radius of(m) positionof further nomenclature continues down thepage inside the text box bulk diffusion coefficient(m/s) mean reacting gas species concentration inthe bulk (kg/m’) C, mean reacting gas species concentration atthe particle surface(kg/m') R. chemical reaction rate ccoefficient i(unitsVary) particle surface area (m) mass fraction of surface species j in the par-ticle nr effectiveness factor(dimensionless) rate of particle surface species reaction perunit area (kg/m2s) R rate of particle surface species depletion(kg/s) Pn bulk paitial pressure ofthe gas phase species(Pa) Dor diffusion rate coefficient for reaction r Rkin,r kinetic rate ofreaction r (units vary) N. apparentorderofreactionr Greek symbols stoichiometric coefficient boundary layerthicknesses(m) Subscripts 7 radial coordinate References 1. Rubin,E.S., Yeh,S., and Hounsell,D.A.,etc.,“Experience curves for power plant emis sioncontroltechnologies”,Int.J. Energy Technologyand Policy, Vol. 2, Nos. 1/2,2004 2. Beychok,M.R.,“Comparative economics ofad-vanced regenerable flue gas desulfurization process-es",Electric Power Research Institute,EPRI CS-1381, 1980 3. Bachalo, W.D.,"ExperimentalMethods in Multi-phase Flows", InternationalJournal on MultiphaseFlow, Vol.20, Suppl.pp.261-295,1994 4.1Bachalo,W.D.,"AMethod for Measuring theSizeand Velocity ofSpheres",by Dual BeamLight Scat-ter Interferometry,Applied Optics, Vol. 19, No.3,February 1,1980. 25.N1olan,P.S.,“Flue Gas Desulfurization Technolo-gies for Coal-Fired Power Plants". The Babcock &Wilcox Company,2000. 6.]Kitto,J.B., Stultz, S.C.,“Steam/its generationanduse”,41st Edition. The Babcock & Wilcoxcompa-ny,2005. 7. Qiu, K., Lindqvist, O.,“Direct Sulfation ofLime-stone at Elevated Pressure”,ChemicalEngineeringScience, Vol 55, pp 3091-3100, 2000. 8.Zevenhoven,R., Yrjas, P., and Hupa,M.,“SulfurDioxide Capture under PFBC Conditions: the Influ-ence ofSorbent Particle Structure”,Elsevier,PII:S0016-2361,1997. 9.T.he Multiple Surface Reactions Model in DiscretePhase.ANSYS FLUENT Theory Guide for Vers ion14.0, 427-428,2011. 10. Smith,I.W.,"The CombustionRates ofCoal Chars:A Review". In 19th Symp.(Int’l.) on Combustion.The Combustion Institute, 1045-1065,1982. 11. Shimizu, T., Peglow,and M.,Sakuno,S., etc.,“Ef-fect ofAttrition on SOz Capture by Limestone underPressured Fluidized Bed Combustion Conditions-Comparison between a MathematicalmodelofSOzCapture by Single LimestoneParticle under Attri-tion Condition and SOz Capture in a Large-ScalePFBC”, Chemical Engineering Science, Vol. 56, pp.6719-6728, 2001. 12. Brown,K., Kalata, W.,Schick,R.I.,“Optimizationof SOz Scrubberusing CFDModeling”.Atomiza-tion and Sprays-Int’lJ.of the Institute ofLiquidAtomization and Spray Systems.2013
确定

还剩8页未读,是否继续阅读?

产品配置单

北京欧兰科技发展有限公司为您提供《烟气,soot,碳烟,硫化物中喷雾粒径,液滴粒径,液滴速度检测方案(气溶胶)》,该方案主要用于废气中喷雾粒径,液滴粒径,液滴速度检测,参考标准--,《烟气,soot,碳烟,硫化物中喷雾粒径,液滴粒径,液滴速度检测方案(气溶胶)》用到的仪器有Artium PDI-FP 双量程可机载飞行探头、激光相位多普勒干涉仪LDV,PDI,PDPA,PDA、激光诱导白炽光(LII)烟气分析仪
推荐专场


相关方案
更多
该厂商其他方案
更多