


尽管LA-ICP-MS有大量的成功应用,但是元素分离仍然是地球科学应用中的主要局限,这种局限在高空间分辨率分析中尤其突出。本研究采用193nm ArF准分子纳秒(ns)激光器和257nm飞秒(fs)激光剥蚀电感耦合等离子体质谱法,研究了硅酸盐玻璃NIST SRM 610和GSE-1G的元素分离和质量载荷效应。与在ns-LA-ICP-MS中观测到的相反,在fs-LA-ICP-MS中,16-24μm的小粒子的分离效率低于40-60μm的大粒子分离效率。在193nm准分子激光LA-ICP-MS中观察,硅酸盐玻璃材料NIST SRM 610和GSE-1G中的Li、Na、Si、K、V、Cr、Mn、Fe、Co、Ni、Cu、Rb、Cs和U的分离行为存在显著差异,利用257nm fs-LA-ICP-MS在高空间分辨率下消除了这些差异。此外,与ns-LA-ICP-MS相比,fs-LA-ICP-MS的质量负载效应和与基体相关的质量负载效应也有所降低。除Sb、Pb、Bi外,元素分离与所选的激光通量无关,与ns-或fs-LA-ICP-MS无关。在本研究中,选择24μm光斑来测试LA-ICP-MS在高空间分辨率下的分析能力。我们使用fs-LA-ICP-MS对MPI-DING、USGS、NIST玻璃样片中的大部分元素的测试数据与参考值具有一致性,误差小于10%。对于ns激光剥蚀分析,其准确性高度依赖于使用的校准策略(传统的外部校准方法或100%氧化物归一化方法)和选择的外部参考物质(NIST SRM 610或GSE-1G)。与193nm准分子LA-ICP-MS相比,fs-LA-ICP-MS中较少的激光诱导元素分离和基体效应使其更适合于高空间分辨率硅酸盐材料的分析。
方案详情

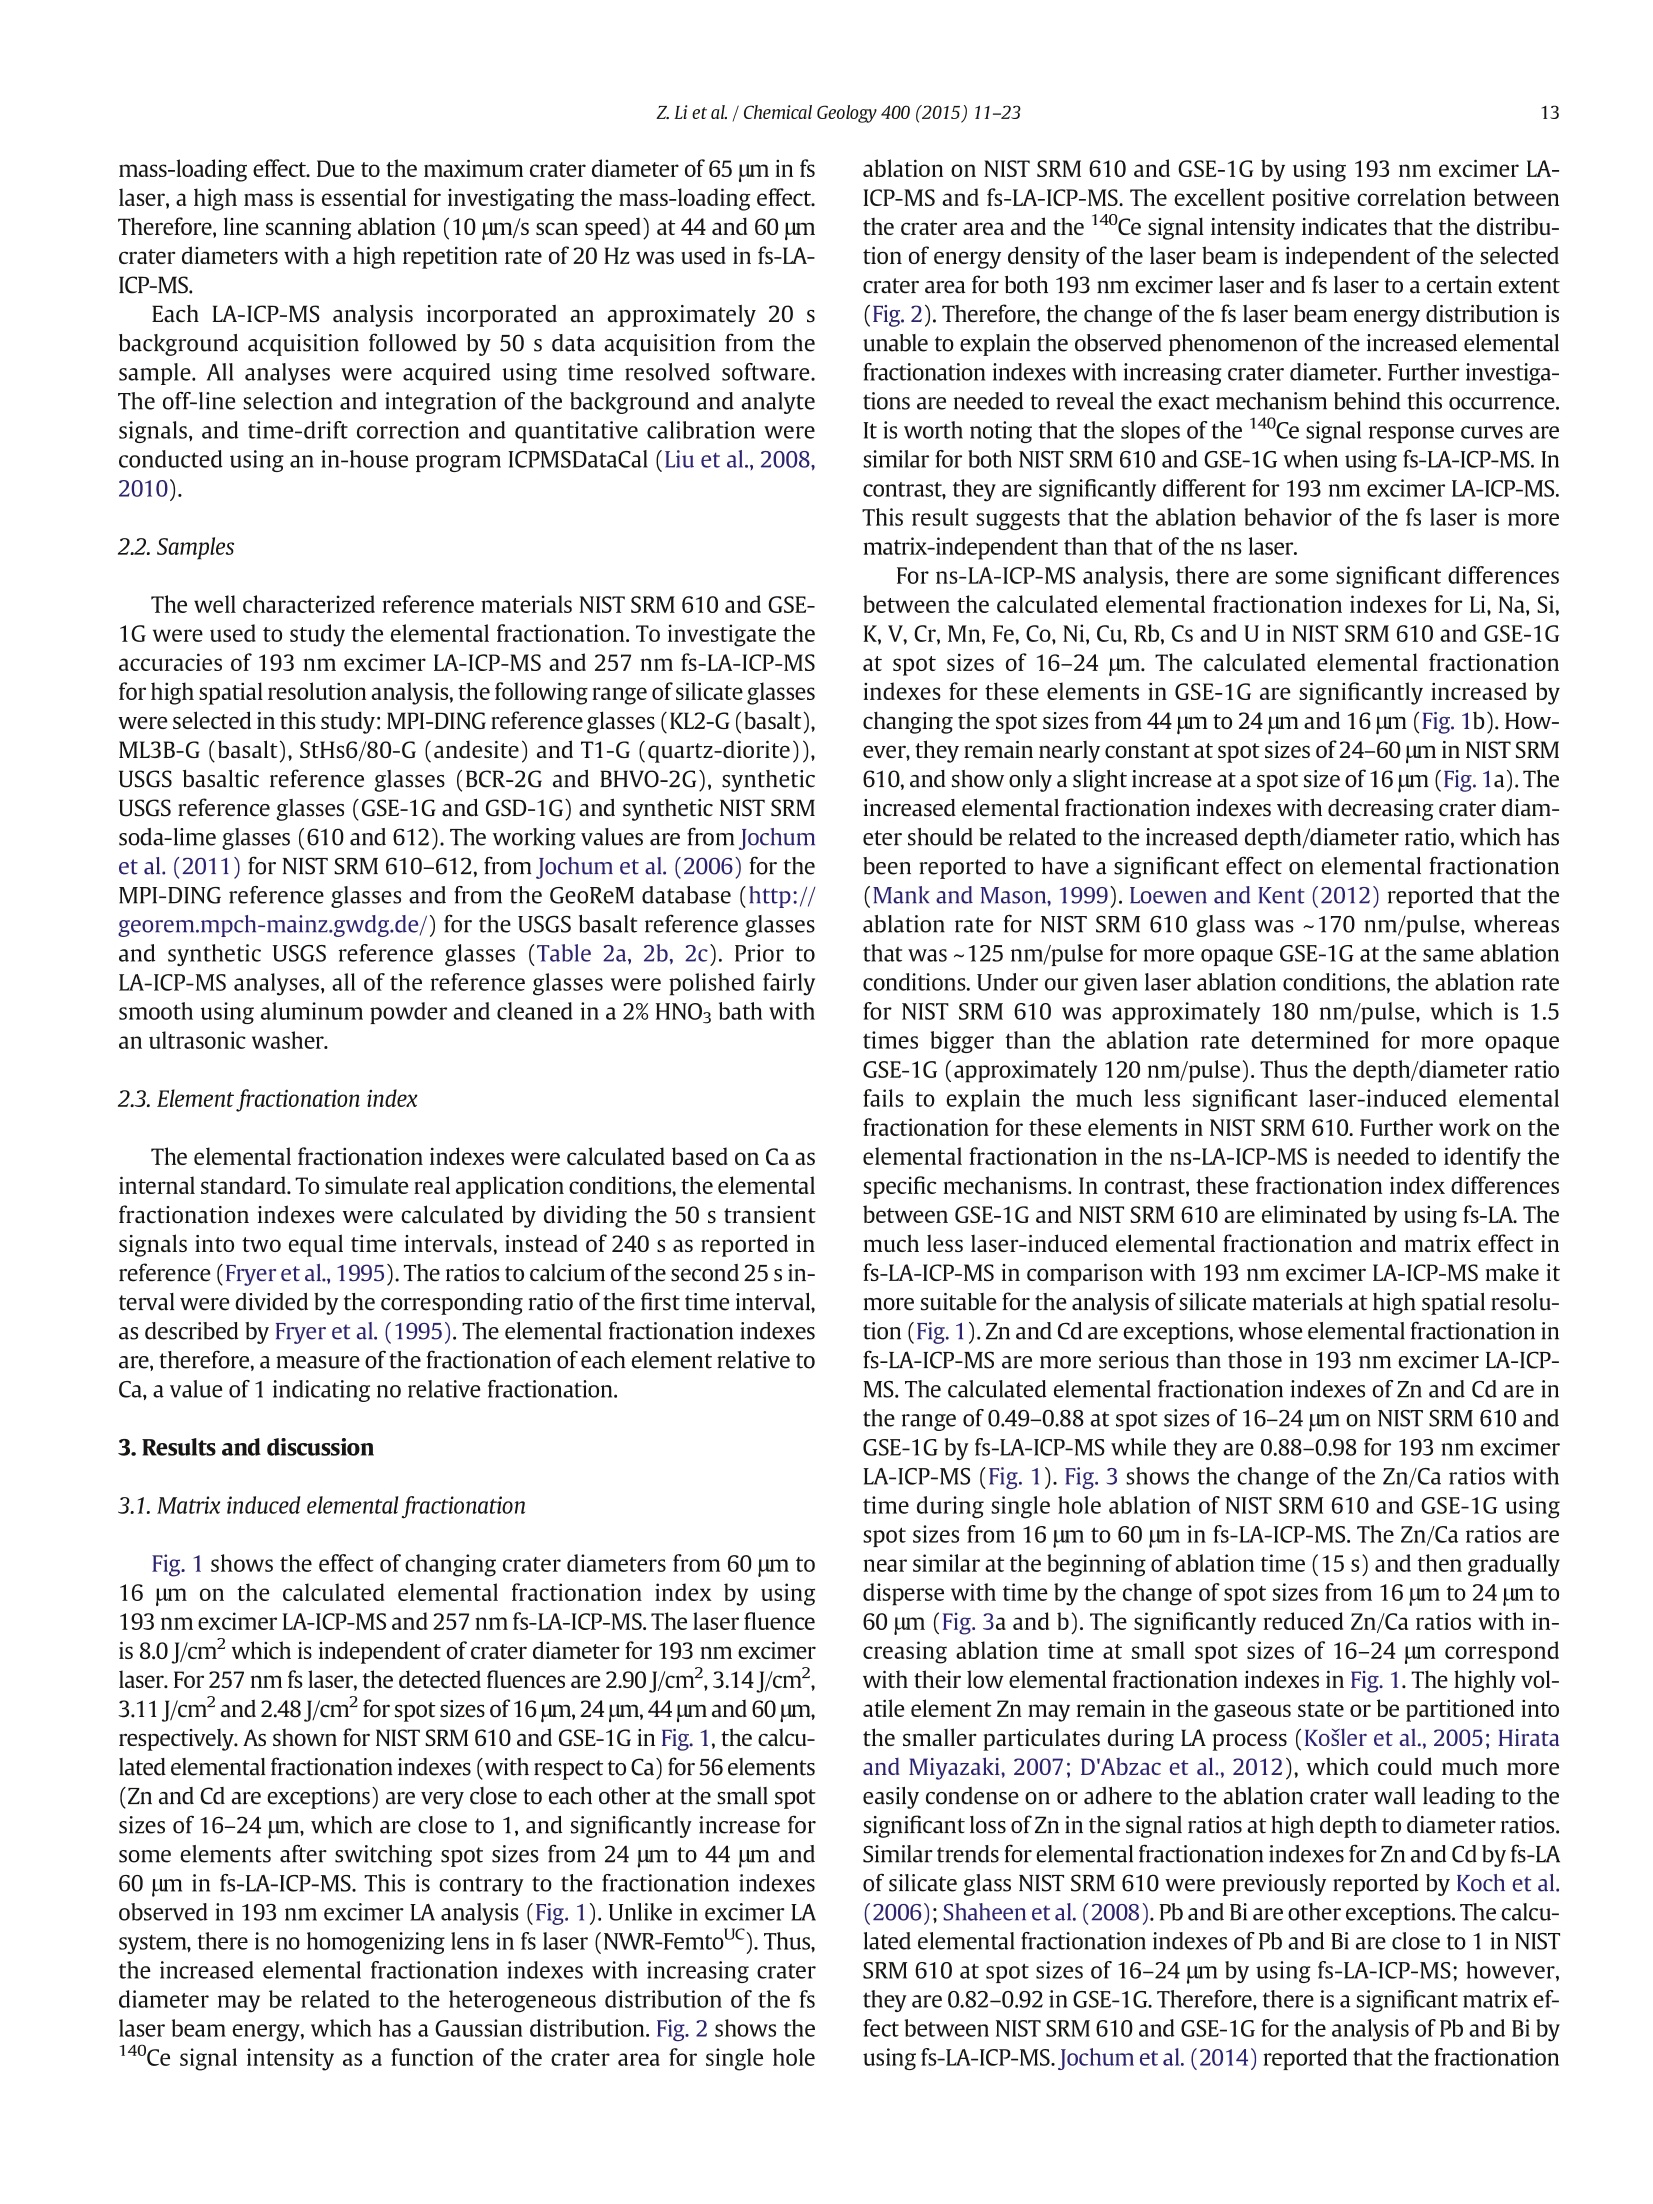
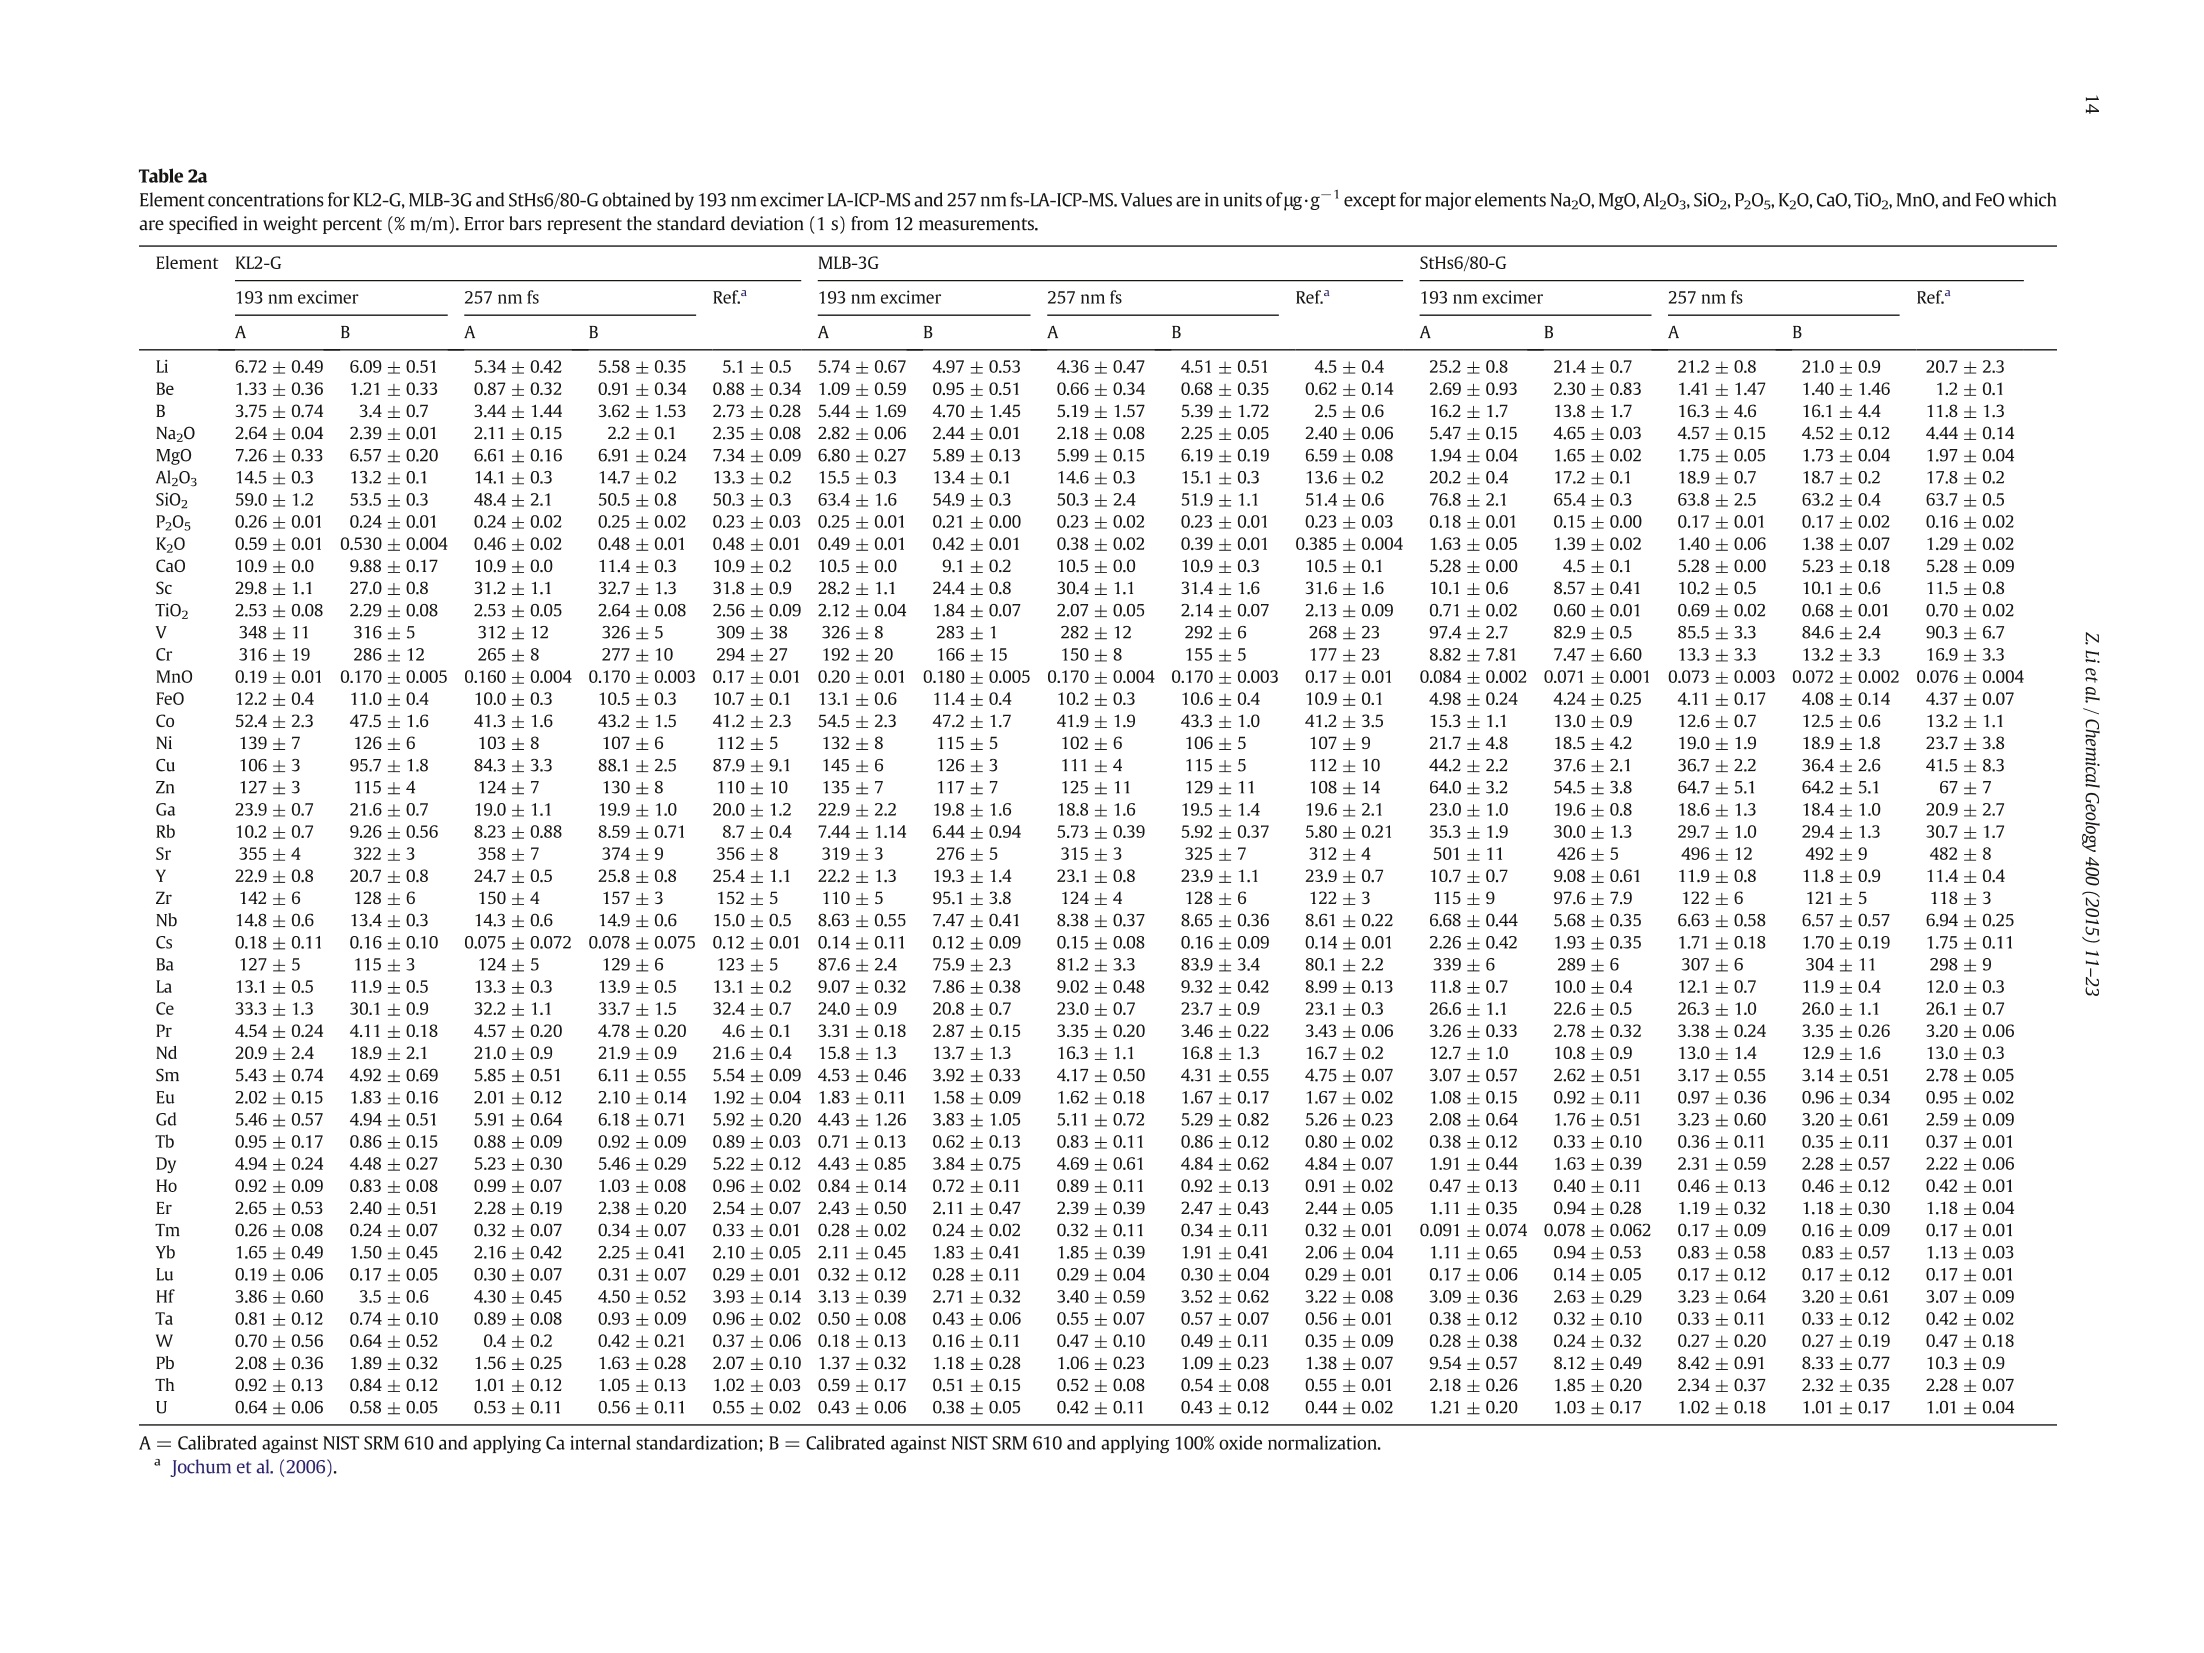
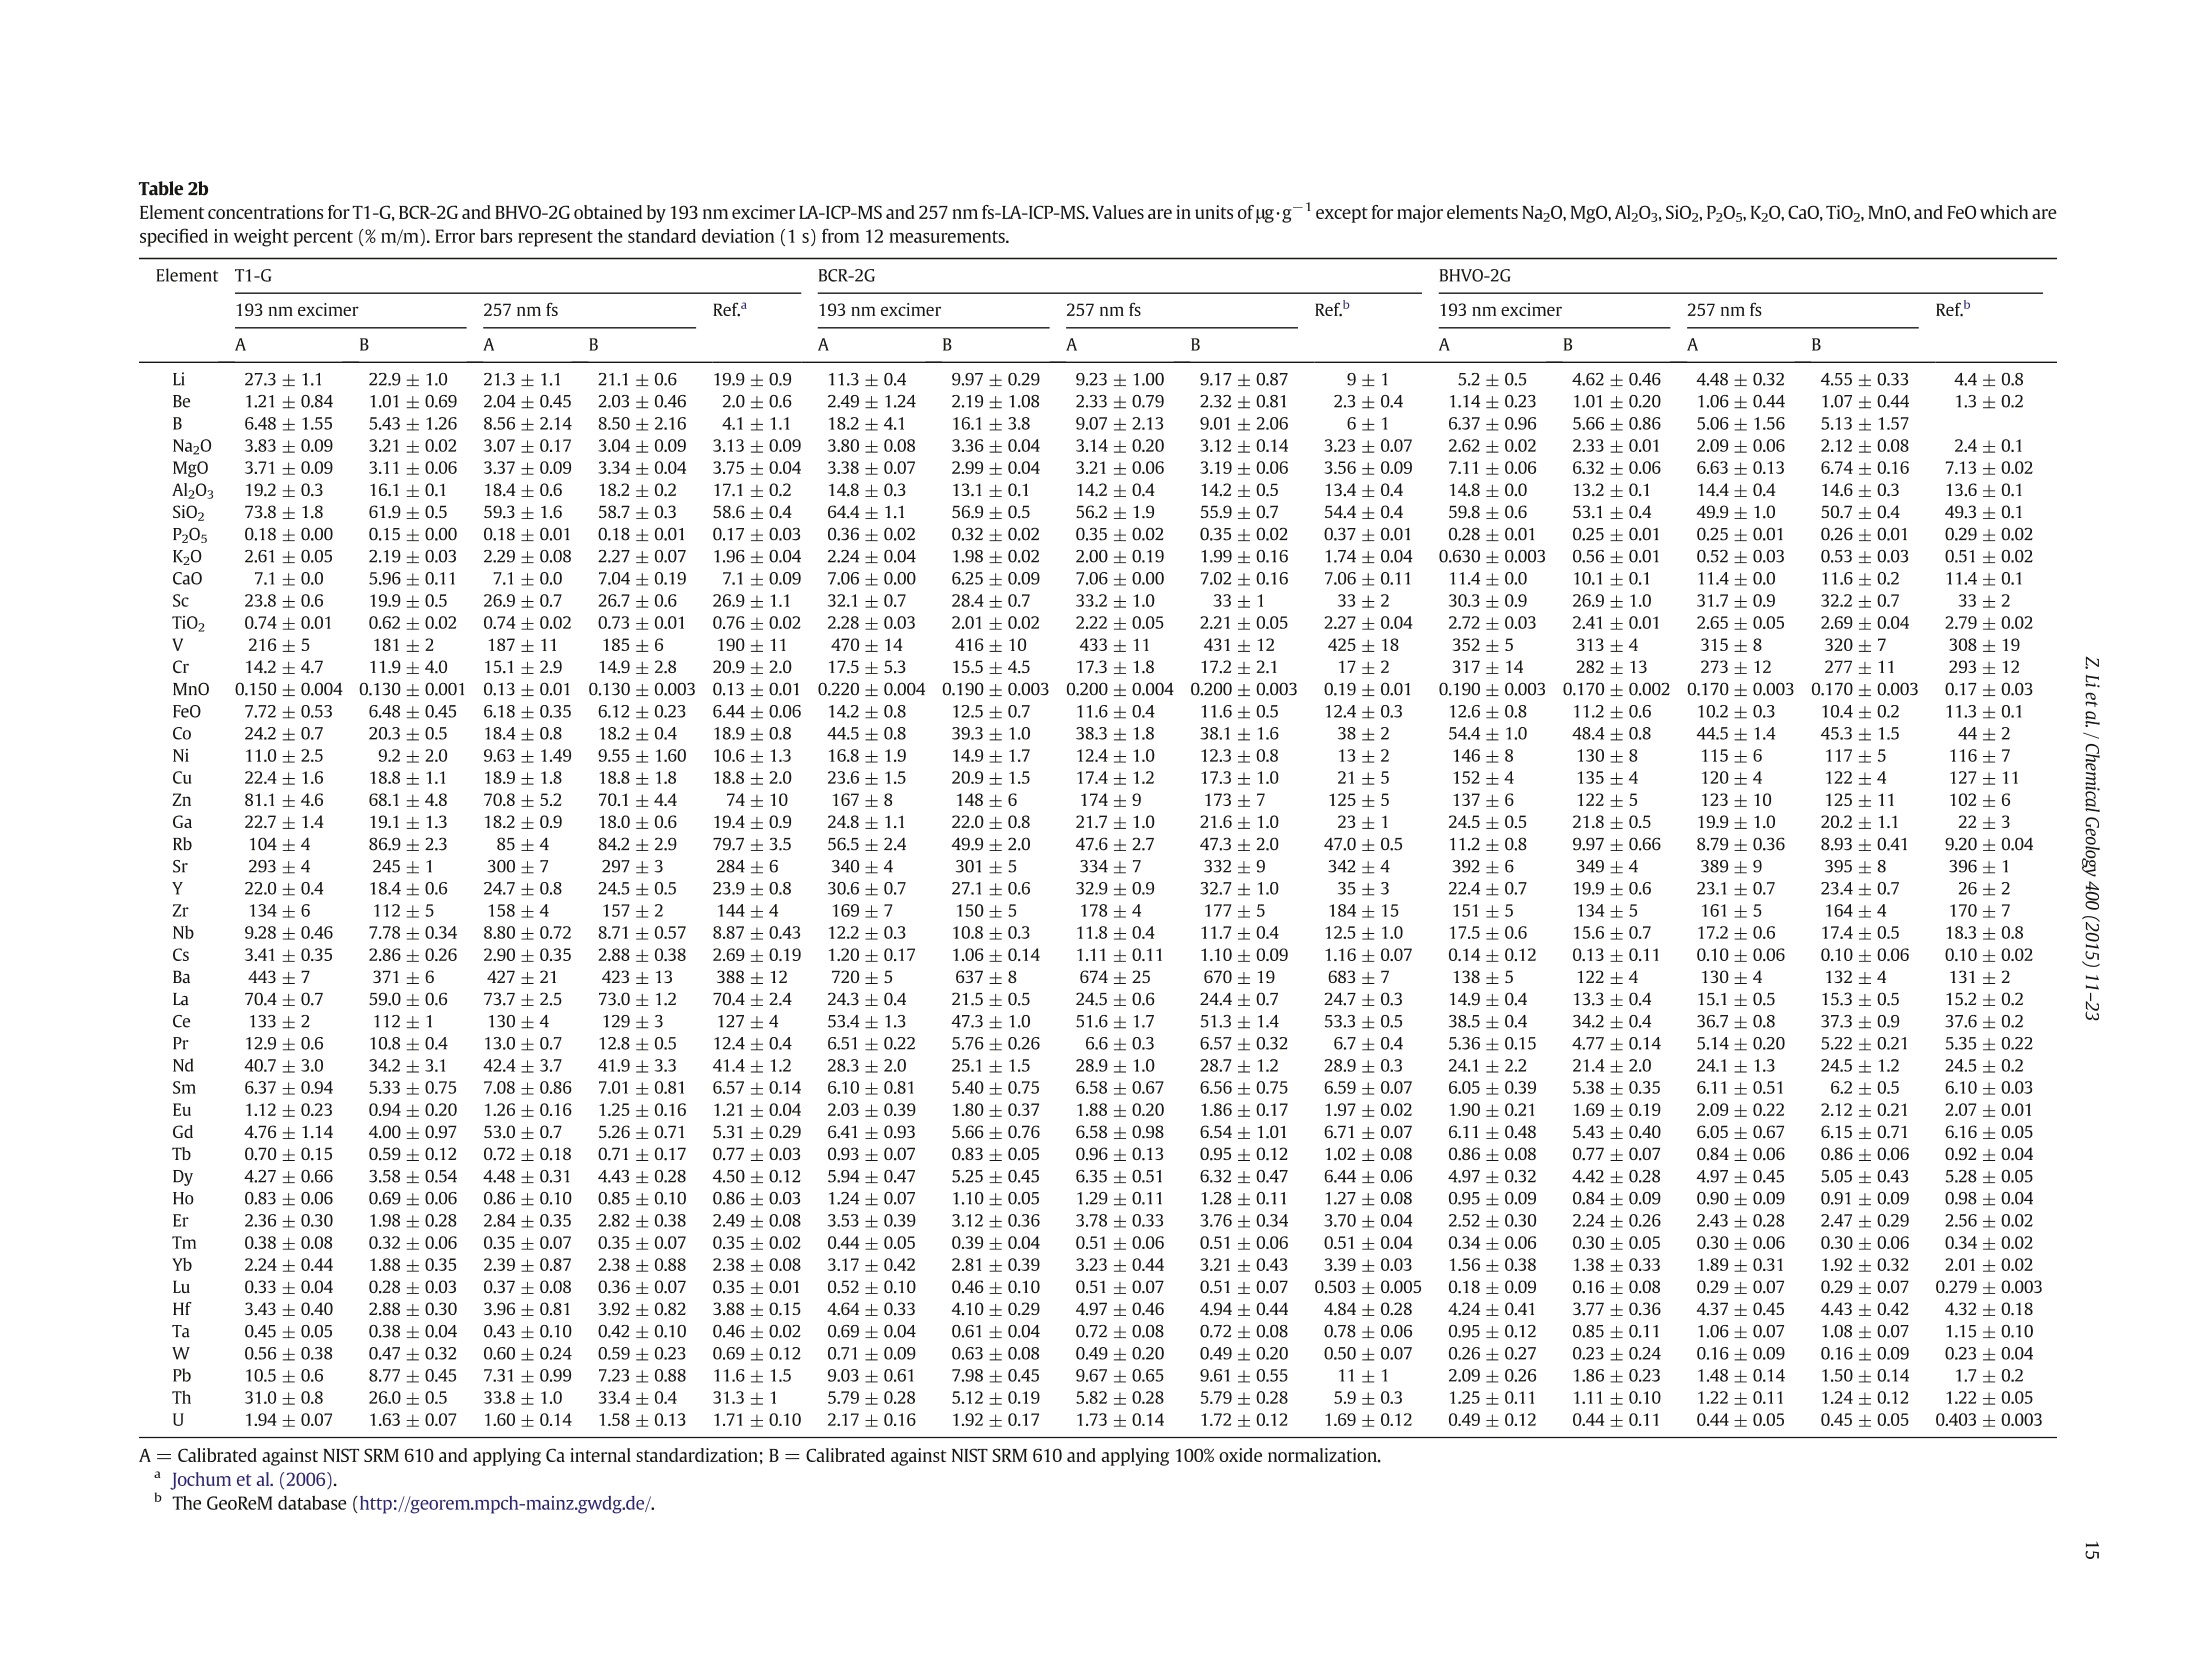
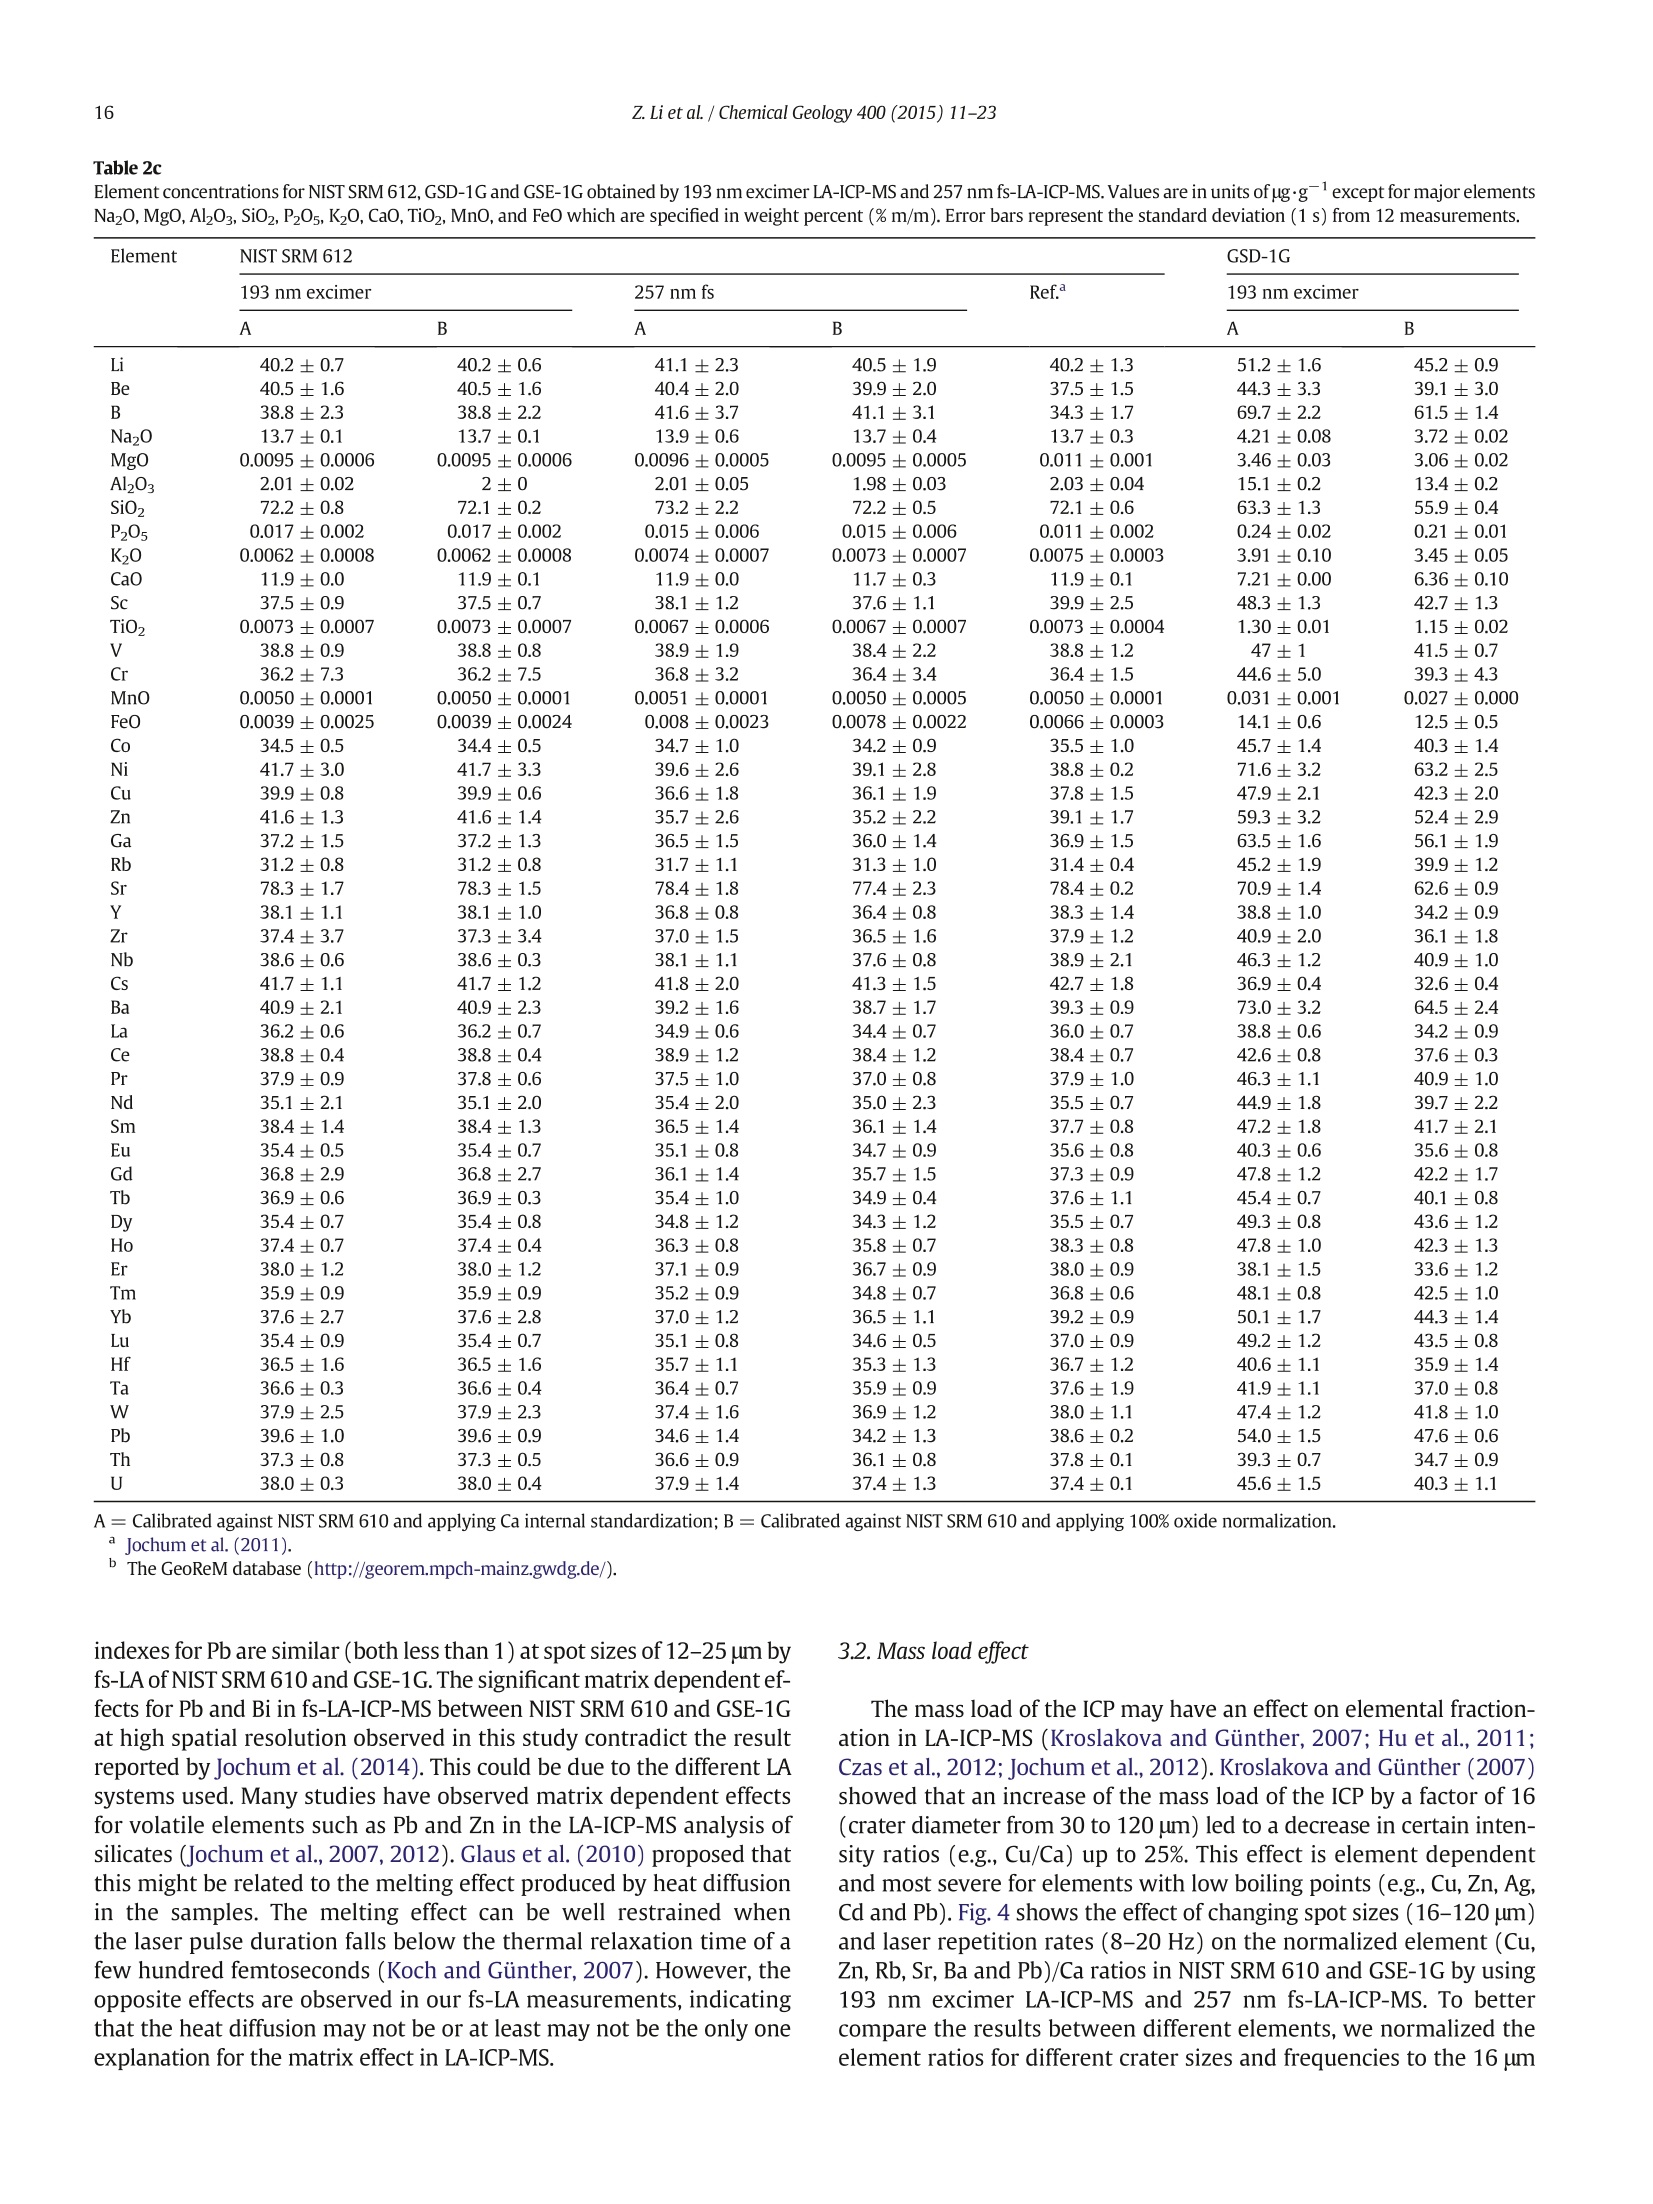
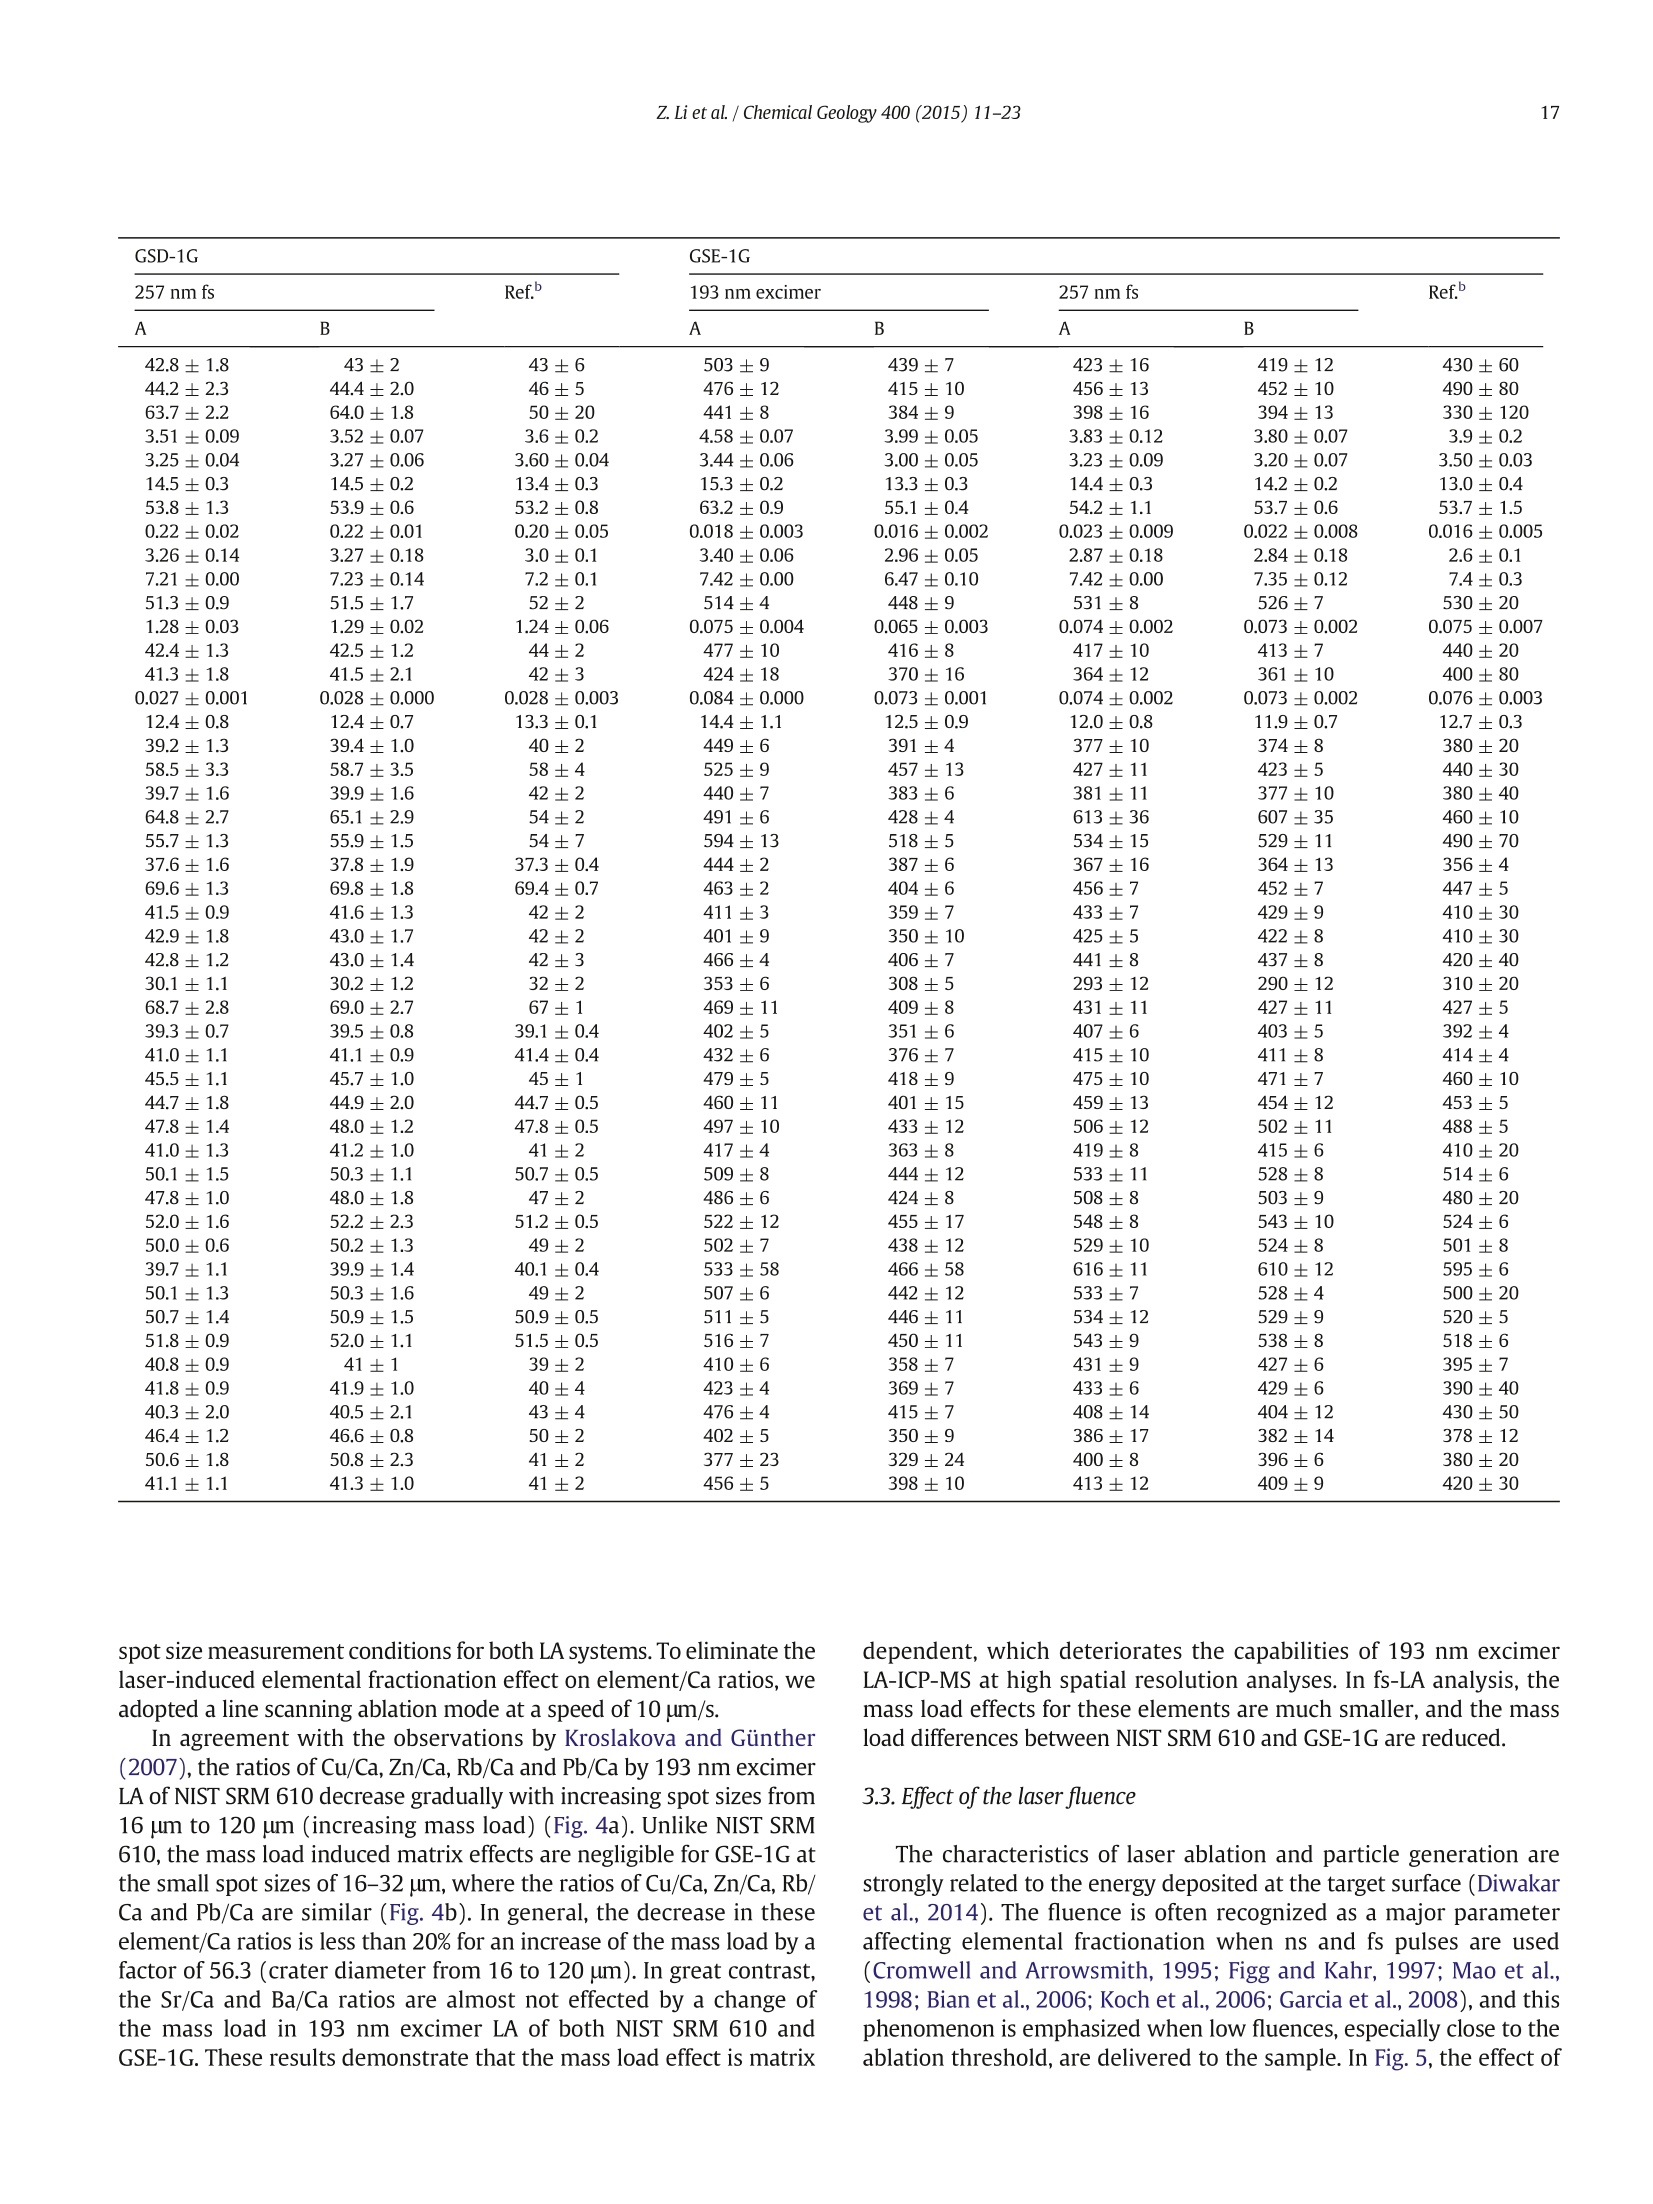
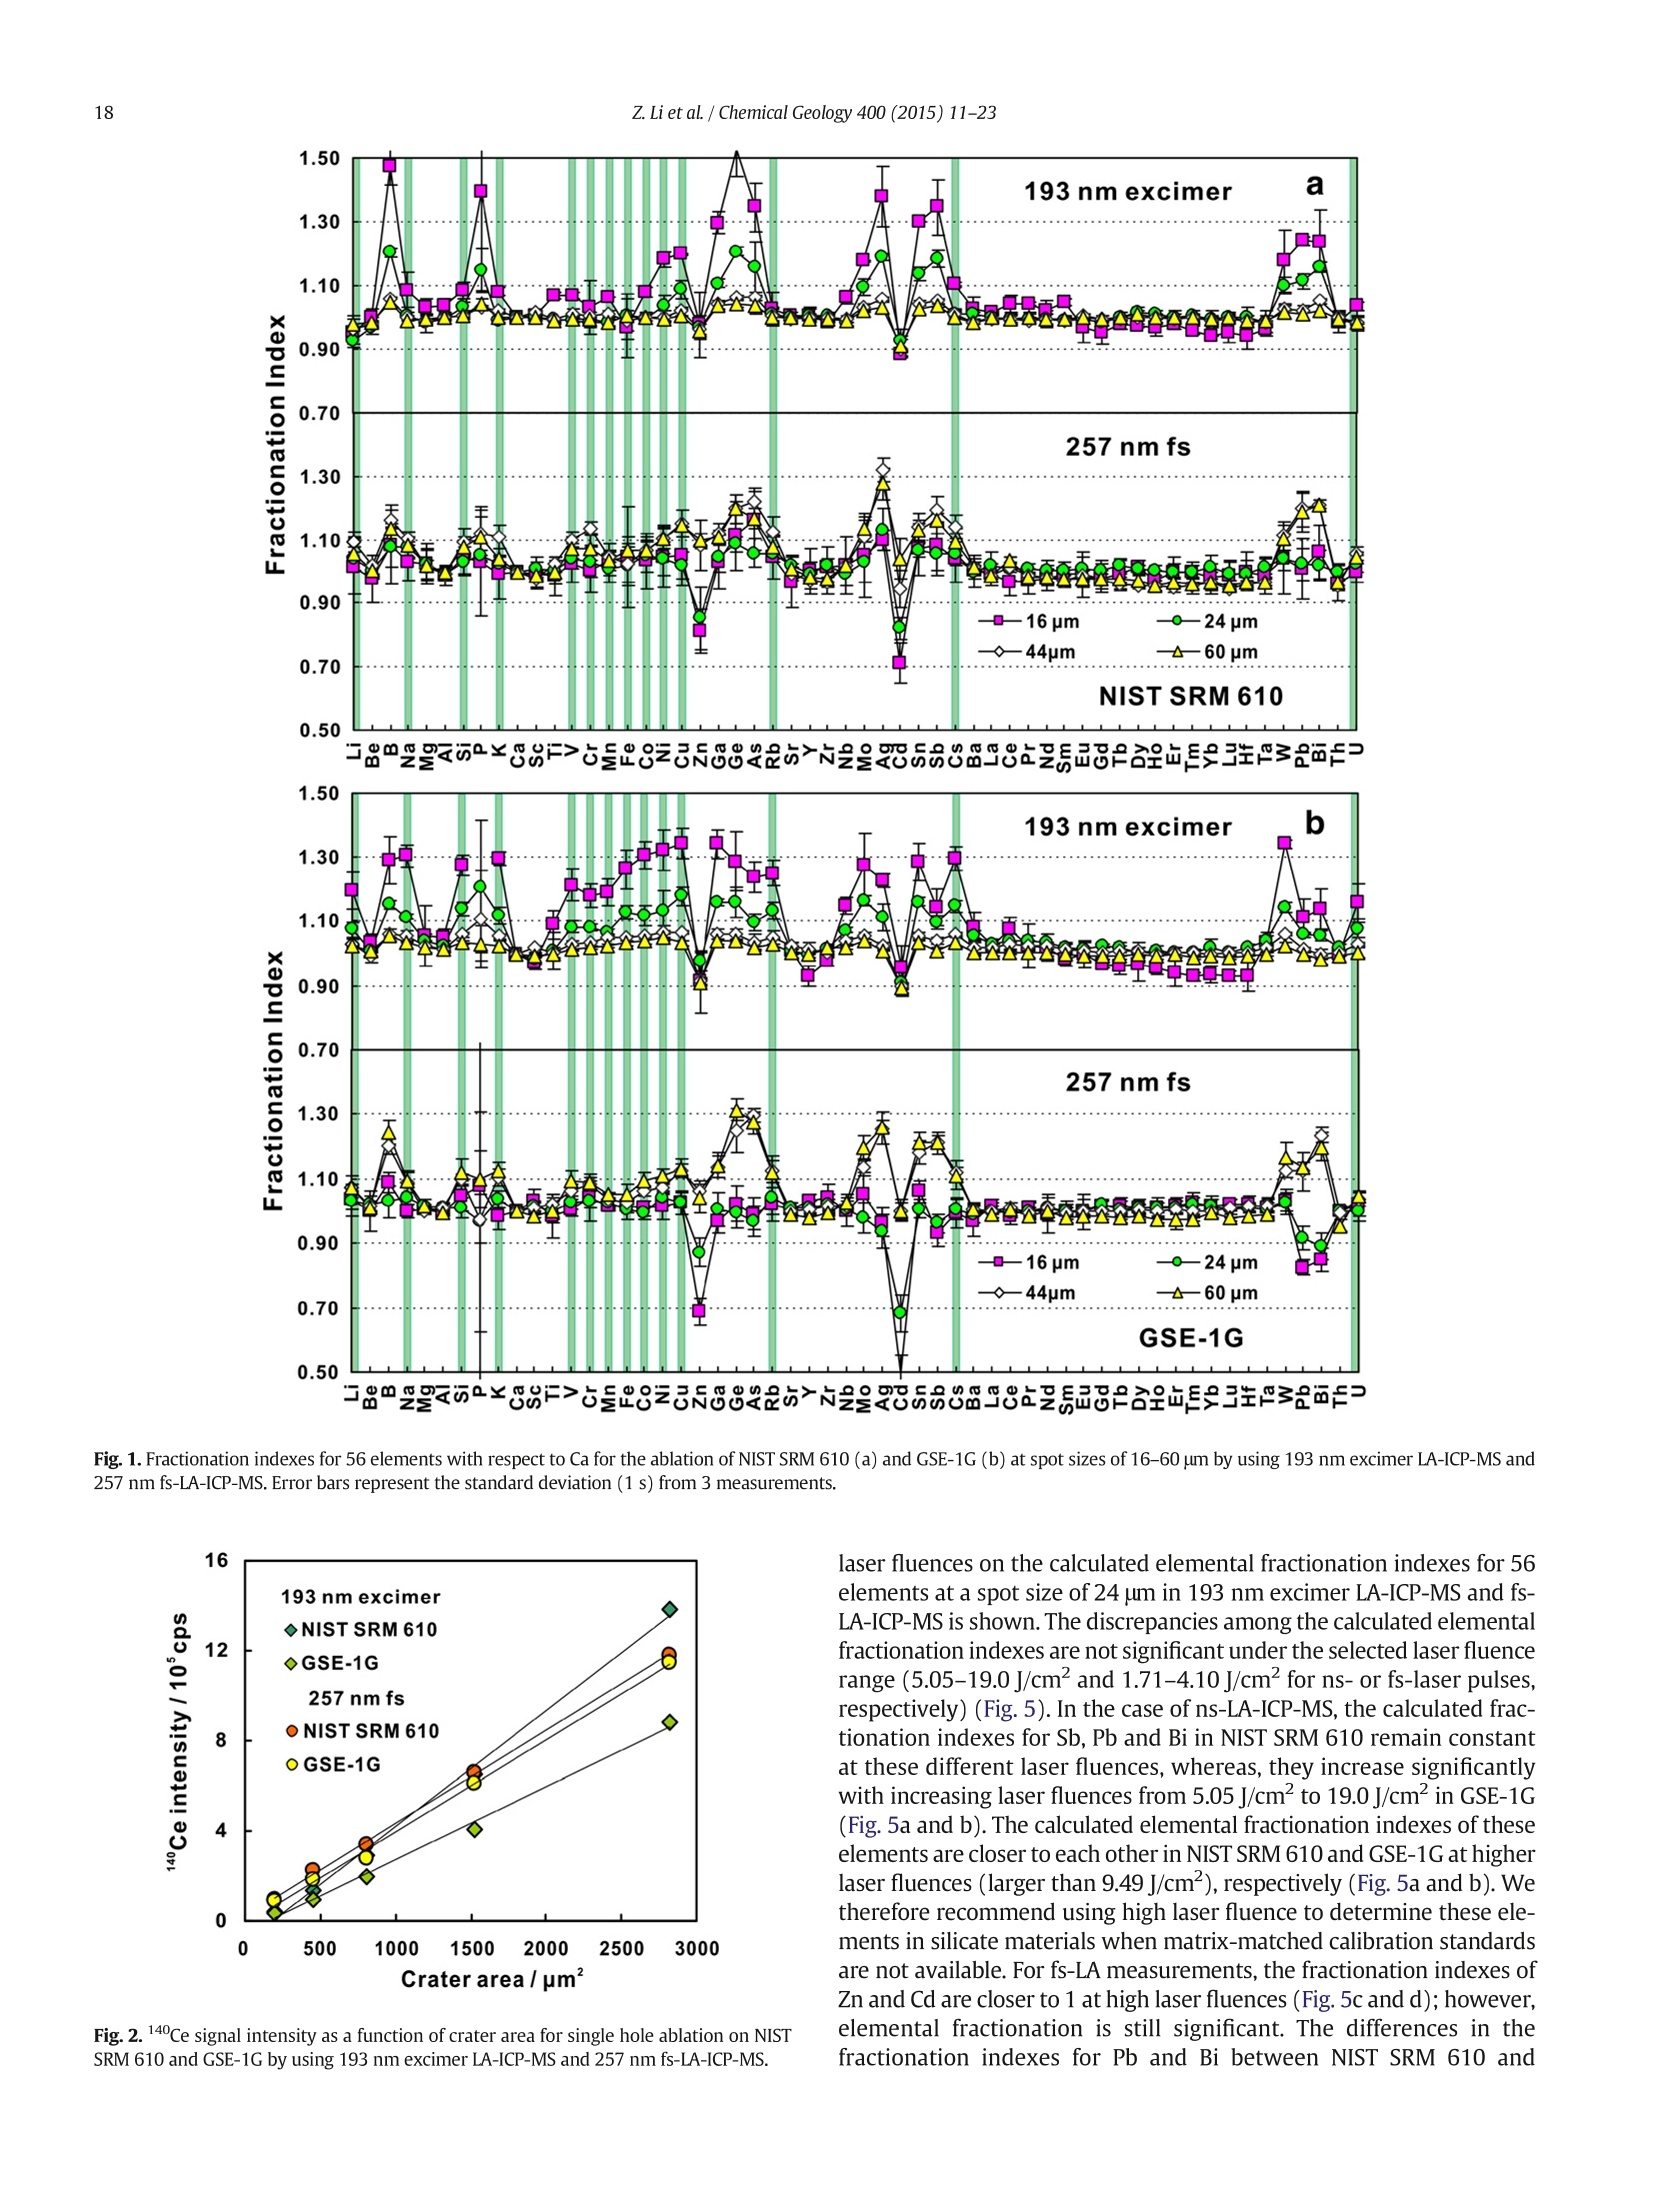
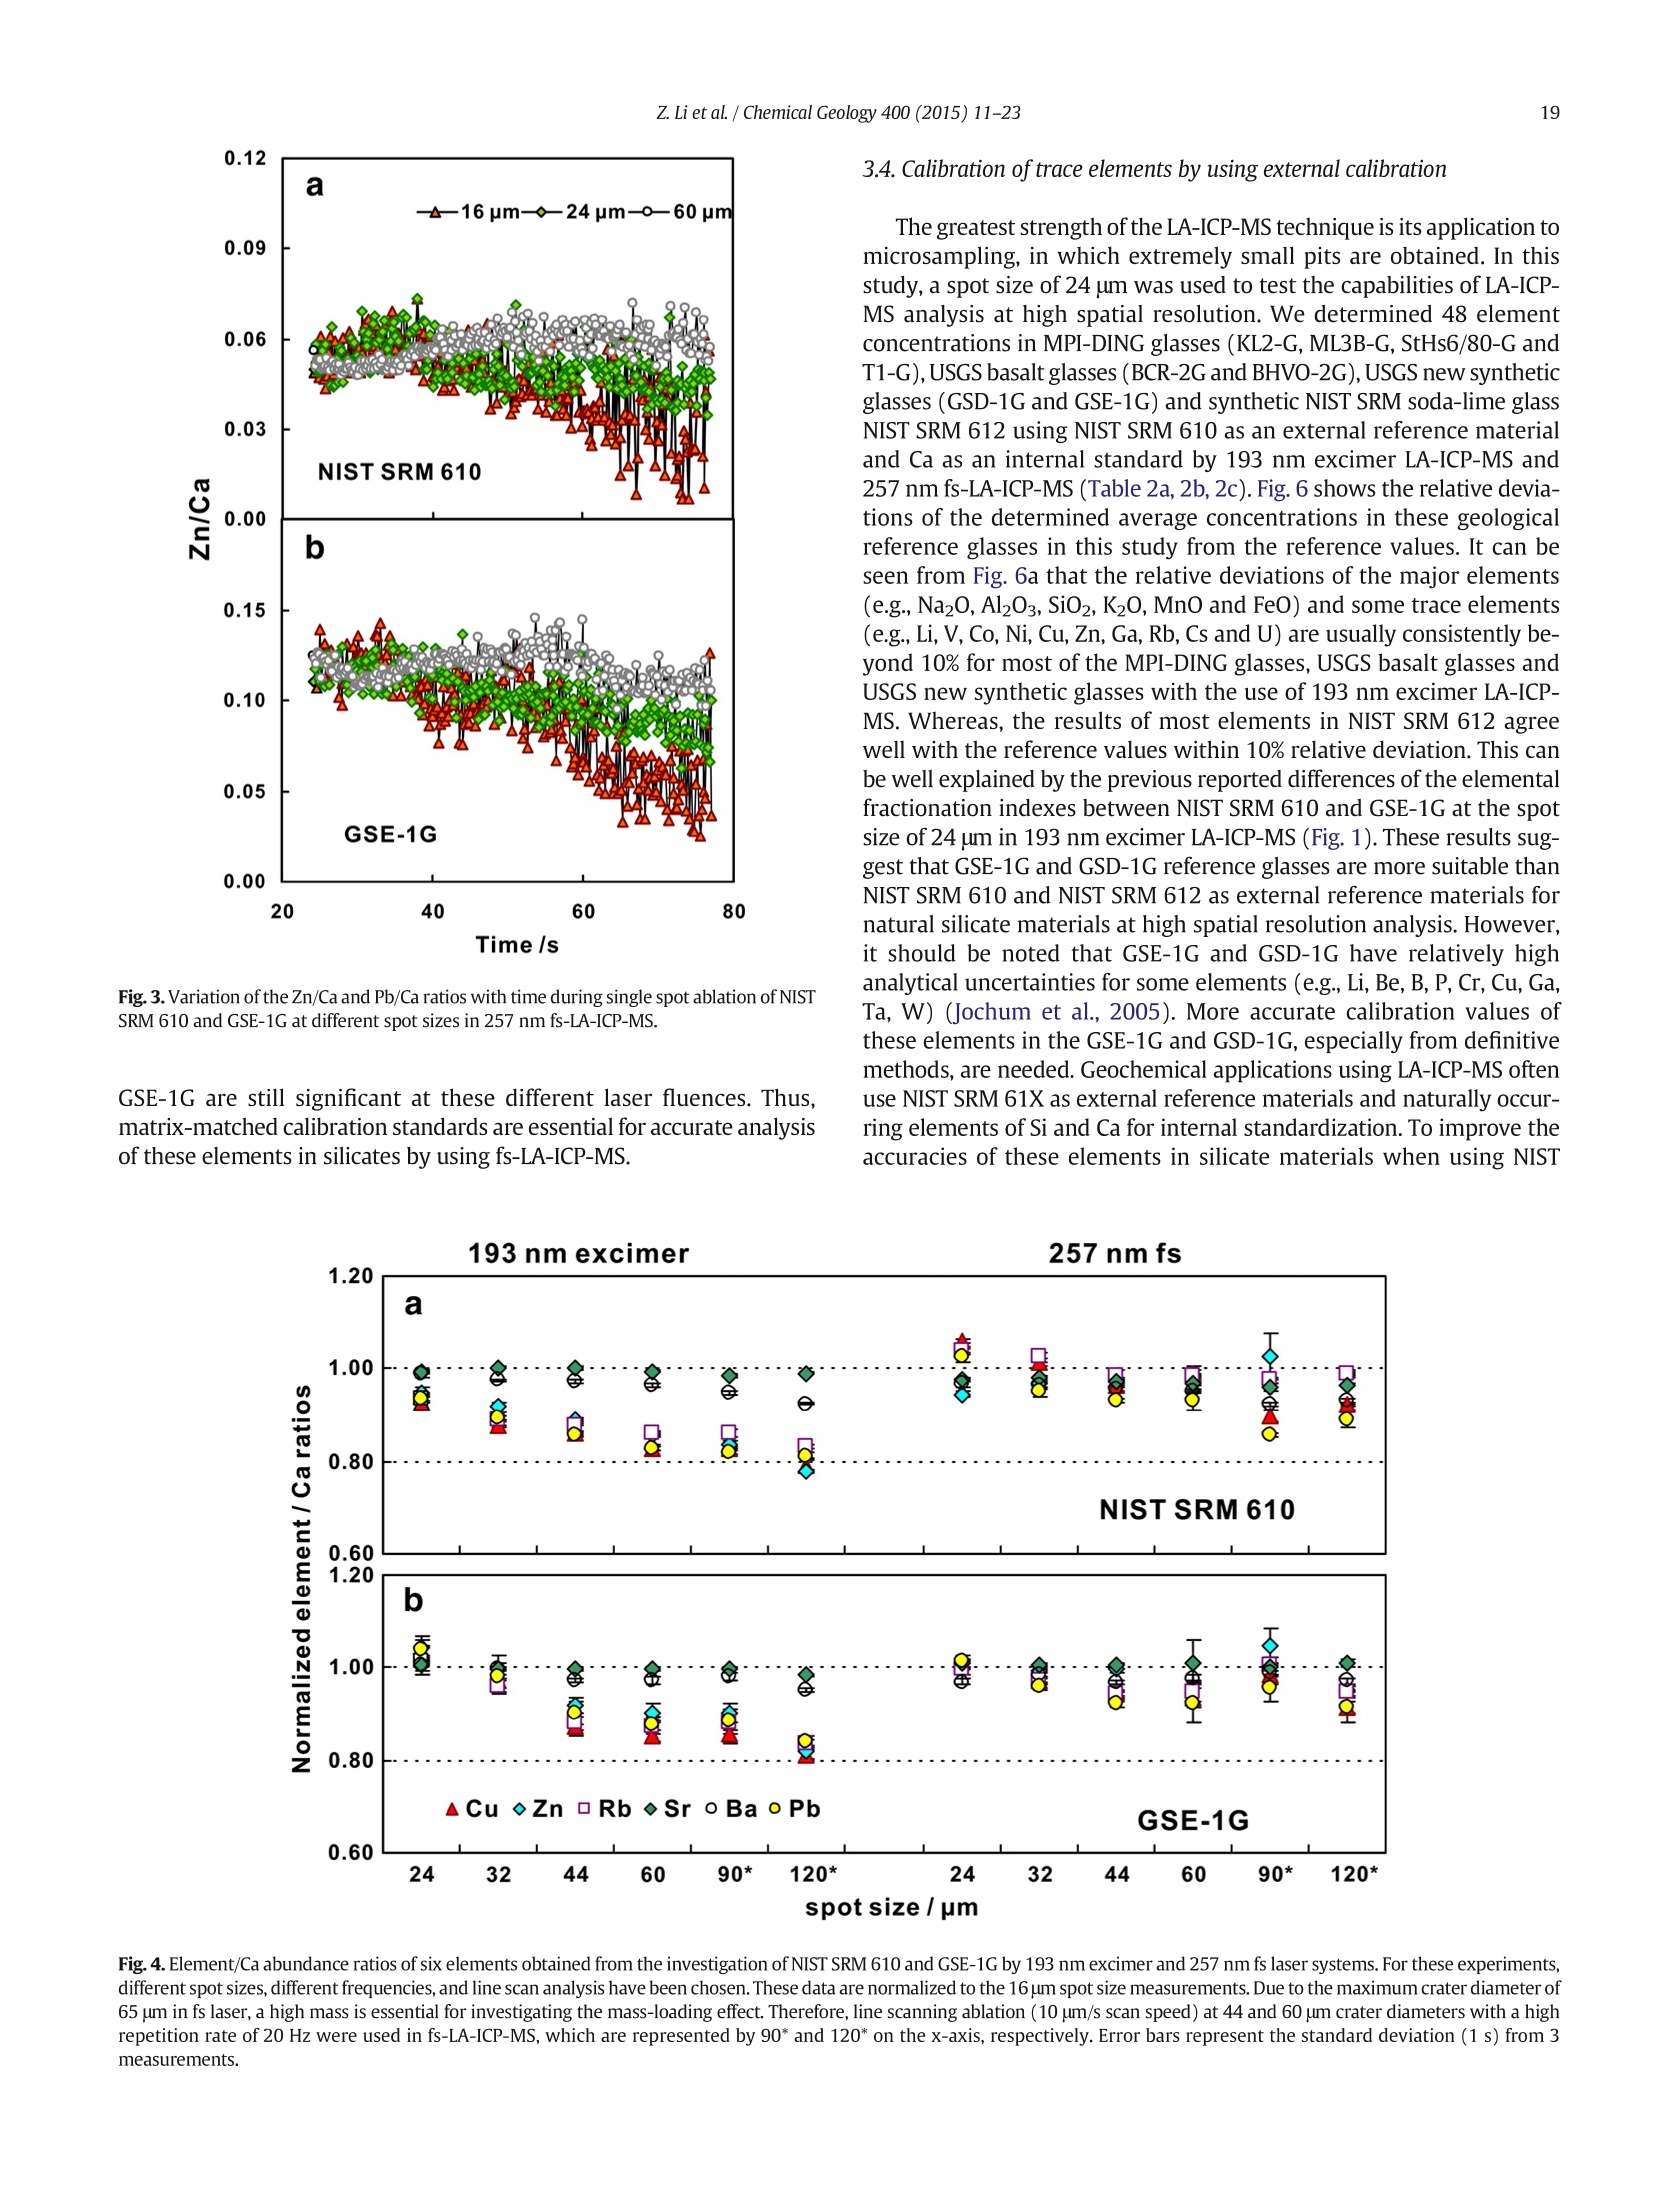
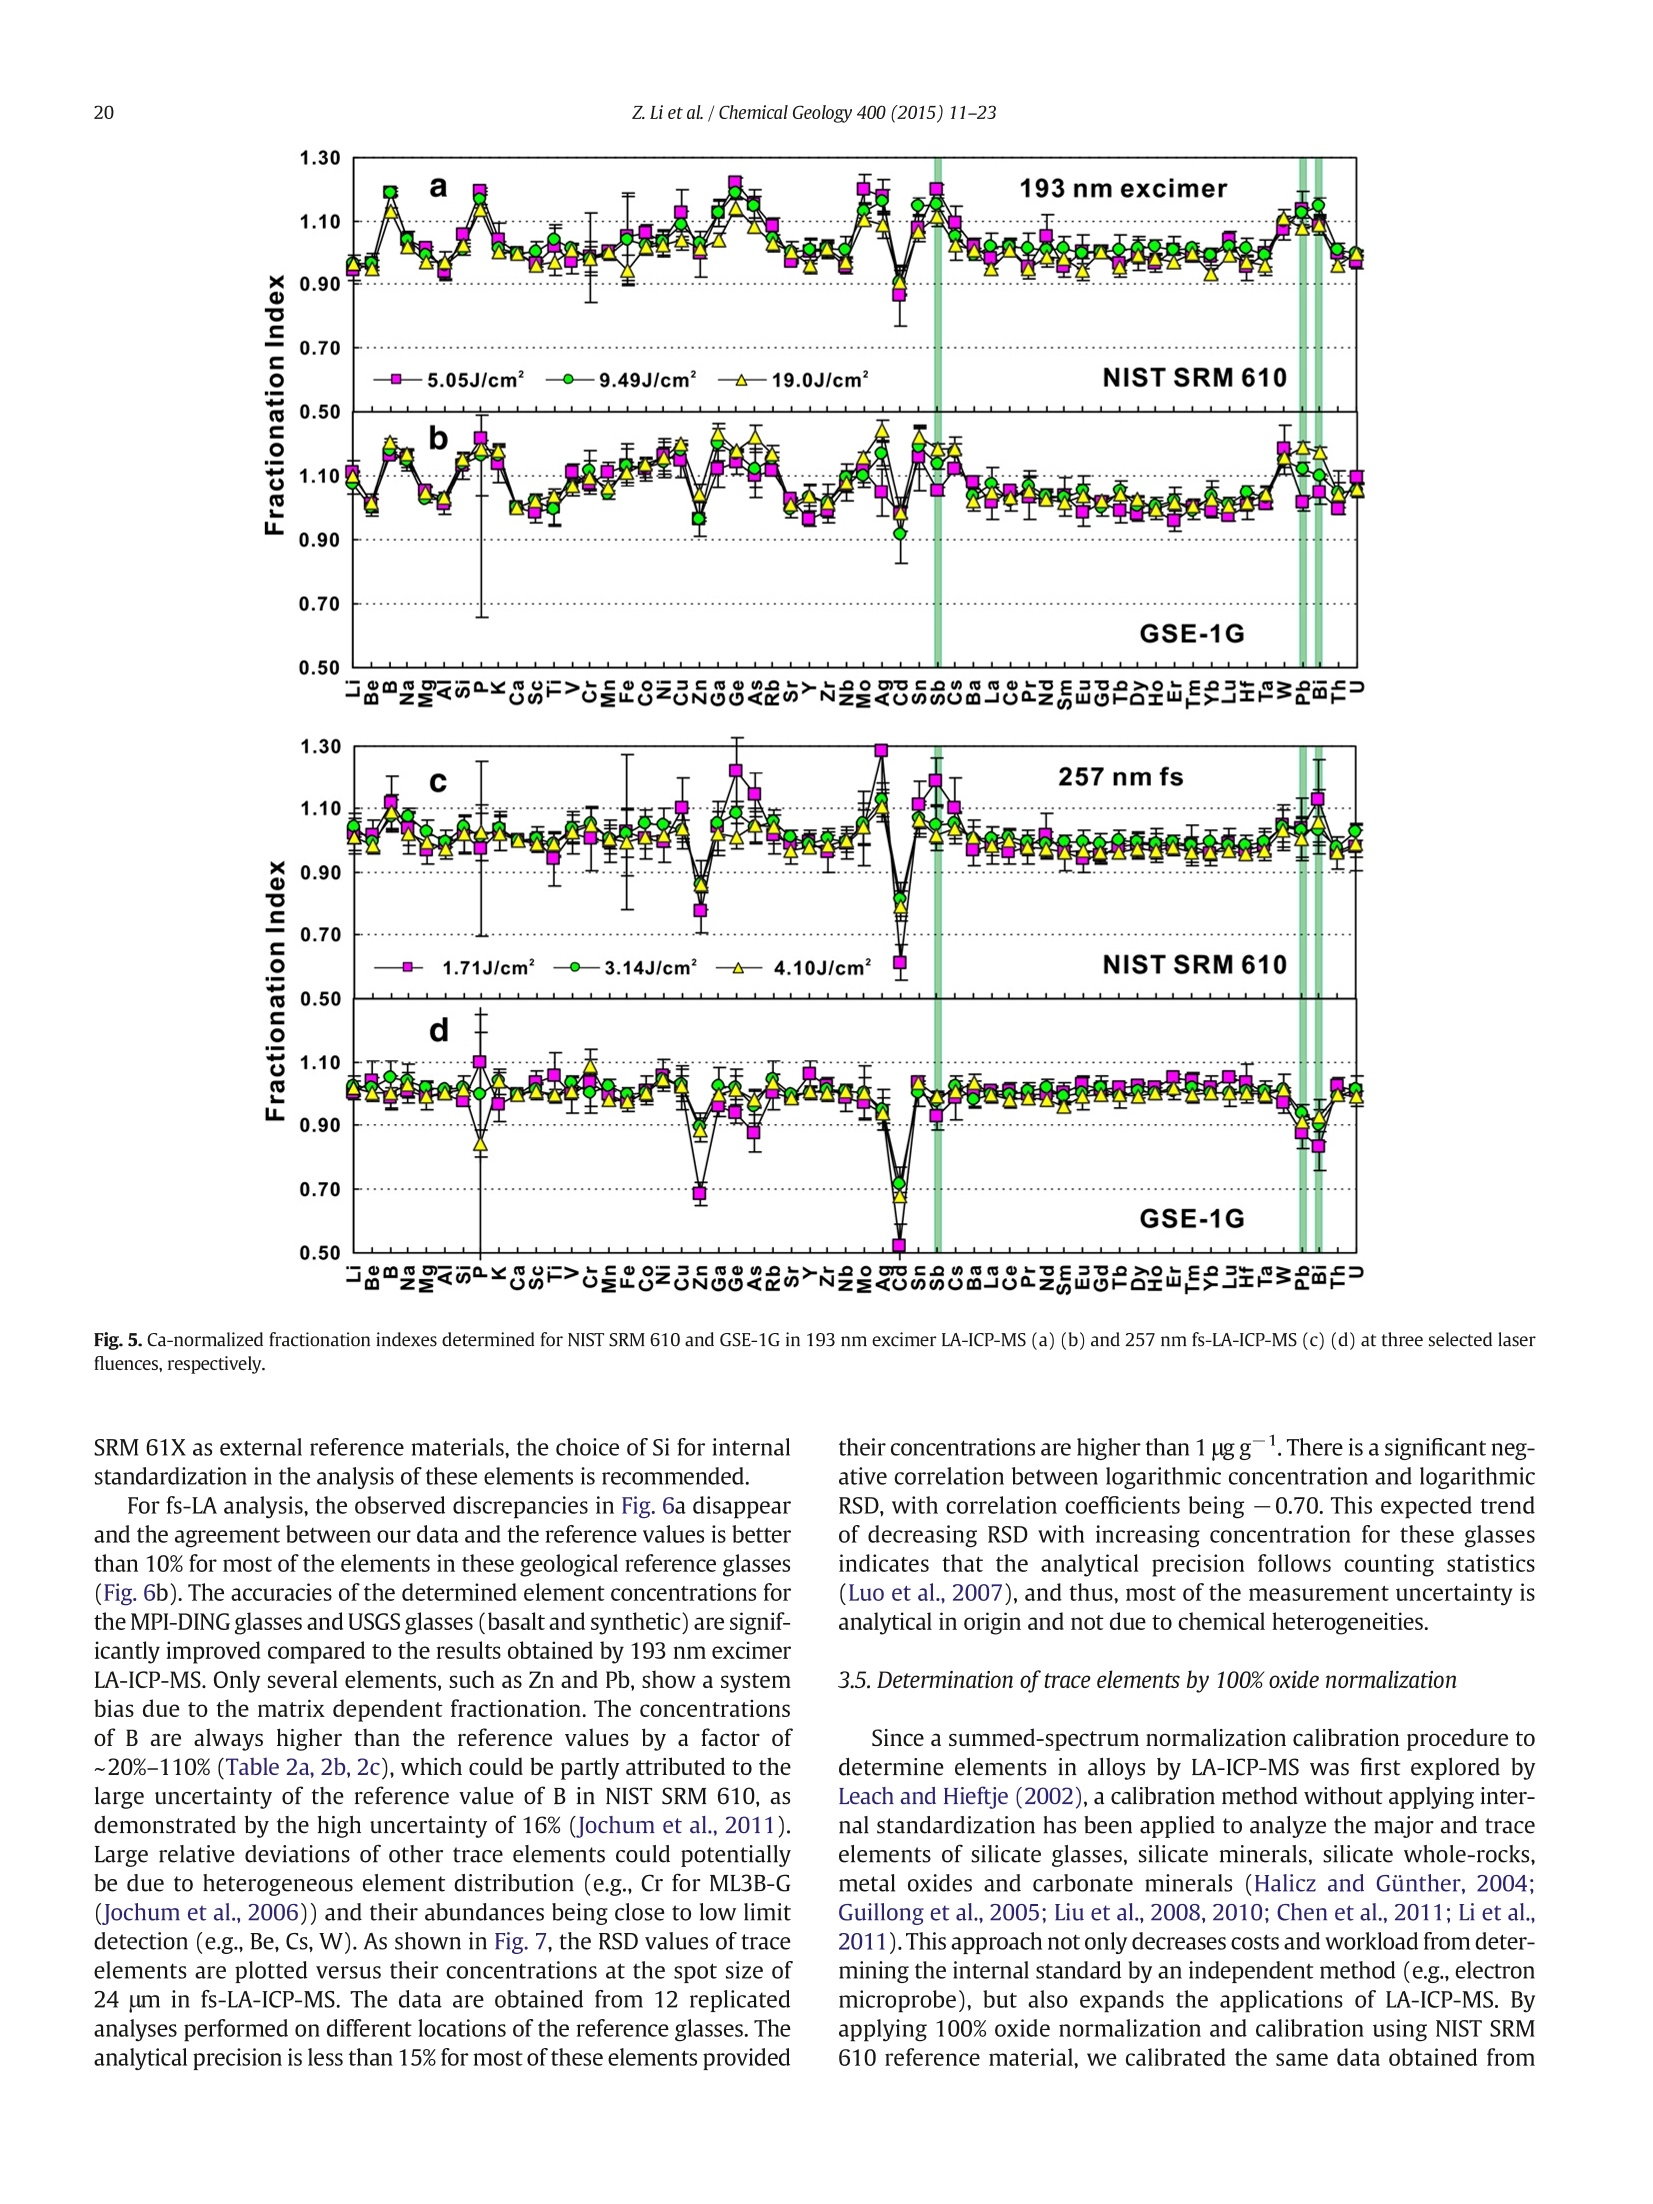
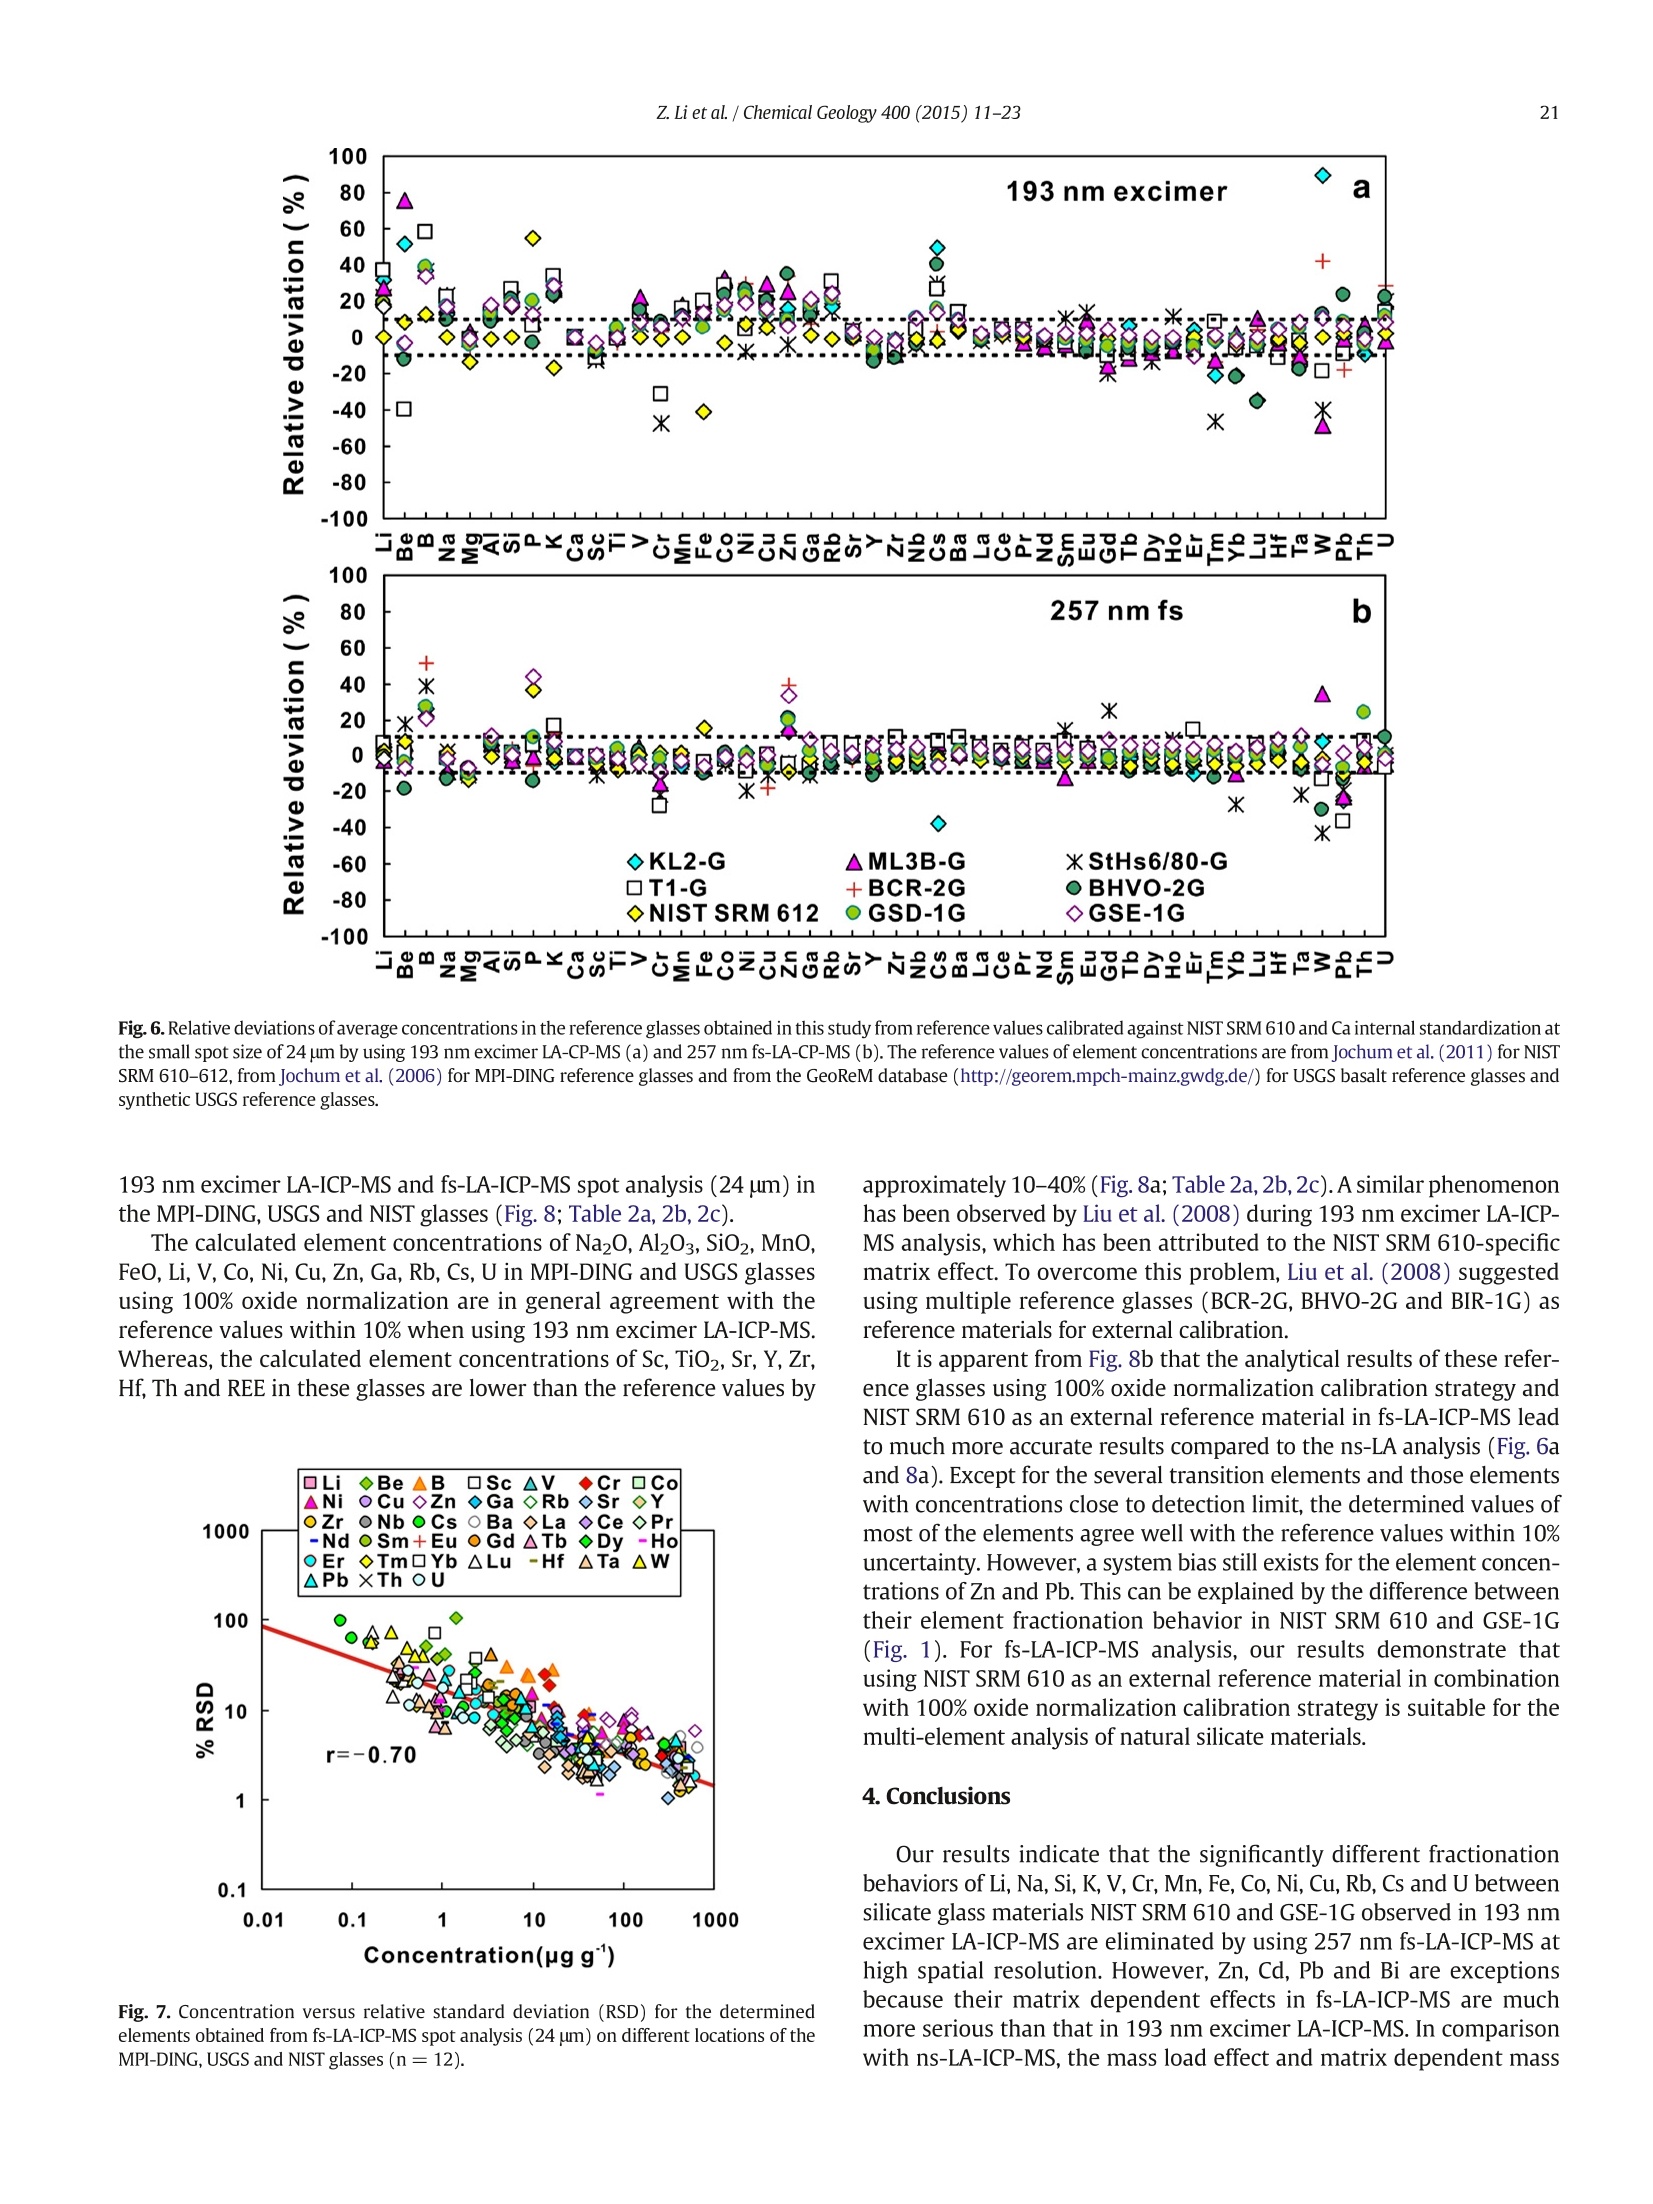
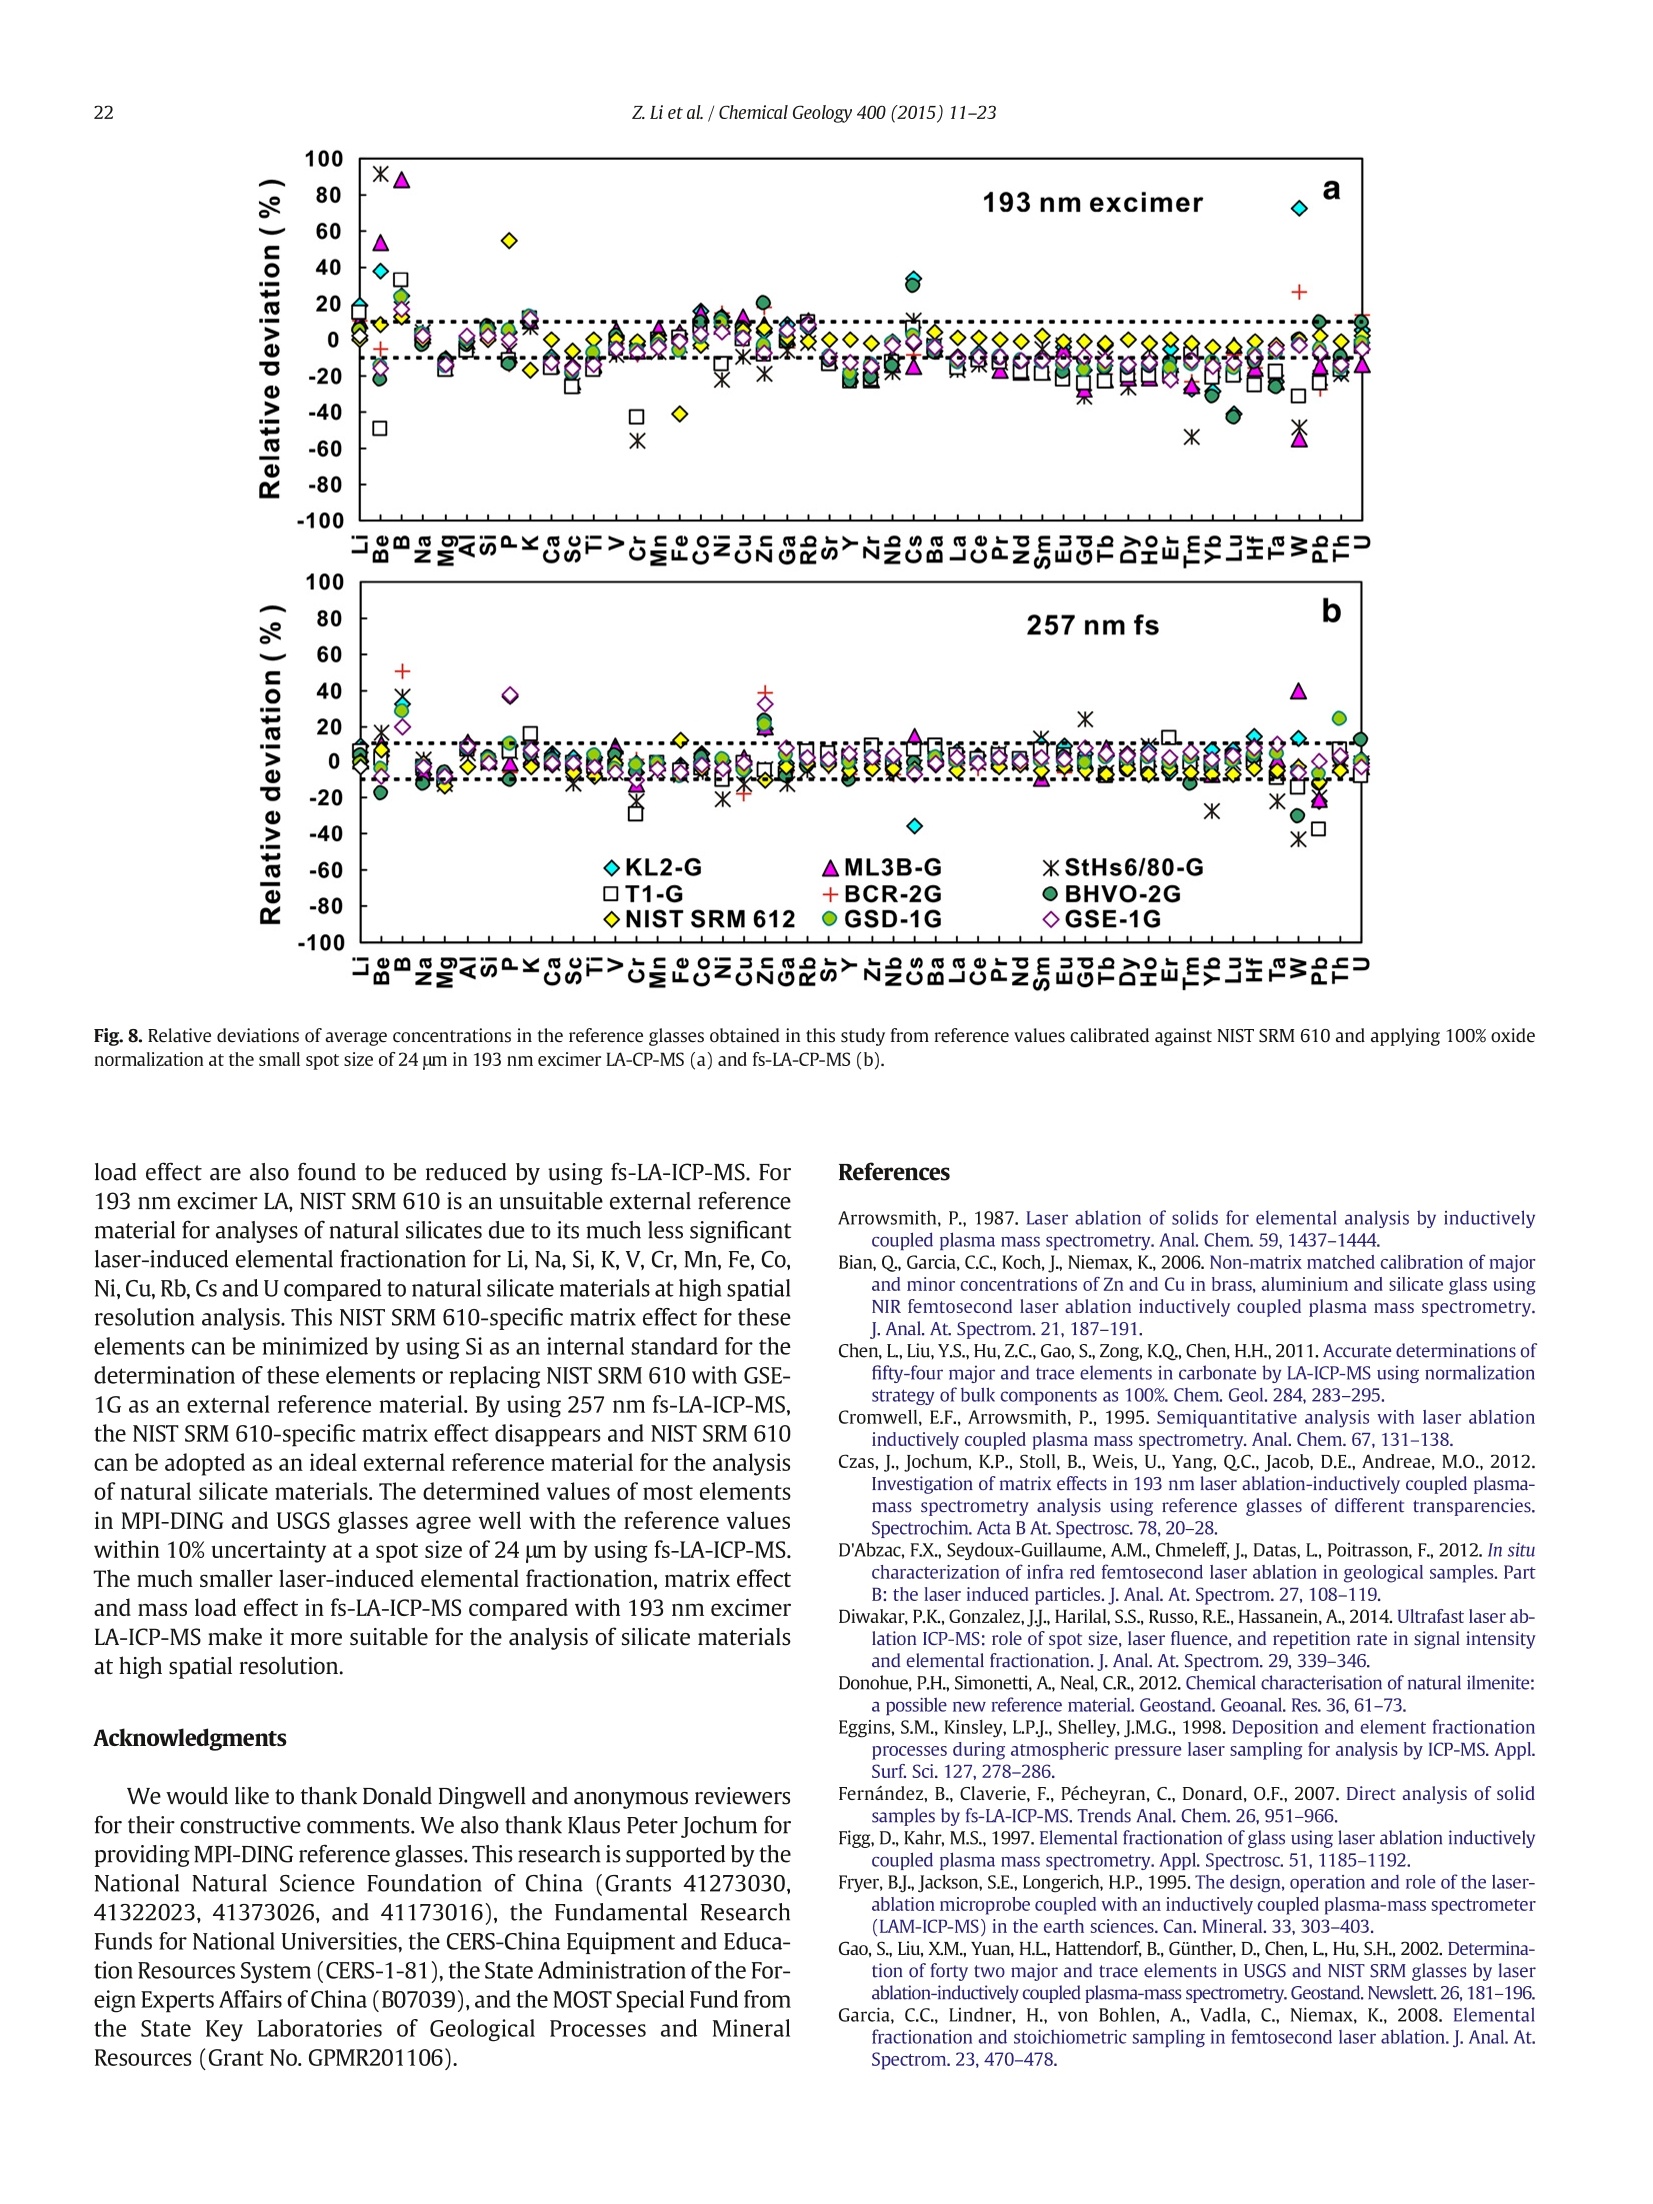
Chemical Geology 400 (2015) 11-23Contents lists available at ScienceDirectChemical Geology 12Z. Li et al./ Chemical Geology 400 (2015) 11-23 journalhomepage: www.elsevier.com/locate/chemgeo Accurate determination of elements in silicate glass by nanosecond andfemtosecond laser ablation ICP-MS at high spatial resolution CrossMark Zhen Li, Zhaochu Hu *, Yongsheng Liu, Shan Gao, Ming Li, Keqing Zong, Haihong Chen, Shenghong HuState Key Laboratory ofGeological Processes and Mineral Resources, Faculty of Earth Sciences, China University of Geosciences, Wuhan 430074, PRChina ARTICL E IN F O ABSTRAC T Article history:Received 30 June 2014Received in revised form 24 November 2014Accepted 5 February 2015 Available online 14 February 2015 Editor: D.B. Dingwell Despite the large number of successful applications of LA-ICP-MS, elemental fractionation remains the mainlimitation for many of its applications in the Earth sciences. This limitation is particularly notable for high spatialresolution analysis. Elemental fractionation and mass-load effect in silicate glasses NIST SRM 610 and GSE-1Gwere investigated by using 193 nm ArF excimer nanosecond (ns) laser and 257 nm femtosecond (fs) laserablation systems coupled to inductively coupled plasma mass spectrometry. Contrary to those observed inns-LA-ICP-MS, the most elemental fractionation at the small spot sizes of 16-24 um are lower than that at thelarge spot sizes of 44-60 um in fs-LA-ICP-MS. The significantly different fractionation behaviors of Li, Na, Si, K,Keywords: V,Cr,Mn, Fe, Co, Ni, Cu, Rb, Cs and U between silicate glass materials NIST SRM 610 and GSE-1G observed inLA-ICP-MS 193 nm excimer LA-ICP-MS are eliminated by using 257 nm fs-LA-ICP-MS at high spatial resolution. In addition,Elemental fractionation the mass load effect and matrix dependent mass load effect are also found to be reduced by using fs-LA-ICP-MS inMatrix effect comparison with ns-LA-ICP-MS. Except for Sb, Pb and Bi, the elemental fractionation is independent on the laserMass load effect fluence chosen,which is irrespective of ns- or fs-LA-ICP-MS. In this study, a spot size of 24 um was used to test theSilicate materials capabilities of LA-ICP-MS analysis at high spatial resolution. The agreement between our data and the referencevalues is better than 10% for most of the elements in MPI-DING,USGS, and NIST glasses by using fs-LA-ICP-MS. Forns laser ablation analysis, the accuracy is highly dependent on the calibration strategies used (conventional ex-ternal calibration method or 100% oxide normalization method) and the selected external reference materials(NIST SRM 610 or GSE-1G). The much less laser-induced elemental fractionation and matrix effect in fs-LA-ICP-MS in comparison with 193 nm excimer LA-ICP-MS make it more suitable for the analysis of silicate materialsat high spatial resolution. High spatial resolution analysis Laser ablation-inductively coupled plasma-mass spectrometry(LA-ICP-MS) has become one of the most popular techniques for thein situ analysis of element and isotopic compositions for a wide varietyof materials (Arrowsmith, 1987; Poitrasson et al., 2000; Jackson et al.,2004; Guinther and Hattendorf, 2005; Kosler, 2007; Sylvester, 2008;Russo et al., 2011; Orellana et al., 2013). Ever since the first feasibilitystudies were carried out during the 1980s (Gray, 1985; Arrowsmith,1987), the performance characteristics of LA-ICP-MS have been stronglyenhanced, principally with the use of ultraviolet (UV) wavelength LAsystems (Giinther and Hattendorf, 2005; Jochum et al., 2007). Amongthese different UV lasers, the 193 nm excimer laser was reported tobe excellent for LA-ICP-MS because its laser pulse energy could be effec-tively absorbed by most materials and produce small-size particles thatcould be easily transported by the carrier gas and efficiently atomizedand ionized in the ICP (Gunther et al., 1997; Guillong et al.,2003;Hattendorf et al., 2003). ( * C o rresponding author. Tel. : + 8627 67885100; f a x: +8 6 27 67885096. E-mail address: zch u @ v ip.s i n a. com (Z. Hu). ) 193 nm excimer LA-ICP-MS has been successfully applied for theanalysis of minerals and silicate glasses with non-matrix matched cali-bration (Giinther et al., 1997; Gao et al., 2002; Resano et al., 2003;Giinther and Hattendorf, 2005). Most of these reported element deter-minations in minerals and silicate glasses were focused on using largespot sizes of 40 to 120 um. This is also true for many other UV-LA-ICP-MS analyses (Kurosawa et al., 2006;Mertz-Kraus et al., 2009; Donohueet al., 2012). The major reason for large spot sizes is to improve sensitiv-ity when the samples were analyzed. The technological progress in ICP-MS instrumentation has led to thepossibility of analyzing craters of smaller diameter. In addition, spatiallyresolved analysis using a laser beam spot as small as possible is neces-sary for microanalysis applications, such as for the analysis of melt inclu-sions, dust aerosols and the zonations of minerals. Liu et al. (2010)reported simultaneous measurements of zircon U-Pb ages and traceelements by LA-ICP-MS at spot sizes of 16-32 um by introducing N2into the ICP to increase sensitivity. The obtained U-Pb ages were consis-tent with the preferred values within about 1% uncertainty (2o) by exter-nal calibration against 91500. Whereas, the most trace elements for91500 and relatively homogenous GJ-1 showed a systematic deviationof 10%-30% calibrated against NIST glasses using Si as an internal standard.The systematic deviation of REEs in carbonate pellets was alsoas high as 20% when calibrated against NIST SRM 610 with the use of Caas an internal standard at a spot size of 32 um (Chen et al., 2011). Huet al. (2011) showed the effect of spot sizes on the determined 24element concentrations in zircon GJ-1, GSE-1G and NIST SRM 612 usingNIST SRM 610 as an external reference material and Si as internal stan-dard. By changing the spot sizes from 16 um to 60 um, the determinedelement concentrations in zircon GJ-1 and GSE-1G were increased by30% (Pb in zircon GJ-1 is an exception), and they were almost not effectedin NIST SRM 612. The determined Pb concentration in carbonate MACS-1calibrated with NIST SRM 612 varied from approximately 170 to 130 ppmwith spot sizes varying from 25 um to 110 um for 193 nm laser measure-ments (Jochum et al., 2012). These results implied that matrix dependenteffects would significantly deteriorate the analysis results of LA-ICP-MSat high spatial resolution when matrix-matched calibration standardswere not available. Therefore, how to reduce the matrix dependentfractionation is important for high spatial resolution analysis. Many investigations suggest that a fs laser might be one of the bestsolutions to reduce the matrix effect and elemental fractionation inthe ablation process (Russo et al., 2002; Fernández et al., 2007; Kochand Giinther,2007; Garcia et al., 2008; Shaheen et al.,2012). The LA pro-cess using a fs laser is significantly less thermal and leads to a shrinkingofthe heat-affected zone (Fernandezet al., 2007). However, the applica-tions of fs-lasers have mainly been concentrated on the fractionationbehavior and the analysis of a few elements in conductors and semi-conductors (Gonzalez et al., 2004; Liu et al., 2004; Koch et al., 2005;Bian et al., 2006; Garcia et al., 2008; Wiltsche and Giinther, 2011).Forexample,Koch et al. (2005) studied the composition and fractionationproperties of dielectric aerosols generated by near infrared (NIR) fs-LAof silicate glass. It had been found that for fluences larger than5J cm-2, the total Zn-, Ca-,Sr-, Ba-, and Pb-specific composition ofthese aerosols corresponded to that of the bulk material even thoughthe composition of different aerosols was size-dependent. Bian et al.(2006) measured the major and minor concentrations of Zn and Cu inbrass,aluminum, and silicate glass using NIR-fs-LA-ICP-MS. Their resultsindicated the possibility of non matrix-matched calibration if thefluence, depending on the matrix, was appropriately adjusted. Garciaetal.(2008) observed that the fractionation of a few elements in binarymetallic and semiconductor samples as well as multi-component glasssamples occurred in the first laser shots particularly if the laser fluencewas near the ablation threshold of the sample. The fractionation couldbe reduced by applying many low-fluence laser shots or one high-fluence laser shot only. In most cases, the fractionation could most likelybe correlated with the respective ionization energies of the elements.There are only a few publications on multi-element analyses of silicatematerials by using fs-LA, especially for an UV-fs-LA (Jochum et al.,2014; Ohata et al., 2014). Jochum et al. (2014) reported the lessmatrix-dependent fractionation for volatile and siderophile/chalcophileelements such as Pb and Zn with 200 nm fs laser compared to the193 nm excimer laser and 213 Nd:YAG laser. The concentrations of 47elements in twenty-two international synthetic silicate glass,geologicalglass, silicate mineral, phosphate and carbonate reference materialswere successfully determined by using NIST SRM 610 as an external ref-erence material at the spot size of 40-65 um with spot analysis and linescan analysis. Ohata et al. (2014) demonstrated that middle ultraviolet(MUV) fs-and far ultraviolet (FUV) ns-LA-ICP-MS applying either Caor Si as an internal standard resulted in only minor discrepancies ofelement concentrations at spot sizes of 60-90 um. Glaus et al.(2010)ob-served the similar morphologies of silicate glass aerosols generated byns-and fs-LA. They considered that fs-LA of silicate with non-matrixmatched calibration would be limited because of a pronounced elementseparation into different particle size fractions. The aim of this study is to evaluate the matrix effect and elementalfractionation in the analysis of silicates by using the UV 193 nm ArFexcimer LA-ICP-MS and the advanced 257 nm fs-LA-ICP-MS at high spa-tial resolution. The widely used NIST SRM 610 and USGS new synthesis GSE-1G have been selected for studying the elemental fractionation andmatrix effect. This is because they not only fulfill the need for differenttypes of matrices due to different major element compositions, butalso have sufficient levels of trace elements to provide adequate signalsfor calibrating the fractionation indexes. For the purposes of compari-son, the MPI-DING, USGS and NIST reference glasses were also analyzedby ns- and fs-LA-ICP-MS with different calibration strategies at a highspatial resolution of 24 pm. 2. Experimental 2.1. Instrumentation Experiments were conducted on an Agilent 7500a ICP-MS (AgilentTechnology, Tokyo, Japan) in combination with a 193 nm ArF excimerLA system (GeoLas 2005, Lambda Physik, Gottingen, Germany) and a257 nm Yb fs-LA system (NWR-Femto"C,USA) owned by the StateKey Laboratory of Geological Processes and Mineral Resources, ChinaUniversity of Geosciences (Wuhan). Details of the instrumental operatingconditions and measurement parameters are summarized in Table 1. Theexcimer 193 nm laser is installed with an optical configuration producinga fairly flat-topped lateral energy distribution leading to pan-shaped ab-lation pits on the sample. The Yb fs-laser system has a Gaussian energybeam profile across its diameter. Helium was chosen as the ablation cellgas as it has been found to consistently enhance the signal 2- to 5-foldscompared to argon gas with the 193 nm excimer laser (Eggins et al.,1998; Giinther and Heinrich, 1999). The carrier and make-up gas flowswere optimized by ablating NIST SRM 610 to obtain maximum signalintensity for Lat, while keeping the ThO/Th ratio <0.3% and the U/Thratio close to 1. Except for spot analysis, we also performed line scananalysis at a 10 um/s speed applying crater diameters of 16-120 um(193 nm excimer) and 16-60 um (257 nm fs) to investigate a possible Table 1Summary of the operating parameters for 193 nm excimer LA-ICP-MS and 257 nm fs-LA-ICP-MS. mass-loading effect. Due to the maximum crater diameter of 65 um in fslaser, a high mass is essential for investigating the mass-loading effect.Therefore,line scanning ablation (10 pm/s scan speed) at 44 and 60 umcrater diameters with a high repetition rate of 20 Hz was used in fs-LA-ICP-MS. Each LA-ICP-MS analysis incorporated an approximately 20 sbackground acquisition followed by 50 s data acquisition from thesample. All analyses were acquired using time resolved software.The off-line selection and integration of the background and analytesignals, and time-drift correction and quantitative calibration wereconducted using an in-house program ICPMSDataCal (Liu et al., 2008,2010). 2.2. Samples The well characterized reference materials NIST SRM 610 and GSE-1G were used to study the elemental fractionation. To investigate theaccuracies of 193 nm excimer LA-ICP-MS and 257 nm fs-LA-ICP-MSfor high spatial resolution analysis, the following range of silicate glasseswere selected in this study: MPI-DING reference glasses (KL2-G(basalt),ML3B-G (basalt), StHs6/80-G (andesite) and T1-G (quartz-diorite)),USGS basaltic reference glasses (BCR-2G and BHVO-2G), syntheticUSGS reference glasses (GSE-1G and GSD-1G) and synthetic NIST SRMsoda-lime glasses (610 and 612).The working values are from Jochumet al. (2011) for NIST SRM 610-612, from Jochum et al. (2006) for theMPI-DING reference glasses and from the GeoReM database (http://georem.mpch-mainz.gwdg.de/) for the USGS basalt reference glassesand synthetic USGS reference glasses (Table 2a, 2b, 2c). Prior toLA-ICP-MS analyses, all of the reference glasses were polished fairlysmooth using aluminum powder and cleaned in a 2% HNO bath withan ultrasonic washer. 2.3. Element fractionation index The elemental fractionation indexes were calculated based on Ca asinternal standard. To simulate real application conditions, the elementalfractionation indexes were calculated by dividing the 50 s transientsignals into two equal time intervals, instead of 240 s as reported inreference (Fryer et al., 1995). The ratios to calcium of the second 25 s in-terval were divided by the corresponding ratio of the first time interval,as described by Fryer et al. (1995). The elemental fractionation indexesare,therefore, a measure of the fractionation of each element relative toCa, a value of 1 indicating no relative fractionation. 3. Results and discussion 3.1. Matrix induced elemental fractionation Fig. 1 shows the effect of changing crater diameters from 60 um to16 um on the calculated elemental fractionation index by using193 nm excimer LA-ICP-MS and 257 nm fs-LA-ICP-MS.The laser fluenceis 8.0 J/cm² which is independent of crater diameter for 193 nm excimerlaser. For 257 nm fs laser, the detected fluences are 2.90 J/cm², 3.14J/cm²,3.11 J/cm²and 2.48 J/cm for spot sizes of 16 um, 24 um, 44 um and 60 um,respectively. As shown for NIST SRM 610 and GSE-1G in Fig. 1, the calcu-lated elemental fractionation indexes (with respect to Ca) for 56 elements(Zn and Cd are exceptions) are very close to each other at the small spotsizes of 16-24 um, which are close to 1, and significantly increase forsome elements after switching spot sizes from 24 um to 44 um and60 um in fs-LA-ICP-MS. This is contrary to the fractionation indexesobserved in 193 nm excimer LA analysis (Fig. 1). Unlike in excimer LAsystem, there is no homogenizing lens in fs laser (NWR-FemtoC). Thus,the increased elemental fractionation indexes with increasing craterdiameter may be related to the heterogeneous distribution of the fslaser beam energy, which has a Gaussian distribution. Fig. 2 shows the140Ce signal intensity as a function of the crater area for single hole ablation on NIST SRM 610 and GSE-1G by using 193 nm excimer LA-ICP-MS and fs-LA-ICP-MS. The excellent positive correlation betweenthe crater area and the 140Ce signal intensity indicates that the distribu-tion of energy density of the laser beam is independent of the selectedcrater area for both 193 nm excimer laser and fs laser to a certain extent(Fig. 2). Therefore, the change of the fs laser beam energy distribution isunable to explain the observed phenomenon of the increased elementalfractionation indexes with increasing crater diameter. Further investiga-tions are needed to reveal the exact mechanism behind this occurrence.It is worth noting that the slopes of the 140ce signal response curves aresimilar for both NIST SRM 610 and GSE-1G when using fs-LA-ICP-MS. Incontrast, they are significantly different for 193 nm excimer LA-ICP-MS.This result suggests that the ablation behavior of the fs laser is morematrix-independent than that of the ns laser. For ns-LA-ICP-MS analysis, there are some significant differencesbetween the calculated elemental fractionation indexes for Li, Na, Si,K,V, Cr, Mn, Fe, Co, Ni, Cu, Rb, Cs and U in NIST SRM 610 and GSE-1Gat spot sizes of 16-24 um. The calculated elemental fractionationindexes for these elements in GSE-1G are significantly increased bychanging the spot sizes from 44 um to 24 um and 16 um (Fig. 1b). How-ever, they remain nearly constant at spot sizes of 24-60 um in NIST SRM610, and show only a slight increase at a spot size of 16 um (Fig. 1a). Theincreased elemental fractionation indexes with decreasing crater diam-eter should be related to the increased depth/diameter ratio, which hasbeen reported to have a significant effect on elemental fractionation(Mank and Mason, 1999). Loewen and Kent (2012) reported that theablation rate for NIST SRM 610 glass was ~170 nm/pulse, whereasthat was ~125 nm/pulse for more opaque GSE-1G at the same ablationconditions. Under our given laser ablation conditions, the ablation ratefor NIST SRM 610 was approximately 180 nm/pulse, which is 1.5times bigger than the ablation rate determined for more opaqueGSE-1G (approximately 120 nm/pulse). Thus the depth/diameter ratiofails to explain the much less significant laser-induced elementalfractionation for these elements in NIST SRM 610. Further work on theelemental fractionation in the ns-LA-ICP-MS is needed to identify thespecific mechanisms. In contrast, these fractionation index differencesbetween GSE-1G and NIST SRM 610 are eliminated by using fs-LA. Themuch less laser-induced elemental fractionation and matrix effect infs-LA-ICP-MS in comparison with 193 nm excimer LA-ICP-MS make itmore suitable for the analysis of silicate materials at high spatial resolu-tion (Fig. 1). Zn and Cd are exceptions, whose elemental fractionation infs-LA-ICP-MS are more serious than those in 193 nm excimer LA-ICP-MS. The calculated elemental fractionation indexes of Zn and Cd are inthe range of 0.49-0.88 at spot sizes of 16-24 um on NIST SRM 610 andGSE-1G by fs-LA-ICP-MS while they are 0.88-0.98 for 193 nm excimerLA-ICP-MS (Fig. 1). Fig. 3 shows the change of the Zn/Ca ratios withtime during single hole ablation of NIST SRM 610 and GSE-1G usingspot sizes from 16 um to 60 um in fs-LA-ICP-MS. The Zn/Ca ratios arenear similar at the beginning of ablation time (15 s) and then graduallydisperse with time by the change of spot sizes from 16 um to 24 um to60 um (Fig. 3a and b). The significantly reduced Zn/Ca ratios with in-creasing ablation time at small spot sizes of 16-24 um correspondwith their low elemental fractionation indexes in Fig. 1. The highly vol-atile element Zn may remain in the gaseous state or be partitioned intothe smaller particulates during LA process (Kosler et al., 2005; Hirataand Miyazaki, 2007; D'Abzac et al., 2012), which could much moreeasily condense on or adhere to the ablation crater wall leading to thesignificant loss of Zn in the signal ratios at high depth to diameter ratios.Similar trends for elemental fractionation indexes for Zn and Cd by fs-LAof silicate glass NIST SRM 610 were previously reported by Koch et al.(2006); Shaheen et al.(2008). Pband Bi are other exceptions. The calcu-lated elemental fractionation indexes of Pb and Bi are close to 1 in NISTSRM 610 at spot sizes of 16-24 um by using fs-LA-ICP-MS; however,they are 0.82-0.92 in GSE-1G. Therefore, there is a significant matrix ef-fect between NIST SRM 610 and GSE-1G for the analysis of Pb and Bi byusing fs-LA-ICP-MS. Jochum et al. (2014) reported that the fractionation Table 2a Element concentrations for KL2-G, MLB-3G and StHs6/80-G obtained by 193 nm excimer LA-ICP-MS and 257 nm fs-LA-ICP-MS. Values are in units of ug.gexcept for major elements Na20,Mg0,Al203,Si02,P205,K20, CaO,TiO2,MnO,and FeO whichare specified in weight percent (%m/m). Error bars represent the standard deviation (1 s) from 12 measurements. Element lKL2-G MLB-3G StHs6/80-G KL2-G 193 nm excimer 257 nmfs Ref. 193 nm excimer 257 nm fs Ref. 193 nm excimer 257 nm fs Ref. A B A B A B A B A B A B Li 6.72±0.49 6.09±0.51 5.34±0.42 5.58±0.35 5.1±0.5 5.74±0.67 4.97±0.53 4.36±0.47 4.51±0.51 4.5±0.4 25.2±0.8 21.4±0.7 21.2±0.8 21.0±0.9 20.7±2.3 Be 1.33±0.36 1.21±0.33 0.87±0.32 0.91±0.34 0.88±0.341.09±0.59 0.95±0.51 0.66±0.34 0.68±0.35 0.62±0.14 2.69±0.93 2.30±0.83 1.41±1.47 1.40±1.46 1.2±0.1 B 3.75±0.74 3.4±0.7 3.44±1.44 3.62±1.53 2.73±0.28 5.44±1.69 4.70±1.45 5.19±1.57 5.39±1.72 2.5±0.6 16.2±1.7 13.8±1.7 16.3±4.6 16.1±4.4 11.8±1.3 Na2O 2.64±0.04 2.39±0.01 2.11±0.15 2.2±0.1 2.35±0.08 2.82±0.06 2.44±0.01 2.18±0.08 2.25±0.05 2.40±0.06 5.47±0.15 4.65±0.03 4.57±0.15 4.52±0.12 4.44±0.14 MgO 7.26±0.33 6.57±0.20 6.61±0.16 6.91±0.24 7.34±0.09 6.80±0.27 5.89±0.13 5.99±0.15 6.19±0.19 6.59±0.08 1.94±0.04 1.65±0.02 1.75±0.05 1.73±0.04 1.97±0.04 Al203 14.5±0.3 13.2±0.1 14.1±0.3 14.7±0.2 13.3±0.2 15.5±0.3 13.4±0.1 14.6±0.3 15.1±0.3 13.6±0.2 20.2±0.4 17.2±0.1 18.9±0.7 18.7±0.2 17.8±0.2 SiO2 59.0±1.2 53.5±0.3 48.4±2.1 50.5±0.8 50.3±0.3 63.4±1.6 54.9±0.3 50.3±2.4 51.9±1.1 51.4±0.6 76.8±2.1 65.4±0.3 63.8±2.5 63.2±0.4 63.7±0.5 P205 0.26±0.01 0.24±0.01 0.24±0.02 0.25±0.02 0.23±0.03 0.25±0.01 0.21±0.00 0.23±0.02 0.23±0.01 0.23±0.03 0.18±0.01 0.15±0.00 0.17±0.01 0.17±0.02 0.16±0.02 K20 0.59±0.010.530±0.004 0.46±0.02 0.48±0.01 0.48±0.01 0.49±0.01 0.42±0.01 0.38±0.02 0.39±0.01 0.385±0.004 1.63±0.05 1.39±0.02 1.40±0.06 1.38±0.07 1.29±0.02 CaO 10.9±0.0 9.88±0.17 10.9±0.0 11.4±0.3 10.9±0.2 10.5±0.0 9.1±0.2 10.5±0.0 10.9±0.3 10.5±0.1 5.28±0.00 4.5±0.1 5.28±0.00 5.23±0.18 5.28±0.09 Sc 29.8±1.1 27.0±0.8 31.2±1.1 32.7±1.3 31.8±0.9 28.2±1.1 24.4±0.8 30.4±1.1 31.4±1.6 31.6±1.6 10.1±0.6 8.57±0.41 10.2±0.5 10.1±0.6 11.5±0.8 TiO2 2.53±0.08 2.29±0.08 2.53±0.05 2.64±0.08 2.56±0.09 ) 2.12±0.04 1.84±0.07 2.07±0.05 2.14±0.07 2.13±0.09 0.71±0.02 0.60±0.01 0.69±0.02 0.68±0.01 0.70±0.02 V 348±11 316±5 312±12 326±5 309±38 326±8 283±1 282±12 292±6 268±23 97.4±2.7 82.9±0.5 85.5±3.3 84.6±2.4 90.3±6.7 Cr 316±19 286±12 265±8 277±10 294±27 192±20 166±15 150±8 155±5 177±23 8.82±7.81 7.47±6.60 13.3±3.3 13.2±3.3 16.9±3.3 MnO 0.19±0.010.170±0.005 0.160±0.0040.170±0.003 0.17±0.01 0.20±0.01 0.180±0.0050.170±0.0040.170±0.003 0.17±0.01 ooNw A = Calibrated against NIST SRM 610 and applying Ca internal standardization; B = Calibrated against NIST SRM 610 and applying 100% oxide normalization. Jochum et al. (2006). Table 2b Element concentrations for T1-G, BCR-2G and BHVO-2G obtained by 193 nm excimer LA-ICP-MS and 257 nm fs-LA-ICP-MS. Values are in units of ug.gexcept for major elements Na20,Mg0,Al20s,Sio2,P20s,K20, CaO, TiO2,MnO, and FeO which arespecified in weight percent (%m/m). Error bars represent the standard deviation (1 s) from 12 measurements. Element T1-G 193 nm excimer BCR-2G BHVO-2G 257nm fs Ref. 193 nm excimer 257 nm fs Ref.b 193 nm excimer 257 nm fs Ref. A B A B A B A B A B A B Li 27.3±1.1 22.9±1.0 21.3±1.1 21.1±0.6 19.9±0.9 11.3±0.4 9.97±0.29 9.23±1.00 9.17±0.87 9±1 5.2±0.5 4.62±0.46 4.48±0.32 4.55±0.33 4.4±0.8 Be 1.21±0.84 1.01±0.69 2.04±0.45 2.03±0.46 2.0±0.6 2.49±1.24 2.19±1.08 2.33±0.79 2.32±0.81 2.3±0.4 1.14±0.23 1.01±0.20 1.06±0.44 1.07±0.44 1.3±0.2 B 6.48±1.55 5.43±1.26 8.56±2.14 8.50±2.16 4.1±1.1 18.2±4.1 16.1±3.8 9.07±2.13 9.01±2.06 6±1 6.37±0.96 5.66±0.86 5.06±1.56 5.13±1.57 Na2O 3.83±0.09 3.21±0.02 3.07±0.17 3.04±0.09 3.13±0.09 3.80±0.08 3.36±0.04 3.14±0.20 3.12±0.14 3.23±0.07 2.62±0.02 2.33±0.01 2.09±0.06 2.12±0.08 2.4±0.1 MgO 3.71±0.09 3.11±0.06 3.37±0.09 3.34±0.04 3.75±0.04 3.38±0.07 2.99±0.04 3.21±0.06 3.19±0.06 3.56±0.09 7.11±0.06 6.32±0.06 6.63±0.13 6.74±0.16 7.13±0.02 A203 19.2±0.3 16.1±0.1 18.4±0.6 18.2±0.2 17.1±0.2 14.8±0.3 13.1±0.1 14.2±0.4 14.2±0.5 13.4±0.4 14.8±0.0 13.2±0.1 14.4±0.4 14.6±0.3 13.6±0.1 SiO2 73.8±1.8 61.9±0.5 59.3±1.6 58.7±0.3 58.6±0.4 64.4±1.1 56.9±0.5 56.2±1.9 55.9±0.7 54.4±0.4 59.8±0.6 53.1±0.4 49.9±1.0 50.7±0.4 49.3±0.1 P205 0.18±0.00 0.15±0.00 0.18±0.01 0.18±0.01 0.17±0.03 0.36±0.02 0.32±0.02 0.35±0.02 0.35±0.02 0.37±0.01 0.28±0.01 0.25±0.01 0.25±0.01 0.26±0.01 0.29±0.02 K20 2.61±0.05 2.19±0.03 2.29±0.08 2.27±0.07 1.96±0.04 2.24±0.04 1.98±0.02 2.00±0.19 1.99±0.16 1.74±0.04 0.630±0.003 0.56±0.01 0.52±0.03 0.53±0.03 0.51±0.02 CaO 7.1±0.0 5.96±0.11 7.1±0.0 7.04±0.19 7.1±0.09 7.06±0.00 6.25±0.09 7.06±0.00 7.02±0.16 7.06±0.11 11.4±0.0 10.1±0.1 11.4±0.0 11.6±0.2 11.4±0.1 Sc 23.8±0.6 19.9±0.5 26.9±0.7 26.7±0.6 26.9±1.1 32.1±0.7 28.4±0.7 33.2±1.0 33±1 33±2 30.3±0.9 26.9±1.0 31.7±0.9 32.2±0.7 33±2 Tio2 0.74±0.01 0.62±0.02 0.74±0.02 0.73±0.01 0.76±0.02 2.28±0.03 2.01±0.02 2.22±0.05 2.21±0.05 2.27±0.04 2.72±0.03 2.41±0.01 2.65±0.05 2.69±0.04 2.79±0.02 216±5 181±2 187±11 185±6 190±11 470±14 416±10 433±11 431±12 425±18 352±5 313±4 315±8 320±7 308±19 Cr 14.2±4.7 11.9±4.0 15.1±2.9 14.9±2.8 20.9±2.0 17.5±5.3 15.5±4.5 17.3±1.8 17.2±2.1 17±2 317±14 282±13 273±12 277±11 293±12 MnO 0.150±0.0040.130±0.001( 0.13±0.01 0.130±0.003 0.13±0.01 0.220±0.0040.190±0.003 0.200±0.0040.200±0.003 0.19±0.01 0.190±0.003 ooNw A= Calibrated against NIST SRM 610 and applying Ca internal standardization; B = Calibrated against NIST SRM 610 and applying 100% oxide normalization.Jochum et al. (2006). The GeoReM database (http://georem.mpch-mainz.gwdg.de/. Element concentrations for NIST SRM 612, GSD-1G and GSE-1G obtained by 193 nm excimer LA-ICP-MS and 257 nm fs-LA-ICP-MS. Values are in units of ug.g except for major elementsNa2O,MgO,Al203, SiO2,P20s,K20, CaO, TiO2, MnO, and FeO which are specified in weight percent (%m/m). Error bars represent the standard deviation (1 s) from 12 measurements. A= Calibrated against NIST SRM 610 and applying Ca internal standardization; B= Calibrated against NIST SRM 610 and applying 100% oxide normalization.Jochum et al.(2011). indexes for Pb are similar (both less than 1) at spot sizes of 12-25 um byfs-LA of NIST SRM 610 and GSE-1G. The significant matrix dependentef-fects for Pb and Bi in fs-LA-ICP-MS between NIST SRM 610 and GSE-1Gat high spatial resolution observed in this study contradict the resultreported by Jochum et al. (2014). This could be due to the different LAsystems used. Many studies have observed matrix dependent effectsfor volatile elements such as Pb and Zn in the LA-ICP-MS analysis ofsilicates (Jochum et al., 2007, 2012). Glaus et al. (2010) proposed thatthis might be related to the melting effect produced by heat diffusionin the samples. The melting effect can be well restrained whenthe laser pulse duration falls below the thermal relaxation time of afew hundred femtoseconds (Koch and Giinther, 2007). However,theopposite effects are observed in our fs-LA measurements, indicatingthat the heat diffusion may not be or at least may not be the only oneexplanation for the matrix effect in LA-ICP-MS. 3.2. Mass load effect The mass load of the ICP may have an effect on elemental fraction-ation in LA-ICP-MS (Kroslakova and Giinther, 2007; Hu et al., 2011;Czas et al., 2012; Jochum et al., 2012). Kroslakova and Giinther (2007)showed that an increase of the mass load of the ICP by a factor of 16(crater diameter from 30 to 120 um) led to a decrease in certain inten-sity ratios (e.g., Cu/Ca) up to 25%. This effect is element dependentand most severe for elements with low boiling points (e.g., Cu,Zn, Ag,Cd and Pb). Fig. 4 shows the effect of changing spot sizes (16-120 um)and laser repetition rates (8-20 Hz) on the normalized element (Cu,Zn, Rb, Sr, Ba and Pb)/Ca ratios in NIST SRM 610 and GSE-1G by using193 nm excimer LA-ICP-MS and 257 nm fs-LA-ICP-MS. To bettercompare the results between different elements, we normalized theelement ratios for different crater sizes and frequencies to the 16 um spot size measurement conditions for both LA systems. To eliminate thelaser-induced elemental fractionation effect on element/Ca ratios, weadopted a line scanning ablation mode at a speed of 10 um/s. In agreement with the observations by Kroslakova and Guinther(2007), the ratios of Cu/Ca,Zn/Ca,Rb/Ca and Pb/Ca by 193 nm excimerLA of NIST SRM 610 decrease gradually with increasing spot sizes from16 um to 120 um (increasing mass load) (Fig.4a). Unlike NIST SRM610, the mass load induced matrix effects are negligible for GSE-1G atthe small spot sizes of 16-32 um, where the ratios of Cu/Ca, Zn/Ca, Rb/Ca and Pb/Ca are similar (Fig.4b). In general, the decrease in theseelement/Ca ratios is less than 20% for an increase of the mass load by afactor of 56.3 (crater diameter from 16 to 120 um). In great contrast,the Sr/Ca and Ba/Ca ratios are almost not effected by a change ofthe mass load in 193 nm excimer LA of both NIST SRM 610 andGSE-1G. These results demonstrate that the mass load effect is matrix dependent, which deteriorates the capabilities of 193 nm excimerLA-ICP-MS at high spatial resolution analyses. In fs-LA analysis, themass load effects for these elements are much smaller, and the massload differences between NIST SRM 610 and GSE-1G are reduced. 3.3. Effect of the laser fluence The characteristics of laser ablation and particle generation arestrongly related to the energy deposited at the target surface (Diwakaret al., 2014). The fluence is often recognized as a major parameteraffecting elemental fractionation when ns and fs pulses are used(Cromwell and Arrowsmith, 1995; Figg and Kahr, 1997; Mao et al.,1998; Bian et al., 2006; Koch et al., 2006; Garcia et al., 2008), and thisphenomenon is emphasized when low fluences, especially close to theablation threshold, are delivered to the sample. In Fig. 5, the effect of 1.50 GSE-1G 0.50 Fig. 2. 140Ce signal intensity as a function of crater area for single hole ablation on NISTSRM 610 and GSE-1G by using 193 nm excimer LA-ICP-MS and 257 nm fs-LA-ICP-MS. laser fluences on the calculated elemental fractionation indexes for 56elements at a spot size of 24 um in 193 nm excimer LA-ICP-MS and fs-LA-ICP-MS is shown. The discrepancies among the calculated elementalfractionation indexes are not significant under the selected laser fluencerange (5.05-19.0 J/cm²and 1.71-4.10 J/cm²for ns-or fs-laser pulses,respectively) (Fig.5). In the case of ns-LA-ICP-MS, the calculated frac-tionation indexes for Sb, Pb and Bi in NIST SRM 610 remain constantat these different laser fluences, whereas, they increase significantlywith increasing laser fluences from 5.05 J/cm² to 19.0 J/cm² in GSE-1G(Fig. 5a and b). The calculated elemental fractionation indexes of theseelements are closer to each other in NIST SRM 610 and GSE-1G at higherlaser fluences (larger than 9.49 J/cm²), respectively (Fig. 5a and b). Wetherefore recommend using high laser fluence to determine these ele-ments in silicate materials when matrix-matched calibration standardsare not available. For fs-LA measurements, the fractionation indexes ofZn and Cd are closer to 1 at high laser fluences (Fig.5c and d); however,elemental fractionation is still significant. The differences in thefractionation indexes for Pb and Bi between NIST SRM 610 and 0.12 Fig.3. Variation of the Zn/Ca and Pb/Ca ratios with time during single spot ablation of NISTSRM 610 and GSE-1G at different spot sizes in 257 nm fs-LA-ICP-MS. GSE-1G are still significant at these different laser fluences. Thus,matrix-matched calibration standards are essential for accurate analysisof these elements in silicates by using fs-LA-ICP-MS. The greatest strength of the LA-ICP-MS technique is its application tomicrosampling, in which extremely small pits are obtained. In thisstudy, a spot size of 24 um was used to test the capabilities of LA-ICP-MS analysis at high spatial resolution. We determined 48 elementconcentrations in MPI-DING glasses (KL2-G, ML3B-G, StHs6/80-G andT1-G),USGS basalt glasses (BCR-2G and BHVO-2G), USGS new syntheticglasses (GSD-1G and GSE-1G) and synthetic NIST SRM soda-lime glassNIST SRM 612 using NIST SRM 610 as an external reference materialand Ca as an internal standard by 193 nm excimer LA-ICP-MS and257 nm fs-LA-ICP-MS (Table 2a, 2b,2c). Fig. 6 shows the relative devia-tions of the determined average concentrations in these geologicalreference glasses in this study from the reference values. It can beseen from Fig. 6a that the relative deviations of the major elements(e.g.,Na20,Al203,SiO2, K20, MnO and FeO) and some trace elements(e.g., Li, V, Co, Ni, Cu, Zn, Ga, Rb, Cs and U) are usually consistently be-yond 10% for most of the MPI-DING glasses, USGS basalt glasses andUSGS new synthetic glasses with the use of 193 nm excimer LA-ICP-MS. Whereas, the results of most elements in NIST SRM 612 agreewell with the reference values within 10% relative deviation. This canbe well explained by the previous reported differences of the elementalfractionation indexes between NIST SRM 610 and GSE-1G at the spotsize of 24 um in 193 nm excimer LA-ICP-MS (Fig. 1). These results sug-gest that GSE-1G and GSD-1G reference glasses are more suitable thanNIST SRM 610 and NIST SRM 612 as external reference materials fornatural silicate materials at high spatial resolution analysis. However,it should be noted that GSE-1G and GSD-1G have relatively highanalytical uncertainties for some elements (e.g., Li, Be, B, P, Cr, Cu, Ga,Ta,W) (Jochum et al., 2005). More accurate calibration values ofthese elements in the GSE-1G and GSD-1G, especially from definitivemethods, are needed. Geochemical applications using LA-ICP-MS oftenuse NIST SRM 61X as external reference materials and naturally occur-ring elements of Si and Ca for internal standardization. To improve theaccuracies of these elements in silicate materials when using NIST Fig. 4. Element/Ca abundance ratios of six elements obtained from the investigation of NIST SRM 610 and GSE-1G by 193 nm excimer and 257 nm fs laser systems. For these experiments,different spot sizes, different frequencies, and line scan analysis have been chosen. These data are normalized to the 16 um spot size measurements.Due to the maximum crater diameter of65 um in fs laser, a high mass is essential for investigating the mass-loading effect. Therefore, line scanning ablation (10 pm/s scan speed) at 44 and 60 um crater diameters with a highrepetition rate of 20 Hz were used in fs-LA-ICP-MS, which are represented by 90* and 120* on the x-axis, respectively. Error bars represent the standard deviation (1 s) from 3measurements. 5 SRM 61X as external reference materials, the choice of Si for internalstandardization in the analysis of these elements is recommended. For fs-LA analysis, the observed discrepancies in Fig. 6a disappearand the agreement between our data and the reference values is betterthan 10% for most of the elements in these geological reference glasses(Fig.6b). The accuracies of the determined element concentrations forthe MPI-DING glasses and USGS glasses (basalt and synthetic) are signif-icantly improved compared to the results obtained by 193 nm excimerLA-ICP-MS.Only several elements, such as Zn and Pb, show a systembias due to the matrix dependent fractionation. The concentrationsof B are always higher than the reference values by a factor of~20%-110% (Table 2a, 2b, 2c), which could be partly attributed to thelarge uncertainty of the reference value of B in NIST SRM 610, asdemonstrated by the high uncertainty of 16% (Jochum et al., 2011).Large relative deviations of other trace elements could potentiallybe due to heterogeneous element distribution (e.g., Cr for ML3B-G(Jochum et al., 2006)) and their abundances being close to low limitdetection (e.g., Be, Cs, W). As shown in Fig.7, the RSD values of traceelements are plotted versus their concentrations at the spot size of24 um in fs-LA-ICP-MS. The data are obtained from 12 replicatedanalyses performed on different locations of the reference glasses. Theanalytical precision is less than 15% for most of these elements provided their concentrations are higher than 1ugg. There is a significant neg-ative correlation between logarithmic concentration and logarithmicRSD, with correlation coefficients being -0.70. This expected trendof decreasing RSD with increasing concentration for these glassesindicates that the analytical precision follows counting statistics(Luo et al., 2007), and thus, most of the measurement uncertainty isanalytical in origin and not due to chemical heterogeneities. 3.5. Determination of trace elements by 100% oxide normalization Since a summed-spectrum normalization calibration procedure todetermine elements in alloys by LA-ICP-MS was first explored byLeach and Hieftje (2002), a calibration method without applying inter-nal standardization has been applied to analyze the major and traceelements of silicate glasses, silicate minerals, silicate whole-rocks,metal oxides and carbonate minerals (Halicz and Giinther, 2004;Guillong et al., 2005; Liu et al., 2008, 2010; Chen et al., 2011; Li et al.,2011). This approach not only decreases costs and workload from deter-mining the internal standard by an independent method (e.g., electronmicroprobe), but also expands the applications of LA-ICP-MS. Byapplying 100% oxide normalization and calibration using NIST SRM610 reference material, we calibrated the same data obtained from Fig. 6. Relative deviations of average concentrations in the reference glasses obtained in this study from reference values calibrated against NIST SRM 610 and Ca internal standardization atthe small spot size of 24 um by using 193 nm excimer LA-CP-MS (a) and 257 nm fs-LA-CP-MS (b). The reference values of element concentrations are from Jochum et al.(2011) for NISTSRM 610-612, from Jochum et al. (2006) for MPI-DING reference glasses and from the GeoReM database (http://georem.mpch-mainz.gwdg.de/) for USGS basalt reference glasses andsynthetic USGS reference glasses. 193 nm excimer LA-ICP-MS and fs-LA-ICP-MS spot analysis (24 um) inthe MPI-DING, USGS and NIST glasses (Fig. 8; Table 2a,2b,2c). The calculated element concentrations of Na2O,Al203,SiO2,MnO,FeO, Li, V, Co, Ni, Cu, Zn, Ga, Rb, Cs, U in MPI-DING and USGS glassesusing 100% oxide normalization are in general agreement with thereference values within 10% when using 193 nm excimer LA-ICP-MS.Whereas, the calculated element concentrations of Sc, TiO2, Sr, Y, Zr,Hf, Th and REE in these glasses are lower than the reference values by Fig. 7. Concentration versus relative standard deviation (RSD) for the determinedelements obtained from fs-LA-ICP-MS spot analysis (24 um) on different locations of theMPI-DING, USGS and NIST glasses (n=12). approximately 10-40% (Fig. 8a; Table 2a,2b,2c). A similar phenomenonhas been observed by Liu et al. (2008) during 193 nm excimer LA-ICP-MS analysis, which has been attributed to the NIST SRM 610-specificmatrix effect. To overcome this problem, Liu et al. (2008) suggestedusing multiple reference glasses (BCR-2G, BHVO-2G and BIR-1G) asreference materials for external calibration. It is apparent from Fig. 8b that the analytical results of these refer-ence glasses using 100% oxide normalization calibration strategy andNIST SRM 610 as an external reference material in fs-LA-ICP-MS leadto much more accurate results compared to the ns-LA analysis (Fig. 6aand 8a). Except for the several transition elements and those elementswith concentrations close to detection limit, the determined values ofmost of the elements agree well with the reference values within 10%uncertainty. However, a system bias still exists for the element concen-trations of Zn and Pb. This can be explained by the difference betweentheir element fractionation behavior in NIST SRM 610 and GSE-1G(Fig. 1). For fs-LA-ICP-MS analysis, our results demonstrate thatusing NIST SRM 610 as an external reference material in combinationwith 100% oxide normalization calibration strategy is suitable for themulti-element analysis of natural silicate materials. 4. Conclusions Our results indicate that the significantly different fractionationbehaviors of Li, Na, Si, K, V, Cr, Mn, Fe, Co, Ni, Cu, Rb, Cs and U betweensilicate glass materials NIST SRM 610 and GSE-1Gobserved in 193 nmexcimer LA-ICP-MS are eliminated by using 257 nm fs-LA-ICP-MS athigh spatial resolution. However, Zn, Cd, Pb and Bi are exceptionsbecause their matrix dependent effects in fs-LA-ICP-MS are muchmore serious than that in 193 nm excimer LA-ICP-MS. In comparisonwith ns-LA-ICP-MS, the mass load effect and matrix dependent mass load effect are also found to be reduced by using fs-LA-ICP-MS. For193 nm excimer LA, NIST SRM 610 is an unsuitable external referencematerial for analyses of natural silicates due to its much less significantlaser-induced elemental fractionation for Li, Na, Si, K, V, Cr, Mn, Fe, Co,Ni, Cu, Rb, Cs and U compared to natural silicate materials at high spatialresolution analysis. This NIST SRM 610-specific matrix effect for theseelements can be minimized by using Si as an internal standard for thedetermination of these elements or replacing NIST SRM 610 with GSE-1G as an external reference material. By using 257 nm fs-LA-ICP-MS,the NIST SRM 610-specific matrix effect disappears and NIST SRM 610can be adopted as an ideal external reference material for the analysisof natural silicate materials. The determined values of most elementsin MPI-DING and USGS glasses agree well with the reference valueswithin 10% uncertainty at a spot size of 24 um by using fs-LA-ICP-MS.The much smaller laser-induced elemental fractionation, matrix effectand mass load effect in fs-LA-ICP-MS compared with 193 nm excimerLA-ICP-MS make it more suitable for the analysis of silicate materialsat high spatial resolution. Acknowledgments We would like to thank Donald Dingwell and anonymous reviewersfor their constructive comments. We also thank Klaus Peter Jochum forproviding MPI-DING reference glasses. This research is supported by theNational Natural Science Foundation of China (Grants 41273030,41322023, 41373026, and 41173016), the Fundamental ResearchFunds for National Universities, the CERS-China Equipment and Educa-tion Resources System (CERS-1-81), the State Administration of the For-eign Experts Affairs of China (B07039), and the MOST Special Fund fromthe State Key Laboratories of Geological Processes and MineralResources (Grant No. GPMR201106) ( References ) Arrowsmith, P., 1987. Laser ablation of solids for elemental analysis by inductivelycoupled plasma mass spectrometry. Anal. Chem. 59,1437-1444. Bian, Q, Garcia, C.C., Koch,J., Niemax, K., 2006. Non-matrix matched calibration of majorand minor concentrations of Zn and Cu in brass, aluminium and silicate glass usingNIR femtosecond laser ablation inductively coupled plasma mass spectrometry.J. Anal. At. Spectrom. 21, 187-191. Chen, L., Liu, Y.S., Hu, Z.C., Gao, S., Zong, K.Q., Chen, H.H., 2011. Accurate determinations offifty-four major and trace elements in carbonate by LA-ICP-MS using normalizationstrategy of bulk components as 100%. Chem. Geol.284,283-295. Cromwell, E.F., Arrowsmith, P., 1995. Semiquantitative analysis with laser ablationinductively coupled plasma mass spectrometry. Anal. Chem. 67, 131-138. ( Czas,J., Jochum, K . P., Stoll, B. , Weis, U., Yang, Q .C., Jacob, D.E., Andreae, M.O., 2012. I n vestig a tion of matrix effects in 193 nm laser ablation -i n d u ctively cou p led plasma- m as s s p e ctro metr y a nalys is u s in g r e f e r ence g l as ses of d if f er e nt t ra n s paren c i e s. . Spectro c h im . Acta B At. Spectros c . 78 , 20 - 28. ) D'Abzac, F.X., Seydoux-Guillaume, A.M., Chmeleff, J., Datas, L., Poitrasson,F., 2012. In situcharacterization of infra red femtosecond laser ablation in geological samples. PartB: the laser induced particles. J. Ana. At. Spectrom. 27, 108-119. Diwakar,P.K., Gonzalez,JJ., Harilal, S.S., Russo, R.E., Hassanein, A., 2014. Ultrafast laser ab-lation ICP-MS: role of spot size, laser fluence, and repetition rate in signal intensityand elemental fractionation. J. Anal. At. Spectrom. 29,339-346. Donohue, P.H., Simonetti,A., Neal, C.R., 2012.Chemical characterisation of natural ilmenite:a possible new reference material. Geostand. Geoanal. Res. 36,61-73. Eggins, S.M., Kinsley, L.P.J., Shelley, J.M.G., 1998. Deposition and element fractionationprocesses during atmospheric pressure laser sampling for analysis by ICP-MS. Appl.Surf. Sci. 127, 278-286. ( F e rnandez, B . , Claverie, F. , Pecheyran, C . , Donard, O.F., 2 0 07. Di r ec t a n a ly si s of s o li d s am ple s b y fs- L A- I C P- M S. Tren d s A nal. Ch em . 2 6,9 51 -9 66 . ) ( F i gg, D., Kahr, M.S., 1997. El eme n ta l f ra ction a tio n of g lass usi n g lase r abla t ion i n d uctivel y coup l ed p l asma m a ss s p e c tromet r y. A p p l. Spect r os c . 51, 1 1 85-1 1 92. ) ( F ryer, B.J., Jackson, S .E., Longerich, H . P., 1 9 95. The d e s i gn , o p e r a t i on an d rol e of th e l ase r - a blation m icropro b e coupled with a n in d uctively coupl ed pla s ma- m a s s s pe c trome t er ( L A M- I C P-MS ) i n t h e eart h s c ie nc es. C a n . Mineral. 3 3, 30 3-403 . ) ( Gao, S., Liu, X.M., Yuan, H.L., Hattendorf, B ., Giinther, D., Chen, L., Hu, S.H. , 2002. Det e r m i na- t i on o f for t y tw o m a j or a n d t rac e elements i n U SG S a n d N IS T S R M glasses by l as er ab lat i o n -i nduc t i v e l y c ou p l ed p lasm a- ma s s spe ctro me tr y. Ge o st and. Ne ws le tt . 2 6 , 1 81 -1 9 6 . ) ( Garcia, C.C., Lindner, H., von B ohlen, A . , Vadla, C . , Niemax, K. , 2008. Elem e nt a l f r a ction a ti o n and s toichi o m e tri c s amp li n g i n f emt o seco n d lase r a bl a ti on. J . Anal . A t . S p ec t ro m . 2 3 ,4 70 -47 8 . ) Glaus, R., Kaegi, R., Krumeich, F., Giinther, D., 2010. Phenomenological studies on struc-ture and elemental composition of nanosecond and femtosecond laser-generatedaerosols with implications on laser ablation inductively coupled plasma massspectrometry. Spectrochim.Acta B At. Spectrosc. 65,812-822. Gonzalez, J., Liu, C.Y., Mao, X.L., Russo, R.E., 2004.UV-femtosecond laser ablation-ICP-MSfor analysis of alloy samples. J.Anal.At. Spectrom. 19, 1165-1168. Gray, A.L., 1985. Solid sample introduction by laser ablation for inductively coupledplasma source mass spectrometry. Analyst110, 551-556. Guillong, M., Horn, I., Giinther, D., 2003. A comparison of 266 nm, 213 nm and 193 nmproduced from a single solid state Nd: YAG laser for laser ablation ICP-MS. J. Anal.At. Spectrom. 18,1224-1230. Guillong, M., Hametner, K., Reusser, E., Wilson, S.A., Gunther, D., 2005. Preliminarycharacterisation of new glass reference materials (GSA-1G, GSC-1G, GSD-1G andGSE-1G) by laser ablation-inductively coupled plasma-mass spectrometry using193 nm, 213 nm and 266 nm wavelengths. Geostand. Geoanal.Res. 29, 315-331. Giinther,D., Hattendorf, B., 2005. Solid sample analysis using laser ablation inductivelycoupled plasma mass spectrometry.Trends Anal. Chem. 24,255-265. Giinther, D., Heinrich, C.A., 1999. Enhanced sensitivity in laser ablation-ICP massspectrometry using helium-argon mixtures as aerosol carrier. J. Anal. At.Spectrom.14,1363-1368. Giinther, D., Frischknecht, R., Heinrich, C.A., Kahlert, H.J., 1997. Capabilities of an argonfluoride 193 nm excimer laser for laser ablation inductively coupled plasma massspectrometry microanalysis of geological materials. J. Anal. At. Spectrom. 12, 939-944. Halicz, L., Giinther, D., 2004. Quantitative analysis of silicates using LA-ICP-MS with liquidcalibration.J.Anal. At. Spectrom. 19, 1539-1545. Hattendorf, B., Latkoczy, C., Guinther, D., 2003.Peer reviewed: laser ablation-ICPMS.Anal.Chem. 75, 341 A-347 A. Hirata, T., Miyazaki, Z., 2007. High-speed camera imaging for laser ablation process: forfurther reliable elemental analysis using inductively coupled plasma-mass spectrom-etry. Anal. Chem. 79,147-152. Hu, Z.C., Liu, Y.S., Chen, L., Zhou, L., Li, M., Zong, K.Q., Zhu, L.Y., Gao, S., 2011. Contrastingmatrix induced elemental fractionation in NIST SRM and rock glasses during laser ab-lation ICP-MS analysis at high spatial resolution. J. Anal. At. Spectrom. 26, 425-430. Jackson, S.E., Pearson, N.J., Griffin, W.L., Belousova, E.A., 2004. The application oflaser ablation-inductively coupled plasma-mass spectrometry to in situ U-Pb zircongeochronology. Chem. Geol.211,47-69. jochum, K.P., Willbold, M., Raczek, I., Stoll, B., Herwig, K., 2005. Chemical characterisationof the USGS reference glasses GSA-1G, GSC-1G, GSD-1G, GSE-1G, BCR-2G, BHVO-2Gand BIR-1G Using EPMA, ID-TIMS, ID-ICP-MS and LA-ICP-MS. Geostand. Geoanal.Res.29,285-302. Jochum, K.P., Stoll, B., Herwig, K., Willbold, M., Hofmann, A.W., et al., 2006. MPI-DINGreference glasses for in situ microanalysis: new reference values for element concen-trations and isotope ratios. Geochem. Geophys. Geosyst. 7 (http://dx.doi:10.1029/2005GC001060). Jochum, K.P., Stoll, B., Herwig, K., Willbold, M., 2007. Validation of LA-ICP-MS traceelement analysis of geological glasses using a new solid-state 193 nm Nd: YAGlaser and matrix-matched calibration. J. Anal. At. Spectrom. 22, 112-121. .At.sP Jochum, K.P., Weis, U., Stoll, B., Kuzmin, D., Yang, Q.C., Raczek, I., Jacob, D.E., Stracke, A.,Birbaum,K., Frick, D.A.,Giinther, D., Enzweiler, J., 2011. Determination of referencevalues for NIST SRM 610-617 glasses following ISO guidelines. Geostand. Geoanal.Res. 35,397-429. Jochum, K.P., Scholz, D., Stoll, B., Weis, U., Wilson, S.A., Yang, Q.C., Schwalb, A., Borner, N.,Jacob, D.E., Andreae, M.O., 2012. Accurate trace element analysis of speleothems andbiogenic calcium carbonates by LA-ICP-MS. Chem. Geol. 318,31-44. Jochum, K.P., Stoll, B., Weis, U., Mertz-Kraus, R., Andreae, M.O., 2014. Non-matrix-matched calibration for the multi-element analysis of geological and environmentalsamples using 200 nm femtosecond LA-ICP-MS: a comparison with nanosecondlasers. Geostand. Geoanal. Res.38,265-292. Koch,J., Giinther, D., 2007. Femtosecond laser ablation inductively coupled plasma massspectrometry: achievements and remaining problems. Anal. Bioanal. Chem.387,149-153. Koch, J.,Lindner, H., Bohlen Von,A., Hergenroder, R., Niemax, K., 2005. Elemental fraction-ation of dielectric aerosols produced by near-infrared femtosecond laser ablation ofsilicate glasses. J. Anal. At. Spectrom. 20, 901-906. Koch, J., Walle, M., Pisonero,J., Guinther, D., 2006. Performance characteristics of ultra-violet femtosecond laser ablation inductively coupled plasma mass spectrometryat~265 and ~200 nm. J. Anal. At. Spectrom. 21,932-940. Kosler, J., 2007. Laser ablation ICP-MS-a new dating tool in Earth science. Proc.Geol.Assoc. 118, 19-24. Kosler, J., Wiedenbeck, M., Wirth, R., Hovorka, J., Sylvester, P., 2005. Chemical andphase composition of particles produced by laser ablation of silicate glass andzircon-implications for elemental fractionation during ICP-MS analysis. J. Anal.At.Spectrom. 20, 402-409. Kroslakova, I., Giinther, D., 2007. Elemental fractionation in laser ablation-inductivelycoupled plasma-mass spectrometry: evidence for mass load induced matrix effectsin the ICP during ablation of a silicate glass. J. Anal. At. Spectrom. 22,51-62. Kurosawa, M., Shima, K., Ishii, S., Sasa, K., 2006. Trace element analysis of fusedwhole-rock glasses by laser ablation-ICP-MS and PIXE. Geostand. Geoanal. Res. 30,17-30. Leach, A.M., Hieftje, G.M., 2002. Identification of alloys using single shot laser ablationinductively coupled plasma time-of-flight mass spectrometry.J. Anal. At. Spectrom.C17,852-857. Li, M., Hu, Z.C., Gao, S., Liu, Y.S., 2011. Direct quantitative determination of trace elementsin fine-grained whole rocks by laser ablation-inductively coupled plasma-massspectrometry. Geostand. Geoanal. Res. 35,7-22. Liu, C., Mao, X.L., Mao, S.S., Zeng, X., Greif, R., Russo, R.E., 2004. Nanosecond and femtosec-ond laser ablation of brass: particulate and ICPMS measurements. Anal. Chem. 76,379-383. Liu, Y.S., Hu, Z.C.,Gao, S., Guinther, D., Xu,J., Gao, C.G., Chen, H.H., 2008. In situ analysis ofmajor and trace elements of anhydrous minerals by LA-ICP-MS without applying aninternal standard. Chem. Geol.257,34-43. Liu, Y.S., Hu, Z.C., Li, M., Gao, S., 2010. Reappraisement and refinement of zircon U-Pbisotope and trace element analyses by LA-ICP-MS. Chin. Sci. Bull. 55, 1535-1546. Loewen, M.W., Kent, AJ., 2012. Sources of elemental fractionation and uncertainty duringthe analysis of semi-volatile metals in silicate glasses using LA-ICP-MS. J. Anal. At.Spectrom. 27, 1502-1508. Luo, Y., Gao, S., Longerich, H.P., Giinther, D., Wunderli, S., Yuan, H.L., Liu, X.M., 2007. Theuncertainty budget of the multi-element analysis of glasses using LA-ICP-MS.J.Anal. At. Spectrom. 22, 122-130. Mank,A.J., Mason, P.R., 1999. A critical assessment of laser ablation ICP-MS as an analyt-ical tool for depth analysis in silica-based glass samples. J. Anal. At. Spectrom. 14,1143-1153. Mao, X.L., Ciocan, A.C., Russo, R.E., 1998. Preferential vaporization during laser ablationinductively coupled plasma atomic emission spectroscopy. Appl. Spectrosc. 52,913-918. Mertz-Kraus, R., Brachert, T.C., Jochum, K.P.,Reuter, M., Stoll, B.,2009.LA-ICP-MS analyseson coral growth increments reveal heavy winter rain in the Eastern Mediterranean at9 Ma. Palaeogeogr. Palaeoclimatol. Palaeoecol.273,25-40. Ohata,M.,Tabersky, D., Glaus, R., Koch,J., Hattendorf, B.,Guinther, D., 2014. Comparison of795 nm and 265 nm femtosecond and 193 nm nanosecond laser ablation inductivelycoupled plasma mass spectrometry for the quantitative multi-element analysis ofglass materials. J. Anal. At. Spectrom. 29, 1345-1353. Orellana, F.A., Galvez, C.G., Roldan, M.T., Garcia-Ruiz, C., 2013. Applications oflaser-ablation-inductively-coupled plasma-mass spectrometry in chemical analysisof forensic evidence. Trends Anal. Chem. 42,1-34. Poitrasson, F., Chenery, S., Shepherd, T.J., 2000. Electron microprobe and LA-ICP-MS studyof monazite hydrothermal alteration: implications for U-Th-Pb geochronology andnuclear ceramics. Geochim. Cosmochim. Acta 64,3283-3297. Resano, M., Vanhaecke, F., Hutsebaut, D., Corte, K.D.,Moens, L., 2003. Possibilities of laserablation-inductively coupled plasma-mass spectrometry for diamond fingerprinting.J. Anal. At. Spectrom. 18,1238-1242. Russo, R.E., Mao, X.L., Liu, H.C., Gonzalez,J., Mao, S.S., 2002. Laser ablation in analyticalchemistry-areview. Talanta 57, 425-451. Russo, R.E., Suen, T.W., Bol’shakov, A.A., Yoo,J., Sorkhabi, O., Mao, X.L., Gonzalez, J.,Oropeza, D., Zorba, V., 2011. Laser plasma spectrochemistry. J. Anal. At. Spectrom.26,1596-1603. Shaheen, M.E., Gagnon, J.E., Yang, Z., Fryer, B.J., 2008. Evaluation of the analyticalperformance of femtosecond laser ablation inductively coupled plasma massspectrometry at 785 nm with glass reference materials. J. Anal. At. Spectrom. 23,1610-1621. Shaheen, M.E., Gagnon, J.E., Fryer, B.J., 2012. Femtosecond (fs) lasers coupled with mod-ern ICP-MS instruments provide new and improved potential for in situ elementaland isotopic analyses in the geosciences. Chem. Geol. 30, 260-273. Sylvester, P.J., 2008. Laser ablation-ICP-MS in the earth sciences: current practices andoutstanding issues. Mineral. Assoc. Can. Short Course Series 40, 1-348. Wiltsche, H., Giinther, D., 2011. Capabilities of femtosecond laser ablation ICP-MS for themajor,minor, and trace element analysis of high alloyed steels and super alloys. Anal.Bioanal. Chem. 399,2167-2174. 尽管LA-ICP-MS有大量的成功应用,但是元素分离仍然是地球科学应用中的主要局限,这种局限在高空间分辨率分析中尤其突出。本研究采用193nm ArF准分子纳秒(ns)激光器和257nm飞秒(fs)激光剥蚀电感耦合等离子体质谱法,研究了硅酸盐玻璃NIST SRM 610和GSE-1G的元素分离和质量载荷效应。与在ns-LA-ICP-MS中观测到的相反,在fs-LA-ICP-MS中,16-24μm的小粒子的分离效率低于40-60μm的大粒子分离效率。在193nm准分子激光LA-ICP-MS中观察,硅酸盐玻璃材料NIST SRM 610和GSE-1G中的Li、Na、Si、K、V、Cr、Mn、Fe、Co、Ni、Cu、Rb、Cs和U的分离行为存在显著差异,利用257nm fs-LA-ICP-MS在高空间分辨率下消除了这些差异。此外,与ns-LA-ICP-MS相比,fs-LA-ICP-MS的质量负载效应和与基体相关的质量负载效应也有所降低。除Sb、Pb、Bi外,元素分离与所选的激光通量无关,与ns-或fs-LA-ICP-MS无关。在本研究中,选择24μm光斑来测试LA-ICP-MS在高空间分辨率下的分析能力。我们使用fs-LA-ICP-MS对MPI-DING、USGS、NIST玻璃样片中的大部分元素的测试数据与参考值具有一致性,误差小于10%。对于ns激光剥蚀分析,其准确性高度依赖于使用的校准策略(传统的外部校准方法或100%氧化物归一化方法)和选择的外部参考物质(NIST SRM 610或GSE-1G)。与193nm准分子LA-ICP-MS相比,fs-LA-ICP-MS中较少的激光诱导元素分离和基体效应使其更适合于高空间分辨率硅酸盐材料的分析。
确定
还剩11页未读,是否继续阅读?

产品配置单
上海凯来仪器有限公司为您提供《硅酸盐玻璃中多种无机元素检测方案(激光剥蚀进样)》,该方案主要用于其他中多种无机元素检测,参考标准--,《硅酸盐玻璃中多种无机元素检测方案(激光剥蚀进样)》用到的仪器有ESLfemto 飞秒激光剥蚀系统
推荐专场
相关方案
更多
该厂商其他方案
更多