


方案详情
文
The new white paper, which demonstrates the possibilities of studying alluvial sapphires from Australia with cathodoluminescence (CL) imaging. This research shows how cathodoluminescence can help to assess crystallisation histories of the precious gemstones and underlying causes for luminescence.
While being used for a wide range of geological application, including sedimentary petrology, igneous petrology, metamorphic petrology, crystal growth, and gemstone identification, cathodoluminescence is not a common technique to study natural sapphires. However, it is used on zircons frequently to see zircon growth crystallisation, and due to the color zonation in some sapphires, hyperspectral cathodoluminescence was used (together with laser ablation inductively coupled plasma mass spectrometry) to examine zonation and trace element defects to understand the conditions of sapphire formation.
The CL measurements for this research were performed with the SPARC, a cathodoluminescence detector, which was mounted on FEG scanning electron microscope (SEM) from Thermo Fisher Scientific/FEI. The results illustrate a strong correlation between color, trace element concentrations, and spectral CL measurements of sapphires.
方案详情

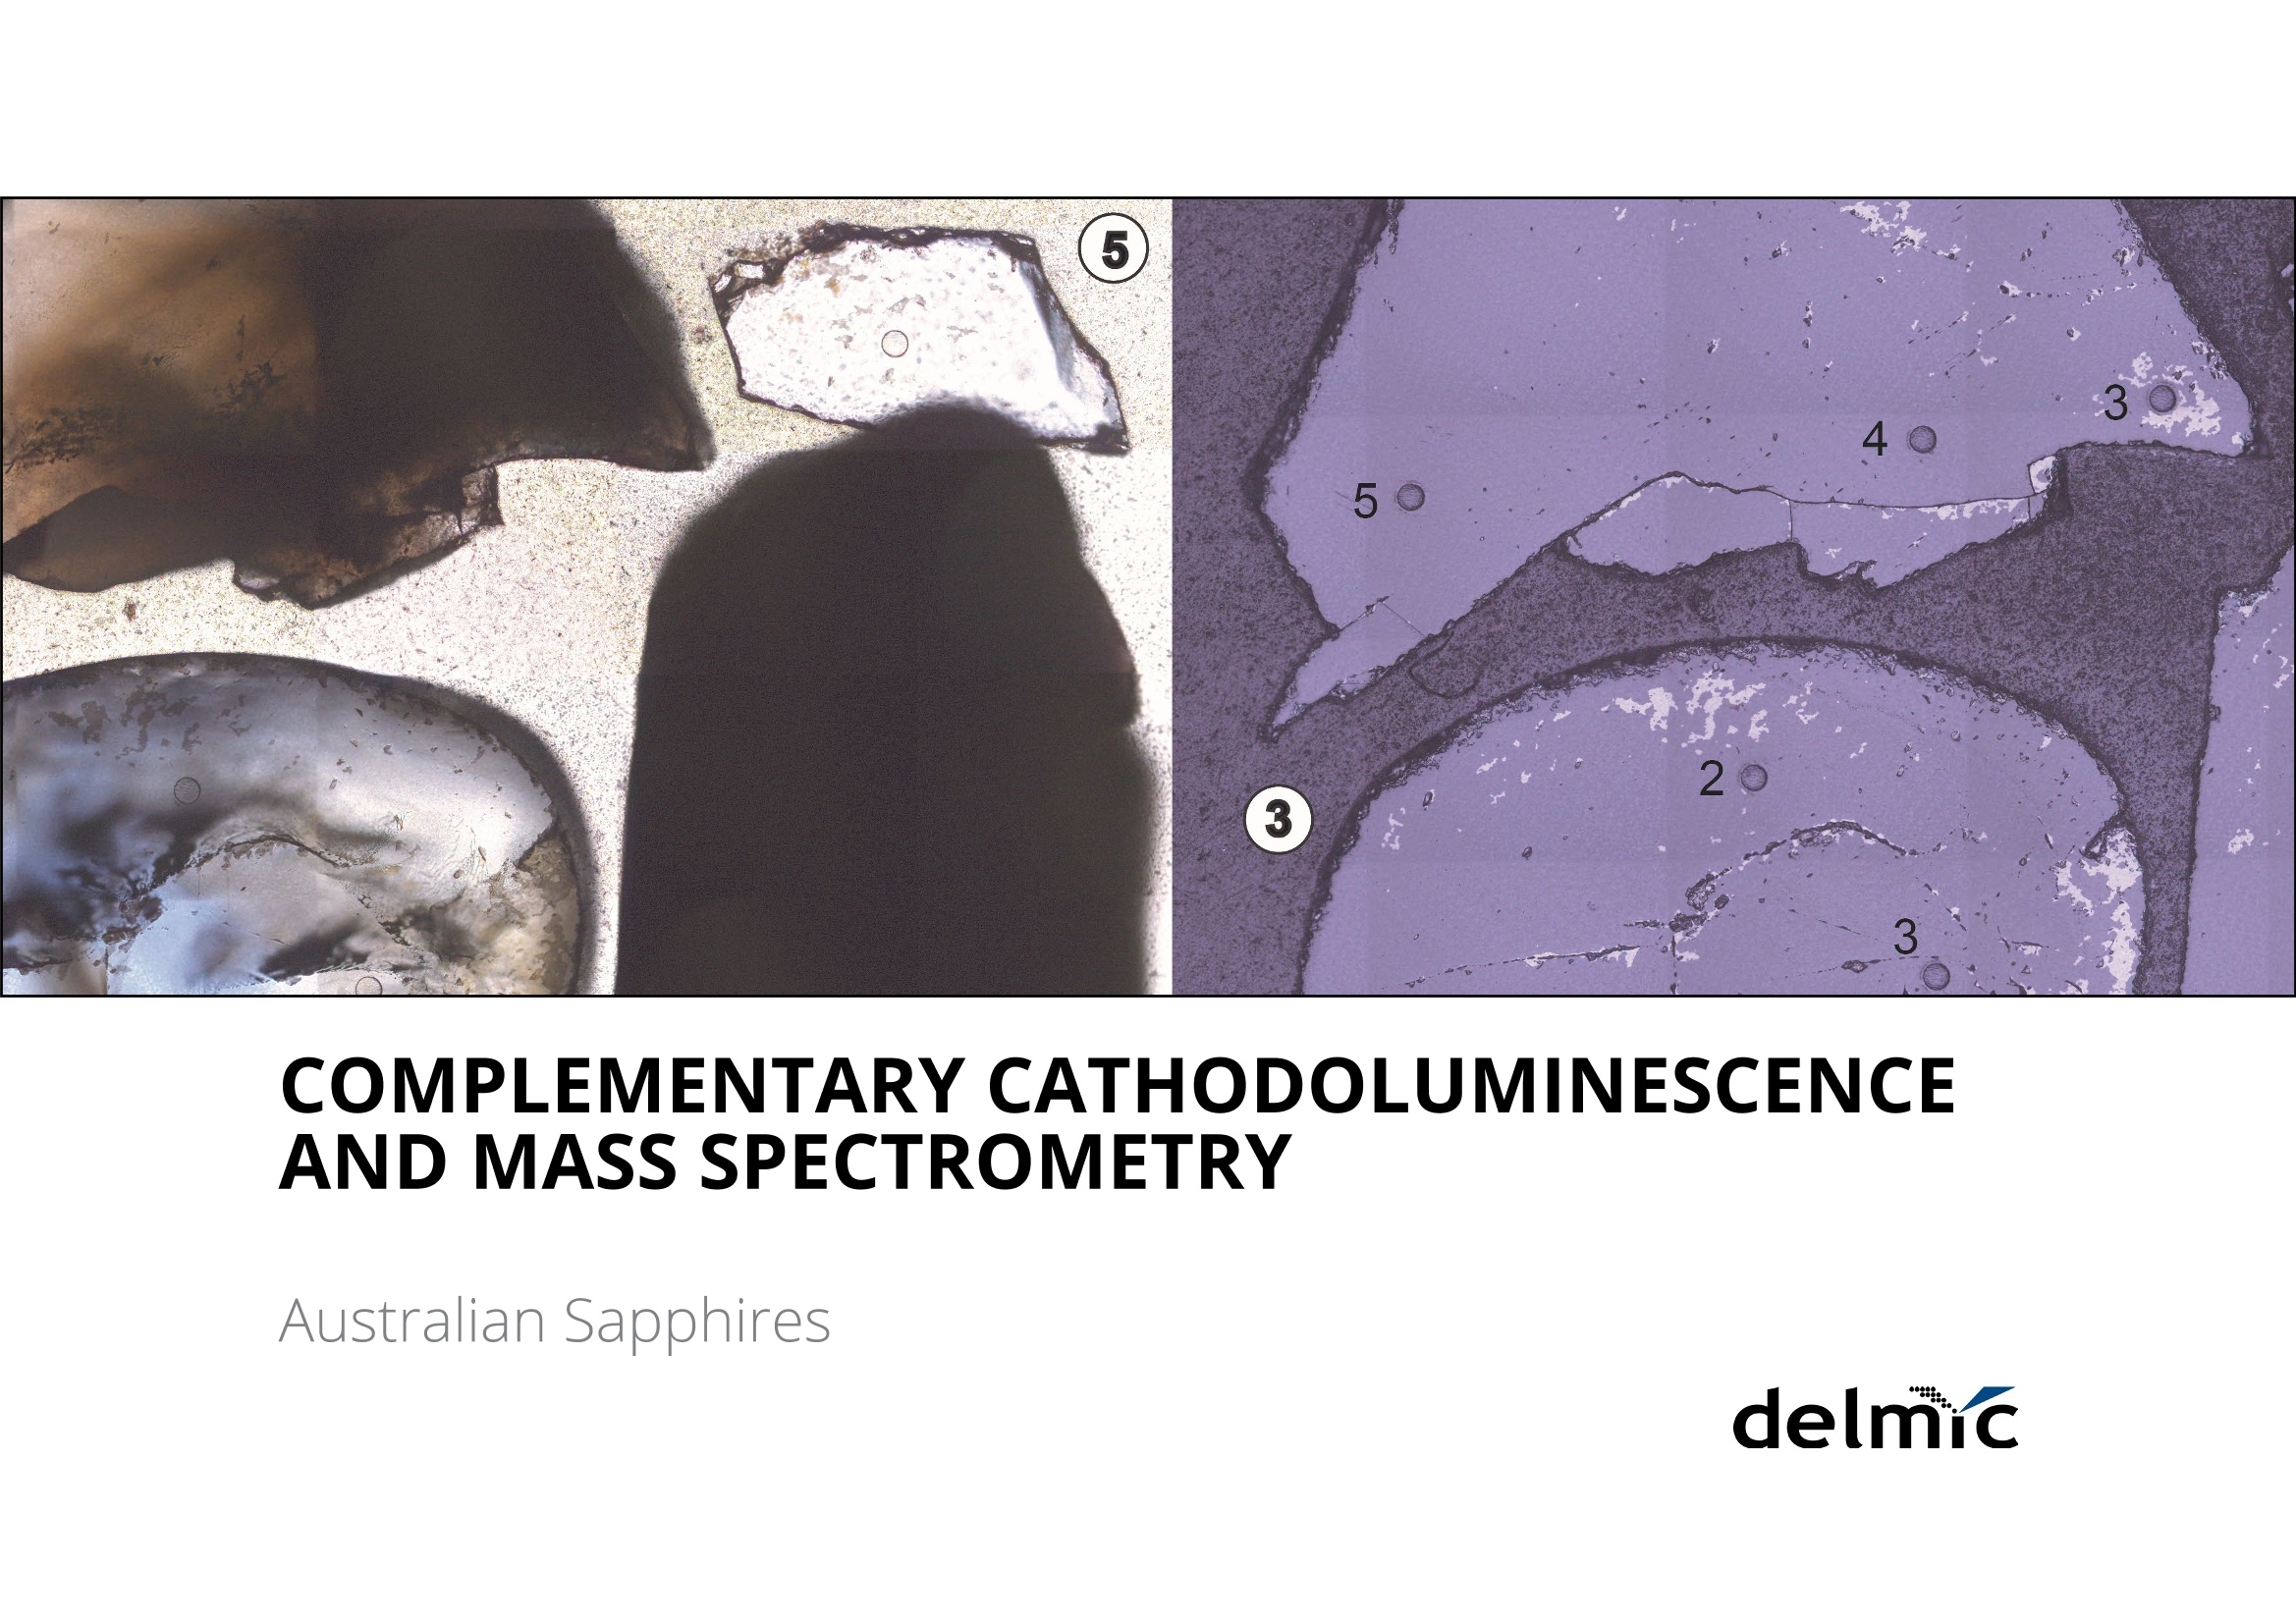
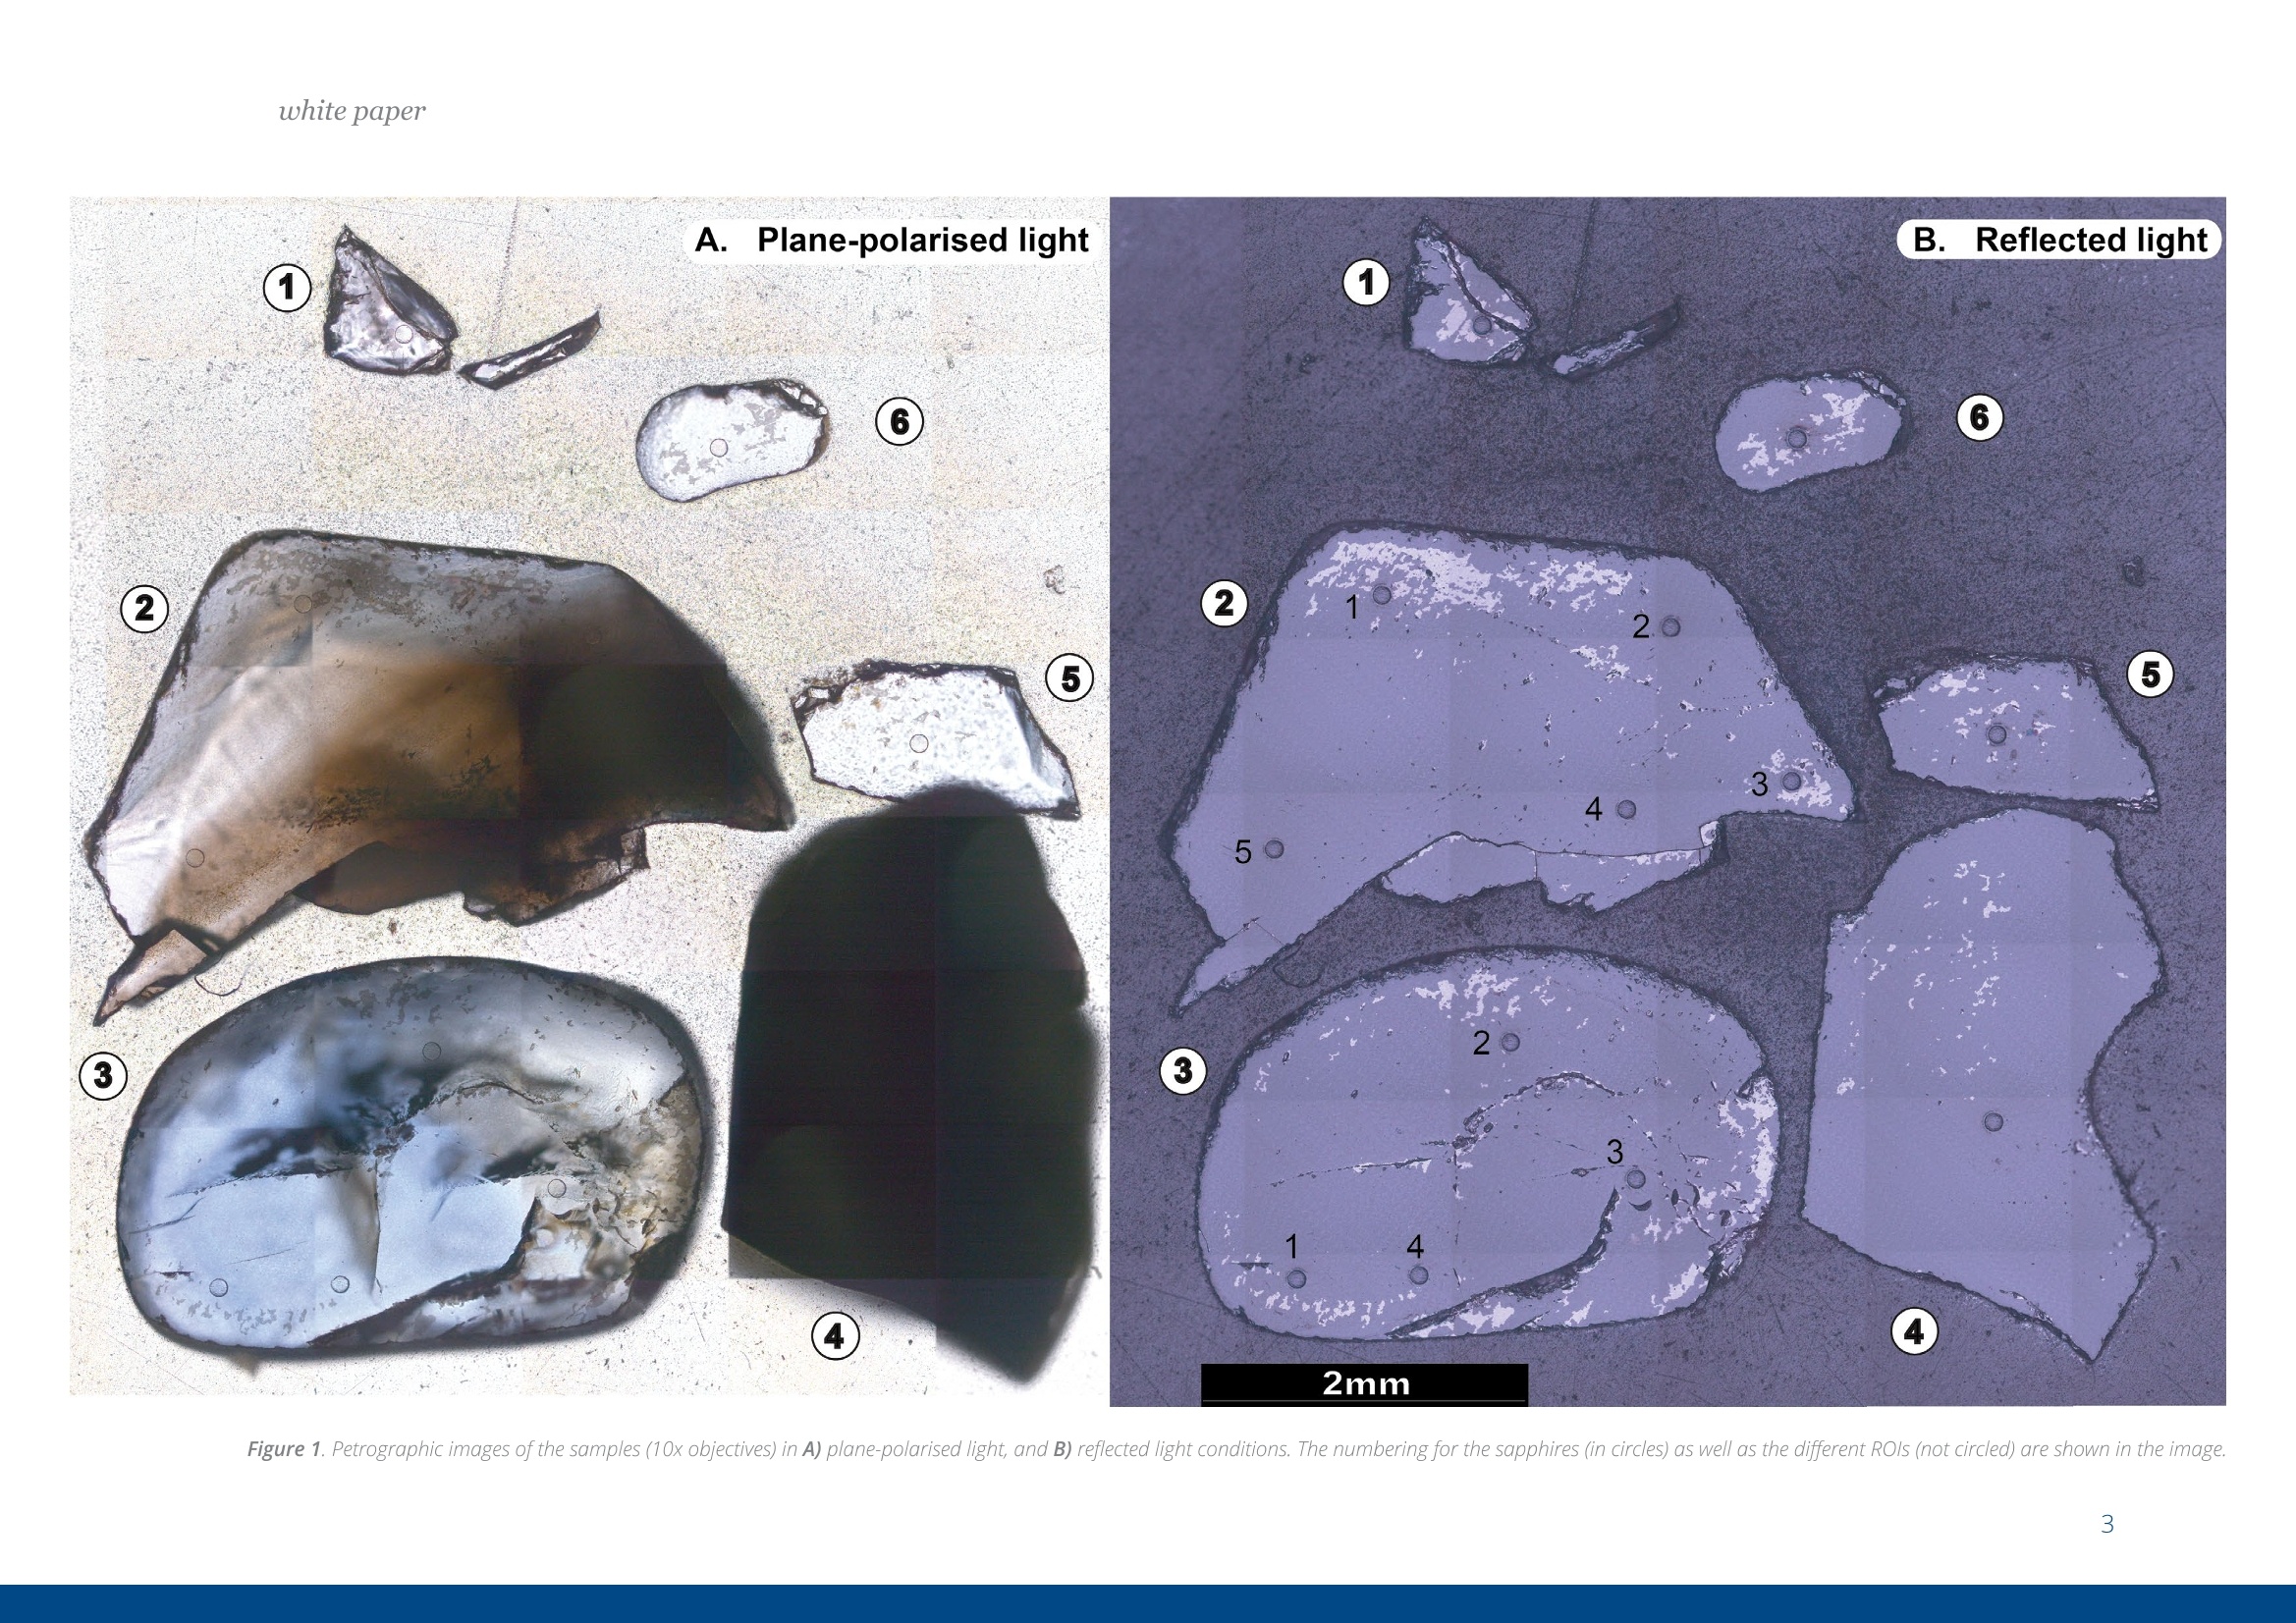
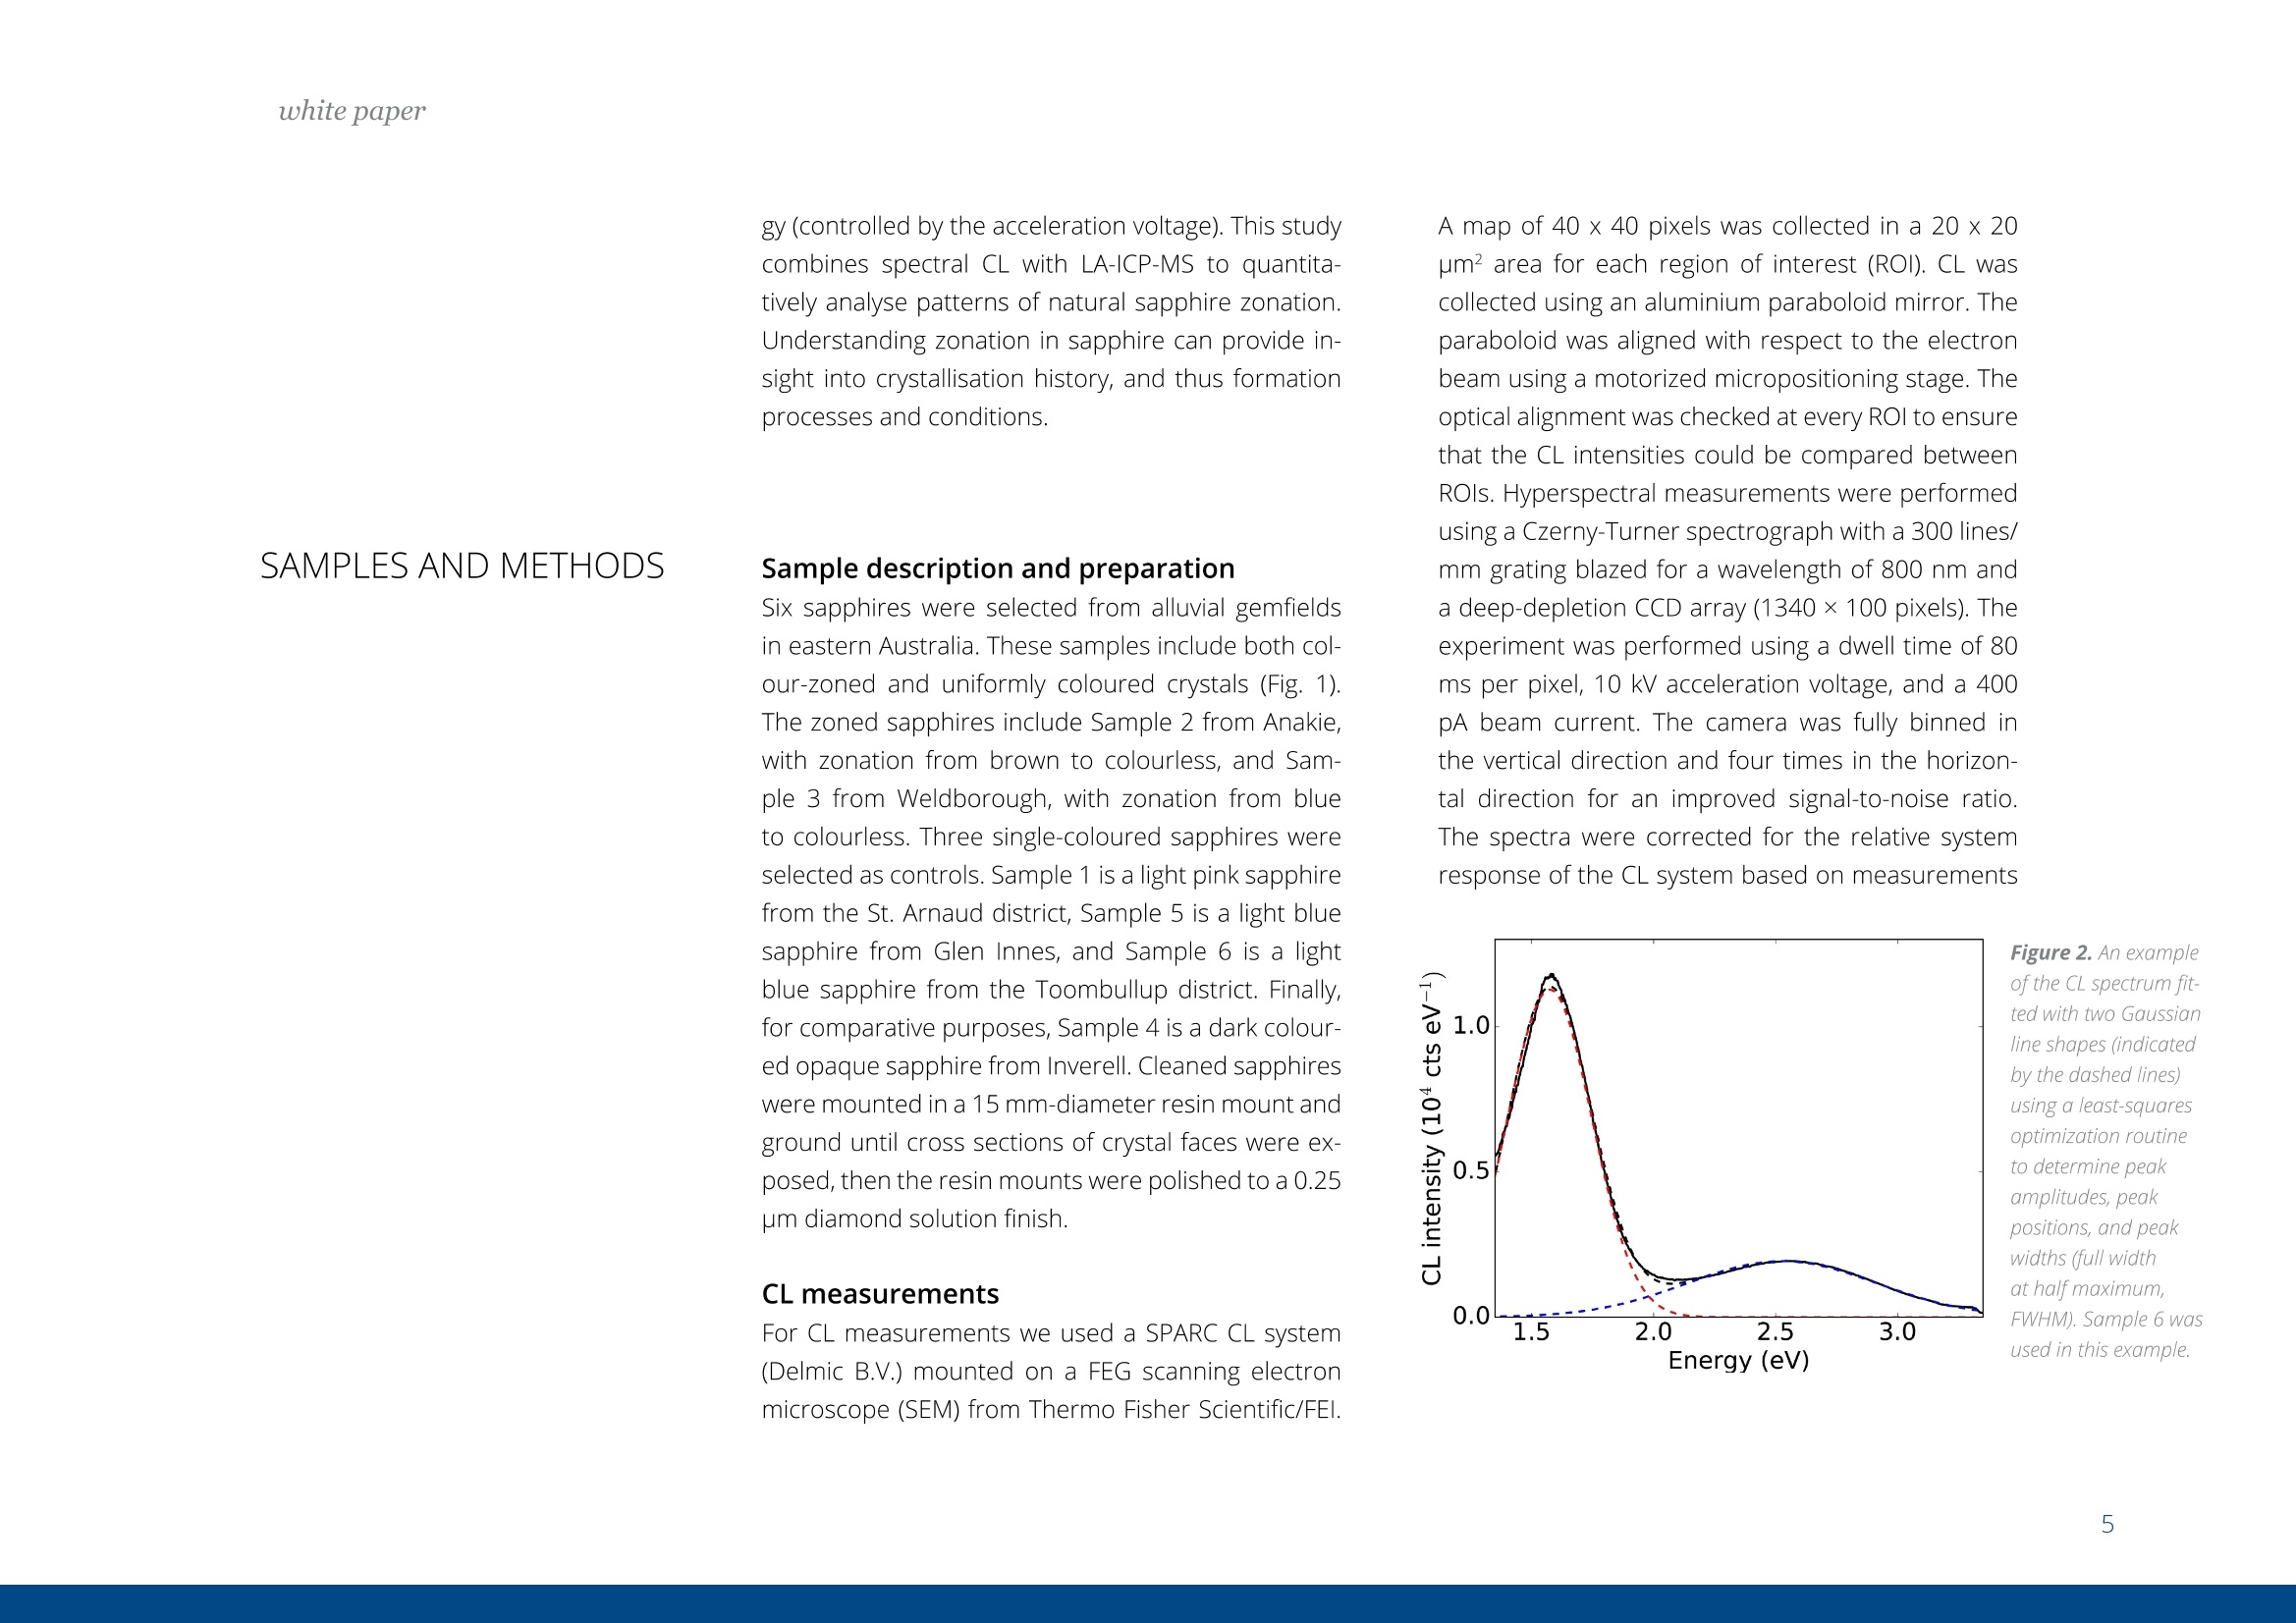
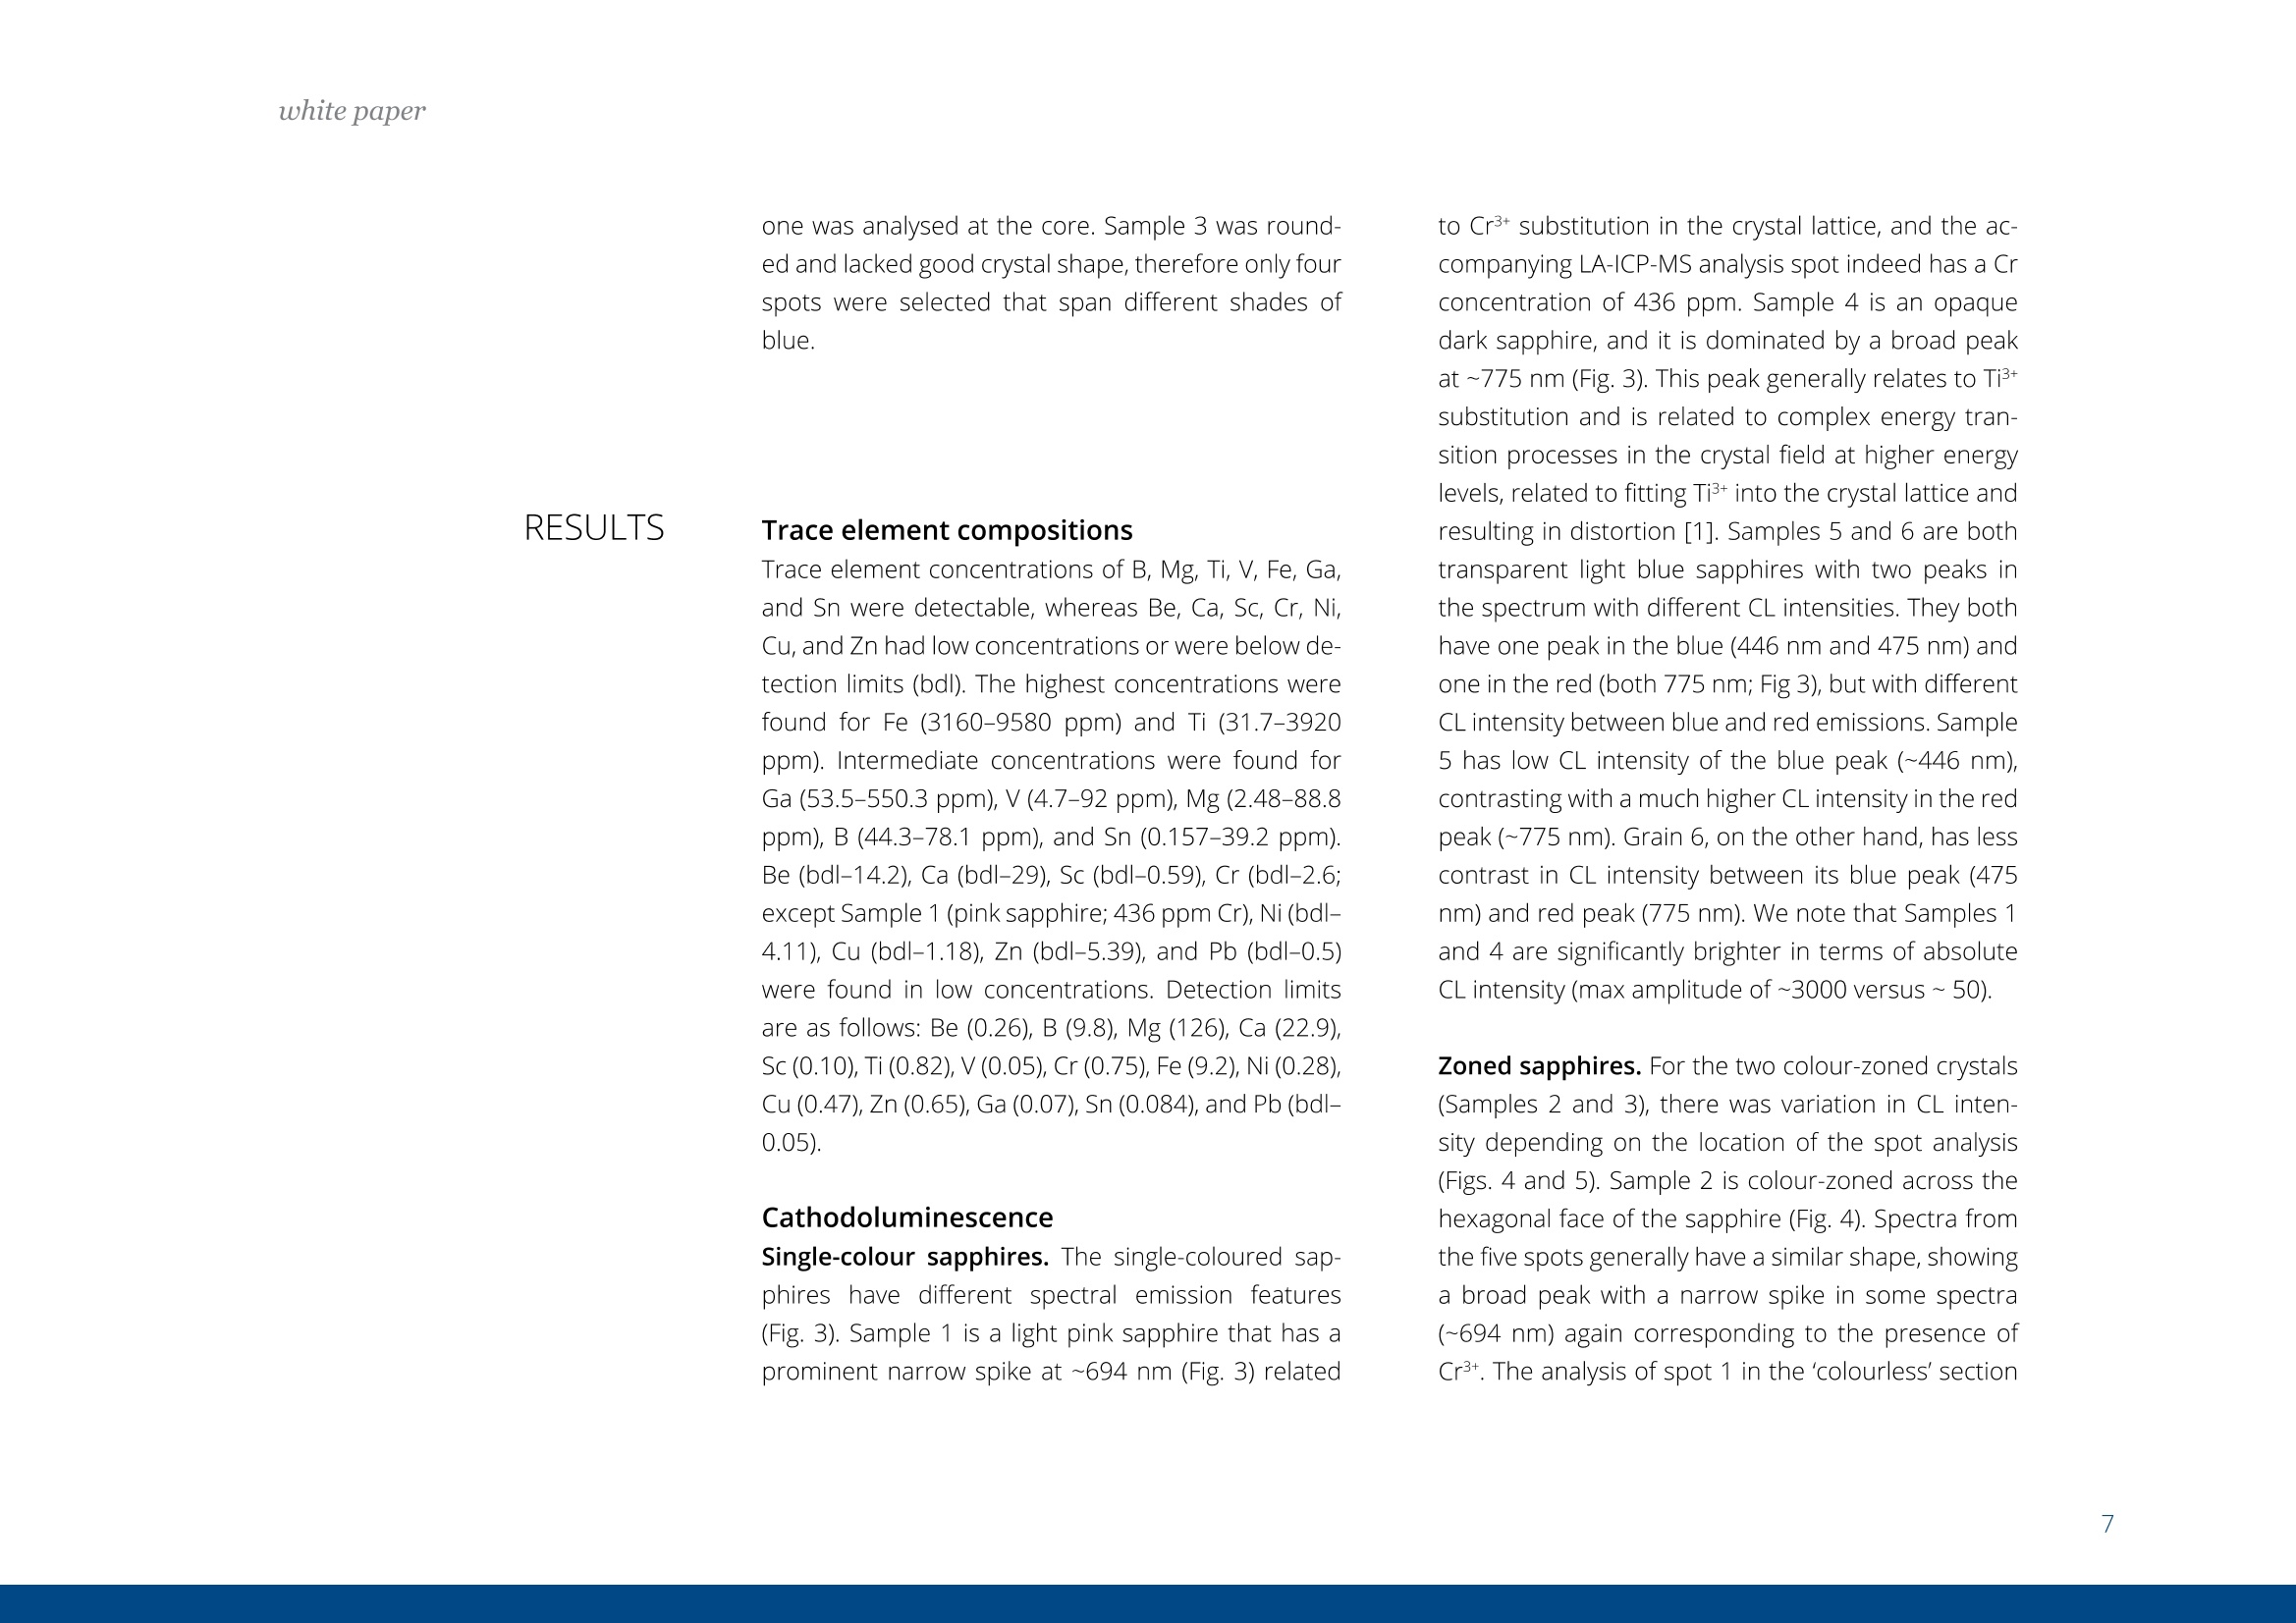
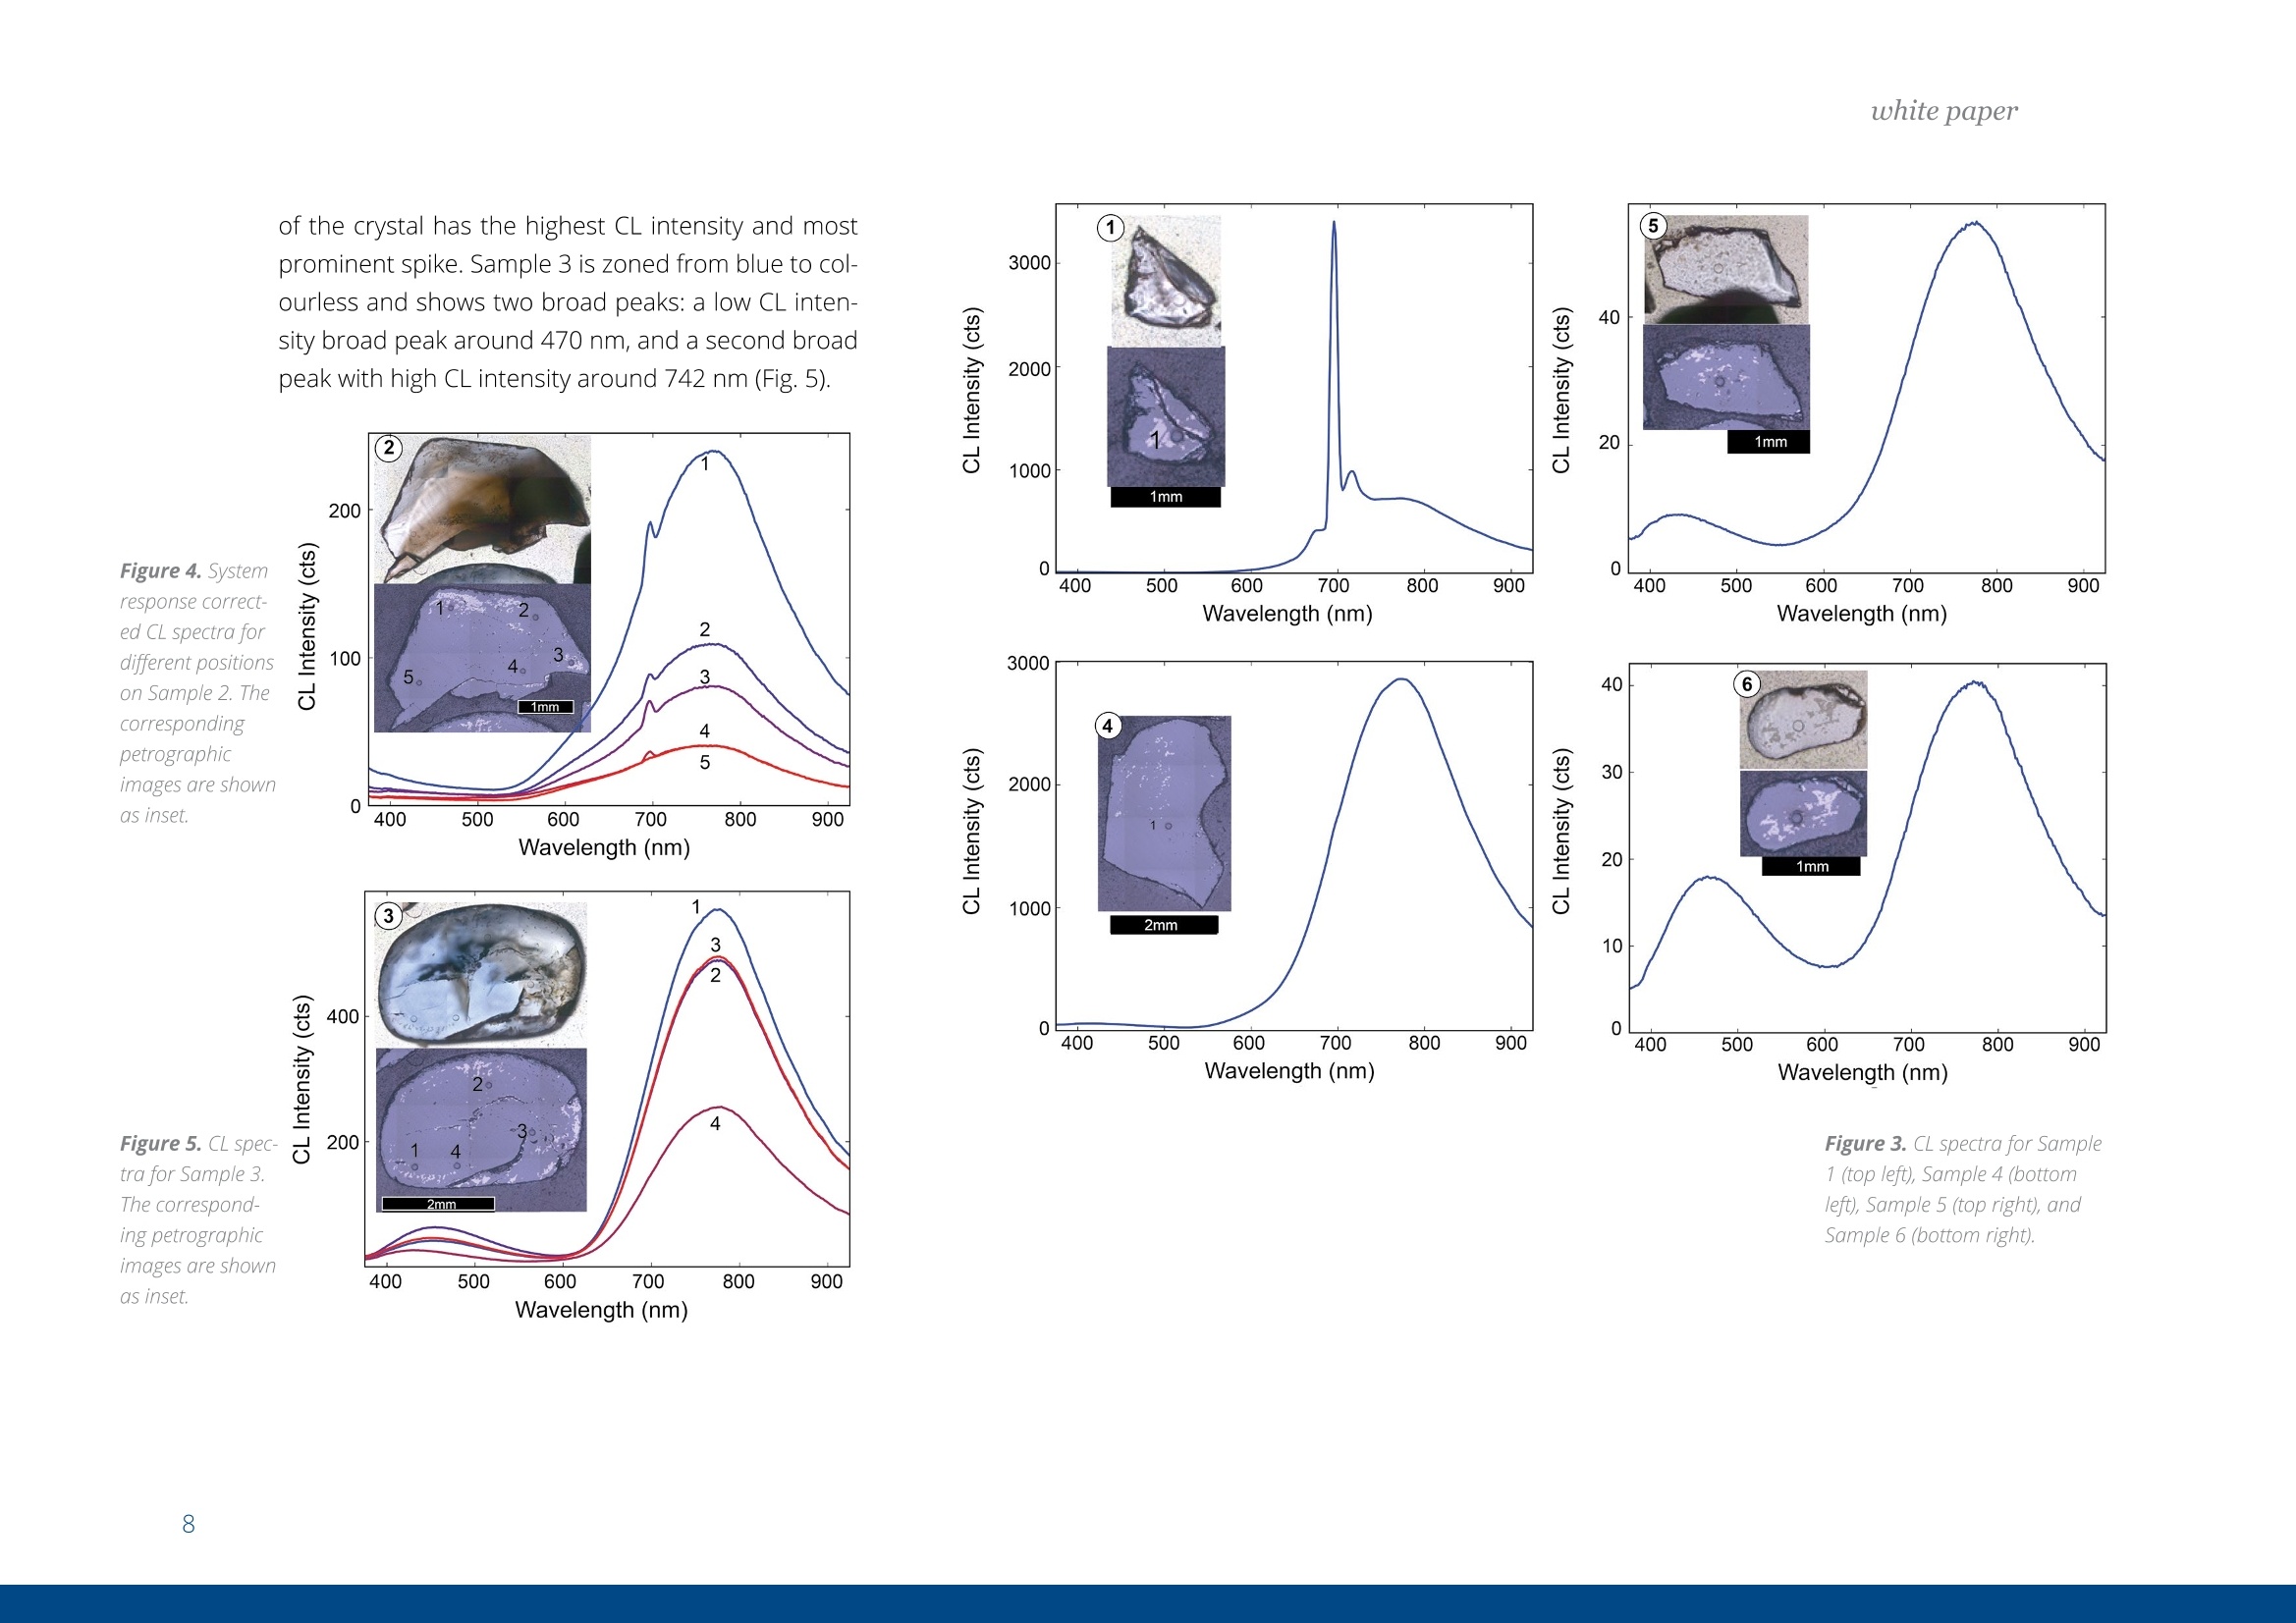
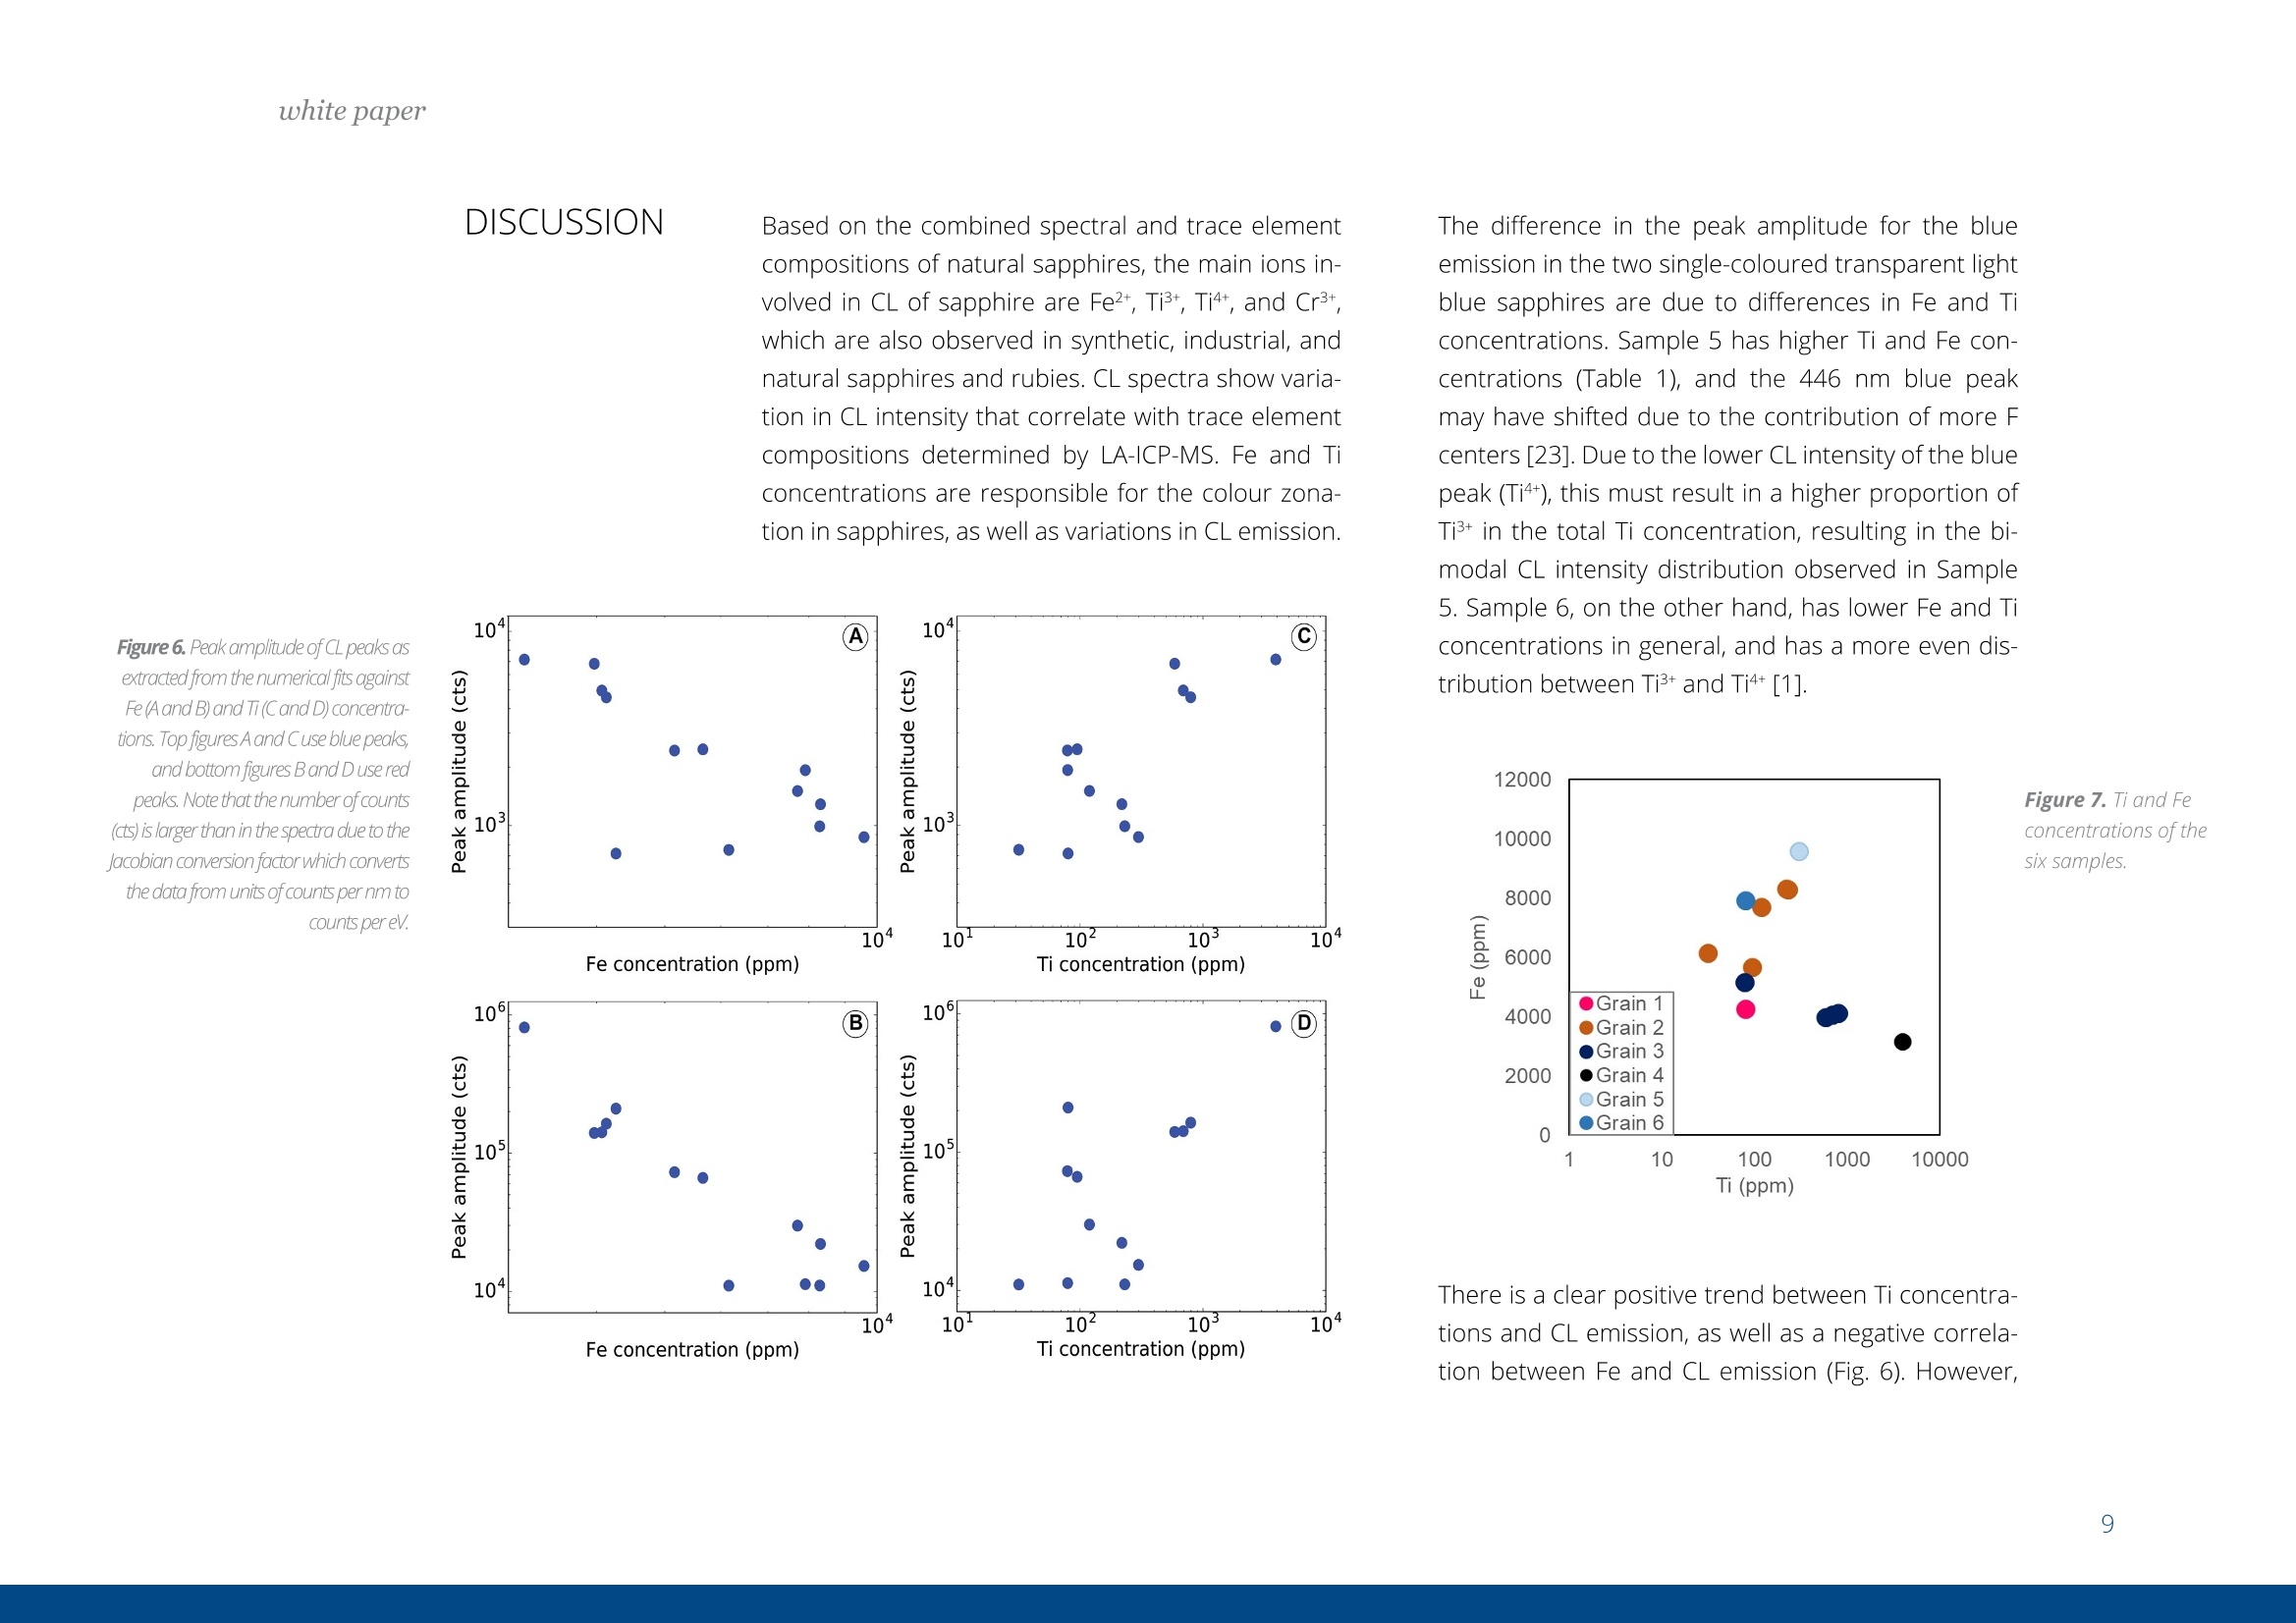
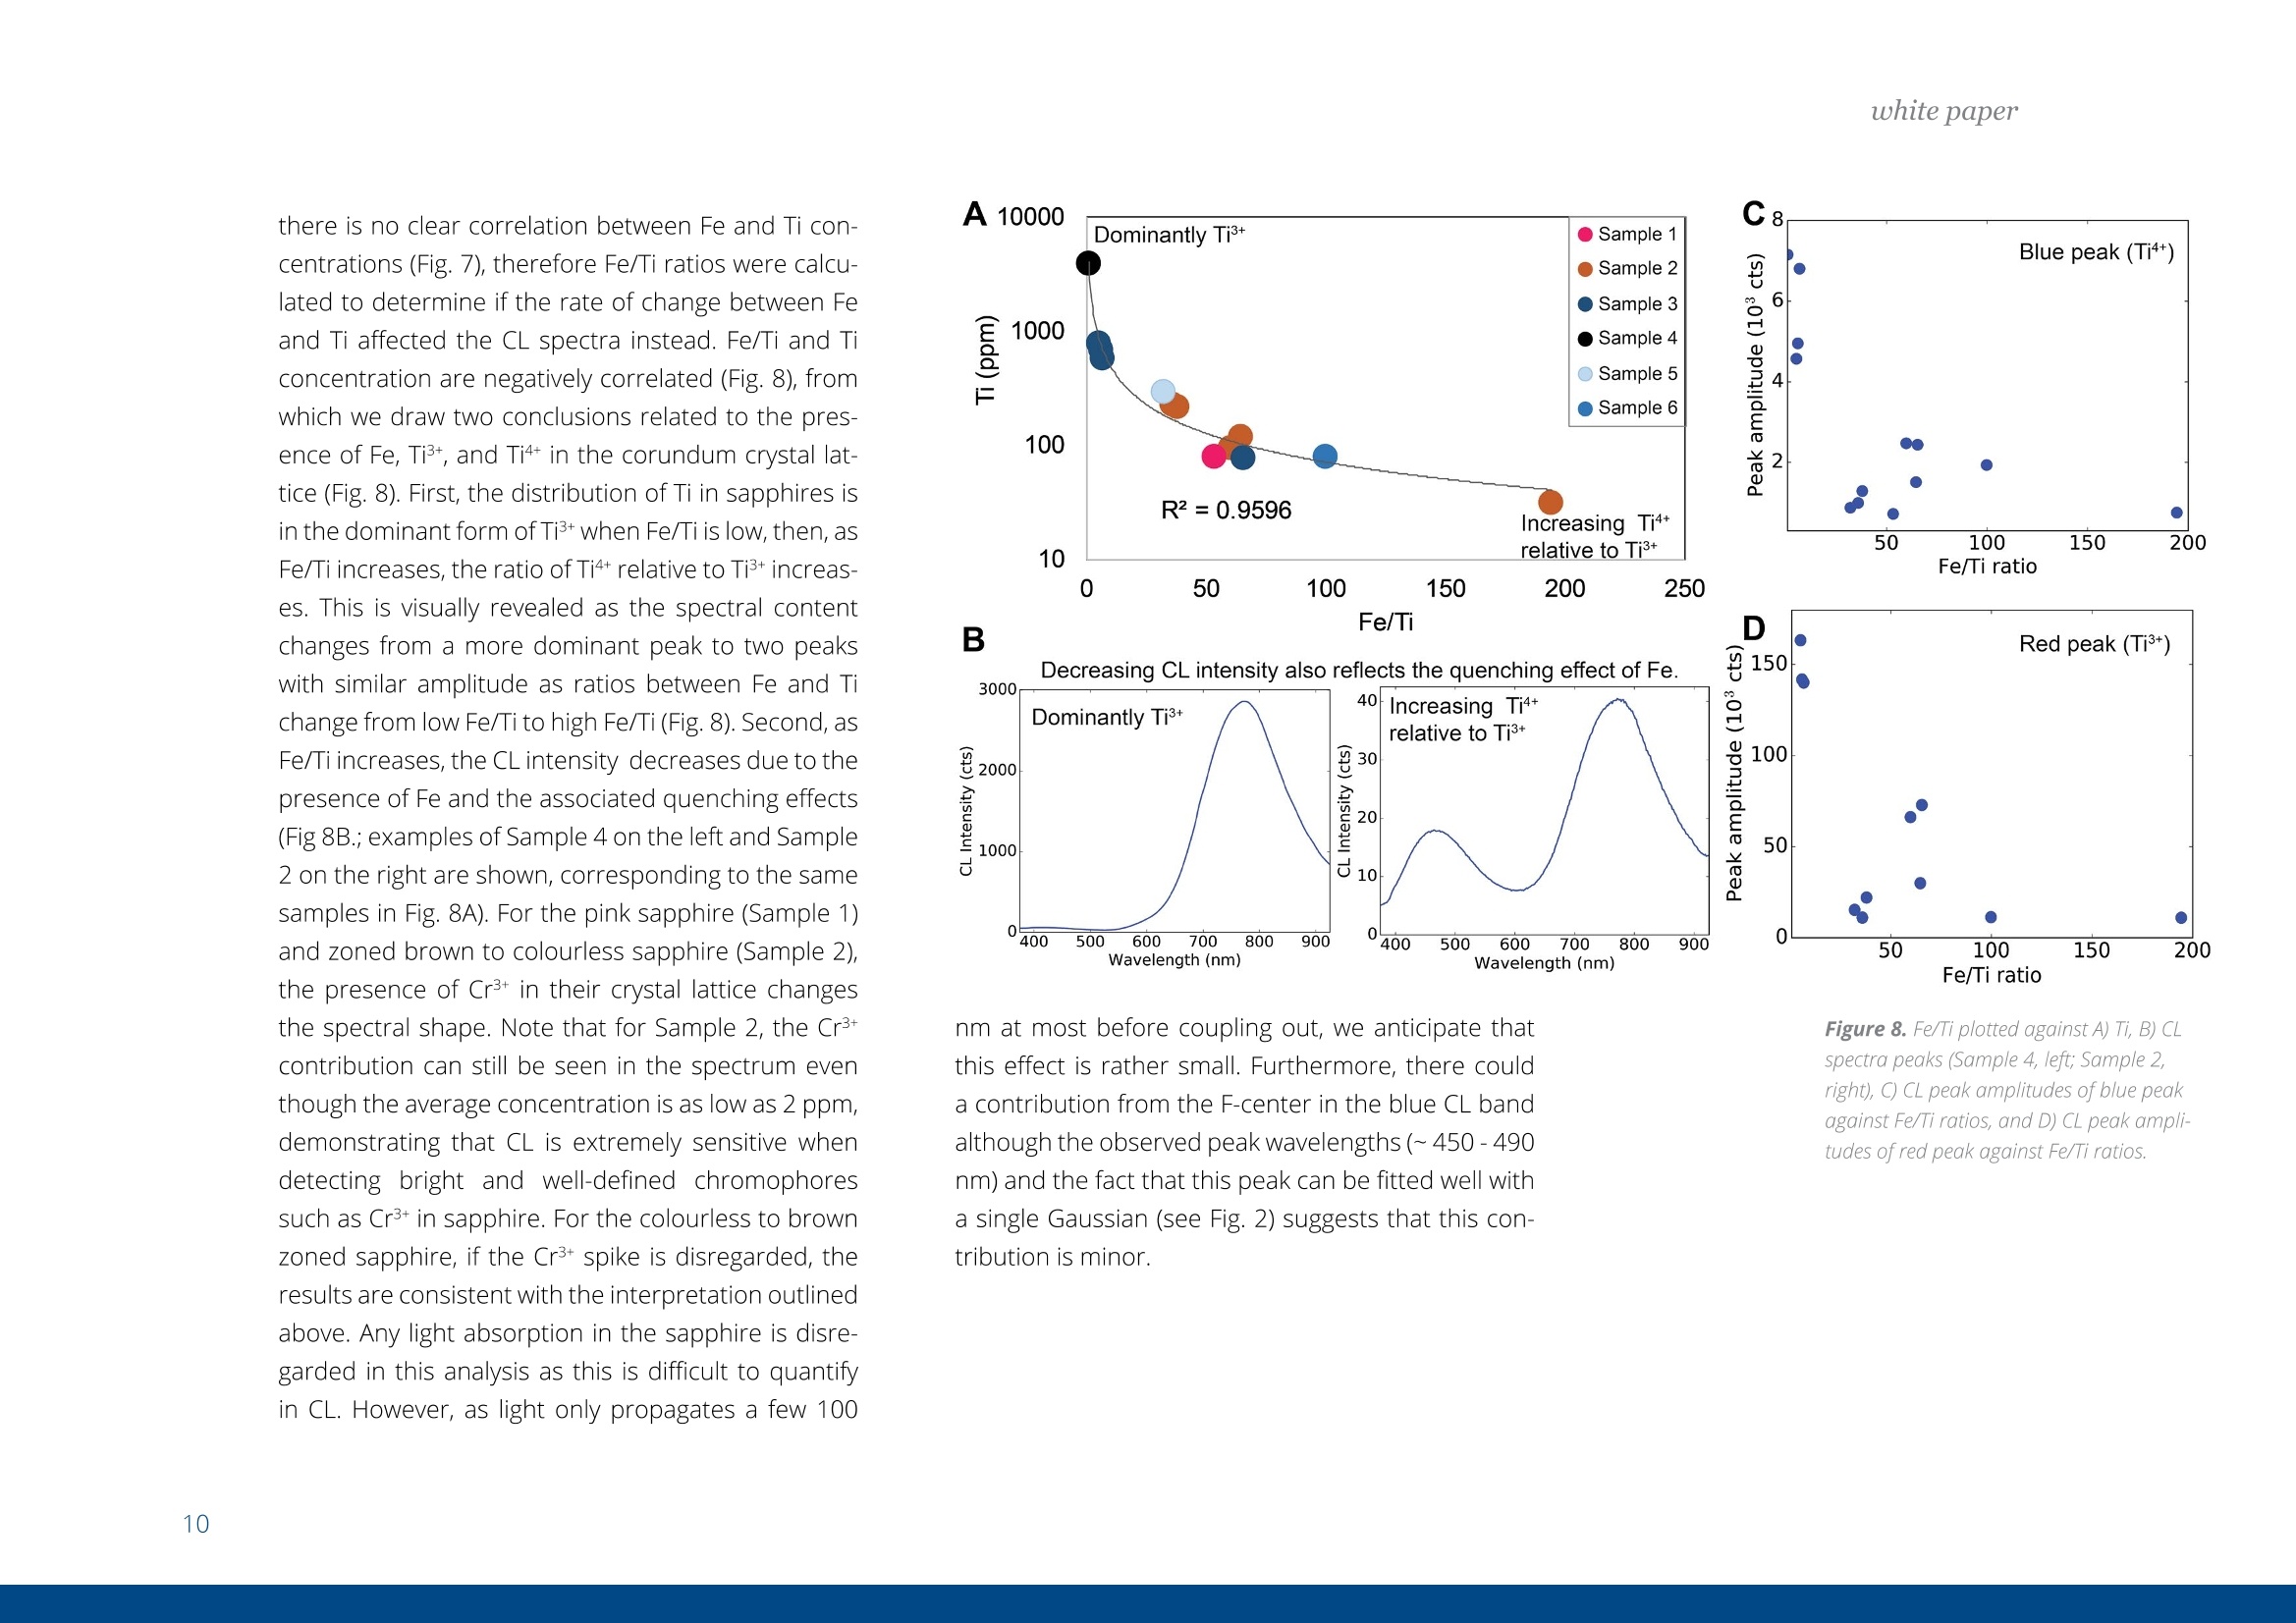
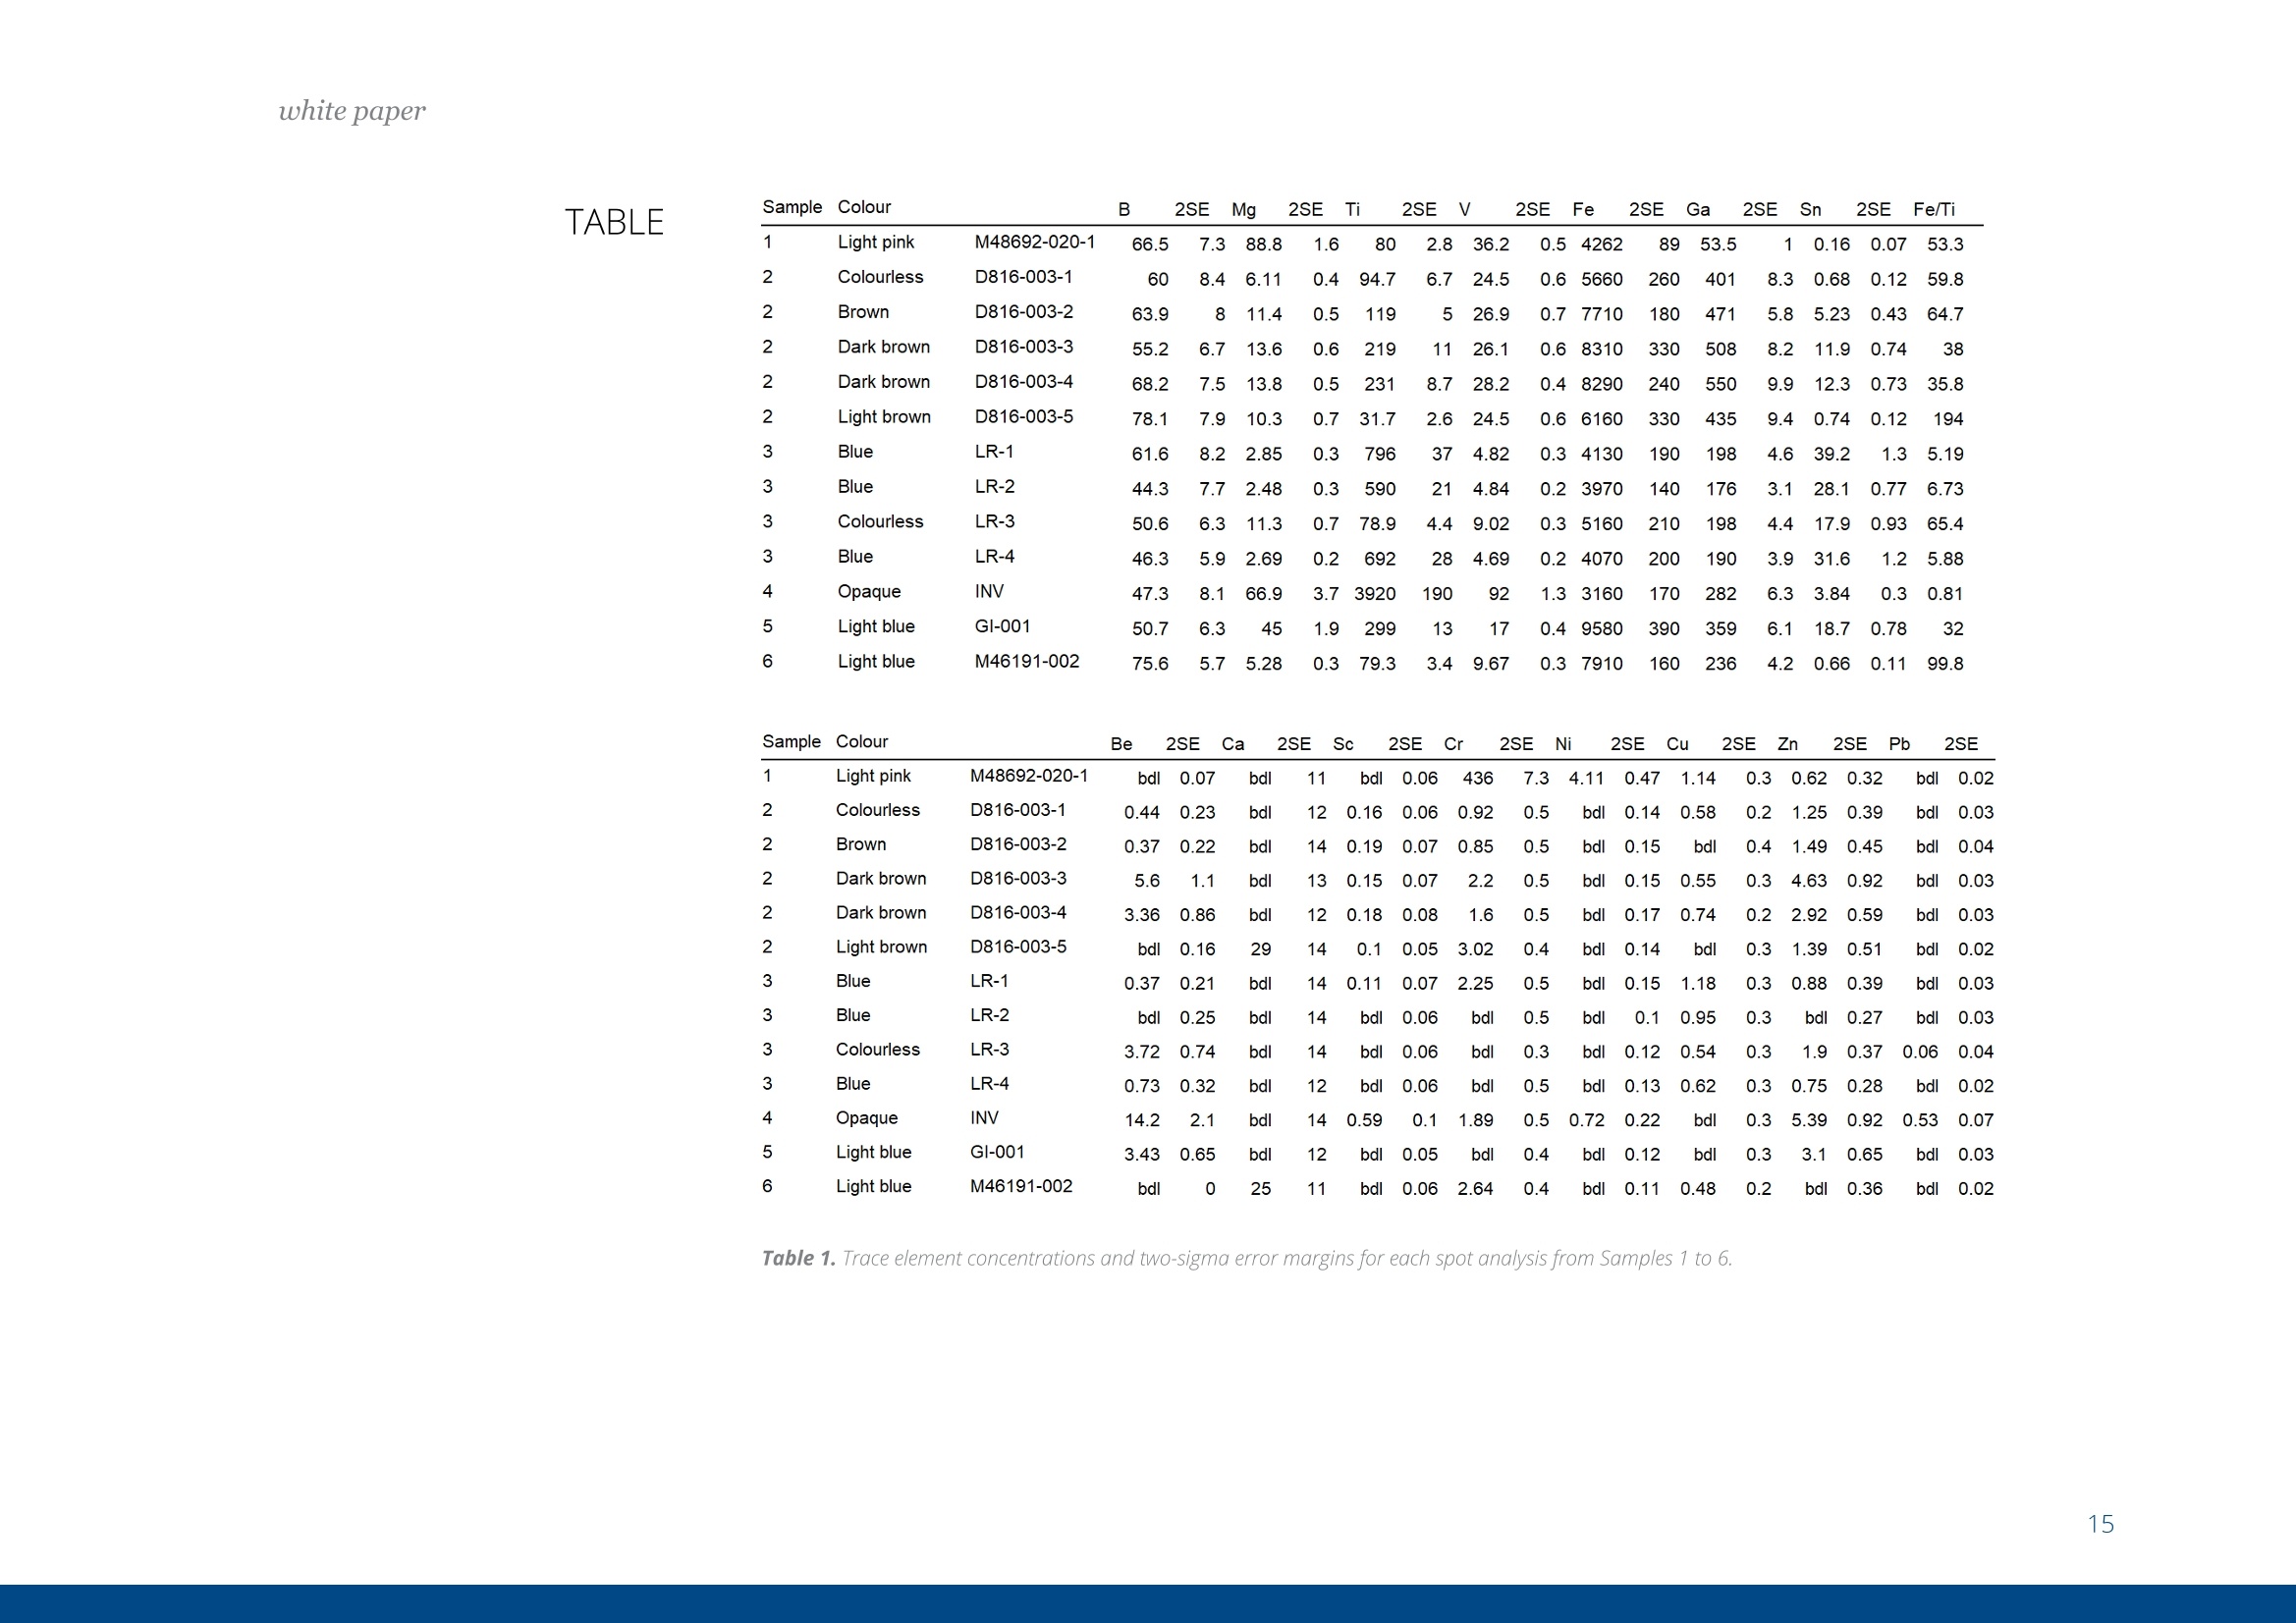
white paper COMPLEMENTARY'CATHODOLUMINESCENCEAND MASS SPECTROMETRY Australian Sapphires Index ABSTRACT 1 INTRODUCTION 2 BACKGROUND4 SAMPLES AND METHODS5 RESULTSS 27 DISCUSSION9 IMPLICATIONS & CONCLUSIONS11ACKNOWLEDGEMENTS & REFERENCES12 Complementary cathodoluminescenceand mass spectrometry ofAustralian sapphires Wong,J.1, Coenen,T.2, andVerdel, C.3 1 School of Earth and Environmental Sciences, University of Queensland 2 DELMIC B.V., Kanaalweg 4, 2628EB Delft, The Netherlands 3Geological Survey of Northern Territory One of the main purposes of cathodoluminescence (CL) imaging and spectroscopy of geological ma-terials is to study zonation and crystallisation histories in minerals such as zircon. Despite commonco-occurrence of zircons and sapphires in alluvial gemfields, there have been limited studies using CLto study chemical zonation of natural sapphire crystals. This study utilises CL to assess crystallisationhistories of sapphire and underlying causes for luminescence. Alluvial sapphires from eastern Australiawere analysed by CL and correlated with complementary laser ablation inductively coupled plasma massspectrometry (LA-ICP-MS) measurements, to determine trace element compositions. Results illustratea strong correlation between colour, trace element concentrations, and spectral CL measurements ofsapphires. CL spectra can potentially indicate relative oxidised or reduced conditions during sapphirecrystallisation. Cathodoluminescence (CL) is used in a wide rangeof geological|aapplications, including sedimentarypetrology, igneous petrology, metamorphic petrolo-gy, crystal growth, and gemstone identification [e.g.,1-11]. The focus of this study is on the application ofCL to minerals, specifically, colour-zoned sapphires.CL is known to be used on zircons frequently to seezircon growth crystallisation [12], therefore due tothe colour zonation in some sapphires and recent CLadvancement, this prompted the evaluation of usingCL on sapphires. Cathodoluminescence is a well-known technique forstudying minerals. CLemission is generated when anelectron beam interacts with a material that is lumi-nescent and produces electromagnetic radiation inthe spectral range from ultraviolet to infrared. Specif-ically, CL occurs when the crystal reaches an excitedstate by absorbing energy from the electron beam,after which this excitation energy is (partially) emittedin the form of light as the crystal returns to the unex-cited ground state [e.g., 3, 10, 13, 14]. CL is used bothas a microscopic and a spectroscopic method thatcan be applied to a wide range of minerals. It is usedfor a large variety of applications: imaging cementand detrital material in sedimentary rocks (e.g. lime-stone/sandstone), and visualization of crystallisationhistories and resulting zonation patterns in minerals,such as zircon [6, 8, 15, 16, 17]. The use of CL for natural sapphires is not common,although CL has been used to study synthetic sap-phires and their growth processes [e.g., 1].Naturalsapphire is a highly sought after precious gemstone,also known as the gem variety of the mineral co-rundum (Al,O): it is the second hardest naturallyoccurring mineral (Moh's hardness scale = 9, afterdiamond), very chemically inert, and relatively dense(~4g/cm3). The natural processes that form sapphiresspark interest for geological research as sapphiresrequire slow crystal growth in a formation environ-ment that is rich in aluminium (Al) and oxygen (O) butdepleted in silicon (Si). Geological processes that canresult in these environments are of particular inter-est. Colour zonation is a common feature in naturalsapphires that may document potential changes ingrowth environments in the form of zonation. In thisstudy we combine laser ablation inductively coupledPlasma mass spectrometry (LA-ICP-MS) and hyper-spectral CL of natural sapphires to examine zonationand trace element defects to understand the condi-tions of sapphire formation. Figure 1. Petrographic images ofthe samples (10x objectives) in A) plane-polarised light, and B) reflected light conditions. The numbering for the sapphires (in circles) as well as the different ROls (not circled) are shown in the image. Sapphires and rubies belong to the trigonal systemand have a crystal structure made up of alternat-ing layers of O2anions and Al3+ cations [18]. Traceamounts of other elements substitute for Al+ (Al,O,usually 97-99 wt%); common substituting elementsare transition metals such as Fe2+/3+, Cr3+, Ti3+/4+, V3+Mn2*/3+, as well as Mg2+ and Ga+[19]. The differencebetween sapphires and rubies is colour and traceelement content: rubies are red due to Cr3+ substi-tution, and sapphires are any other colour, thoughcommonly blue due to intervalence charge transferbetween Fe2+ and Ti4+[201. CL has more frequently been applied to syntheticsapphires and rubies than natural crystals. Most im-portantly,Chapoulie et al., [1] found that the CL emis-sion spectrum is directly linked to defects in the localstructure of the crystal lattice in industrial sapphires.In particular, CL studies have found that Feacts asa quenching centre, Ti+ is a near-infrared emittingcentre (broad peak between 728 and 794 nm), andTi4+ is a blue emitting centre (broad peak at 470 nm;[1]). From synthetic rubies, spectral CL studies foundnarrow well-defined spectral peaks of the well-knownCr3+substitution at ~694 nm[9, 10]. Both the Ti+andCr3+ centres can be very efficient light emitters, and,as such, they are employed in Ti:sapphire and rubylaser systems respectively [21, 22]. When O?anionsare removed from the crystal lattice of corundum, they create F centres, wherein removal of O?createsan F centre with typical spectral peaks at 415 nm, andremoval of O produces a Ft- centre with a peak at325 nm [23]. CL imaging is commonly used to visualise growthzones of zircon (ZrSiO)[24-27], a mineral that iscommonly found as inclusion in sapphires, or asmegacrysts co-occurring with sapphires in alluvialgemfields. Sapphires and rubies have distinct zona-tion patterns, but few studies use CL to quantitivelyanalyse crystal zonation. There are few CL studiesof natural sapphires and rubies that show zonation[5, 25, 28,29]. In some Scottish sapphires, oscillato-ry zoning can be observed in hand specimens, andUpton et al. [29] suggest that CL in these naturalsapphires is quenched by both Fe and Ti. CL imagingof Burmese rubies has identified skeletal growth fea-tures [5], whereas Moguk rubies show subtle zona-tion features parallel to external prismatic faces [25].Prior CL studies have mainly employed panchromaticCL imaging, as opposed to wavelength-sensitive hy-perspectral CL. As mentioned above, results fromsynthetic and industrial sapphires and rubies sug-gest that Fe is commonly associated with quenchingeffects. Since Fe is a minor element that comprises0.1 -1 wt%, this could (strongly) reduce the observedCL signal, although the CL signal can be boosted byincreasing beam current and primary electron ener- SAMPLES AND METHODS gy (controlled by the acceleration voltage). This studycombines spectral CL with LA-ICP-MS to quantita-tively analyse patterns of natural sapphire zonation.Understanding zonation in sapphire can provide in-sight into crystallisation history, and thus formationprocesses and conditions. Sample description and preparation Six sapphires were selected from alluvial gemfieldsin eastern Australia. These samples include both col-our-zoned and uniformly coloured crystals (Fig. 1).The zoned sapphires include Sample 2 from Anakie,with zonation from brown to colourless, and Sample 3 from Weldborough, with zonation from blueto colourless. Three single-coloured sapphires wereselected as controls. Sample 1 is a light pink sapphirefrom the St. Arnaud district, Sample 5 is a light bluesapphire from Glen Innes, and Sample 6 is a lightblue sapphire from the Toombullup district. Finally,for comparative purposes, Sample 4 is a dark colour-ed opaque sapphire from Inverell. Cleaned sapphireswere mounted in a 15 mm-diameter resin mount andground until cross sections of crystal faces were ex-posed, then the resin mounts were polished to a 0.25um diamond solution finish. CL measurements For CL measurements we used a SPARC CL system(Delmic B.V.) mounted on a FEG scanning electronmicroscope (SEM) from Thermo Fisher Scientific/FEl. A map of 40 x 40 pixels was collected in a 20 x 20um² area for each region of interest (ROI). CL wascollected using an aluminium paraboloid mirror. Theparaboloid was aligned with respect to the electronbeam using a motorized micropositioning stage. Theoptical alignment was checked at every ROl to ensurethat the CL intensities could be compared betweenROls. Hyperspectral measurements were performedusing a Czerny-Turner spectrograph with a 300 lines/mm grating blazed for a wavelength of 800 nm anda deep-depletion CCD array (1340×100 pixels). Theexperiment was performed using a dwell time of 80ms per pixel, 10 kV acceleration voltage, and a 400pA beam current. The camera was fully binned inthe vertical direction and four times in the horizon-tal direction for an improved signal-to-noise ratio.The spectra were corrected for the relative systemresponse of the CL system based on measurements Figure 2. An exampleof the CL spectrum fit-ted with two Gaussianline shapes (indicatedby the dashed lines)using a least-squaresoptimization routineto determine peakamplitudes, peakpositions, and peakwidths (full widthat half maximum,FWHM). Sample 6 wasused in this example. and calculations for a single-crystal aluminium sub-strate [30]. The absolute scaling of the y-axes in thespectra becomes rather arbitrary due to this correc-tion because it is only a relative correction. Howev-er, the measurements can still be compared directlyfrom one to the other (from ROI to ROl and from sap-phire to sapphire), and the relative peak amplitudesshould be representative for the actual CL emissionas well. The peak amplitudes, peak positions, andpeak widths (full width at half maximum, FWHM)were obtained by fitting the blue and red peaks withGaussian line shapes using a least-squares optimi-zation routine (see Fig. 2 for an example). In spectrawhere the peak associated with Cr3+ was present weused three Gaussians for fitting. The spectra werecorrected with the appropriate jacobian conversionfactor, such that the spectra could be fitted in the en-ergy domain [31]. LA-ICP-MS Procedure LA-ICP-MS was used to measure local trace elementconcentrations in the sapphires. Spot locations forCL and LA-ICP-MS analyses were the same in orderto directly correlate trace element and spectral data.Trace element analyses were performed on a LA-ICP-MS at the Queensland University of Technology fol-lowing a revised methodology from Wong et al.[32].Concentrations of elements were determined with aNew Wave Excimer laser ablation system (wavelength= 193 nm) using He gas flow (0.4 L/min), coupled toan Agilent 8800 triple quadrupole ICP-MS via a junc-tion with 1.0 L/min Ar flow in Teflon tubing. The re- action cell was idle, and the instrument was run in"single-quad" mode. Elemental concentrations weredetermined by using Al,O, as an internal standardand assuming that Al,O,=99 wt% based on the aver-age Al,O-corrected composition derived from elec-tron probe microanalysis (EPMA) [33]. The ablationspot had a diameter of 85 um, ablating at 6 Hz over30 seconds laser-on time, with a laser-off period of30 seconds that allowed the signal to return to back-ground levels. The laser ablation spots are clearly vis-ible in the reflection image in Figure 1b. The massesmeasured include Be, 11B, 24Mg, 44Ca, 45Sc, 47Ti, 51V,52Cr, 57Fe, 60Ni, 63Cu, 66Zn, 71Ga, 118Sn, and 208Pb. Con-centrations were calculated from raw counts usingNIST 612 as the external standard. Data were pro-cessed using lolite [34], a software package based onthe calculation style of Longerich et al. [35] for deter-mination of individual concentrations and associateddetection limits. The same reference materials andinternal standards were used as in the study of Wonget al.[32]. Of the six samples, two samples were zoned (Sam-ples 2 and 3), three samples were transparent andsingle-coloured (Samples 1, 5, and 6), and one sam-ple was dark-coloured and opaque (Sample 4). Forthe single-colour samples we selected one spot in thecentre of the crystal (Samples 1, 4, 5,and 6). Multiplespots were analysed for zoned crystals. For Sample 2,five spots were selected because it was a fragment-ed hexagonal sample with good crystal shape. Fourspots were analysed at the rim of this sample, and one was analysed at the core. Sample 3 was round-ed and lacked good crystal shape,therefore only fourspots were selected that span different shades ofblue. Trace element compositions Trace element concentrations of B, Mg, Ti, V, Fe, Ga,and Sn were detectable, whereas Be, Ca, Sc, Cr, Ni,Cu, and Zn had low concentrations or were below de-tection limits (bdl). The highest concentrations werefound for Fe (3160-9580 ppm) and Ti (31.7-3920ppm). Intermediate concentrations were found forGa (53.5-550.3 ppm), V(4.7-92 ppm), Mg (2.48-88.8ppm), B (44.3-78.1 ppm), and Sn (0.157-39.2 ppm).Be (bdl-14.2), Ca (bdl-29), Sc (bdl-0.59), Cr (bdl-2.6;except Sample 1 (pink sapphire; 436 ppm Cr), Ni (bdl-4.11), Cu (bdl-1.18), Zn (bdl-5.39), and Pb(bdl-0.5)were found in low concentrations. Detection limitsare as follows: Be (0.26), B (9.8), Mg(126), Ca (22.9),Sc (0.10), Ti (0.82), V(0.05), Cr(0.75), Fe (9.2), Ni (0.28),Cu (0.47), Zn (0.65), Ga (0.07), Sn(0.084), and Pb (bdl-0.05). Cathodoluminescence Single-colour sapphires. The single-coloured sap-phires have different spectral emission features(Fig. 3). Sample 1 is a light pink sapphire that has aprominent narrow spike at ~694 nm (Fig. 3) related to Cr3+ substitution in the crystal lattice, and the ac-companying LA-ICP-MS analysis spot indeed has a Crconcentration of 436 ppm. Sample 4 is an opaquedark sapphire, and it is dominated by a broad peakat ~775 nm (Fig.3). This peak generally relates to Ti3+substitution and is related to complex energy tran-sition processes in the crystal field at higher energylevels, related to fitting Ti+ into the crystal lattice andresulting in distortion [1]. Samples 5 and 6 are bothtransparent light blue sapphires with two peaks inthe spectrum with different CL intensities. They bothhave one peak in the blue (446 nm and 475 nm) andone in the red (both 775 nm; Fig 3), but with differentCL intensity between blue and red emissions. Sample5 has low CL intensity of the blue peak (~446 nm),contrasting with a much higher CL intensity in the redpeak (~775 nm). Grain 6,on the other hand, has lesscontrast in CL intensity between its blue peak (475nm) and red peak (775 nm). We note that Samples 1and 4 are significantly brighter in terms of absoluteCL intensity (max amplitude of ~3000 versus~50). Zoned sapphires. For the two colour-zoned crystals(Samples 2 and 3), there was variation in CL inten-sity depending on the location of the spot analysis(Figs. 4 and 5). Sample 2 is colour-zoned across thehexagonal face of the sapphire (Fig.4). Spectra fromthe five spots generally have a similar shape, showinga broad peak with a narrow spike in some spectra(~694 nm) again corresponding to the presence ofCr3t. The analysis of spot 1 in the 'colourless' section of the crystal has the highest CL intensity and mostprominent spike. Sample 3 is zoned from blue to col-ourless and shows two broad peaks: a low CL inten-sity broad peak around 470 nm, and a second broadpeak with high CL intensity around 742 nm (Fig.5). 800 900 800 900 Figure 3. CL spectra for Sample1 (top left), Sample 4 (bottomleft), Sample 5 (top right), andSample 6 (bottom right). Based on the combined spectral and trace elementcompositions of natural sapphires, the main ions in-volved in CL of sapphire are Fe2+, Ti3+, Ti4+, and Cr3+,which are also observed in synthetic, industrial, andnatural sapphires and rubies. CL spectra show varia-tion in CL intensity that correlate with trace elementcompositions determined by LA-ICP-MS. Fe and Ticoncentrations are responsible for the colour zona-tion in sapphires, as well as variations in CL emission. Figure 6. Peak amplitude ofCLpeaks asextracted from the numerical fits againstFe(Aand B) and Ti(Cand D) concentra-tions. Top figures A and Cuse blue peaks,and bottomfigures Band D use redpeaks. Note that the number of counts(cts) is larger than in the spectra due to the/acobian conversion factorwhich convertsthe data from units of counts per nm tocounts pereV. The difference in the peak amplitude for the blueemission in the two single-coloured transparent lightblue sapphires are due to differences in Fe and Ticoncentrations. Sample 5 has higher Ti and Fe con-centrations (Table 1), and the 446 nm blue peakmay have shifted due to the contribution of more Fcenters [23]. Due to the lower CL intensity of the bluepeak (Ti4t), this must result in a higher proportion ofTi+ in the total Ti concentration, resulting in the bi-modal CL intensity distribution observed in Sample5. Sample 6, on the other hand, has lower Fe and Ticoncentrations in general, and has a more even dis-tribution between Ti3+ and Ti4+[1]. Figure 7. Ti and Feconcentrations ofthesix samples. There is a clear positive trend between Ti concentra-tions and CL emission, as well as a negative correla-tion between Fe and CL emission (Fig. 6). However, there is no clear correlation between Fe and Ti con-centrations (Fig. 7), therefore Fe/Ti ratios were calcu-lated to determine if the rate of change between Feand Ti affected the CL spectra instead. Fe/Ti and Ticoncentration are negatively correlated (Fig. 8), fromwhich we draw two conclusions related to the pres-ence of Fe, Ti3, and Ti4+ in the corundum crystal lat-tice (Fig.8). First, the distribution of Ti in sapphires isin the dominant form of Ti+ when Fe/Ti is low, then, asFe/Ti increases,the ratio of Ti4+ relative to Ti3+ increas-es. This is visually revealed as the spectral contentchanges from a more dominant peak to two peakswith similar amplitude as ratios between Fe and Tichange from low Fe/Ti to high Fe/Ti (Fig. 8). Second, asFe/Ti increases, the CL intensity decreases due to thepresence of Fe and the associated quenching effects(Fig 8B.; examples of Sample 4 on the left and Sample2 on the right are shown, corresponding to the samesamples in Fig. 8A). For the pink sapphire (Sample 1)and zoned brown to colourless sapphire (Sample 2),the presence of Cr3+ in their crystal lattice changesthe spectral shape. Note that for Sample 2, the Cr3tcontribution can still be seen in the spectrum eventhough the average concentration is as low as 2 ppm,demonstrating that CL is extremely sensitive whendetecting bright and well-defined chromophoressuch as Cr3+ in sapphire. For the colourless to brownzoned sapphire, if the Cr3+ spike is disregarded, theresults are consistent with the interpretation outlinedabove. Any light absorption in the sapphire is disre-garded in this analysis as this is difficult to quantifyin CL. However, as light only propagates a few 100 A 10000 Dominantly Ti’ ●5Sample 1 Increasing Ti++relative to Ti3+ 400 500600 700 800 900 ,400 500 600 700 800 900 Wavelength (nm) Wavelength (nm) Fe/Ti ratio nm at most before coupling out, we anticipate thatthis effect is rather small. Furthermore, there coulda contribution from the F-center in the blue CL bandalthough the observed peak wavelengths (~450-490nm) and the fact that this peak can be fitted well witha single Gaussian (see Fig.2) suggests that this con-tribution is minor. Figure 8. Fe/Ti plotted against A) Ti, B) CLspectra peaks (Sample 4, left; Sample 2,right), C) CL peak amplitudes of blue peakagainst Fe/Ti ratios, and D) CL peak ampli-tudes ofred peak against Fe/Ti ratios. The oxidation state of Feand Ti in sapphires is ofinterest because these elements are importantchromophores (colour-causing elements). The vary-ing proportions between Ti+ and Ti4+ observed fromour trace element compositions and CL spectra maybe important indicators of the relative reducing oroxidising conditions sapphires may have experi-enced. Between the different valence states of Ti, Ti4is generally more stable and common, whereas Ti+is less stable and as a result, more reactive as a re-ducing agent. The negative power trendline betweenFe/Ti and Ti suggests that the conditions of sapphireformation steadily change from reducing (dominantlyTi3+) to oxidising (relatively more Ti4+) conditions. BothTi3t and Ti4t are known to exist in sapphires [36, 37]The finding of a negative correlation is determinedfrom the interpretation of Ti peaks [1]. There is amore dominant Ti3+ peak when there are low Fe/Ti ra- Natural alluvial sapphires from eastern Australia wereanalysed by both CL and LA-ICP-MS to assess chemicalzonation, as well as test spectralCL as a means for iden-tifying sapphire zonation. Spectral data show variationin zoned sapphires that is correlated with variation inFe and Ti concentrations measured by LA-ICP-MS. Therelationship between Fe/Ti and Ti concentrations con-trols the CL spectral emissions in sapphires due to de-fects in the crystal lattice related to substitution of dif-ferent ions.The negative trendline between Fe/Ti andTi led to two main observations related to the pres- tios, and a bimodal peak of Ti +and Ti4+ with high Fe/Ti(Fig.8). It is commonly accepted that the intervalencecharge transfer (IVCT) between Fe2+→Ti4+ causes theblue colour in sapphires [36]. It may be argued thatIVCT results in this change between Ti3+ and Ti4+, butnew XANES research suggests that the presence ofFe3tand Ti4+ in mixed acceptor states (through an en-ergy band model) is the cause of colour in blue sap-phires instead [38]. More research may provide fur-ther insight to oxidation states of Fe and Ti, and theirlattice positioning may prove useful in understandingthe conditions of sapphire formation. In terms of CLspectroscopy more rigorous high-resolution zona-tion mapping could be performed in the future, go-ing beyond point ROI acquisitions. In particular, if theSEM stage is scanned in an automated fashion duringacquisition, systematic hyperspectral imaging couldbe performed over mm to cm distances. ence of Fe, Ti+, and Ti4+ in the corundum crystal lattice:1) the distribution of Ti is dominantly Tis+ when Fe/Ti islow, then, as Fe/Ti increases, the ratio between Ti+ andTi4t evens out; and 2) as Fe/Ti increases,the CL intensi-ty decreases due to the presence of Fe and its quench-ing effects. This study is the first to note the correlationbetween Fe and Ti, documented by spectral and traceelement data, which may reflect variably reducing oroxidising conditions of sapphire formation. Samples from St. Arnaud district and Anakie regionare from museum donations from William Birch fromVictoria Museum, and Kristen Spring and AndrewRozefelds from Queensland Museum. Charlotte Allenand Karine Moromizato are thanked for running theLA-ICP-MS system at the Institute for Future Environ-ments (IFE) part of the Central Analytical ResearchFacilities (CARF) at Queensland University of Tech-nology. The former School of Earth Sciences at theUniversity of Queensland is thanked for their LeicaAutomated Scanning Microscope used for imaging.. Prof. Albert Polman (AMOLF,Amsterdam, the Netherlands) is thanked for providing time on the cathodoluminescencesystem. REFERENCES [1] Chapoulie, R., Capdupuy, C., Schvoerer, M., and Bechtel,F., Cathodoluminescence and crystal growth of sapphire,Physica status solidi (a), 171,613-621(1999) ( [2] Schaltegger, U., Fanning, C. M.,Gunther, D., Maurin, J . C., Schulmann, K., and Gebauer, D., Growth, annealing and recrystallization o f zirco n and preservation of monazite in high-grade metamorphism: conventional and in-situ U-Pb isotope,cathodoluminescence and microchemical evidence, Contributions to Mineralogy and Petrology, 134, 186-201(1999) ) ( [3] Pagel, M. , Barbin, V., Blanc, P., and Ohnenste t ter, D . , ) Cathodoluminescence in Geosciences, Berlin/Heidelberg,Berlin/Heidelberg: Springer Berlin Heidelberg (2000) ( [4] Ponahlo,j.,Cathodoluminescence as a t ool in gemstone identification, Cathodoluminescence in Ge o sciences, Springer, 479-500(2000) ) [5] Garnier,V., Ohnenstetter, D., Giuliani, G.,Blanc, P.,andSchwarz, D., Trace-element contents and cathodolumi-nescence of "trapiche" rubies from Mong Hsu, Myanmar(Burma): geological significance, Mineralogy and Petrology,76, 179-193 (2002) [6] Richter, D. K., Gotte, T., Gotze,J., and Neuser, R. D.,Progress in application of cathodoluminescence (CL) in ( sedimentary petrology, Mineralogy and Petrology, 79, 127- 166(2003) ) [7] Schertl, H.-P., Neuser, R. D., Sobolev, N. V., and Shatsky,V. S., UHP-metamorphic rocks from Dora Maira/West-ern Alps and Kokchetav/Kazakhstan; new insights usingcathodoluminescence petrography, European journal ofMineralogy, 16, 49-57 (2004) ( [8] Boggs, S., and Krinsley, D . H ., Application o f c athodo- luminescence imaging to the study of sedimentary rocks / Sam Boggs,jr. and David Krinsley, Cambridge, UK;New York, Cambridge, UK ; New York : Cambridge University Press (2006) ) ( [9] Guguschev, C., Gotze,j.,and Gobbels, M., 2010, Cathodoluminescence microscopy and s p ectroscopy of synthetic ruby crystals grown b y the optical floating zone technique.(Author abstract)(Report), American Mineralogist,95,449(2010) ) ( [10] Gotze,J., Application of Cathodoluminescence Micros- copy and Spectroscopy in G eosciences, M icroscopyand Microanalysis , 18,1270-1284 (2012) ) ( [11] Siebel, W. , Shang, C. K., Thern, E ., Danisik, M., and Rohrmuller,J. , Zircon response to high-grade metamor- phism as revealed by U - Pb and cathodoluminescence studies,I n ternational journal of Earth Sciences, 101, 2 1 05-2123(2012) ) ( [12] Gotze,j., and Kempe, U., Physical P r inciples of Cath- odoluminescence (C L ) and its Applications in Geosciences, in,Cathodoluminescence and its Application in the Planetary Sciences, 1-22 (2009) ) ( [13]Yacobi, B. G.,and Holt, D. B., CathodoluminescenceMicroscopy of Inorganic Solids, Boston, M A, Boston, M A : Sprin g er US, Imprint: Springer (1990) ) ( [14] Coenen, T ., and H aegel, N . M., Cathodoluminescence for the 21st century: L earning more from light, Applied Physics Reviews, 4(201 7 ) ) ( [15] Houseknecht,D . W., Use of cathodoluminescence pe- trographyfor understanding compaction, quartz cementa- ) ( tion,and porosity in sandstones: Luminescence Microscopy and Spectroscopy: Quantitative and Qua l itative Applica- tions, SEPM Short Course, 25, 59- 6 6(1991) ) ( [16] M illiken, K. L . , Reed, R. M., and L aubach, S.E., Quantify- ing compaction and cementation in deformation b a nds inporous sandstones, AAPG Memoir, 85, 237-249 (2005) ) ( [17] Coenen, T.,Cathodoluminescence Imaging on Sedi-mentary Rocks: Quartz Sandstones: whitepaper (2016) ) ( [18] Dobrovinskaya, E. R., L ytvynov, L. A., and Pishchik,V.,Properties of Sapphire, Sapphire Materials, M anu f acturing, Applications, Springer, 55- 1 76 (2009) ) ( [19] Hughes, R. W., Ruby & Sapphire, RWH Publishing (1997) [20] Pisutha-Arnond,V., Hager, T .,Atichat, W. , and ) ( Wathanakul, P., The r o le of Be, Mg, Fe, and Ti in c ausing col- our in cor u ndum,journal of Gemmology, 3 0, 131-143( 2 006) [21] Eggleston,J. M., Deshazer,L. G ., and Kangas, K. W.,Characteristics and kinetics of laser-pumped Ti:sapphire oscillators, Quantum Electronics, IEEE journal of, 24, 1009- 1015(1988) ) ( [22] K umari, S . , K ushwaha, A., and Khare, A., Spatial dis- tribution of electron temperature and io n de n sity in la s er induced ruby (Al,O: C r 3*) plasma using Langmuir probe,J. Instrum., 7 (2012) ) ( [23] M unisso, M . C., Zhu, W., L eto, A., and Pezzotti, G ., Stress dependence of sapphire cathodoluminescence from optically active oxygen defects as a function of cr y stallo-graphic orientation: T he journal of physical chemistry, 111, 3526(2007) ) ( [24] Graham, I ., Sutherland,L.,Zaw,K., N echaev, V.,and Khanchuk, A.,Advances in our understanding of the gemcorundum deposits of the W e st Pacific continental m argins intraplate basaltic fields , Ore Geology Reviews, 34, 200 - 215 (2008) ) ( [25] H a rlow, G., and B e nder, W., A study of ruby (co- rundum) compositions f rom the Mogok Belt, Myanmar: Searching for c hemical fingerprints, American M ineralogist, 98,1120-1132(2013) ) ( [26] Bindeman,I. N . ,Serebryakov, N. S.,Schmitt, A. K., Vazquez,J. A . , Guan, Y., Azimov, P. Y., A stafiev, B . Y., Palan- dri,J., and Dobrzhinetskaya, L., F ie ld and microanalytical isotopic investigation of ultradepleted in 1 80 Paleoprotero- z oic" S lushball E a rth" rocks from Ka r elia, Russia, Geosphere,10,308-339 (2014) ) ( [27]Sutherland, F.L., Coenraads, R. R.,Abduriyim, A., Me f - f re, S., Hoskin, P . W . O., Giuliani, G., Beattie, R . , Wuhrer, R., and Sutherland, G. B., Corundum (s a pphire) and zircon re- lationships,Lava Pla i ns gem fields, NE Australia: Integrated mineralogy, geochemistry, a g e determination, genesis an d geographical typing, M ineralogical Magazine, 7 9,545-581 (2015) ) ( [28] Sorokina, E. S., Hofmeister, W., Hager, T ., Mertz-Kraus,R., Buhre, S ., and Saul,j. M. , Morphological and chemical evolution of corundum (ruby and sapphire): crystal ontog- eny reconstructed by EMPA, LA-ICP- M S, and [Cr.sup.3+ ] Raman mapping.(Report)(Author abstract), American Miner- alogist, 101,2716(2016) ) ( [29] U pton, B. G . J., H inton, R . W., Aspen, P. , Finch, A. A., andValley,j. W., Megacrysts and Associated Xenoliths: Evi d ence f or Migration of Geochemically Enriched M elts i n the Upper Mantle Beneath Scotland,journal of Petrology, 40, 9 35-955 (1999) ) ( [30] Brenny, B. J. M., Coenen, T., a nd P o lman, A., Quanti- fying coherent and i ncoherent cathodoluminescence in semiconductors and metals, journal ofApplied Physics, 115, 244307(2014) ) ( [31] Meuret, S., C oenen, T., Zeijlemaker, H . , Latzel, M., Christiansen, S., Conesa Boj, S., a nd Polman, A., Ph y s. Rev. B 96,035308(2017) ) ( [32] Wong,J., Verdel, C.,and Allen, C. M. , Trace-element compositions of s apphire and r u by from the e a stern A u s-tralian gemstone belt, Mineralogical Magazine, 81 (2017) ) [33] Wong,J., Trace element and oxygen isotope geochem-istry of east Australian sapphires: regional petrogenesisand tectonic implications, PhD thesis, University of Queens- ( [34] Paton, C., Hellstrom,J. , Paul, B., Woodhead, J .,and Hergt, J., lolit e : Freeware for the visualisation and process-ing of mass spectrometric data,journal of Analytical Atomic Spectrometry,26, 2508-2518( 2 011) ) ( [35] L ongerich, H . P.,jackson, S. E., and G u nther, D., Laser ablation inductively coupled p lasma mass spectrometric transient signal data a cquisition a nd analyte c o ncentration calculation,journal ofanalytical atomic spectrometry, 11, ) ( 899-904(1996) ) ( [36] Fritsc h , E., an d Rossman, G. R. , An update on color in gems: Part 3: Colors caused by band gaps and physical phenomena, Gems & Gemology,24, 8 1 -102 ( 1 988a) ) ( [37] Fritsch,E., and Rossman, G. R., An update on color in gems: Part 3: Colors caused by band gaps and physical phenomena, Gems & Gemology, 24, 81-102(1988b) ) ( [38] Wongrawang, P ., Monarumit, N., Thammajak,N., Wathanakul, P., and Wongkokua, W., Oxidation s t ates of Fe a nd Ti in blue sapphire, M a terials Research Ex p ress, 3, 026201 (2016) ) Sample Colour Light pink M48692-020-1 Be 2SE Ca 1.6 2SE Sc 2SE Cr 2SE Ni 89 2SE Cu 2SE Zn 2SE Pb 2SE 2 Light pink M48692-020-1 bdl 0.07 6.11 bdl 11 bdl 0.06 436 7.3 4.11 0.47 1.14 0.3 0.62 0.32 bdl 0.02 2 Colourless D816-003-1 0.44 0.23 11.4 bdl 1220.16 0.06 0.92 0.5 bdl 0.14 0.58 0.2 1.25 0.39 bdl 0.03 2 Brown D816-003-2 0.37 0.22 13.6 bdl 14 0.19 0.07 0.85 0.5 bdl 0.15 bdl 0.4 1.49) C0.45 bdl 0.04 2 Dark brown D816-003-3 5.6 1.1 13.8 bdl 13 0.15 0.07 2.2 0.5 bdl 0.15 0.55 0.3 4.63 0.92 bdl 0.03 2 Dark brown D816-003-4 3.36 0.86 10.3 bdl 1220.18 0.08 1.6 0.5 bdl 0.177 0.74 0.2 2 2.92(0.59 bdl 0.03 2 Light brown D816-003-5 bdl 0.16 2.85 29 14 0.1 0.05 3.02 0.4 bdl 0.14 bdl 0.3 1.39(0.51 bdl 0.02 3 Blue LR-1 0,37 0.21 2.48 bdl 14 9.11 0.077 2.25 0.5 bdl 0.15 1.18 0.3 0.88 0.39 bdl 0.03 3 Blue LR-2 bdl 0.25 11.3 bdl 14 bdl 0.06 bdl 0.35160 bdl 0.1 0.95 0.3 bdl 0.27 bdl 0.03 3 Colourless LR-3 3.722 0.74 2.69 bdl 14 bdl 0.06 bdl 0.24070 bdl 0.12 0.54 0.3 1.9 0.37 0.06 0.04 3 Blue LR-4 0.733 0.32 66.9 bdl 12 bdl 0.06 bdl 1.33160 bdl 0.133 0.62 0.3 0.75 0.28 bdl 0.02 4 Opaque INY 14.2 2.1 45 bdl 14 0.59 0.1 1.89 0.5 0.722 0.22 bdl 0.3 5.3910.92 0.53 0.07 5 Light blue GI-001 3.43 0.65 5.28 bdl 12 bdl 0.05 bdl 0.37910 bdl 0.12 bdl 0.3 3.1 0.65 bdl 0.03 6 Light blue M46191-002 bdl 0 Found this white paper interesting? Visit our website forthe latest news on sample preparation techniques, scien-tific publications and more cathodoluminescence micros-copy applications. DELMIC B.V. is a company based in Delft, the Netherlandsthat produces correlative light and electron microscopysolutions. DELMIC's systems cater to a broad range ofresearchers in fields ranging from nanophotonics to cellbiology. For questions regarding this note, contact our SPARC Applica-tion Specialist at: coenen@delmic.com For more SPARC application notes, see: delmic.com/applica-tion-cathodoluminescence-materials-and-optics The SPARC isISahigh-performanceecathodolumines-cence detection systemproduced byDELMIC. Thesystem is designed to optimally collect and detectcathodoluminescence emission, enabling fast and sensitivematerial characterization at the nanoscale. Kanaalweg4 2628 EB Delft The Netherlandstel.+31 15 7440158 www.delmic.comn info@delmic.com delnc We invite you to download the new white paper, which demonstrates the possibilities of studying alluvial sapphires from Australia with cathodoluminescence (CL) imaging. This research shows how cathodoluminescence can help to assess crystallisation histories of the precious gemstones and underlying causes for luminescence. While being used for a wide range of geological application, including sedimentary petrology, igneous petrology, metamorphic petrology, crystal growth, and gemstone identification, cathodoluminescence is not a common technique to study natural sapphires. However, it is used on zircons frequently to see zircon growth crystallisation, and due to the color zonation in some sapphires, hyperspectral cathodoluminescencewas used (together with laser ablation inductively coupled plasma mass spectrometry) to examine zonation and trace element defects to understand the conditions of sapphire formation.The CL measurements for this research were performed with the SPARC, a cathodoluminescence detector, which was mounted on FEG scanning electron microscope (SEM) from Thermo Fisher Scientific/FEI. The results illustrate a strong correlation between color, trace element concentrations, and spectral CL measurements of sapphires. You are welcome to download the white paper if you would like to read about the whole process of sample description, sample preparations and procedures used. If you would like to dive in even more in various analytical SEM tools and methods for studying geological samples, check our upcoming workshop at the Geology department of the University of Oslo.
确定

还剩17页未读,是否继续阅读?

产品配置单
苏州德尓微仪器有限公司为您提供《地质晶体中科研检测方案(电镜部件)》,该方案主要用于其他中科研检测,参考标准--,《地质晶体中科研检测方案(电镜部件)》用到的仪器有SPARC -高性能SEM阴极发光成像系统
推荐专场
相关方案
更多