


方案详情
文
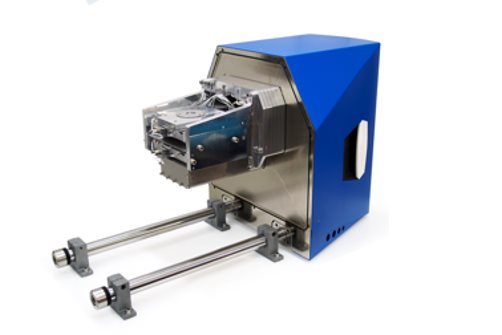
集成光电子关联(iCLEM),荷兰delmic公司创新发明的一种新技术,在SEM内集成光镜,实现样品同一位置进行荧光光学成像和电子显微成像。该显微方法正在世界范围内广泛应用于癌症研究、海洋生物学、神经科学和细胞生物学。最近这种技术在USGS应用于地质学领域,以深入了解地质材料中的沉积有机质。
在最新发表论文中,美国地质调查局(USGS)使用delmic的iCLEM系统SECOM,对始新世绿河红木区不成熟油页岩和上白垩统塔斯卡卢萨群中油页岩进行了观测研究。结果表明,这种技术非常有效地识别和表征有机纳米孔隙形成的有机物质类型和状态[3]。
有机质的数据很容易用高分辨率扫描电子显微镜(SEM)获得,但研究人员不能单独使用SEM来区分有机质的类型,如干酪根与固体沥青。然而,荧光显微镜的荧光像对于识别页岩油气藏中的有机质非常有用[1]。采用光电关联技术,在一台显微镜上结合这两种技术,地质学家可以获得更多的数据,而无需考虑耗时的样品制备,样品转移、重新导航定位等造成的困难或样品损坏[2]。
方案详情

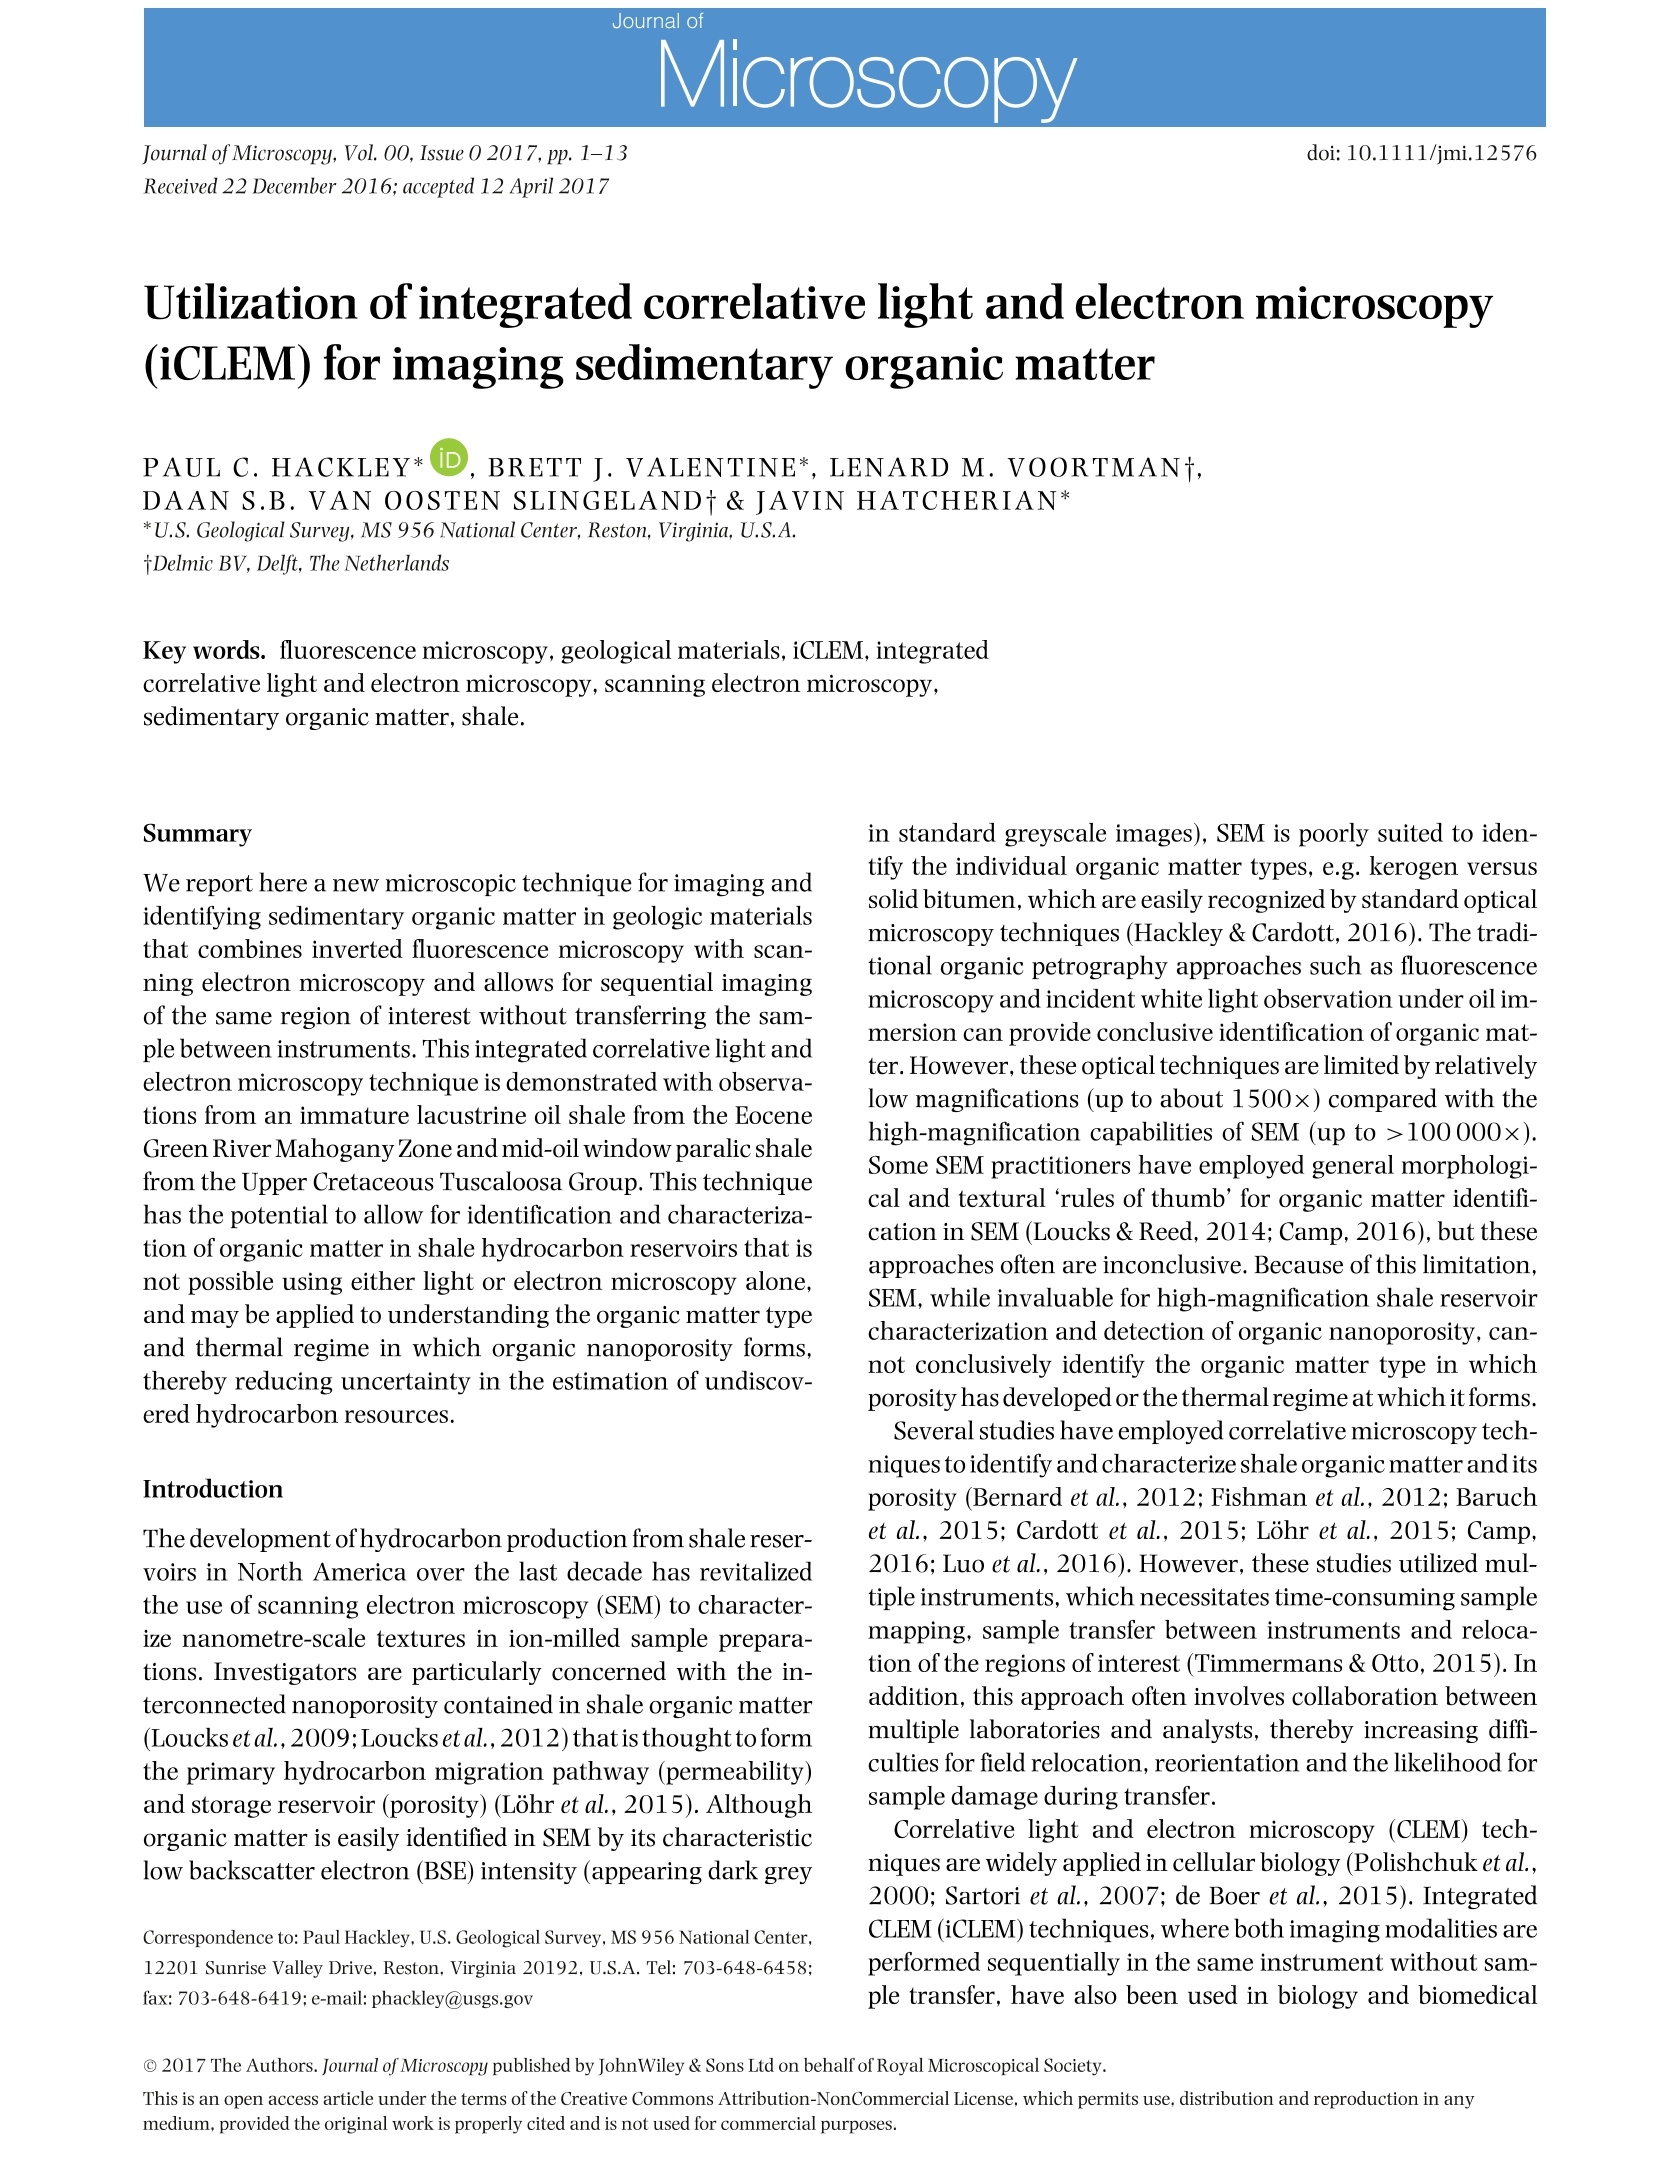
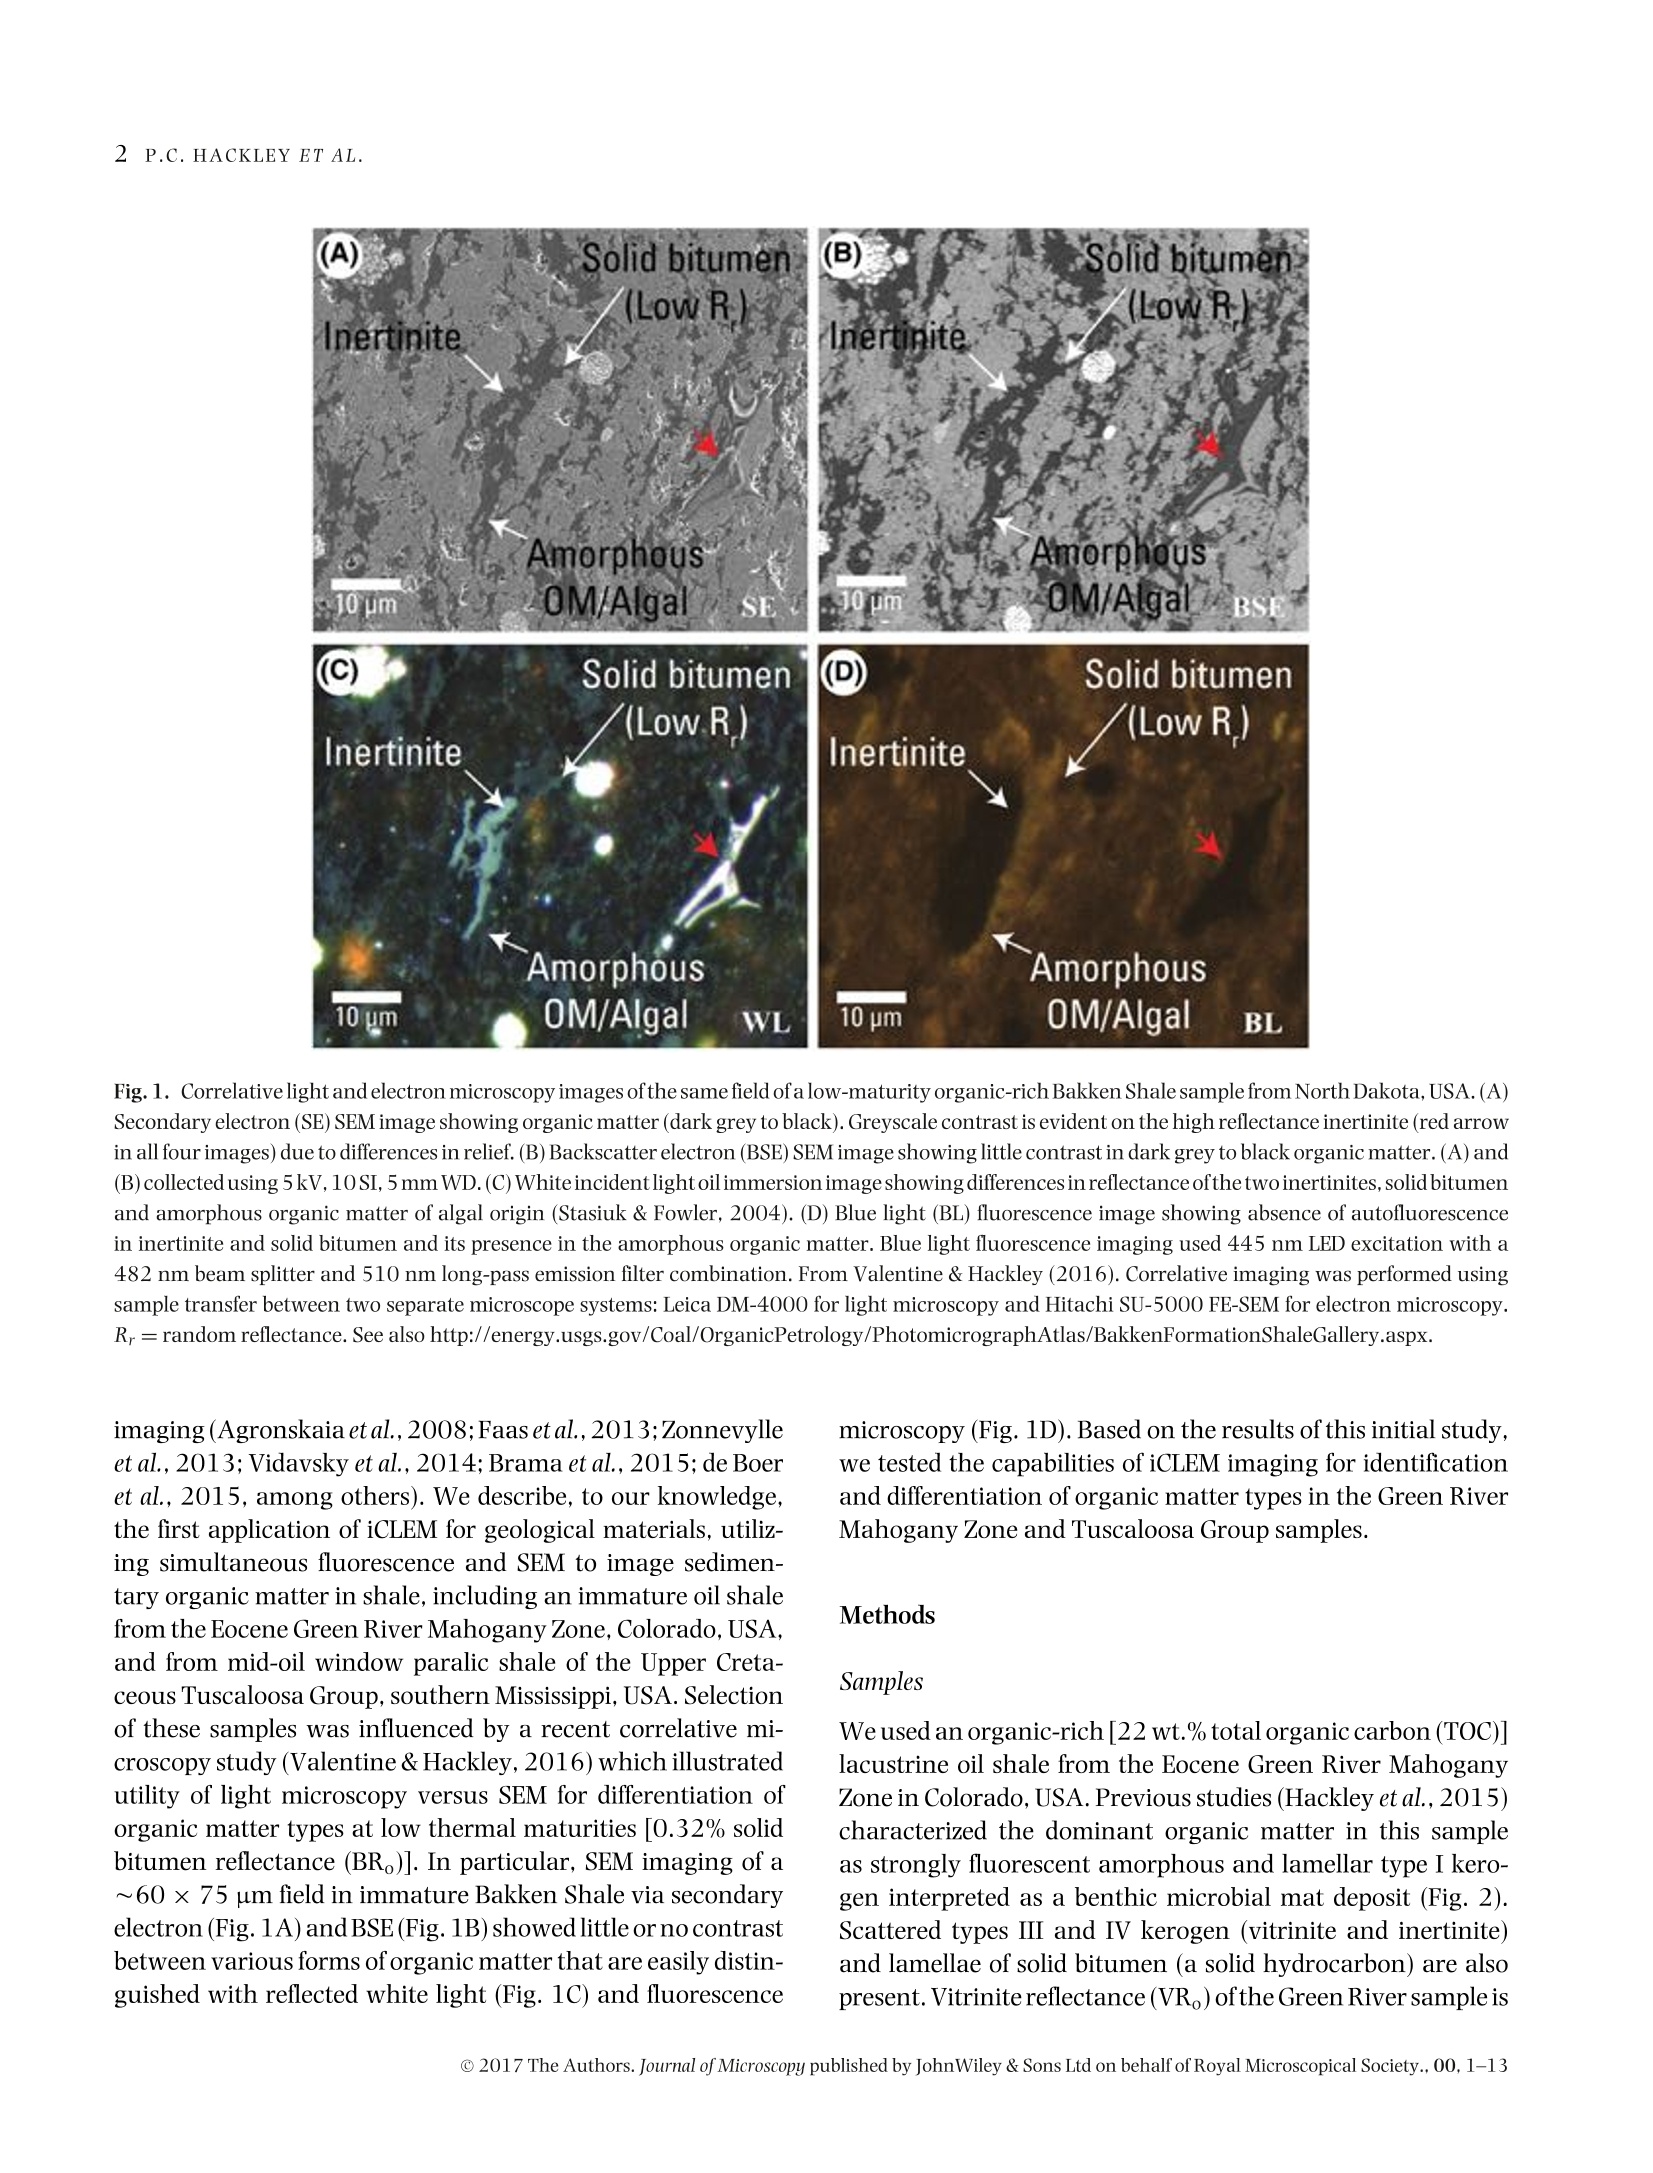
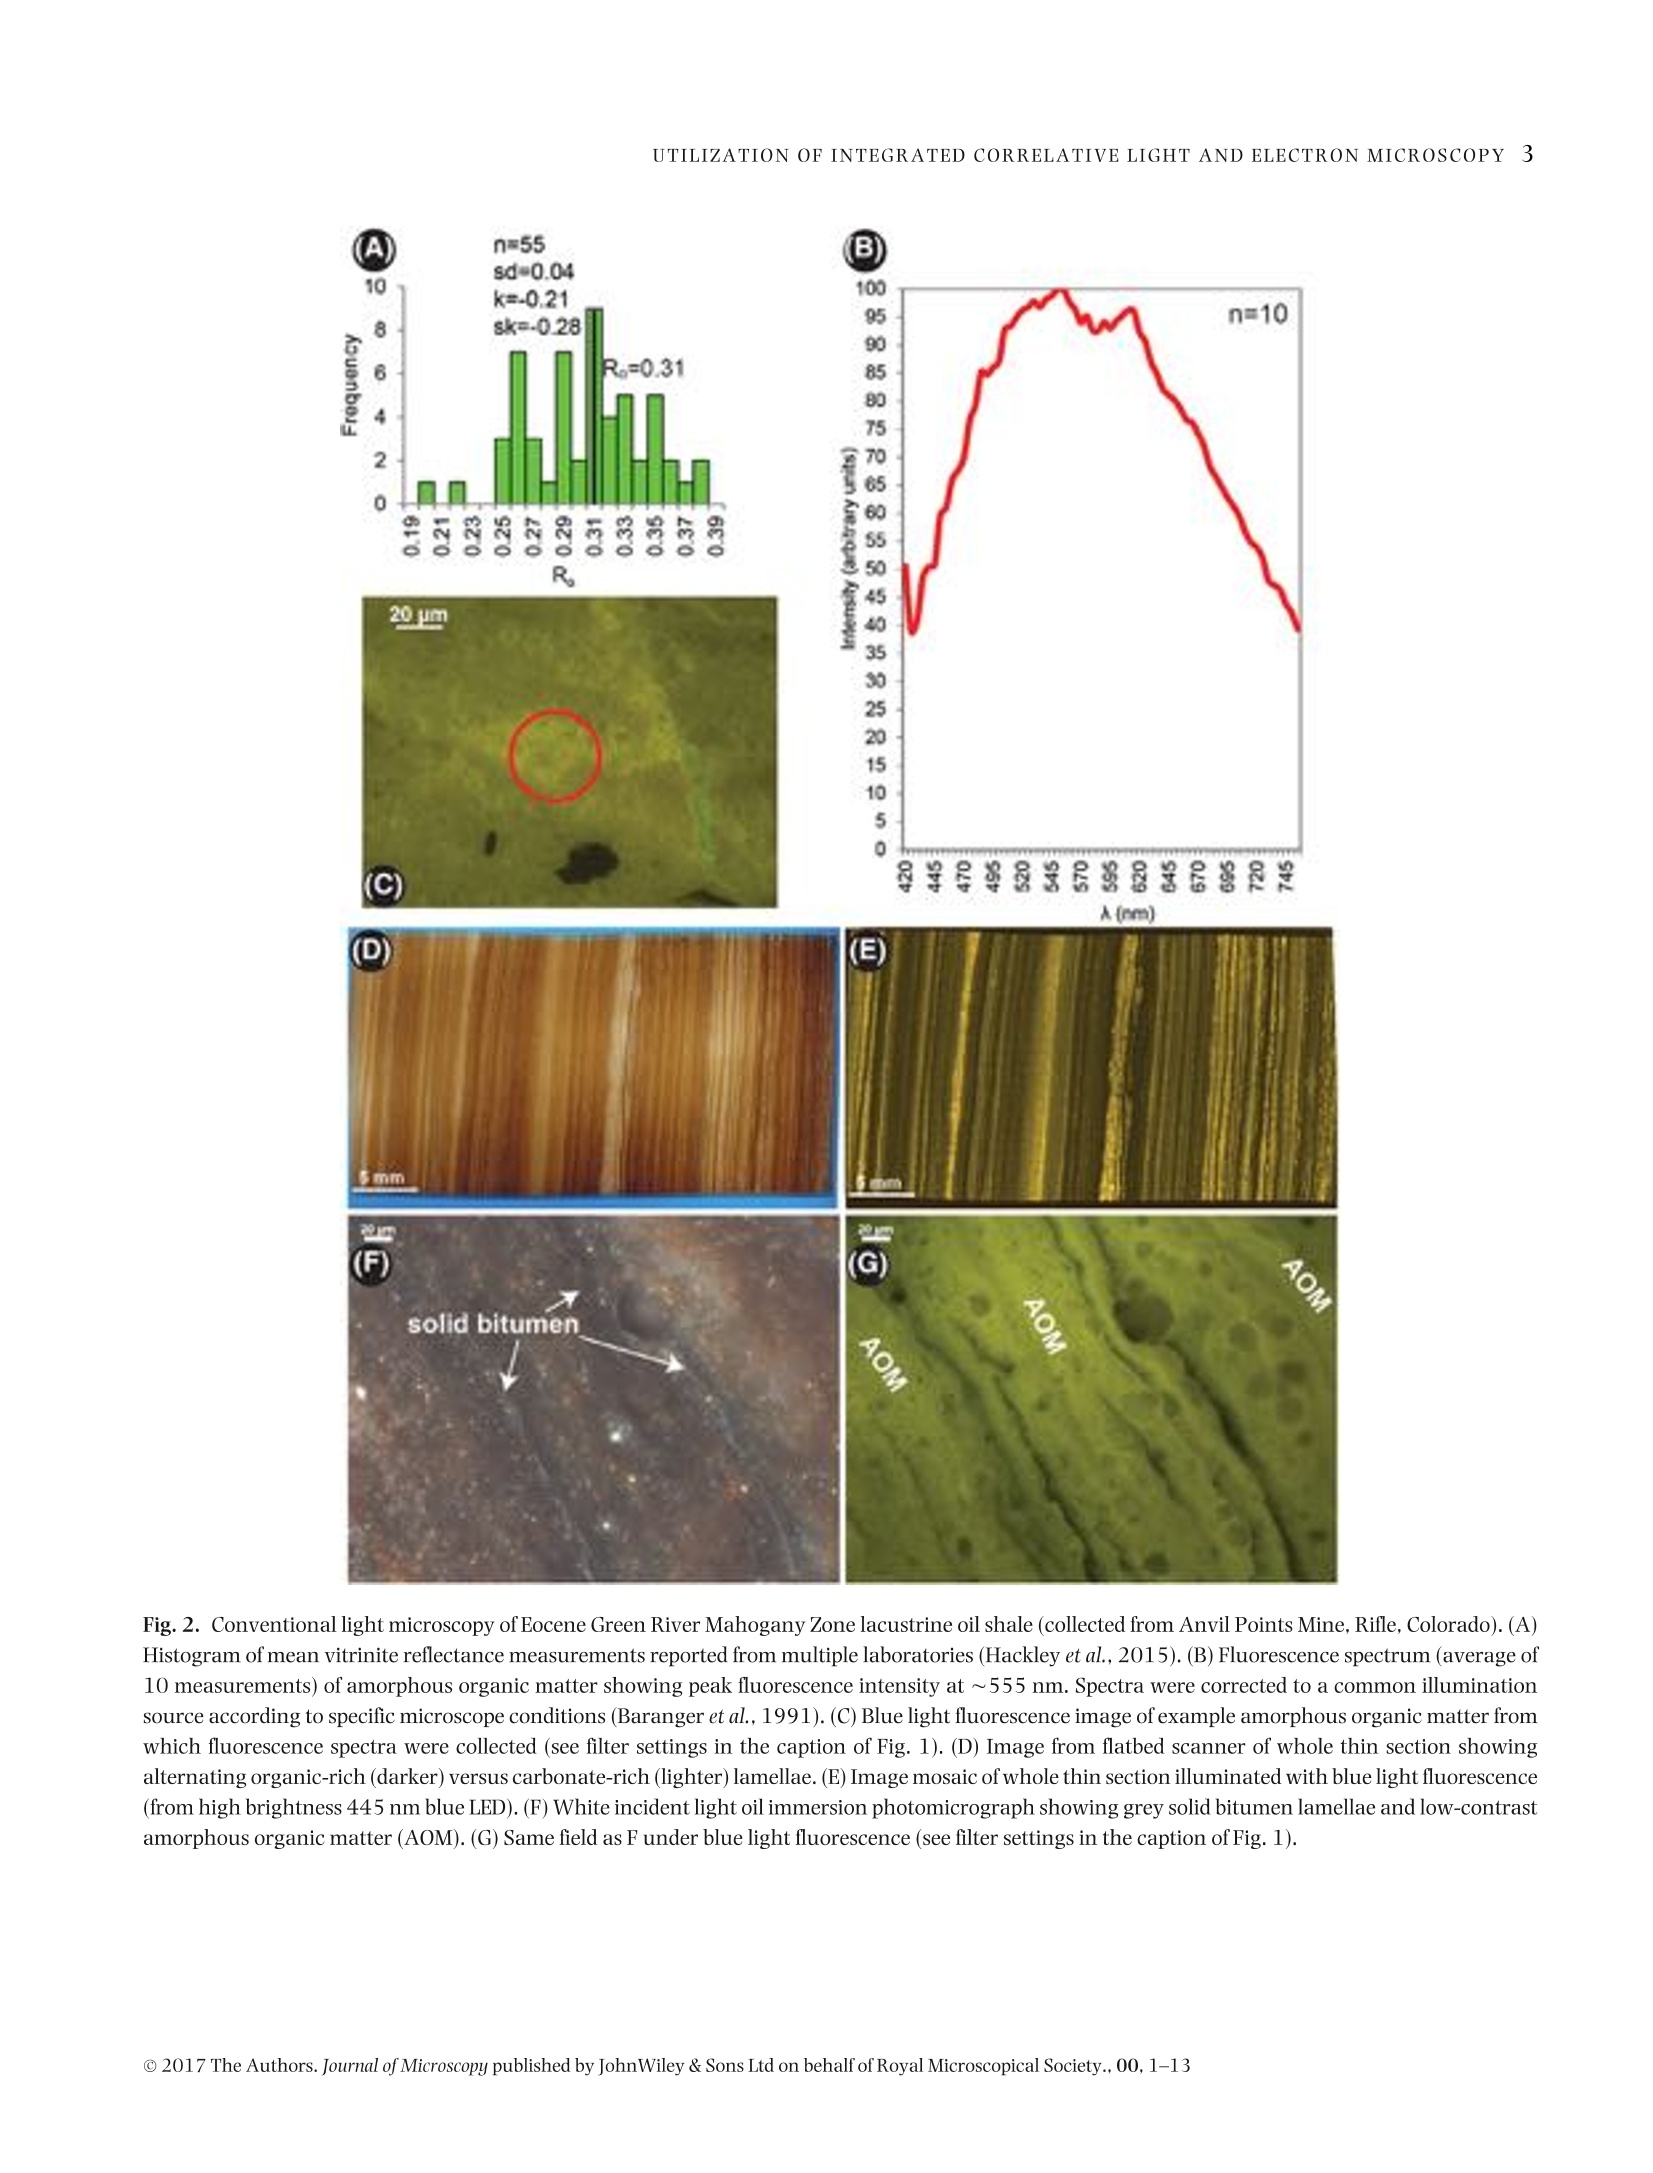
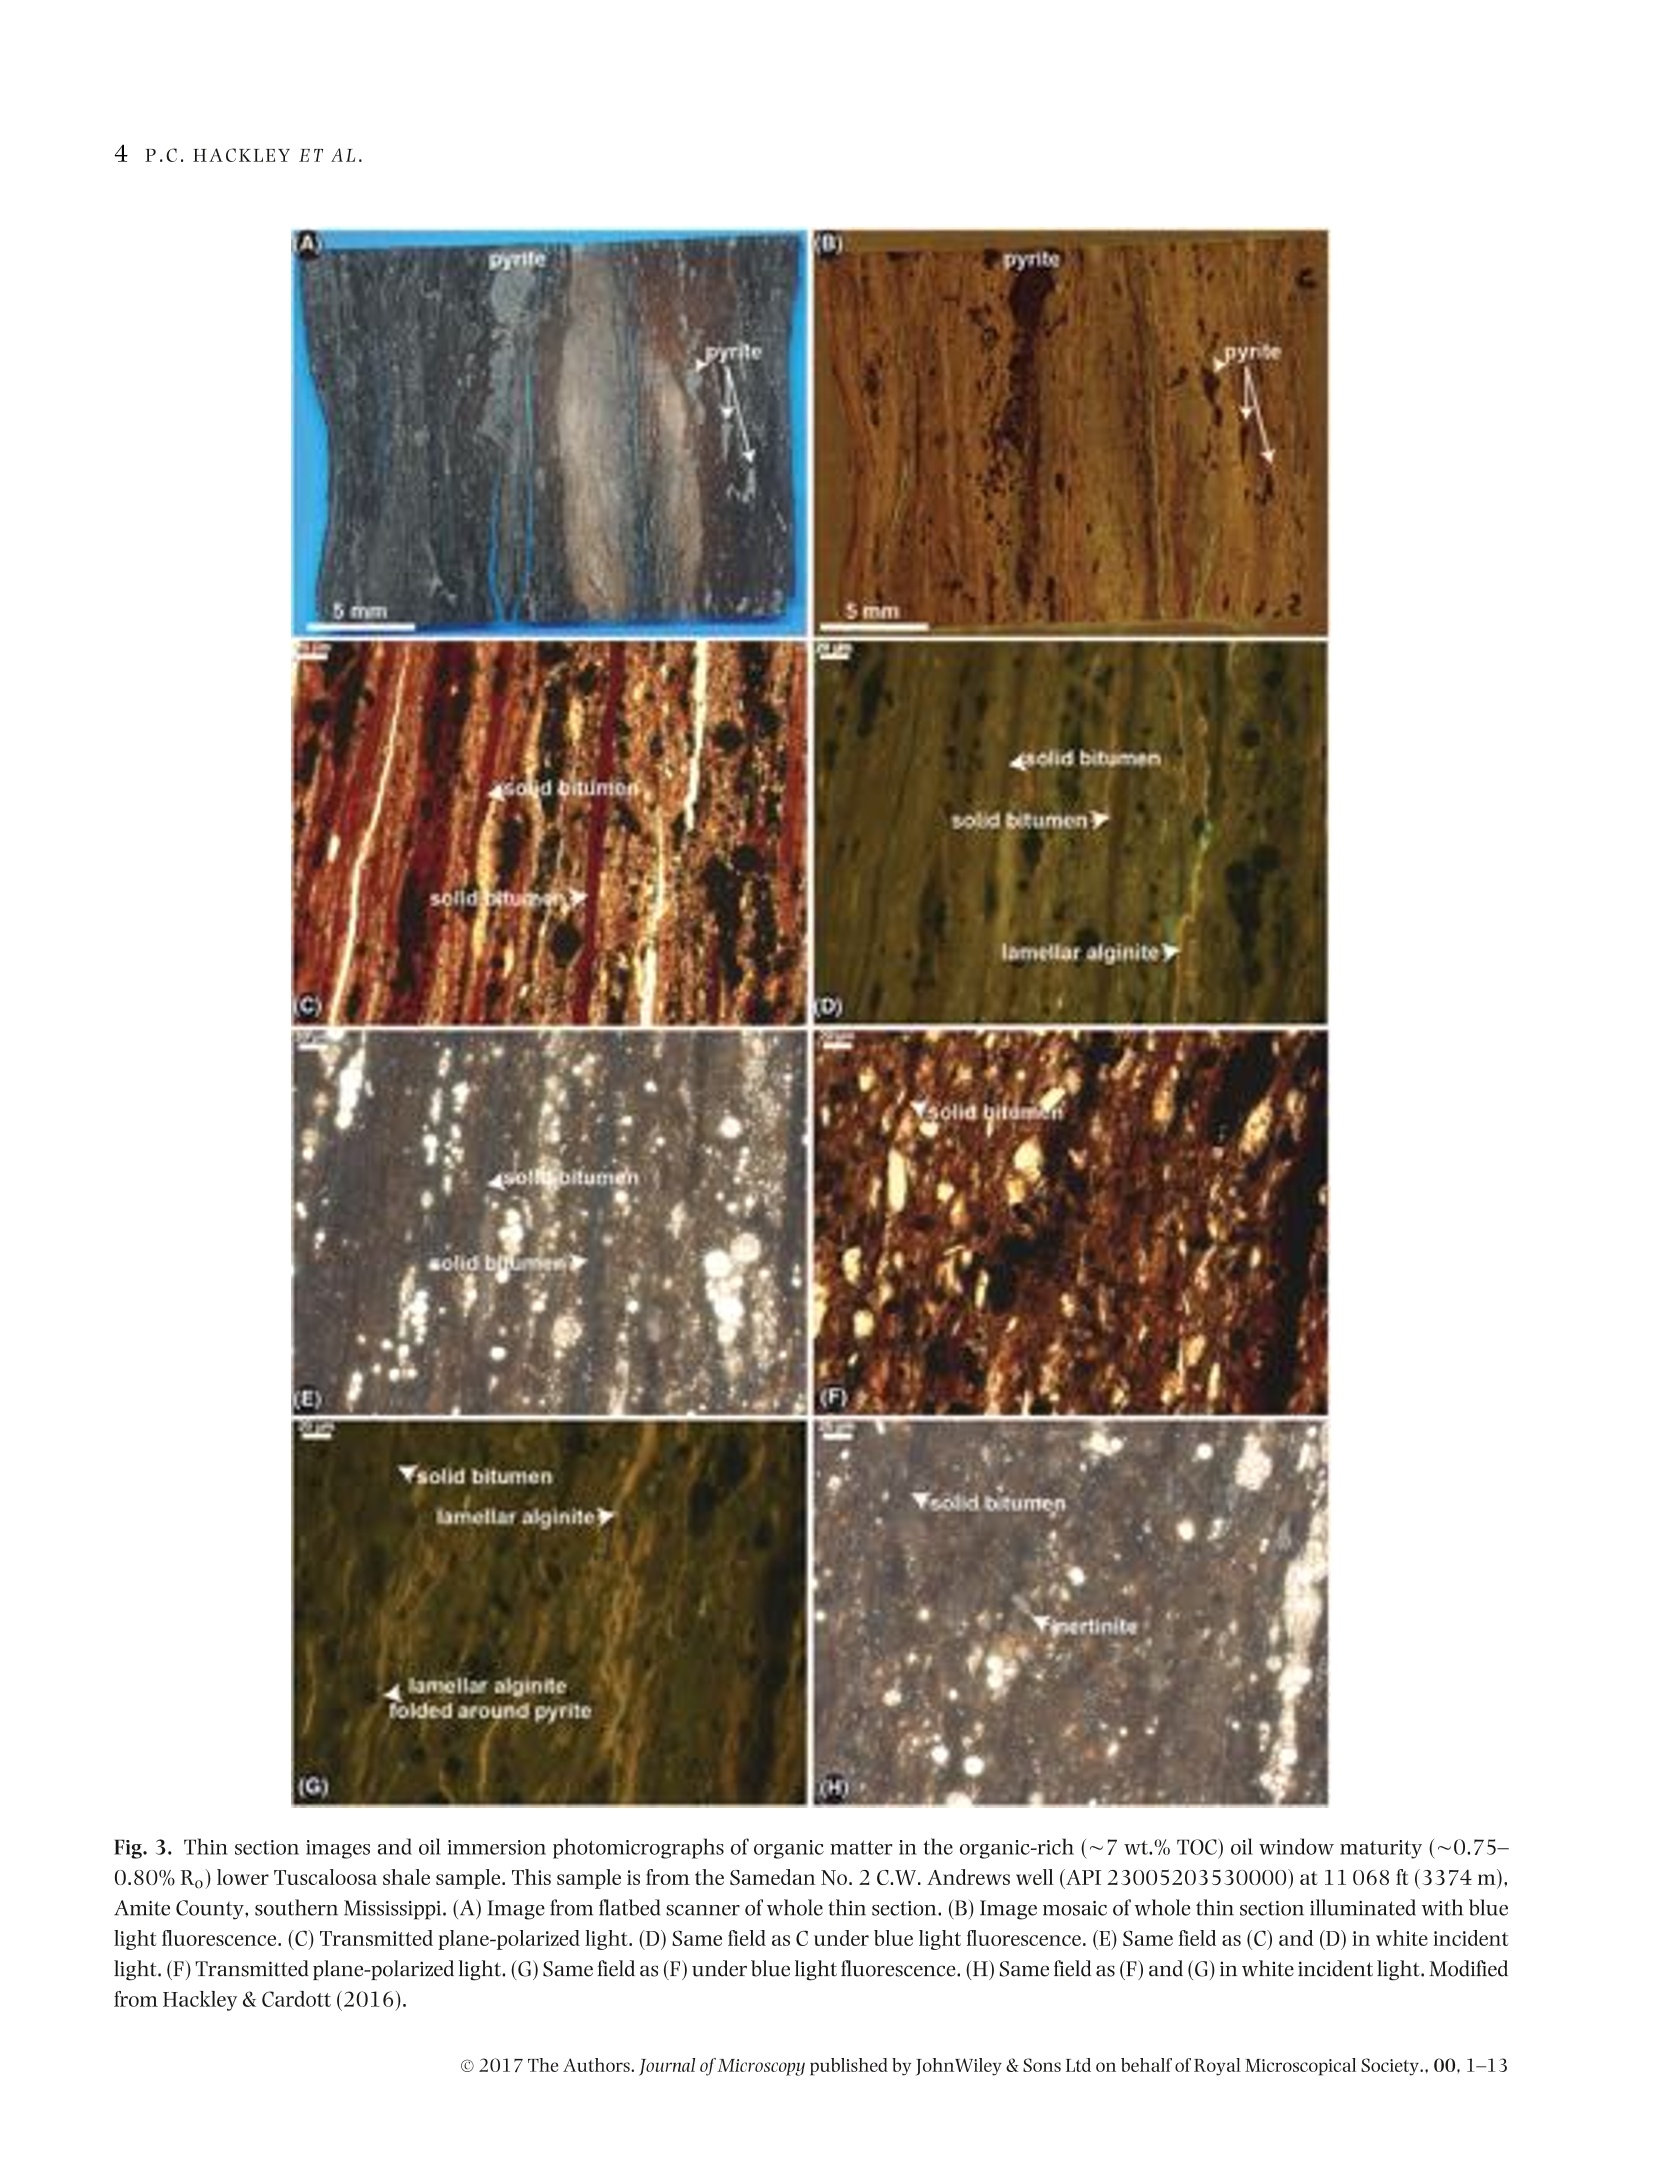
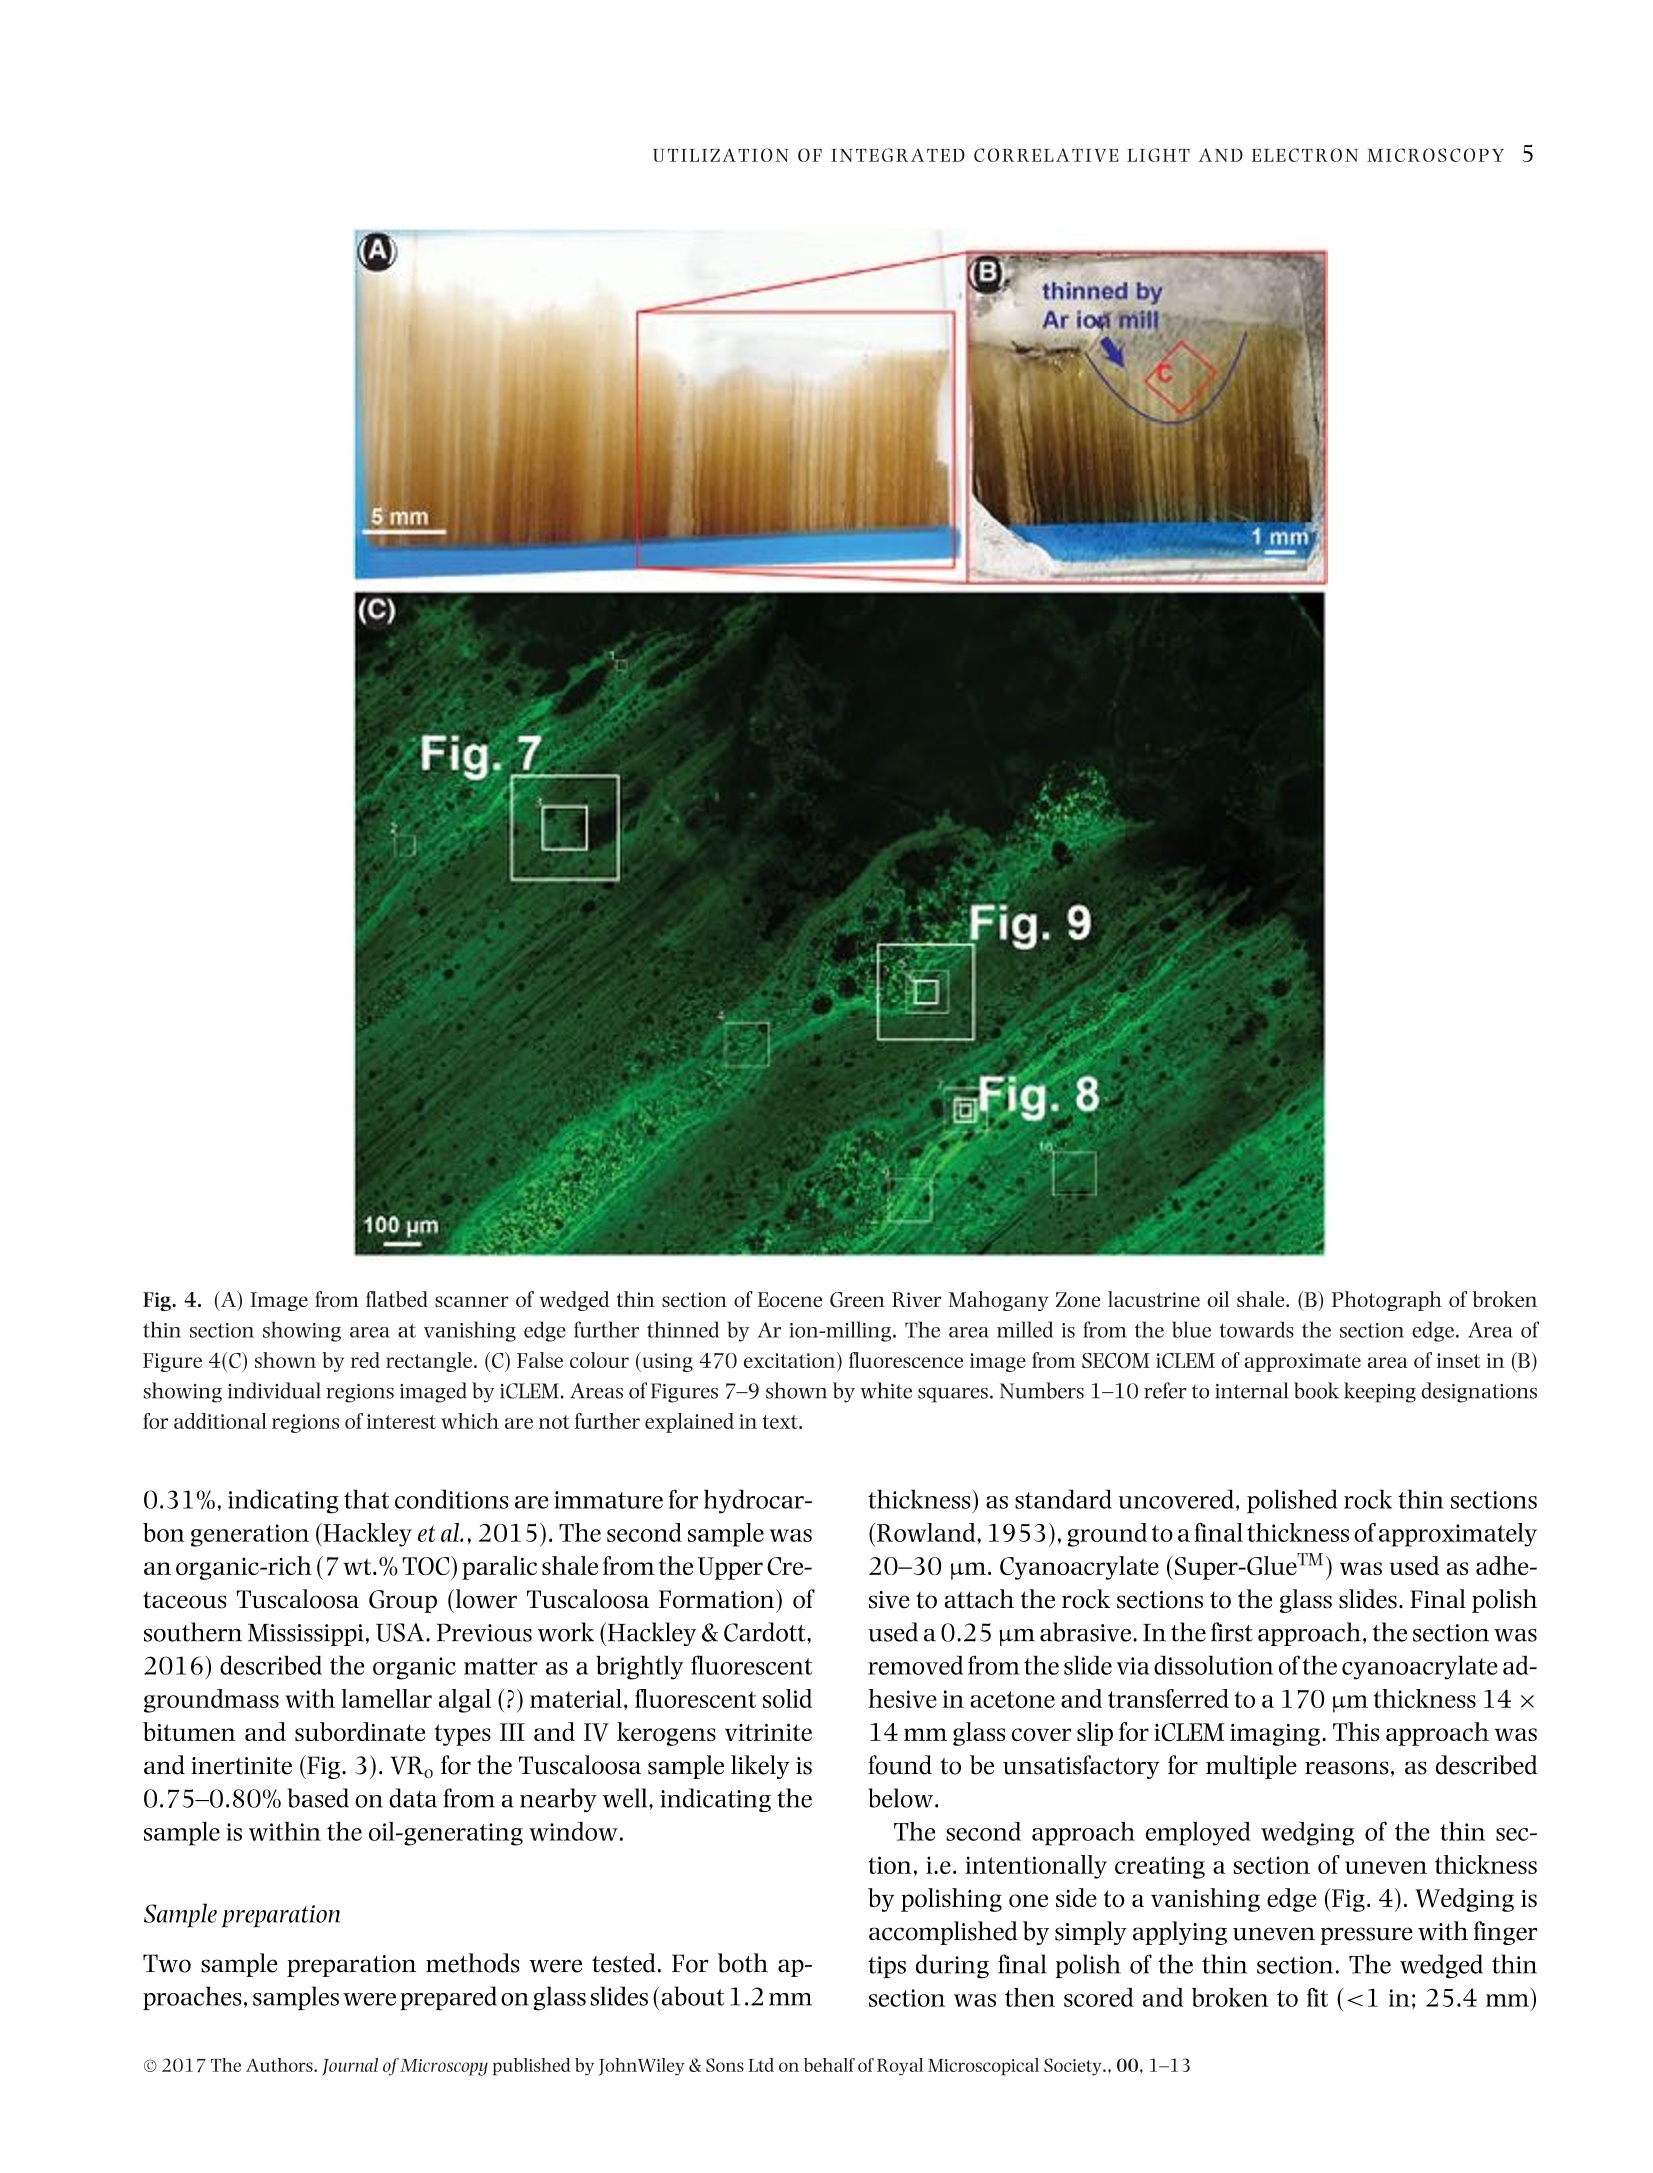
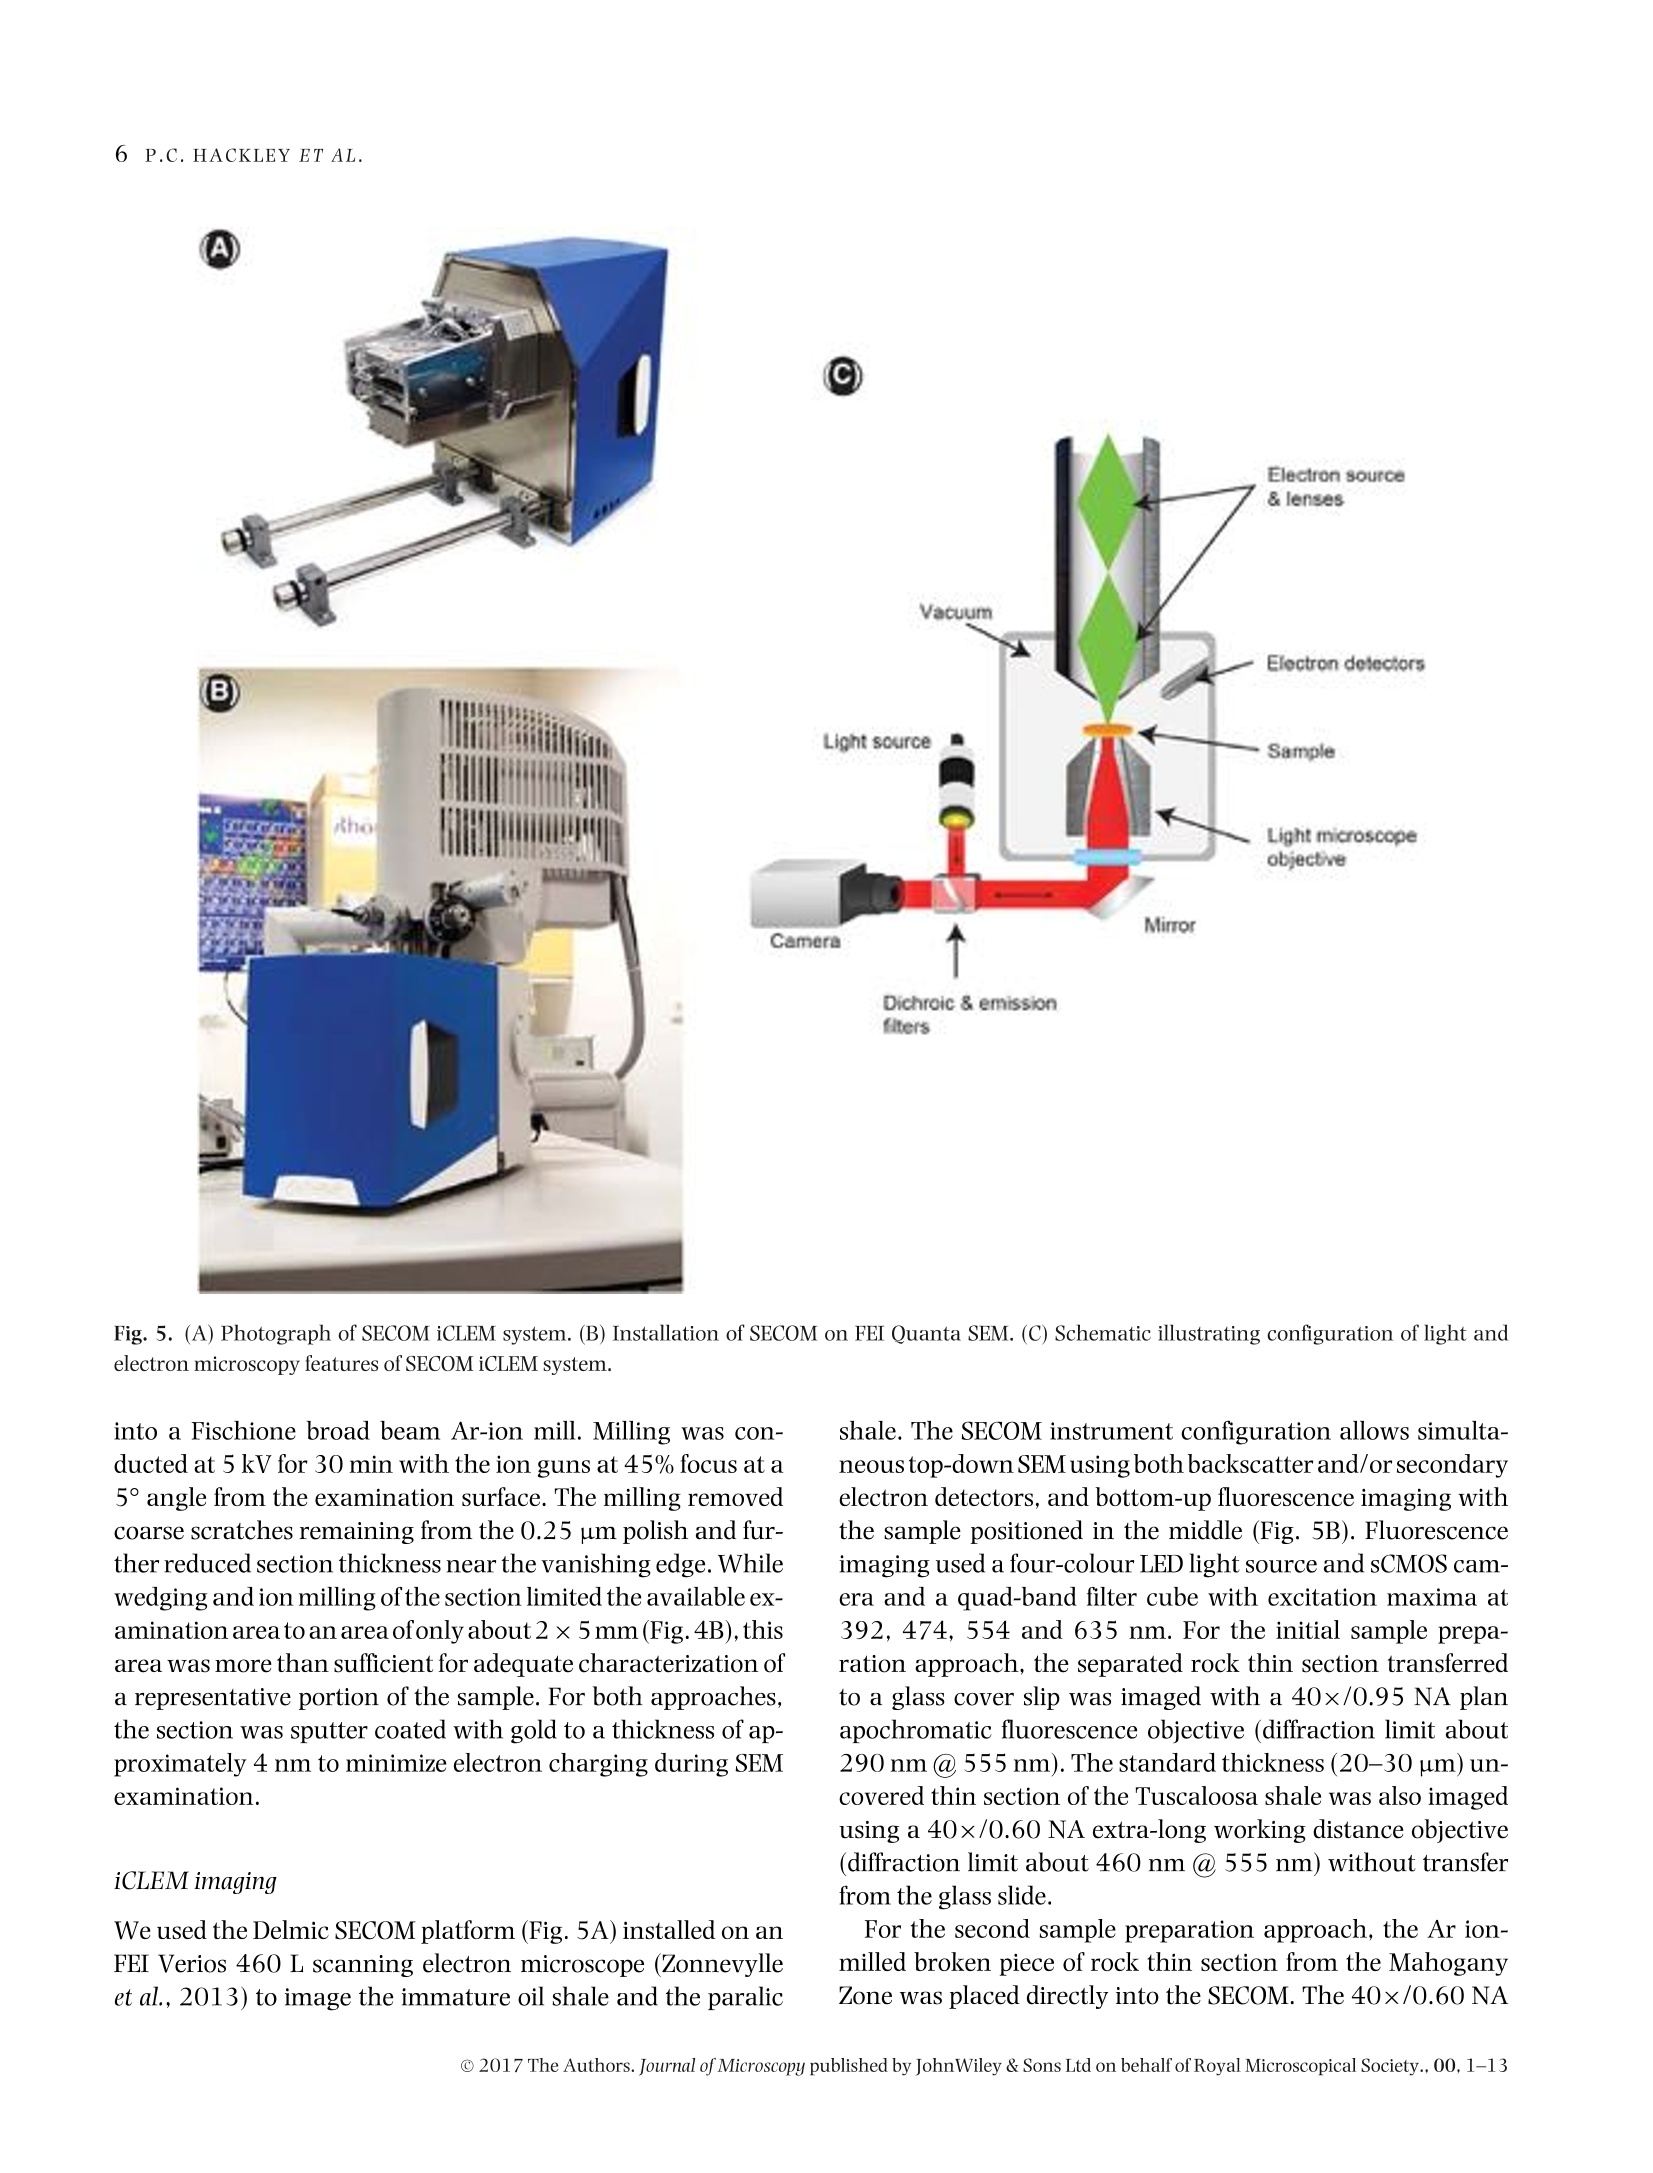
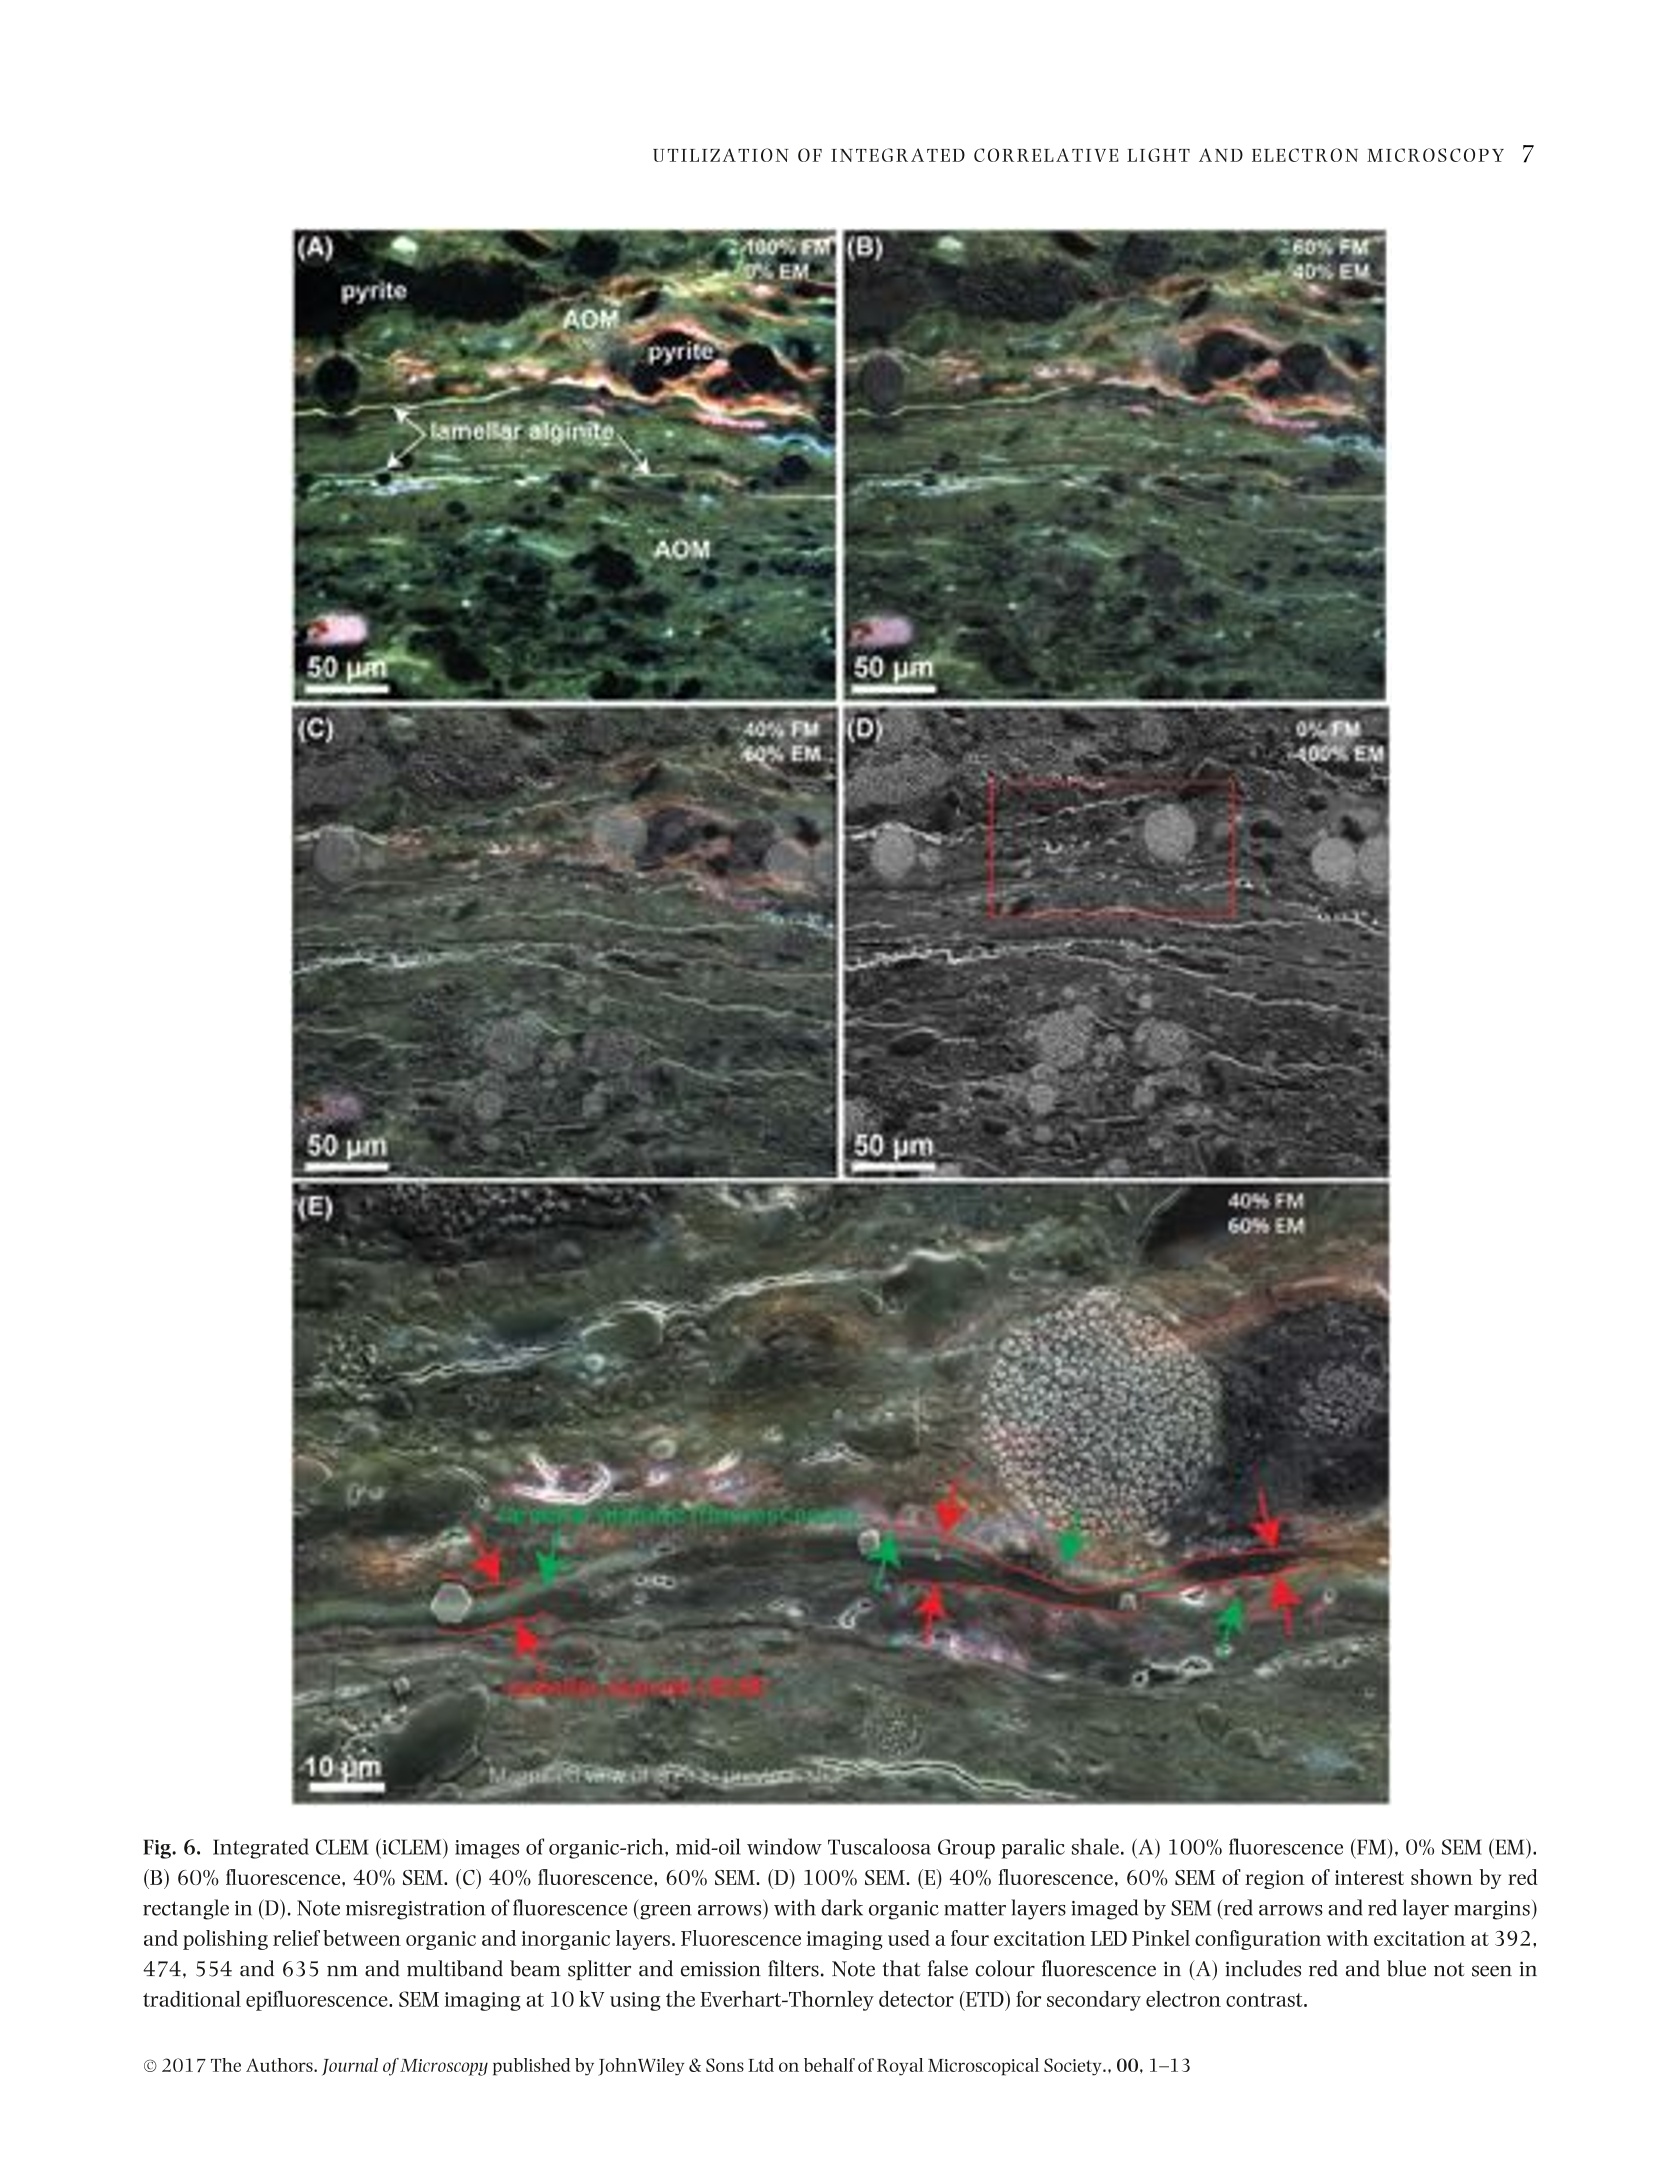
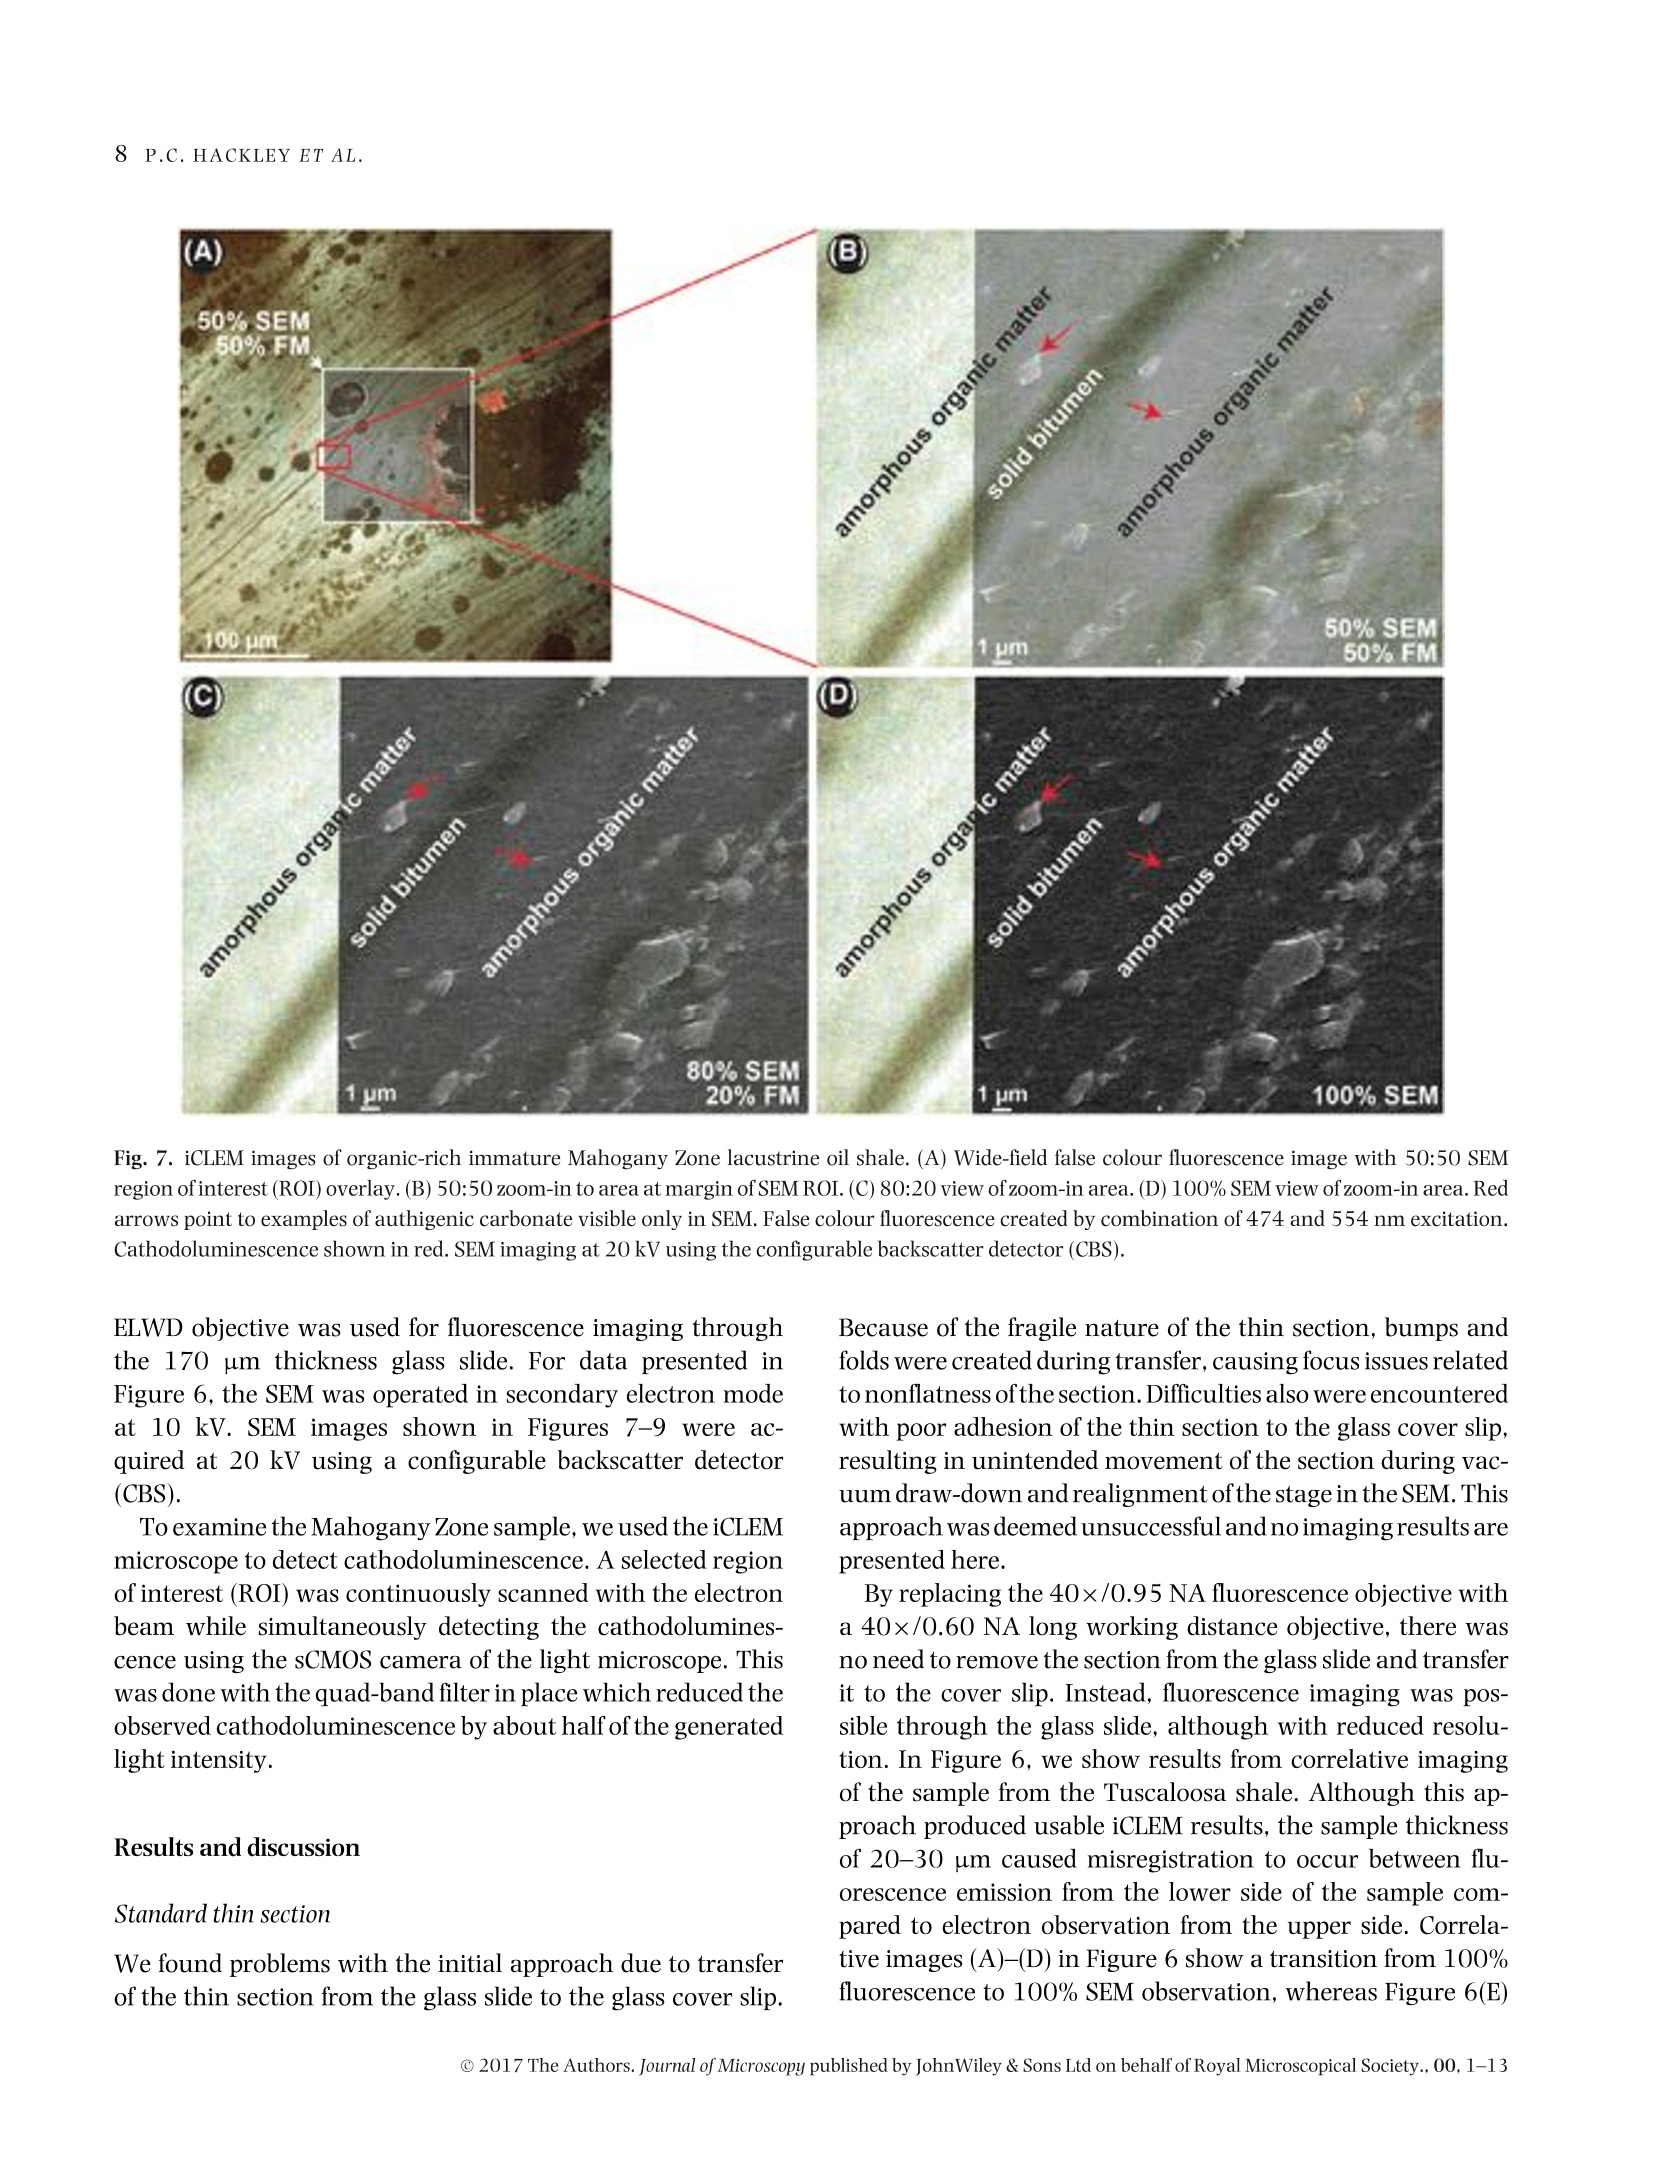
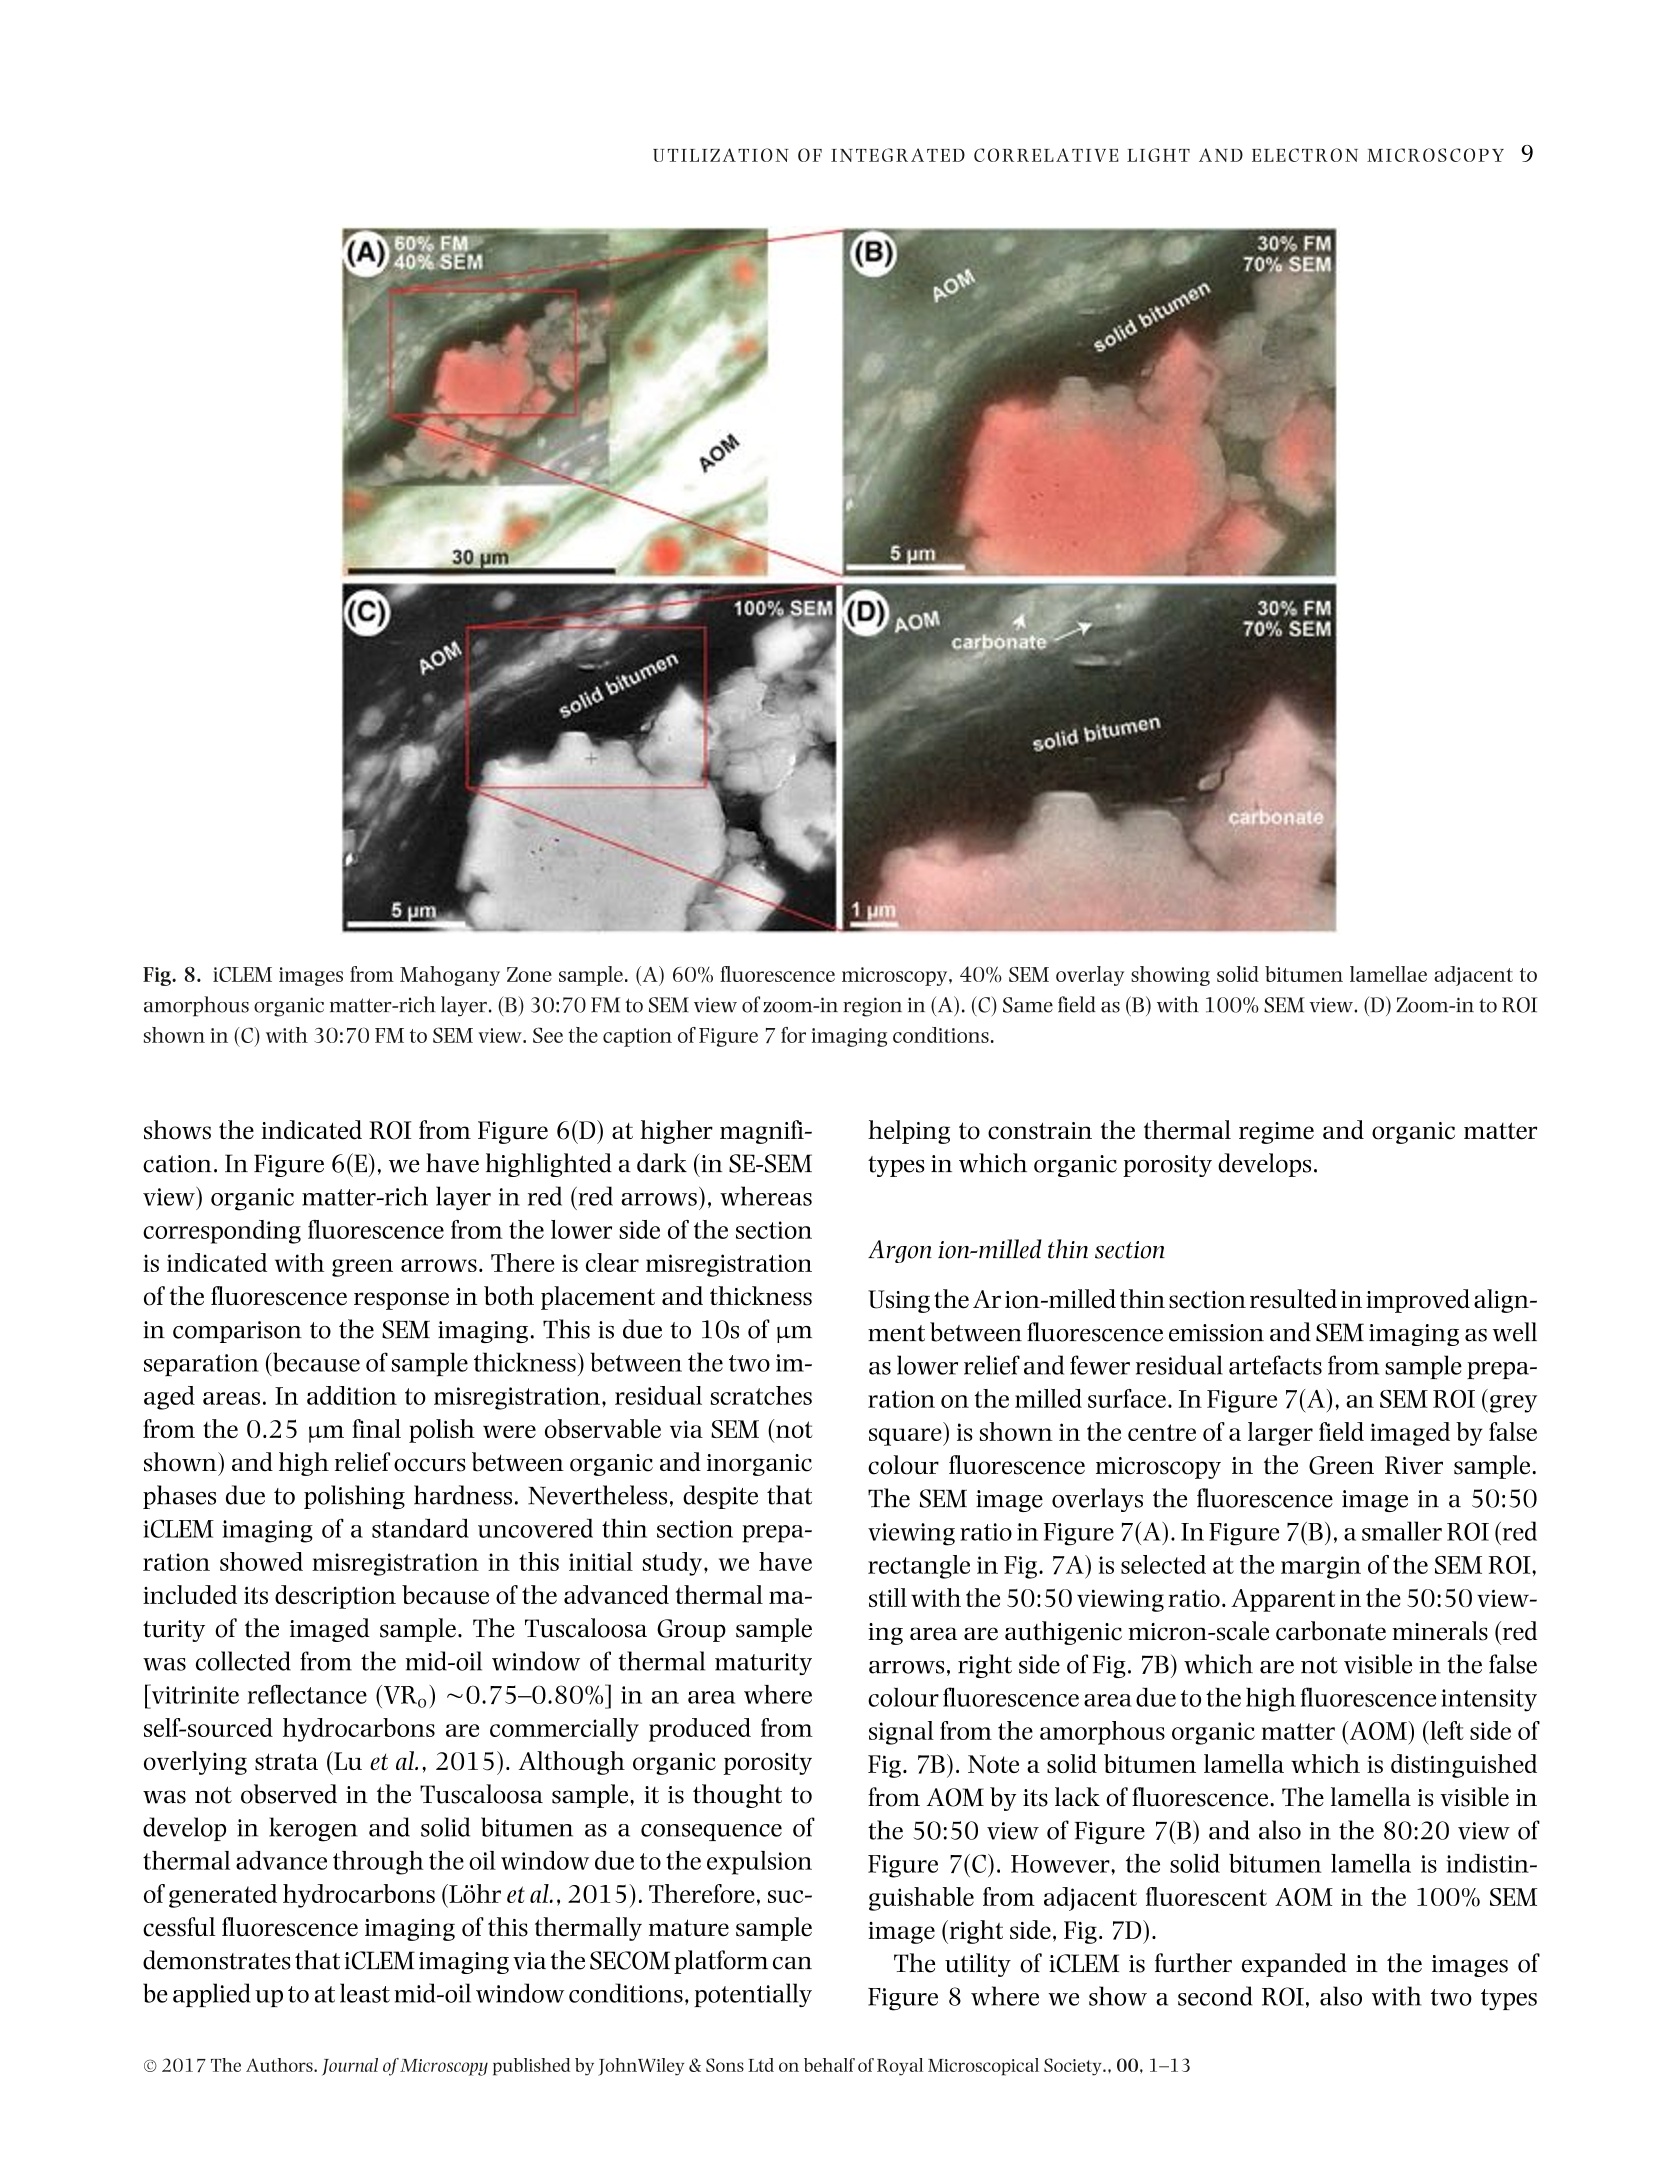
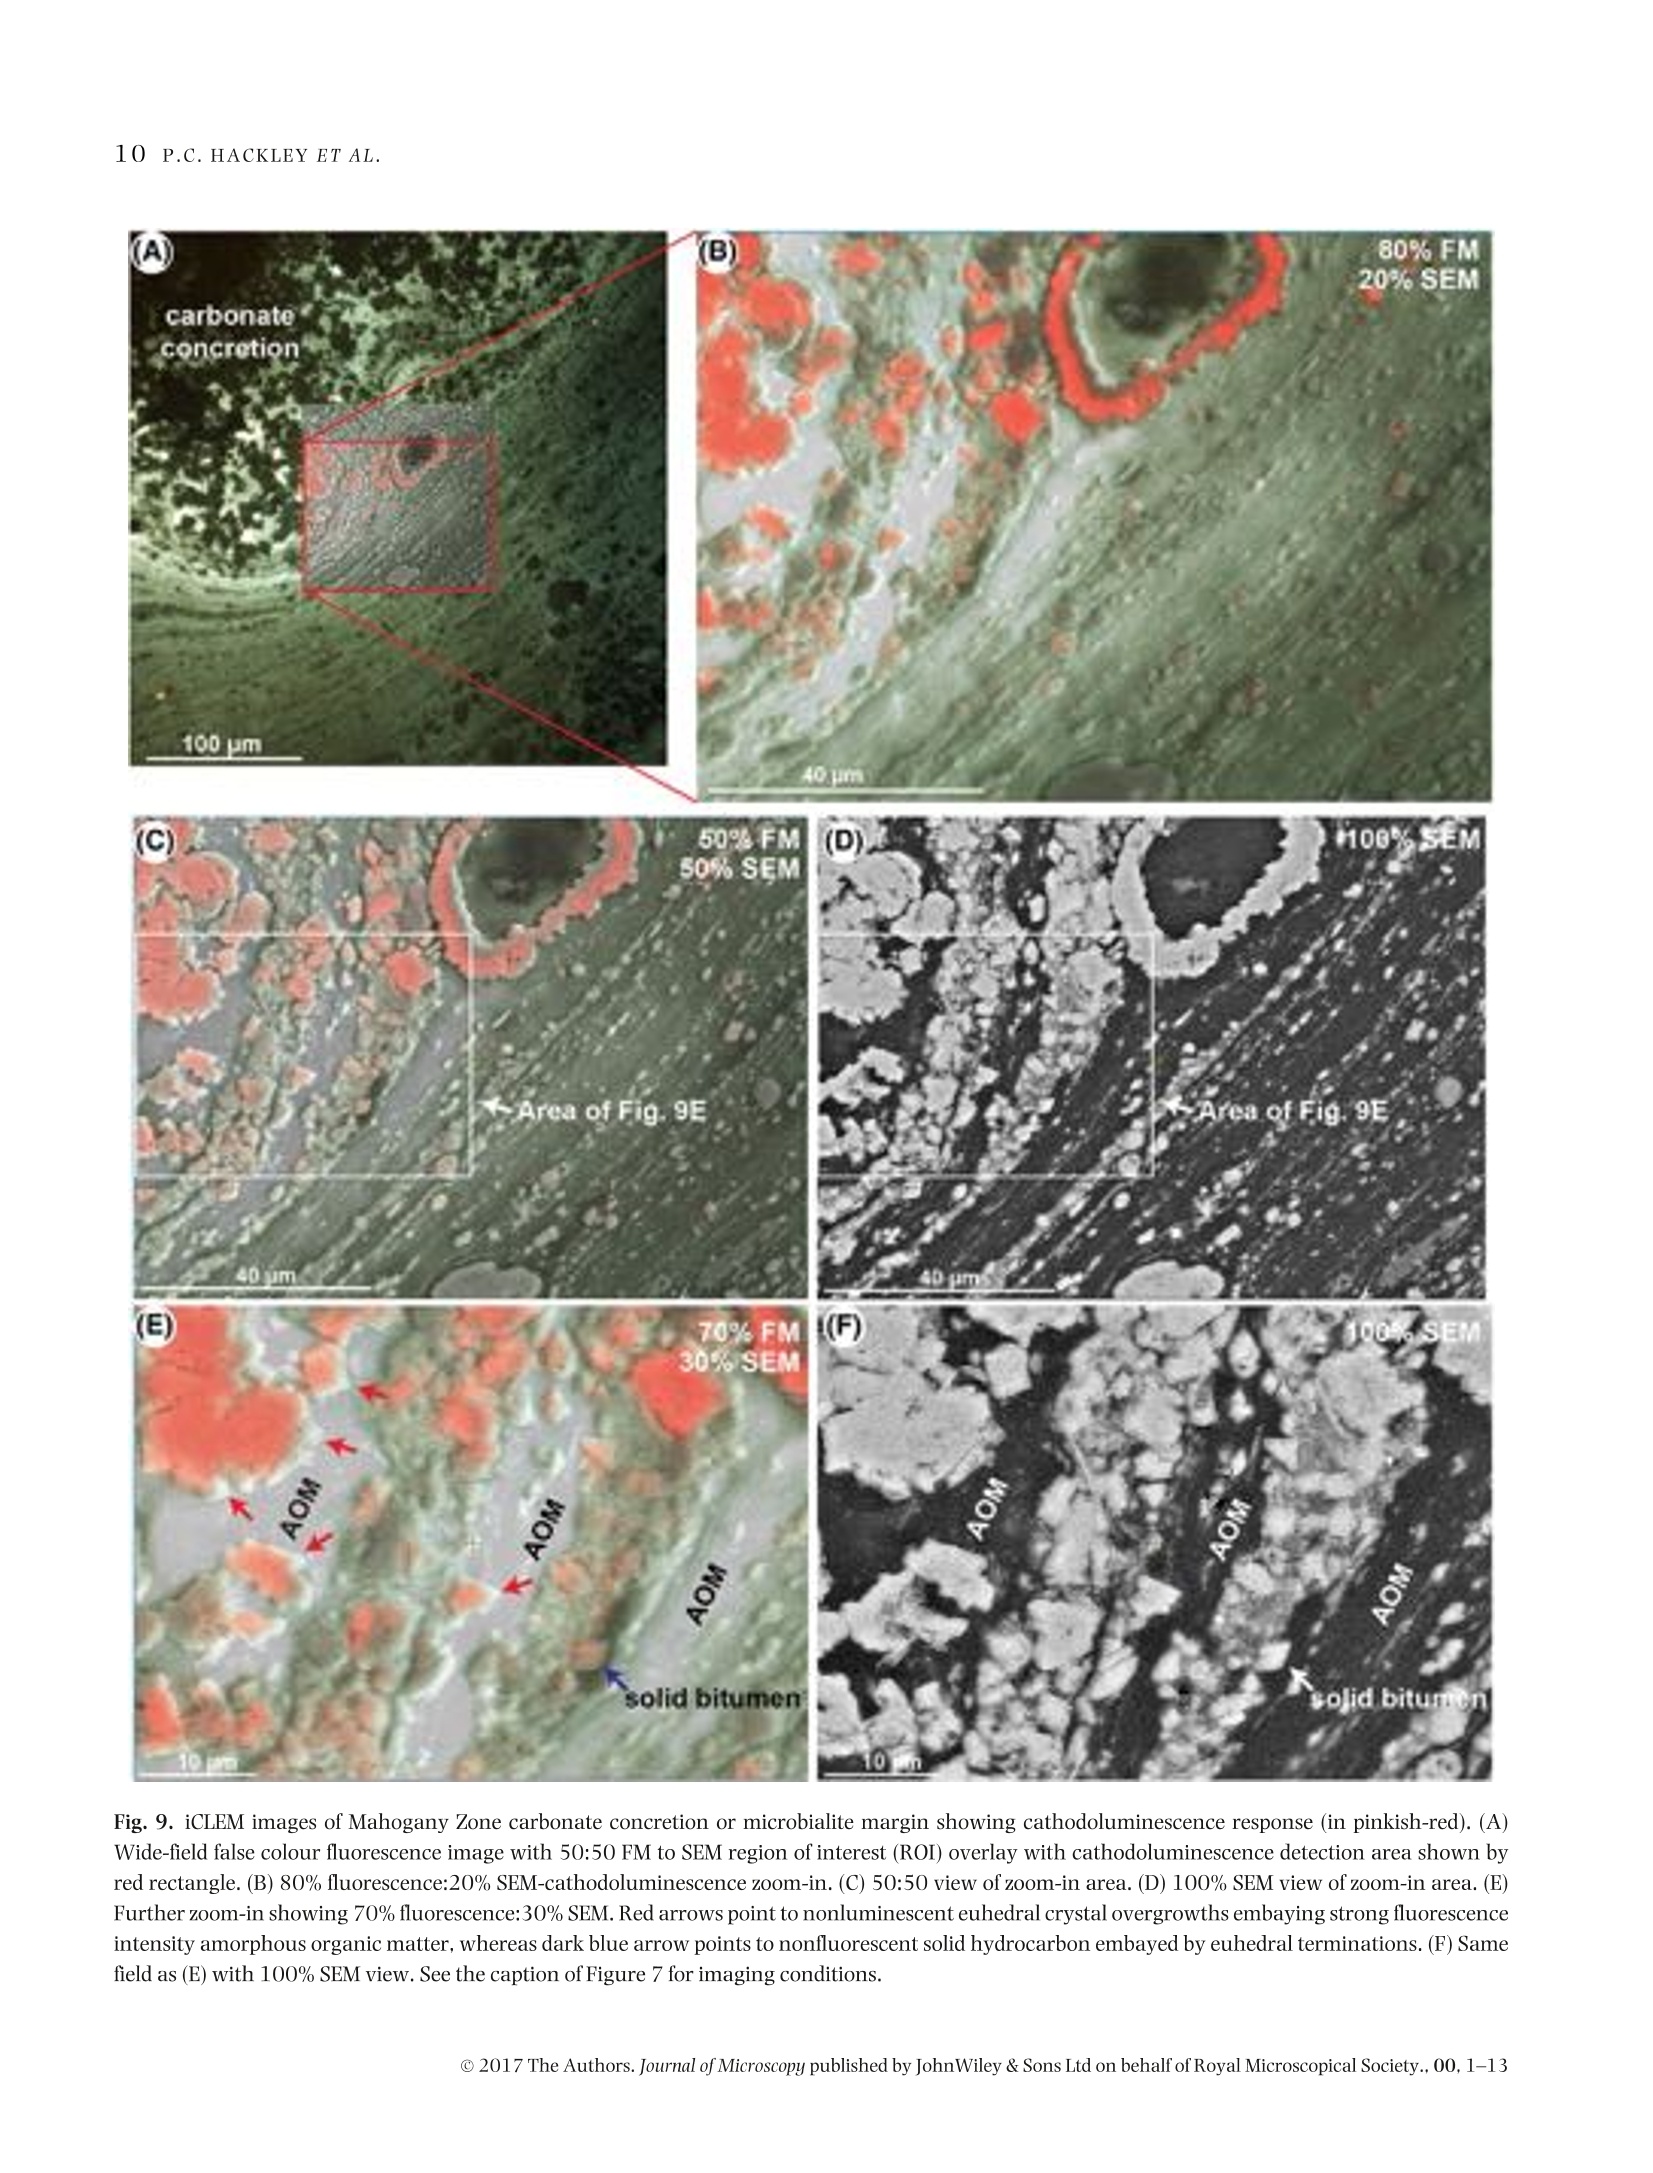
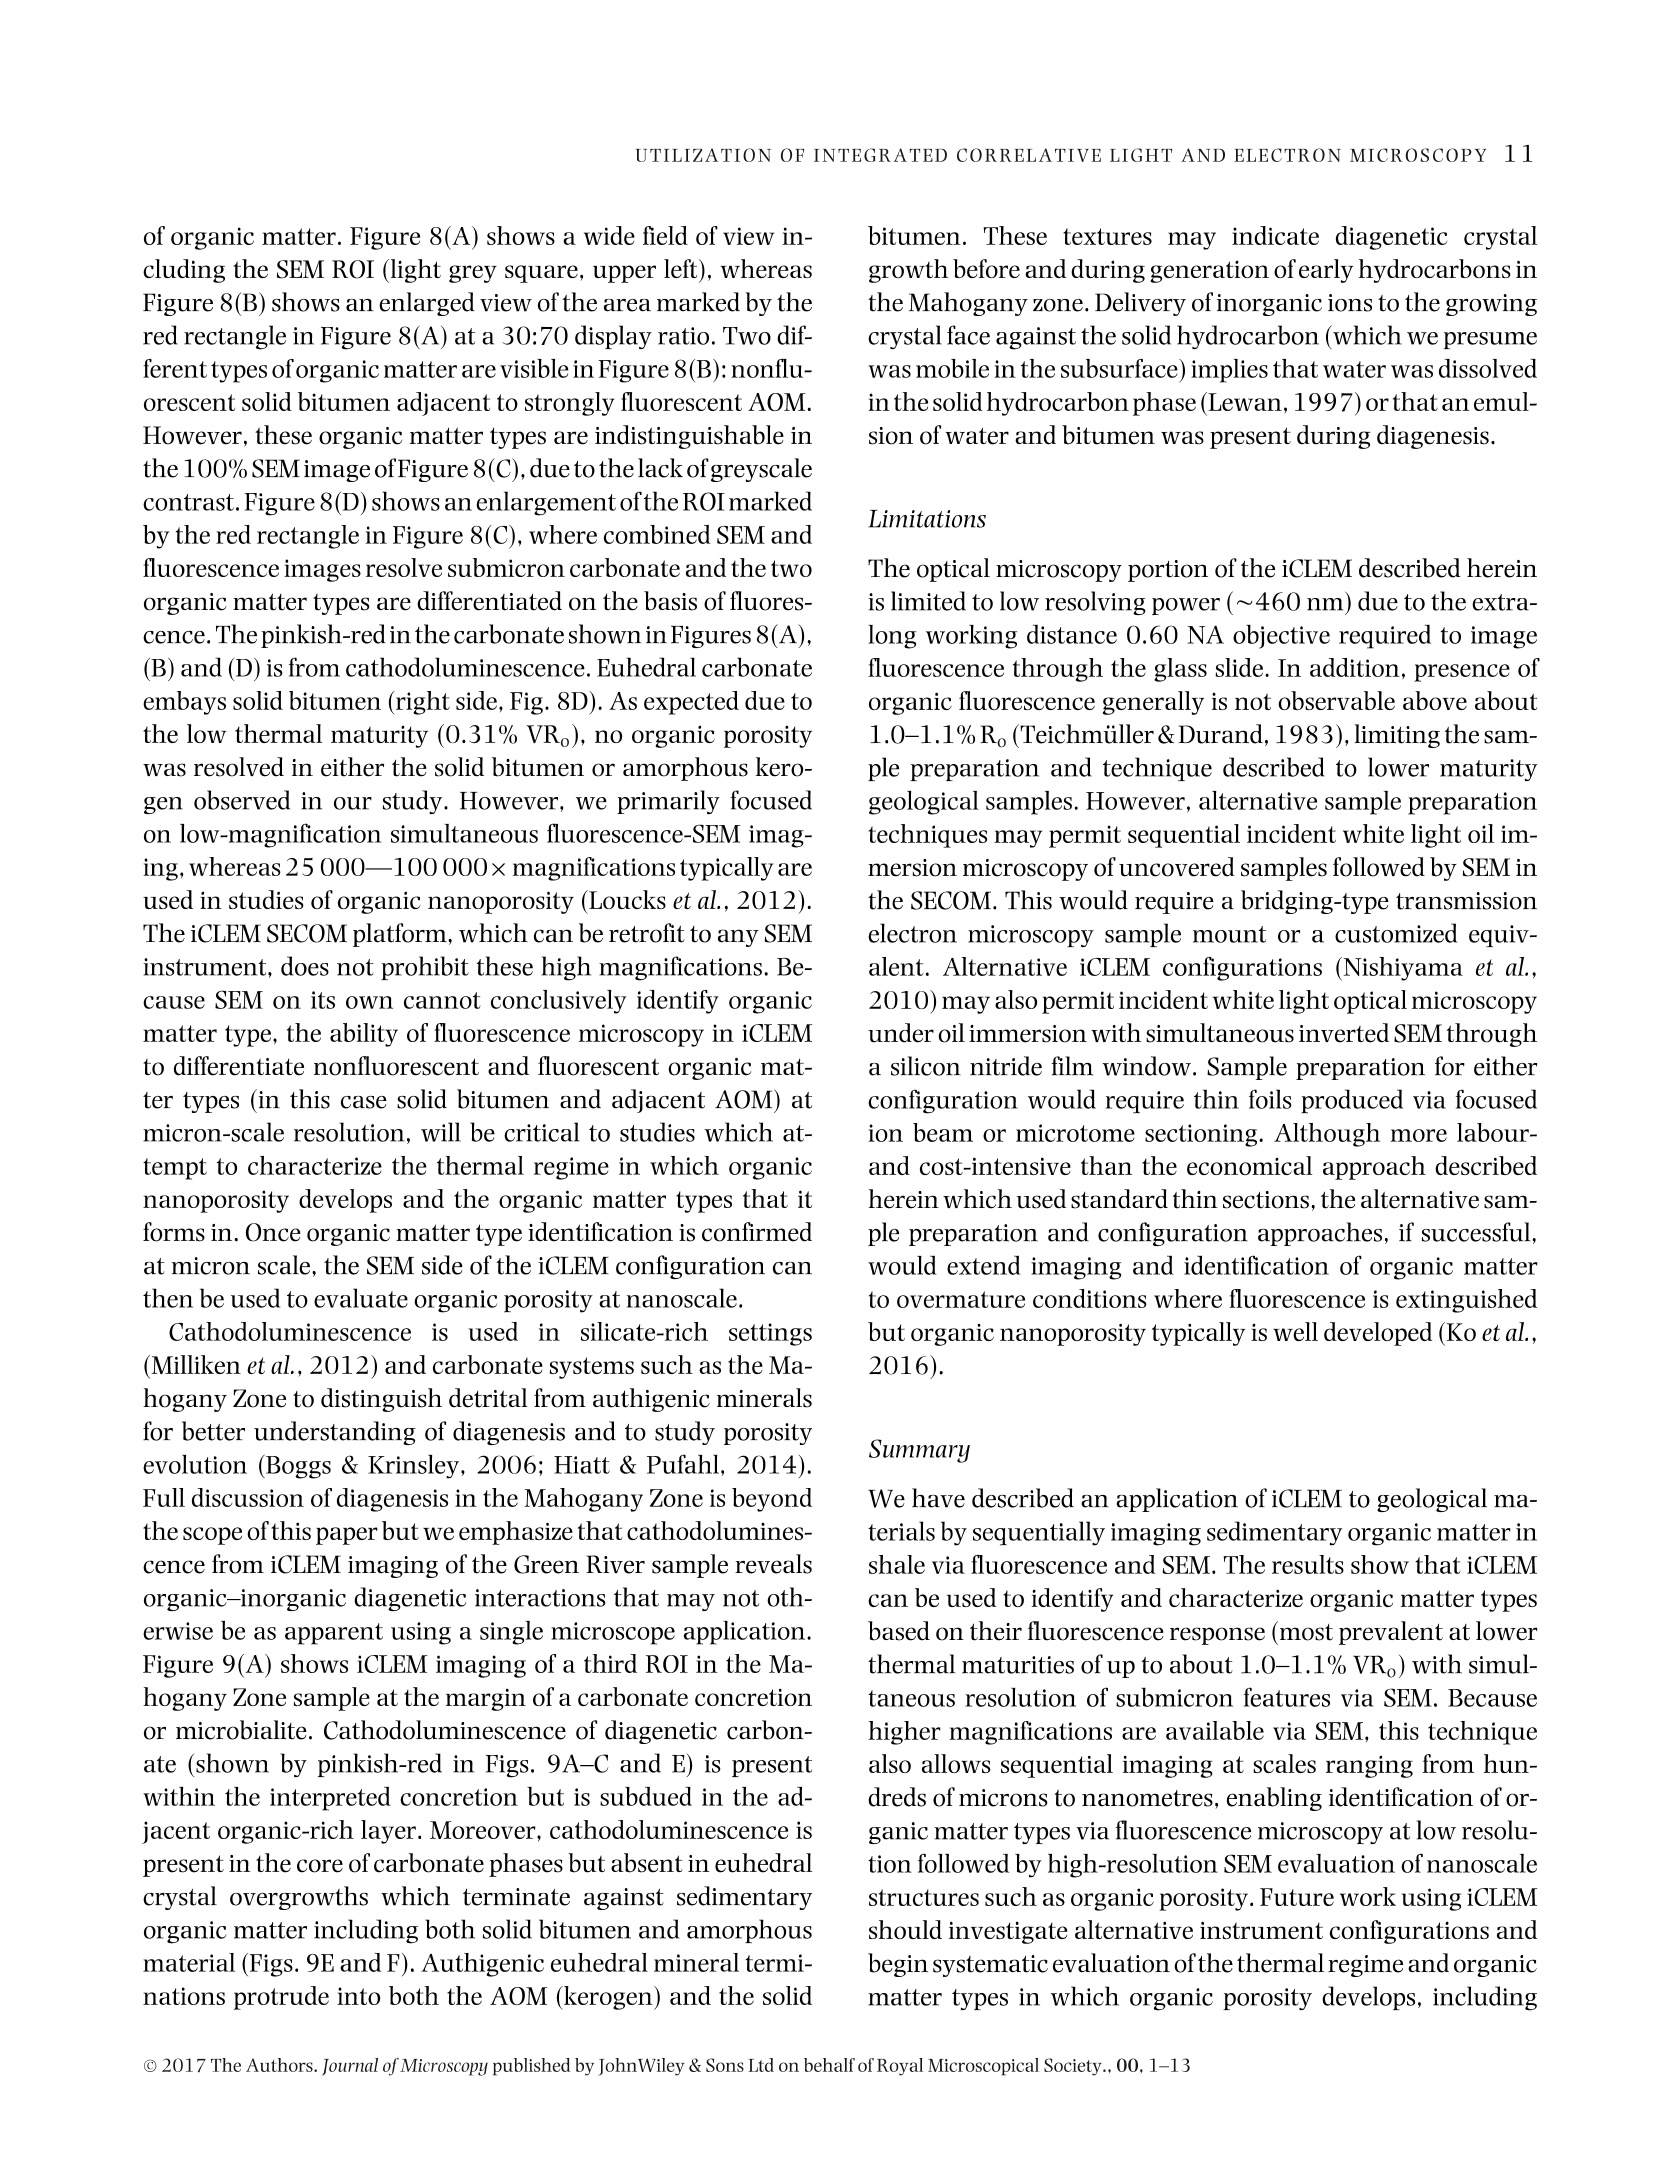
Microscopydoi: 10.1111/jmi.12576Journal of Microscopy, Vol.00, Issue 0 2017,pp. 1-13Received 22 December 2016; accepted 12 April 2017 2P.C.HACKLEY ET AL. Utilization of integrated correlative light and electron microscopy(iCLEM) for imaging sedimentary organic matter PAUL C. HACKLEY* , BRETT J.VALENTINE*,LENARD M. VOORTMANt, DAAN S.B. VAN OOSTEN SLINGELAND+& JAVIN HATCHERIAN* *U.S. Geological Survey, MS 956 National Center, Reston, Virginia, U.S.A. tDelmic BV, Delft, The Netherlands Key words. fluorescence microscopy, geological materials, iCLEM, integratedcorrelative light and electron microscopy, scanning electron microscopy,sedimentary organic matter, shale. Summary We report here a new microscopic technique for imaging andidentifying sedimentary organic matter in geologic materialsthat combines inverted fluorescence microscopy with scan-ning electron microscopy and allows for sequential imagingof the same region of interest without transferring the sam-ple between instruments. This integrated correlative light andelectron microscopy technique is demonstrated with observa-tions from an immature lacustrine oil shale from the EoceneGreen River Mahogany Zone and mid-oil window paralic shalefrom the Upper Cretaceous Tuscaloosa Group. This techniquehas the potential to allow for identification and characteriza-tion of organic matter in shale hydrocarbon reservoirs that isnot possible using either light or electron microscopy alone,and may be applied to understanding the organic matter typeand thermal regime in which organic nanoporosity forms,thereby reducing uncertainty in the estimation of undiscov-ered hydrocarbon resources. Introduction The development ofhydrocarbon production from shale reser-voirs in North America over the last decade has revitalizedthe use of scanning electron microscopy (SEM) to character-ize nanometre-scale textures in ion-milled sample prepara-tions. Investigators are particularly concerned with the in-terconnected nanoporosity contained in shale organic matter(Loucks etal.,2009;Loucksetal.,2012)thatis thought to formthe primary hydrocarbon migration pathway (permeability)and storage reservoir (porosity) (Lohr et al., 2015). Althoughorganic matter is easily identified in SEM by its characteristiclow backscatter electron (BSE) intensity (appearing dark grey ( Correspondence to: Paul Hackley, U. S . Geological Survey, MS 9 56 National Ce n ter, 1 2201 S u nrise V a lley Drive, R eston,V i rginia 20192, U.S.A. T e l:7 0 3-648-6458; fax: 703-648-6419; e-mail:phackley@usgs.gov ) in standard greyscale images), SEM is poorly suited to iden-tify the individual organic matter types, e.g. kerogen versussolid bitumen, which are easily recognized by standard opticalmicroscopy techniques (Hackley & Cardott,2016). The tradi-tional organic petrography approaches such as fluorescencemicroscopy and incident white light observation under oil im-mersion can provide conclusive identification of organic mat-ter. However, these optical techniques are limited by relativelylow magnifications (up to about 1500×) compared with thehigh-magnification capabilities of SEM (up to >100 000×).Some SEM practitioners have employed general morphologi-cal and textural rules of thumb’ for organic matter identifi-cation in SEM (Loucks & Reed, 2014;Camp,2016), but theseapproaches often are inconclusive. Because of this limitation,SEM, while invaluable for high-magnification shale reservoircharacterization and detection of organic nanoporosity, can-not conclusively identify the organic matter type in whichporosity has developed or the thermalregime at which it forms. Several studies have employed correlative microscopy tech-niques toidentify and characterize shale organic matter anditsporosity (Bernard et al., 2012; Fishman et al., 2012; Baruchet al., 2015; Cardott et al., 2015; Lohr et al., 2015;Camp,2016;Luo et al.,2016). However, these studies utilized mul-tiple instruments, which necessitates time-consuming samplemapping, sample transfer between instruments and reloca-tion of the regions of interest(Timmermans & Otto, 2015). Inaddition, this approach often involves collaboration betweenmultiple laboratories and analysts, thereby increasing diffi-culties for field relocation. reorientation and the likelihood forsample damage during transfer. Correlative light and electron microscopy (CLEM) tech-niques are widely applied in cellular biology (Polishchuk et al.,2000; Sartori et al.,2007; de Boer et al.,2015). IntegratedCLEM (iCLEM) techniques, where both imaging modalities areperformed sequentially in the same instrument without sam-ple transfer, have also been used in biology and biomedical ( This i s an open access article under the terms of the Creative Commons Attribution-NonCommercial License, which permit s use, distri b ution and reproduction in any medium, provided the original work is properly cited and is not us e d for commercial purposes. ) Fig.1. Correlativelight and electron microscopy images ofthe same field ofa low-maturity organic-rich Bakken Shale sample from NorthDakota,USA.(A)Secondary electron (SE) SEM image showing organic matter (dark grey to black). Greyscale contrast is evident on the high reflectance inertinite (red arrowin all four images) due to differences in relief. (B)Backscatterelectron(BSE) SEM image showing little contrast in dark grey to black organic matter.(A) and(B)collected using 5kV,10SI,5mm WD. (C) Whiteincidentlight oilimmersion image showing differences in reflectanceofthetwoinertinites, solid bitumenand amorphous organic matter of algal origin (Stasiuk & Fowler, 2004). (D) Blue light (BL) fluorescence image showing absence of autofluorescencein inertinite and solid bitumen and its presence in the amorphous organic matter. Blue light fluorescence imaging used 445 nm LED excitation with a482 nm beam splitter and 510 nm long-pass emission filter combination. From Valentine & Hackley (2016). Correlative imaging was performed usingsample transfer between two separate microscope systems: Leica DM-4000 for light microscopy and Hitachi SU-5000 FE-SEM for electron microscopy.Rr=random reflectance. See also http://energy.usgs.gov/Coal/OrganicPetrology/PhotomicrographAtlas/BakkenFormationShaleGallery.aspx. imaging (Agronskaia etal., 2008;Faasetal.,2013;Zonnevylleet al., 2013; Vidavsky et al., 2014;Brama et al.,2015;de Boeret al., 2015, among others). We describe, to our knowledge,the first application of iCLEM for geological materials, utiliz-ing simultaneous fluorescence and SEM to image sedimen-tary organic matter in shale, including an immature oil shalefrom the Eocene Green River Mahogany Zone, Colorado, USA,and from mid-oil window paralic shale of the Upper Creta-ceous Tuscaloosa Group, southern Mississippi, USA. Selectionof these samples was influenced by a recent correlative mi-croscopy study (Valentine &Hackley,2016) which illustratedutility of light microscopy versus SEM for differentiation oforganic matter types at low thermal maturities [0.32% solidbitumen reflectance (BR。)]. In particular, SEM imaging of a~60×75 um field in immature Bakken Shale via secondaryelectron (Fig.1A)and BSE (Fig.1B)showed little or no contrastbetween various forms oforganic matter that are easily distin-guished with reflected white light (Fig. 1C) and fluorescence microscopy (Fig.1D). Based on the results of this initial study,we tested the capabilities of iCLEM imaging for identificationand differentiation of organic matter types in the Green RiverMahogany Zone and Tuscaloosa Group samples. Methods Samples We used an organic-rich [22 wt.% total organic carbon (TOC)]lacustrine oil shale from the Eocene Green River MahoganyZone in Colorado, USA. Previous studies (Hackley et al., 2015)characterized the dominant organic matter in this sampleas strongly fluorescent amorphous and lamellar type I kero-gen interpreted as a benthic microbial mat deposit (Fig. 2).Scattered types ⅢI and IV kerogen (vitrinite and inertinite)and lamellae of solid bitumen (a solid hydrocarbon) are alsopresent. Vitrinite reflectance (VR。)ofthe Green River sample is Fig. 2. Conventional light microscopy of Eocene Green River Mahogany Zone lacustrine oil shale (collected from Anvil Points Mine, Rifle, Colorado).(A)Histogram of mean vitrinite reflectance measurements reported from multiple laboratories (Hackley et al.,2015). (B) Fluorescence spectrum (average of10 measurements) of amorphous organic matter showing peak fluorescence intensity at ~555 nm. Spectra were corrected to a common illuminationsource according to specific microscope conditions (Baranger et al.,1991). (C) Blue light fluorescence image of example amorphous organic matter fromwhich fluorescence spectra were collected (see filter settings in the caption of Fig. 1). (D) Image from flatbed scanner of whole thin section showingalternating organic-rich (darker) versus carbonate-rich (lighter)lamellae. (E) Image mosaic of whole thin section illuminated with blue light fluorescence(from high brightness 445 nm blue LED).(F) White incident light oil immersion photomicrograph showing grey solid bitumen lamellae and low-contrastamorphous organic matter (AOM). (G) Same field as F under blue light fluorescence (see filter settings in the caption of Fig. 1). Fig. 3. Thin section images and oil immersion photomicrographs of organic matter in the organic-rich (~7 wt.% TOC) oil window maturity (~0.75-0.80% R。) lower Tuscaloosa shale sample. This sample is from the Samedan No. 2 C.W. Andrews well (API 23005203530000) at 11068 ft (3374 m),Amite County, southern Mississippi. (A) Image from flatbed scanner of whole thin section. (B) Image mosaic of whole thin section illuminated with bluelight fluorescence.(C) Transmitted plane-polarized light. (D) Same field as C under blue light fluorescence. (E) Same field as (C) and (D) in white incidentlight.(F) Transmitted plane-polarized light.(G) Same field as (F) under blue light fluorescence.(H) Same field as (F) and (G) in white incident light. Modifiedfrom Hackley & Cardott (2016). Fig. 4. (A) Image from flatbed scanner of wedged thin section of Eocene Green River Mahogany Zone lacustrine oil shale. (B) Photograph of brokenthin section showing area at vanishing edge further thinned by Ar ion-milling. The area milled is from the blue towards the section edge. Area ofFigure 4(C) shown by red rectangle. (C) False colour (using 470 excitation) fluorescence image from SECOM iCLEM of approximate area of inset in (B)showing individual regions imaged by iCLEM. Areas of Figures 7-9 shown by white squares. Numbers 1-10 refer to internal book keeping designationsfor additional regions of interest which are not further explained in text. 0.31%, indicating that conditions are immature for hydrocar-bon generation (Hackley et al., 2015). The second sample wasan organic-rich (7 wt.%TOC)paralic shale from the Upper Cre-taceous Tuscaloosa Group (lower Tuscaloosa Formation) ofsouthern Mississippi, USA. Previous work (Hackley &Cardott,2016) described the organic matter as a brightly fluorescentgroundmass with lamellar algal (?) material, fluorescent solidbitumen and subordinate types ⅢI and IV kerogens vitriniteand inertinite (Fig. 3). VR, for the Tuscaloosa sample likely is0.75-0.80% based on data from a nearby well, indicating thesample is within the oil-generating window. Sample preparation Two sample preparation methods were tested. For both ap-proaches, samples were prepared on glass slides (about 1.2 mm thickness) as standard uncovered, polished rock thin sections(Rowland,1953),ground to a final thickness ofapproximately20-30 pm. Cyanoacrylate (Super-GlueM) was used as adhe-sive to attach the rock sections to the glass slides. Final polishused a 0.25 pm abrasive. In the first approach, the section wasremoved from the slide via dissolution ofthe cyanoacrylate ad-hesive in acetone and transferred to a 170 um thickness 14 ×14 mm glass cover slip for iCLEM imaging. This approach wasfound to be unsatisfactory for multiple reasons, as describedbelow. The second approach employed wedging of the thin sec-tion, i.e. intentionally creating a section of uneven thicknessby polishing one side to a vanishing edge (Fig. 4). Wedging isaccomplished by simply applying uneven pressure with fingertips during final polish of the thin section. The wedged thinsection was then scored and broken to fit (<1 in; 25.4 mm) YA Fig. 5. (A) Photograph of SECOM iCLEM system. (B) Installation of SECOM on FEI Quanta SEM. (C) Schematic illustrating configuration of light andelectron microscopy features of SECOM iCLEM system. into aFischione broad beam Ar-ion mill. Milling was con-ducted at 5 kV for 30 min with the ion guns at 45% focus at a5° angle from the examination surface. The milling removedcoarse scratches remaining from the 0.25 um polish and fur-ther reduced section thickness near the vanishing edge. Whilewedging and ion milling of the section limited the available ex-amination area to an area ofonly about 2×5mm(Fig.4B), thisarea was more than sufficient for adequate characterization ofa representative portion of the sample. For both approaches,the section was sputter coated with gold to a thickness of ap-proximately 4 nm to minimize electron charging during SEMexamination. iCLEM imaging We used the Delmic SECOM platform (Fig. 5A) installed on anFEI Verios 460 L scanning electron microscope (Zonnevylleet al., 2013) to image the immature oil shale and the paralic shale. The SECOM instrument configuration allows simulta-neoustop-down SEMusing both backscatter and/or secondaryelectron detectors, and bottom-up fluorescence imaging withthe sample positioned in the middle (Fig. 5B). Fluorescenceimaging used a four-colour LED light source and sCMOS cam-era and a quad-band filter cube with excitation maxima at392, 474, 554 and 635 nm. For the initial sample prepa-ration approach, the separated rock thin section transferredto a glass cover slip was imaged with a 40x/0.95 NA planapochromatic fluorescence objective (diffraction limit about290 nm @555 nm). The standard thickness (20-30 um) un-covered thin section of the Tuscaloosa shale was also imagedusing a 40×/0.60 NA extra-long working distance objective(diffraction limit about 460 nm @ 555 nm) without transferfrom the glass slide. For the second sample preparation approach,the Ar ion-milled broken piece of rock thin section from the MahoganyZone was placed directly into the SECOM. The 40×/0.60 NA Fig. 6. Integrated CLEM (iCLEM) images of organic-rich, mid-oil window Tuscaloosa Group paralic shale. (A) 100% fluorescence (FM), 0% SEM (EM).(B) 60% fluorescence, 40% SEM. (C) 40% fluorescence, 60% SEM.(D) 100% SEM. (E) 40% fluorescence, 60% SEM of region of interest shown by redrectangle in (D). Note misregistration of fluorescence (green arrows) with dark organic matter layers imaged by SEM (red arrows and red layer margins)and polishing relief between organic and inorganic layers. Fluorescence imaging used a four excitation LED Pinkel configuration with excitation at 392,474, 554 and 635 nm and multiband beam splitter and emission filters. Note that false colour fluorescence in (A) includes red and blue not seen intraditional epifluorescence. SEM imaging at 10 kV using the Everhart-Thornley detector (ETD) for secondary electron contrast. Fig. 7. iCLEM images of organic-rich immature Mahogany Zone lacustrine oil shale. (A) Wide-field false colour fluorescence image with 50:50 SEMregion ofinterest (ROI) overlay.(B) 50:50 zoom-in to area at margin of SEM ROI. (C) 80:20 view ofzoom-in area. (D) 100% SEM view of zoom-in area. Redarrows point to examples of authigenic carbonate visible only in SEM. False colour fluorescence created by combination of 474 and 554 nm excitation.Cathodoluminescence shown in red. SEM imaging at 20 kV using the configurable backscatter detector (CBS). ELWD objective was used for fluorescence imaging throughthe 170 um thickness glass slide. For data presented inFigure 6, the SEM was operated in secondary electron modeat 10 kV. SEM images shown in Figures 7-9 were ac-quired at 20 kV using a configurable backscatter detector(CBS). To examine the Mahogany Zone sample, we used the iCLEMmicroscope to detect cathodoluminescence. A selected regionof interest (ROI) was continuously scanned with the electronbeam while simultaneously detecting the cathodolumines-cence using the sCMOS camera of the light microscope. Thiswas done with the quad-band filter in place which reduced theobserved cathodoluminescence by abouthalf of the generatedlight intensity. Results and discussion Standard thin section We found problems with the initial approach due to transferof the thin section from the glass slide to the glass cover slip. Because of the fragile nature of the thin section, bumps andfolds were created during transfer, causing focus issues relatedto nonflatness ofthe section.Difficulties also were encounteredwith poor adhesion of the thin section to the glass cover slip,resulting in unintended movement of the section during vac-uum draw-down andrealignment ofthe stage in the SEM. Thisapproach was deemedunsuccessful andnoimaging results arepresented here. By replacing the 40×/0.95 NA fluorescence objective witha 40×/0.60 NA long working distance objective, there wasno need to remove the section from the glass slide and transferit to the cover slip. Instead, fluorescence imaging was pos-sible through the glass slide, although with reduced resolu-tion. In Figure 6, we show results from correlative imagingof the sample from the Tuscaloosa shale. Although this ap-proach produced usable iCLEM results, the sample thicknessof 20-30 um caused misregistration to occur between flu-orescence emission from the lower side of the samplecom-pared to electron observation from the upper side. Correla-tive images (A)-(D) in Figure 6 show a transition from 100%fluorescence to 100% SEM observation, whereas Figure 6(E) Fig. 8. iCLEM images from Mahogany Zone sample. (A) 60% fluorescence microscopy, 40% SEM overlay showing solid bitumen lamellae adjacent toamorphous organic matter-rich layer.(B) 30:70 FM to SEM view of zoom-in region in (A). (C) Same field as (B) with 100% SEM view. (D) Zoom-in to ROIshown in (C) with 30:70 FM to SEM view. See the caption of Figure 7 for imaging conditions. shows the indicated ROI from Figure 6(D) at higher magnifi-cation. In Figure 6(E), we have highlighted a dark (in SE-SEMview) organic matter-rich layer in red (red arrows), whereascorresponding fluorescence from the lower side of the sectionis indicated with green arrows. There is clear misregistrationof the fluorescence response in both placement and thicknessin comparison to the SEM imaging. This is due to 10s of umseparation (because of sample thickness) between the two im-aged areas. In addition to misregistration, residual scratchesfrom the 0.25 um final polish were observable via SEM (notshown) and high reliefoccurs between organic and inorganicphases due to polishing hardness. Nevertheless, despite thatiCLEM imaging of a standard uncovered thin section prepa-ration showed misregistration in this initial study, we haveincluded its description because of the advanced thermal ma-turity of the imaged sample. The Tuscaloosa Group samplewas collected from the mid-oil window of thermal maturity[vitrinite reflectance (VR。)~0.75-0.80%] in an area whereself-sourced hydrocarbons are commercially produced fromoverlying strata (Lu et al., 2015). Although organic porositywas not observed in the Tuscaloosa sample, it is thought todevelop in kerogen and solid bitumen as a consequence ofthermal advance through the oil window due to the expulsionof generated hydrocarbons (Lohr et al.,2015). Therefore, suc-cessful fluorescence imaging of this thermally mature sampledemonstrates thatiCLEM imaging via the SECOM platform canbeapplied up to at least mid-oil window conditions, potentially helping to constrain the thermal regime and organic mattertypes in which organic porosity develops. Argon ion-milled thin section Using the Arion-milled thin section resulted in improved align-ment between fluorescence emission and SEM imaging as wellas lower relief and fewer residual artefacts from sample prepa-ration on the milled surface. In Figure 7(A), an SEM ROI (greysquare) is shown in the centre of a larger field imaged by falsecolour fluorescence microscopy in the Green River sample.The SEM image overlays the fluorescence image in a 50:50viewing ratio in Figure 7(A). In Figure 7(B), a smaller ROI (redrectangle in Fig. 7A) is selected at the margin of the SEM ROI,still with the 50:50 viewing ratio. Apparent in the 50:50 view-ing area are authigenic micron-scale carbonate minerals (redarrows, right side of Fig. 7B) which are not visible in the falsecolour fluorescence area due to the high fluorescence intensitysignal from the amorphous organic matter (AOM) (left side ofFig. 7B). Note a solid bitumen lamella which is distinguishedfrom AOM by its lack of fluorescence. The lamella is visible inthe 50:50 view of Figure 7(B) and also in the 80:20 view ofFigure 7(C). However, the solid bitumen lamella is indistin-guishable from adjacent fluorescent AOM in the 100% SEMimage (right side, Fig.7D). The utility of iCLEM is further expanded in the images ofFigure 8 where we show a second ROI, also with two types 50%FM noe%SEM Fig. 9. iCLEM images of Mahogany Zone carbonate concretion or microbialite margin showing cathodoluminescence response (in pinkish-red). (A)Wide-field false colour fluorescence image with 50:50 FM to SEM region of interest (ROI) overlay with cathodoluminescence detection area shown byred rectangle. (B) 80% fluorescence:20% SEM-cathodoluminescencezoom-in. (C) 50:50 view of zoom-in area. (D) 100% SEM view of zoom-in area. (E)Further zoom-in showing 70% fluorescence:30% SEM. Red arrows point to nonluminescent euhedral crystal overgrowths embaying strong fluorescenceintensity amorphous organic matter, whereas dark blue arrow points to nonfluorescent solid hydrocarbon embayed by euhedral terminations. (F) Samefield as (E) with 100% SEM view. See the caption of Figure 7 for imaging conditions. of organic matter. Figure 8(A) shows a wide field of view in-cluding the SEM ROI (light grey square, upper left), whereasFigure 8(B) shows an enlarged view of the area marked by thered rectangle in Figure 8(A) at a 30:70 display ratio. Two dif-ferent types oforganic matter are visible in Figure 8(B): nonflu-orescent solid bitumen adjacent to strongly fluorescent AOM.However, these organic matter types are indistinguishable inthe 100% SEMimage ofFigure 8(C), due to the lack of greyscalecontrast. Figure 8(D) shows an enlargementoftheROI markedby the red rectangle in Figure 8(C), where combined SEM andfluorescence images resolve submicron carbonate and the twoorganic matter types are differentiated on the basis of fluores-cence.The pinkish-redin the carbonate shown inFigures 8(A),(B) and (D) is from cathodoluminescence.Euhedral carbonateembays solid bitumen (right side, Fig. 8D). As expected due tothe low thermal maturity (0.31% VR。), no organic porositywas resolved in either the solid bitumen or amorphous kero-gen observed in our study. However, we primarily focusedon low-magnification simultaneous fluorescence-SEM imag-ing, whereas 25 000—100 000xmagnifications typically areused in studies of organic nanoporosity (Loucks et al., 2012).The iCLEM SECOM platform, which can be retrofit to any SEMinstrument, does not prohibit these high magnifications. Be-cause SEM on its own cannot conclusively identify organicmatter type, the ability of fluorescence microscopy in iCLEMto differentiate nonfluorescent and fluorescent organic mat-ter types (in this case solid bitumen and adjacent AOM) atmicron-scale resolution, will be critical to studies which at-tempt to characterize the thermal regime in which organicnanoporosity develops and the organic matter types that itforms in. Once organic matter type identification is confirmedat micron scale, the SEM side of the iCLEM configuration canthen be used to evaluate organic porosity at nanoscale. Cathodoluminescence isISused in silicate-rich settings(Milliken et al., 2012) and carbonate systems such as the Ma-hogany Zone to distinguish detrital from authigenic mineralsfor better understanding of diagenesis and to study porosityevolution (Boggs & Krinsley, 2006; Hiatt & Pufahl, 2014).Full discussion of diagenesis in the Mahogany Zone is beyondthe scope ofthis paper but we emphasize thatcathodolumines-cence from iCLEM imaging of the Green River sample revealsorganic-inorganic diagenetic interactions that may not oth-erwise be as apparent using a single microscope application.Figure 9(A) shows iCLEM imaging of a third ROI in the Ma-hogany Zone sample at the margin of a carbonate concretionor microbialite. Cathodoluminescence ofdiagenetic carbon-ate (shown by pinkish-red in Figs.9A-C and E) is presentwithin the interpreted concretion but is subdued in the ad-jacent organic-rich layer. Moreover, cathodoluminescence ispresent in the core of carbonate phases but absent in euhedralcrystal overgrowths which terminate against sedimentaryorganic matter including both solid bitumen and amorphousmaterial (Figs.9E and F). Authigenic euhedral mineral termi-nations protrude into both the AOM (kerogen) and the solid bitumen. These textures may indicate diagenetic crystalgrowth before and during generation ofearly hydrocarbons inthe Mahogany zone.Delivery ofinorganic ions to the growingcrystal face against the solid hydrocarbon (which we presumewas mobile in the subsurface) implies that water was dissolvedin the solid hydrocarbon phase (Lewan,1997)orthatan emul-sion of water and bitumen was present during diagenesis. Limitations The optical microscopy portion of the iCLEM described hereinis limited to low resolving power (~460 nm) due to the extra-long working distance 0.60 NA objective required to imagefluorescence through the glass slide. In addition, presence oforganic fluorescence generally is not observable above about1.0-1.1%R。(Teichmiiller&Durand,1983),limiting the sam-ple preparation and technique described to lower maturitygeological samples. However, alternative sample preparationtechniques may permit sequential incident white light oil im-mersion microscopy of uncovered samples followed by SEM inthe SECOM. This would require a bridging-type transmissionelectron microscopy sample mount or a customized equiv-alent. Alternative iCLEM configurations (Nishiyama et al.,2010) may also permit incident white light optical microscopyunder oil immersion with simultaneous inverted SEM througha silicon nitride film window. Sample preparation for eitherconfiguration would require thin foils produced via focusedion beam or microtome sectioning. Although more labour-and cost-intensive than the economical approach describedherein which used standard thin sections,the alternative sam-ple preparation and configuration approaches, if successful,would extend imaging and identification of organic matterto overmature conditions where fluorescence is extinguishedbut organic nanoporosity typically is well developed (Ko et al.,2016) Summary We have described an application of iCLEM to geological ma-terials by sequentially imaging sedimentary organic matter inshale via fluorescence and SEM. The results show that iCLEMcan be used to identify and characterize organic matter typesbased on their fluorescence response (most prevalent at lowerthermal maturities of up to about 1.0-1.1% VR。) with simul-taneous resolution of submicron features via SEM. Becausehigher magnifications are available via SEM, this techniquealso allows sequential imaging at scales ranging from hun-dreds of microns to nanometres, enabling identification of or-ganic matter types via fluorescence microscopy at low resolu-tion followed by high-resolution SEM evaluation of nanoscalestructures such as organic porosity. Future work using iCLEMshould investigate alternative instrument configurations andbegin systematic evaluation ofthe thermal regime andorganicmatter types in which organic porosity develops, including shale samples of peak oil (VR。~0.9%) and higher maturities,and artificial maturation sequences created through hydrouspyrolysis experiments. Acknowledgements Reviews by Clint Scott (USGS), Brian Cardott (Oklahoma Geo-logical Survey), Wayne Camp (Anadarko Petroleum Corpora-tion) and an anonymous journal reviewer improved this pa-per. Justin Birdwell (USGS) contributed the Mahogany Zonesample. This research was funded by the USGS Energy Re-sources Program. Any use of trade, firm or product names isfor descriptive purposes only and does not imply endorsementby the U.S. Government. Attribution terms This Licensed Material constitutes“a work of the United StatesGovernment"as defined by the U.S. Copyright Act, 17 U.S.C.sec. 101:17 U.S.C. sec. 105. A“work of the United StatesGovernment”is a work prepared by an officer or employee ofthe United States Government as part of that person’s officialduties and is not subject to copyright protection in the UnitedStates.However, copyright in a foreign country may apply. ( References ) ( Agronskaia, A.V., Valentijn, J.A., van Drie l , L. F ., et al.(2008) Integratedfluorescence and t r ansmission electron microscopy.J. Struct. Bio l .164, 183-189. ) ( Baranger,R.,Martinez,L. , Pittion,J.-L.&Pouleau,J.( 19 91) A newcalibra-tion procedure for fluorescence measurements of sedimentary organicmatter.Org. Geochem.17,467 - 475. ) ( Baruch,E.T.,Kennedy,M.J.,Lohr, S.C. &Dewhurst,D.N. (2015) Feldspardissolution-enhancedporosity in P aleoproterozoic shalereservoir faciesfrom t he Barney Creek Fo rmation (McArthur Basin, Australia). AAPG Bull.99,1745-1770. ) ( Bernard, S., Horsfield, B ., Schulz, H .-M., Wirth, R . ,Schreiber, A. & Sher-wood, N.(2012) Ge o chemical evo l ution of o rganic-rich shales wi t hincreasing maturity: a STXM and TEM study of the Posidonia Shale(Lower Toarcian, northern G e rmany). M a r. Petrol. Geol. 3 1 ,70-89. ) ( Boggs, S ., Jr. & K rinsley, D. (2006) Application of CathodoluminescenceImaging to the Study of Sedimentary Rocks. Cambridge University Press, New York. ) ( Brama, E., Peddie, C.J., Jones, M.L., Domart, M .-C . , Snetkov, X., Way, M., L arijani, B. & Collinson, L.M. (2015) Standard f luorescent p roteins asdual-modality probes for correlative experiments in an integrated lightand electron microscope. J . Chem . Biol.8, 1 79- 1 8 8. ) ( Camp,W.K.(2016)Strategies for i dentifying organic matter types in SEM.In SEPM-AAPG Mudstone Diagenesis Hedberg Research Conference. Santa Fe, New Mexico. ) ( Cardott, B .J., Landis, C.R. & Curtis, M.E. ( 2 015)Po s t-oil solid b i tumennetwork i n the Woodford Shale, U S A - a potential pr i mary migrationpathway. Int. J. Coal Geol. 1 39, 106-11 3 . ) ( de Boer, P., Hoogenboom, J.P. & Giepmans, B .N.(2015) C o rrelated lightand electron m icroscopy: ultrastructure l ights up! Nat Methods 1 2, 503-513. ) ( F aas, F .G., Barcena, M., Agronskaia, A. V ., et al. ( 2 013) Localization of fluorescently labeled structures in frozen-hydrated samples using inte- grated light electron microscopy. J. Struct . Bio l . 181,28 3 -290. ) ( Fishman,N.S.,Hackley,P.C.,Lowers,H.A., Hil l ,R.J.,Egenhoff, S.O.,Eberl,D.D. & Blum, A.E. (2012) The nature of po r osity in organic-rich mud-stones of the Upper Jurassic Kimmeridge C lay F ormation, N orth Sea,offshore United Kingdom. Int. J . Coal Geo l . 10 3 ,32-50. ) ( H ackley,P.C., A r aujo,C . V., Bo r rego, A.G., et al. (2015) Standardization of reflectance measurements in dispersed or g anic matter: results of an exercise to improve interlaboratory agreement. Mar. Pet r ol. Geol. 59, 22-34. ) ( H ackley, P.C. & Ca r dott, B.J. (2016 ) Application o f organic petrographyin North A m erican shale petroleum sys t ems: a r e view. Int. J.Coal Geol. 1 63, 8-51. ) Hiatt, E.E. & Pufahl, P.K. (2014) Cathodoluminescence petrography ofcarbonate rocks: application to understanding diagenesis, reservoirquality, and pore system evolution. In: Cathodoluminescence and Its Ap-plication to Geoscience (ed. by I. Coulson), pp. 75-96. MineralogicalAssociation of Canada. Short Course Series Volume 45. Fredericton,NB. ( K o, L .T., Loucks, R.G., Zhang, T., Ruppel, S.C . & Shao, D. (2016) Poreand p ore network evolution of Upper C r etaceous Boquillas (Eagle Ford - equivalent) mudrocks: results from g old tube p yrolysis experiments. AAPG Bull. 100,1693-1722. ) Lewan,M.D. (1997) Experiments on the role of water in petroleum for-mation. Geochim. Cosmochim. Acta 61,3691-3723. ( Lohr, S.C., Baruch, E .T., Hall, P.A. & Kennedy, M .J. ( 2015 ) I s organic pore development in g a s shales influenced b y the primary porosity and structure of thermally i mmature organic ma t ter? Org. Geochem. 87, 119-1 3 2. ) ( L oucks,R.G., R eed,R.M., Ruppel, S.C. & Jarvie,D.M. (2009) Morphology,genesis, and distribution of nanometer-scale pores in siliceous mud-stones ofthe M ississippian Barnett shale. J. Sediment.Res. 79,848-86 1 . ) ( Loucks, R.G.,Reed,R.M., Ruppel, S.C. & Hammes,U. (2012 ) Spectrum ofpore types a nd networks in mudrocks and a de s criptive classification for matrix-related mudrock pores. AAPG Bull.96,1071-1098. ) ( L oucks,R . G. & R e ed,R. M . (2014) Scanning-electron-microprobe petro-graphic e vidence f or distinguishing organic-matter pores associatedwith d epositional organic matter v ersus migrated organic matter i n mudrocks. GulfCoast A s soc. Geol. Soc. J.3,51 - 60. ) Lu, J., Ruppel, S.C. & Rowe, H.D. (2015) Organic matter pores and oilgeneration in the Tuscaloosa marine shale. AAPG Bull.99,333-357. ( Luo,Q.,Zhong,N . ,Dai, N.&Zhang, W.(2016)Graptolite-derived organicmatter in the Wufeng-LongmaxiFormations (UpperOrdovician-LowerSilurian) of southeastern Chongqing, China: implications for g a s shaleevaluation. I nt. J. Coa l Geol. 153,87-98. ) ( M illiken, K.L. , Esch, W.L., Reed, R.M . & Zhang, T. (2012) Grain assem-blages a nd strong diagenetic overprinting in s i liceous mudrocks, Bar-nett Shale ( Mississippian), Fort Worth Basin, Texas. AAPG Bul l . 96 , 1553-1578. ) ( N ishiyama, H., Suga, M., Ogura, T . , M aruyama, Y. , Koizumi, M. , Mi o , K ., Kitamura, S. & Sato, C. ( 2010) Atmospheric s canning electronmicroscope observes cells and tissues in open medium through siliconnitride film. J. Struct . Biol. 169,4 3 8-449 . ) ( Polishchuk, R .S., P olishchuk, E.V., M arra, P . , Alberti, S ., B uccione, R., Luini, A. & Mironov, A.A. (2000) Co r relative light-electron m i -croscopy reveals the tabular-saccular ultrastructure of carriers operat-ing between G olgi apparatus and p lasma membrane. J. C e ll Biol. 148, 45-58. ) ( Rowland,E.O.(1953)Preparation of thin r o ck sections. Mineral . Mag.30, 254-258. ) ( S artori, A ., G atz, R., Beck, F . , Rigort, A . , B a umeister, W. & Pl i tz k o, J.M.(2007) Correlative microscopy: b ridging the gap between fluorescencelight microscopy a n d cryo-electron to m ography. J. S t ruct. Bio l . 16 0 , 135-145. ) ( Stasiuk,L.D.&Fowler,M.G.(2004)Organic facies in Devonian and Missis-sippian strata of Western Canada Sedimentary Basin: relation to kero-gen t ype, paleoenvironment, and pa l eogeography. Bull. Can . Pet r ol. Geol. 52.234 - 255. ) Teichmiiller, M. & Durand, B. (1983) Fluorescence microscopical rankstudies on liptinites and vitrinites in peat and coals, and compari-son with results of the Rock-Eval pyrolysis. Int. J. Coal Geol. 2, 197-230. Timmermans, F.J. & Otto, C. (2015) Contributed review: review of inte-grated correlative light and electron microscopy. Rev. Sci. Instrum. 86,011501. Valentine, B.J. & Hackley, P.C. (2016) Bridging the gap between opticaland electron microscopy: the importance of correlative microscopy forunderstanding dispersed organic matter. In Society for Organic Petrology. Annual Meeting, Joint Meeting of TSOP-AASP-ICCP.Houston, Texas. Vidavsky, N., Addadi, S., Mahamid,J., Shimoni, E., Ben-Ezra,D., Shpigel,M., Weiner, S. & Addadi,L. (2014) Initial stages of calcium uptake andmineral deposition in sea urchin embryos. Proc. Natl. Acad. Sci. U. S. A111,39-44. ( Z onnevylle, A.C. , V an Tol , R.F., Li v , N., Narvaez, A.C., Effting, A.P., Kruit,P. & Hoogenboom, J.P. (2013) In t egration of a high-NA light mi c ro- scope in a scanning electron microscope.J. M icrosc.252,58 - 70. ) ◎ The Authors. Journal of Microscopy published by JohnWiley & Sons Ltd on behalf of Royal Microscopical Society. 集成光电子关联(iCLEM),荷兰delmic公司创新发明的一种新技术,在SEM内集成光镜,实现样品同一位置进行荧光光学成像和电子显微成像。该显微方法正在世界范围内广泛应用于癌症研究、海洋生物学、神经科学和细胞生物学。最近这种技术在USGS应用于地质学领域,以深入了解地质材料中的沉积有机质。在最新发表论文中,美国地质调查局(USGS)使用delmic的iCLEM系统SECOM,对始新世绿河红木区不成熟油页岩和上白垩统塔斯卡卢萨群中油页岩进行了观测研究。结果表明,这种技术非常有效地识别和表征有机纳米孔隙形成的有机物质类型和状态[3]。有机质的数据很容易用高分辨率扫描电子显微镜(SEM)获得,但研究人员不能单独使用SEM来区分有机质的类型,如干酪根与固体沥青。然而,荧光显微镜的荧光像对于识别页岩油气藏中的有机质非常有用[1]。采用光电关联技术,在一台显微镜上结合这两种技术,地质学家可以获得更多的数据,而无需考虑耗时的样品制备,样品转移、重新导航定位等造成的困难或样品损坏[2]。
确定
还剩11页未读,是否继续阅读?

产品配置单

苏州德尓微仪器有限公司为您提供《地质中有机物检测方案(电镜部件)》,该方案主要用于其他中有机物检测,参考标准--,《地质中有机物检测方案(电镜部件)》用到的仪器有SECOM-集成式光电联用平台
推荐专场

相关方案
更多