


方案详情
文
快速模拟量光电倍增管PMT检测,可用于大规模快速成像。对于大面积样品快速检测,非常适合地质领域的应用
方案详情

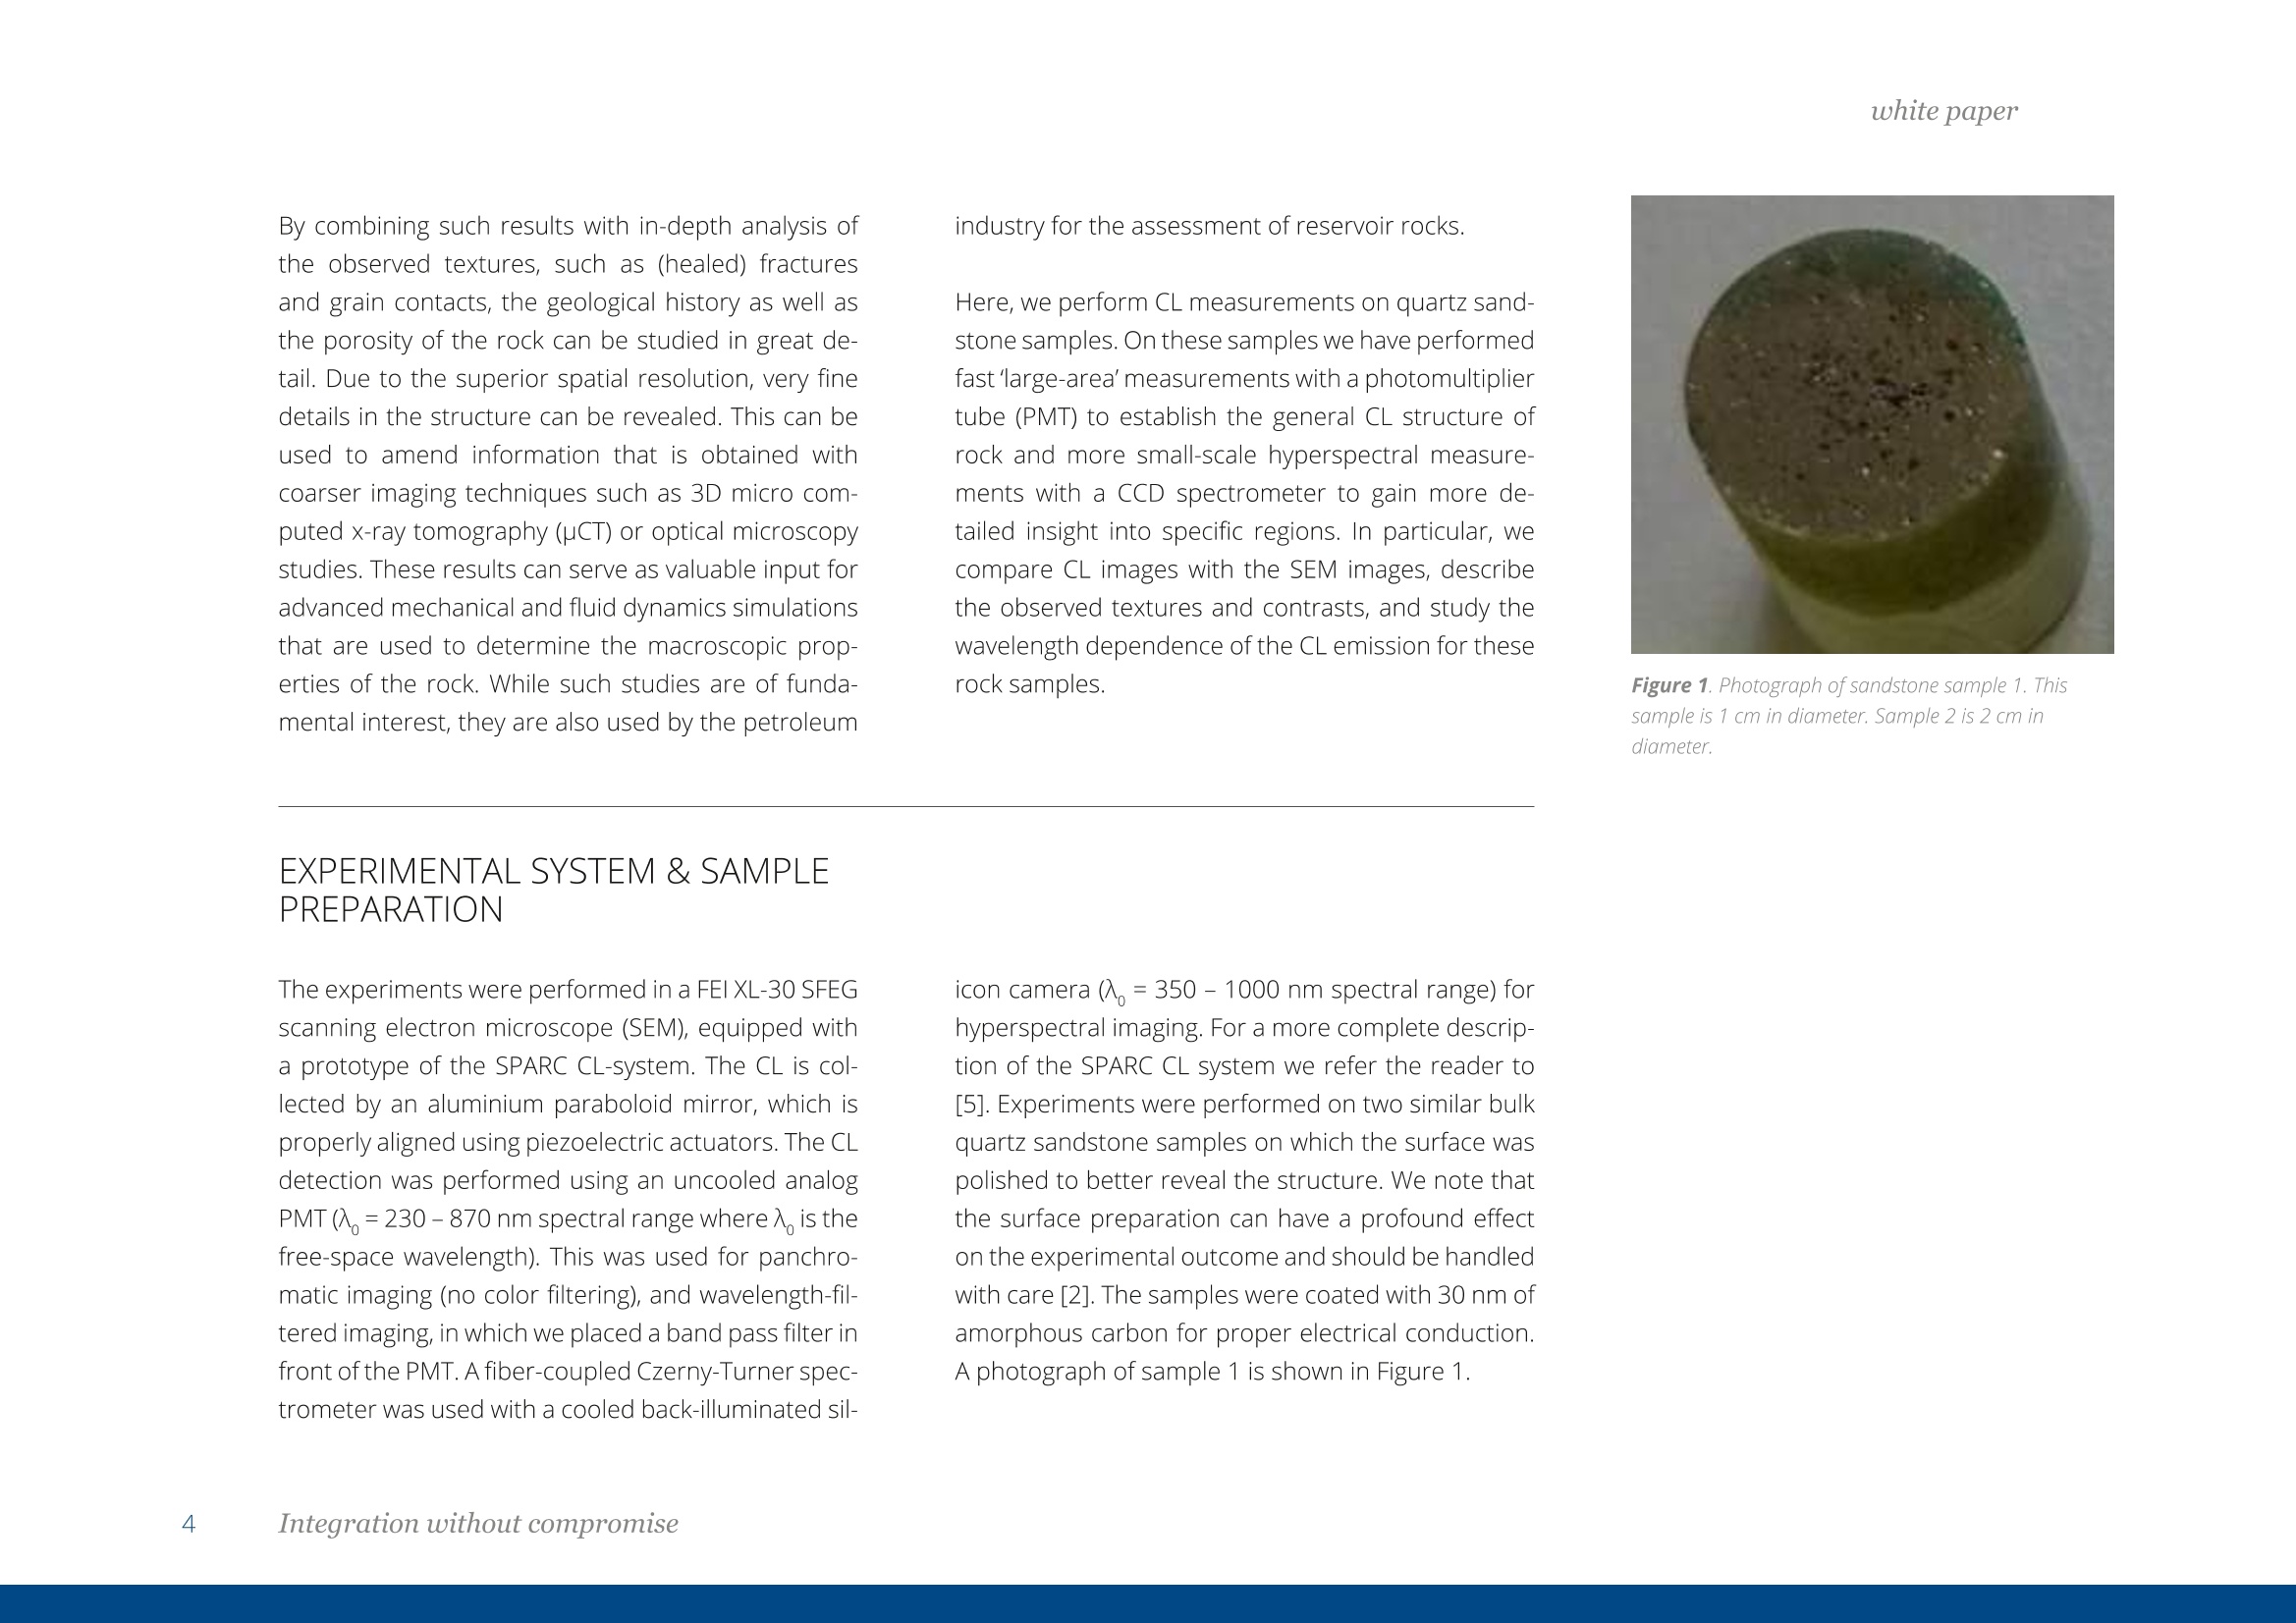
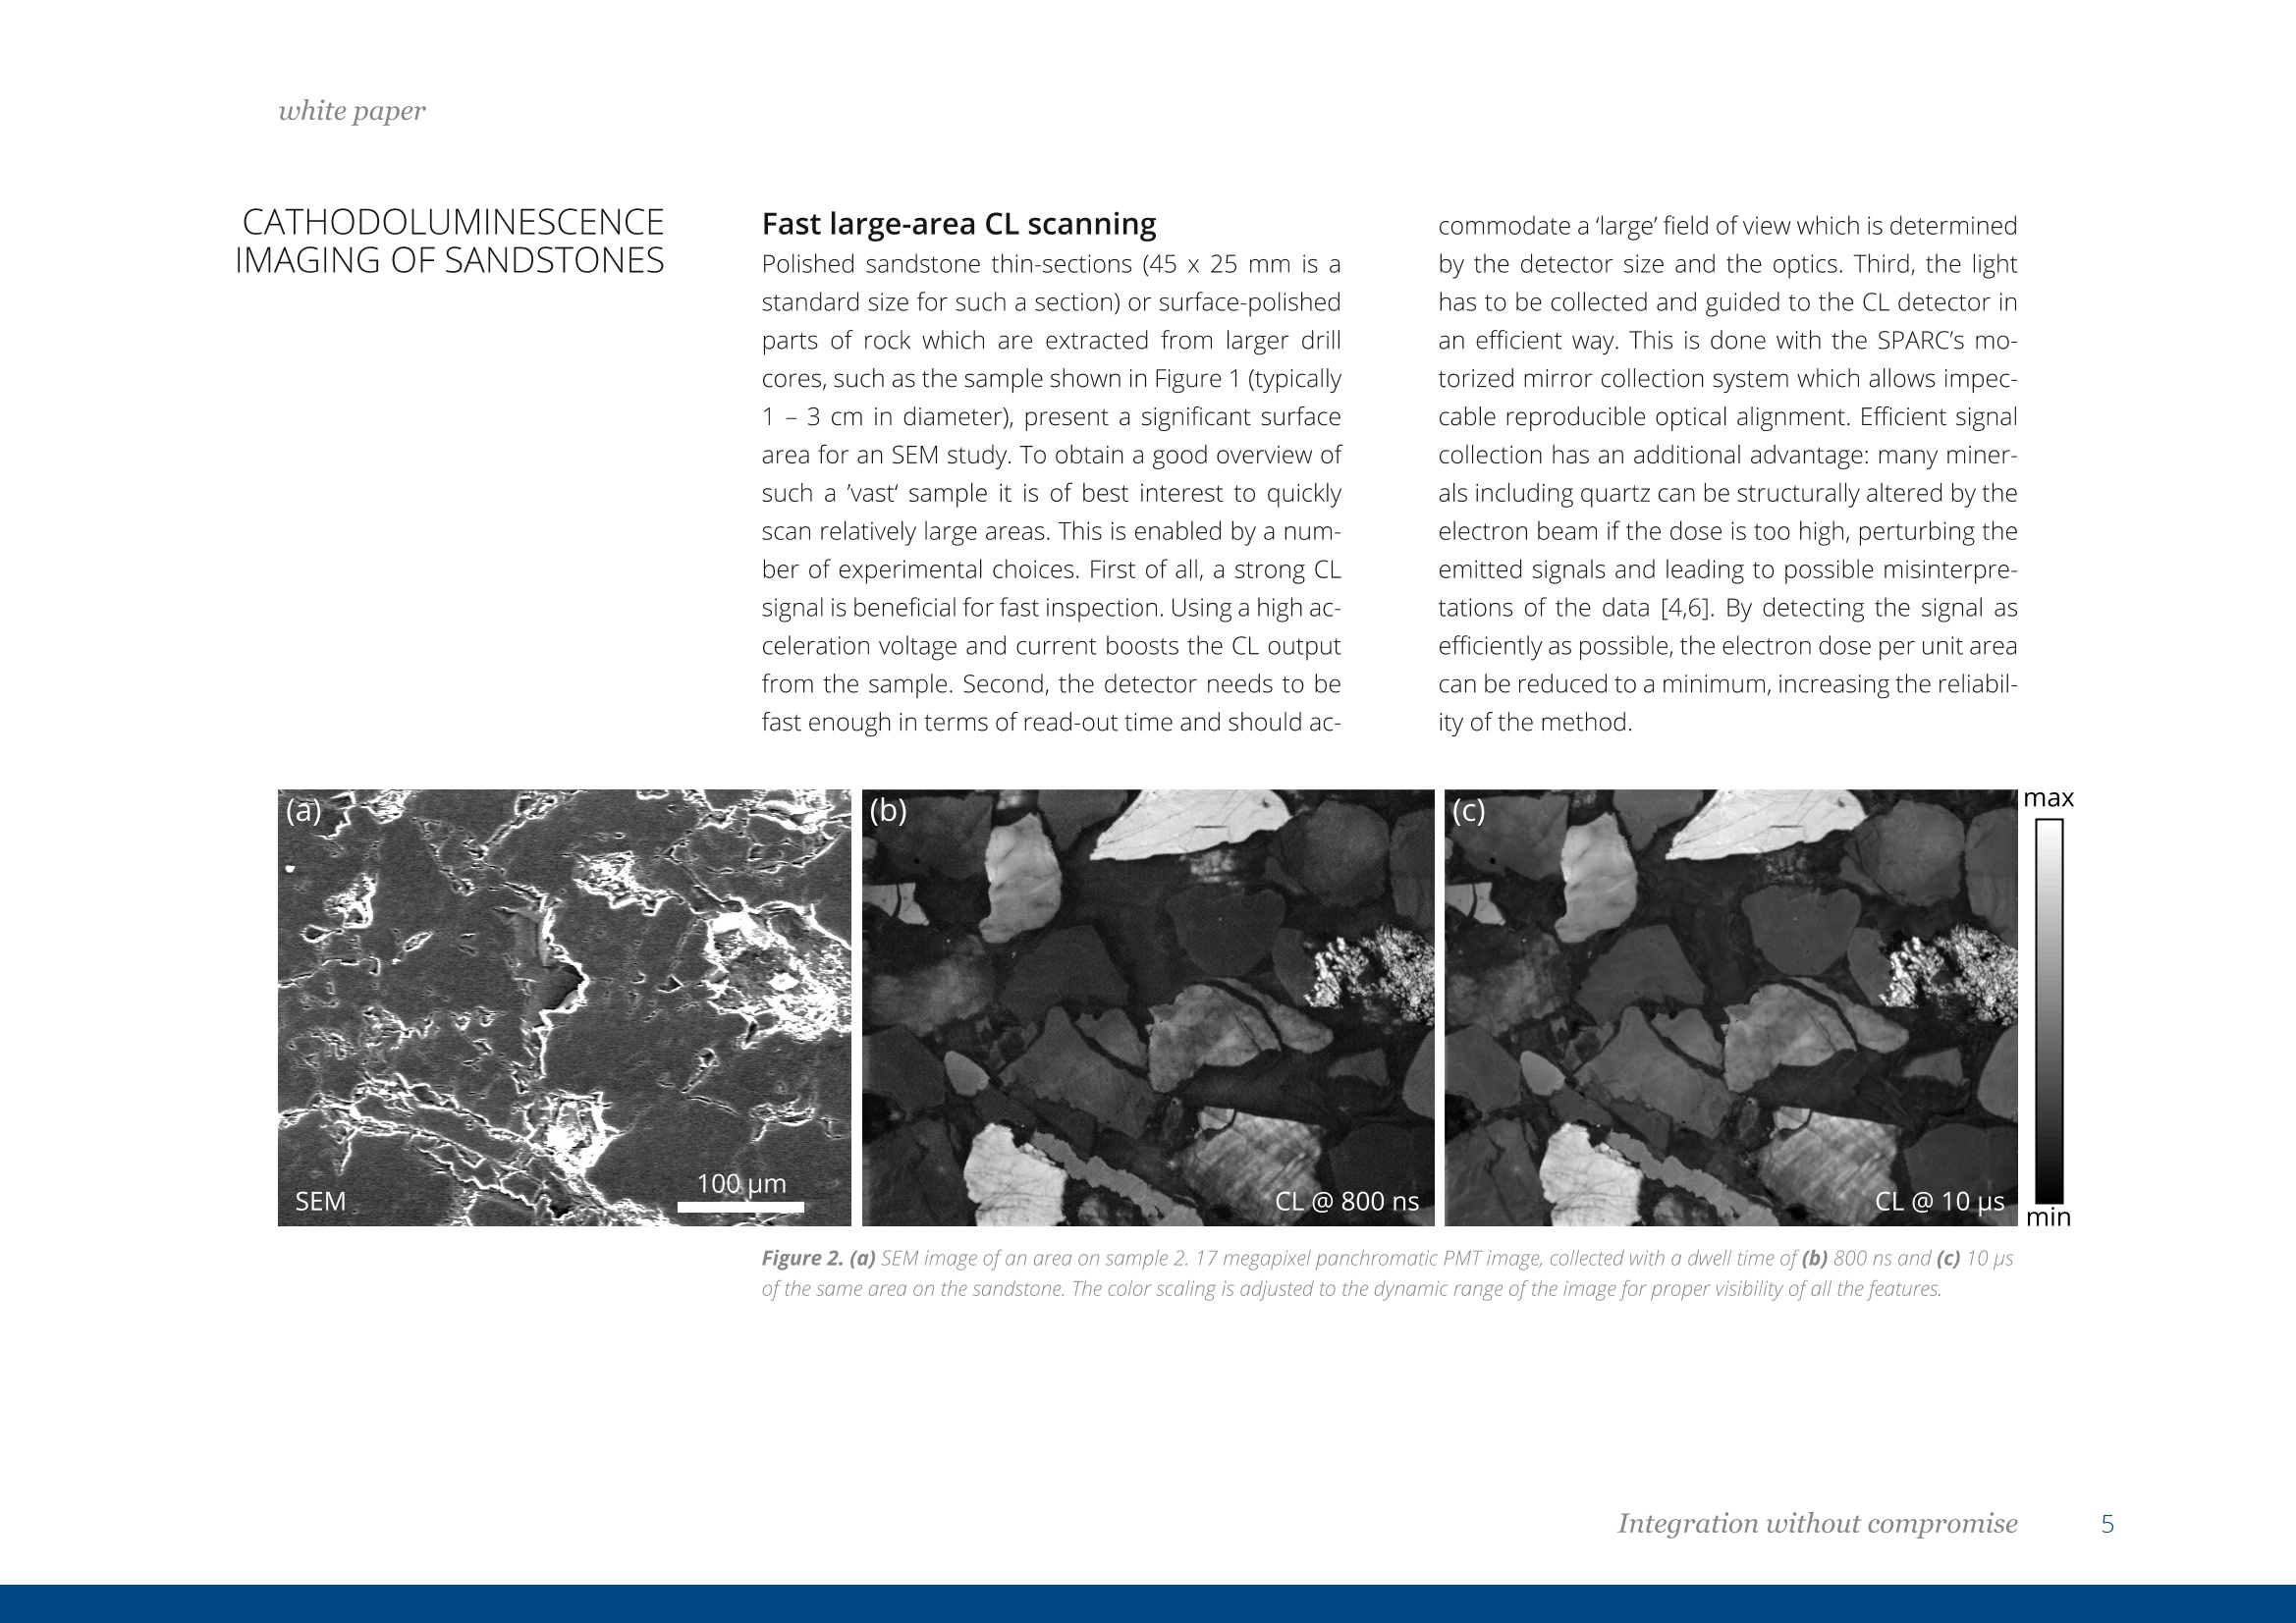
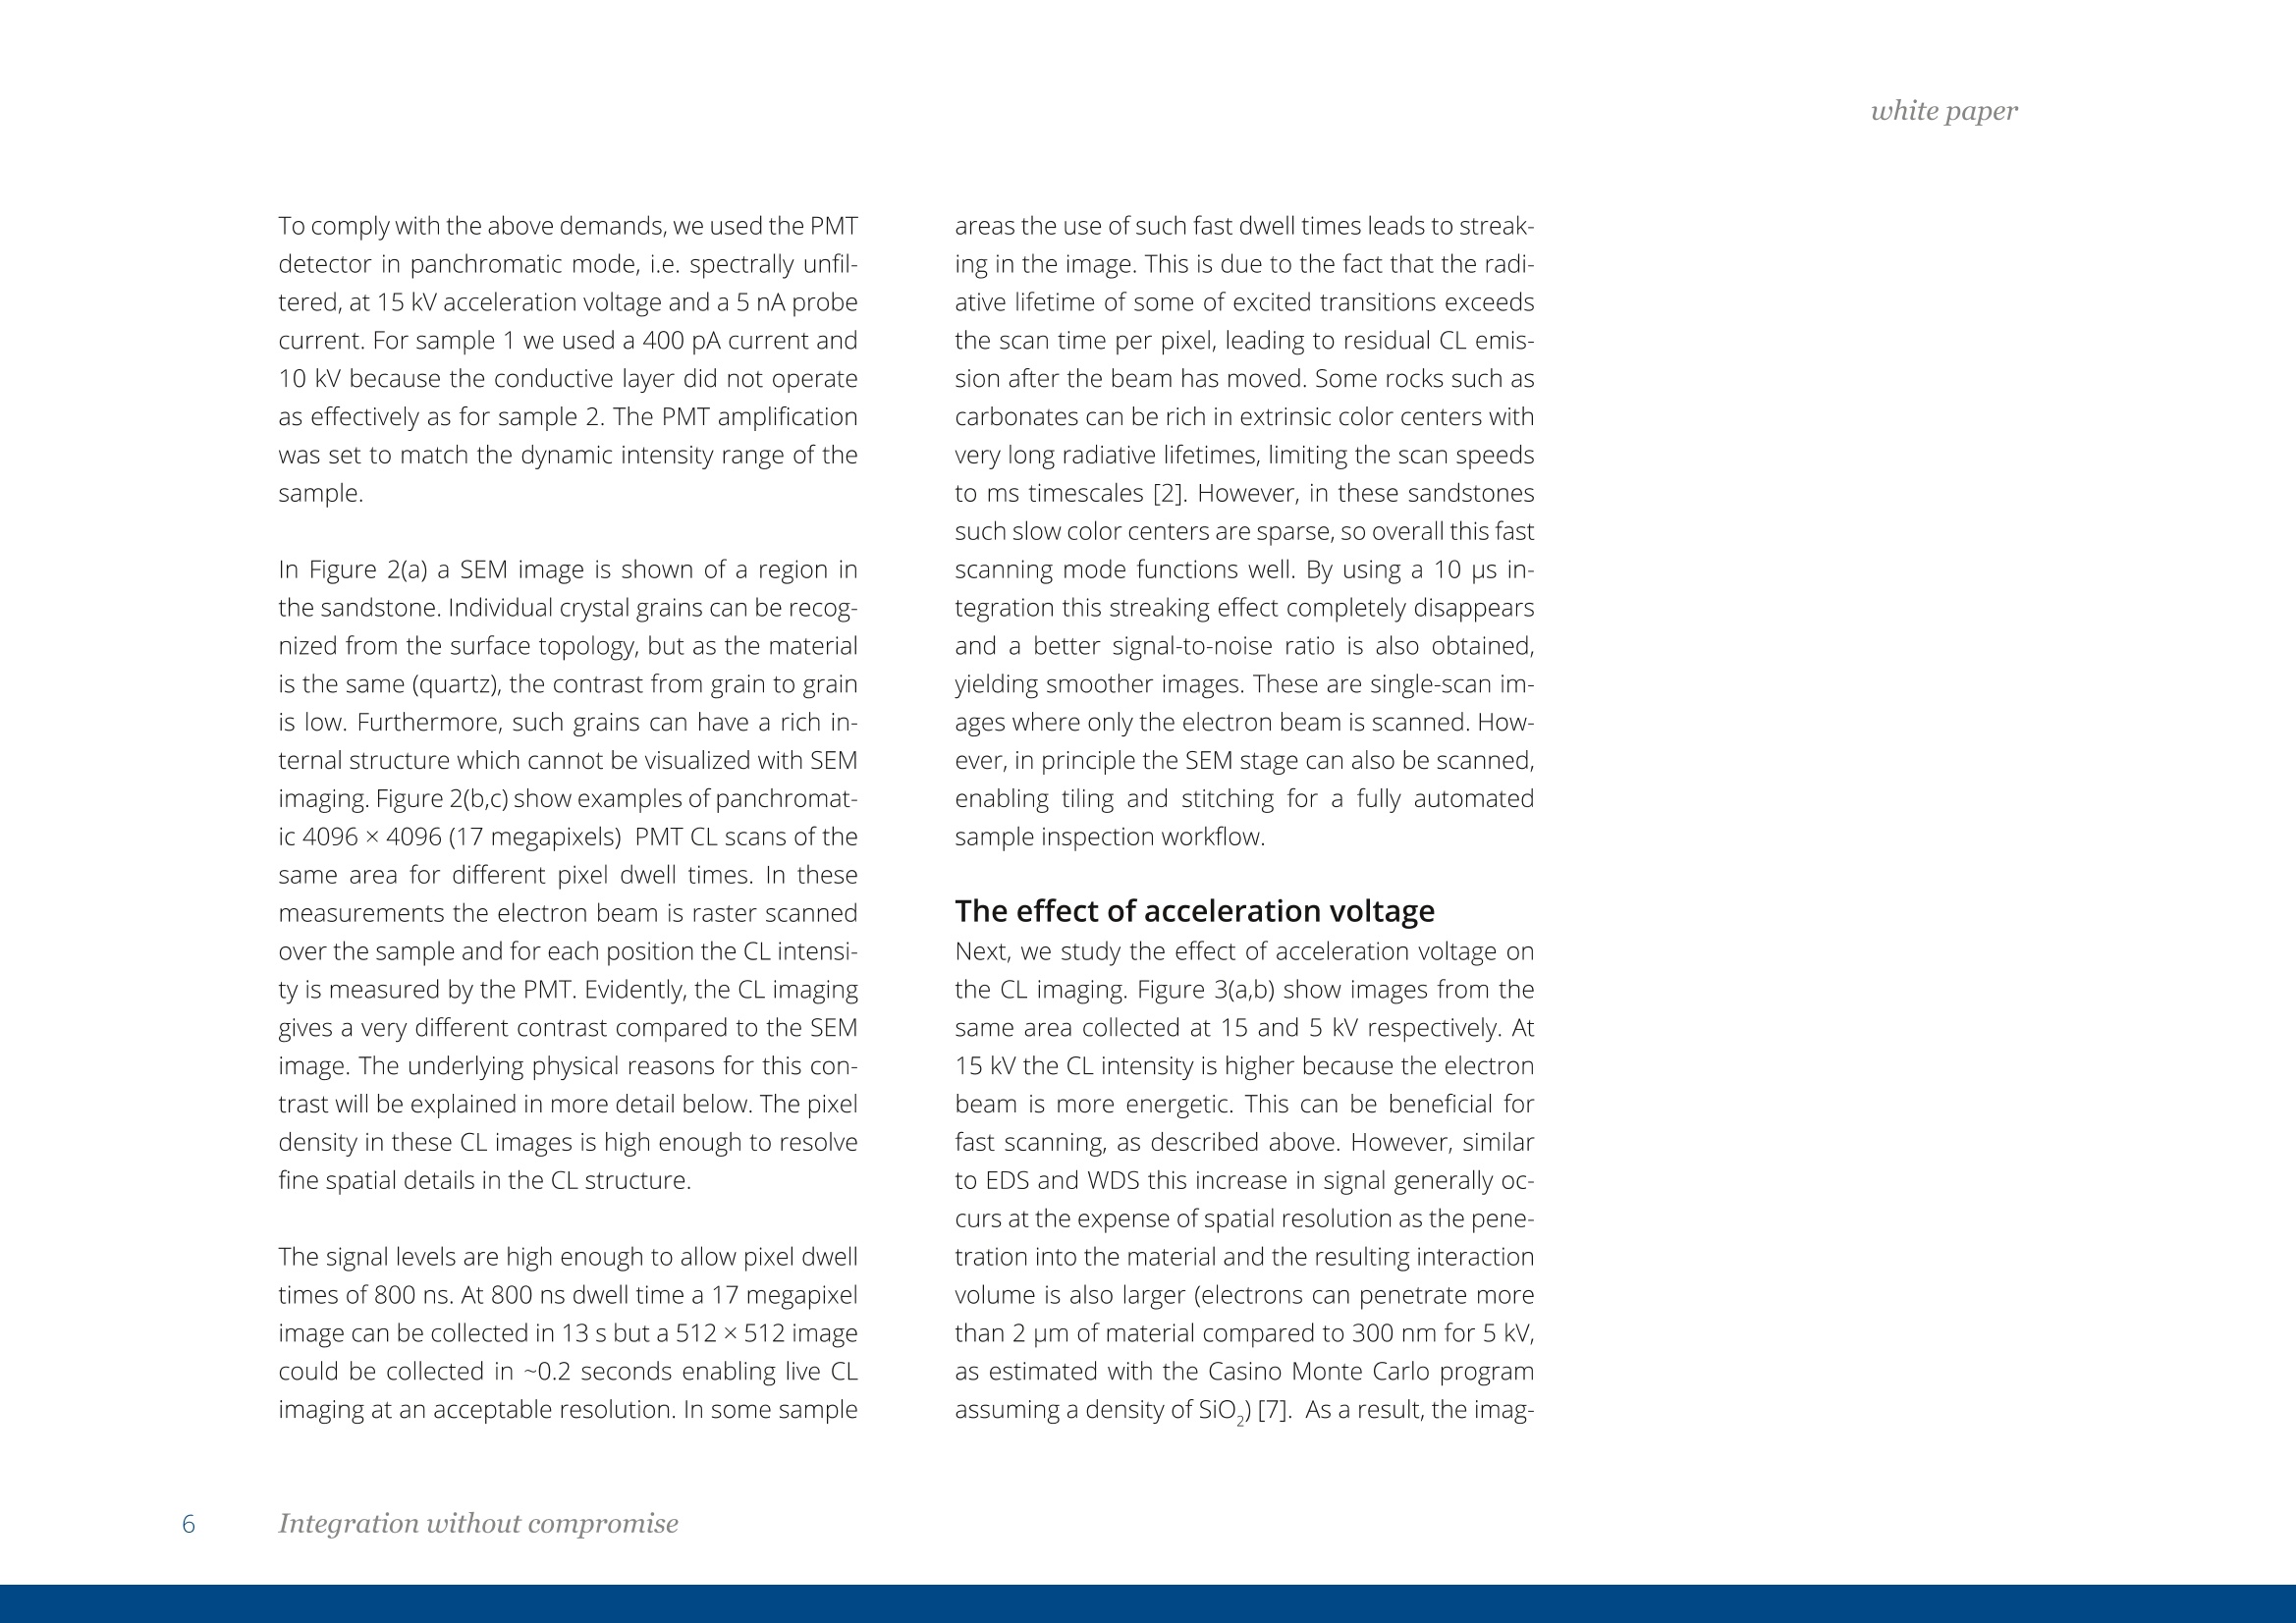
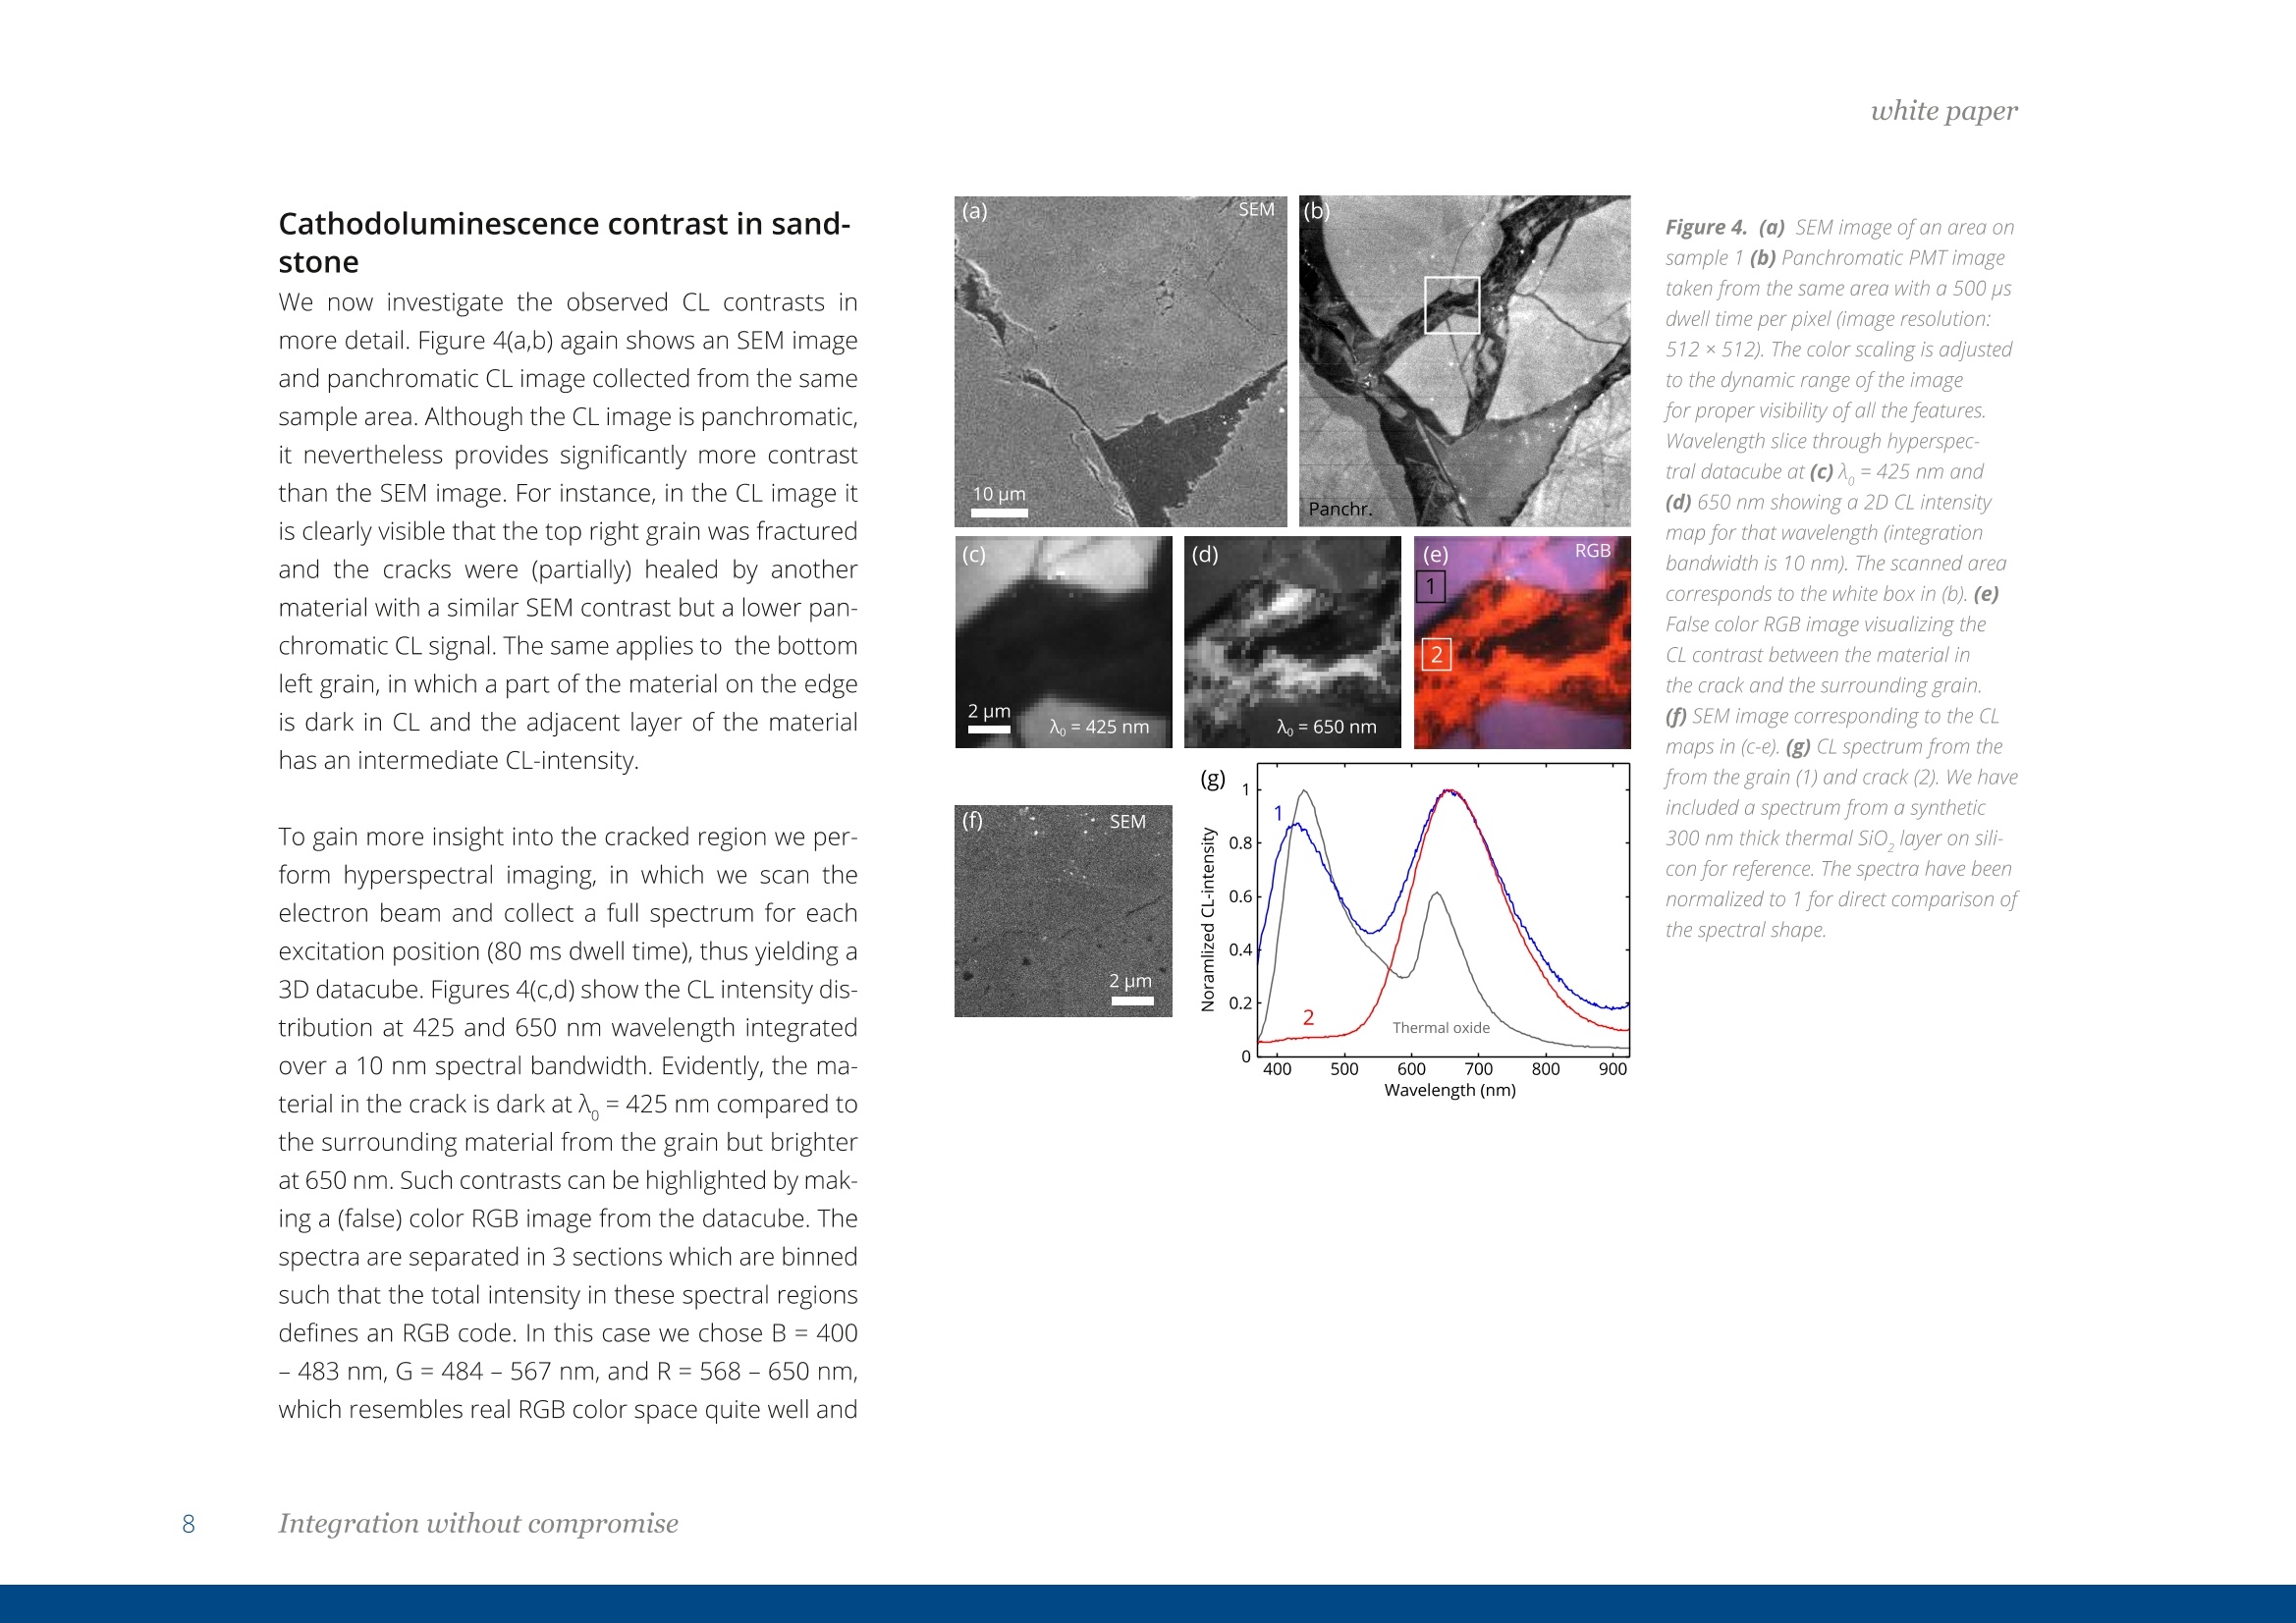
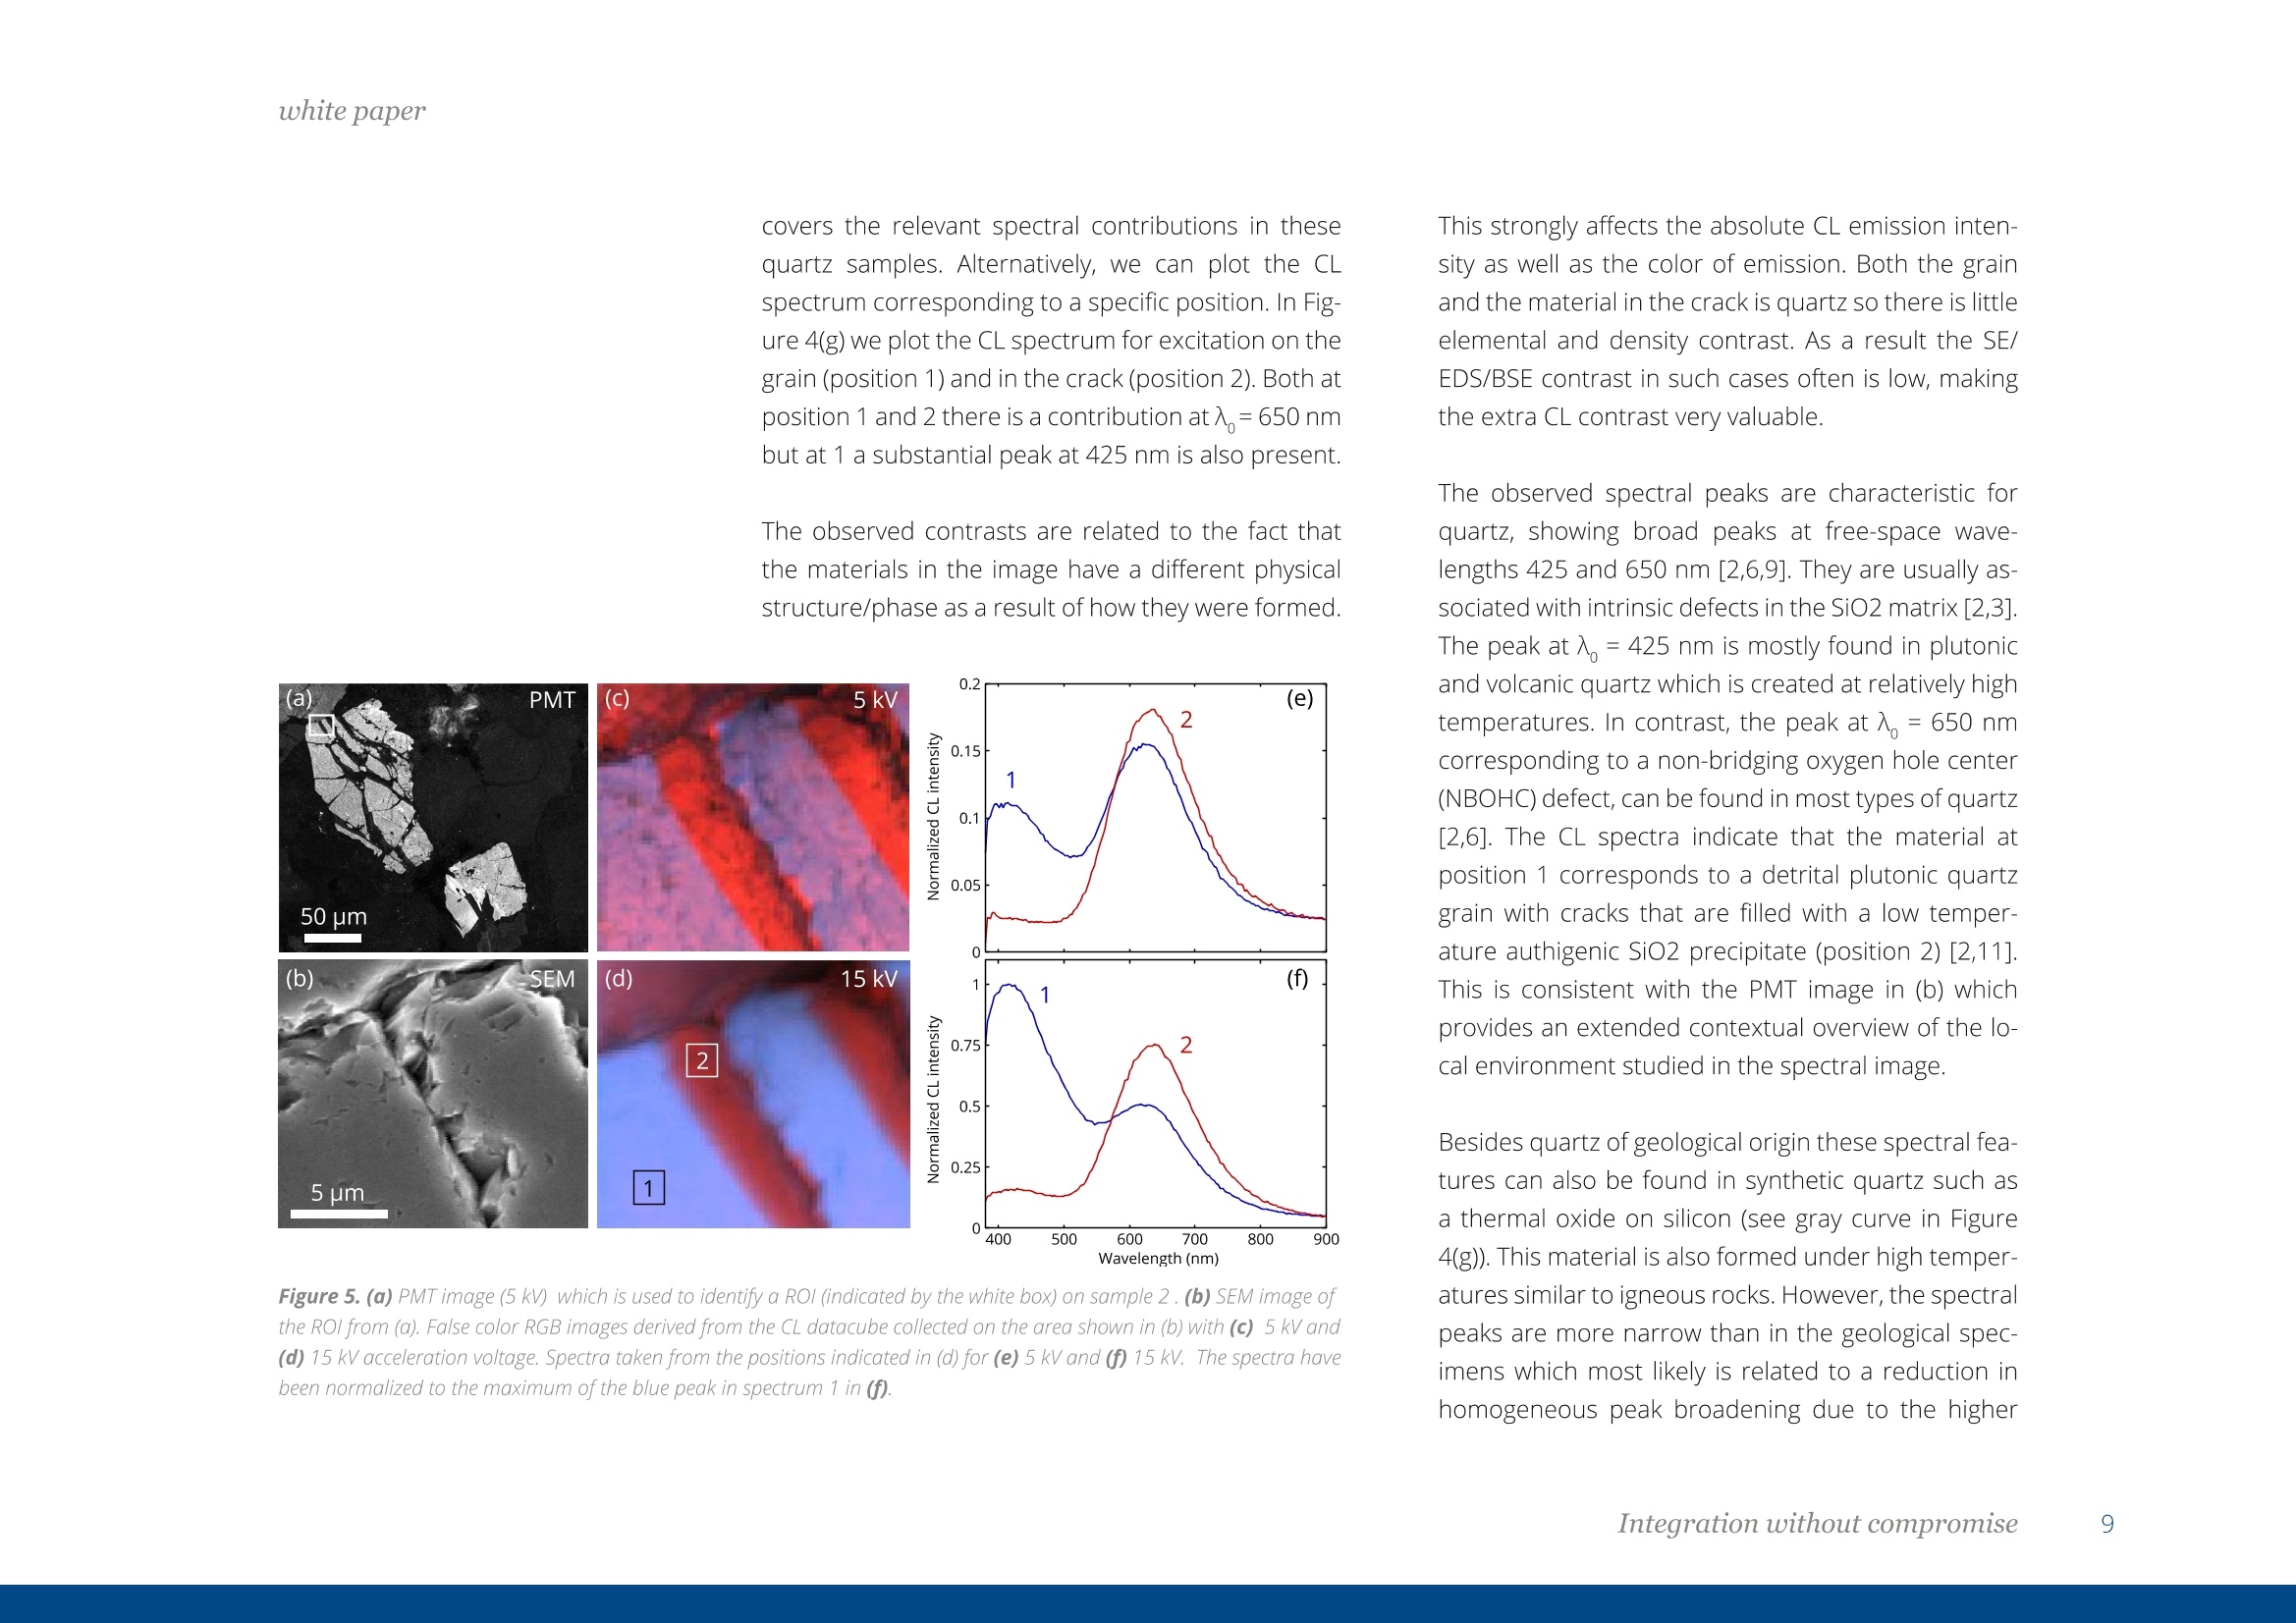
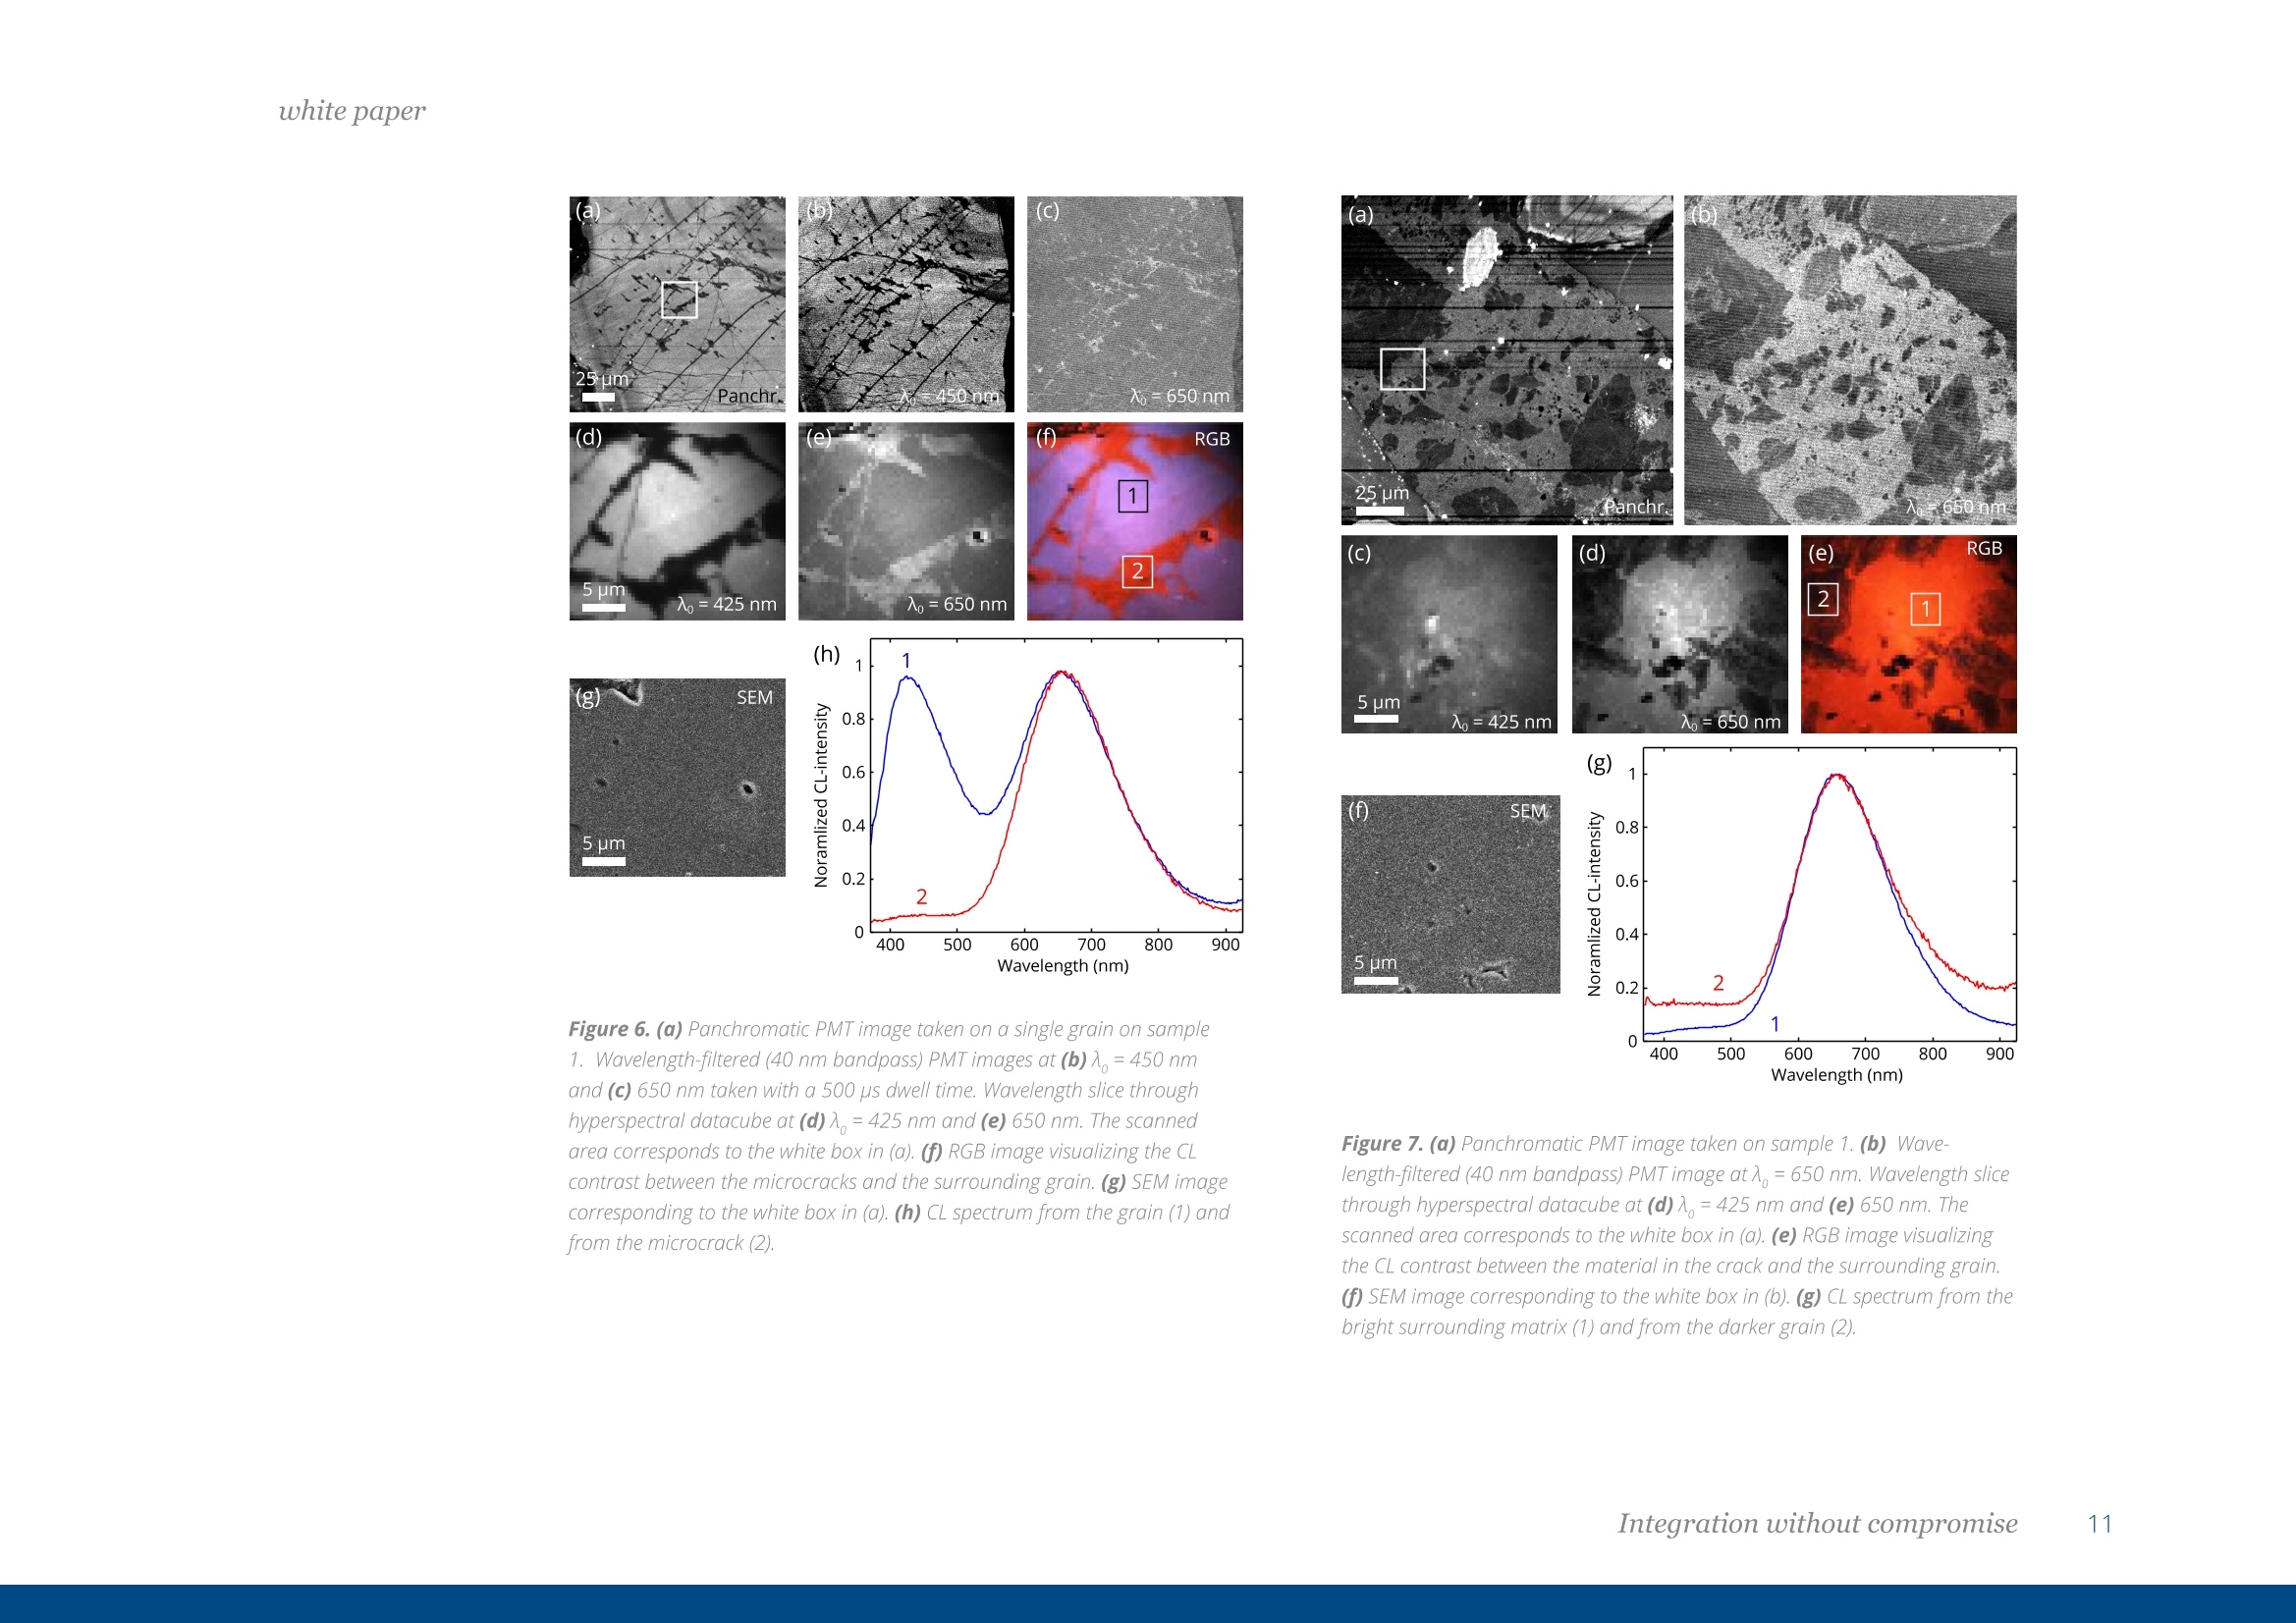
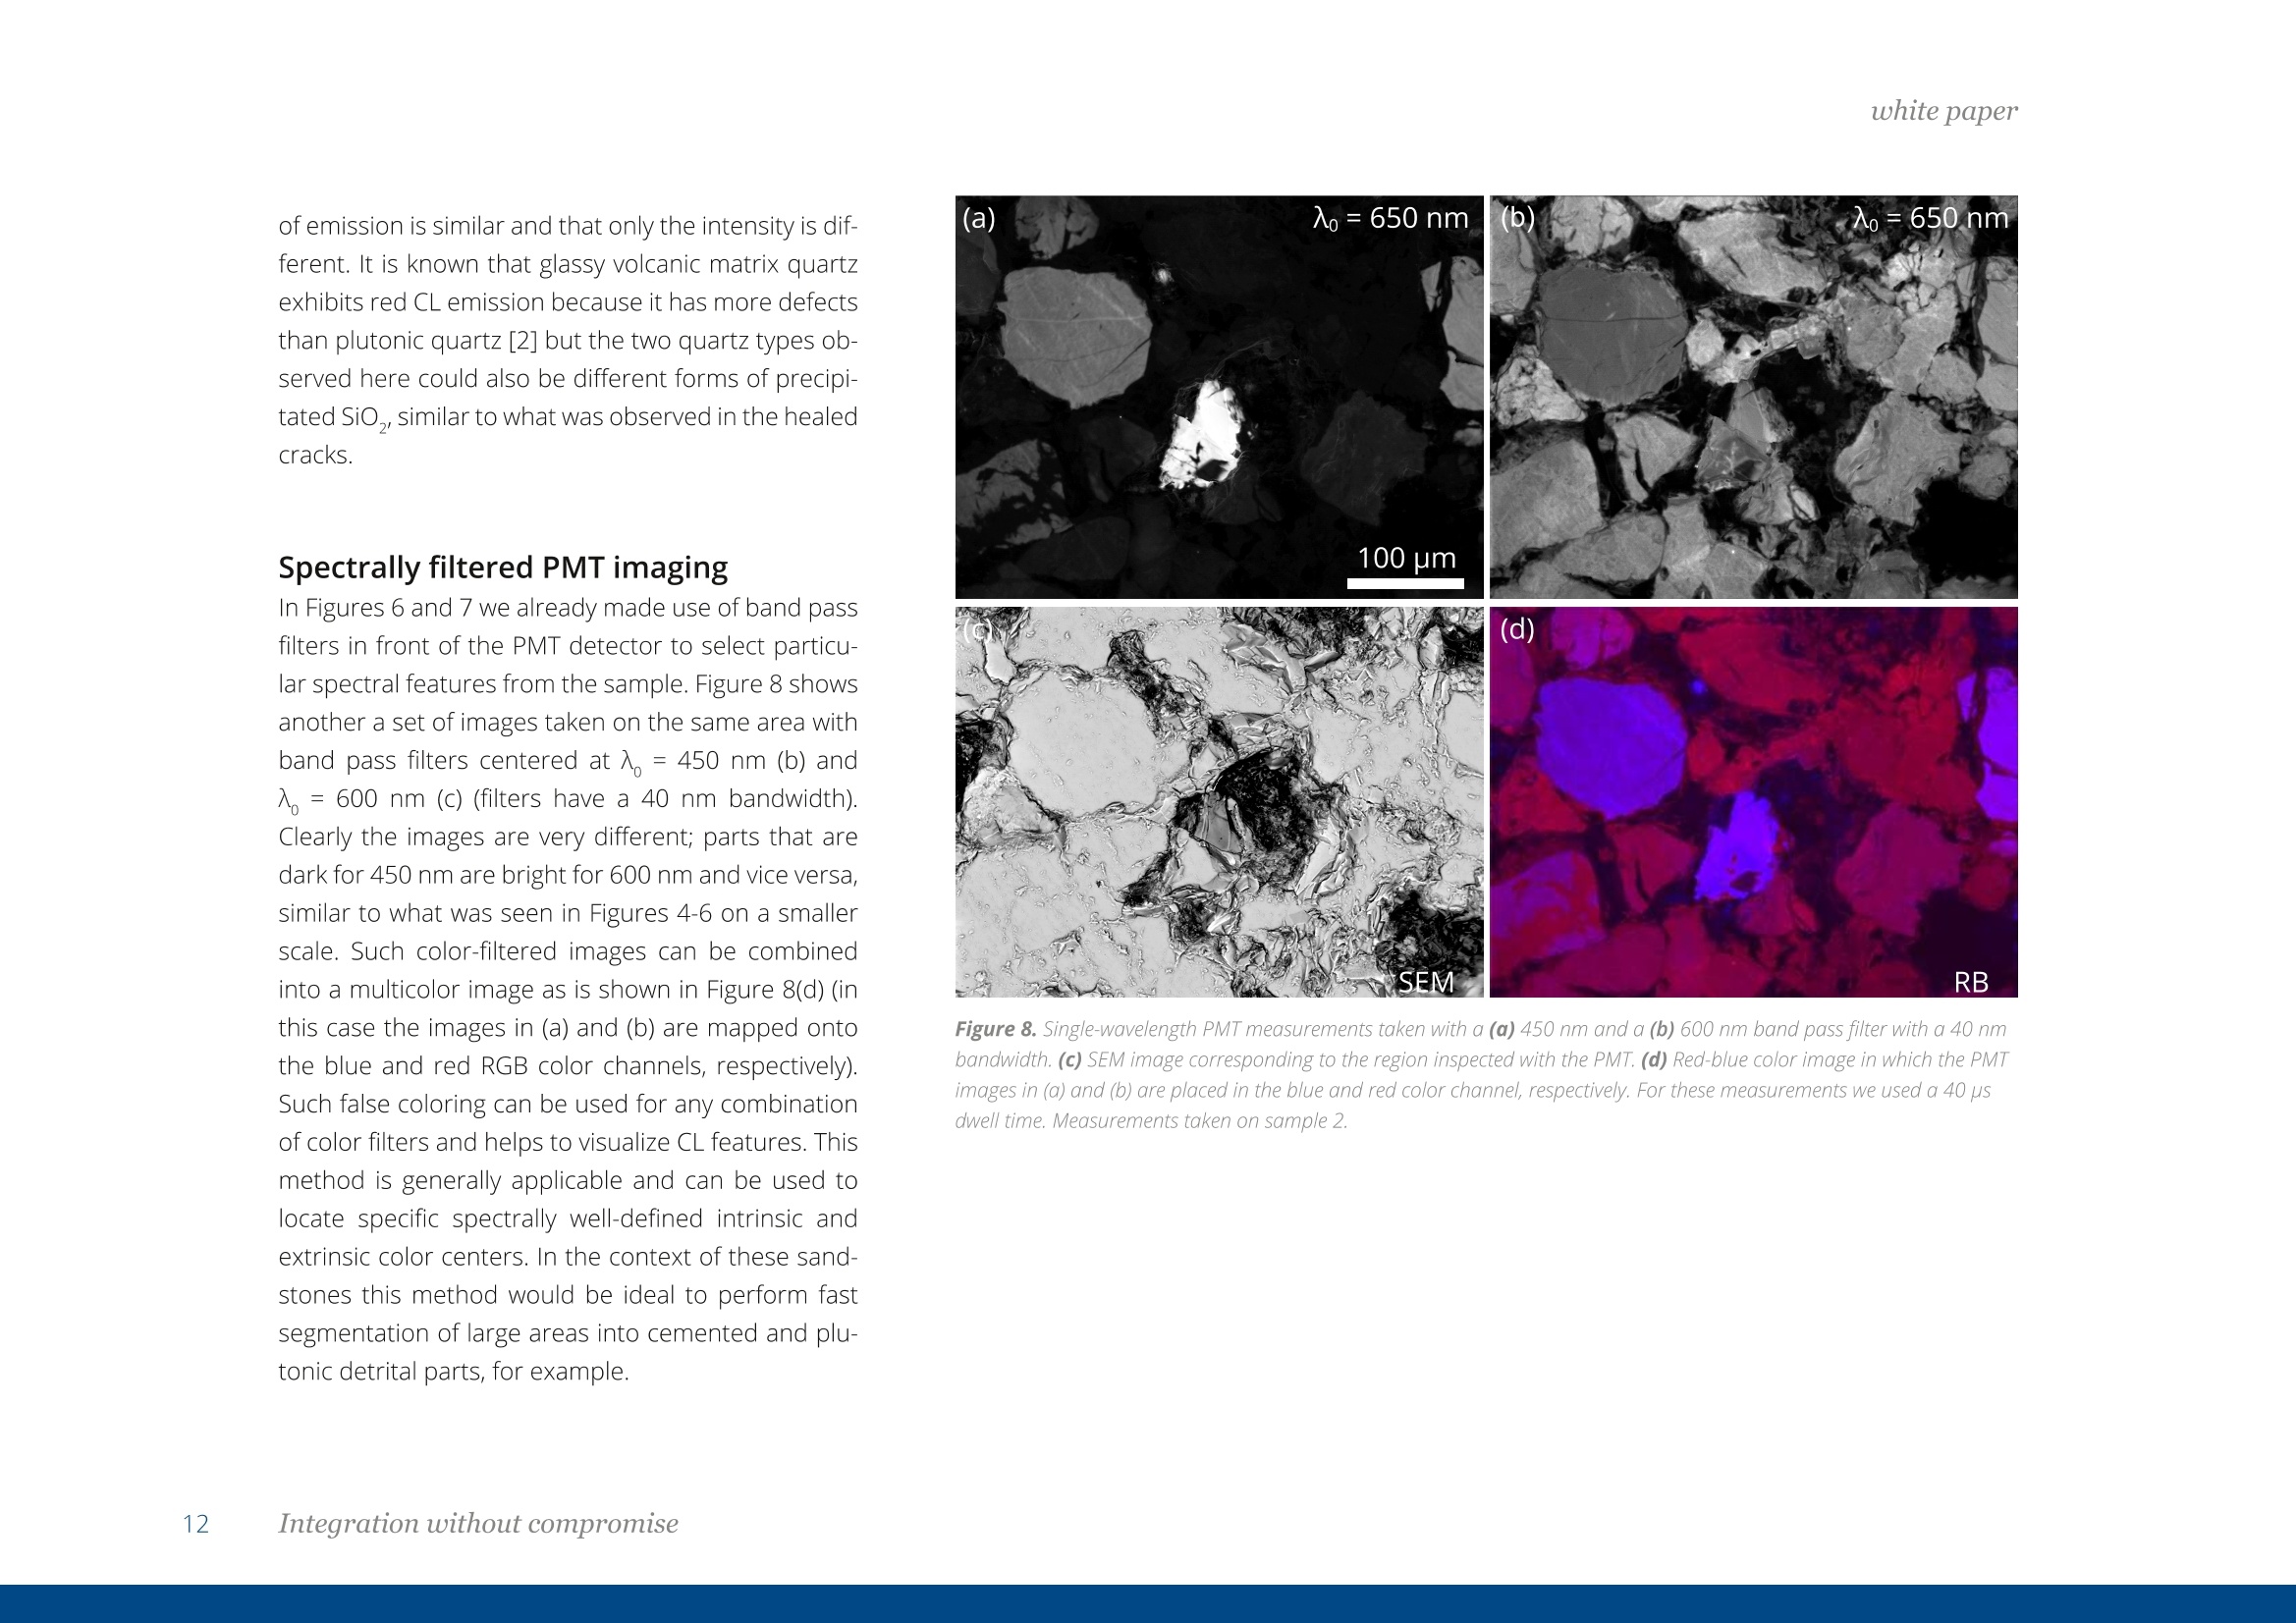
white paper CATHODOLUMINESCENCE IMAGINGON SEDIMENTARY ROCKS Quartz Sandstones Index ABSTRACT 1 INTRODUCTION2 EXPERIMENTAL SYSTEM & SAMPLE PREPARATION4 CATHODOLUMINESCENCE IMAGING OF SANDSTONES5 CONCLUSIONS & OUTLOOK13 ACKNOWLEDGEMENTS13 REFERENCESJ14 Toon Coenen DELMIC B.V., Thijsseweg 11, 2629 JA Delft, The Netherlands Cathodoluminescence spectroscopy is a powerful tool for the micro-characterization of rocks and min-erals, complementary to other electron microscopy-based techniques, such as backscattered electronimaging and energy/wavelength dispersive x-ray spectroscopy. In this white paper, we show how thetechnique can be employed to study quartz sandstone, a common type of sedimentary rock, which hasgained both fundamental interest as well as practical interest in the form of fossil fuel exploration andextraction. In particular, we apply panchromatic (unfiltered), color-filtered, and hyperspectral cathodo-luminescence imaging to reveal textures and contrasts of interest at the microscale which can aid inestablishing the geological history as well as in porosity/permeability studies of such rocks. Sedimentary rocks are made up of a particular classof rocks which are formed by the weathering oftheEarth's crust, the accumulation of shells secreted byorganisms on the seafloor, and the precipitation ofminerals from water. They are typically composed ofgranular material which has been lithified by pres-sure and temperature as the rock is buried deeper inthe Earth's crust (if the deformations and changes inthe material are too extreme the rock is classified asmetamorphic.). The grain size can vary from less than4 pm for clay materials up to more than 25 cm forsome rudite materials. Due to their granular structure, sedimentary rocksare generally quite permeable to fluids such as wa-ter. Minerals can precipitate from this infused waterto form a cement that strongly binds the individualgrains in the rock. Sedimentary rocks present a valua-ble source of iron and natural fertilizer. Furthermore,they form the main source of fossil fuels (oil, naturalgas,and coal) and thus hold great practical value. Inthis case, the porous network in the rock determinesthe oil/gas holding capacity, as well as the transportproperties which are relevant for the extraction ofthese resources [1]. Sandstone is a particular type of sedimentary rockwhich has strong relevance to the petroleum indus-try, as it presents one of the main rock types in whichfossil fuels can be found. In sandstone, at least 50% of the grains must have a size between 60 and 200um. Sandstones often have a high quartz content, asquartz is more resistant to weathering compared toother common minerals such as feldspar and mica.Cement can also be present in sandstone whichcan strongly affect its porosity and permeability. Themicroscale/nanoscale topology and texture can beused to interpret the geological history of the rock.Furthermore, they directly affect the overall chemical,mechanical, and fluid transport properties of the rockand hence studying the rocks at those length scalesis of high interest. Over the course of the last decades, it has beendemonstrated that scanning electron microscope(SEM)-based cathodoluminescence (CL) spectros-copy is a pertinent technique for the micro-charac-terization of sedimentary rocks [2-4]. In particular, itprovides information that is complementary to SEM-based techniques, such as energy and wavelengthdispersive x-ray spectroscopy (EDS, WDS), and elec-tron backscattering imaging (BSE, EBSD). Typicallythe CL yield is high enough for rapid- and, in somecases, even video-rate scanning, allowing the fast in-spection of relatively large areas. In the case of sand-stone, CL imaging can be used to quantitatively mapthe quartz composition of the sample which enables,for instance, the rigorous segmentation of granularmaterial and cemented material. By combining such results with in-depth analysis ofthe observed textures, such as (healed) fracturesand grain contacts, the geological history as well asthe porosity of the rock can be studied in great de-tail. Due to the superior spatial resolution, very finedetails in the structure can be revealed. This can beused to amend information that is obtained withcoarser imaging techniques such as 3D micro com-puted x-ray tomography (pCT) or optical microscopystudies. These results can serve as valuable input foradvanced mechanical and fluid dynamics simulationsthat are used to determine the macroscopic prop-erties of the rock. While such studies are of funda-mental interest, they are also used by the petroleum EXPERIMENTAL SYSTEM & SAMPLEPREPARATION The experiments were performed in a FEI XL-30 SFEGscanning electron microscope (SEM), equipped witha prototype of the SPARC CL-system. The CL is col-lected by an aluminium paraboloid mirror, which isproperly aligned using piezoelectric actuators. The CLdetection was performed using an uncooled analogPMT(,=230-870 nm spectral range where 入, is thefree-space wavelength). This was used for panchro-matic imaging (no color filtering), and wavelength-fil-tered imaging, in which we placed a band pass filter infront ofthe PMT. A fiber-coupled Czerny-Turner spec-trometer was used with a cooled back-illuminated sil- Here, we perform CL measurements on quartz sand-stone samples. On these samples we have performedfast large-area'measurements with a photomultipliertube (PMT) to establish the general CL structure ofrock and more small-scale hyperspectral measure-ments with a CCD spectrometer to gain more de-tailed insight into specific regions. In particular, wecompare CL images with the SEM images, describethe observed textures and contrasts, and study thewavelength dependence of the CL emission for theserock samples. icon camera(=350-1000 nm spectral range) forhyperspectral imaging. For a more complete descrip-tion of the SPARC CL system we refer the reader to[5].Experiments were performed on two similar bulkquartz sandstone samples on which the surface waspolished to better reveal the structure. We note thatthe surface preparation can have a profound effecton the experimental outcome and should be handledwith care [2]. The samples were coated with 30 nm ofamorphous carbon for proper electrical conduction.A photograph of sample 1 is shown in Figure 1. Figure 1. Photograph of sandstone sample 1. Thissample is 1 cm in diameter. Sample 2 is 2 cm indiameter. CATHODOLUMINESCENCEMAGING OF SANDSTONES Fast large-area CL scanning Polished sandstone thin-sections (45 x 25 mm is astandard size for such a section) or surface-polishedparts of rock which are extracted from larger drillcores, such as the sample shown in Figure 1 (typically1 - 3 cm in diameter), present a significant surfacearea for an SEM study. To obtain a good overview ofsuch a 'vast’ sample it is of best interest to quicklyscan relatively large areas. This is enabled by a num-ber of experimental choices. First of all, a strong CLsignal is beneficial for fast inspection. Using a high ac-celeration voltage and current boosts the CL outputfrom the sample. Second, the detector needs to befast enough in terms of read-out time and should ac- commodate a large' field of view which is determinedby the detector size and the optics. Third, the lighthas to be collected and guided to the CL detector inan efficient way. This is done with the SPARC's mo-torized mirror collection system which allows impec-cable reproducible optical alignment. Efficient signalcollection has an additional advantage: many miner-als including quartz can be structurally altered by theelectron beam if the dose is too high, perturbing theemitted signals and leading to possible misinterpre-tations of the data [4,6]. By detecting the signal asefficiently as possible, the electron dose per unit areacan be reduced to a minimum, increasing the reliabil-ity of the method. max CL @ 10 ps min Figure 2. (a) SEM image of an area on sample 2. 17 megapixel panchromatic PMT image, collected with a dwell time of (b) 800 ns and (c) 10 usofthe same area on the sandstone. The color scaling is adjusted to the dynamic range of the image for proper visibility of all the features. To comply with the above demands, we used the PMTdetector in panchromatic mode, i.e. spectrally unfil-tered, at 15 kV acceleration voltage and a 5 nA probecurrent. For sample 1 we used a400 pA current and10 kV because the conductive layer did not operateas effectively as for sample 2. The PMT amplificationwas set to match the dynamic intensity range of thesample. In Figure 2(a) a SEM image is shown of a region inthe sandstone. Individual crystal grains can be recog-nized from the surface topology, but as the materialis the same (quartz), the contrast from grain to grainis low. Furthermore, such grains can have a rich in-ternal structure which cannot be visualized with SEMimaging. Figure 2(b,c) show examples of panchromat-ic 4096×4096 (17 megapixels) PMT CL scans of thesame area for different pixel dwell times. In thesemeasurements the electron beam is raster scannedover the sample and for each position the CL intensi-ty is measured by the PMT. Evidently, the CL imaginggives a very different contrast compared to the SEMimage. The underlying physical reasons for this con-trast will be explained in more detail below. The pixeldensity in these CL images is high enough to resolvefine spatial details in the CL structure. The signal levels are high enough to allow pixel dwelltimes of 800 ns. At 800 ns dwell time a 17 megapixelimage can be collected in 13 s but a 512 ×512 imagecould be collected in ~0.2 seconds enabling live CLimaging at an acceptable resolution. In some sample areas the use of such fast dwell times leads to streak-ing in the image.This is due to the fact that the radi-ative lifetime of some of excited transitions exceedsthe scan time per pixel, leading to residual CL emis-sion after the beam has moved. Some rocks such ascarbonates can be rich in extrinsic color centers withvery long radiative lifetimes, limiting the scan speedsto ms timescales [2]. However, in these sandstonessuch slow color centers are sparse,so overall this fastscanning mode functions well. By using a 10 us in-tegration this streaking effect completely disappearsand a better signal-to-noise ratio is also obtained,yielding smoother images. These are single-scan im-ages where only the electron beam is scanned. How-ever, in principle the SEM stage can also be scanned,enabling tiling and stitching for a fully automatedsample inspection workflow. The effect of acceleration voltage Next, we study the effect of acceleration voltage onthe CL imaging. Figure 3(a,b) show images from thesame area collected at 15 and 5 kV respectively. At15 kV the CL intensity is higher because the electronbeam is more energetic. This can be beneficial forfast scanning, as described above. However, similarto EDS and WDS this increase in signal generally oc-curs at the expense of spatial resolution as the pene-tration into the material and the resulting interactionvolume is also larger (electrons can penetrate morethan 2 um of material compared to 300 nm for 5 kV,as estimated with the Casino Monte Carlo programassuming a density of SiO,) [7]. As a result, the imag- es at 5 kV have more noise but show sharper spatialfeatures which could be beneficial for high-resolutionstudies. This is aptly illustrated by the images in Fig-ures 3(c,d). Another example of this effect is shownin Figure 5(c,d). In sedimentary rocks (such as mud-stone and shale) the feature sizes are so small thata reduced voltage may be essential to capture all theimportant spatial features, but in sandstone most ofthe features are large enough to be resolved withhigher voltages. We note that the electron interaction volume does notsolely determine the spatial resolution and CL out- put. The translucency and texture of the material alsoplay a role, as (wavelength-dependent) absorptionand scattering in the material as well as reflectionson material interfaces can hinder light outcouplingand detection [8]. Additionally, the depth-dependentstructure of the material itself may play a role (e.g.the material is stratified or zoned in the vertical di-rection). Quartz is typically quite transparent, so lighttransport through microns of materials is possiblewithout significant propagation losses. Figure 3. Panchromatic 1 megapixel PMT images taken at (a) 15 and (b) 5 kV on the same area using a 10 us dwell time. The images in (c)and(d) show a blow up of the area enclosed by the white box in (b) for 15 and 5 kV respectively, revealing the difference in spatial resolution. Meas-urements taken on sample 2. Cathodoluminescence contrast in sand-stone We now investigate the observed CL contrasts inmore detail. Figure4(a,b)again shows an SEM imageand panchromatic CL image collected from the samesample area. Although the CL image is panchromatic,it nevertheless provides significantly more contrastthan the SEM image. For instance, in the CL image itis clearly visible that the top right grain was fracturedand the cracks were (partially) healed by anothermaterial with a similar SEM contrast but a lower pan-chromatic CL signal. The same applies to the bottomleft grain, in which a part of the material on the edgeis dark in CL and the adjacent layer of the materialhas an intermediate CL-intensity. To gain more insight into the cracked region we per-form hyperspectral imaging, in which we scan theelectron beam and collect a full spectrum for eachexcitation position (80 ms dwell time), thus yielding a3D datacube. Figures 4(c,d) show the CL intensity distribution at 425 and 650 nm wavelength integratedover a 10 nm spectral bandwidth. Evidently, the ma-terial in the crack is dark at 入 =425 nm compared tothe surrounding material from the grain but brighterat 650 nm. Such contrasts can be highlighted by mak-ing a (false) color RGB image from the datacube. Thespectra are separated in 3 sections which are binnedsuch that the total intensity in these spectral regionsdefines an RGB code. In this case we chose B= 400-483 nm, G=484-567 nm, and R= 568-650 nm,which resembles real RGB color space quite well and (a) (b) Thermal oxide 0 400 500 600 700 800 900 Wavelength (nm) covers the relevant spectral contributions in thesequartz samples. Alternatively, we can plot the CLspectrum corresponding to a specific position. In Fig-ure 4(g)we plot the CLspectrum for excitation on thegrain (position 1) and in the crack (position 2). Both atposition 1 and 2 there is a contribution at入 =650 nmbut at 1 a substantial peak at 425 nm is also present. The observed contrasts are related to the fact thatthe materials in the image have a different physicalstructure/phase as a result of how they were formed. Wavelength(nm) Figure 5. (a) PMT image (5 kV) which is used to identify a ROl (indicated by the white box) on sample 2. (b) SEM image ofthe ROl from (a). False color RGB images derived from the CL datacube collected on the area shown in (b) with (c) 5 kV and(d) 15 kV acceleration voltage. Spectra taken from the positions indicated in (d) for (e) 5 kV and (f) 15 kV. The spectra havebeen normalized to the maximum of the blue peak in spectrum 1 in (f). This strongly affects the absolute CL emission inten-sity as well as the color of emission. Both the grainand the material in the crack is quartz so there is littleelemental and density contrast. As a result the SE/EDS/BSE contrast in such cases often is low, makingthe extra CL contrast very valuable. The observed spectral peaks are characteristic forquartz, showing broad peaks at free-space wave-lengths 425 and 650 nm [2,6,9]. They are usually as-sociated with intrinsic defects in the SiO2 matrix [2,3].The peak at 入 = 425 nm is mostly found in plutonicand volcanic quartz which is created at relatively hightemperatures. In contrast, the peak at 入 =650 nmcorresponding to a non-bridging oxygen hole center(NBOHC) defect, can be found in most types of quartz[2,6]. The CL spectra indicate that the material atposition 1 corresponds to a detrital plutonic quartzgrain with cracks that are filled with a low temper-ature authigenic SiO2 precipitate (position 2) [2,11].This is consistent with the PMT image in (b) whichprovides an extended contextual overview of the lo-cal environment studied in the spectral image. Besides quartz of geological origin these spectral fea-tures can also be found in synthetic quartz such asa thermal oxide on silicon (see gray curve in Figure4(g)). This material is also formed under high temper-atures similar to igneous rocks. However,the spectralpeaks are more narrow than in the geological spec-imens which most likely is related to a reduction inhomogeneous peak broadening due to the higher material quality and purity. It has been shown that ex-trinsic CL from titanium impurities in the quartz canalso have a profound CL signature that gives rise toa strong CL feature at入=458 nm[9,10].Aluminiumis another common impurity in quartz which can leadto CL emission bands at 入 =390nm and入=500 nm[4,6]. Although we cannot be certain, these impuritiesseem to have a minor effect on the CL emission inour case, as has also been observed in other cases[4]. Elemental x-ray mapping or mass spectrometrycan be used to verify the presence and even deter-mine the concentration of such impurities. Figure 5 shows a similar workflow to Figure 4, butin this case we also vary the acceleration voltage. In5(a) we show the PMT image from which a region ofinterest (ROl) is selected for hyperspectral imaging.Figure 5 (c,d) shows the RGB CL images for 5 and 15kV acceleration voltage. The CL measurements againreveal regions with strong 'blue' and 'red'emission.We also note that the colors are not exactly the samefor the two voltages and that the image for 15 kV ismore blurry and uniform, reflecting the difference inexcitation volume. In (e) and (f) we show spectra for the two distinctlycolored regions as indicated in (d), for 5 and 15 kV re-spectively. In this case we have normalized all spectrato the maximum of spectrum 1 in (f) (blue curve) asto allow a more quantitative comparison. Looking atthe intensities, the overall CL yield at 5 kV is roughlyfive times lower compared to 15 kV. Consistent with the color coding in (c,d) we find that the blue peak isdominant at position 1 whereas the red peak dom-inates at position 2. Furthermore, the peak ratiosare different for 5 and 15 kV. This could be due to adifference in how the material transitions are drivenby the electron beam. The excitation density as wellas the energy distribution of electrons in the inter-action volume is different for these beam parame-ters, possibly affecting peak amplitudes. Additionally,depth-dependent light outcoupling/absorption ef-fects and depth-dependent changes in the materialstructure/composition could play a role. A rigorousexperimental study in which acceleration voltage andbeam current are systematically varied may providemore insight, but is beyond the scope of this paper. In the measurements in Figures 4 and 5, the crackswere rather large (~5 um). The grain studied in Figure6 shows smaller microcracks and spiders which arecommon in plutonic quartz grains [2,9]. Like the larg-er cracks these also appear dark in the panchromaticCL. By using color filtered PMT imaging it becomesclear that these cracks are also infilled with authigen-ic quartz. This is corroborated by the hyperspectralexperiment which displays very similar behavior towhat was observed in Figures 4 and 5. |n some cases the observed behavior is different fromFigures 4-6. In Figure 7 the strong blue/UV contribu-tion is absent but there is nevertheless a contrast inintensity between smaller crystals and the surround-ing matrix. Spectral inspection shows that the color Figure 6. (a) Panchromatic PMT image taken on a single grain on sample1. Wavelength-filtered (40 nm bandpass) PMT images at (b)X,=450 nmand (c) 650 nm taken with a 500 us dwell time. Wavelength slice throughhyperspectral datacube at (d)1 =425 nm and(e) 650 nm. The scannedarea corresponds to the white box in (a). (f) RGB image visualizing the CLcontrast between the microcracks and the surrounding grain. (g) SEM imagecorresponding to the white box in (a). (h) CL spectrum from the grain (1) andfrom the microcrack (2). (a) Wavelength (nm) Figure 7.(a) Panchromatic PMT image taken on sample 1. (b) Wave-length-filtered (40 nm bandpass) PMT image at ,=650 nm. Wavelength slicethrough hyperspectral datacube at (d) 入,=425 nm and (e) 650 nm. Thescanned area corresponds to the white box in(a). (e) RGB image visualizingthe CL contrast between the material in the crack and the surrounding grain.(f) SEM image corresponding to the white box in (b). (g) CL spectrum from thebright surrounding matrix (1) and from the darker grain (2). of emission is similar and that only the intensity is dif-ferent. It is known that glassy volcanic matrix quartzexhibits red CL emission because it has more defectsthan plutonic quartz [2] but the two quartz types ob-served here could also be different forms of precipi-tated SiO,,similar to what was observed in the healedcracks. Spectrally filtered PMT imaging In Figures 6 and 7 we already made use of band passfilters in front of the PMT detector to select particu-lar spectral features from the sample. Figure 8 showsanother a set of images taken on the same area withband pass filters centered at 入 = 450 nm (b) and入= 600 nm (c) (filters have a 40 nm bandwidth).Clearly the images are very different; parts that aredark for 450 nm are bright for 600 nm and vice versa,similar to what was seen in Figures 4-6 on a smallerscale. Such color-filtered images can be combinedinto a multicolor image as is shown in Figure 8(d) (inthis case the images in (a) and (b) are mapped ontothe blue and red RGB color channels, respectively).Such false coloring can be used for any combinationof color filters and helps to visualize CL features.Thismethod is generally applicable and can be used tolocate specific spectrally well-defined intrinsic andextrinsic color centers. In the context of these sand-stones this method would be ideal to perform fastsegmentation of large areas into cemented and plu-tonic detrital parts, for example. Figure 8. Single-wavelength PMT measurements taken with a(a) 450 nm and a (b) 600 nm band pass filter with a 40 nmbandwidth. (c) SEM image corresponding to the region inspected with the PMT. (d) Red-blue color image in which the PMTimages in (a) and (b) are placed in the blue and red color channel, respectively. For these measurements we used a 40 usdwell time. Measurements taken on sample 2. ACKNOLWEDGEMENTS In conclusion, we have shown the value of CL imagingin the context of quartz sandstones. Complementaryimaging modalities in the CL system can be combinedto form an efficient workflow for in-depth studies. The(spectrally-filtered) PMT imaging allows rapid inspec-tion for ROI determination and large area imagingfor visualizing the overall spatial structures and tex-tures of the rock at the micro/nanoscale. The moredetailed hyperspectral studies with the spectrographcan be employed to unravel the structure and mate-rial properties of these rocks at a deeper, more quan-titative level. The presented results clearly demonstrate that ce-mented and granular detrital quartz can efficiently beidentified and segmented in CL imaging. Quantitativemethods such as point counting or even full-scale CLimaging can be used to estimate the volumetric ratiobetween intergranular porosity, overgrowths,and de- ( We would li k e to thank W i lliam N e ijssen, E r ic Goer- gen, and T obias G erwig (FEI Company, Digital Rock Laboratory, Houston) for p roviding sandstone sam-ple 2 and for u seful d iscussions. ) trital quartz. This ratio can subsequently be used toestimate the initial pore volume which can determinethe degree of compaction in sandstones, for instance[2,12,13]. Studying porosity, cementation, compac-tion, and (micro)crack generation with CL is relevantfor petroleum geology as these provide quantitativeindicators on the permeability and storage capaci-ty of reservoir rocks. By combining CL imaging withother analytical SEM-based techniques such as BSE,EBSD, WDS, and EDS fully comprehensive automat-ed sedimentary rock studies can be performed. Fur-thermore, the high-resolution 2D information that isobtained in CL can in principle be combined with fo-cused-ion-beam milling or with information obtainedfrom pCT to gain insight into the 3D rock structure.These prospects are very exciting and will hopefullylead to even more comprehensive and automatedmethods for studying sedimentary rock processesand properties. ( [1] S. N. E hrenberg and P . H . N adeau, S a ndstone vs . Car- bonate p etroleum r e servoirs: A global p erspective on p o - rosity-depth and p orosity-permeabil i ty relationships , A A PGBull. 89, 435-44 5 (2005). ) ( [2] S. Boggs jr. and D. Krinsley,Application o f Cathodolumi nescence Imaging to the Study of Sedimentary Rocks, Cam-bridge University Press (2006). ) ( [3] M. Pagel, V. Barbin, P . Blanc , and D. Ohnenstetter, Cath-odoluminescence in G e osciences, Springer (2000). ) ( [4] D. K . Richt e r, T h. Gotte,j. G otze, a n d R . D. Ne u ser, Pro - gress i n appl i cation of cathodolumi n escence (CL) i n s e di- mentary petr o logy, Mineralogy and Petrology 79, 12 7 - 166 (2003). ) ( [5] T. Coenen, S. V. de n Hoedt , and A . P o lman, The SPARC cathodoluminescence system: a platform for nanoscale op-tics and materials s cience, Micros. T oday(2016). ) ( [6] M. A. Stevens K alceff and M . R. P h i llips, Cathodolumi-nescence m i crocharacteriz a tion o f the d e fect structure ofquartz, Phys. Rev . B. 52,3122-3134(1995). ) ( [7] D. Drouin, A. R. C outure, D. Joly, X. Tastet,V . A i mez and R. Gauvin , CASINO V2.4 2 - A F ast and Easy-to-use Modeling T ool for Scanning E lectron M icroscopy and M i croanalysisUsers, Scanning 29, 92-101(2007). ) ( [8] K. L. Milliken, SEM-Based Cathodolu m inesce n ce Imaging for Discr i minating Quartz Types in M udrocks, URTeC (2013). [9] http://www.csiro.au/luminescence/default.aspx ) ( [10] W. P. Leeman, C. M.MacRa e , N. C . W i lson,A. Torpy,C. A. Lee,J.j. Student,j. B. Thomas, and E. P. V i cenzi, A S tudyof Cathodoluminescence and Trace E l ement Compositional Zoning in Natural Quartz from Volcanic Rocks: Mapping Tita- nium Content i n Quartz, M ic r osc. M icroanal. 18, 1322- 1 341 (2012). ) ( [11] K. L. Milliken, Th e widespread occurrence o f h ealedmicrofractures in silicic l as t i c rocks : Evide n ce fro m s canned cathodoluminescence i m aging, American R o ck M e chanics Association (1994). ) ( [12] D . W. Ho u seknecht, Use of cathodoluminescence pe- trography for understanding compaction, q uartz c ementa- tion, and porosity in sandstones . Luminescence M i c roscopy and S p ectroscopy: Quantitative an d Qualitative Applica- tions, SEPM Short Course 25, 59 - 66(1991). ) ( [13] K. L. Milliken, R . M . Reed,and S. E. Laubach, Quantifying compaction and cementation in deformation bands i n po-rous sandstones, AAPG Memoir 85, 237-249(2005). ) Found this white paper interesting? Visit our websitefor the latest news on sample preparation techniques,scientific publications and more cathodoluminescencemicroscopy applications. ABOUT DELMIC B.V. is a company based inInDelft, theNetherlands that produces correlative light andelectron microscopy solutions. DELMIC's systemscater to a broad range of researchers in fields rangingfrom nanophotonics to cell biology. For questions regarding this white paper, contact ourSPARC Application Specialist at: coenen@delmic.comFor more information on the SPARC, visit:www.delmic.com/sparc.php The SPARC is a high-performance cathodolumines-cence detection system produced by DELMIC. Thens system is designed to optimally collect a l detectcathodoluminescence emission, enabling fast andsensitive material characterization at the nanoscale. Integration without compromise Thijsseweg 11 2629JA Delft The Netherlandstel. +31157440158 www.delmic.com info@delmic.com Integration without compromise
确定


还剩16页未读,是否继续阅读?

产品配置单
苏州德尓微仪器有限公司为您提供《石英砂岩中矿物含量检测方案(电镜部件)》,该方案主要用于非金属矿产中矿物含量检测,参考标准--,《石英砂岩中矿物含量检测方案(电镜部件)》用到的仪器有SPARC -高性能SEM阴极发光成像系统
推荐专场

相关方案
更多