


方案详情
文
采用LaVision公司的粒子成像测速系统,对冲击激波碰撞影响下的横向喷射-腔体相互作用进行了研究。测试系统包括一台200毫焦的双脉冲激光器和IagerProX型CCD相机。
方案详情

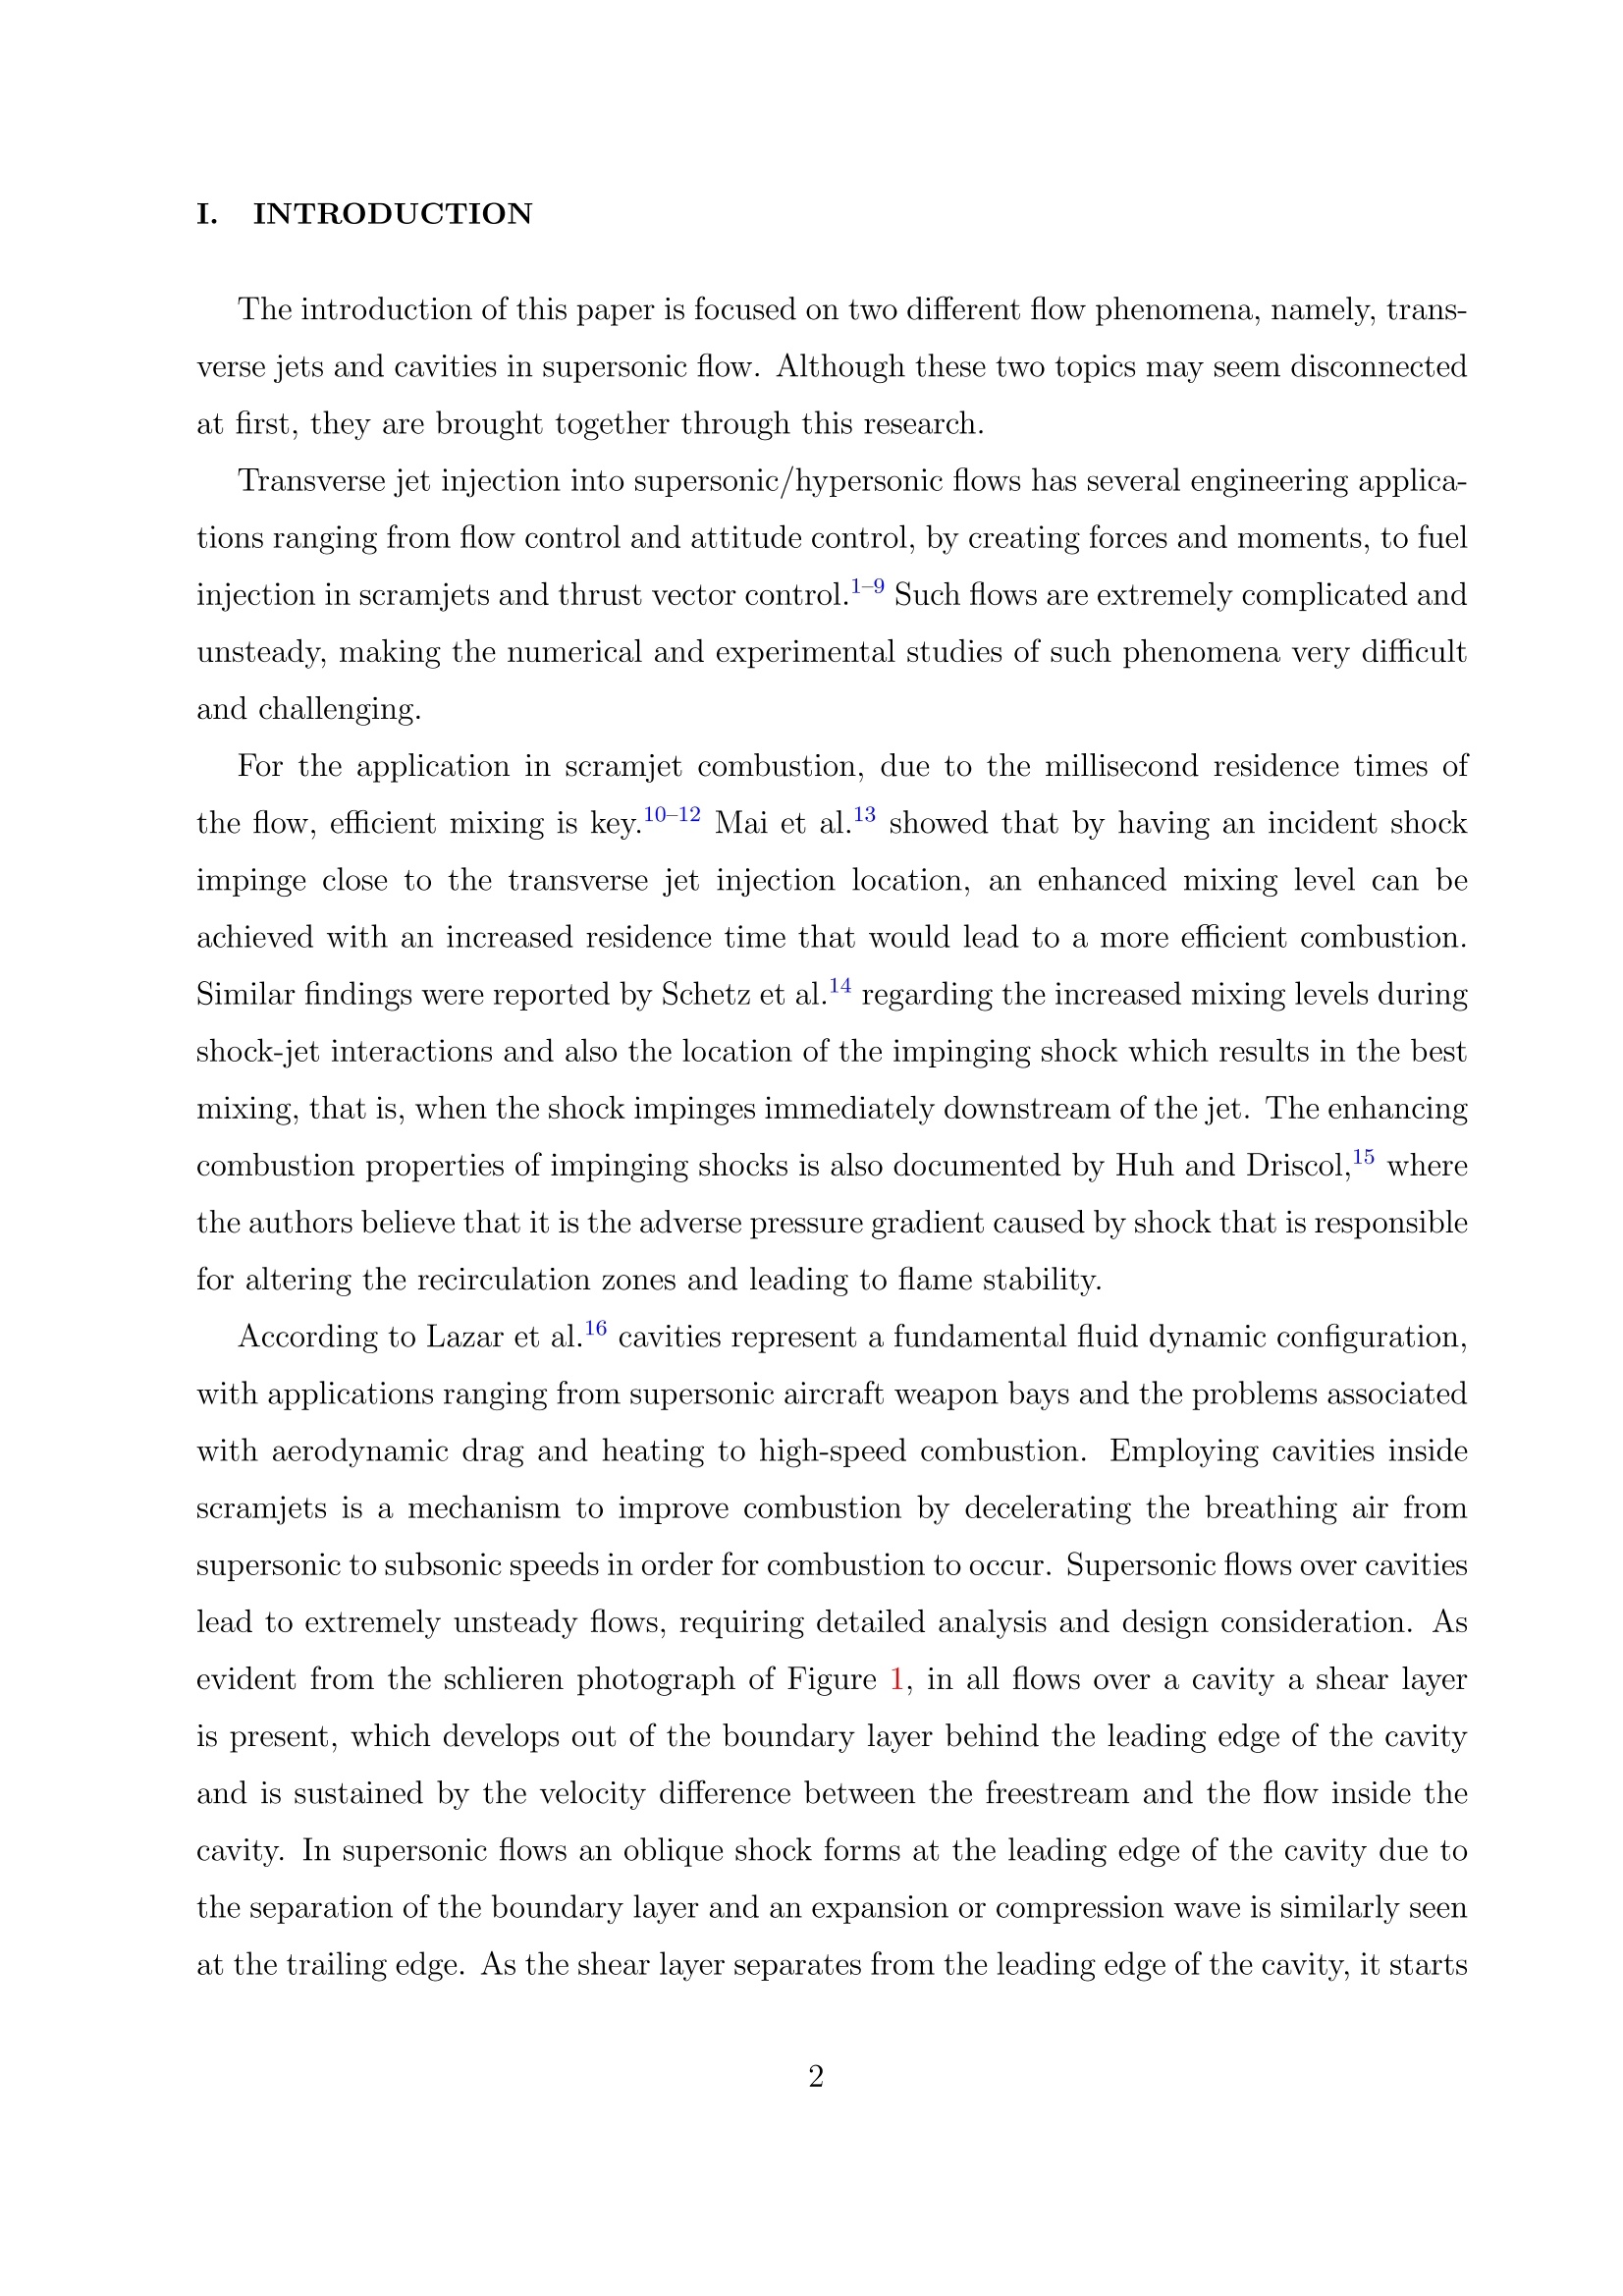
ResearchGate See discussions, stats, and author profiles for this publication at: https://www.researchgate.net/publication/275059482 Transverse jet-cavity interactions with theinfluence of an impinging shock Article in International Journal of Heat and Fluid Flow· June 2015 DOI: 10.1016/j.ijheatfluidflow.2015.03.004 CITATIONS12 READS 59 5 authors, including:Hossein Zare-BehtashKonstantinos KontisUniversity of GlasgowUniversity of Glasgow96 PUBLICATIONS431 CITATIONS213 PUBLICATIONS 1,164 CITATIONSSEE PROFILESEE PROFILETakahiro UkaiShigeru ObayashiUniversity of GlasgowTohoku University12 PUBLICATIONS 51 CITATIONS356 PUBLICATIONS 3,839 CITATIONSSEE PROFILESEE PROFILE All content following this page was uploaded by Hossein Zare-Behtash on 10 June 2015. Zare-Behtash, H., Lo, K.H., Kontis, K., Ukai, T., and Obayashi, S.(2015)Transverse jet-cavity interactions with the influence of an impinging shock. International Journal of Heat and Fluid Flow, 53, pp. 146-155. Copyright C 2015 Elsevier. A copy can be downloaded for personal non-commercial research orstudy, without prior permission or charge The content must not be changed in any way or reproduced in any formator medium without the formal permission of the copyright holder(s) When referring to this work, full bibliographic details must be given http://eprints.gla.ac.uk/104455/ Deposited on: 13 April 2015. Enlighten- Research publications by members of the University of Glasgowhttp://eprints.gla.ac.uk Transverse Jet-Cavity Interactions with theInfluence of an Impinging Shock H. Zare-Behtash,* K. H. Lo, and K. KontisSchool of Engineering, University of Glasgow, Scotland G12 8QQ, UK T. Ukai and S. Obayashi Institute of Fluid Science, Tohoku University, Sendai, Miyagi, 980-8577, JapanAbstract For high-speed air breathing engines, fuel injection and subsequent mixing with air is paramountfor combustion. The high freestream velocity poses a great challenge to efficient mixing both inmacroscale and microscale. Utilising cavities downstream of fuel injection locations, as a means tohold the flow and stabilise the combustion, is one mechanism which has attracted much attention,requiring further research to study the unsteady flow features and interactions occurring withinthe cavity. In this study we combine the transverse jet injection upstream of a cavity with animpinging shock to see how this interaction influences the cavity flow, since impinging shocks havebeen shown to enhance mixing of transverse jets. Utilising qualitative and quantitative methods:schlieren, oilflow, PIV, and PSP the induced flowfield is analysed. The impinging shock lifts theshear layer over the cavity and combined with the instabilities generated by the transverse jetcreates a highly complicated flowfield with numerous vertical structures. The interaction betweenthe oblique shock and the jet leads to a relatively uniform velocity distribution within the cavity. ( *Hossein.Zare-Behtash@glasgow.ac.uk ) I. INTRODUCTION The introduction of this paper is focused on two different flow phenomena, namely, trans-verse jets and cavities in supersonic flow. Although these two topics may seem disconnectedat first, they are brought together through this research. Transverse jet injection into supersonic/hypersonic flows has several engineering applica-tions ranging from flow control and attitude control, by creating forces and moments, to fuelinjection in scramjets and thrust vector control.1-9 Such flows are extremely complicated andunsteady, making the numerical and experimental studies of such phenomena very difficultand challenging. For the application in scramjet combustion, due to the millisecond residence times ofthe flow, efficient mixing is key.10-12 Mai et al.13 showed that by having an incident shockimpinge close to the transverse jet injection location, an enhanced mixing level can beachieved with an increased residence time that would lead to a more efficient combustion.Similar findings were reported by Schetz et al.14 regarding the increased mixing levels duringshock-jet interactions and also the location of the impinging shock which results in the bestmixing, that is, when the shock impinges immediately downstream of the jet. The enhancingcombustion properties of impinging shocks is also documented by Huh and Driscol,15 wherethe authors believe that it is the adverse pressure gradient caused by shock that is responsiblefor altering the recirculation zones and leading to flame stability. According to Lazar et al.16 cavities represent a fundamental fluid dynamic configuration,with applications ranging from supersonic aircraft weapon bays and the problems associatedwith aerodynamic drag and heating to high-speed combustion. Employing cavities insidescramjets is a mechanism to improve combustion by decelerating the breathing air fromsupersonic to subsonic speeds in order for combustion to occur. Supersonic flows over cavitieslead to extremely unsteady flows, requiring detailed analysis and design consideration. Asevident from the schlieren photograph of Figure1, in all flows over a cavity a shear layeris present, which develops out of the boundary layer behind the leading edge of the cavityand is sustained by the velocity difference between the freestream and the flow inside thecavity. In supersonic flows an oblique shock forms at the leading edge of the cavity due tothe separation of the boundary layer and an expansion or compression wave is similarly seenat the trailing edge. As the shear layer separates from the leading edge of the cavity, it starts to roll up into large-scale vortical structures due to the KelvinHelmholtz instability. Whenthese structures impinge on the trailing edge of the cavity, acoustic waves are generated.These waves propagate to the leading edge within the cavity, because the free-stream flowis supersonic, to further excite the shear layer. Gruber et al.18 looked at how changes in the aft wall of an open cavity can lead to changesin the shear layer and hence the drag and residence time within the cavity. Sakamoto etal.19 revealed the complex three-dimensional nature of two-dimensional cavity flows, and theoscillatory nature of the leading edge cavity shock.. When introducing an impinging shockover the cavity, they found that the shear layer angle, separation lines, and the featuresof the bow shock at the rear corner of the cavity depend strongly on the impinging shocklocation. Ukai et al.20 showed that if an injector is positioned close to the cavity leadingedge, not only is the mixing enhanced within the cavity, but a stable mixing can be achievedindependent on the jet-to-freestream momentum flux ratio. According to Ben-Yakar and Hanson flame holding is achieved by: 1) organisation ofa recirculation area where the fuel and air can be mixed partially at low velocities, and 2)interaction of a shock wave with partially or fully mixed fuel and oxidizer; both of thesemethods can be found in the present study. It is therefore the goal of this study to examinethe flow physics when combining an impinging shock wave with a transverse jet locatedupstream of a cavity. It is believed that combining the merits of enhanced jet mixing dueto an impinging shock together with placing a cavity downstream, higher levels of mixingand flow stability can be achieved. It is believed that the results will not only shed lighton the fundamental flow characteristics but also help in the development and verification ofadvanced turbulence modelling tools. II. EXPERIMENTAL SETUP A. Wind tunnel and model The wind tunnel, identical to that used by Ukai et al.,20 is an intermittent indraft tunnelwith test section dimensions of 150×215×485mm (widthxheightxlength). Desiccant par-ticles are present at the tunnel inlet to absorb the moisture in the air, a heater is used todry the desiccants and relieve them of any moisture content. For a Mach number of 1.9, the tunnel has a stable run time of approximately 5 seconds and a Mach number variation of±0.01 for different runs. The Reynolds number for the current experiments is 8.4×10⁶/m.Although previous studies examining scramjet flow physics have covered higher Mach num-bers and Reynolds numbers in the 106 regime,22 the flow inside the combustion chamber of ascramjet would be travelling at a much lower Mach number due to the various compressionwaves encountered upstream.23 As shown in Figure 2, a shock generator with a wedge angle of 10 degrees is mountedon the top wall of the test section to generate an oblique shock wave. The location of theshock generator can be varied in the streamwise sense.Two locations are chosen. Case 1immediately downstream of the jet location, and Case 2 where the shock wave impinges7.5mm downstream of the cavity leading edge. A rectangular open cavity, 100mm in length (L) and 20mm deep (D), was designed intothe bottom wall of the test section. An axisymmetric conical jet hole with an orifice diameterof di=2.2mm was placed 10mm (0.1L) upstream of the cavity along the centreline, with airas the jet medium. A jet to freestream momentum flux ratio, measure of the jet penetrationinto the freestream, of 5.3 was chosen, identical to the work of Ukai et a1.20,24 which is definedin Eq. (1), where y denotes specific heat ratio, p pressure, M Mach number, and the subscriptsts “cand “jet”refer to the freestream and jet conditions, respectively.2 B. Measurement Techniques A standard Z-type schlieren system was utilised, identical to that used by Zare-Behtashet al.25,26 The light source was a 450W continuous Xenon lamp and a Photron SA-1 high-speed camera was used to capture images at a frame rate of 10kfps with an exposure timeof 1us. Oil flow visualisation is a simple and effective method for visualising surface flowpatterns.27 Here, a mixture of fluorescent powder, paraffin, oleic acid, and silicon oil wasused to map the flow. Before each run, the oil is deposited inside the cavity near the rearwall and illuminated with a pair of UV LED panels, 390nm wavelength, from both sides of the test section. Images are acquired using a Canon SLR camera, model EOS-450D, witha 12M pixel resolution. The recipe was optimised through trial and error to ensures thatthe oil does not dry too quickly, allowing sufficient time for the flow to establish, but at thesame time it is not too viscous to obstruct the flow. For particle image velocimetry, a Litron Nano L series, ND:YAG Q-switched laser, 532nmwavelength, 4ns pulse duration, 200mJ/pulse and 15Hz repetition rate, was used for illumi-nation along the centreline of the cavity. The time averaged flow field measurements consistof 60 image pairs captured with a ▲t of 0.9us. The ▲t was recommended by the software,which is dependent on the field of view and the freestream velocity. A laser arm was usedto deliver the laser to the test section. To create tracer particles a TSI six-jet atomisermodel 9307-6 was used. The seeder is capable of creating particles with a diameter of ap-proximately 1um.28 A LaVision Imager ProX CCD camera with 1600×1200 pixel resolutionwas used for image capture at 14 bit digitisation..The recorded image pairs are initiallydivided into 32×32 pixel interrogation windows and then processed with a cross correlationalgorithm using the DaVis 7.2 software, the interrogation windows are then refined to 16×16pixel squares. The total uncertainty of the PIV measurements, taking into account the error arisingduring the cross-correlation process,2 the accuracy of the seeder particles to follow the flowstreamline,30 and also the uncertainty in velocity measurement using PIV,31is calculated at±6.5%. The Pressure sensitive paint (PSP) technique was also utilised. The description of thistechnique along with its merits over conventional pressure measurement techniques are wellmenated in the literature.32-37 The in-house developed PSP technol 7usepresent study has been successfully applied in a variety of flow conditions and has beenfound in all cases to provide accurate pressure measurements when compared to conven-tional pressure transducers.38-44 The PSP setup consists of a LaVision Image Intense 12-bitCCD camera with a 590nm long-pass filter mounted on the lens, and UV LEDs with peakwavelength of 390nm were used for image acquisition. Ruthenium is used as the luminoh-pore molecules in the current recipe. Multiple images were collected and then summed toimprove the signal to noise ratio of the collected data. The PSP was sprayed over the cavityfloor over a matte white coat, and the camera was mounted on the top wall looking downonto the cavity. A dark image is subtracted from the wind-on (with flow) and wind-off (no flow) imagesto account for variations in the dark current signal of the camera. An in-house developedMatlab code is used for image processing. The code also carries out an image registrationto eliminate any errors due to model movement during the experiments. An a-priori cal-ibration was applied to the data, since in-situ calibration was not possible in the currentsetup. Temperature errors are usually associated with PSP measurements. Due to the lowspeed flow near the cavity floor, the recovery temperature approaches the flow stagnationtemperature, and the fact that the model is made from aluminium, that has a high thermalconductivity, all contribute to an isothermal boundary condition.4 Pressure tappings were also placed along the cavity floor. However due to the tunneldesign, long tubes were required to connect these to the transducers. The length of thesetubes combined with the relatively short flow duration meant that the pressure data wereunreliable. III. RESULTS AND DISCUSSION Instantaneous schlieren photographs of the flow are presented in Figure 3. From theseimages, the boundary layer thickness upstream of the cavity is calculated as 8.1mm. Fromthe separation of the boundary layer at the leading edge of the cavity, a shear layer is formed.Downstream, the shear layer becomes less visible due to its unsteady nature. At the rearcorner of the cavity a bow shock is formed due to the impingement of supersonic flow atthis location. Figures 3(a) and (b) correspond to Case 1, shock immediately downstreamof the jet, whereas Figures 3(c) and (d) show Case 2 with the impinging shock downstreamof the cavity leading edge. At the front corner of the cavity typically an oblique shockwave is induced by the shear layer, however in the present study the interaction betweenthe impinging shock in Figure3(a)leads to a different flow structure. When an incidentshock impinges on a boundary layer it creates a reflected shock, whilst at the same timelifting the boundary layer and creating a virtual bump. Depending on the strength of thisinteraction, a region of reversed flow is some times created within this virtual bump. Dueto the strong interaction of the impinging shock and boundary layer a separation shock isformed immediately upstream of the impinging shock. Traces of a weak recompression shockare also visible in this picture. In Figure 3(c), the impinging shock occurs over the cavity and on the shear layer, howeverthe interaction results in a similar interaction as with the boundary layer,46 namely the liftingof the shear layer. Because the shear layer is lifted, the boundary layer separation at theleading corner of the cavity is moved further upstream, i.e., separation occurs earlier,andso the oblique separation shock from the cavity corner moves upstream. This behaviour isevident when comparing the case with the impinging shock to the undisturbed cavity caseshown in Figure 4. When the jet is switched on in Figures 3(b) and (d), the presence of thejet moves the separation shock further upstream for both shock impingement locations. Surface oil flow visualisations along with the streamlines are shown in Figure 5.Themodel centreline marked by the dashed line also crosses the centreline of the upstream jet.Wall effects occurring close to the cavity sides are evident. With no jets, the cavity floor isdominated by a strong flow originating from the rear face and terminating in two counterrotating vortices in Figures 5(a) and (c).When the jet is switch on, depicted in Figures5(b) and (d), the presence of the jet leads to a relatively lower pressure along the centrelineof the cavity floor (corroborated by the PSP measurements in Figure 9) compared to thesides. This gradient in pressure causes the air from the cavity sides to converge along thecentreline and push the two large vortices closer together. While the individual PIV measurements are likely to be accurate, the uncertainty as-sociated with the possible lack of sufficient vector fields, to ensure statistical convergence,needs to be first addressed. As indicated in Figure 6, six random locations in the field ofview were selected as samples and their stream-wise velocity component compared to. Asevident in Figure 6(a), the obtained velocities tend to converge for the current ensembleswith 60 vector fields. The standard error of the ensembles (standard deviation/square rootof the population size), in Figure 6(b), decreases substantially as the number of vector fieldsincreases. The sample points P5 and P6 exhibit higher error since they are located into theshear layer and cavity region, respectively, hence being influenced by the high instability ofthe flow. The time averaged absolute flowfield velocity and streamlines for both cases is presentedin Figure 7. Corroborating the schlieren images the impinging shock in Figures 7(a) and (c),with the jet off, raises the boundary and shear layer. This behaviour is further confirmed byexamining Figure 8 which shows the flow over the same cavity with identical flow properties(the scales are slightly different). The boundary layer upstream of the cavity leading edge is flat and parallel to the wall for the case with no shock impingement. Comparing this tothe PIV results of Figures 7(a) and (c), in these figures the boundary layer is clearly lifted.For Case 1 in Figure 7(a), the shear layer downstream of the interaction remains horizontaland propagates downstream. For Case 2 however, in Figure 7(c), the raising of the shearlayer is accompanied by a subsequent dip in its profile. When the jet is switched on, see Figures 7(b) and (d), the flowfield characteristics areconsiderably different. Based on the work of Gruber et al.4,47 and Ukai et al.,24 the interactionbetween the jet and incoming flow leads to the creation of new vortical structures, leadingto the amplification of the turbulence with the boundary layer and shear layer. The newstructures created by the transverse jet are a combination of the influence of the jet bowshock and recirculation regions before and after the jet injection location. The presence ofthe jet not only thickens the shear layer but also lifts it higher. With the jet on, the flowstructure inside the cavity is also different between Case 1 and Case 2. In Figure 7(b), thepresence of a large vortex towards the aft wall of the cavity is evident. For Case 2, however,this vortex appears to be much smaller and closer to the aft wall. The streamlines of Figure7(d) indicate that there is a greater transfer of mass and momentum between the cavity andthe freestream in Case2. The pressure along the cavity centreline, obtained from PSP data, is provided in Figure9for the two cases with and without the jet. The uncertainty in the PSP measurements is±4.4%.48 For both shock locations, the pressure is higher when the jet is switched on. Thehigher measured pressure, along the model centreline, indicates that with the introductionof the jet the flow speed along the cavity floor is reduced. This is consistent with thePIV data of Figures 7(b) and (d), where the shear layer thickness over the cavity increaseswith the introduction of the jet changing the vortex structures inside the cavity. A distinctdifference between the two shock impingement cases is the pressure rise (looking from X=220 pixels towards the cavity fore-wall) labelled in Figure 9(a). The location of this pressurerise corresponds to the recirculation region near the fore wall of the cavity. Since the risein pressure appears for the jet off and on cases, it means that it is as a result of the shockinteraction and its impingement location. It appears that the impinging shock reduces thestrength of the vortex near the fore wall, leading to a lower induced velocity and thereforehigher static pressure. This, however, needs to be substantiated by comparing the pressuremeasurements from an undisturbed cavity. High resolution PIV measurements focusing on this small region are necessary to extract the exact flow structures. Because the two shock impingement cases with no jet exhibit a similar time averagedvelocity profile,taking Case 1 where the shock impinges immediately downstream of the jet,the root mean square of the Va (longitudinal) and Vy (transverse) components of velocityprofile are presented in Figure 10. It is clear from this data that for the present open cavitycase, the longitudinal oscillations, running along the cavity, are the dominant structuresresponsible for the mass and momentum transfer in and out of the cavity. This behaviourwas also observed for Case 2 with the jet off, and with the jet on for both cases.Forsmall cavities (L/D <2-3) transverse oscillation dominate the cavity unsteadiness whereasfor larger aspect ratio cavities longitudinal oscillation are the dominant mechanism. Theimpingement of the shear layer at the aft wall introduces freestream flow into the cavity. Thisimpingement creates acoustic or compression waves inside the cavity.2 The propagation ofthese compression wave inside the cavity result in the high rms value of the V component. The turbulence Reynolds stress, Rey is an important dynamic quantity affecting themean flow since it is responsible for a major part of the momentum transfer due to turbu-lent fluctuations. The Reynolds stress is not only an indicator of the r.m.s. velocities butalso related to vorticity which is has strong influence on mixing, making it a suitable param-eter to analyse..The calculated Reynolds stresses are provided in Figure 11. The highestconcentration of Rery occurs near the aft wall of the cavity since this is where the dominantvortex structure inside the cavity exists.With the introduction of the jet in Figures 11(b)and (d), Case 1 shows a greater area of the cavity covered by turbulent structures originatingfrom the transverse jet. Profiles of the Reynolds stress taken at three different locations along the cavity floor:0.2L, 0.5L, and 0.8L (L being the length of the cavity) are plotted in Figure 12 for eachsubfigure of Figure 11. The profiles corresponding to Case 2, Figures 12(c) and (d), showhigher magnitudes of Rery near the aft wall compared to Case 1. The profiles of Case 1indicate the presence of smaller structures and greater in number, this is induced from thegreater number of fluctuations in Rery as we move from Y= 0mm at the cavity floor toY= 50mm in the shear layer. To clarify this behaviour, Figure 13 shows the Rery profilesfor the two shock impingement locations with jet on at x=0.5L. The greater number offluctuations is deduced from the higher number of peaks in the profile for Case 1. Examining the Reynolds stress near the leading edge wall of the cavity in Figure 14, it is evident that for Case 1, where the shock impinges near the jet location, the region wherethe Rexy has a lower magnitude near the fore-wall is smaller in size compared to Case 2.In terms of mixing, this implies that in Case 1 a larger area of mixing is present inside thecavity,leading to an enhanced overall mixing. IV.CONCLUSIONS The current investigation analysed experimentally the flow characteristics of a transversejet injection upstream of an open cavity with the influence of an impinging shock.Theresults reveal that the location of the impinging shock influences the cavity flow. Theinteraction between the vortical structures created by the transverse jet and the impingingshock changes the geometry of the shear layer over the cavity.The streamlines showedthat when the shock impinges near the cavity leading edge, the lifting of the shear layerencourages a greater momentum transfer into the freestream near the cavity aft wall. Theshock impingement location also influences the vortex structure inside the cavity. When theshock wave impinges close to the jet, the strength of the vortex near the cavity fore-wall isreduced leading to a lower induced velocity near the bottom wall. Analysis of the Reynolds stress inside the cavity reveal that when the jet is introducedand the shock impinges close to the jet, a greater area of the cavity is covered by turbulentstructures originating from the transverse jet. The Reynolds stress also shows an enhance-ment in mixing occurring the cavity fore-wall for the aforementioned case, deduced by thelarger area of high of Reynolds stress magnitude. We can conclude from the findings presented here that the case where the shock impingesclose to the jet leads to the creation of a greater number of smaller turbulent structurescompared to when the shock impinges on the cavity corner. Given the 3D nature of using asingle jet to force the cavity flow, high resolution PIV experiments focusing on specific areasof the cavity a recommended.These will provide a more comprehensive insight into theflow interactions. What remains to be seen is how the variation in turbulence and thereforemixing resulted from the shock interaction influences parameters such as residence time,burn percentage, thrust production and also the generation of noise inside a scramjet. It is recommended that the number of vector fields collected for the PIV analysis beincreased so that a higher level of convergence can be achieved, thereby increasing the accuracy of the time-averaged results. Acknowledgments The authors are grateful to the technical and administrative staff at the university, andto the EPSRC engineering equipment loan pool, especially Mr. Adrian Walker, for the loanof the Photron camera.This paper is dedicated to the hard work and talents of Mr. LeePaul who manufactured the models and has recently left the department. ( 1Ferri, A., Nucci, L.M. , “ “Preliminary investigation of a new type of supersonic inlet,”NACA-TN-2286 (1951). ) ( 2 S ullins, G.A., “ Demonstration o f mode transition in a scramjet combustor,” Journal o f Propul-sion and P ower 9 , 515-5 2 0, ( 1 993). ) ( 3 Ali, M., F ujiwara , T ., L eblanc, J .E.,“Influence of main flow inlet configuration o n mixingand flameholding in t ransverse injection into supersonic airstream, ” International Journal ofEngineering Science 38, 1161- 1 181,(2000). ) ( 4 Gruber, M .R., N ejad, A.S., C hen, T .H., Dutton, J.C.,“ T ransverse i n jection f rom circular andellipti c nozzle s into a supersonic crossflow , ” Journa l of Propulsio n and Power 16, 449-457,(2000). ) ( 5Kontis, K.,“ J et control effectiveness studies on a flat-plate body at hypersonic speeds,” T r ans-actions of the Japan Society for Aeronautical and Space S ciences 4 7, 131-137, (2 0 04). ) ( 6 Lee, S .H.,“ C haracteristics of dual tr a nsverse injection in sc r amjet combustor, Part 1: Mixi n g,”Journal of Propulsion and P ower 22, 1 0 12-1019, ( 2 006). ) ( L e e, S.H., “Characteristics of dual t r ansverse injection in scramjet combustor, Part 2: Combus-tion,” Journal of Propulsion and Power 22,1020-1 0 26,(2006). ) ( 8 Erdem, E.,Kontis, K . ,“N u merical and exp e rimental investigation of transverse injection flows,”Shock Waves 20, 103-118, ( 2010). ) ( 9 Cecere, D ., I ngenito, A ., Giacomazzi, E., Romagnosi, L., B r uno, C. , “Hy d rogenair super-sonic combustion f o r f u ture h y personic vehicles,” International J o urnal of Hy d rogen Ene r gy36,11969-11984,(2011). ) ( 10 Tomioka, S . , Jacobsen, L.S., Schetz, J .A., “Sonic injection from diamond-shaped orifices into a supersonic crossflow,”Journal of Propulsion and Power 19, 104-114,(2003). ) ( 11 B urtschell, Y., Zeitoun, D.E., “ Numerical i n vestigation of H2 injection in Mach 5 air f low witha strong shock/boundary l a yer i nteraction,” Shock Waves 1 3, 4 65-472, (2004). ) 12Huang, W., Liu, W.D., Li, S.B., Xia, Z.X., Liu, J., Wang, Z.G.,“Influences of the turbulencemodel and the slot width on the transverse slot injection flow field in supersonic flows,” ActaAstronautica 73, 1-9, (2001). 13Mai, T., Sakimitsu, Y., Nakamura, H., Ogami, Y., Kudo, T.,Kobayashi, H.,“Effect of the incident shock wave interacting with transversal jet flow on the mixing and combustion,” Pro-ceedings of the Combustion Institute 33, 2335-2342,(2011). 14Schetz, J.A., Maddalena, L., Burger, S.K., “Molecular weight and shock-wave effects on trans-verse injection in supersonic flow,”Journal of Propulsion and Power 26, 1102-1113, (2010). 15Huh, H., Driscoll, J.F., “Shock-wave-enhancement of the mixing and stability limits of super-sonic hydrogen-air jet flames,”26th Symposium (International) on Combustion/The Combus-tion Institute,2933-2939, (1996). 16Lazar, E., Elliot, G., Glumac, N.,“Control of the shear layer above a supersonic cavity usingenergy deposition,” AIAA Journal 46,2987-2997, (2008). 17Zhuang, N., Alvi, F.S., Alkislar, M.B., Shih, C.,“Supersonic cavity flows and their control,"AIAA Journal 44,2118-2128,(2006). 18Gruber, M.R., Baurle, R.A., Mathur, T., Hsu, K.-Y., “Fundamental studies of cavity-basedflameholder concepts for supersonic combustors,” Journal of Propulsion and Power 17, 146-153,(2001). 19Sakamoto, K., Matsunaga, K., Fujii, K., Tamura, Y.,“Experimental investigation of supersonicinternal cavity flows,” 26th AIAA Fluid Dynamics Conference AIAA-95-2213, (1995). 20Ukai, T., Obayashi, S., Zare-Behtash,H., Erdem, E., Lo, K.H.,Kontis, K.,“Effectiveness ofjet location on mixing characteristics inside a cavity in supersonic flow,” Experimental Thermaland Fluid Science (2013), 52,59-67,(2014). 21Ben-Yakar, A., Hanson, R.K.,“Cavity flame-holders for ignition and flame stabilization inscramjets: An overview,” Journal of Propulsion and Power 17, 869-877, (2001). 22Holland, S.D.,“Reynolds number and cowl position effects for a generic sidewall compressionscramjet inlet at Mach 10 - A computational and experimental investigation,” 17th AerospaceGround Testing Conference, Nashville, AIAA-92-4026, (1992). 23Che Idris, A., Saad, M.R., Zare-Behtash, H., Kontis, K.,“Luminescent measurement systemsfor the investigation of a scramjet inlet-isolator,”Sensors 14, 6606-6632, (2014). 24Ukai, T., Zare-Behtash, H., Lo, K.H., Kontis, K., Obayashi, S.,“Effects of dual jets d.S1tanceon mixing characteristics and flow path within a cavity in supersonic crossflow,” InternationalJournal of Heat and Fluid Flow (2014), In Press. 25Zare-Behtash, H., Kontis,K., Gongora-Orozco, N., Takayama,K.,“Compressible vortex loops:Effect of nozzle geometry,” International Journal of Heat and Fluid Flow 30, 561-576, (2009). ( 26 Z are-Behtash, H., Gongora-Orozco, N . , K o ntis, K.,“Effect of p rimary jet g eometry on e j ectorperformance: A c o ld-flow i n vestigation,” International Journal o f Heat and Fluid Flow 32 , 596-607, ( 2011). ) ( 27 Lada, C ., K ontis, K . ,“Experimental studies on tra n sitional and clo s ed cavity configurationsincluding flow control,”Journal of Aircraft 47, 723- 7 30,( 2 010). ) ( 28 Zare-Behtash, H ., Kontis, K., Gongora-Orozco,N . , Takayama, K.,“S h ock wave-induced vortexloops emanating from n o zzles w i th s i ngular corners,” E xperiments in F l uids 4 9 , 1 0 05-1019,(2010). ) ( 29 Lusl, W.T. , “Control of Supersonic Cavity Flow by Leading E d ge Blowing,”MP h i ll, Universityof Florida, USA, (2011). ) ( 30 Samimy, M., Lele, S.K.,“Motion of p articles with inertia in a c o m pressible free sh e ar layer,”Physics of Fluids 3,1915- 1 923,(1991). ) ( 31 Grant, I. , Owens, E.H.,“Confidence Interval Estimate s i n PIV Measurements of TurbulentFlows,” Applied Optics 29,1400-1402,(1990). ) ( 32 C arroll, B .F., A bbitt, J .D., Lukas, E .W., M o rris, M.J.,“Step response of pres s ure-sensitivepaints,”AIAA Journal 34, pp. 521- 5 26, 1 996. ) ( 33 Moshasrov, V ., R adchenko,V. , Fonov, S. , ‘ “ Luminescent P ressure Sensors in AerodynamicExperiments,”Central Aerodynamic Institute (T s AGI), 1998. ) ( 34 Bell, J.H . , Schairer, E.T . , Hand, L.A., Mehta, R.D.,“Surface pr e ssure measurements usi n gluminescent c oatings,” A nnual R e view of Fluid M e chanics 33, pp. 15 5 -206,2001. ) ( 35 Kontis, K ., L ada, C., Zare-Behtash, H.,“Effect of di m ples on gla n cing shock wave turbulentboundary layer i nteractions,” Shock Waves 1 7, p p. 323- 3 35, 2008. ) 36Gregory, J.W., Asai, K., Kameda, M., Liu, T., Sullivan, J.P., “A review of pressure-sensitivepaint for high-speed and unsteady aerodynamics,” Proceedings of the Institution of MechanicalEngineers, Part G: Journal of Aerospace Engineering 222, pp. 249-290,2008. 37Yang, L., Zare-Behtash, H., Erdem, E., Kontis, K.,,“Application of AA-PSP to hypersonicflows: The double ramp model,” Sensors and Actuators B: Chemical 161, 100-107, (2012). 38Kontis, K.,“A review of some current research on pressure sensitive paint and thermographicphosphor techniques,” The Aeronautical Journal 111,495-508, (2007). 399Zare-Behtash, H., Gongora-Orozco, N., Kontis, K.,“PSP visualization studies on a convergentnozzle with an ejector system,”Journal of Visualization 12, 157-163, (2009). ( 40Quinn, M.K., Y a ng, L., Kontis, K.,“Pressure-sensitive paint: Effect o f substrate,” S ensors 1 1 ,11649-11663, ( 2011). ) ( 41 Y ang, L., Erdem, E., Zare-Behtash, H . , Kontis, K., Saravanan, S.,“P r essure-sensitive paint o n a truncated cone in h ypersonic flow a t i ncidences,” International Journal of Heat and F luidFlow 37, 9 - 2 1, ( 2012). ) ( 42 2 Y ang, L., Zare-Behtash, H., E rdem,E. , Kontis, K.,“Investigation of the double ramp in hyper-sonic flow using luminescent measurement systems,”E p erimental The r mal and F luid Science40,50-56, (2012). ) ( 43 Quinn, M . K., Go n gora-Orozco, N., Kont i s, K., I rel a nd, P.,“App l ication of pr e ssure-sensitivepaint to low-speed flow around a U -bend of strong curvature,” E x perimental Thermal and FluidScience 48, 5 8- 6 6, (2013). ) ( 44 4(Quinn, M.K., Kontis, K.,“Pressure-sensitive paint measurements of transient shock phenom-ena,” Sensors 13, 4404-4427,(2013). ) 45Bjorge, S.T., Reeder, M.F., Subramanian, C. Crafton, J., Fonov, S.,“Flow around an objectprojected from a cavity into a supersonic freestream,”AIAA Journal 43,1465-1475,(2005). ( 46 B abinksy, H ., Harvey, J.K., “ Shock wave-boundary layer interactions,”Cambridge U n iversity Press 2011. ) ( 47 Gruber, M .R., B aurle, R .A., M athur, T., Hsu, K .-Y.,“Mixing and penetration studies of sonicjets in a Mach 2 freestream,” Journal of Propulsion and Power 1 1,315-323,(1995). ) ( 48Zare-Behtash, H., Gongora-Orozco,N., K o ntis, K.,Holder, S . ,“ A pplication o f novel pressure-sensitive paint formulations for the surface flow mapping of high-speed jets,” ExperimentalThermal and Fluid Science 33,852- 8 64,(2009). ) List of Figures 1 Schlieren image of a typical supersonic flow over cavity. 17 2 Model arrangement and test cases for shock impingement. 17 3 Instantaneous schlieren images: (a) & (b) Case 1, (c) & (d) Case 2. 17 4 Instantaneous schlieren images: (a) baseline,4(b) Case 2 corresponding toFigure 3(c). 18 5 Oil flow pattern along cavity floor: (a)& (b) Case 1,(c) & (d) Case 2... 18 6 PIV statistical analysis for increasing number of vector fields: (a) Convergenceof velocity, (b) Standard error. . 19 7 Time average absolute velocity: (a) & (b) Case 1, (c)& (d) Case 2. 19 8 Time average absolute velocity for the no-shock case taken from Ukai et al.L20 20 9 PSP pressure profile along the centreline of the cavity, (a) Case 1, (b) Case 2.20 10 Root mean square profiles of: (a)& (c) Vx and (b) & (d) Vy correspondingto Figure 7(a).. 21 11 Reynolds stress: (a) & (b)Case 1, (c) & (d) Case 2. . 22 12 Reynolds stress profiles along the cavity relating to Figure 11: (a) & (b) Case1, (c) & (d) Case 2. . 23 13 Reynolds stress profiles for Case 1 and Case 2 at the cavity centreline of 0.5L. 24 14 Zoomed areas of Reynolds stress: (a) Case 1, (b) Case 2 (the scales have beensaturated to better discern the flow near the leading edge wall). 24 FIG. 1: Schlieren image of a typical supersonic flow over cavity.6 FIG. 2: Model arrangement and test cases for shock impingement. FIG. 3: Instantaneous schlieren images: (a) & (b) Case 1, (c) & (d) Case 2. a) b) FIG. 4: Instantaneous schlieren images: (a) baseline,24 (b) Case 2 corresponding to Figure 3(c). FIG. 5: Oil flow pattern along cavity floor: (a) & (b) Case 1, (c) & (d) Case 2. Point 1 Point 2 Point 3 Point 4 Point 5 Point 6l FIG. 6: PIV statistical analysis for increasing number of vector fields:(a) Convergence of velocity,(b) Standard error. FIG. 7: Time average absolute velocity: (a) &(b) Case 1, (c) & (d) Case 2. FIG. 8: Time average absolute velocity for the no-shock case taken from Ukai et al.2 FIG. 9: PSP pressure profile along the centreline of the cavity, (a) Case 1, (b) Case 2. FIG. 10: Root mean square profiles of: (a) & (c) Vx and (b)& (d) Vy corresponding to Figure7(a). ReXY FIG. 11: Reynolds stress: (a) & (b) Case 1, (c) & (d) Case 2. a)5 Jet OFF )50F Jet ON FIG. 12: Reynolds stress profiles along the cavity relating to Figure 11: (a) & (b) Case 1, (c) &(d) Case 2. FIG. 13: Reynolds stress profiles for Case 1 and Case 2 at the cavity centreline of 0.5L. Reynold stress XY: -100D -70--40 -10 20 50 80 110 140 170 200 FIG. 14: Zoomed areas of Reynolds stress: (a) Case 1, (b) Case 2 (the scales have been saturatedto better discern the flow near the leading edge wall). The user has requested enhancement of the downloaded file. For high-speed air breathing engines, fuel injection and subsequent mixing with air is paramountfor combustion. The high freestream velocity poses a great challenge to ecient mixing both inmacroscale and microscale. Utilising cavities downstream of fuel injection locations, as a means tohold the ow and stabilise the combustion, is one mechanism which has attracted much attention,requiring further research to study the unsteady ow features and interactions occurring withinthe cavity. In this study we combine the transverse jet injection upstream of a cavity with animpinging shock to see how this interaction inuences the cavity ow, since impinging shocks havebeen shown to enhance mixing of transverse jets. Utilising qualitative and quantitative methods:schlieren, oilow, PIV, and PSP the induced ow
eld is analysed. The impinging shock lifts theshear layer over the cavity and combined with the instabilities generated by the transverse jetcreates a highly complicated ow
eld with numerous vertical structures. The interaction betweenthe oblique shock and the jet leads to a relatively uniform velocity distribution within the cavity.
确定


还剩24页未读,是否继续阅读?

产品配置单

北京欧兰科技发展有限公司为您提供《空气流场、喷射过程中流场、冲击激波、横向喷射、腔体相互作用检测方案(CCD相机)》,该方案主要用于航空中流场、冲击激波、横向喷射、腔体相互作用检测,参考标准--,《空气流场、喷射过程中流场、冲击激波、横向喷射、腔体相互作用检测方案(CCD相机)》用到的仪器有德国LaVision PIV/PLIF粒子成像测速场仪
推荐专场


相关方案
更多
该厂商其他方案
更多