


方案详情
文
This paper describes the development of an experimental technique that combines simultaneous planar
laser-induced fluorescence (PLIF) and infrared (IR) thermography imaging, and its application to the measurement
of unsteady and conjugate heat-transfer in harmonically forced, thin liquid-film flows falling
under the action of gravity over an inclined electrically heated-foil substrate. Quantitative, spatiotemporally
resolved and simultaneously conducted measurements are reported of the film thickness, film
free-surface temperature, solid–liquid substrate interface temperature, and local/instantaneous heat flux
exchanged with the heated substrate. Based on this information, local and instantaneous heat-transfer
coefficients (HTCs) are recovered. Results concerning the local and instantaneous HTC and how this is
correlated with the local and instantaneous film thickness suggest considerable heat-transfer enhancement
relative to steady-flow predictions in the thinner film regions. This behaviour is attributed to a
number of unsteady/mixing transport processes within the wavy films that are not captured by laminar,
steady-flow analysis. The Nusselt number Nu increases with the Reynolds number Re; at low Re values
the mean Nu number corresponds to 2.5, in agreement with the steady-flow theory, while at higher
Re, both the Nu number and the HTC exhibit significantly enhanced values. Evidence that the HTC
becomes decoupled from the film thickness for the upper range of observed film thicknesses is also presented.
Finally, smaller film thickness fluctuation intensities were associated with higher HTC fluctuation
intensities, while the amplitude of the wall temperature fluctuations was almost proportional to the
amplitude of the HTC fluctuations.
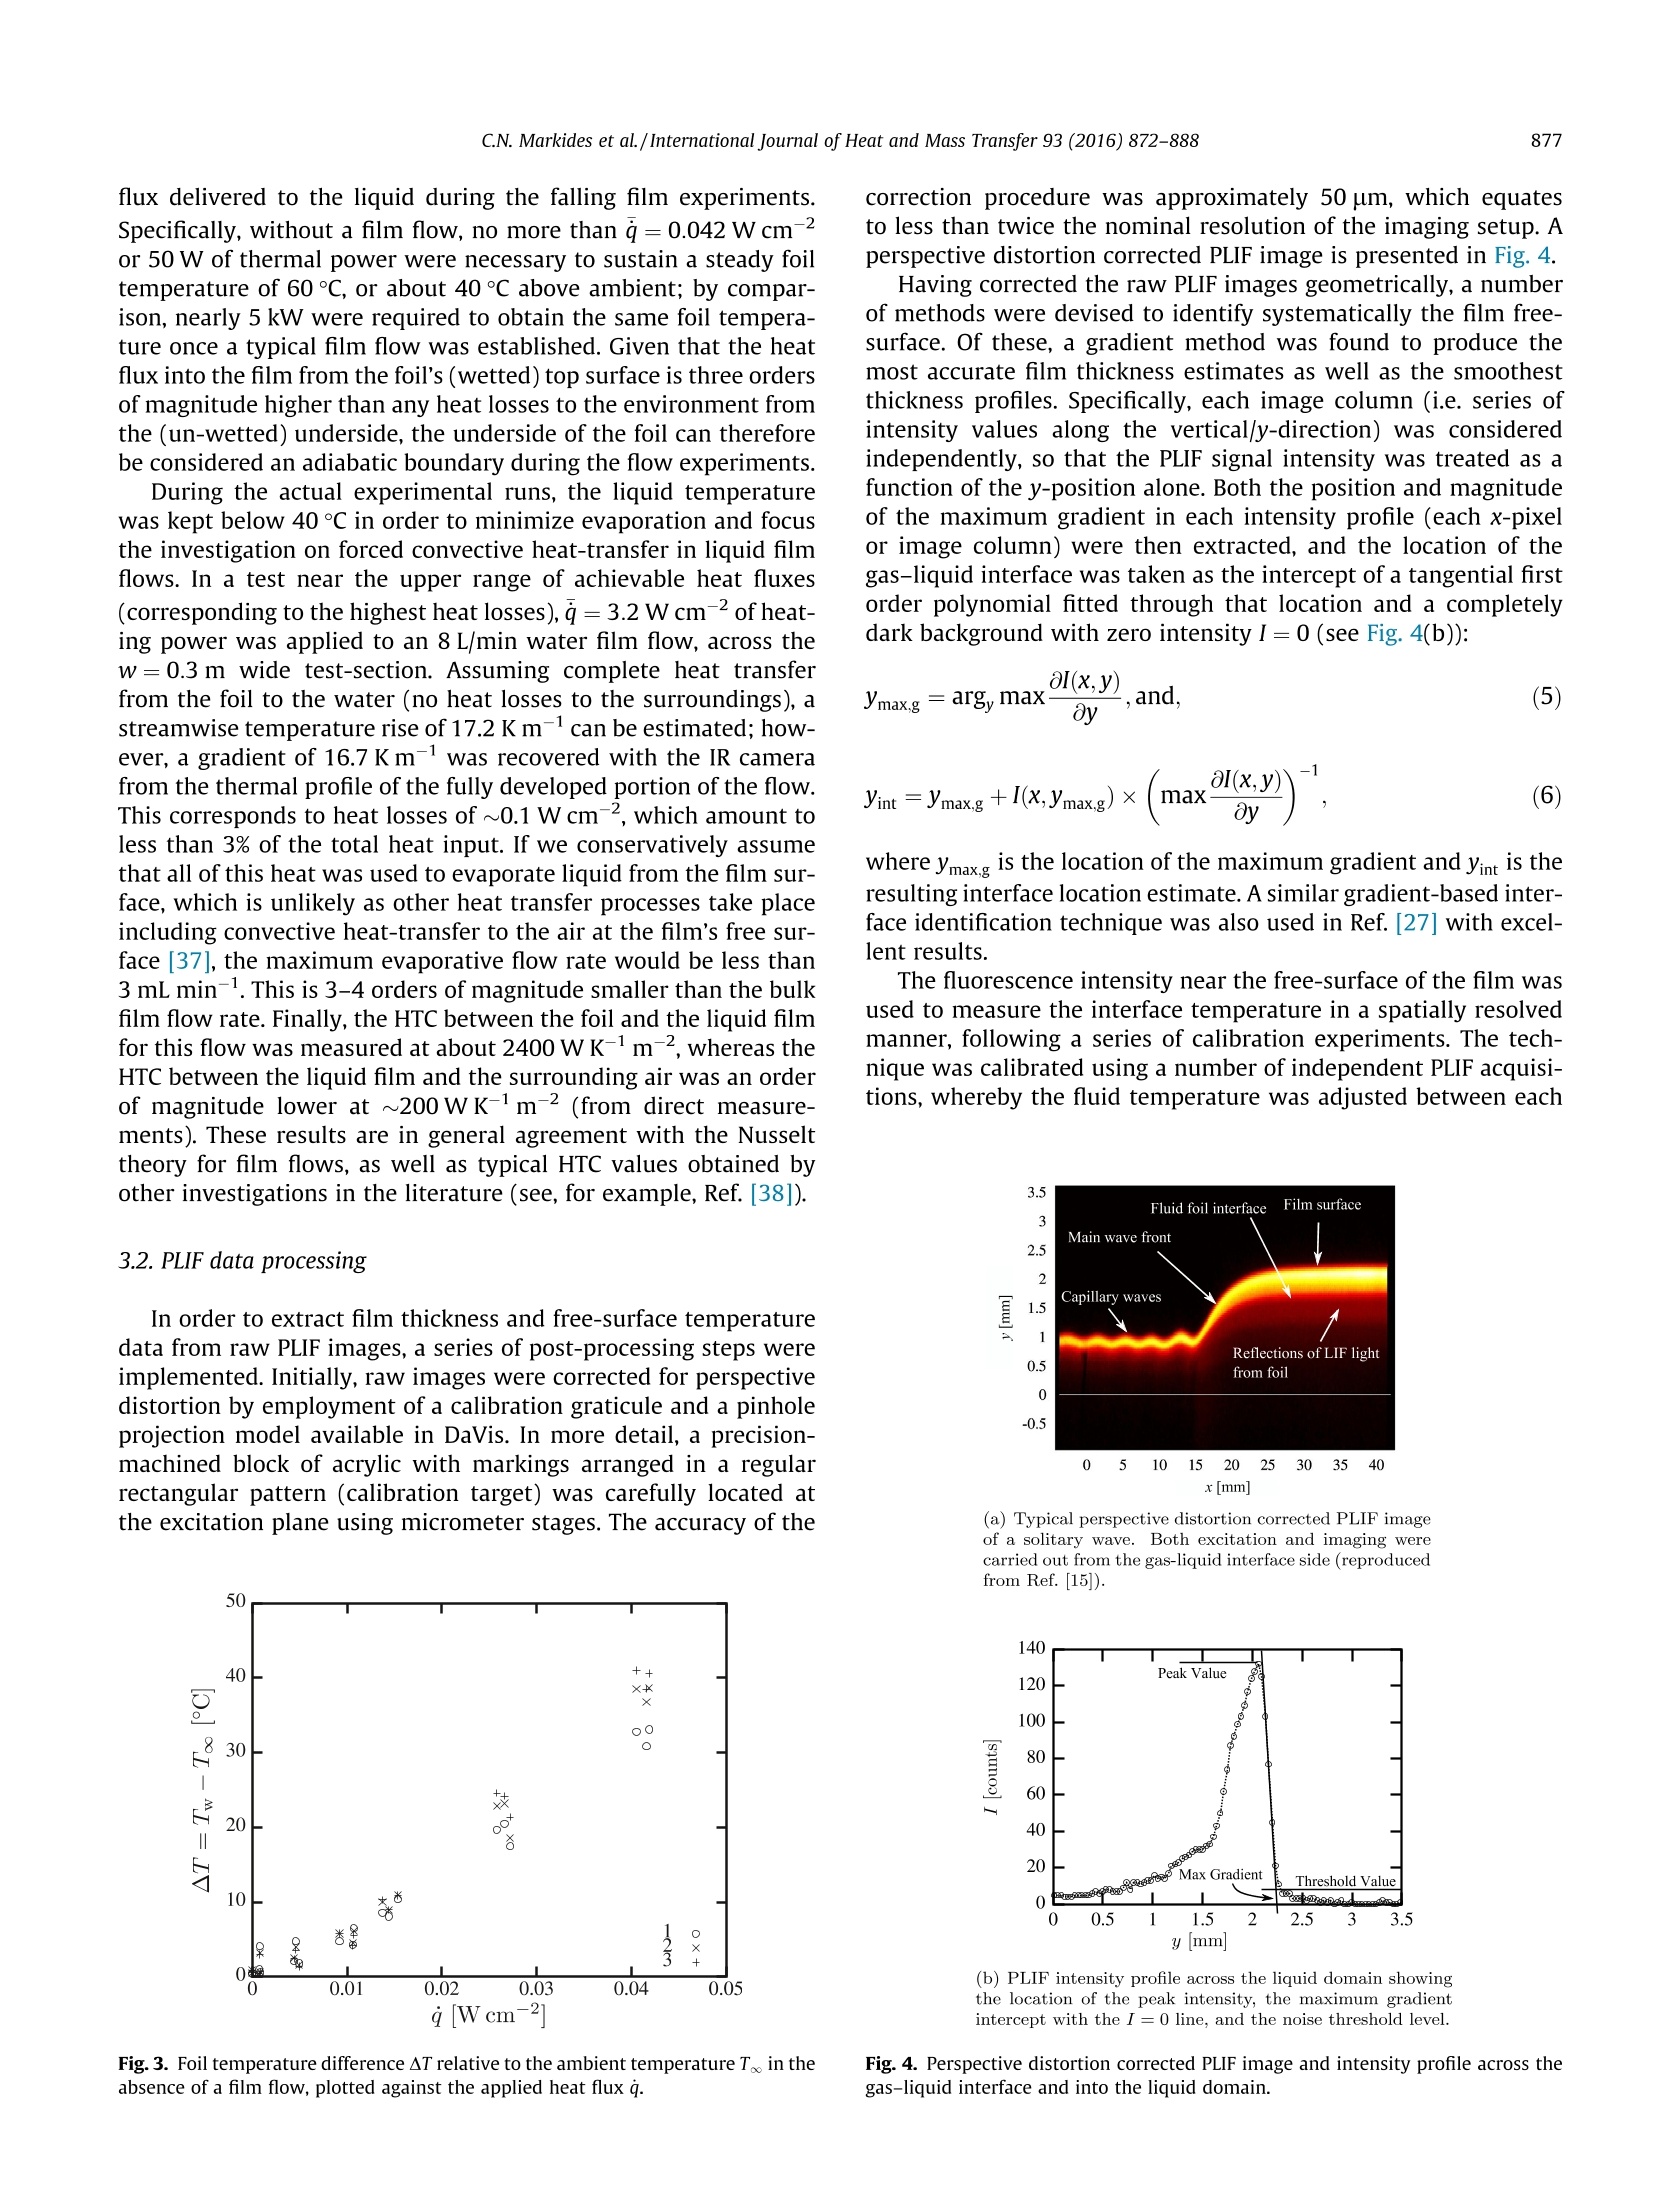
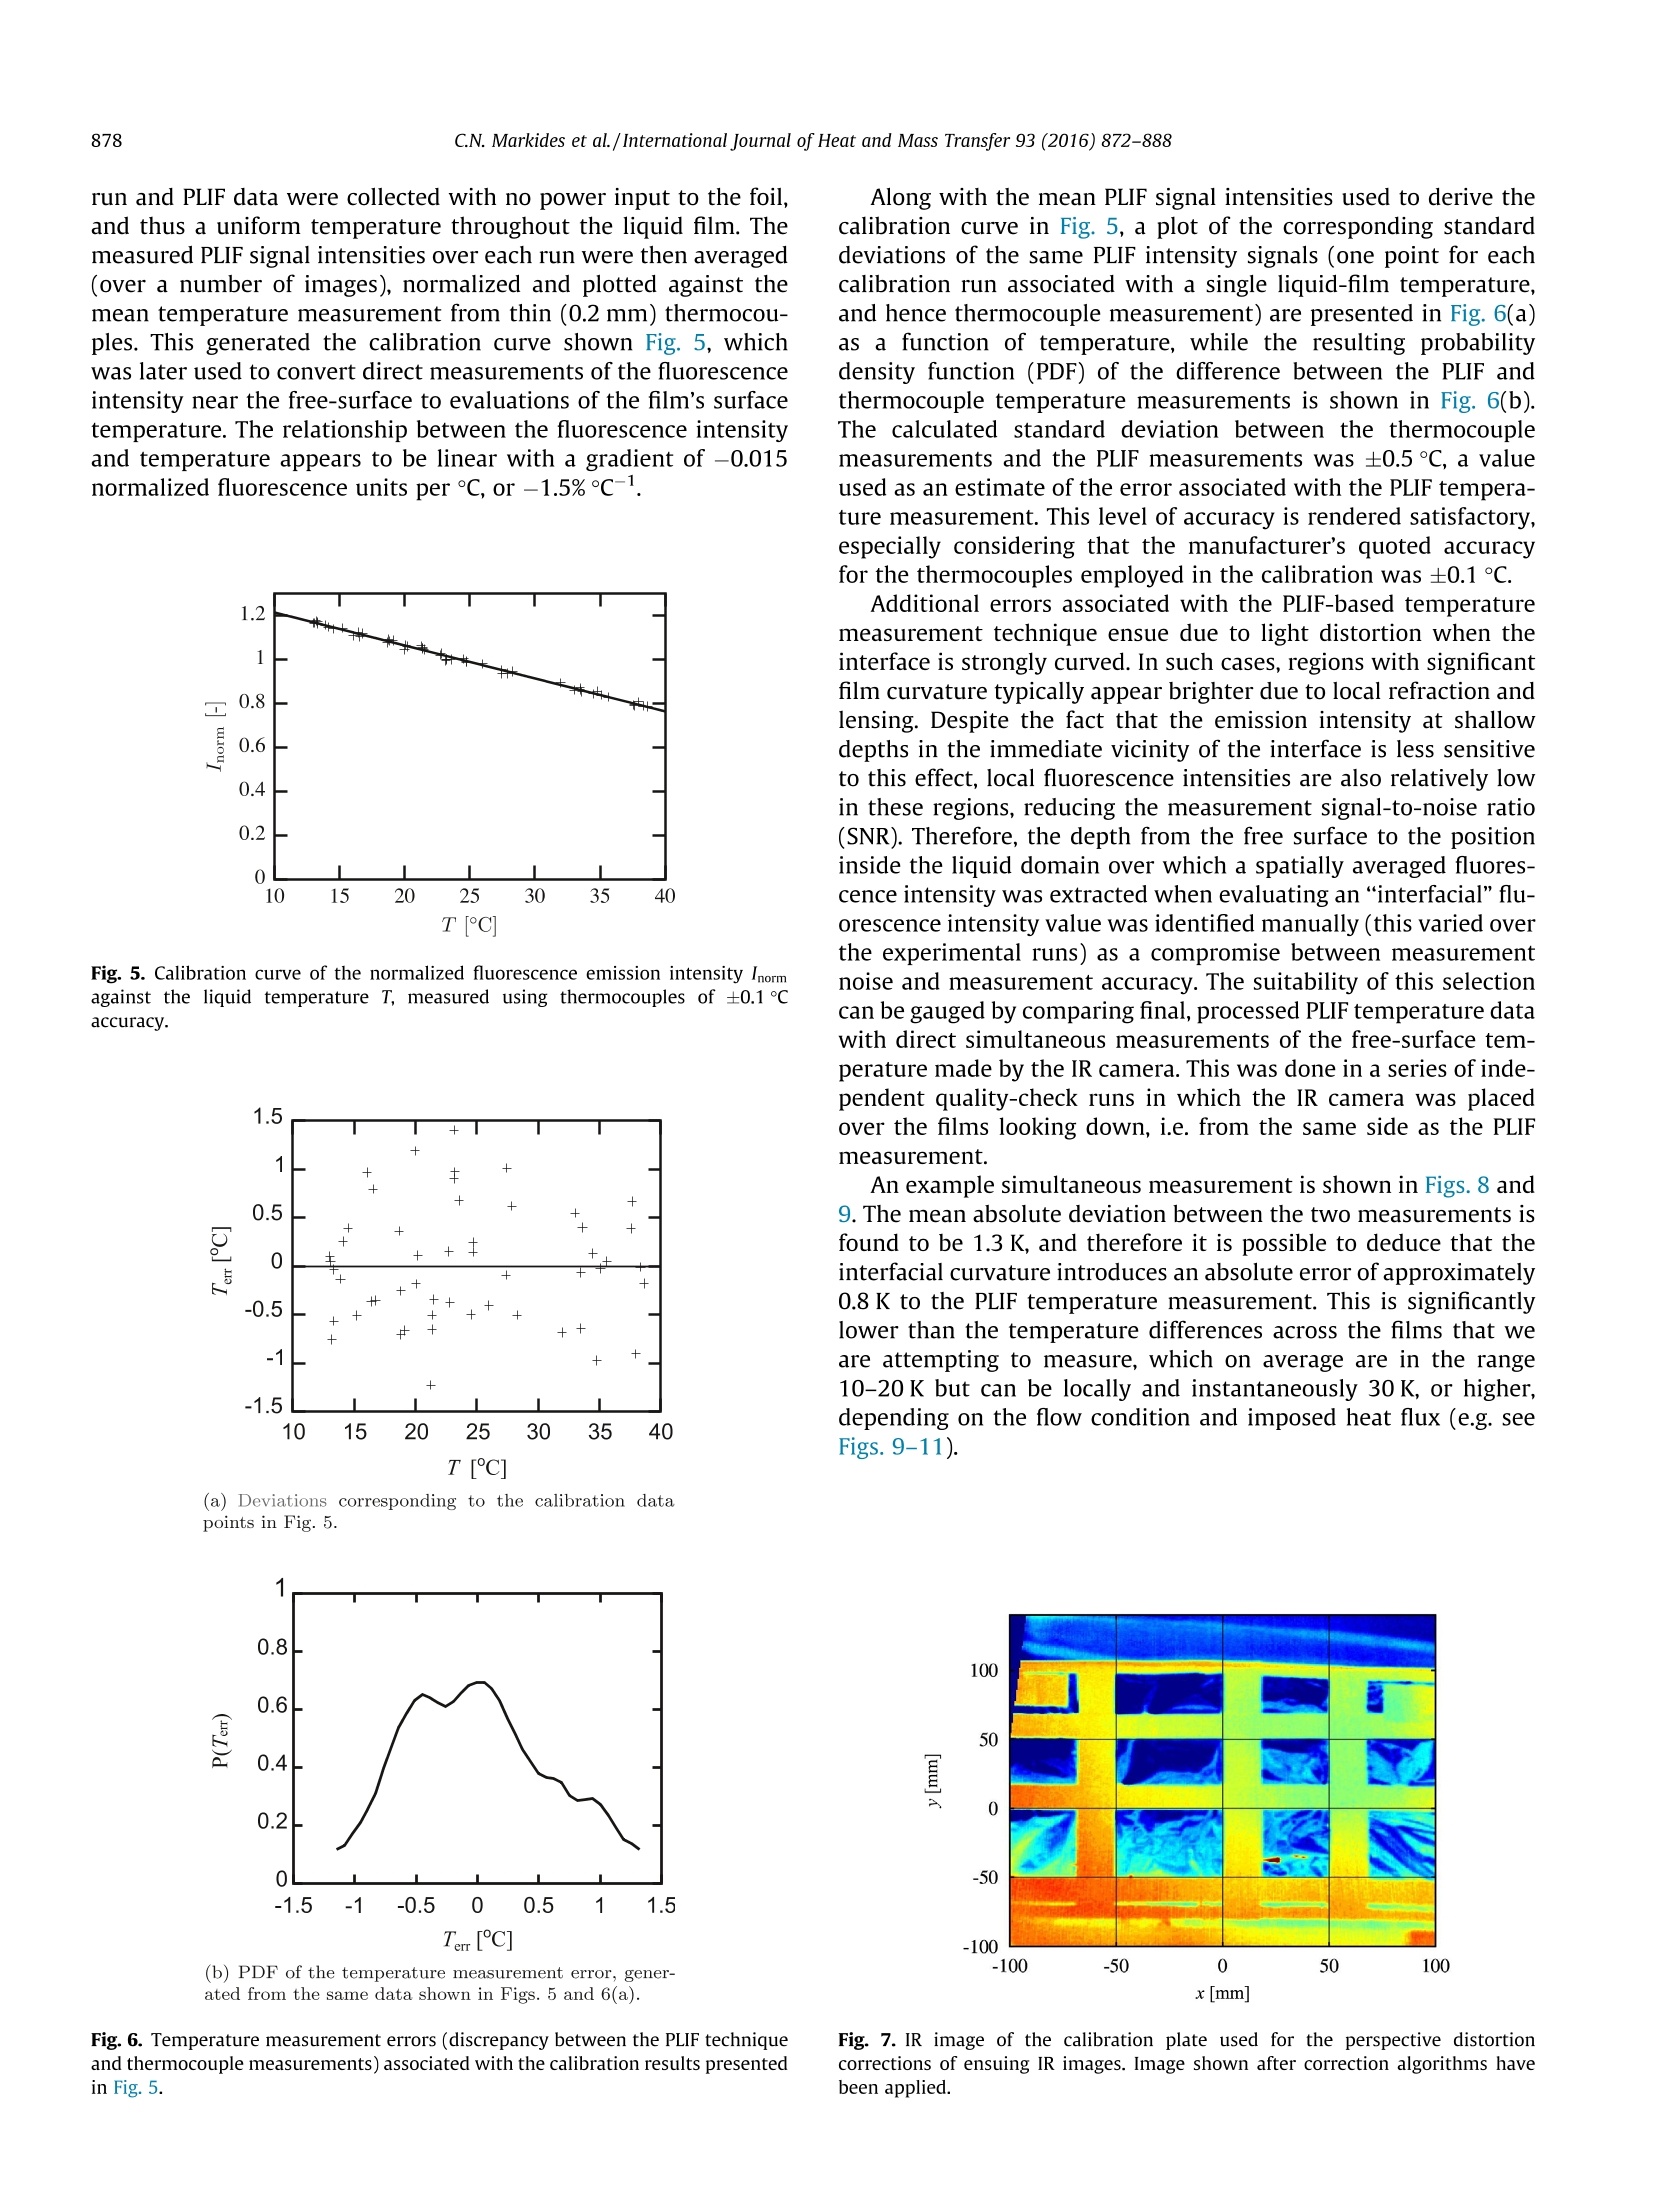
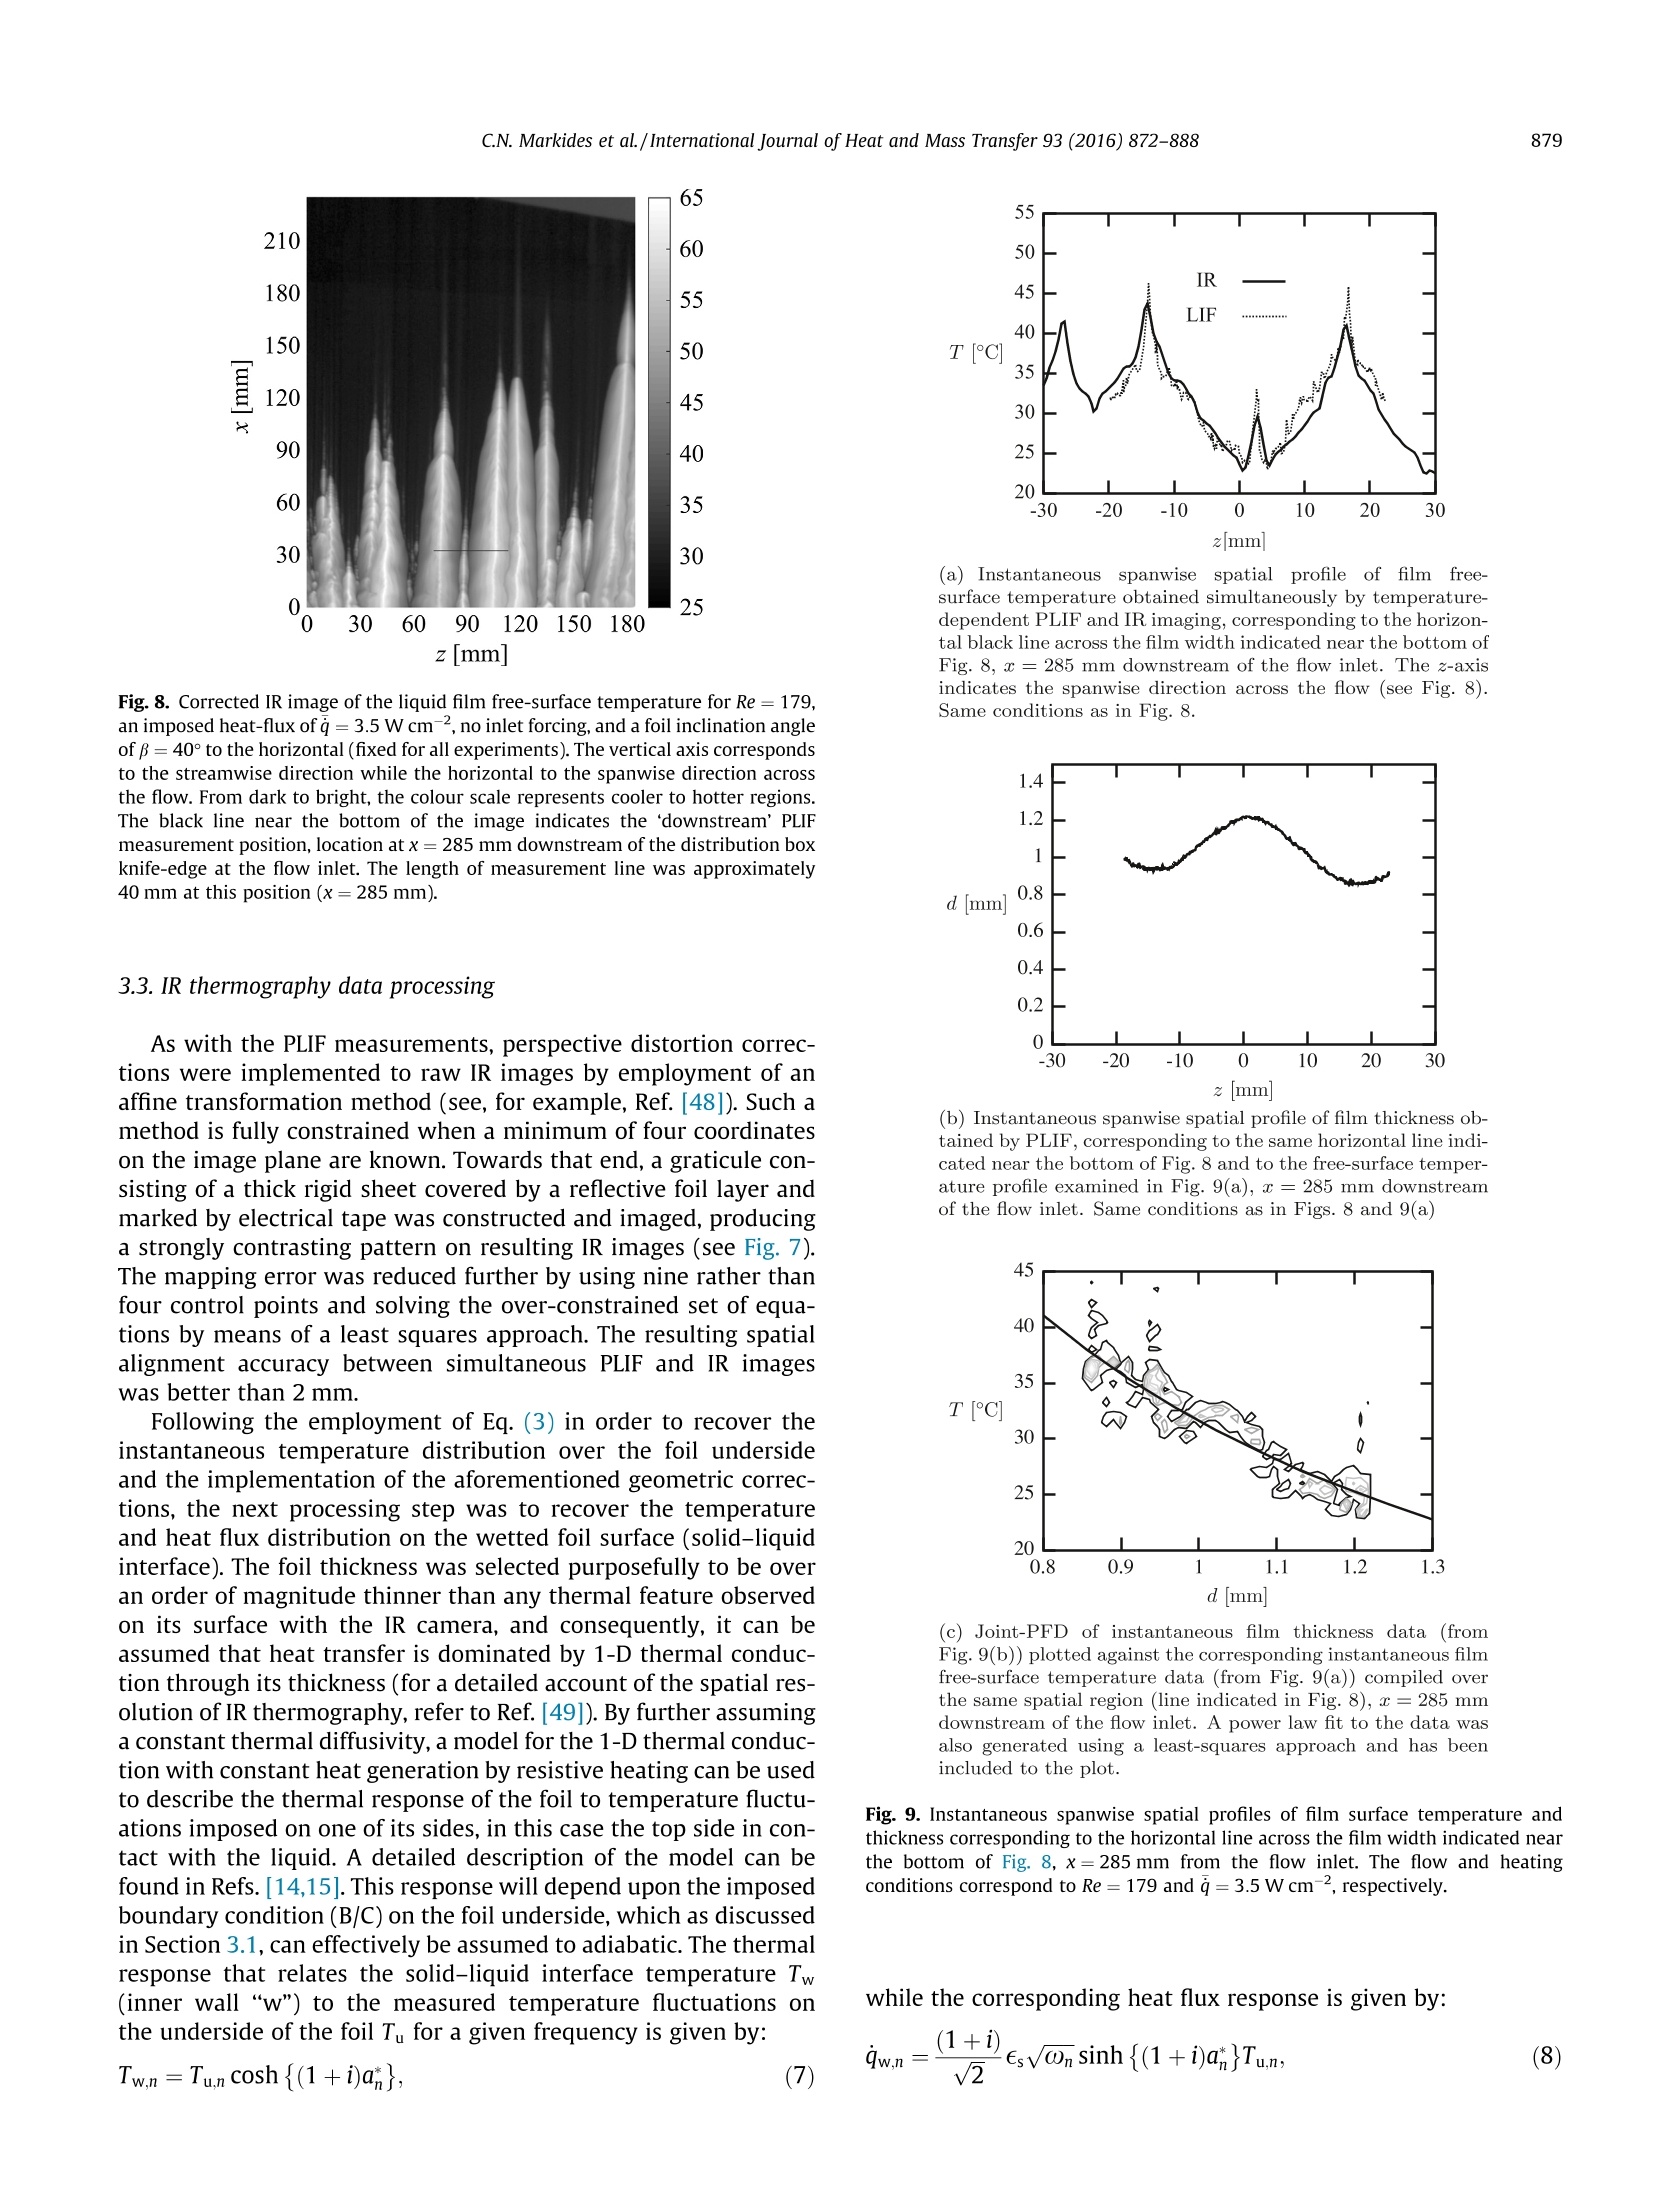
方案详情

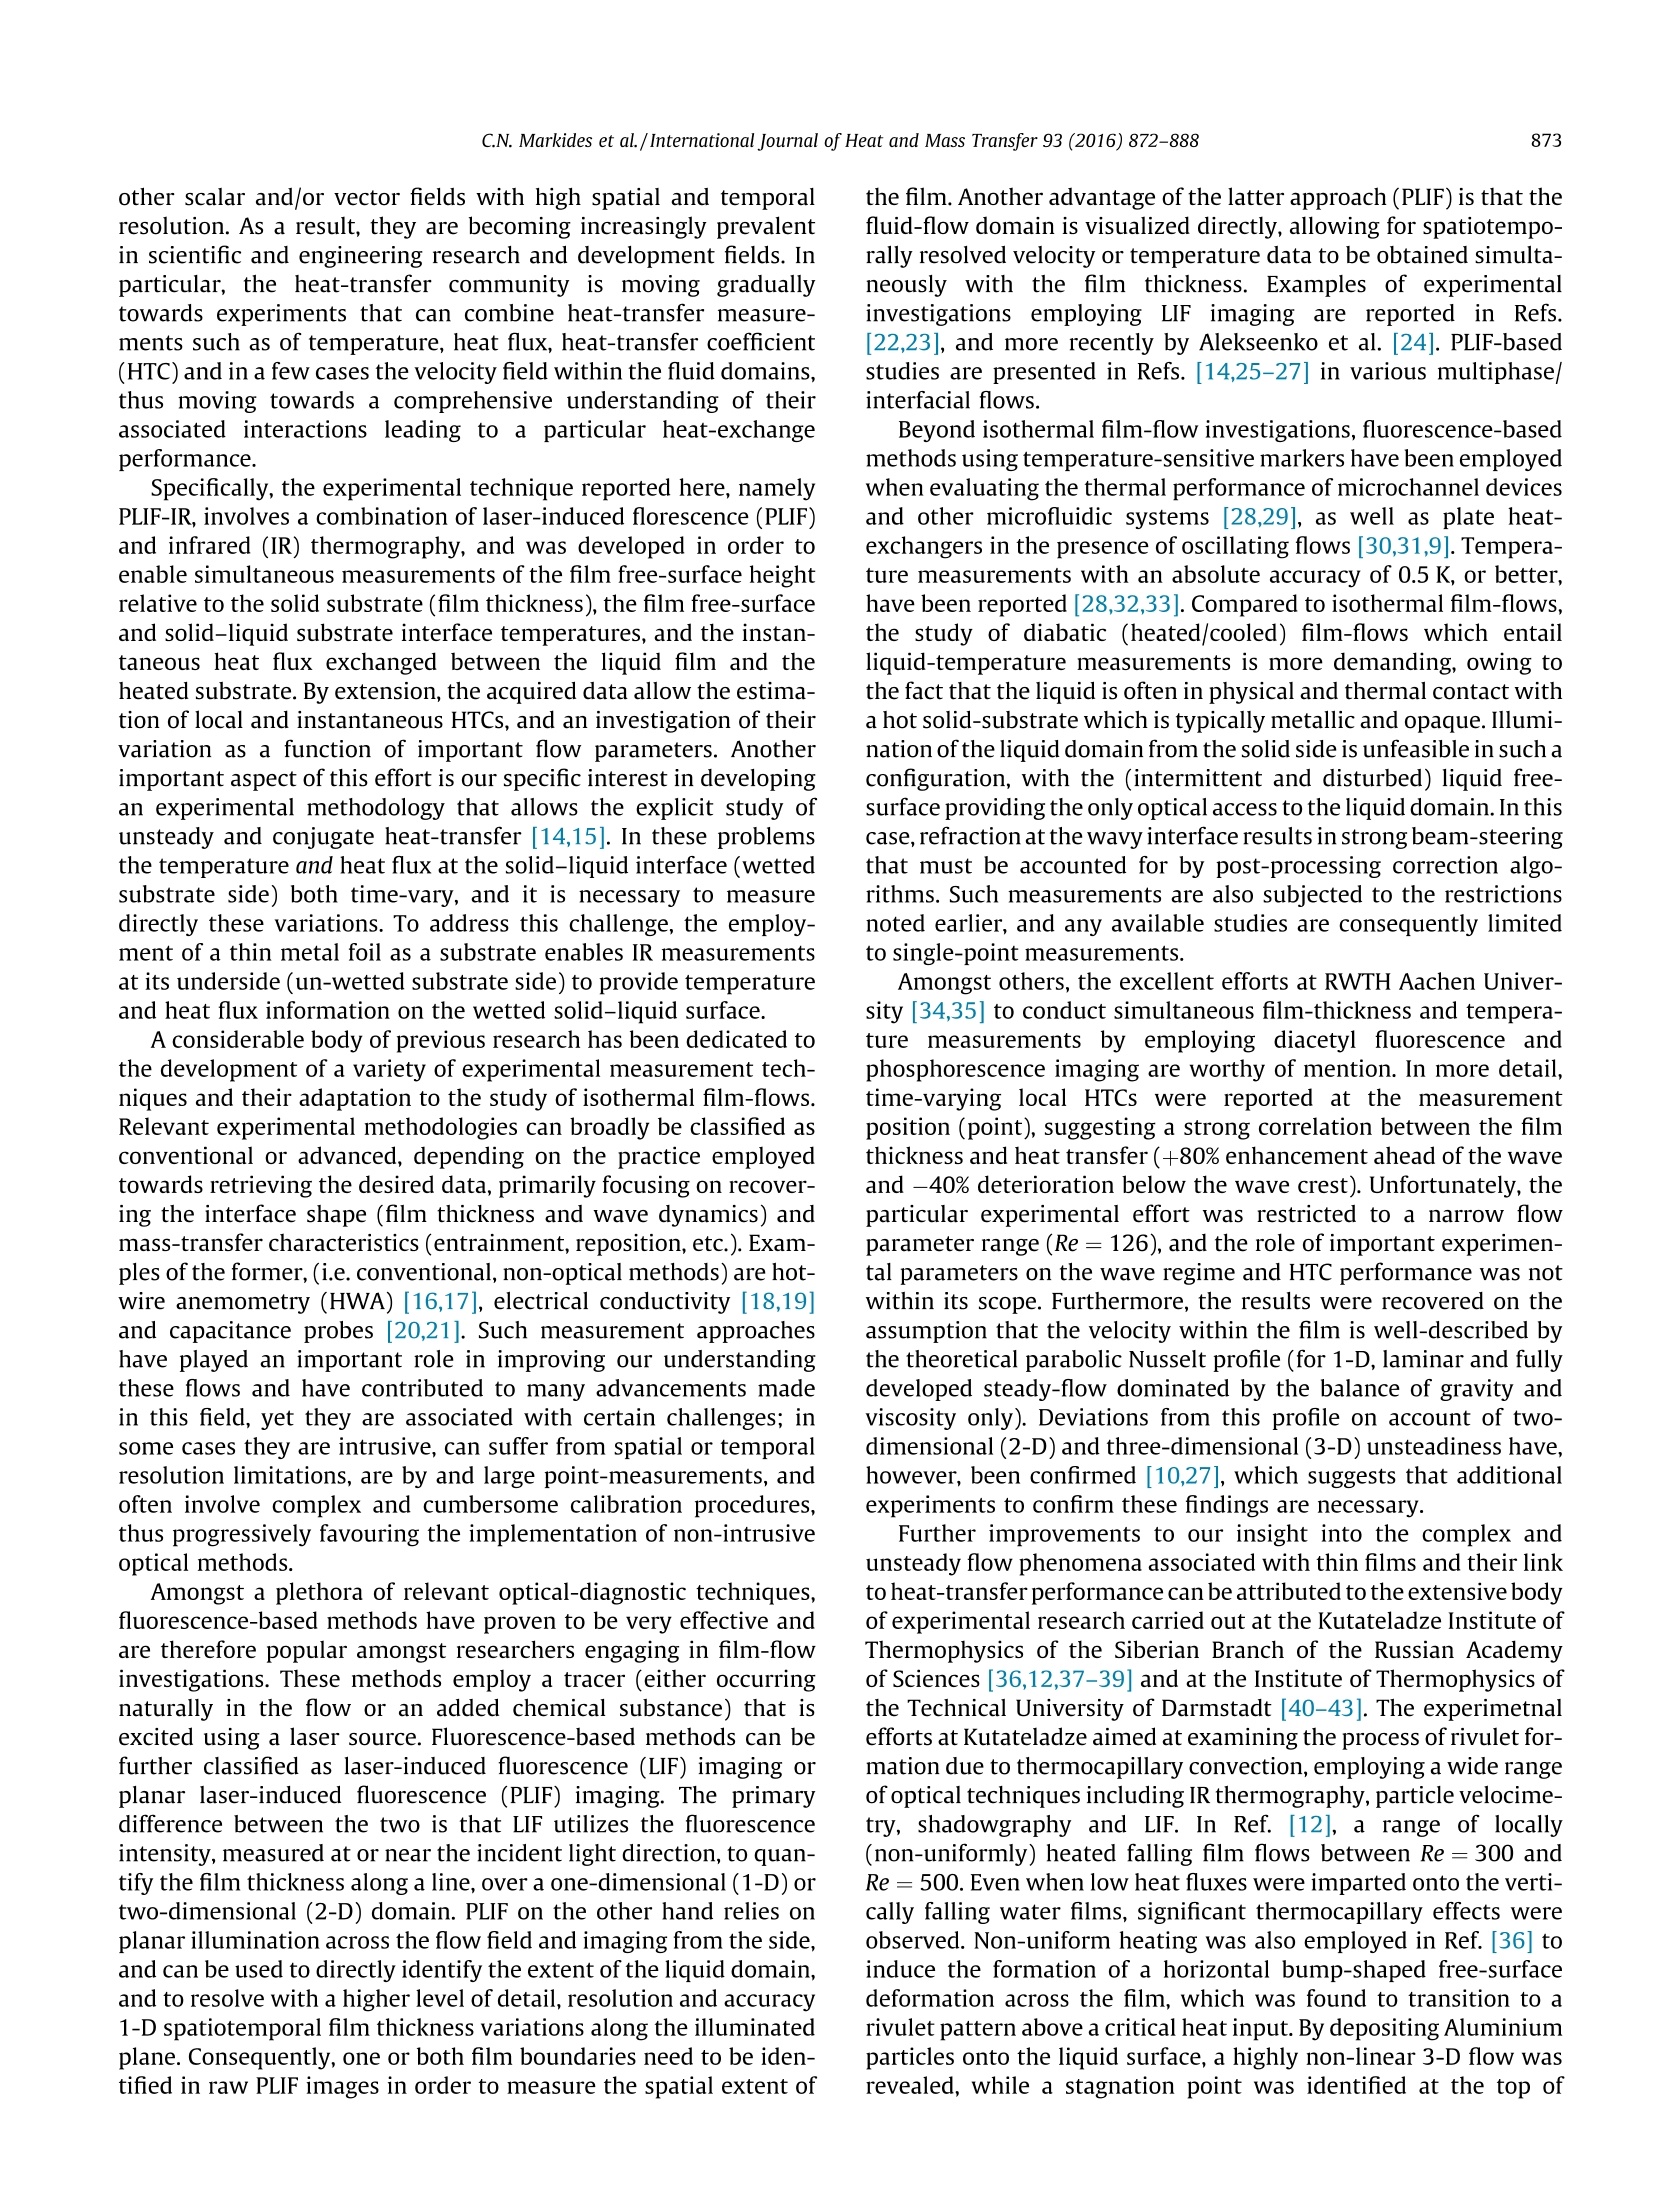
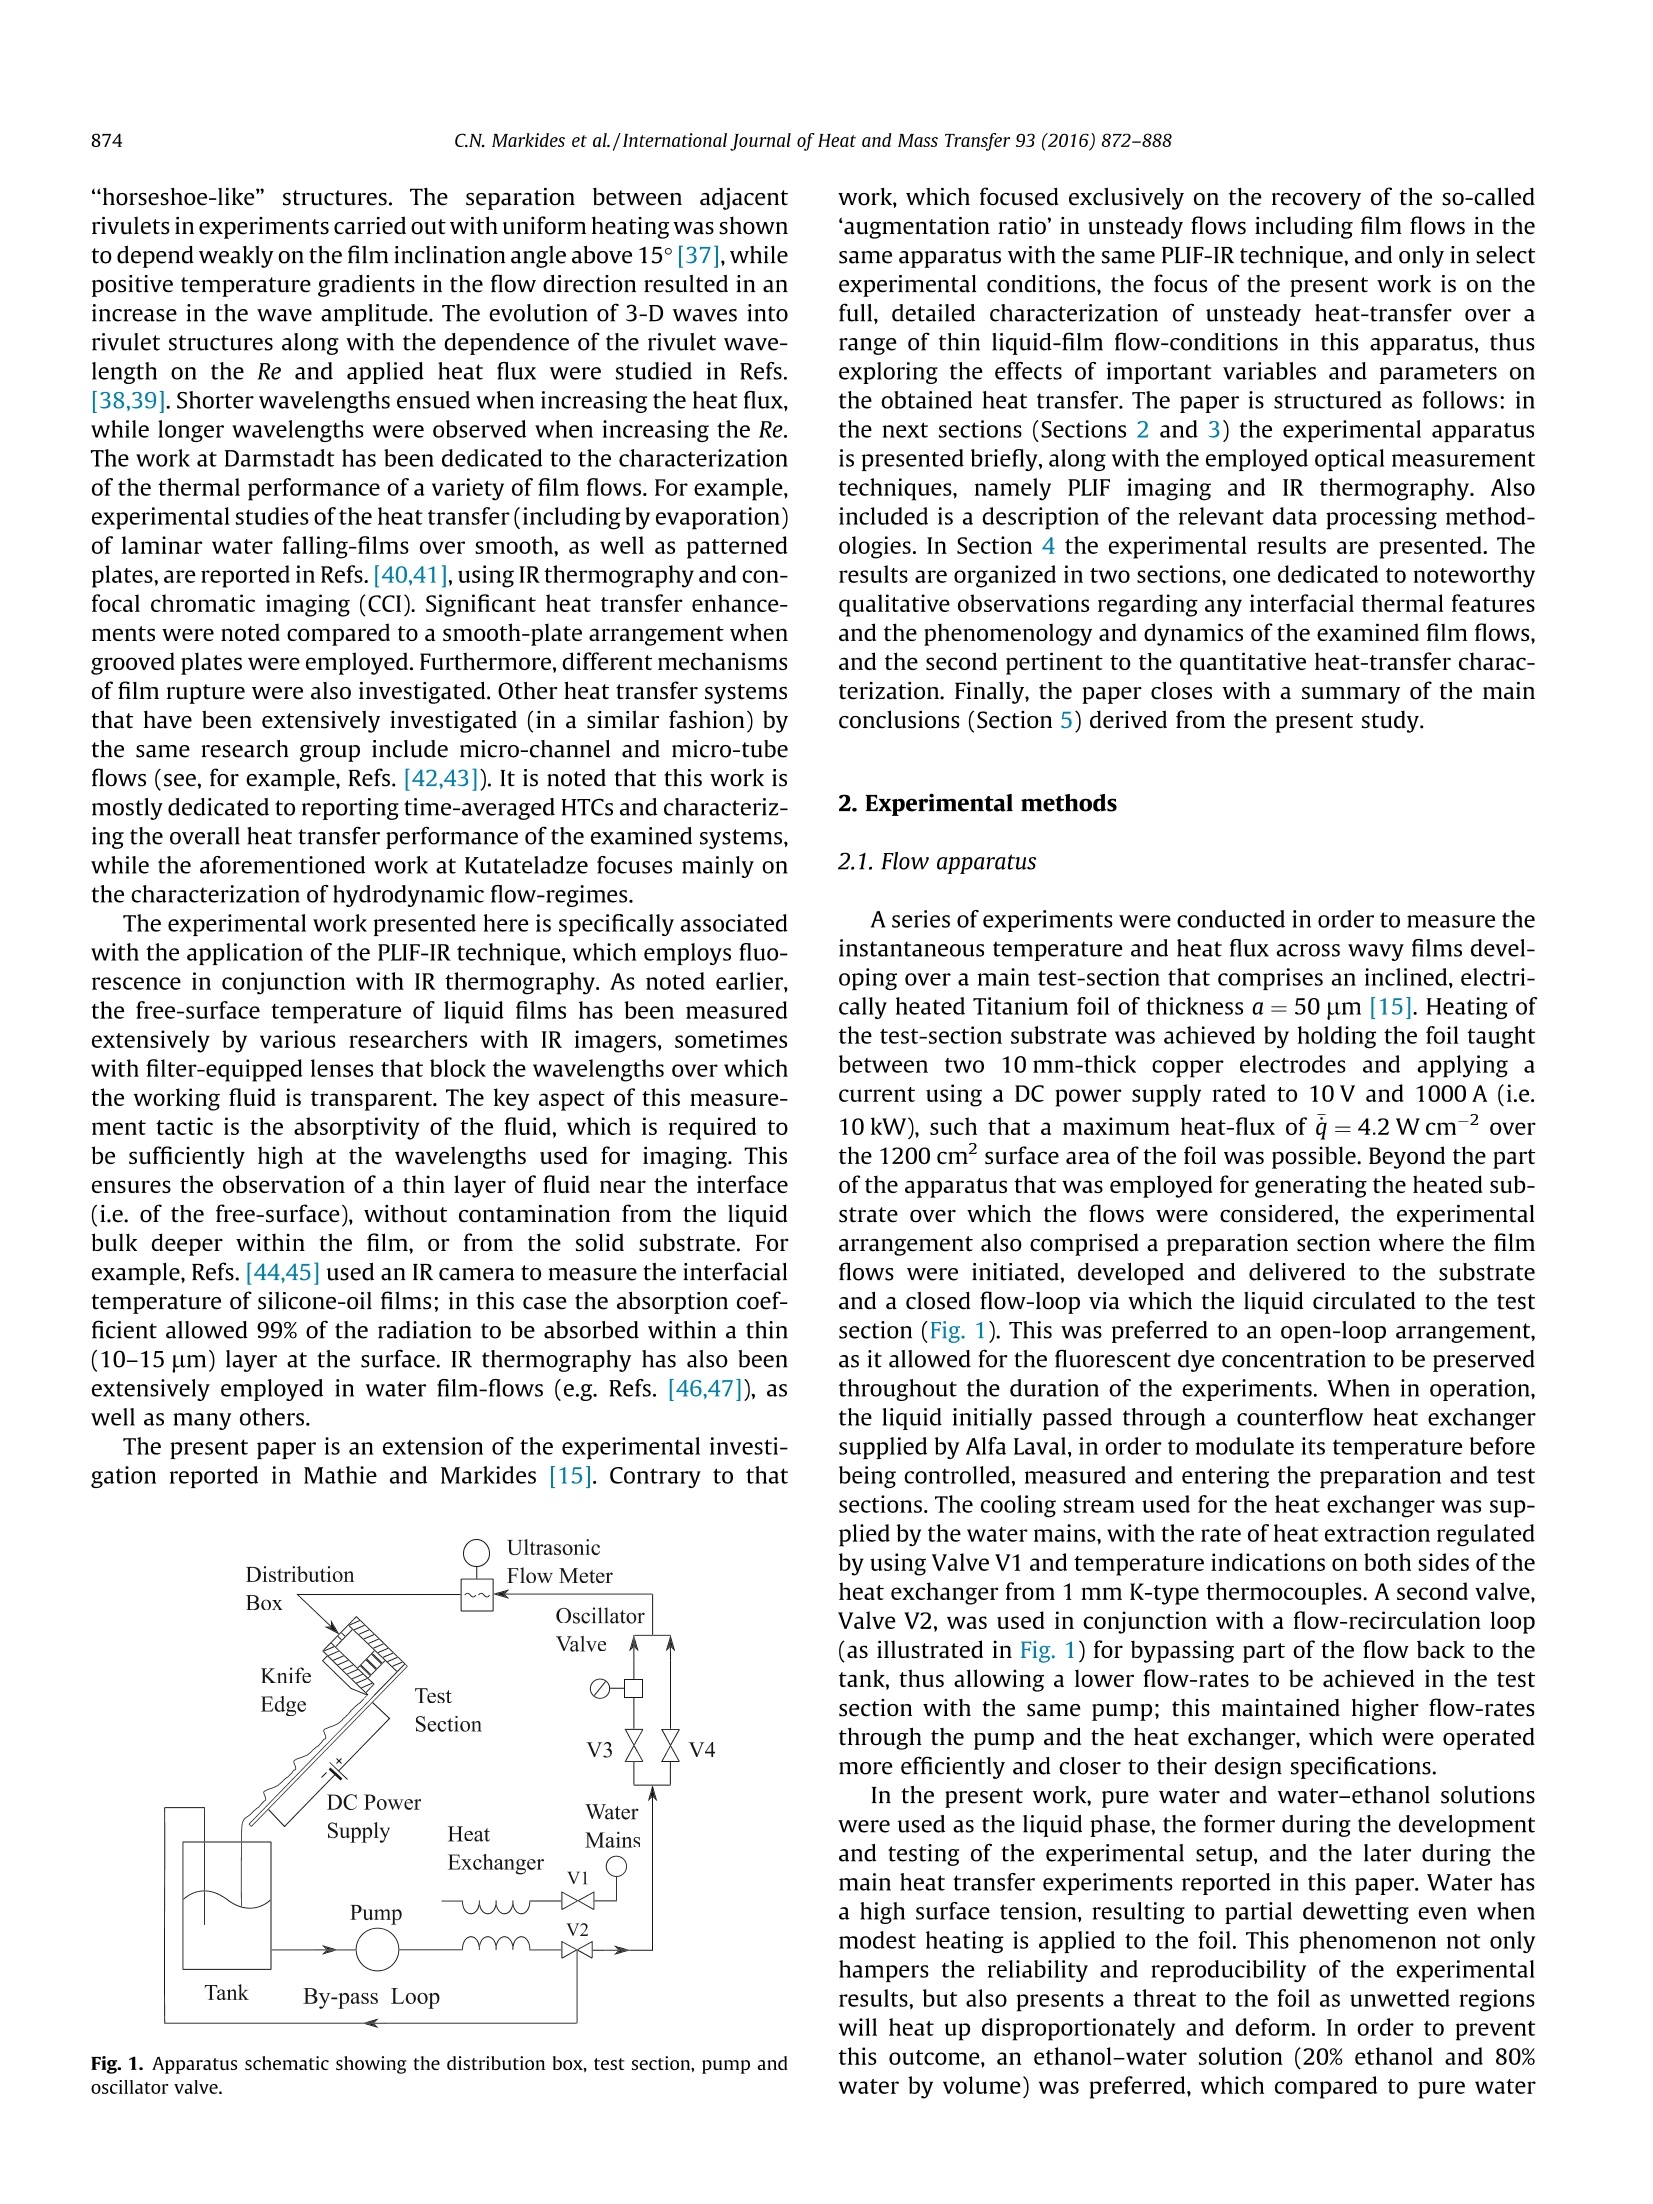
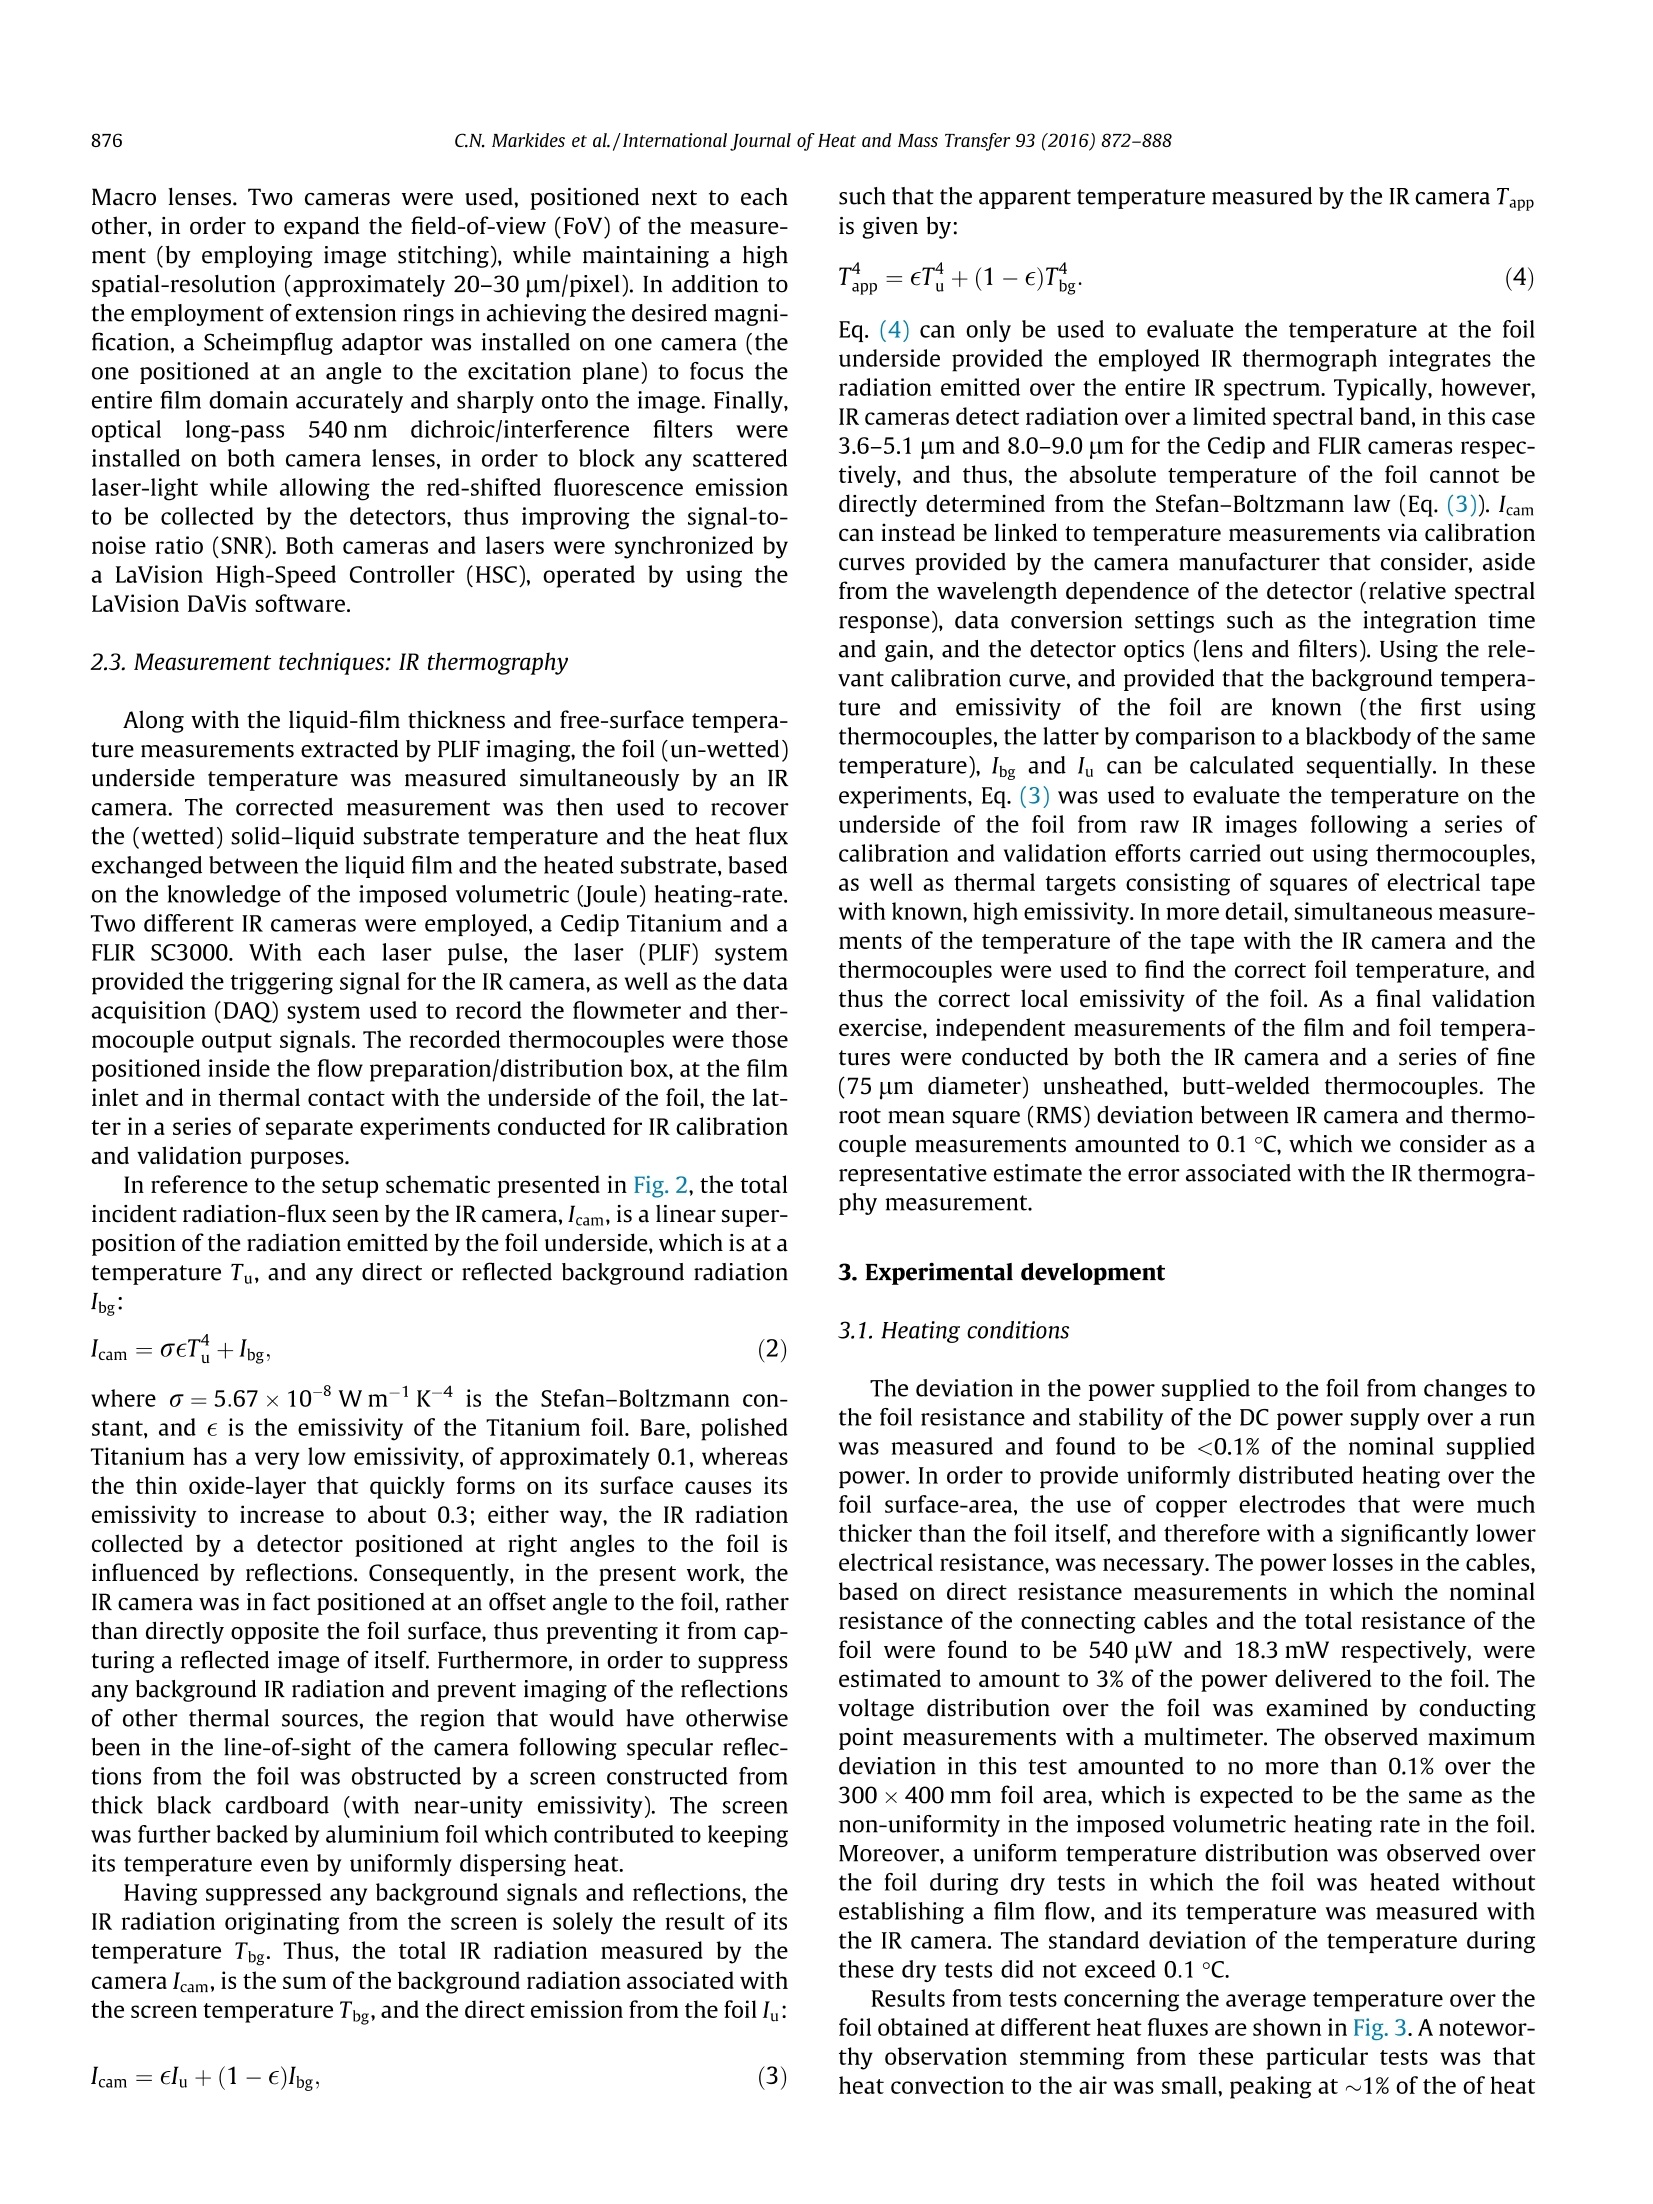
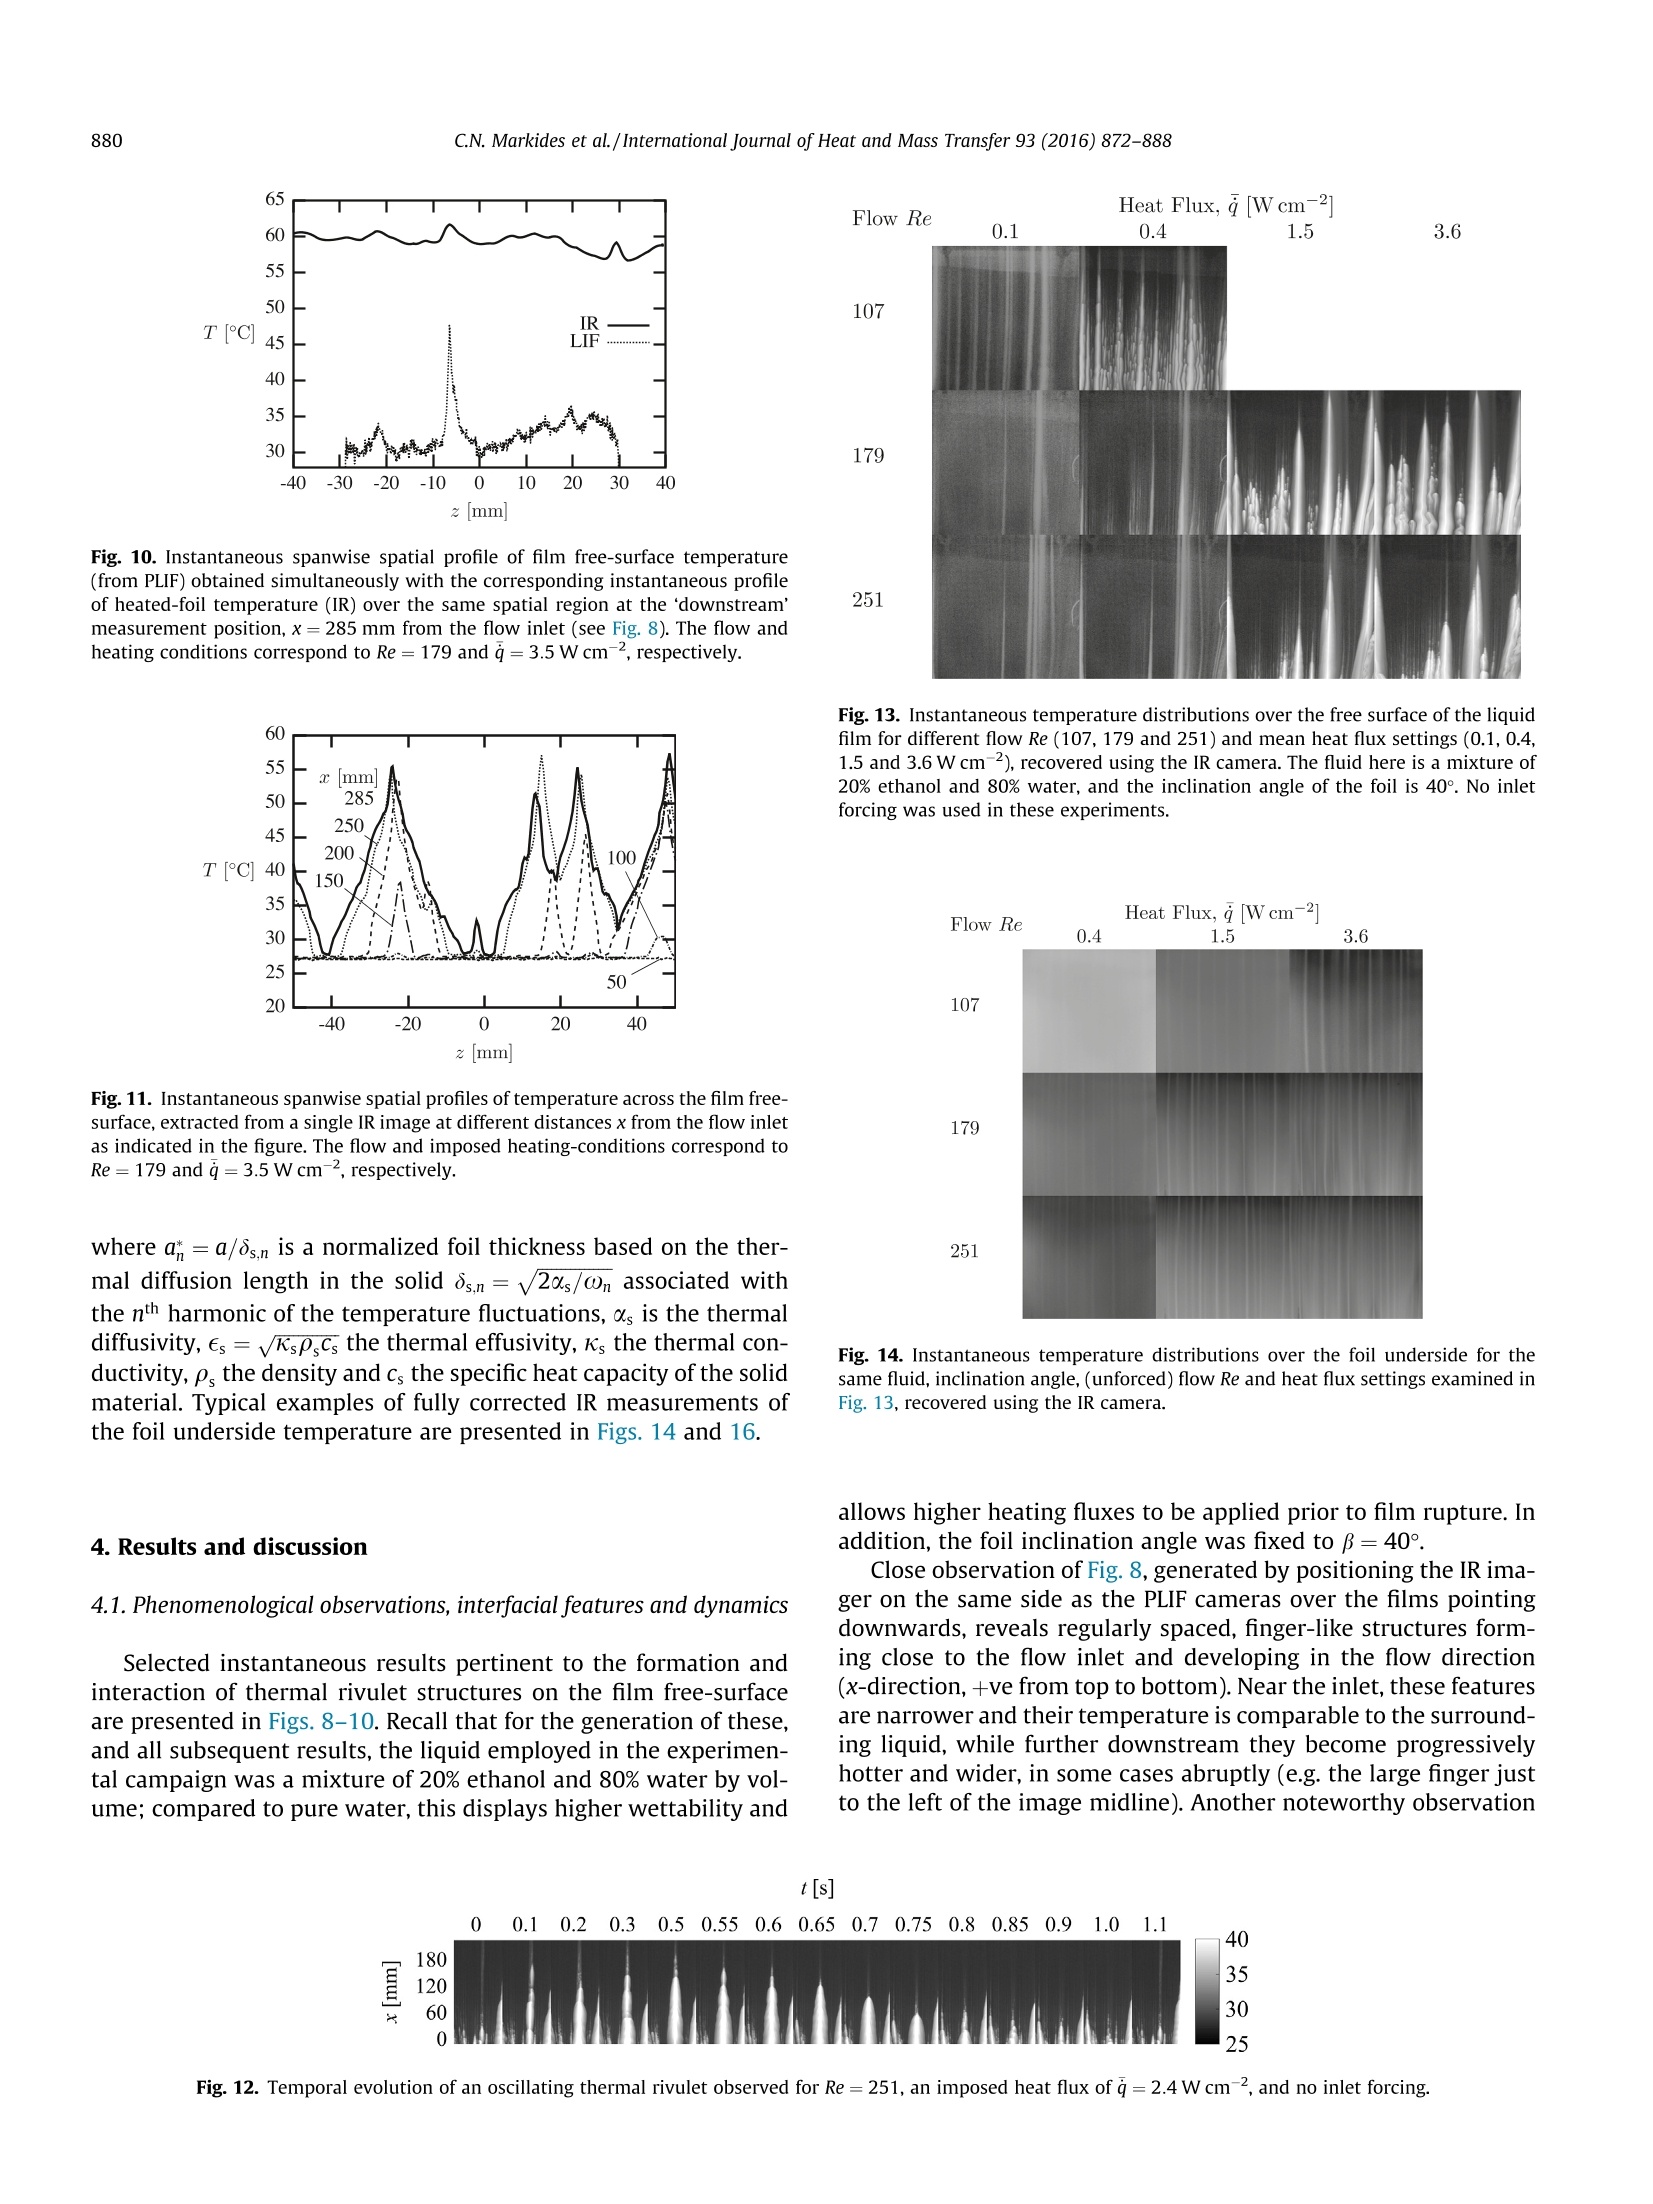
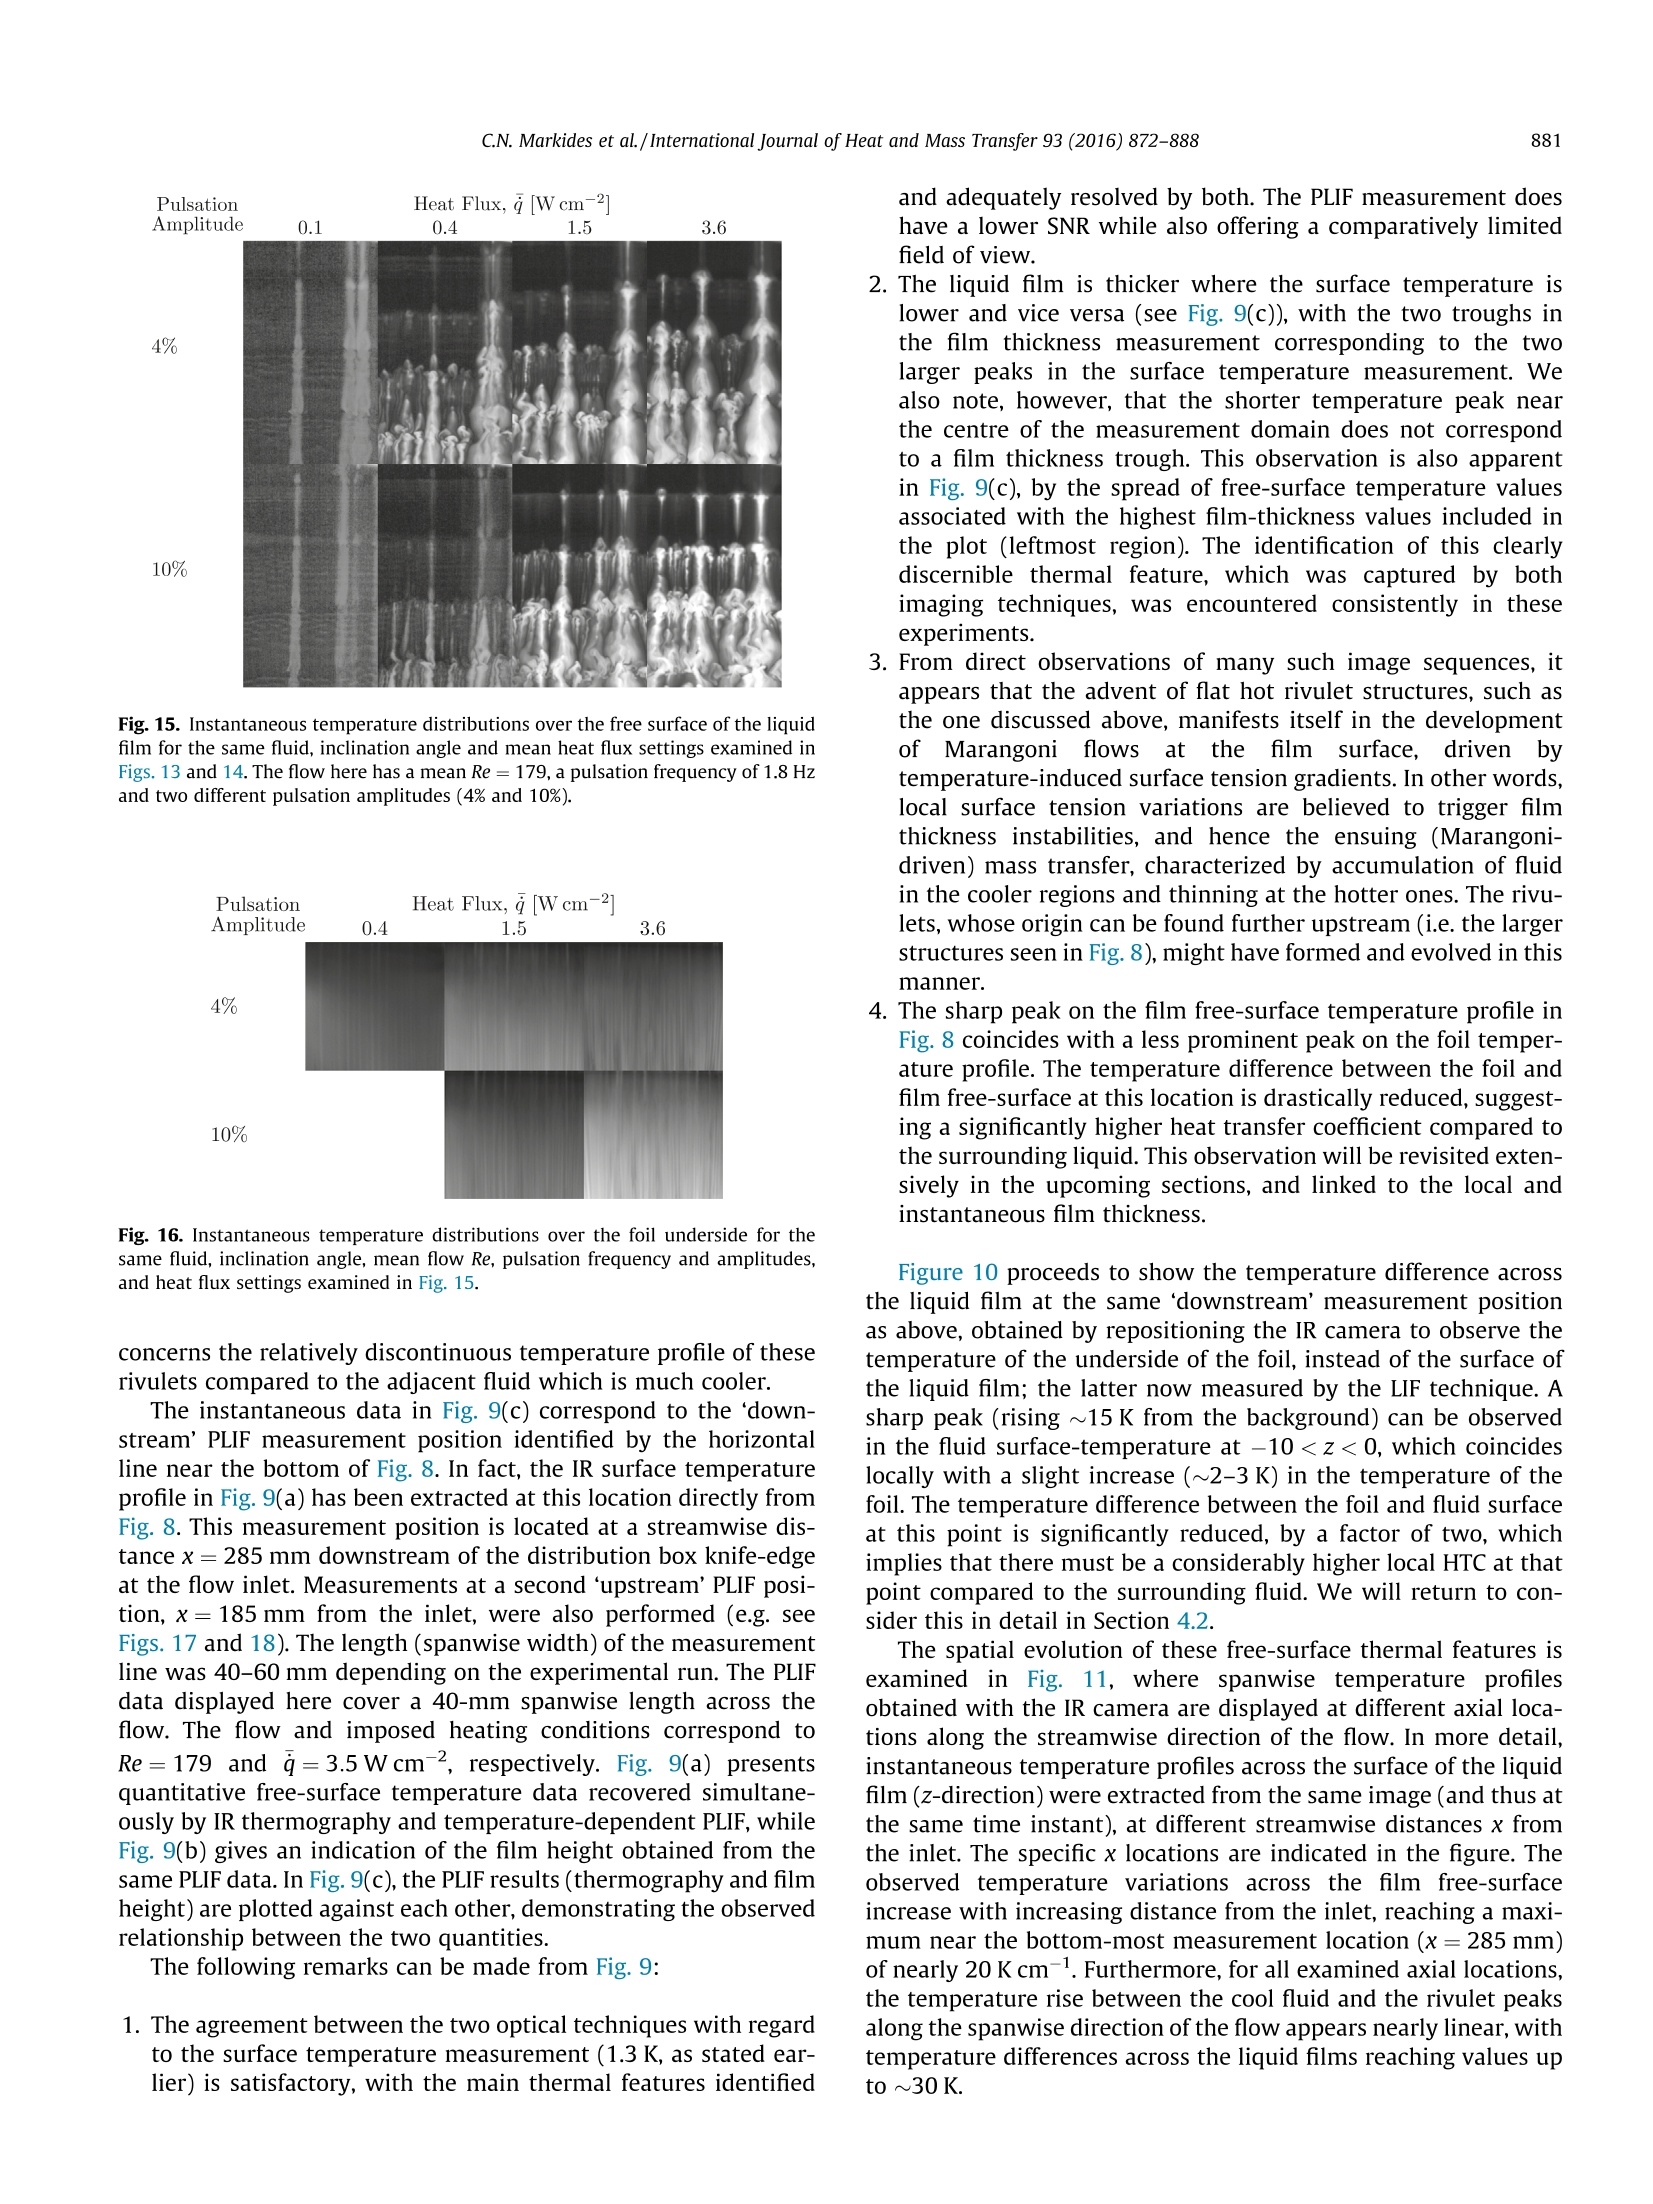
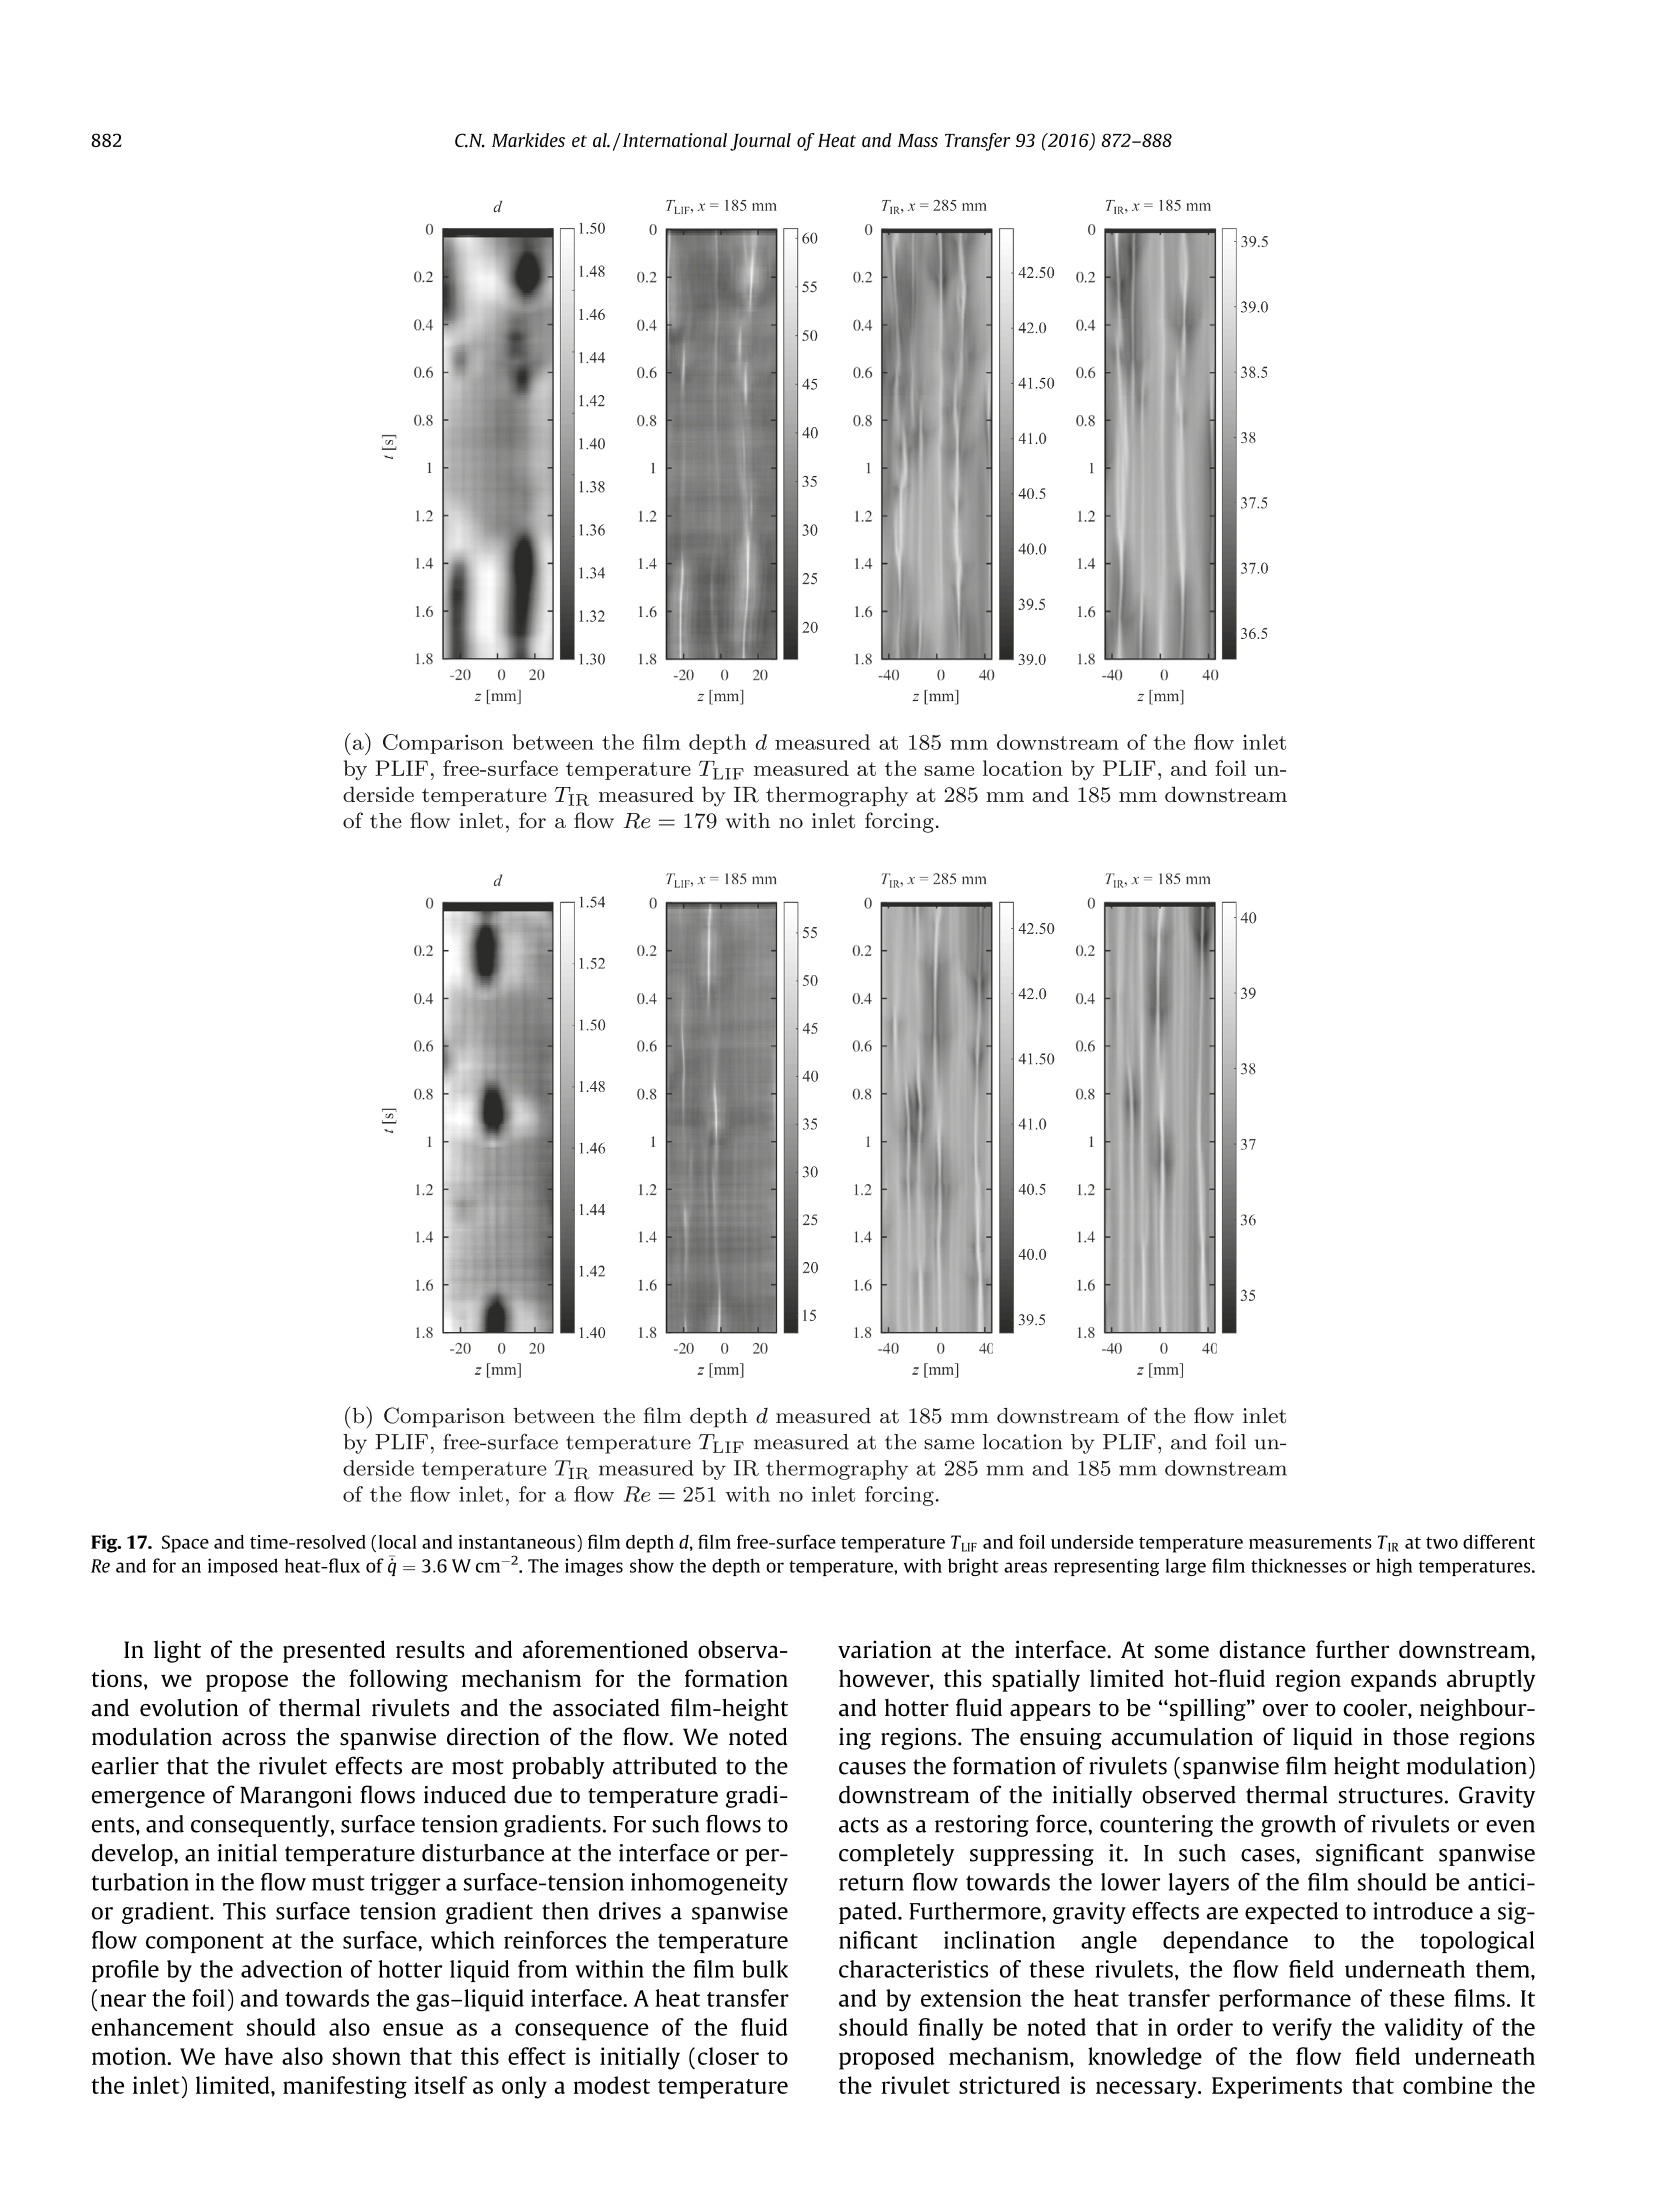
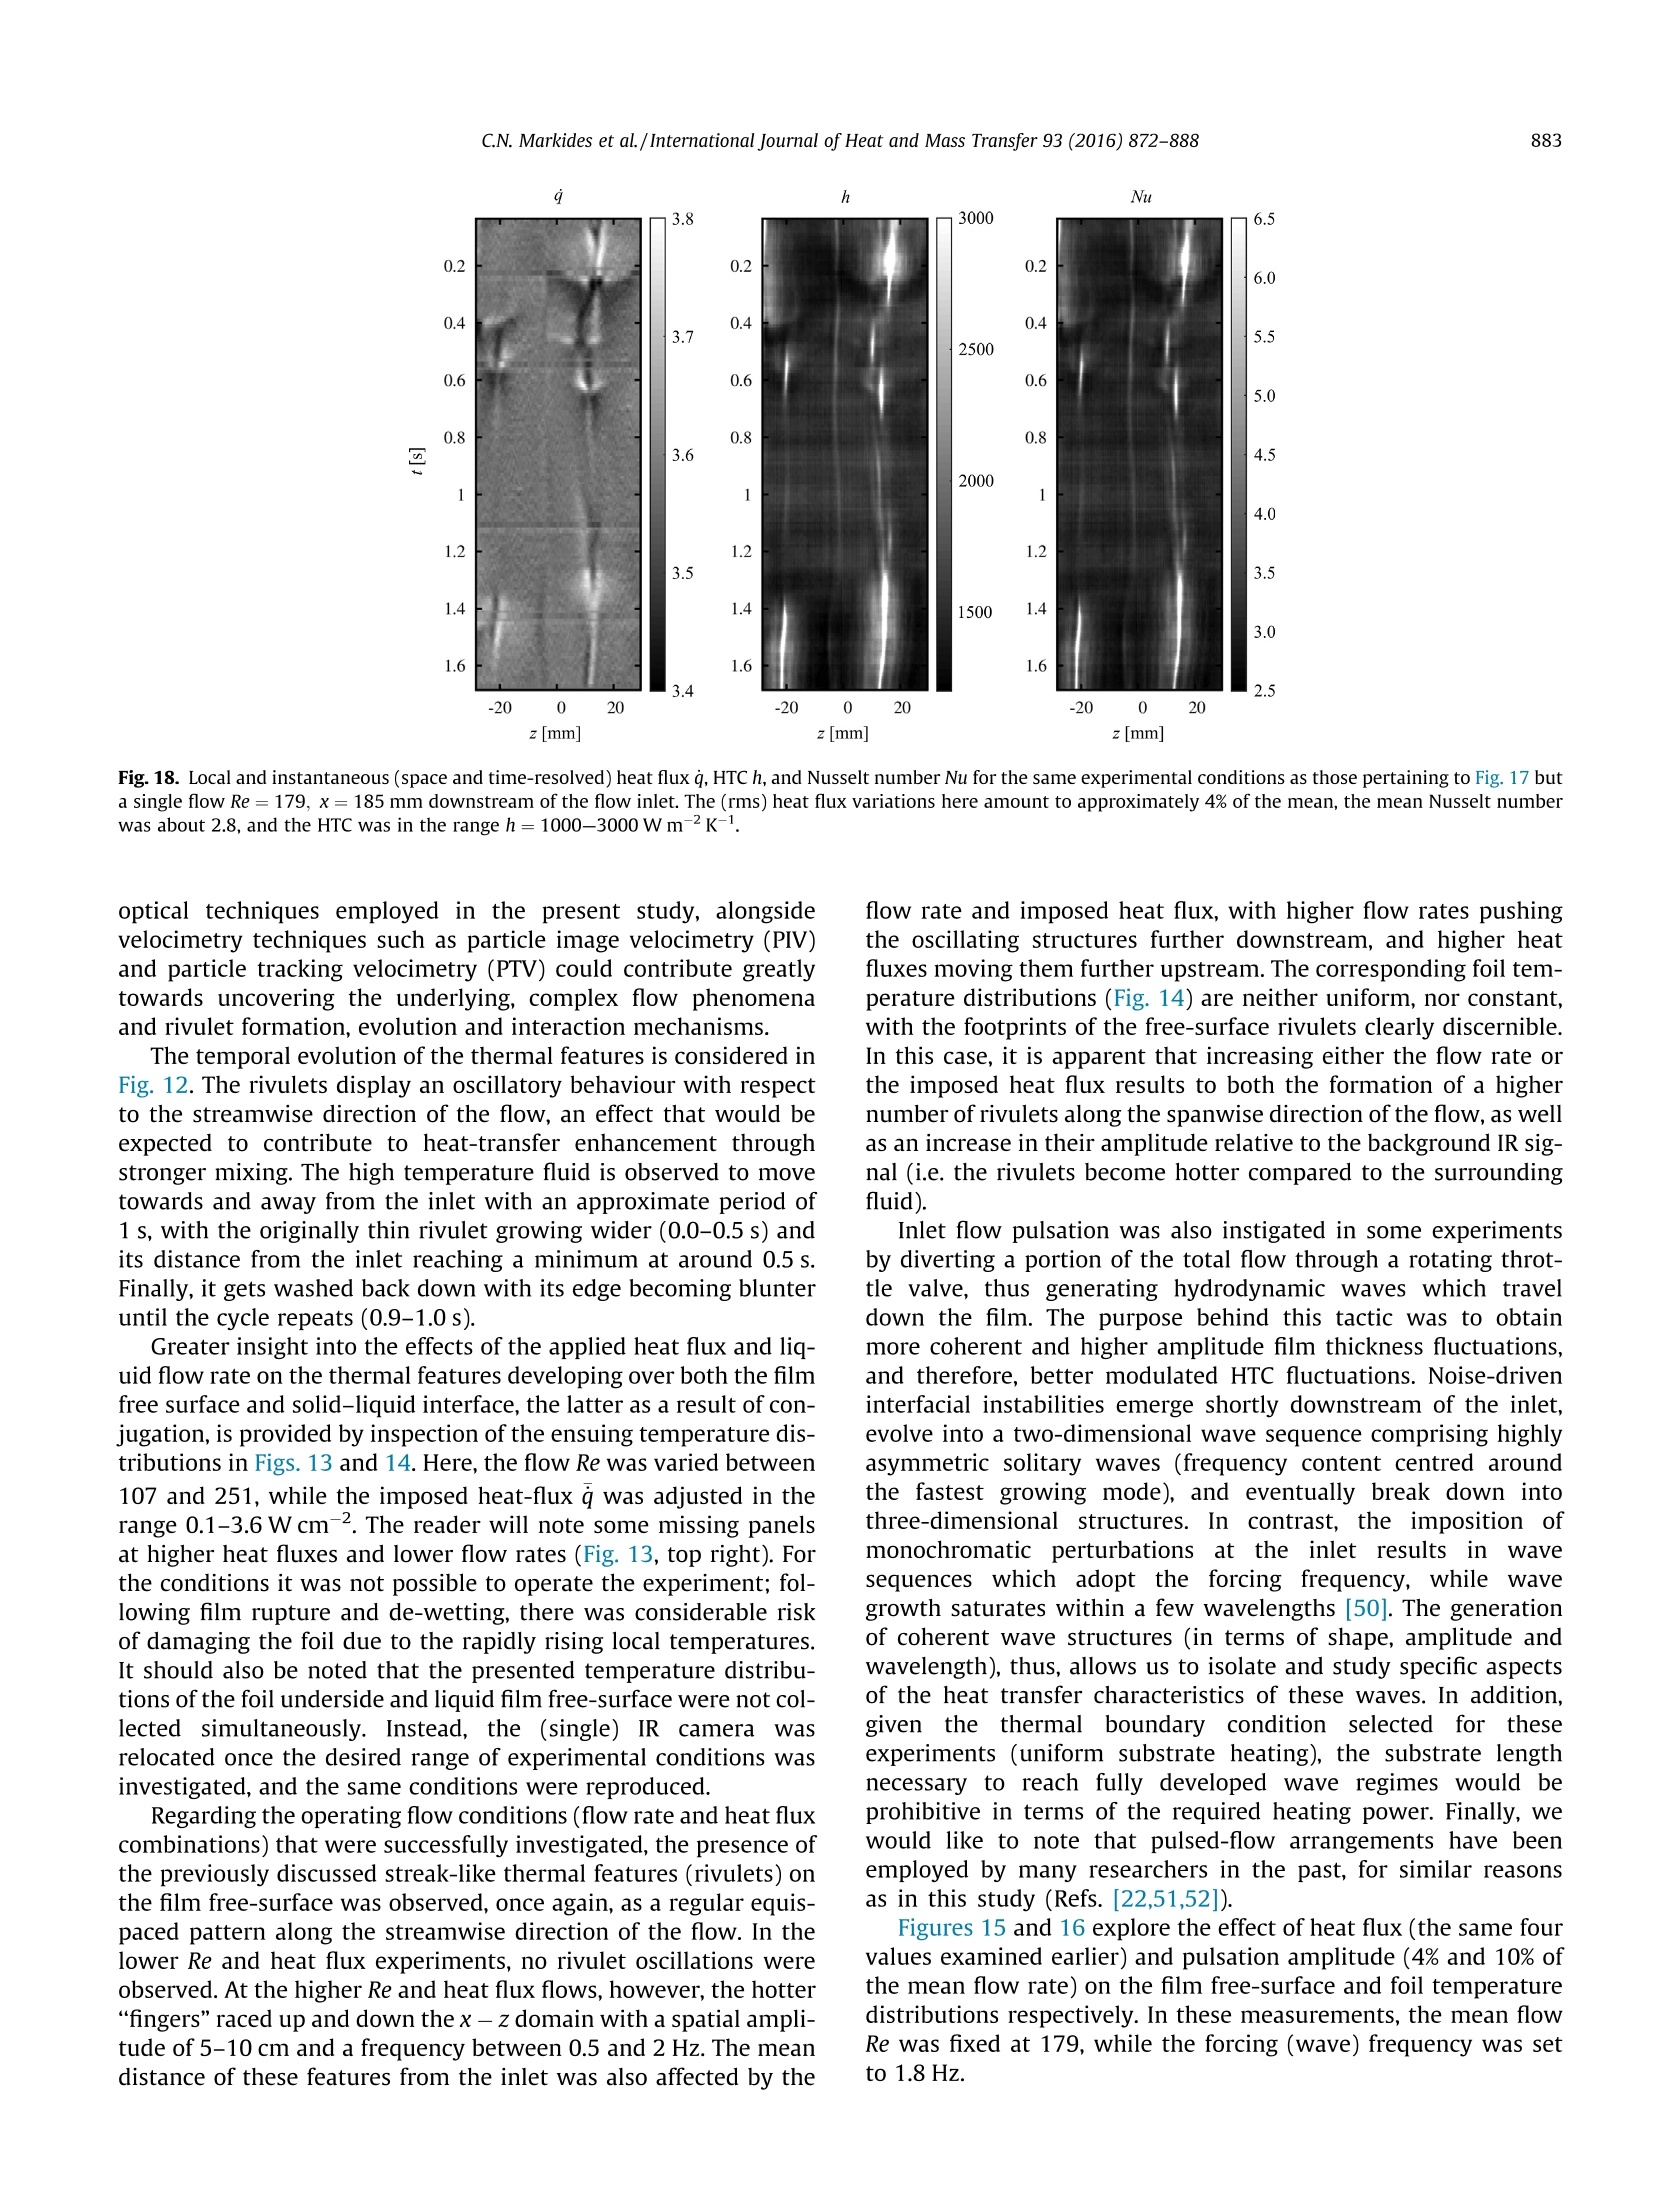
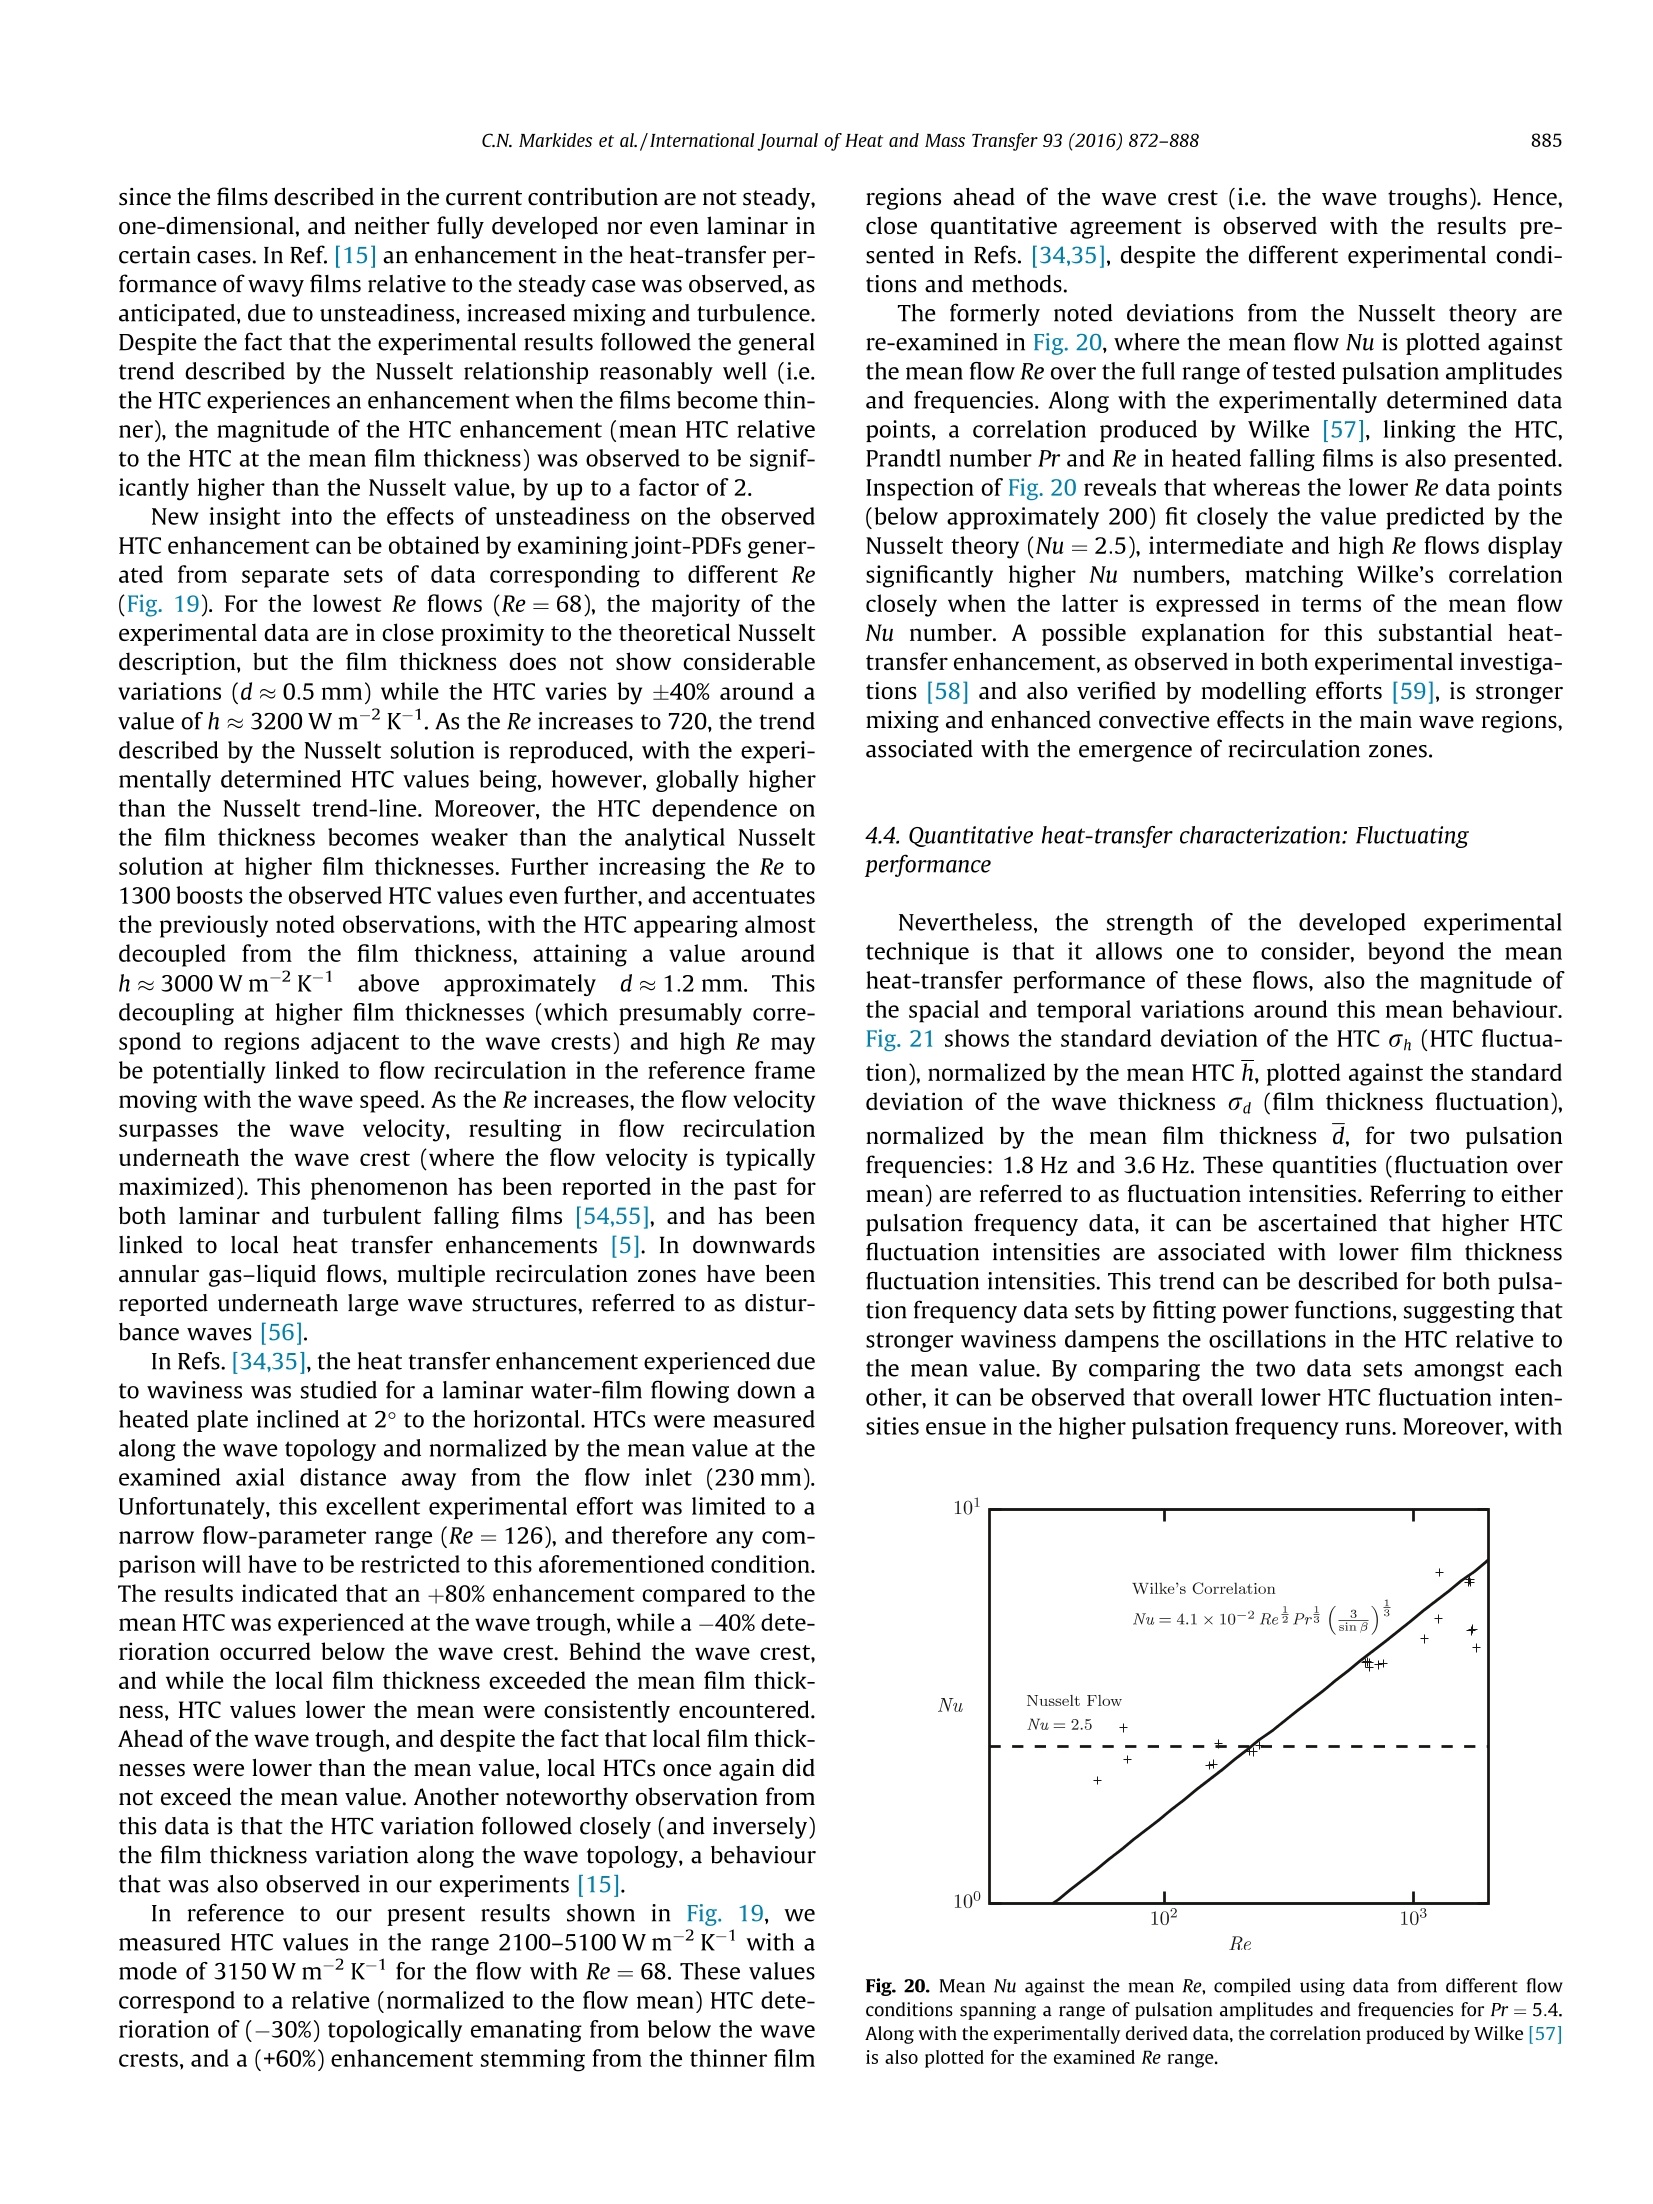
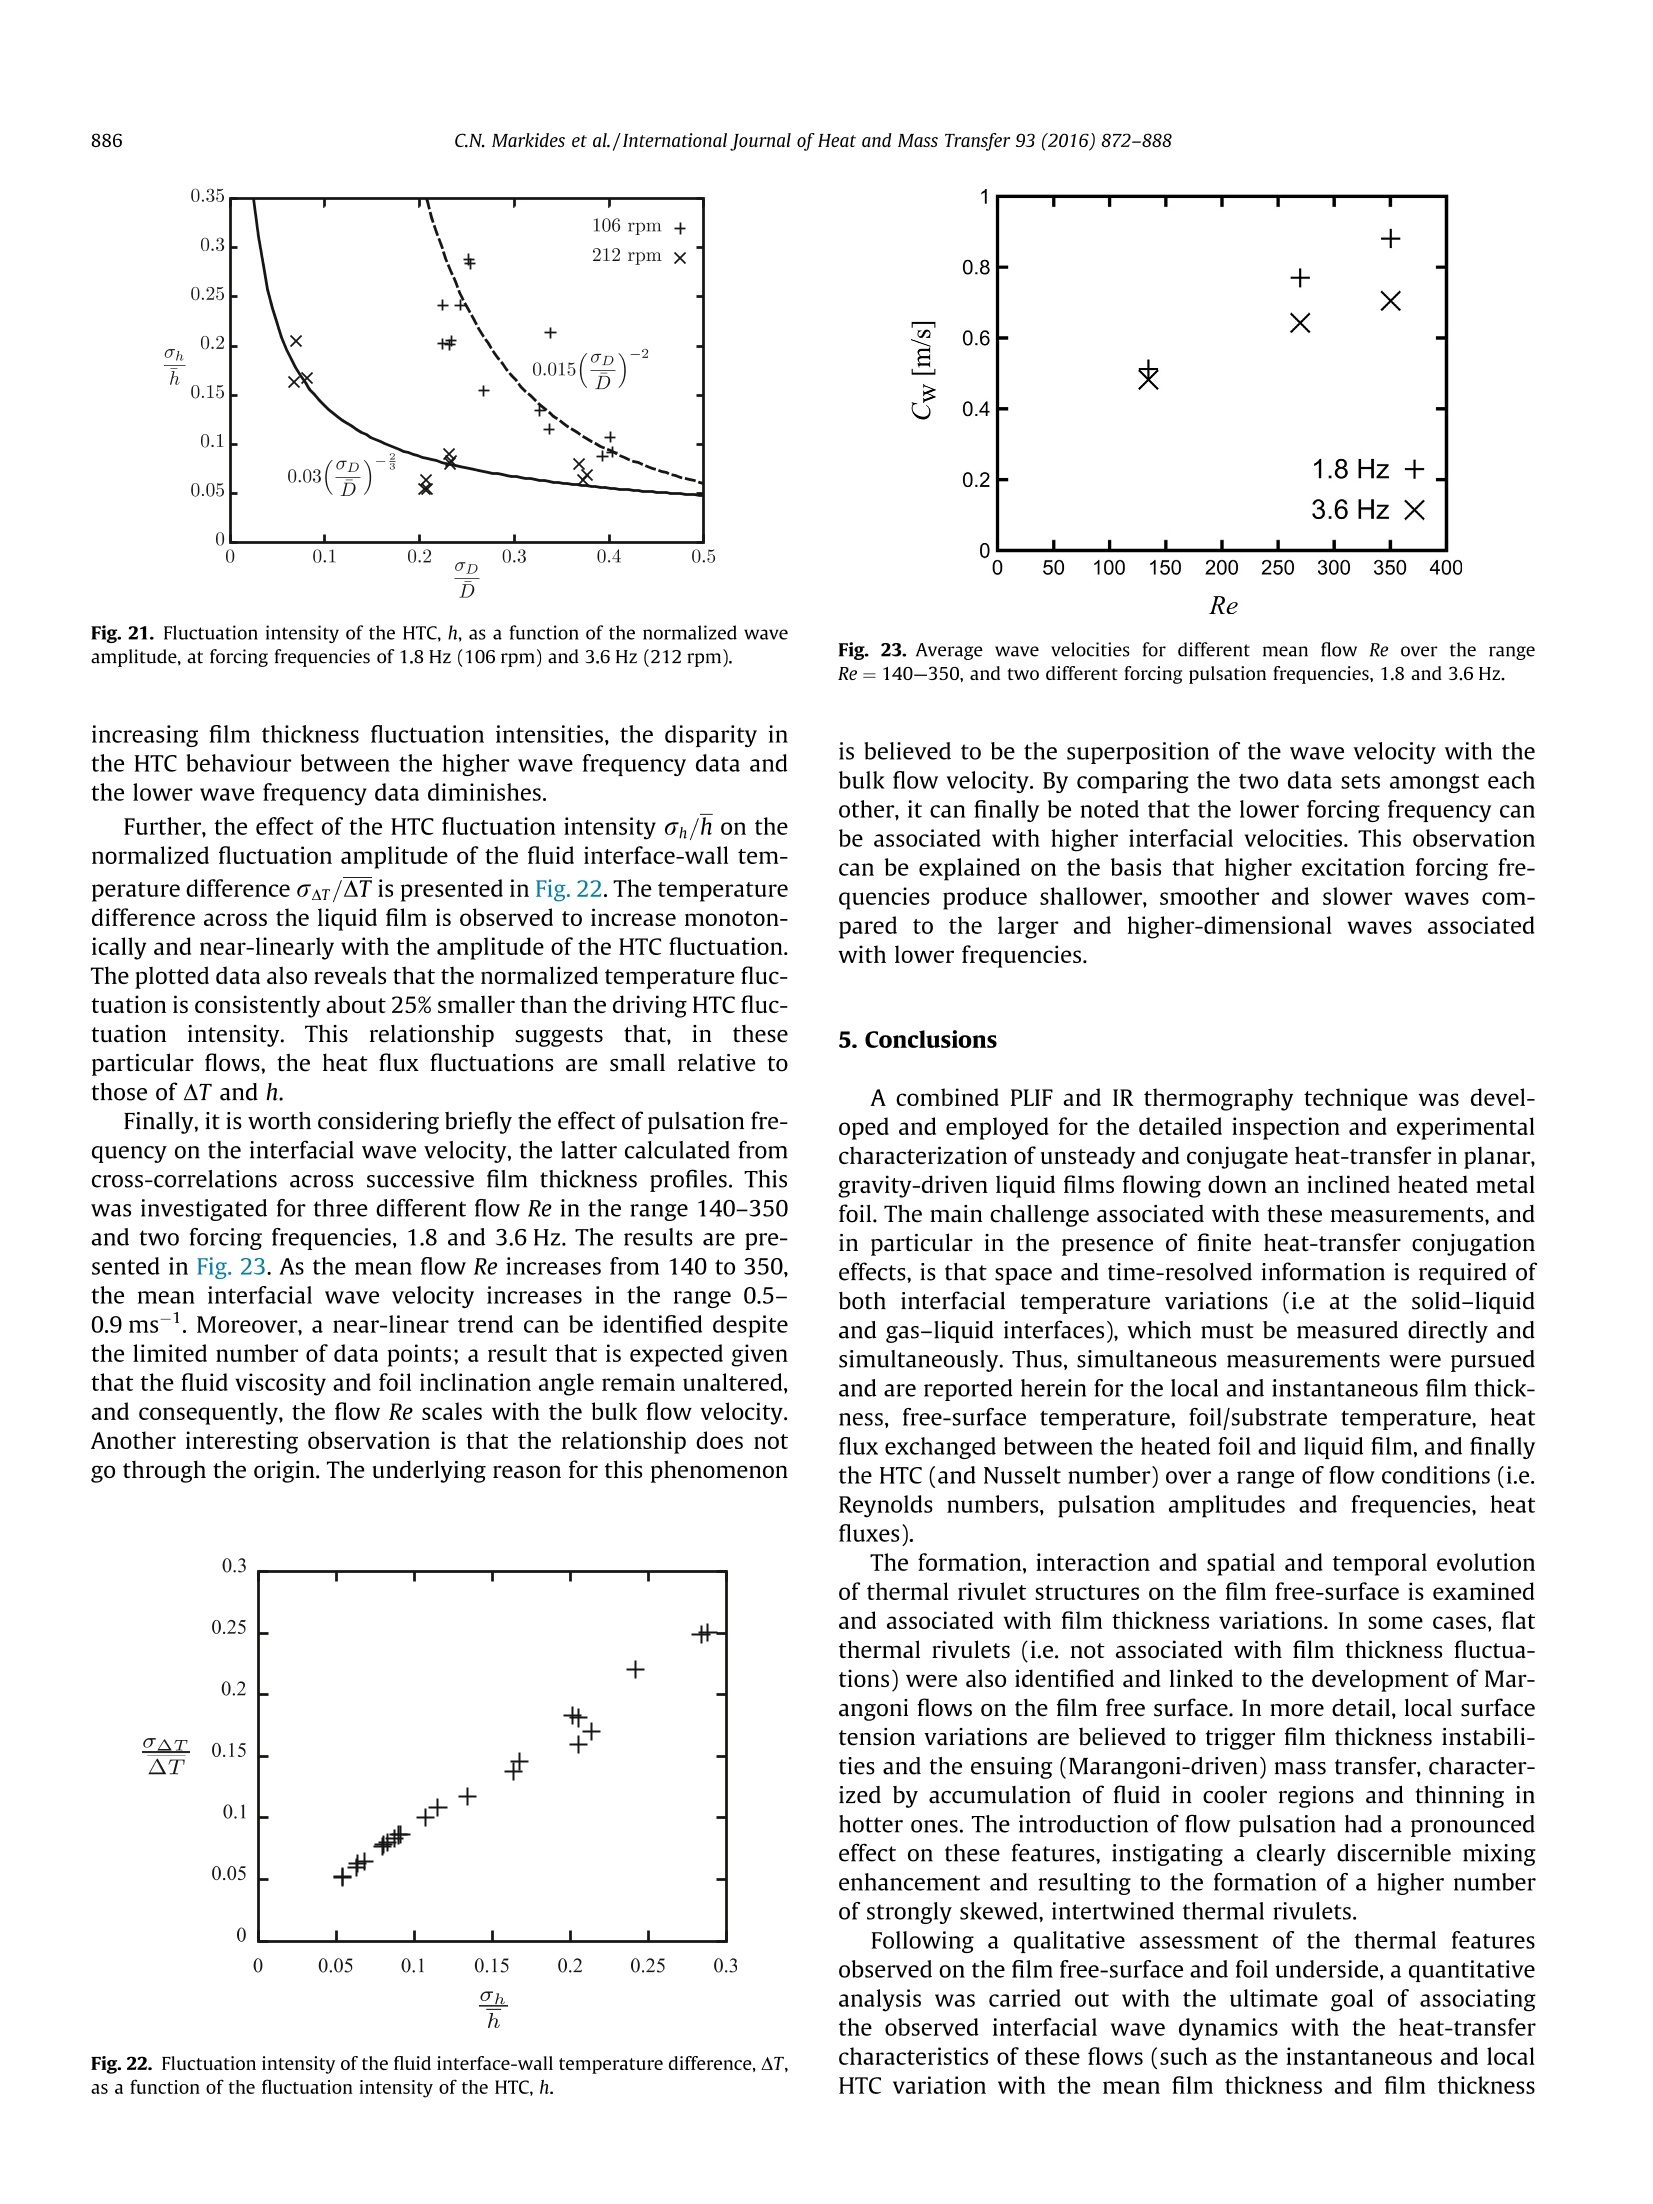
International Journal of Heat and Mass Transfer 93 (2016) 872-888 873C.N. Markides et al./International Journal of Heat and Mass Transfer 93 (2016) 872-888 Contents lists available at ScienceDirect International Journal of Heat and Mass Transferjournal homepage: www.elsevier.com/locate/ijhmt An experimental study of spatiotemporally resolved heat transferin thin liquid-film flows falling over an inclined heated foil Christos N. Markides *, Richard Mathie, Alexandros Charogiannis Clean Energy Processes (CEP) Laboratory, Department of Chemical Engineering, Imperial College London, London SW7 2AZ, United Kingdom ARTICLEINFO ABSTRAC T Article history: Received 3 July 2015Received in revised form 26 October 2015Accepted 28 October 2015 Keywords: Film flows Planar laser-induced fluorescence Infrared thermography ConvectionUnsteady heat transfer Heat transfer coefficient Film thickness This paper describes the development of an experimental technique that combines simultaneous planarlaser-induced fluorescence (PLIF) and infrared (IR) thermography imaging, and its application to the mea-surement of unsteady and conjugate heat-transfer in harmonically forced, thin liquid-film flows fallingunder the action of gravity over an inclined electrically heated-foil substrate. Quantitative, spatiotempo-rally resolved and simultaneously conducted measurements are reported of the film thickness, filmfree-surface temperature,solid-liquid substrate interface temperature,and local/instantaneous heat fluxexchanged with the heated substrate.Based on this information, local and instantaneous heat-transfercoefficients (HTCs) are recovered. Results concerning the local and instantaneous HTC and how this iscorrelated with the local and instantaneous film thickness suggest considerable heat-transfer enhance-ment relative to steady-flow predictions in the thinner film regions. This behaviour is attributed to anumber of unsteady/mixing transport processes within the wavy films that are not captured by laminar,steady-flow analysis. The Nusselt number Nu increases with the Reynolds number Re; at low Re valuesthe mean Nu number corresponds to 2.5, in agreement with the steady-flow theory, while at higherRe, both the Nu number and the HTC exhibit significantly enhanced values. Evidence that the HTCbecomes decoupled from the film thickness for the upper range of observed film thicknesses is also pre-sented. Finally, smaller film thickness fluctuation intensities were associated with higher HTC fluctuationintensities, while the amplitude of the wall temperature fluctuations was almost proportional to theamplitude of the HTC fluctuations. o 2015 The Authors. Published by Elsevier Ltd. This is an open access article under the CC BY license(http://creativecommons.org/licenses/by/4.0/). 1. Introduction Liquid films falling under the action of gravity are classicalfree-surface flows that are either directly encountered in or repre-sentative of a wide range of industrial applications, includingwetted-wall absorbers, heat exchangers, condensers, evaporatorsand reactors. The practical interest in these flows arises primarilyfrom their high surface-to-volume ratios and excellent heat andmass transfer characteristics. It therefore comes as no surprise thatextensive theoretical [1-4], numerical [5-9] and experimental[10-13] efforts have been devoted to their study over the past dec-ades. The extraction of reliable detailed experimental data has,however, proven particularly challenging owing to a number ofchallenges inherent to these flow systems, such as the restrictedfluid domains under observation (often sub-mm) and the intermit-tent nature of the moving and wavy interface. The present ( * C orresponding author. ) ( E-mail a ddresses: c .markides@imperial.a c .uk ( C.N. Markides), r i chard.mathie@ c antab.n e t ( R. Mathie),a c1 0 05@ic . a c .uk ( A . Charogiannis). ) investigation is motivated by the strong demand for detailed,spatiotemporally resolved hydrodynamic and heat-transfer datain planar falling-film flows. This information is necessary for thepurpose of improving our fundamental understanding of theseimportant flows, and also for furthering the development and val-idation of advanced analytical tools and numerical modellingcodes, by providing sophisticated closures for accurate and reliablepredictions. Beyond this fundamental interest, the availability ofthe information can also prove valuable in our efforts to appreciatethe transport capabilities of these flows and our in-depth under-standing of the associated underlying heat-transfer mechanisms,which can then be harnessed in practical situations to improveperformance and reduce the size and cost of equipment. This paper describes a simultaneous application of optical-diagnostic techniques for the provision of the aforementionedspatiotemporally resolved heat-transfer information in thinliquid-films flowing downnan 1inclined1heated foil. Opticaltechniques are recognizedl as advancedmeasurement tools.capable of providing detailed, non-intrusive multi-dimensionalinformation on concentration, phase, temperature, velocity and ( 0 017-9310 / O 20 1 5 The Authors. Published by Elsevier Ltd . ) ( This is an open access article under the CC B Y license ( h ttp:/ /c r ea t ivecom m ons.org / lic e nses/by/ 4 .0/). ) other scalar and/or vector fields with high spatial and temporalresolution. As a result, they are becoming increasingly prevalentin scientific and engineering research and development fields. Inparticular, the heat-transfer community is moving graduallytowards experiments that can combine heat-transfer measure-ments such as of temperature, heat flux, heat-transfer coefficient(HTC)and in a few cases the velocity field within the fluid domains,thus moving towards a comprehensive understanding of theirassociated interactions leading to a particular heat-exchangeperformance. Specifically, the experimental technique reported here, namelyPLIF-IR, involves a combination of laser-induced florescence (PLIF)and infrared (IR) thermography, and was developed in order toenable simultaneous measurements of the film free-surface heightrelative to the solid substrate (film thickness), the film free-surfaceand solid-liquid substrate interface temperatures, and the instan-taneous heat flux exchanged between the liquid film and theheated substrate. By extension, the acquired data allow the estima-tion of local and instantaneous HTCs, and an investigation of theirvariation as a function of important flow parameters. Anotherimportant aspect of this effort is our specific interest in developingan experimental methodology that allows the explicit study ofunsteady and conjugate heat-transfer [14,15]. In these problemsthe temperature and heat flux at the solid-liquid interface (wettedsubstrate side) both time-vary, and it is necessary to measuredirectly these variations. To address this challenge, the employ-ment of a thin metal foil as a substrate enables IR measurementsat its underside (un-wetted substrate side) to provide temperatureand heat flux information on the wetted solid-liquid surface. Amongst a plethora of relevant optical-diagnostic techniques,fluorescence-based methods have proven to be very effective andare therefore popular amongst researchers engaging in film-flowinvestigations. These methods employ a tracer (either occurringnaturally in the flow or an added chemical substance) that isexcited using a laser source. Fluorescence-based methods can befurther classified as laser-induced fluorescence (LIF) imaging orplanar laser-induced fluorescence (PLIF) imaging. The primarydifference between the two is that LIF utilizes the fluorescenceintensity,measured at or near the incident light direction, to quan-tify the film thickness along a line, over a one-dimensional (1-D) ortwo-dimensional (2-D) domain. PLIF on the other hand relies onplanar illumination across the flow field and imaging from the side,and can be used to directly identify the extent of the liquid domain,and to resolve with a higher level of detail, resolution and accuracy1-D spatiotemporal film thickness variations along the illuminatedplane. Consequently, one or both film boundaries need to be iden-tified in raw PLIF images in order to measure the spatial extent of the film. Another advantage of the latter approach (PLIF) is that thefluid-flow domain is visualized directly, allowing for spatiotempo-rally resolved velocity or temperature data to be obtained simulta-neously with the film thickness. Examples of experimentalinvestigations employing LIF imaging are reported in Refs.[22,23], and more recently by Alekseenko et al.[24]. PLIF-basedstudies are presented in Refs. [14,25-27] in various multiphase/interfacial flows. Beyond isothermal film-flow investigations, fluorescence-basedmethods using temperature-sensitive markers have been employedwhen evaluating the thermal performance of microchannel devicesand other microfluidic systems [28,29], as well as plate heat-exchangers in the presence of oscillating flows [30,31,9]. Tempera-ture mea15Ksurements with an absolute accuracy of 0.5 K, or better,have been reported [28,32,33]. Compared to isothermal film-flows,the study of diabatic (heated/cooled) film-flows which entailliquid-temperature measurements is more demanding, owing tothe fact that the liquid is often in physical and thermal contact witha hot solid-substrate which is typically metallic and opaque. Illumi-nation of the liquid domain from the solid side is unfeasible in such aconfiguration, with the (intermittent and disturbed) liquid free-surface providing the only optical access to the liquid domain. In thiscase, refraction at the wavy interface results in strong beam-steeringthat must be accounted for by post-processing correction algo-rithms. Such measurements are also subjected to the restrictionsnoted earlier, and any available studies are consequently limitedto single-point measurements. Amongst others, the excellent efforts at RWTH Aachen Univer-sity [34,35] to conduct simultaneous film-thickness and tempera-ture measurements by employing diacetyl fluorescence andphosphorescence imaging are worthy of mention. In more detail,time-varying local HTCs were reported at the measurementposition (point), suggesting a strong correlation between the filmthickness and heat transfer (+80% enhancement ahead of the waveand -40% deterioration below the wave crest). Unfortunately, theparticular experimental effort was restricted to a narrow flowparameter range (Re=126), and the role of important experimen-tal parameters on the wave regime and HTC performance was notwithin its scope. Furthermore, the results were recovered on theassumption that the velocity within the film is well-described bythe theoretical parabolic Nusselt profile (for 1-D, laminar and fullydeveloped steady-flow dominated by the balance of gravity andviscosity only). Deviations from this profile on account of two-dimensional (2-D) and three-dimensional (3-D) unsteadiness have,however, been confirmed [10,27], which suggests that additionalexperiments to confirm these findings are necessary. Further improvements to our insight into the complex andunsteady flow phenomena associated with thin films and their linkto heat-transferperformance can be attributed to the extensive bodyof experimental research carried out at the Kutateladze Institute ofThermophysics of the Siberian Branch of the Russian Academyof Sciences [36,12,37-39] and at the Institute of Thermophysics ofthe Technical University of Darmstadt [40-43]. The experimetnalefforts at Kutateladze aimed at examining the process of rivulet for-mation due to thermocapillary convection, employing a wide rangeof optical techniques including IR thermography,particle velocime-try, shadowgraphy and LIF. In Ref. [12], a range of locally(non-uniformly) heated falling film flows between Re=300 andRe=500. Even when low heat fluxes were imparted onto the verti-cally falling water films, significant thermocapillary effects wereobserved. Non-uniform heating was also employed in Ref. [36] toinduce the formation of a horizontal bump-shaped free-surfacedeformation across the film, which was found to transition to arivulet pattern above a critical heat input. By depositing Aluminiumparticles onto the liquid surface, a highly non-linear 3-D flow wasrevealed, while a stagnation point was identified at the top of “horseshoe-like” structures. The separation between adjacentrivulets in experiments carried out with uniform heating was shownto depend weakly on the film inclination angle above 15°[37], whilepositive temperature gradients in the flow direction resulted in anincrease in the wave amplitude. The evolution of 3-D waves intorivulet structures along with the dependence of the rivulet wave-length on the Re and applied heat flux were studied in Refs.[38,39]. Shorter wavelengths ensued when increasing the heat flux,while longer wavelengths were observed when increasing the Re.The work at Darmstadt has been dedicated to the characterizationof the thermal performance of a variety of film flows. For example,experimental studies of the heat transfer (including by evaporation)of laminar water falling-films over smooth, as well as patternedplates, are reported in Refs. [40,41], using IR thermography and con-focal chromatic imaging (CCI). Significant heat transfer enhance-ments were noted compared to a smooth-plate arrangement whengrooved plates were employed. Furthermore, different mechanismsof film rupture were also investigated.Other heat transfer systemsthat have been extensively investigated (in a similar fashion) bythe same research group include micro-channel and micro-tubeflows (see, for example, Refs.[42,43]). It is noted that this work ismostly dedicated to reporting time-averaged HTCs and characteriz-ing the overall heat transfer performance of the examined systems,while the aforementioned work at Kutateladze focuses mainly onthe characterization of hydrodynamic flow-regimes. The experimental work presented here is specifically associatedwith the application of the PLIF-IR technique, which employs fluo-rescence in conjunction with IR thermography. As noted earlier,the free-surface temperature of liquid films has been measuredextensively by various researchers with IR imagers, sometimeswith filter-equipped lenses that block the wavelengths over whichthe working fluid is transparent. The key aspect of this measure-ment tactic is the absorptivity of the fluid, which is required tobe sufficiently high at the wavelengths used for imaging. Thisensures the observation of a thin layer of fluid near the interface(i.e. of the free-surface), without contamination from the liquidbulk deeper within the film, or from the solid substrate. Forexample,Refs. [44,45]used an IR camera to measure the interfacialtemperature of silicone-oil films; in this case the absorption coef-ficient allowed 99% of the radiation to be absorbed within a thin(10-15 um) layer at the surface. IR thermography has also beenextensively employed in water film-flows (e.g. Refs. [46,47]), aswell as many others. The present paper is an extension of the experimental investi-gation reported in Mathie and Markides [15]. Contrary to that Fig. 1. Apparatus schematic showing the distribution box, test section, pump andoscillator valve. work, which focused exclusively on the recovery of the so-called'augmentation ratio' in unsteady flows including film flows in thesame apparatus with the same PLIF-IR technique, and only in selectexperimental conditions, the focus of the present work is on thefull, detailed characterization of unsteady heat-transfer over arange of thin liquid-film flow-conditions in this apparatus, thusexploring the effects of important variables and parameters onthe obtained heat transfer. The paper is structured as follows: inthe next sections (Sections 2 and 3) the experimental apparatusis presented briefly, along with the employed optical measurementtechniques, namely PLIF imaging and IR thermography. Alsoincluded is a description of the relevant data processing method-ologies. In Section 4 the experimental results are presented. Theresults are organized in two sections, one dedicated to noteworthyqualitative observations regarding any interfacial thermal featuresand the phenomenology and dynamics of the examined film flows,and the second pertinent to the quantitative heat-transfer charac-terization. Finally, the paper closes with a summary of the mainconclusions (Section 5) derived from the present study. 2. Experimental methods 2.1. Flow apparatus A series of experiments were conducted in order to measure theinstantaneous temperature and heat flux across wavy films devel-oping over a main test-section that comprises an inclined, electri-cally heated Titanium foil of thickness a=50 um [15]. Heating ofthe test-section substrate was achieved by holding the foil taughtbetween two 10 mm-thick copper electrodes and applying acurrent using a DC power supply rated to 10 V and 1000 A (i.e.10kW), such that a maximum heat-flux of q=4.2 W cm-2overthe 1200 cm²surface area of the foil was possible. Beyond the partof the apparatus that was employed for generating the heated sub-strate over which the flows were considered, the experimentalarrangement also comprised a preparation section where the filmflows were initiated, developed and delivered to the substrateand a closed flow-loop via which the liquid circulated to the testsection (Fig. 1). This was preferred to an open-loop arrangement,as it allowed for the fluorescent dye concentration to be preservedthroughout the duration of the experiments. When in operation,the liquid initially passed through a counterflow heat exchangersupplied by Alfa Laval, in order to modulate its temperature beforebeing controlled, measured and entering the preparation and testsections. The cooling stream used for the heat exchanger was sup-plied by the water mains, with the rate of heat extraction regulatedby using Valve V1 and temperature indications on both sides of theheat exchanger from 1 mm K-type thermocouples. A second valve,Valve V2, was used in conjunction with a flow-recirculation loop(as illustrated in Fig. 1) for bypassing part of the flow back to thetank, thus allowing a lower flow-rates to be achieved in the testsection with the same pump; this maintained higher flow-ratesthrough the pump and the heat exchanger, which were operatedmore efficiently and closer to their design specifications. In the present work, pure water and water-ethanol solutionswere used as the liquid phase, the former during the developmentand testing of the experimental setup, and the later during themain heat transfer experiments reported in this paper. Water hasa high surface tension, resulting to partial dewetting even whenmodest heating is applied to the foil. This phenomenon not onlyhampers the reliability and reproducibility of the experimentalresults, but also presents a threat to the foil as unwetted regionswill heat up disproportionately and deform. In order to preventthis outcome, an ethanol-water solution (20% ethanol and 80%water by volume) was preferred, which compared to pure water displays substantially higher wettability, allows for higher heatinputs to be applied, and reduces the risk of damaging the setup.The density pr, kinematic viscosity vr and surface tension or ofthe employed solution at 20°C correspond to 978kg m,1.53×10-6m²s-1and 4.2×10⁻²N m-1 respectively. In order to selectively trigger the rapid growth of waves andobtain developed wave-regimes within a relatively short test-section, the flow was split downstream of the bypass valve (V2)by diverting a portion of it through a rotating throttle valve (oscil-lator valve, V3 in Fig. 1). Torque to drive the oscillator valve wasprovided by a 5 V, 1 A, 1.8° step-angle stepper-motor controlledby an in-house developed controller, thus achieving a maximumrotational (i.e. wave) frequency of approximately 11 Hz. After theoscillator valve, the pulsating supply was recombined with thesteady supply that was also controlled by an independent valve(V4). The total flow-rate was then measured by using an ultrasonicflowmeter (UF25B by Cynergy3 Components). In more detail, therecorded pulse-sequence (one TTL pulse generated for each mL offlow) was used to recover instantaneous and cumulative flow-rate time-traces, from which the mean flow-rates and intensityof flow-rate pulsations were calculated. The rotational speed of (a) Test-section schematic showing the position of thelaser sheet and IR camera relative to the heated foilwhen observing a thin slice along the direction of theflow (reproduced from Ref. [15]). (b) Test-section arrangement showing the positionof the laser sheet-optics and PLIF cameras relativeto the heated foil when observing a horizontal sliceacross the direction of the flow. Fig. 2. Apparatus including the heated-foil substrate/test-section, flow-prepara-tion/distribution setup and optical arrangement. Showing the position of the lasersheet-optics and PLIF cameras relative to the heated foil when observing ahorizontal slice across the direction of the flow. the pump, and therefore the film flow-rate, was modulated byusing a 1200V A variable autotransformer (Carroll & Meynell).Finally,the flow was distributed uniformly across the heated areaof the foil by a flow-preparation section of width w=0.3 m, thatfeatured a series of grids, meshes and a honeycomb, as well as aknife-edge slot along with a set of micrometer stages that wereused to adjust and set the initial height of the liquid films as thesewere introduced over the heated-foil test-section. A complete view of the apparatus is given in Fig. 2. Measure-ments were performed at two streamwise positions; at an‘upstream'location a distance x=185 mm from the distributionbox knife-edge at the flow inlet, and at a downstream'locationx=285 mm from the inlet. In the arrangement shown in Fig. 2(a) the IR camera is positioned underneath the test section withthe laser sheet-optics illuminating a vertical slice along the direc-tion of the flow, whereas in a second arrangement (Fig. 2(b)), thetwo PLIF cameras are positioned to observe a horizontal sliceacross the film, excited by the laser sheet-optics that werepositioned on top of the test section (at the top of the image).Experiments with the IR camera in this position were alsoperformed. A fluorescent target used to correct for pulse-to-pulselaser-intensity variations can also be seen, located just above thefoil. The Titanium foil and distribution box were installed on analuminium support-frame with the inclination angle fixed toβ=40°to the horizontal. The distribution box, which comprisedgrids,meshes and a honeycomb, functioned as a settling chamber,breakingdown and dissipating secondary flows,large-scale eddiesand turbulence, and creating a uniform flow at the test-sectioninlet. Finally, a type-K thermocouple was installed inside thechamber allowing for the liquid temperature to be monitored.Using the mean flow-rate measurement from the ultrasonicflowmeter, a Reynolds number can be defined at the flow inlet, as: In this expression, U stands for the local bulk-fluid velocity, D forthe channel depth at the inlet (20 mm), I for the flow rate per unitchannel width w, and vr for the kinematic viscosity of the liquid. 2.2. Measurement techniques: PLIF imaging A 2-D PLIF imaging technique was used to characterize the localand instantaneous film thickness and film free-surface tempera-ture simultaneously. To that end, a temperature-sensitive fluores-cent dye (Rhodamine B) was dissolved in the liquid phase (here,pure water or a water-ethanol solution),forming a low concentra-tion (~1 g/L), perfectly mixed aqueous-dye solution. Amongstothers, the well-characterized strong dependence of RhodamineB fluorescence to temperature variations was a primary reasonfor employing this particular tracer in these present experiments. The aqueous liquid-phase was excited by a 0.1 mm-thick laser-sheet, generated by a dedicated sheet optics and lens combinationmanufactured by LaVision that was positioned over the wavyinterface andpointing downwards.Furthermore, alineartransition-stage was employed,so that the location of the excita-tion plane could be adjusted with a high degree of accuracy. Thesheet optics were connected via a guiding arm to a dual-cavity,frequency-doubled Nd:YAG laser (Nano-L-50-100PV by LitronLasers), capable of approximately 50 mJ/pulse at the selected exci-tation wavelength (532nm) and a frequency of 100 Hz per head.Each head could be fired separately by the software, allowing amaximum continuous sampling of 200 Hz, and therefore, a tempo-ral resolution down to 5 ms. The resulting fluorescent light was collected by a pair ofsynchronized LaVision VC-Imager Pro HS 500 cameras equippedwith 1280×1024 pixel CMOS sensors and Sigma 105 mm f/2.8 Macro lenses. Two cameras were used, positioned next to eachother, in order to expand the field-of-view (FoV) of the measure-ment (by employing image stitching), while maintaining a highspatial-resolution (approximately 20-30 um/pixel). In addition tothe employment of extension rings in achieving the desired magni-fication, a Scheimpflug adaptor was installed on one camera (theone positioned at an angle to the excitation plane) to focus theentire film domain accurately and sharply onto the image. Finally,optical long-pass540 nmdichroic/interference filters wereinstalled on both camera lenses, in order to block any scatteredlaser-light while allowing the red-shifted fluorescence emissionto be collected by the detectors, thus improving the signal-to-noise ratio (SNR). Both cameras and lasers were synchronized bya LaVision High-Speed Controller (HSC), operated by using theLaVision DaVis software. 2.3. Measurement techniques: IR thermography Along with the liquid-film thickness and free-surface tempera-ture measurements extracted by PLIF imaging, the foil (un-wetted)underside temperature was measured simultaneously by an IRcamera. The corrected measurement was then used to recoverthe (wetted) solid-liquid substrate temperature and the heat fluxexchanged between the liquid film and the heated substrate, basedon the knowledge of the imposed volumetric (Joule) heating-rate.Two different IR cameras were employed, a Cedip Titanium and aFLIR SC3000. With each laser pulse, the laser (PLIF) systemprovided the triggering signal for the IR camera, as well as the dataacquisition (DAQ) system used to record the flowmeter and ther-mocouple output signals. The recorded thermocouples were thosepositioned inside the flow preparation/distribution box, at the filminlet and in thermal contact with the underside ofthe foil, the lat-ter in a series of separate experiments conducted for IR calibrationand validation purposes. In reference to the setup schematic presented in Fig.2,the totalincident radiation-flux seen by the IR camera, Icam, is a linear super-position of the radiation emitted by the foil underside, which is at atemperature Tu, and any direct or reflected background radiationbg: where G=5.67×10⁻⁸Wm-1K-4 is the Stefan-Boltzmann con-stant, and e is the emissivity of the Titanium foil. Bare, polishedTitanium has a very low emissivity, of approximately 0.1, whereasthe thin oxide-layer that quickly forms on its surface causes itsemissivity to increase to about 0.3; either way, the IR radiationcollected by a detector positioned a/ t right angles to the foil isianfluenced by reflections. Consequently, in the present work, theIR camera was in fact positioned at an offset angle to the foil, ratherthan directly opposite the foil surface,thus preventing it from cap-turing a reflected image of itself. Furthermore, in order to suppressany background IR radiation and prevent imaging of the reflectionsof other thermal sources, the region that would have otherwisebeen in the line-of-sight of the camera following specular reflec-tions from the foil was obstructed by a screen constructed fromthick black cardboard (with near-unity emissivity). The screenwas further backed by aluminium foil which contributed to keepingits temperature even by uniformly dispersing heat. Having suppressed any background signals and reflections, theIR radiation originating from the screen is solely the result of itstemperature Tbg. Thus, the total IR radiation measured by thecamera Icam, is the sum of the background radiation associated withthe screen temperature Tbg, and the direct emission from the foil Iu: such that the apparent temperature measured by the IR camera Tappis given by: Eq. (4) can only be used to evaluate the temperature at the foilunderside provided the employed IR thermograph integrates theradiation emitted over the entire IR spectrum. Typically, however,IR cameras detect radiation over a limited spectral band, in this case3.6-5.1 um and 8.0-9.0 um for the Cedip and FLIR cameras respec-tively, and thus, the absolute temperature of the foil cannot bedirectly determined from the Stefan-Boltzmann law (Eq. (3)). Icamcan instead be linked to temperature measurements via calibrationcurves provided by the camera manufacturer that consider, asidefrom the wavelength dependence of the detector (relative spectralresponse), data conversion settings such as the integration timeand gain, and the detector optics (lens and filters). Using the rele-vant calibration curve, and provided that the background tempera-ture and emissivity of the foil are known (the first usingthermocouples, the latter by comparison to a blackbody of the sametemperature), Ig and Iu can be calculated sequentially. In theseexperiments, Eq. (3) was used to evaluate the temperature on theunderside of the foil from raw IR images following a series ofcalibration and validation efforts carried out using thermocouples,as well as thermal targets consisting of squares of electrical tapewith known, high emissivity. In more detail, simultaneous measure-ments of the temperature of the tape with the IR camera and thethermocouples were used to find the correct foil temperature, andthus the correct local emissivity of the foil. As a final validationexercise, independent measurements of the film and foil tempera-tures were conducted by both the IR camera and a series of fine(75 um diameter) unsheathed, butt-welded thermocouples. Theroot mean square (RMS) deviation between IR camera and thermo-couple measurements amounted to 0.1 ℃, which we consider as arepresentative estimate the error associated with the IR thermogra-phy measurement. 3. Experimental development 3.1. Heating conditions The deviation in the power supplied to the foil from changes tothe foil resistance and stability of the DC power supply over a runwas measured and found to be <0.1% of the nominal suppliedpower. In order to provide uniformly distributed heating over thefoil surface-area, the use of copper electrodes that were muchthicker than the foil itself, and therefore with a significantly lowerelectrical resistance, was necessary. The power losses in the cables,based on direct resistance measurements in which the nominalresistance of the connecting cables and the total resistance of thefoil were found to be 540 uW and 18.3 mW respectively, wereestimated to amount to 3% of the power delivered to the foil. Thevoltage distribution over the foil was examined by conductingpoint measurements with a multimeter. The observed maximumdeviation in this test amounted to no more than 0.1% over the300×400 mm foil area, which is expected to be the same as thenon-uniformity in the imposed volumetric heating rate in the foil.Moreover, a uniform temperature distribution was observed overthe foil during dry tests in which the foil was heated withoutestablishing a film flow, and its temperature was measured withthe IR camera. The standard deviation of the temperature duringthese dry tests did not exceed 0.1 ℃. Results from tests concerning the average temperature over thefoil obtained at different heat fluxes are shown in Fig. 3. Anotewor-thy observation stemming from these particular tests was thatheat convection to the air was small, peaking at ~1% of the of heat flux delivered to the liquid during the falling film experiments.Specifically, without a film flow, no more than q=0.042 W cm-2or 50 W of thermal power were necessary to sustain a steady foiltemperature of 60C, or about 40°C above ambient; by compar-ison, nearly 5 kW were required to obtain the same foil tempera-ture once a typical film flow was established. Given that the heatflux into the film from the foil's (wetted) top surface is three ordersof magnitude higher than any heat losses to the environment fromthe (un-wetted) underside, the underside of the foil can thereforebe considered an adiabatic boundary during the flow experiments. During the actual experimental runs, the liquid temperaturewas kept below 40℃ in order to minimize evaporation and focusthe investigation on forced convective heat-transfer in liquid filmflows. In a test near the upper range of achievable heat fluxes(corresponding to the highest heat losses), q=3.2 W cm-2 of heat-ing power was applied to an 8 L/min water film flow, across thew=0.3 m wide test-section. Assuming complete heat transferfrom the foil to the water (no heat losses to the surroundings), astreamwise temperature rise of 17.2 K m-1 can be estimated; how-ever, a gradient of 16.7Km- was recovered with the IR camerafrom the thermal profile of the fully developed portion of the flow.This corresponds to heat losses of ~0.1 W cm-, which amount toless than 3% of the total heat input. If we conservatively assumethat all of this heat was used to evaporate liquid from the film sur-face, which is unlikely as other heat transfer processes take placeincluding convective heat-transfer to the air at the film's free sur-face [37], the maximum evaporative flow rate would be less than3 mL min-1. This is 3-4 orders of magnitude smaller than the bulkfilm flow rate. Finally, the HTC between the foil and the liquid filmfor this flow was measured at about 2400 W K-1m-, whereas theHTC between the liquid film and the surrounding air was an orderof magnitude lower at ~200 W K-m- (from direct measure-ments). These results are in general agreement with the Nusselttheory for film flows, as well as typical HTC values obtained byother investigations in the literature (see, for example, Ref. [38]). 3.2. PLIF data processing In order to extract film thickness and free-surface temperaturedata from raw PLIF images, a series of post-processing steps wereimplemented. Initially, raw images were corrected for perspectivedistortion by employment of a calibration graticule and a pinholeprojection model available in DaVis. In more detail, a precision-machined block of acrylic with markings arranged in a regularrectangular pattern (calibration target) was carefully located atthe excitation plane using micrometer stages. The accuracy of the Fig. 3. Foil temperature difference AT relative to the ambient temperature T in theabsence of a film flow, plotted against the applied heat flux q. correction procedure was approximately 50 um, which equatesto less than twice the nominal resolution of the imaging setup. A perspective distortion corrected PLIF image is presented in Fig. 4.Having corrected the raw PLIF images geometrically,a numberof methods were devised to identify systematically the film free-surface. Of these, a gradient method was found to produce themost accurate film thickness estimates as well as the smoothestthickness profiles. Specifically, each image column (i.e. series ofintensity values along the vertical/y-direction) was consideredindependently, so that the PLIF signal intensity was treated as afunction of the y-position alone.Both the position and magnitudeof the maximum gradient in each intensity profile (each x-pixelor image column) were then extracted, and the location of thegas-liquid interface was taken as the intercept of a tangential firstorder polynomial fitted through that location and a completelydark background with zero intensity I =0 (see Fig. 4(b)): where ymax.g is the location of the maximum gradient and yint is theresulting interface location estimate. A similar gradient-based inter-face identification technique was also used in Ref. [27] with excel-lent results. The fluorescence intensity near the free-surface of the film wasused to measure the interface temperature in a spatially resolvedmanner, following a series of calibration experiments. The tech-nique was calibrated using a number of independent PLIF acquisi-tions, whereby the fluid temperature was adjusted between each (a) Typical perspective distortion corrected PLIF imageof a solitary wave. Both excitation and imaging werecarried out from the gas-liquid interface side (reproducedfrom Ref. [15]). (b) PLIF intensity profile across the liquid domain showingthe location of the peak intensity, the maximum gradientintercept with the I =0 line, and the noise threshold level. Fig. 4. Perspective distortion corrected PLIF image and intensity profile across thegas-liquid interface and into the liquid domain. run and PLIF data were collected with no power input to the foil,and thus a uniform temperature throughout the liquid film. Themeasured PLIF signal intensities over each run were then averaged(over a number of images), normalized and plotted against themean temperature measurement from thin (0.2 mm) thermocou-ples. This generated the calibration curve shown Fig.5, whichwas later used to convert direct measurements of the fluorescenceintensity near the free-surface to evaluations of the film’s surfacetemperature. The relationship between the fluorescence intensityand temperature appears to be linear with a gradient of -0.015normalized fluorescence units per C,or -1.5%℃. Fig. 5. Calibration curve of the normalized fluorescence emission intensity Inorm10.10against the liquid temperature T, measured using thermocouples of ±0.1 ℃accuracy. T[C] (a) Deviations corresponding to the calibration datapoints in Fig. 5. (b) PDF of the temperature measurement error, gener-ated from the same data shown in Figs. 5 and 6(a). Fig. 6. Temperature measurement errors (discrepancy between the PLIF techniqueand thermocouple measurements) associated with the calibration results presentedin Fig.5. Along with the mean PLIF signal intensities used to derive thecalibration curve in Fig. 5, a plot of the corresponding standarddeviations of the same PLIF intensity signals (one point for eachcalibration run associated with a single liquid-film temperature,and hence thermocouple measurement) are presented in Fig. 6(a)as a function of temperature, while the resulting probabilitydensity function (PDF) of the difference between the PLIF andthermocouple temperature measurements is shown in Fig. 6(b).The calculated standard deviation between the thermocouplemeasurements and the PLIF measurements was ±0.5℃, a valueused as an estimate of the error associated with the PLIF tempera-ture measurement. This level of accuracy is rendered satisfactory,especially considering that the manufacturer’s quoted accuracyfor the thermocouples employed in the calibration was ±0.1℃. Additional errors associated with the PLIF-based temperaturemeasurement technique ensue due to light distortion when theinterface is strongly curved. In such cases, regions with significantfilm curvature typically appear brighter due to local refraction andlensing. Despite the fact that the emission intensity at shallowdepths in the immediate vicinity of the interface is less sensitiveto this effect, local fluorescence intensities are also relatively lowin these regions, reducing the measurement signal-to-noise ratio(SNR). Therefore, the depth from the free surface to the positioninside the liquid domain over which a spatially averaged fluores-cence intensity was extracted when evaluating an“interfacial" flu-orescence intensity value was identified manually (this varied overthe experimental runs) as a compromise between measurementnoise and measurement accuracy. The suitability of this selectioncan be gauged by comparing final, processed PLIF temperature datawith direct simultaneous measurements of the free-surface tem-perature made by the IR camera. This was done in a series of inde-pendent quality-check runs in which the IR camera was placedover the films looking down, i.e. from the same side as the PLIFmeasurement. An example simultaneous measurement is shown in Figs. 8 and9. The mean absolute deviation between the two measurements isfound to be 1.3 K, and therefore it is possible to deduce that theinterfacial curvature introduces an absolute error of approximately0.8 K to the PLIF temperature measurement. This is significantlylower than the temperature differences across the films that weare attempting to measure, which on average are in the range10-20 K but can be locally and instantaneously 30 K, or higher,depending on the flow condition and imposed heat flux (e.g. seeFigs. 9-11). Fig. 7. IR image of the calibration plate used for the perspective distortioncorrections of ensuing IR images. Image shown after correction algorithms havebeen applied. Fig. 8. Corrected IR image of the liquid film free-surface temperature for Re=179,an imposed heat-flux of q=3.5 W cm-,no inlet forcing, and a foil inclination angleof β=40° to the horizontal (fixed for all experiments). The vertical axis correspondsto the streamwise direction while the horizontal to the spanwise direction acrossthe flow. From dark to bright, the colour scale represents cooler to hotter regions.The black line near the bottom of the image indicates the ‘downstream’ PLIFmeasurement position, location at x=285 mm downstream of the distribution boxknife-edge at the flow inlet. The length of measurement line was approximately40 mm at this position (x=285 mm). 3.3. IR thermography data processing As with the PLIF measurements, perspective distortion correc-tions were implemented to raw IR images by employment of anaffine transformation method (see, for example, Ref.[48]). Such amethod is fully constrained when a minimum of four coordinateson the image plane are known. Towards that end, a graticule con-sisting ofa thick rigid sheet covered by a reflective foil layer andmarked by electrical tape was constructed and imaged, producinga strongly contrasting pattern on resulting IR images (see Fig. 7).The mapping error was reduced further by using nine rather thanfour control points and solving the over-constrained set of equa-tions by means of a least squares approach. The resulting spatialalignment accuracy between simultaneous PLIF and IR imageswas better than 2 mm. Following the employment of Eq. (3) in order to recover theinstantaneous temperature distribution over the foil undersideand the implementation of the aforementioned geometric correc-tions, the next processing step was to recover the temperatureand heat flux distribution on the wetted foil surface (solid-liquidinterface). The foil thickness was selected purposefully to be overan order of magnitude thinner than any thermal feature observedon its surface with the IR camera, and consequently, it can beassumed that heat transfer is dominated by 1-D thermal conduc-tion through its thickness (for a detailed account of the spatial res-olution of IR thermography, refer to Ref.[49]). By further assuminga constant thermal diffusivity, a model for the 1-D thermal conduc-tion with constant heat generation by resistive heating can be usedto describe the thermal response of the foil to temperature fluctu-ations imposed on one of its sides, in this case the top side in con-tact with the liquid. A detailed description of the model can befound in Refs. [14,15]. This response will depend upon the imposedboundary condition (B/C) on the foil underside, which as discussedin Section 3.1, can effectively be assumed to adiabatic. The thermalresponse that relates the solid-liquid interface temperature Tw(inner wall “w") to the measured temperature fluctuations onthe underside of the foil Tu for a given frequency is given by: (a) Instantaneousspanwise spatial1 pprofile of film free-surface temperature obtained simultaneously by temperature-dependent PLIF and IR imaging, corresponding to the horizon-tal black line across the film width indicated near the bottom ofFig. 8, cc=285 mm downstream of the flow inlet. The z-axisindicates the spanwise direction across the flow (see Fig. 8)Same conditions as in Fig.8. (b) Instantaneous spanwise spatial profile of film thickness ob-. tained by PLIF, corresponding to the same horizontal line indi-cated near the bottom of Fig. 8 and to the free-surface temper-ature profile examined in Fig. 9(a), x=285 mm downstreamof the flow inlet. Same conditions as in Figs. 8 and 9(a) (c) Joint-PFD of instantaneous film thickness data (fromFig.9(b)) plotted against the corresponding instantaneous filmfree-surface temperature data (from Fig.9(a)) compiled overthe same spatial region (line indicated in Fig. 8), c=285 mmdownstream of the flow inlet. A power law fit to the data wasalso generated using a least-squares approach and has beenincluded to the plot. Fig. 9. Instantaneous spanwise spatial profiles of film surface temperature andthickness corresponding to the horizontal line across the film width indicated nearthe bottom of Fig. 8, x=285 mm from the flow inlet. The flow and heatingconditions correspond to Re=179 and q=3.5W cm-,respectively. while the corresponding heat flux response is given by: Fig. 10. Instantaneous spanwise spatial profile of film free-surface temperature(from PLIF) obtained simultaneously with the corresponding instantaneous profileof heated-foil temperature (IR) over the same spatial region at the ‘downstream'measurement position,x=285 mm from the flow inlet (see Fig. 8). The flow andheating conditions correspond to Re=179 and q=3.5 W cm-, respectively. Fig. 11. Instantaneous spanwise spatial profiles of temperature across the film free-surface, extracted from a single IR image at different distances x from the flow inletas indicated in the figure. The flow and imposed heating-conditions correspond toRe=179 and q=3.5 W cm-, respectively. where a*=a/8s.n is a normalized foil thickness based on the ther-mal diffusion length in the solid 8sn=√2os/Wn associated withthe nth harmonic of the temperature fluctuations, as is the thermaldiffusivity,Es =√Ks p,cs the thermal effusivity, Ks the thermal con-ductivity, p, the density and cs the specific heat capacity of the solidmaterial. Typical examples of fully corrected IR measurements ofthe foil underside temperature are presented in Figs. 14 and 16. 4. Results and discussion 4.1. Phenomenological observations, interfacial features and dynamics Selected instantaneous results pertinent to the formation andinteraction of thermal rivulet structures on the film free-surfaceare presented in Figs. 8-10. Recall that for the generation of these,and all subsequent results, the liquid employed in the experimen-tal campaign was a mixture of 20% ethanol and 80% water by vol-ume; compared to pure water, this displays higher wettability and Fig. 13. Instantaneous temperature distributions over the free surface of the liquidfilm for different flow Re (107, 179 and 251) and mean heat flux settings (0.1, 0.4,1.5 and 3.6 Wcm-), recovered using the IR camera. The fluid here is a mixture of20% ethanol and 80% water, and the inclination angle of the foil is 40°. No inletforcing was used in these experiments. Fig. 14. Instantaneous temperature distributions over the foil underside for thesame fluid, inclination angle, (unforced) flow Re and heat flux settings examined inFig. 13, recovered using the IR camera. allows higher heating fluxes to be applied prior to film rupture. Inaddition, the foil inclination angle was fixed to β=40°. Close observation of Fig. 8, generated by positioning the IR ima-ger on the same side as the PLIF cameras over the films pointingdownwards, reveals regularly spaced, finger-like structures form-ing close to the flow inlet and developing in the flow direction(x-direction, +ve from top to bottom). Near the inlet, these featuresare narrower and their temperature is comparable to the surround-ing liquid, while further downstream they become progressivelyhotter and wider, in some cases abruptly (e.g. the large finger justto the left of the image midline). Another noteworthy observation Fig. 15. Instantaneous temperature distributions over the free surface of the liquidfilm for the same fluid, inclination angle and mean heat flux settings examined inFigs. 13 and 14. The flow here has a mean Re=179, a pulsation frequency of 1.8 Hzand two different pulsation amplitudes (4% and 10%). Fig. 16. Instantaneous temperature distributions over the foil underside for thesame fluid, inclination angle, mean flow Re, pulsation frequency and amplitudes,and heat flux settings examined in Fig. 15. concerns the relatively discontinuous temperature profile of theserivulets compared to the adjacent fluid which is much cooler. The instantaneous data in Fig. 9(c) correspond to the ‘down-stream’PLIF measurement position identified by the horizontalline near the bottom of Fig. 8. In fact, the IR surface temperatureprofile in Fig. 9(a) has been extracted at this location directly fromFig. 8. This measurement position is located at a streamwise dis-tance x=285 mm downstream of the distribution box knife-edgeat the flow inlet. Measurements at a second ‘upstream’PLIF posi-tion, x=185 mm from the inlet, were also performed (e.g. seeFigs. 17 and 18). The length (spanwise width) of the measurementline was 40-60 mm depending on the experimental run. The PLIFdata displayed here cover a 40-mm spanwise length across theflow. The flow and imposed heating conditions correspond toRe=179 and q=3.5 Wcm-2, respectively. Fig. 9(a) presentsquantitative free-surface temperature data recovered simultane-ously by IR thermography and temperature-dependent PLIF, whileFig. 9(b) gives an indication of the film height obtained from thesame PLIF data. In Fig.9(c), the PLIF results (thermography and filmheight) are plotted against each other, demonstrating the observedrelationship between the two quantities. The following remarks can be made from Fig. 9: 1. The agreement between the two optical techniques with regardto the surface temperature measurement (1.3 K, as stated ear-lier) is satisfactory, with the main thermal features identified and adequately resolved by both. The PLIF measurement doeshave a lower SNR while also offering a comparatively limitedfield of view. 2. The liquid film is thicker where the surface temperature islower and vice versa (see Fig. 9(c)), with the two troughs inthe film thickness measurement corresponding to the twolarger peaks in the surface temperature measurement. Wealso note, however, that the shorter temperature peak nearthe centre of the measurement domain does not correspondto a film thickness trough. This observation is also apparentin Fig. 9(c), by the spread of free-surface temperature valuesassociated with the highest film-thickness values included inthe plot (leftmost region). The identification of this clearlydiscernible thermal feature, which was captured by bothimaging techniques, was encountered consistently in theseexperiments. 3. From direct observations of many such image sequences, itappears that the advent of flat hot rivulet structures, such asthe one discussed above, manifests itself in the developmentof Marangoni flows attheeflmsurface,ddrivenbytemperature-induced surface tension gradients. In other words,local surface tension variations are believed to trigger filmthickness instabilities, and hence the ensuing (Marangoni-driven) mass transfer, characterized by accumulation of fluidin the cooler regions and thinning at the hotter ones. The rivu-lets, whose origin can be found further upstream (i.e. the largerstructures seen in Fig.8), might have formed and evolved in thismanner. 4. The sharp peak on the film free-surface temperature profile inFig. 8 coincides with a less prominent peak on the foil temper-ature profile. The temperature difference between the foil andfilm free-surface at this location is drastically reduced,suggest-ing a significantly higher heat transfer coefficient compared tothe surrounding liquid. This observation will be revisited exten-sively in the upcoming sections, and linked to the local andinstantaneous film thickness. Figure 10 proceeds to show the temperature difference acrossthe liquid film at the same ‘downstream'measurement positionas above, obtained by repositioning the IR camera to observe thetemperature of the underside of the foil, instead of the surface ofthe liquid film; the latter now measured by the LIF technique. Asharp peak (rising ~15 K from the background) can be observedin the fluid surface-temperature at -10
确定

还剩15页未读,是否继续阅读?

产品配置单


北京欧兰科技发展有限公司为您提供《落到倾斜箔片上的液体薄膜中流动的时间空间分辨热传导过程的实验研究检测方案(粒子图像测速)》,该方案主要用于其他中流动的时间空间分辨热传导过程的实验研究检测,参考标准--,《落到倾斜箔片上的液体薄膜中流动的时间空间分辨热传导过程的实验研究检测方案(粒子图像测速)》用到的仪器有德国LaVision PIV/PLIF粒子成像测速场仪、PLIF平面激光诱导荧光火焰燃烧检测系统
推荐专场


相关方案
更多
该厂商其他方案
更多