


方案详情
文
During the course of a hypothetical severe accident in a nuclear Pressurized Water Reactor (PWR),
hydrogen may be produced by the reactor core oxidation and distributed into the containment. Spray
systems are used in order to limit overpressure, to enhance the gas mixing to avoid hydrogen
accumulation, and to wash out the fission products. In order to simulate these phenomena with CFD
codes, it is first necessary to know the droplet size and velocity distributions close to the outlet nozzle.
Furthermore, since most of the phenomena relative to droplets (condensation, gas entrainment,
collision) are of particular importance in the region below the nozzle, accurate input data are needed
for real-scale PWR calculations. The objective is therefore to determine experimentally these input
data.
Experimental measurements were performed on a single spray nozzle which is routinely used in many
PWRs. This nozzle is generally used with water at a relative pressure supply of 350 kPa, producing a
mass flow rate of approximately 1 kg/s. At a distance of 20 cm, where atomization is just achieved, it
is found that geometric mean diameter varies from 305 to 366 μm, Sauter mean diameter from 430 to
600 μm and mean axial velocity from 14.1 to 18.4 m/s.
方案详情

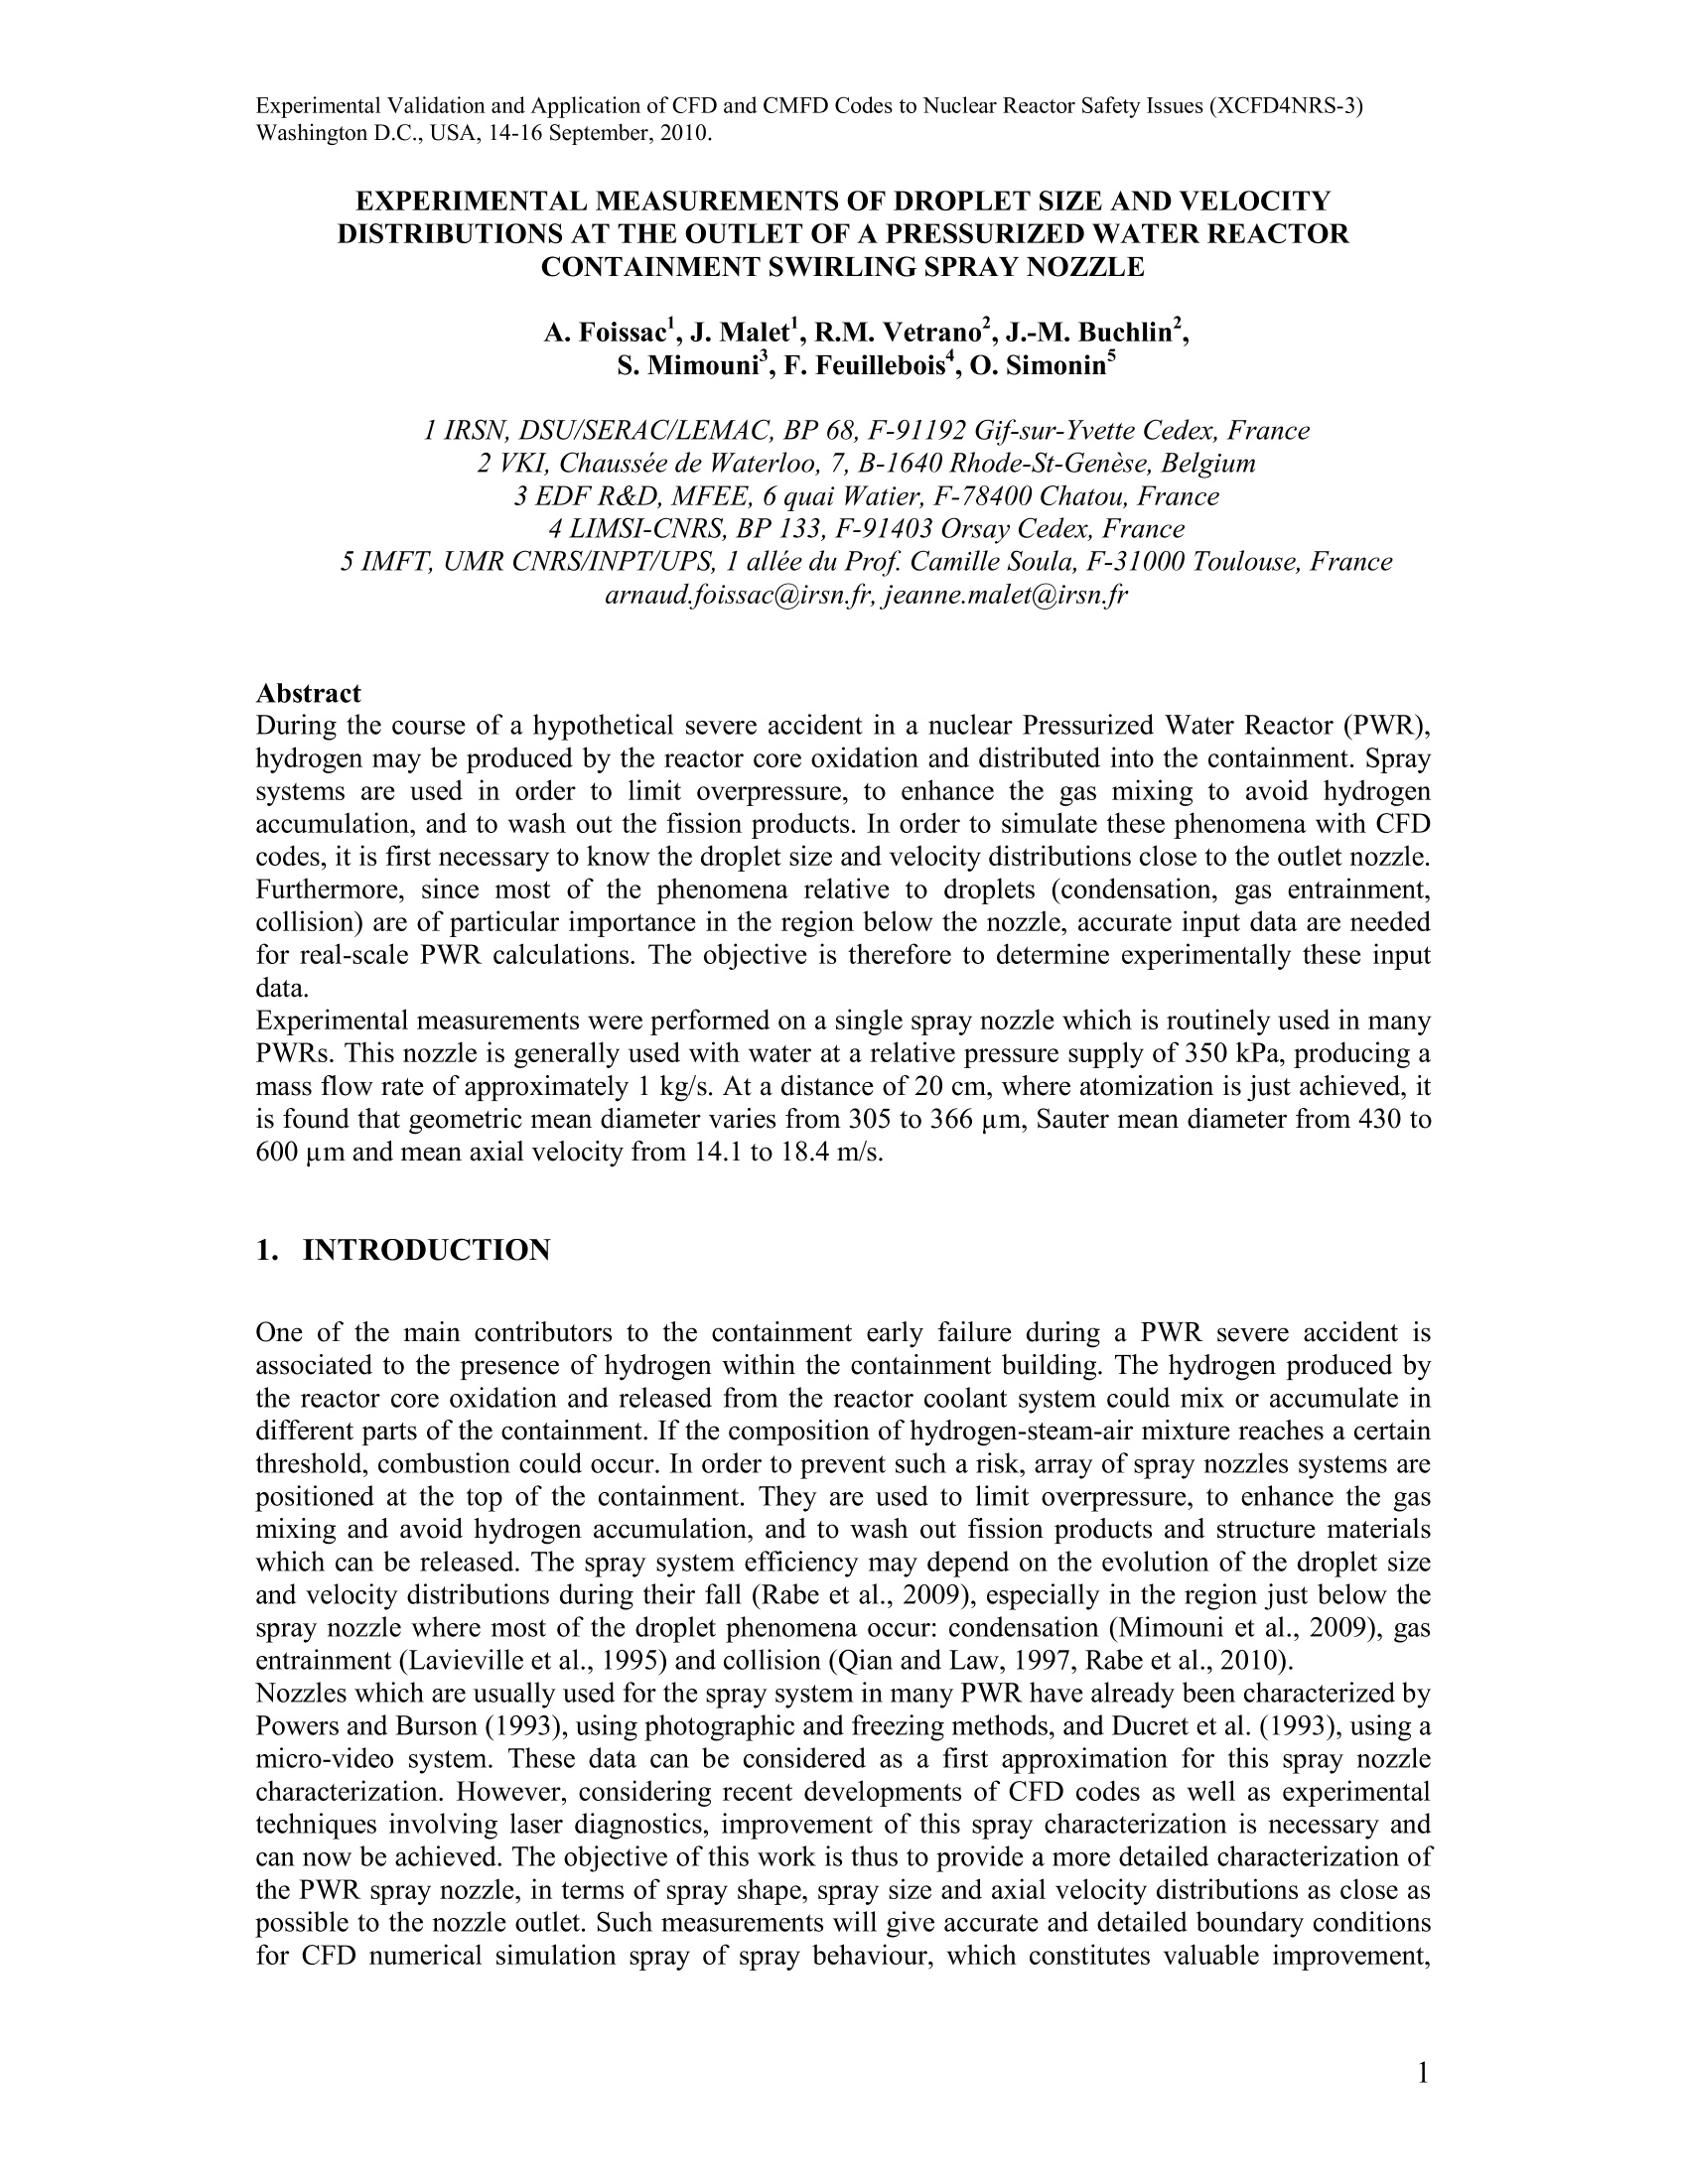
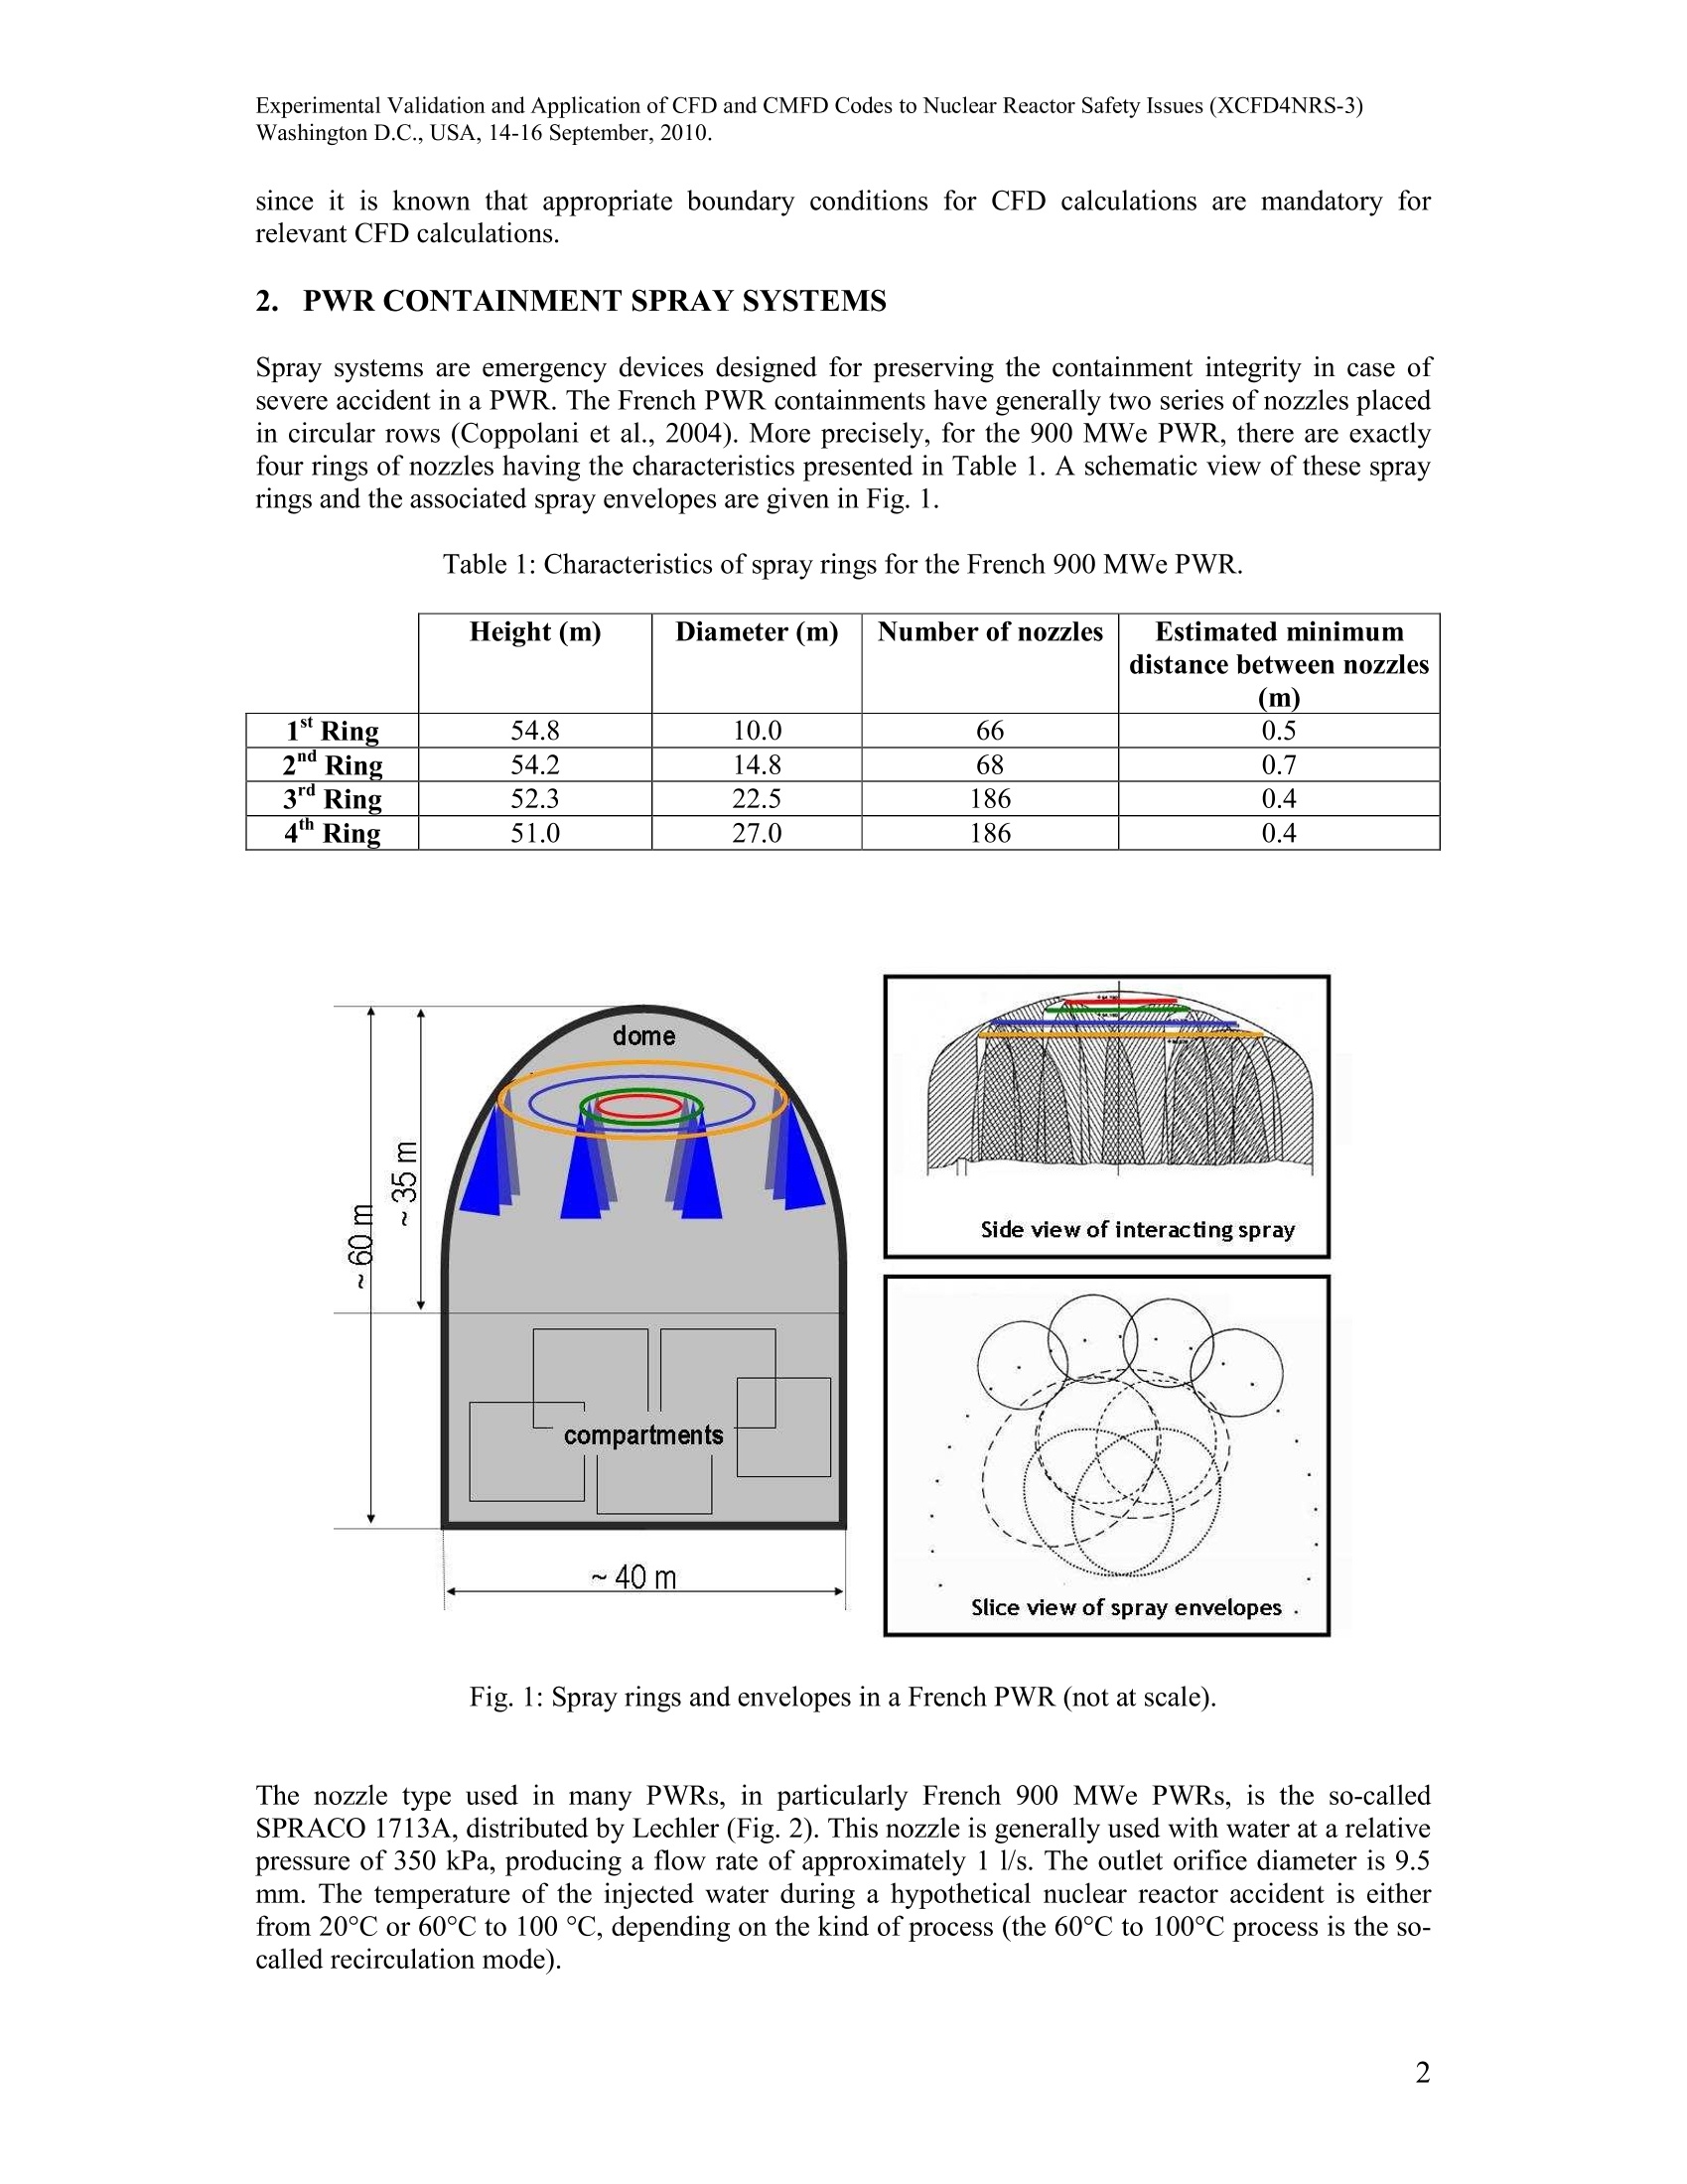
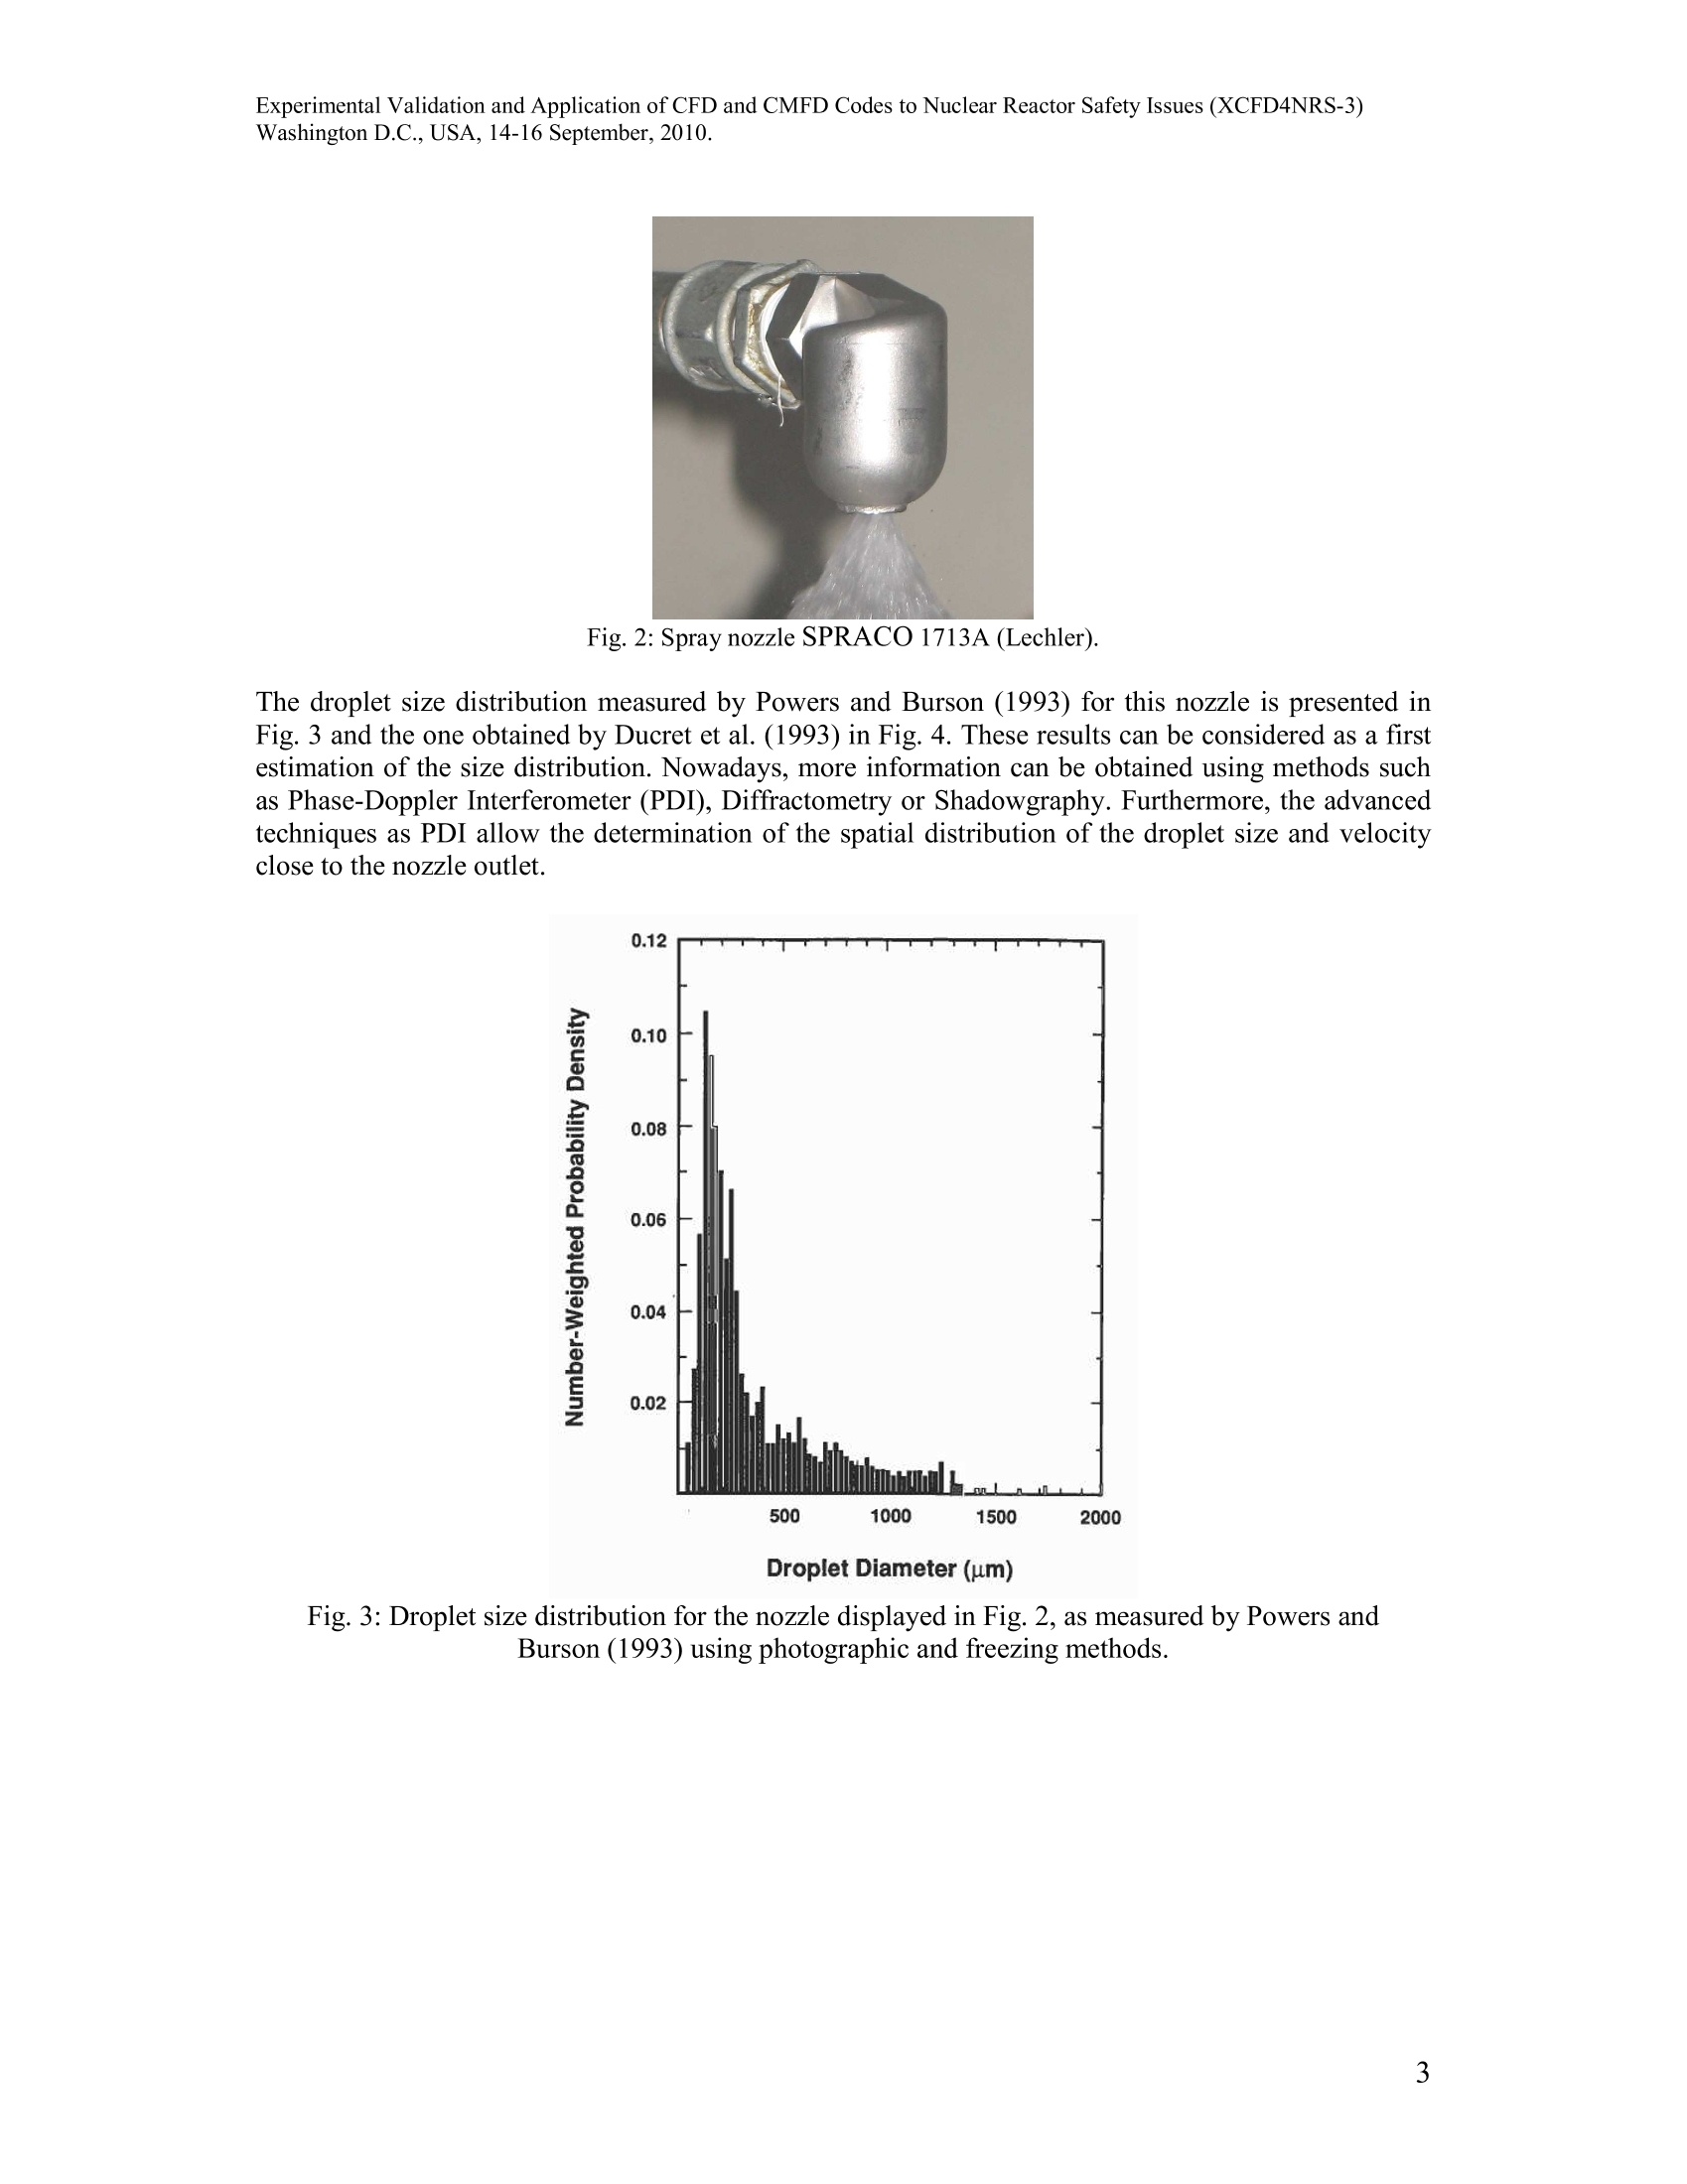
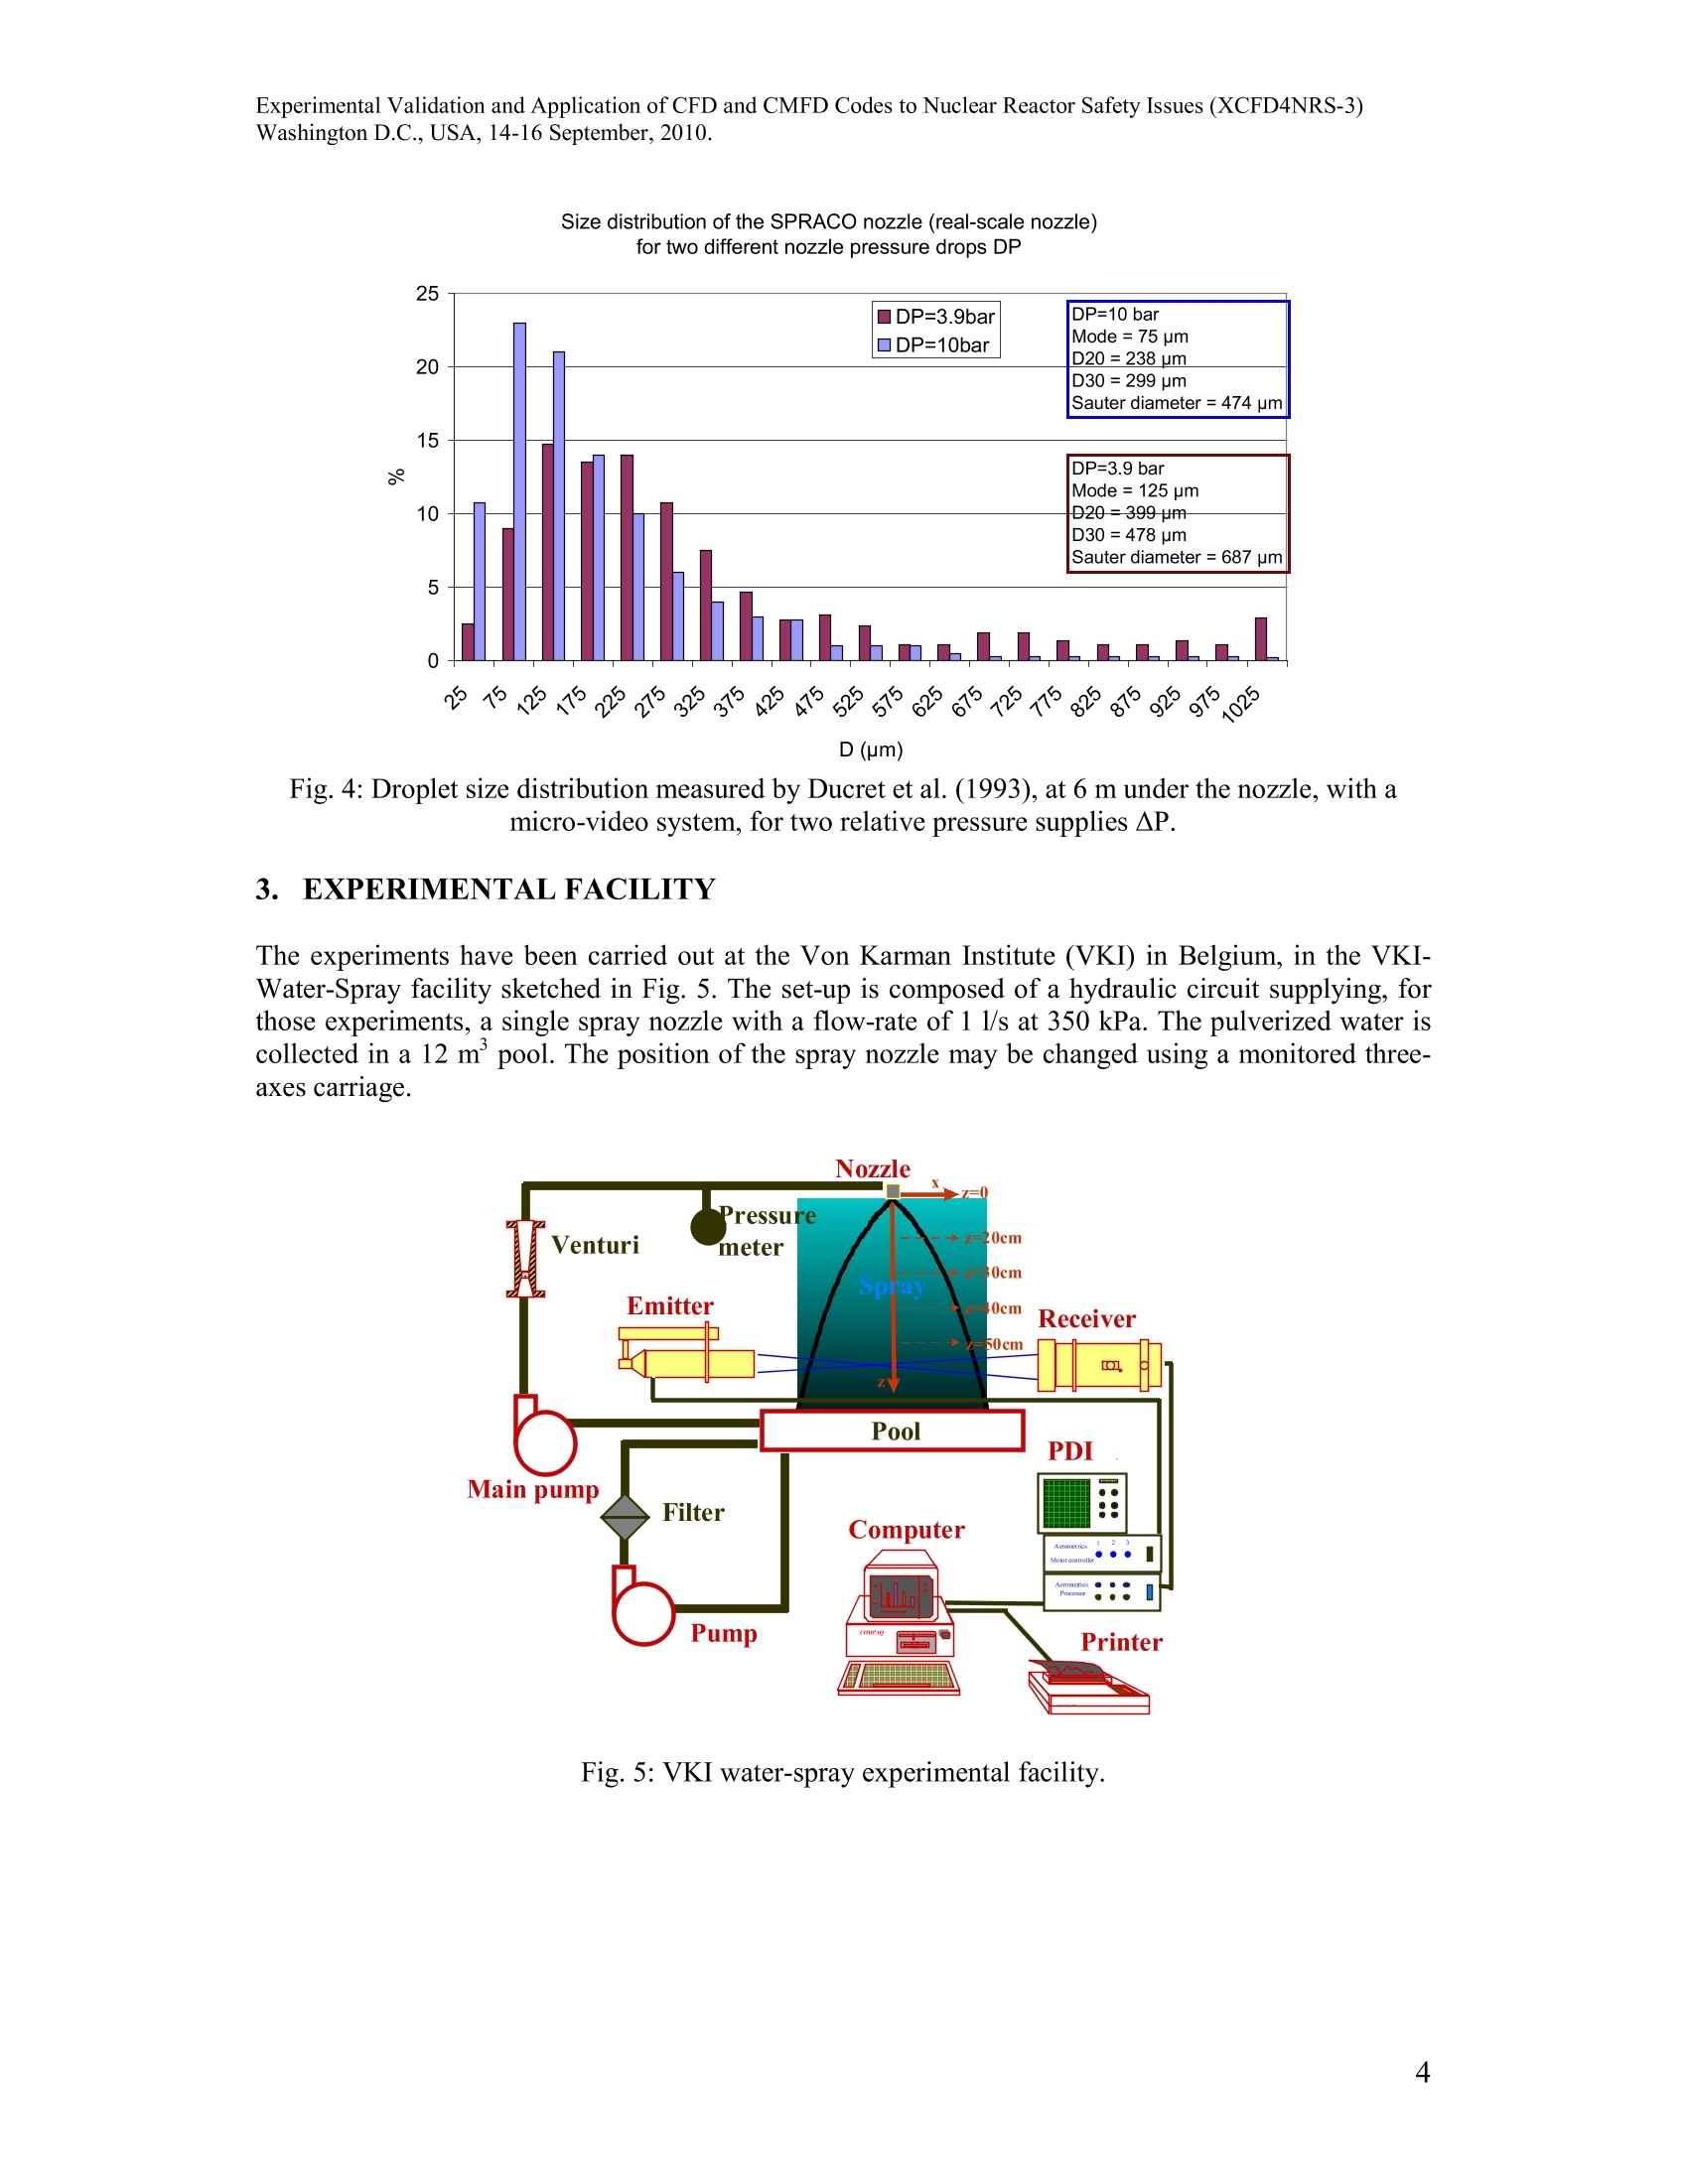
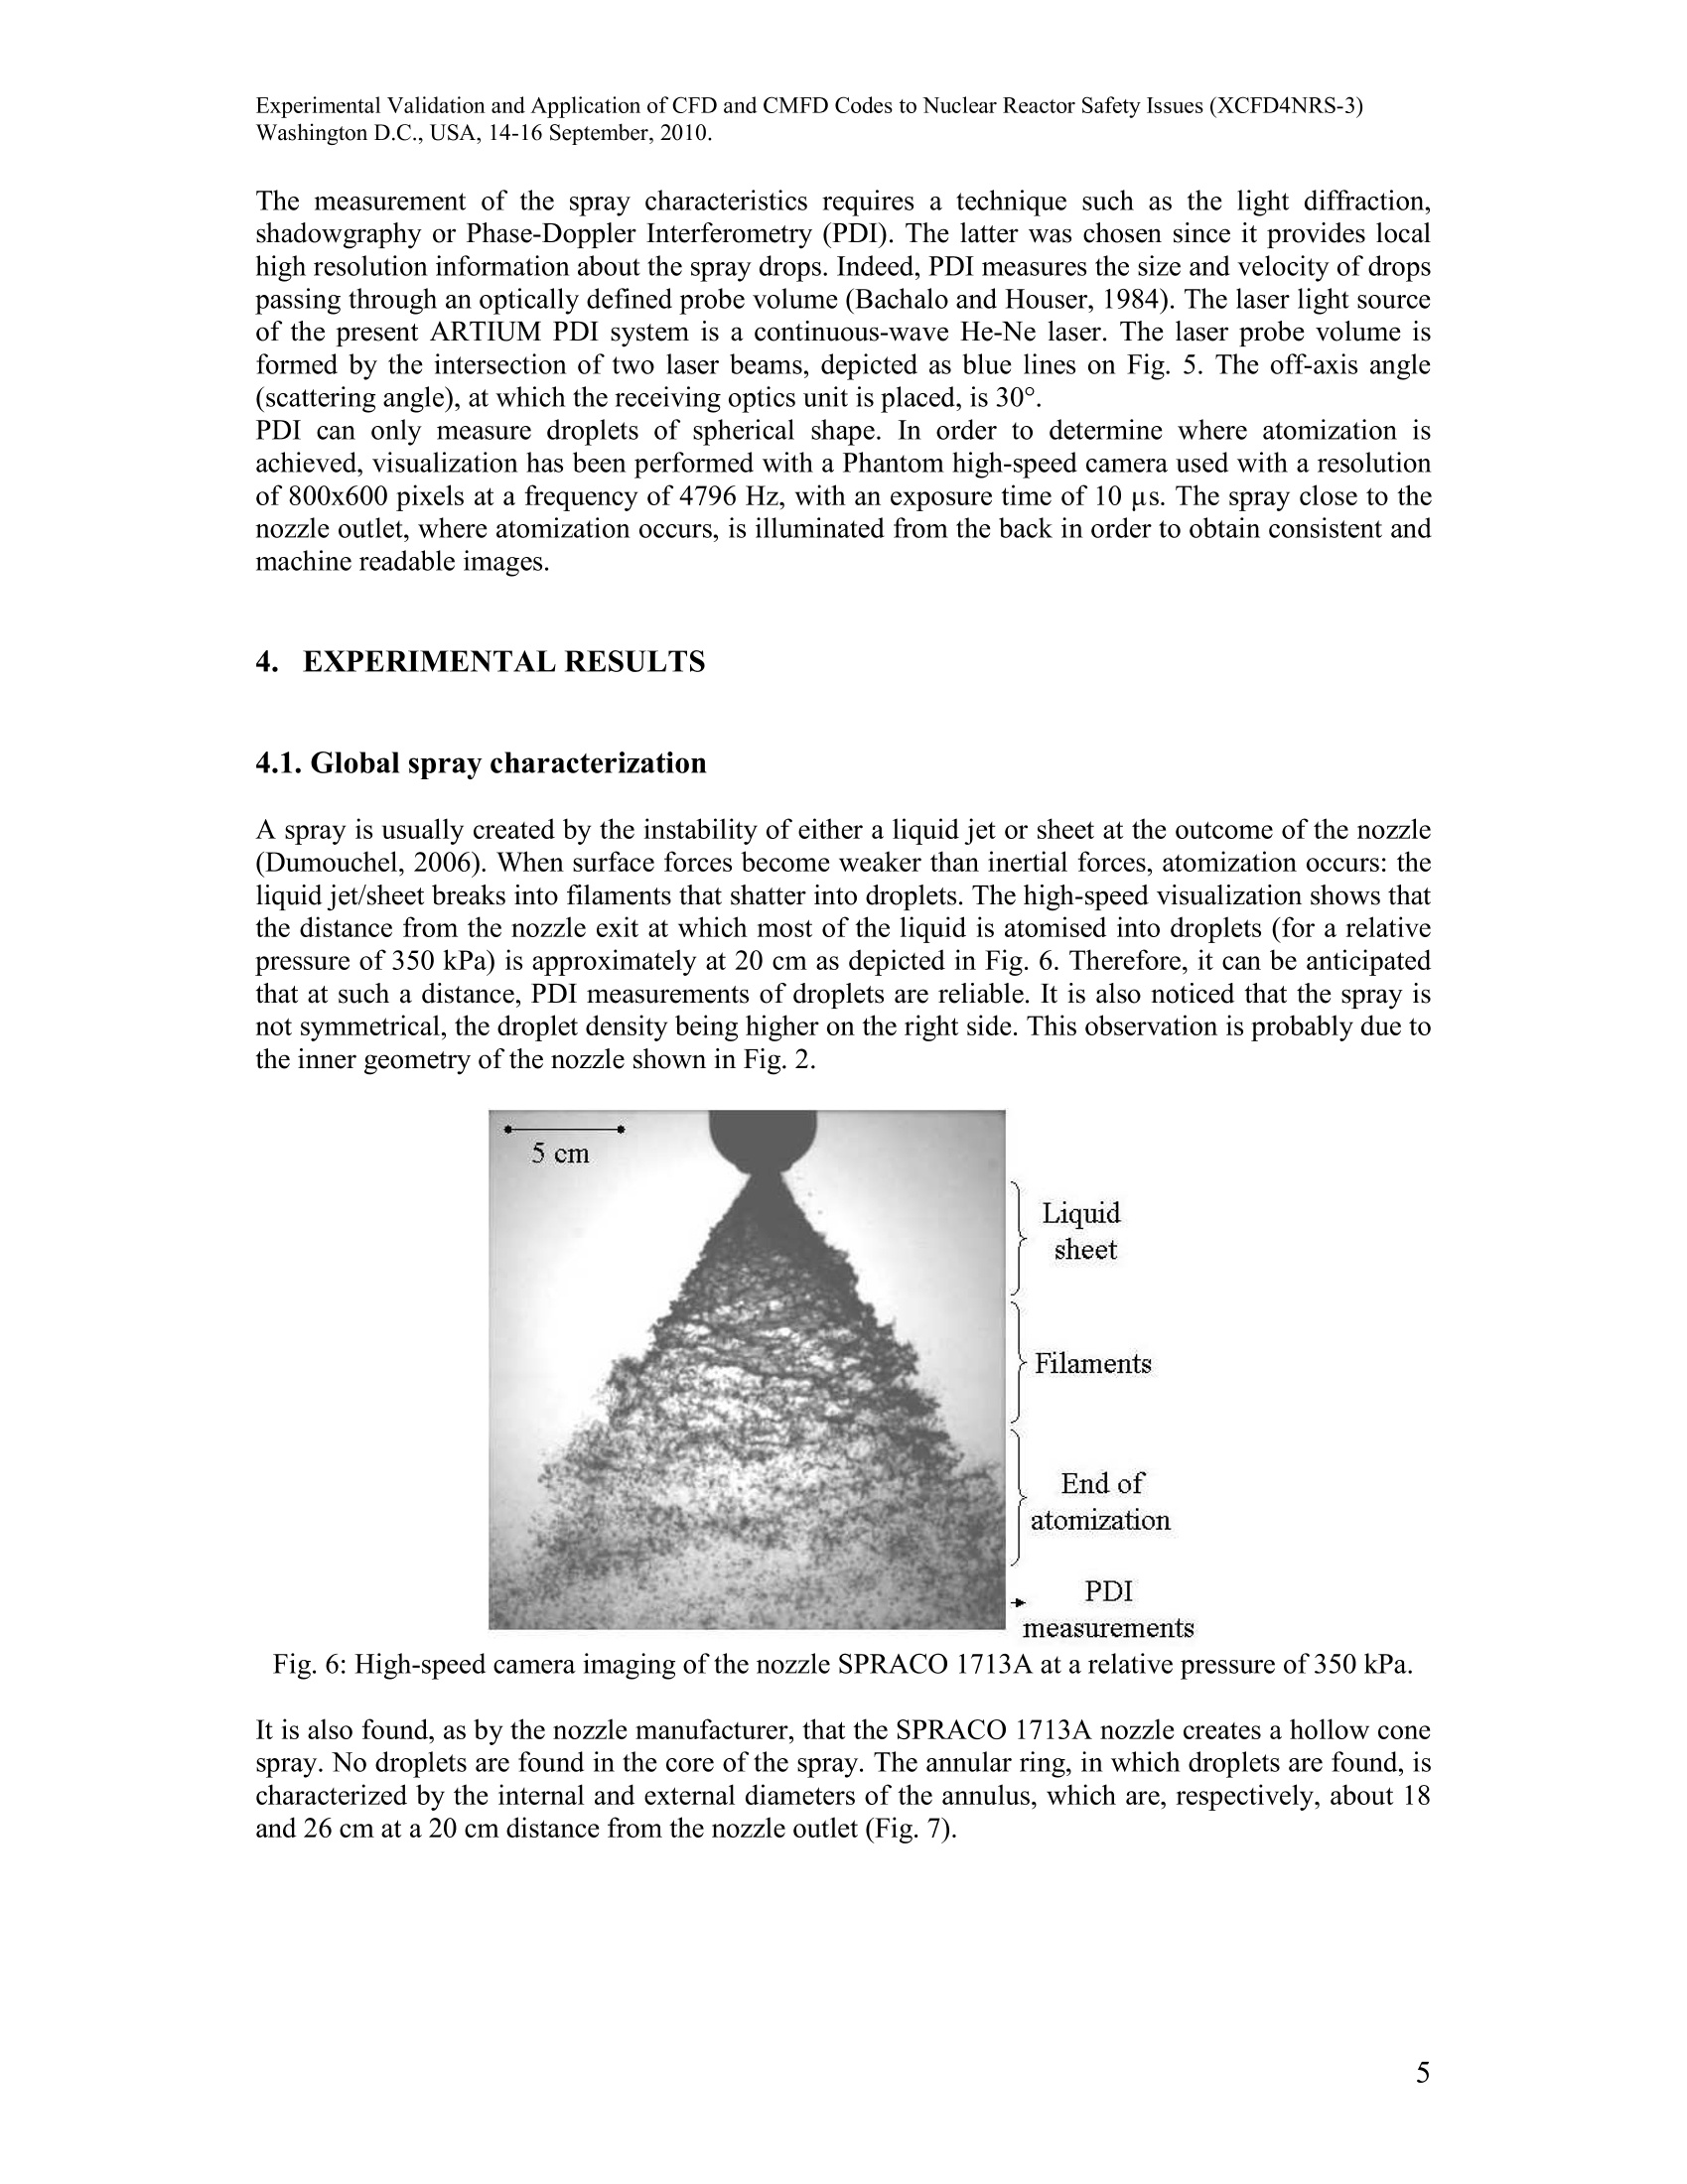
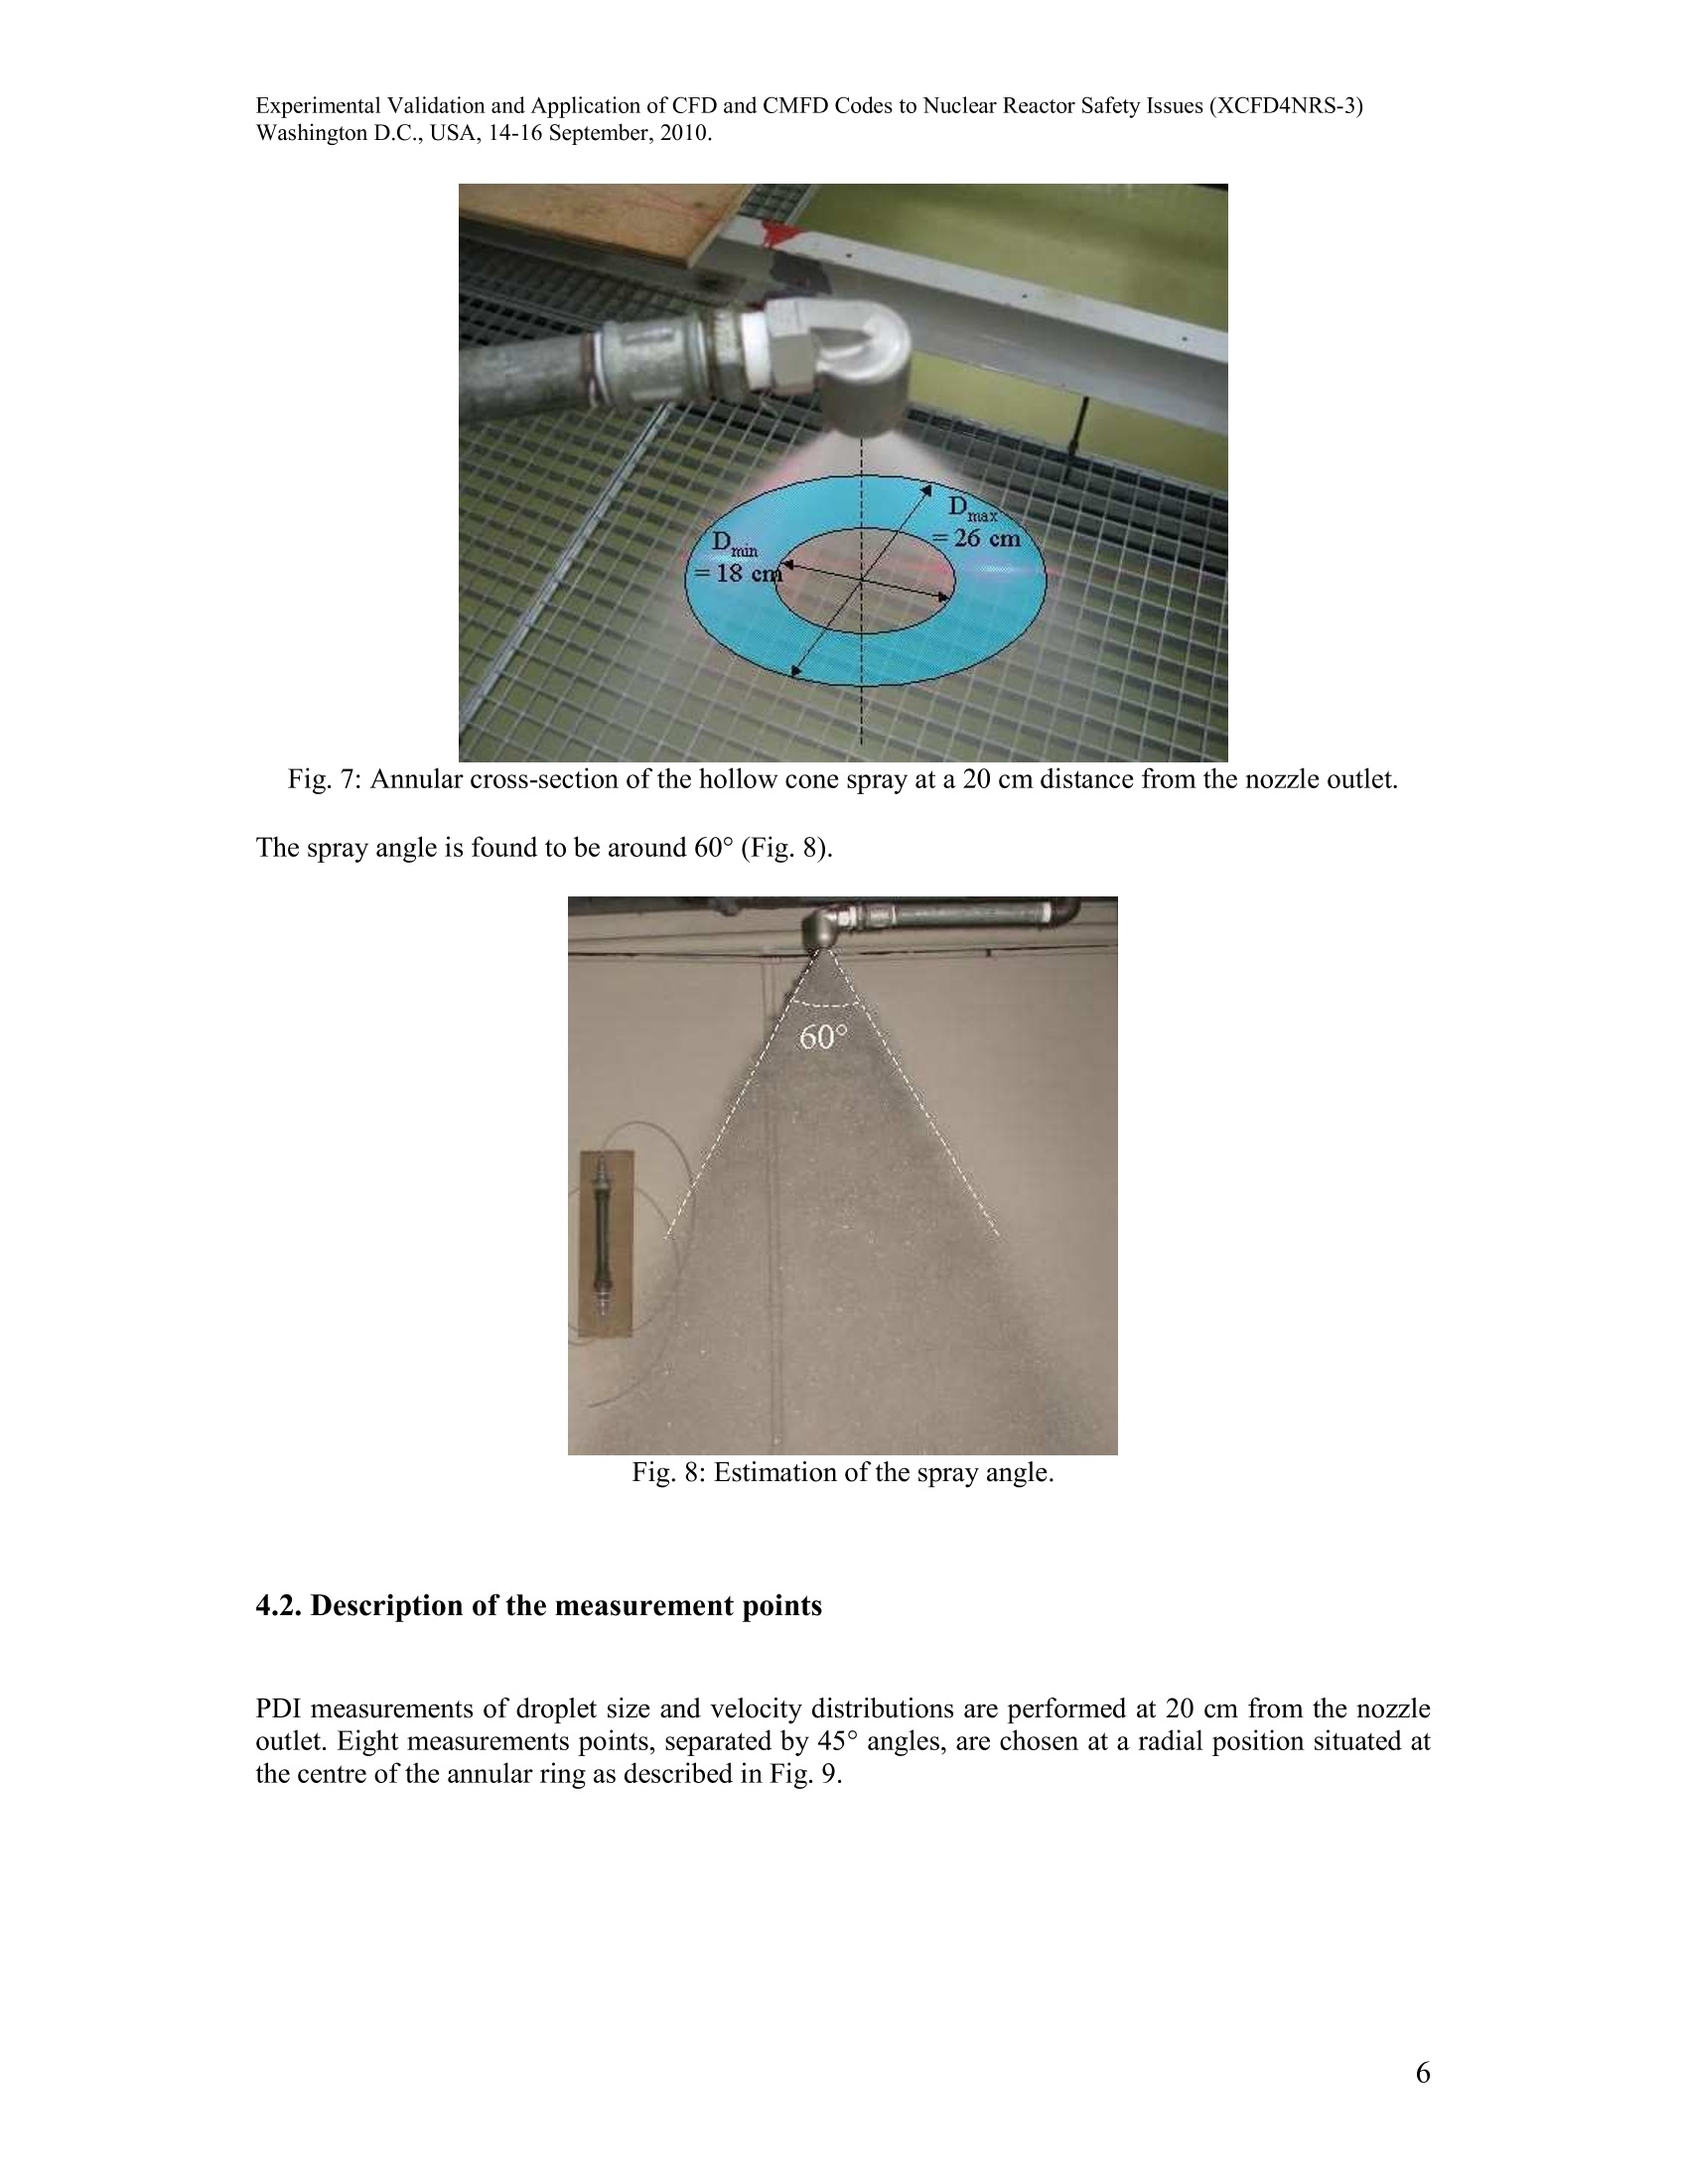
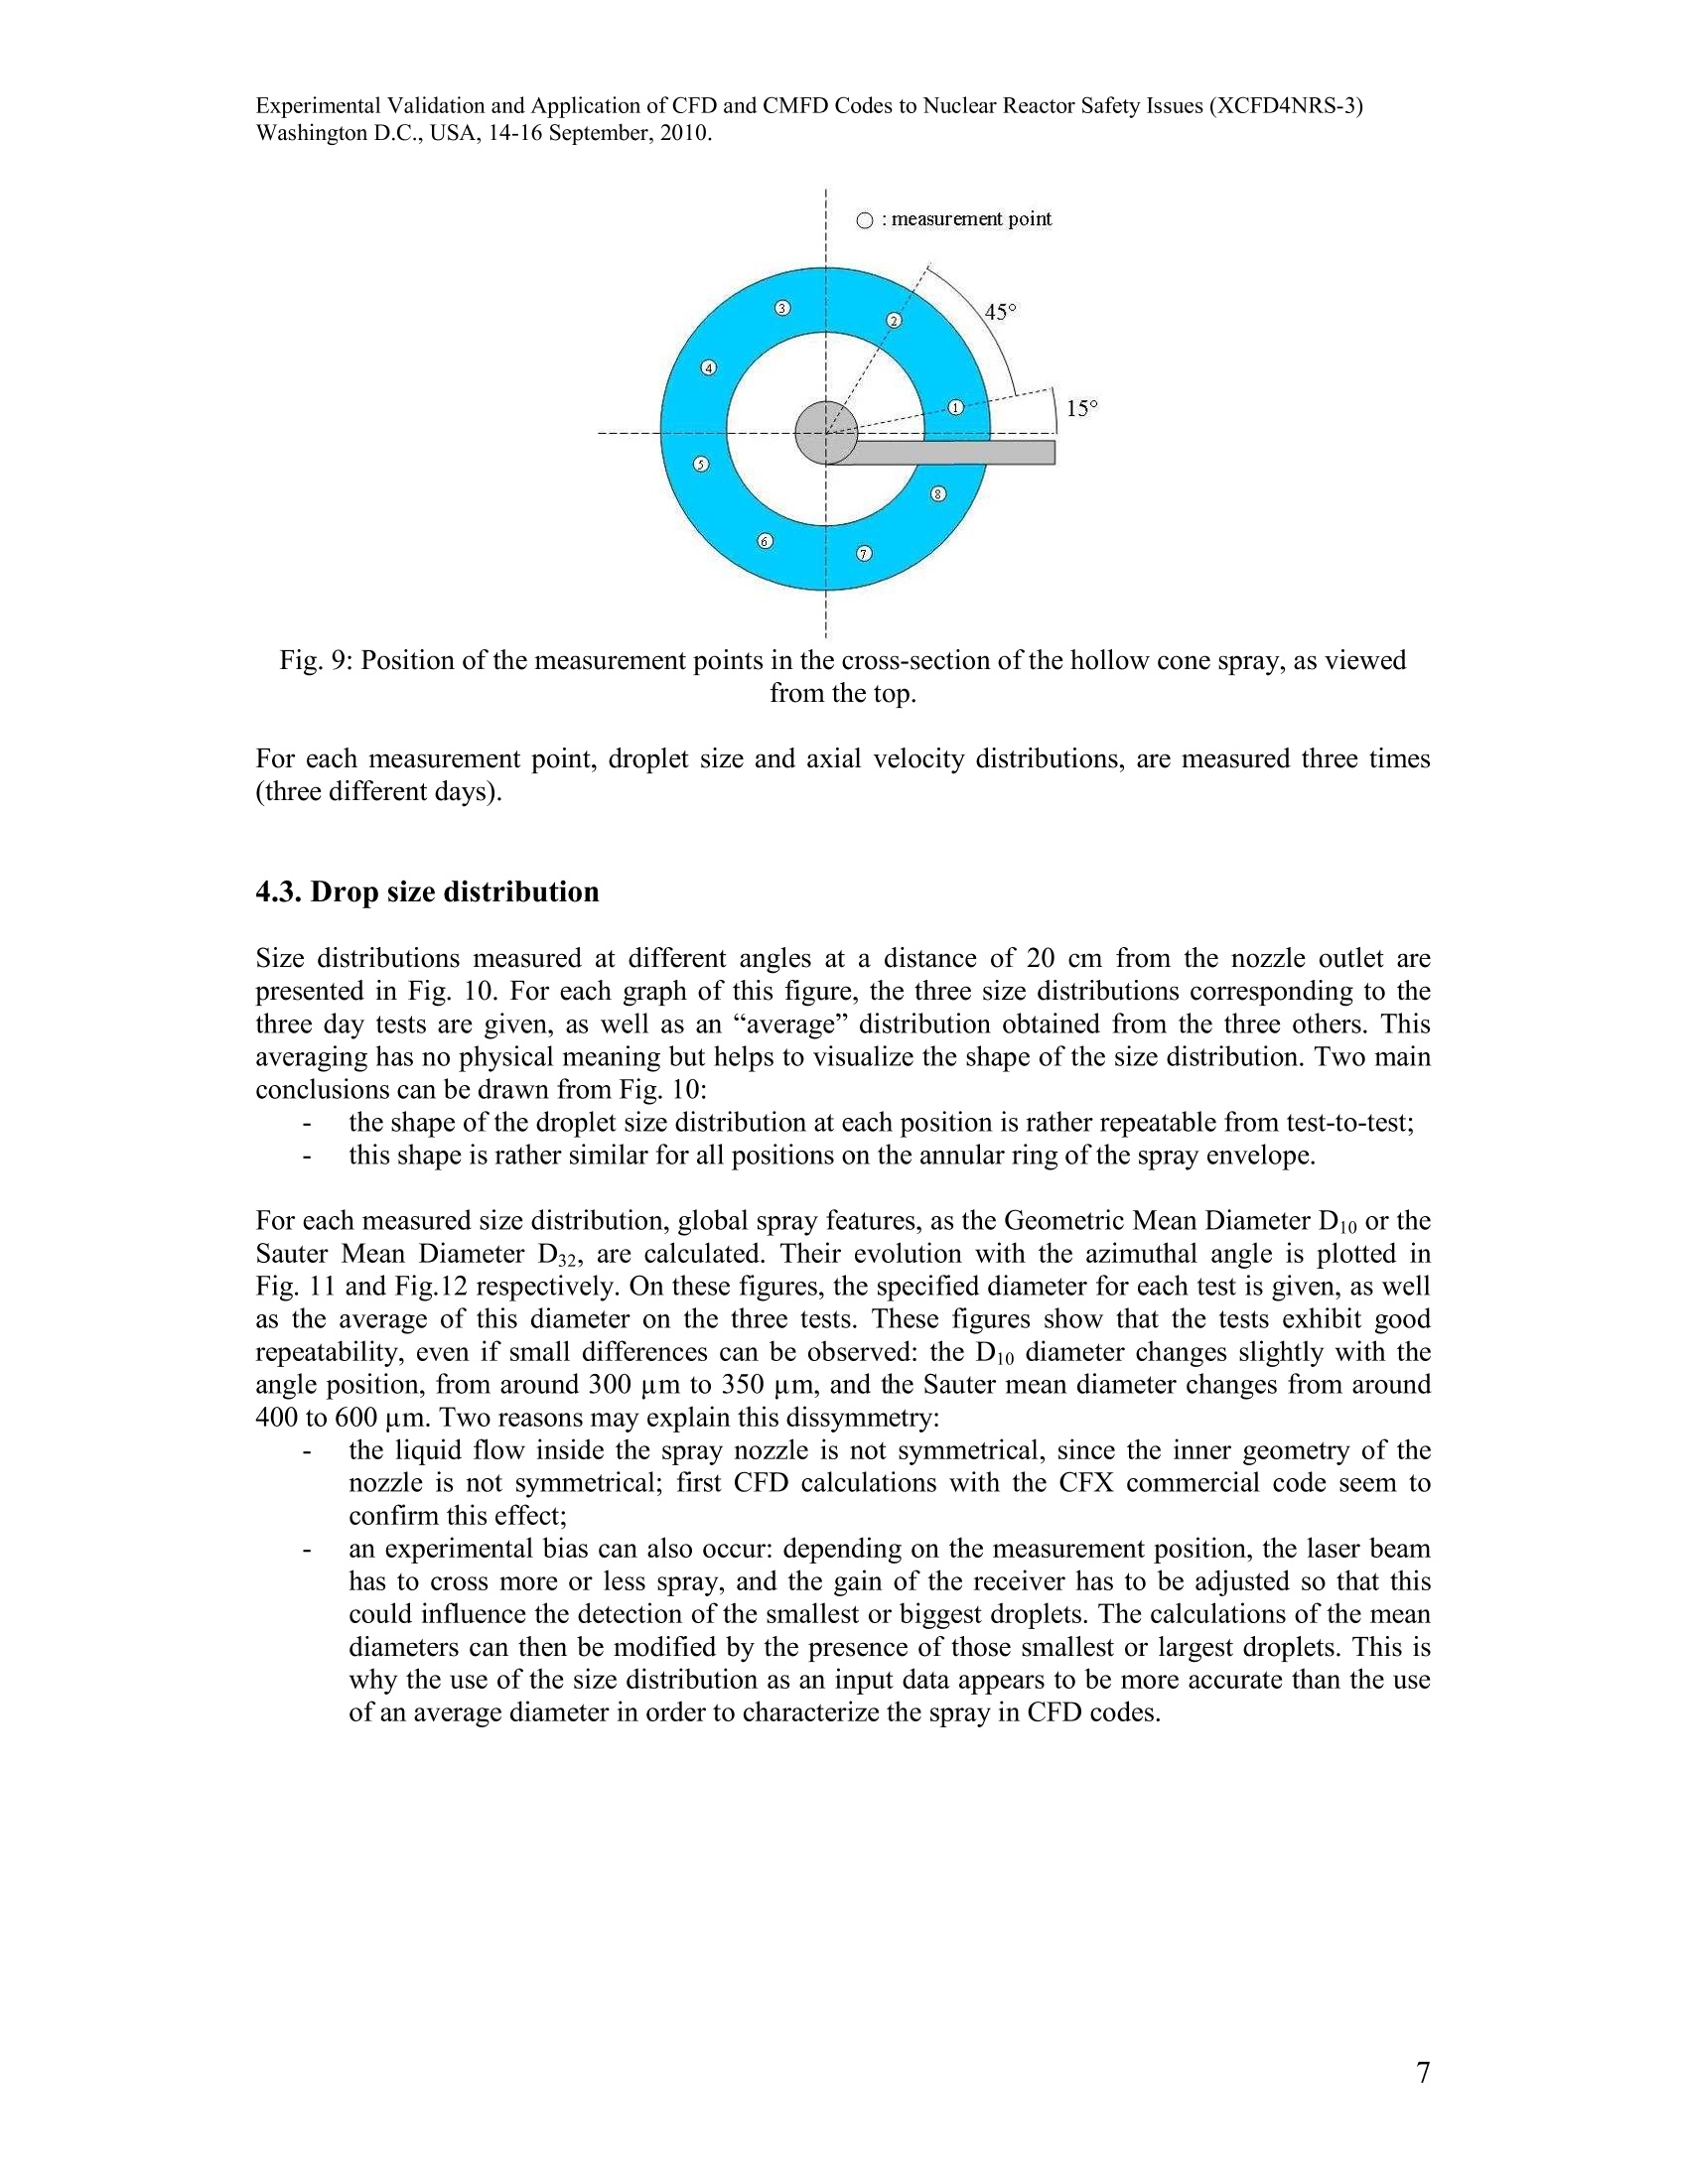
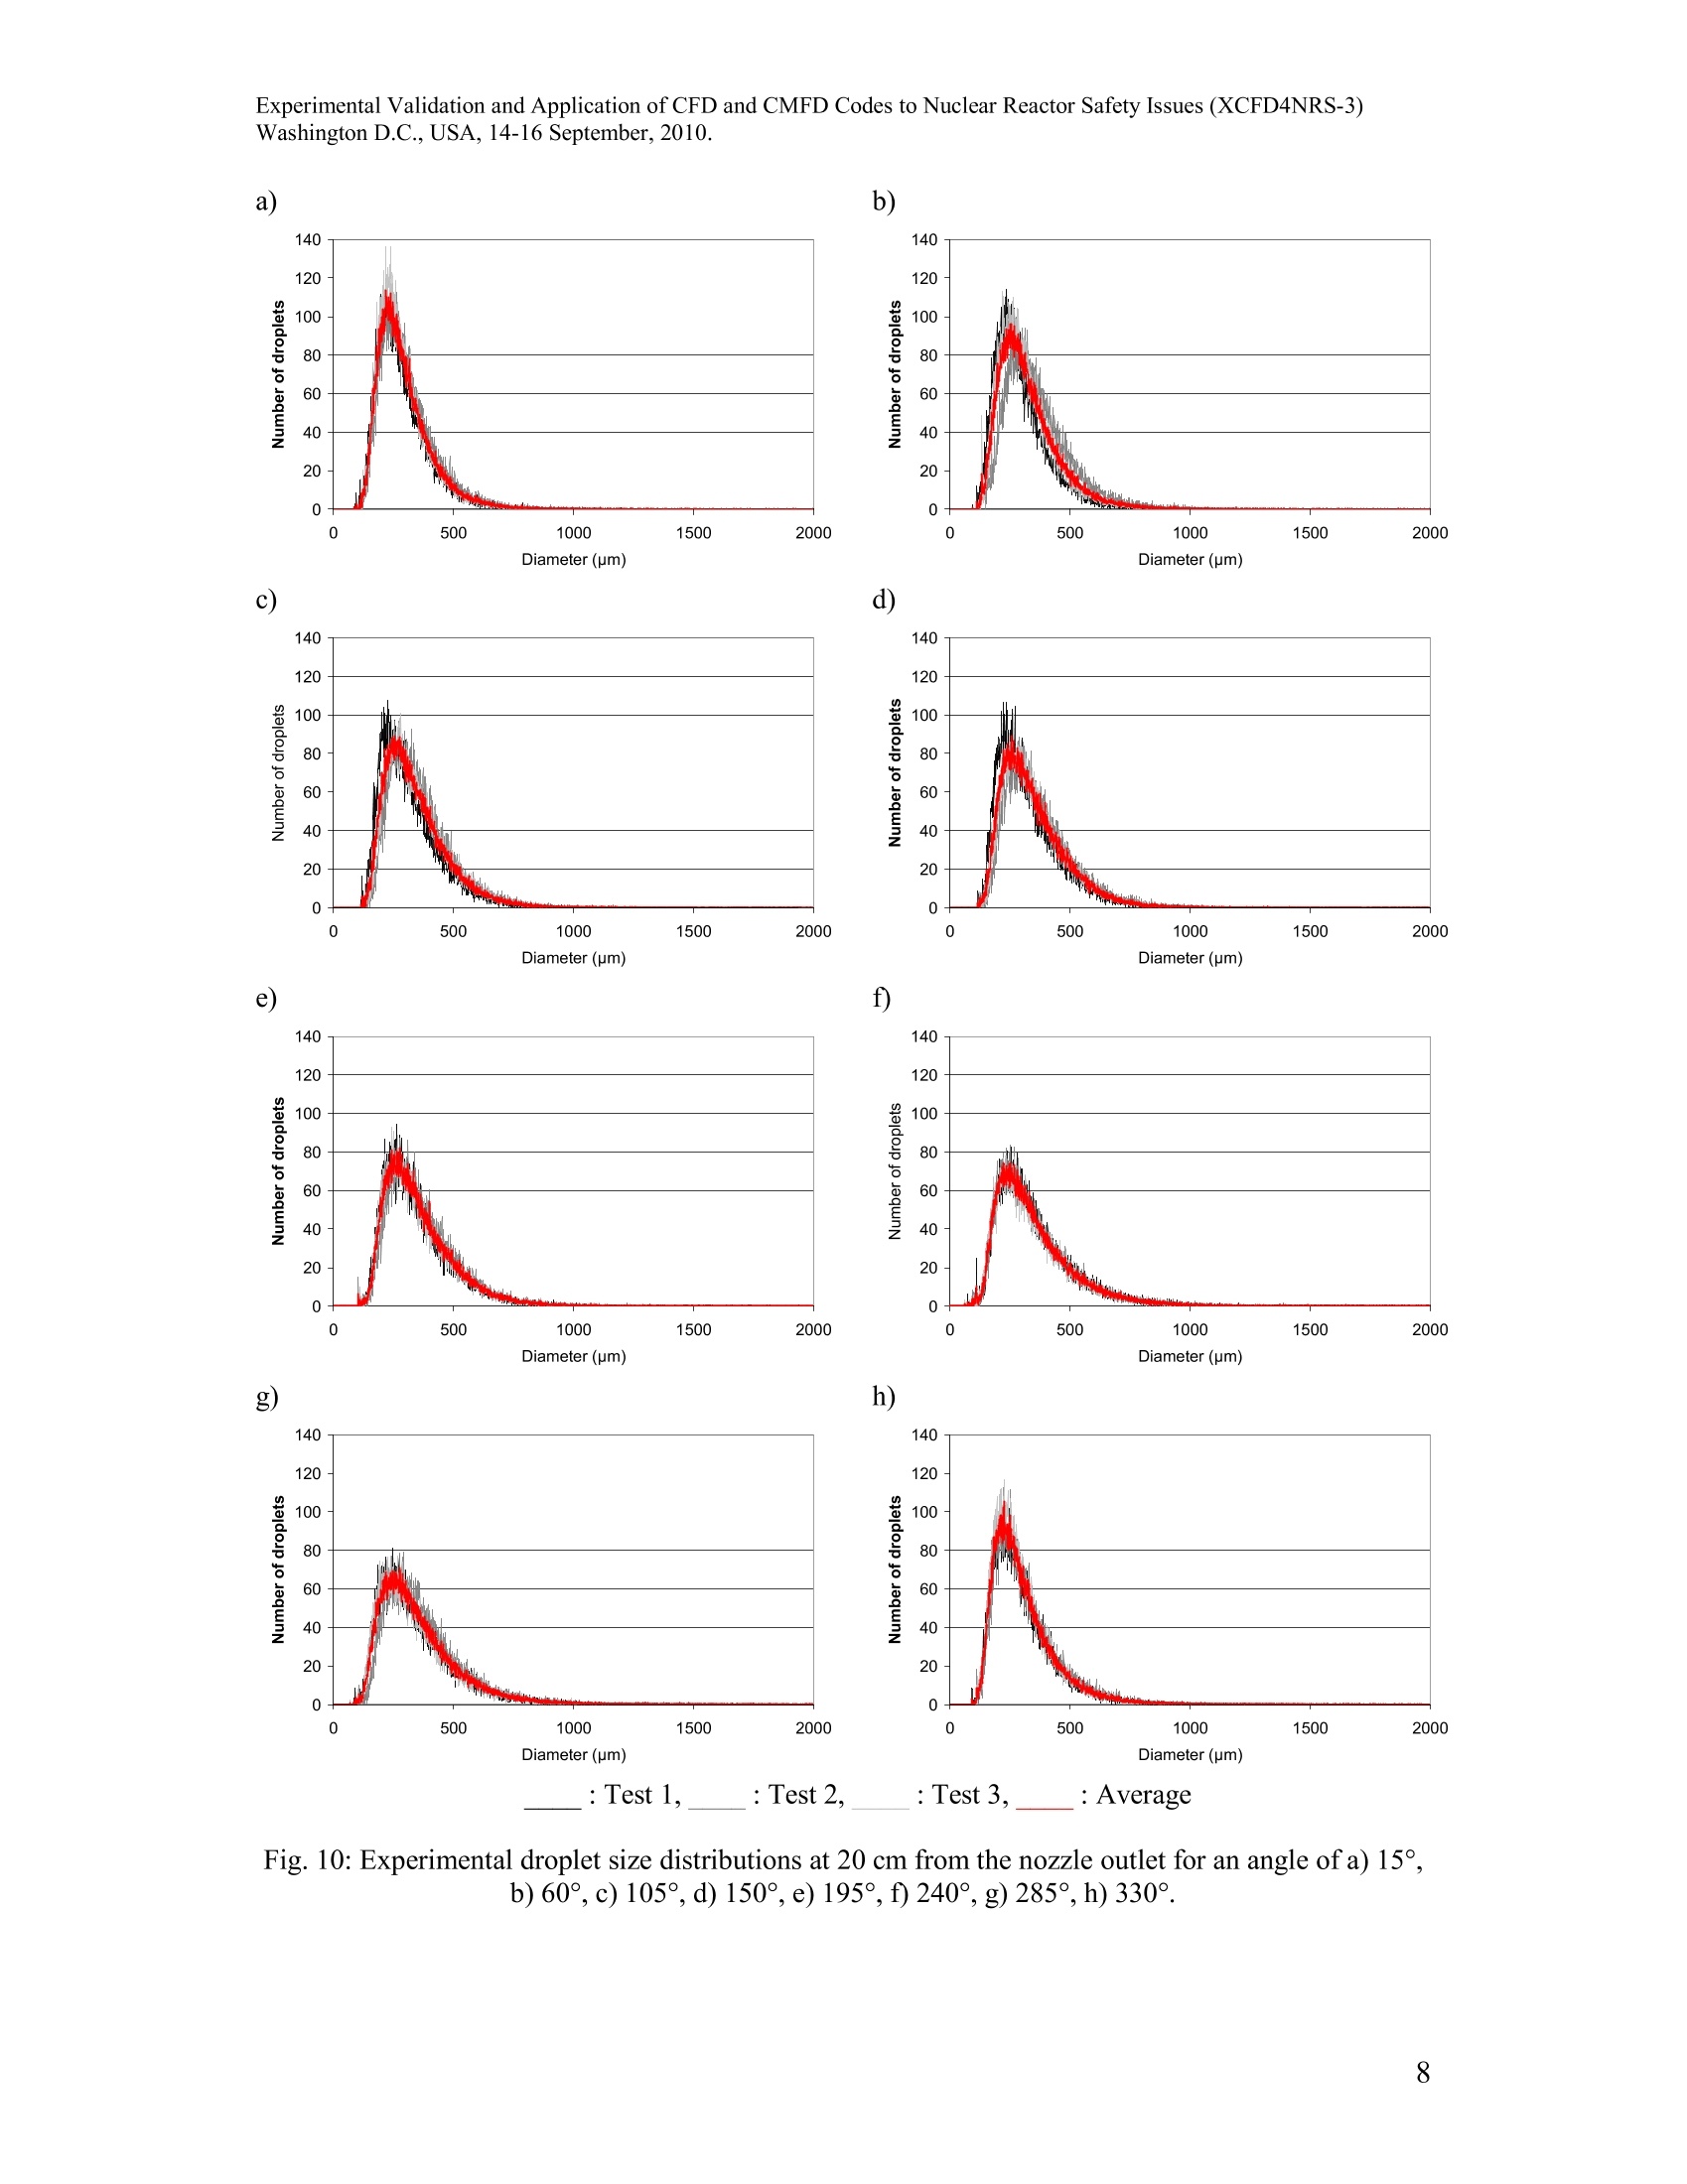
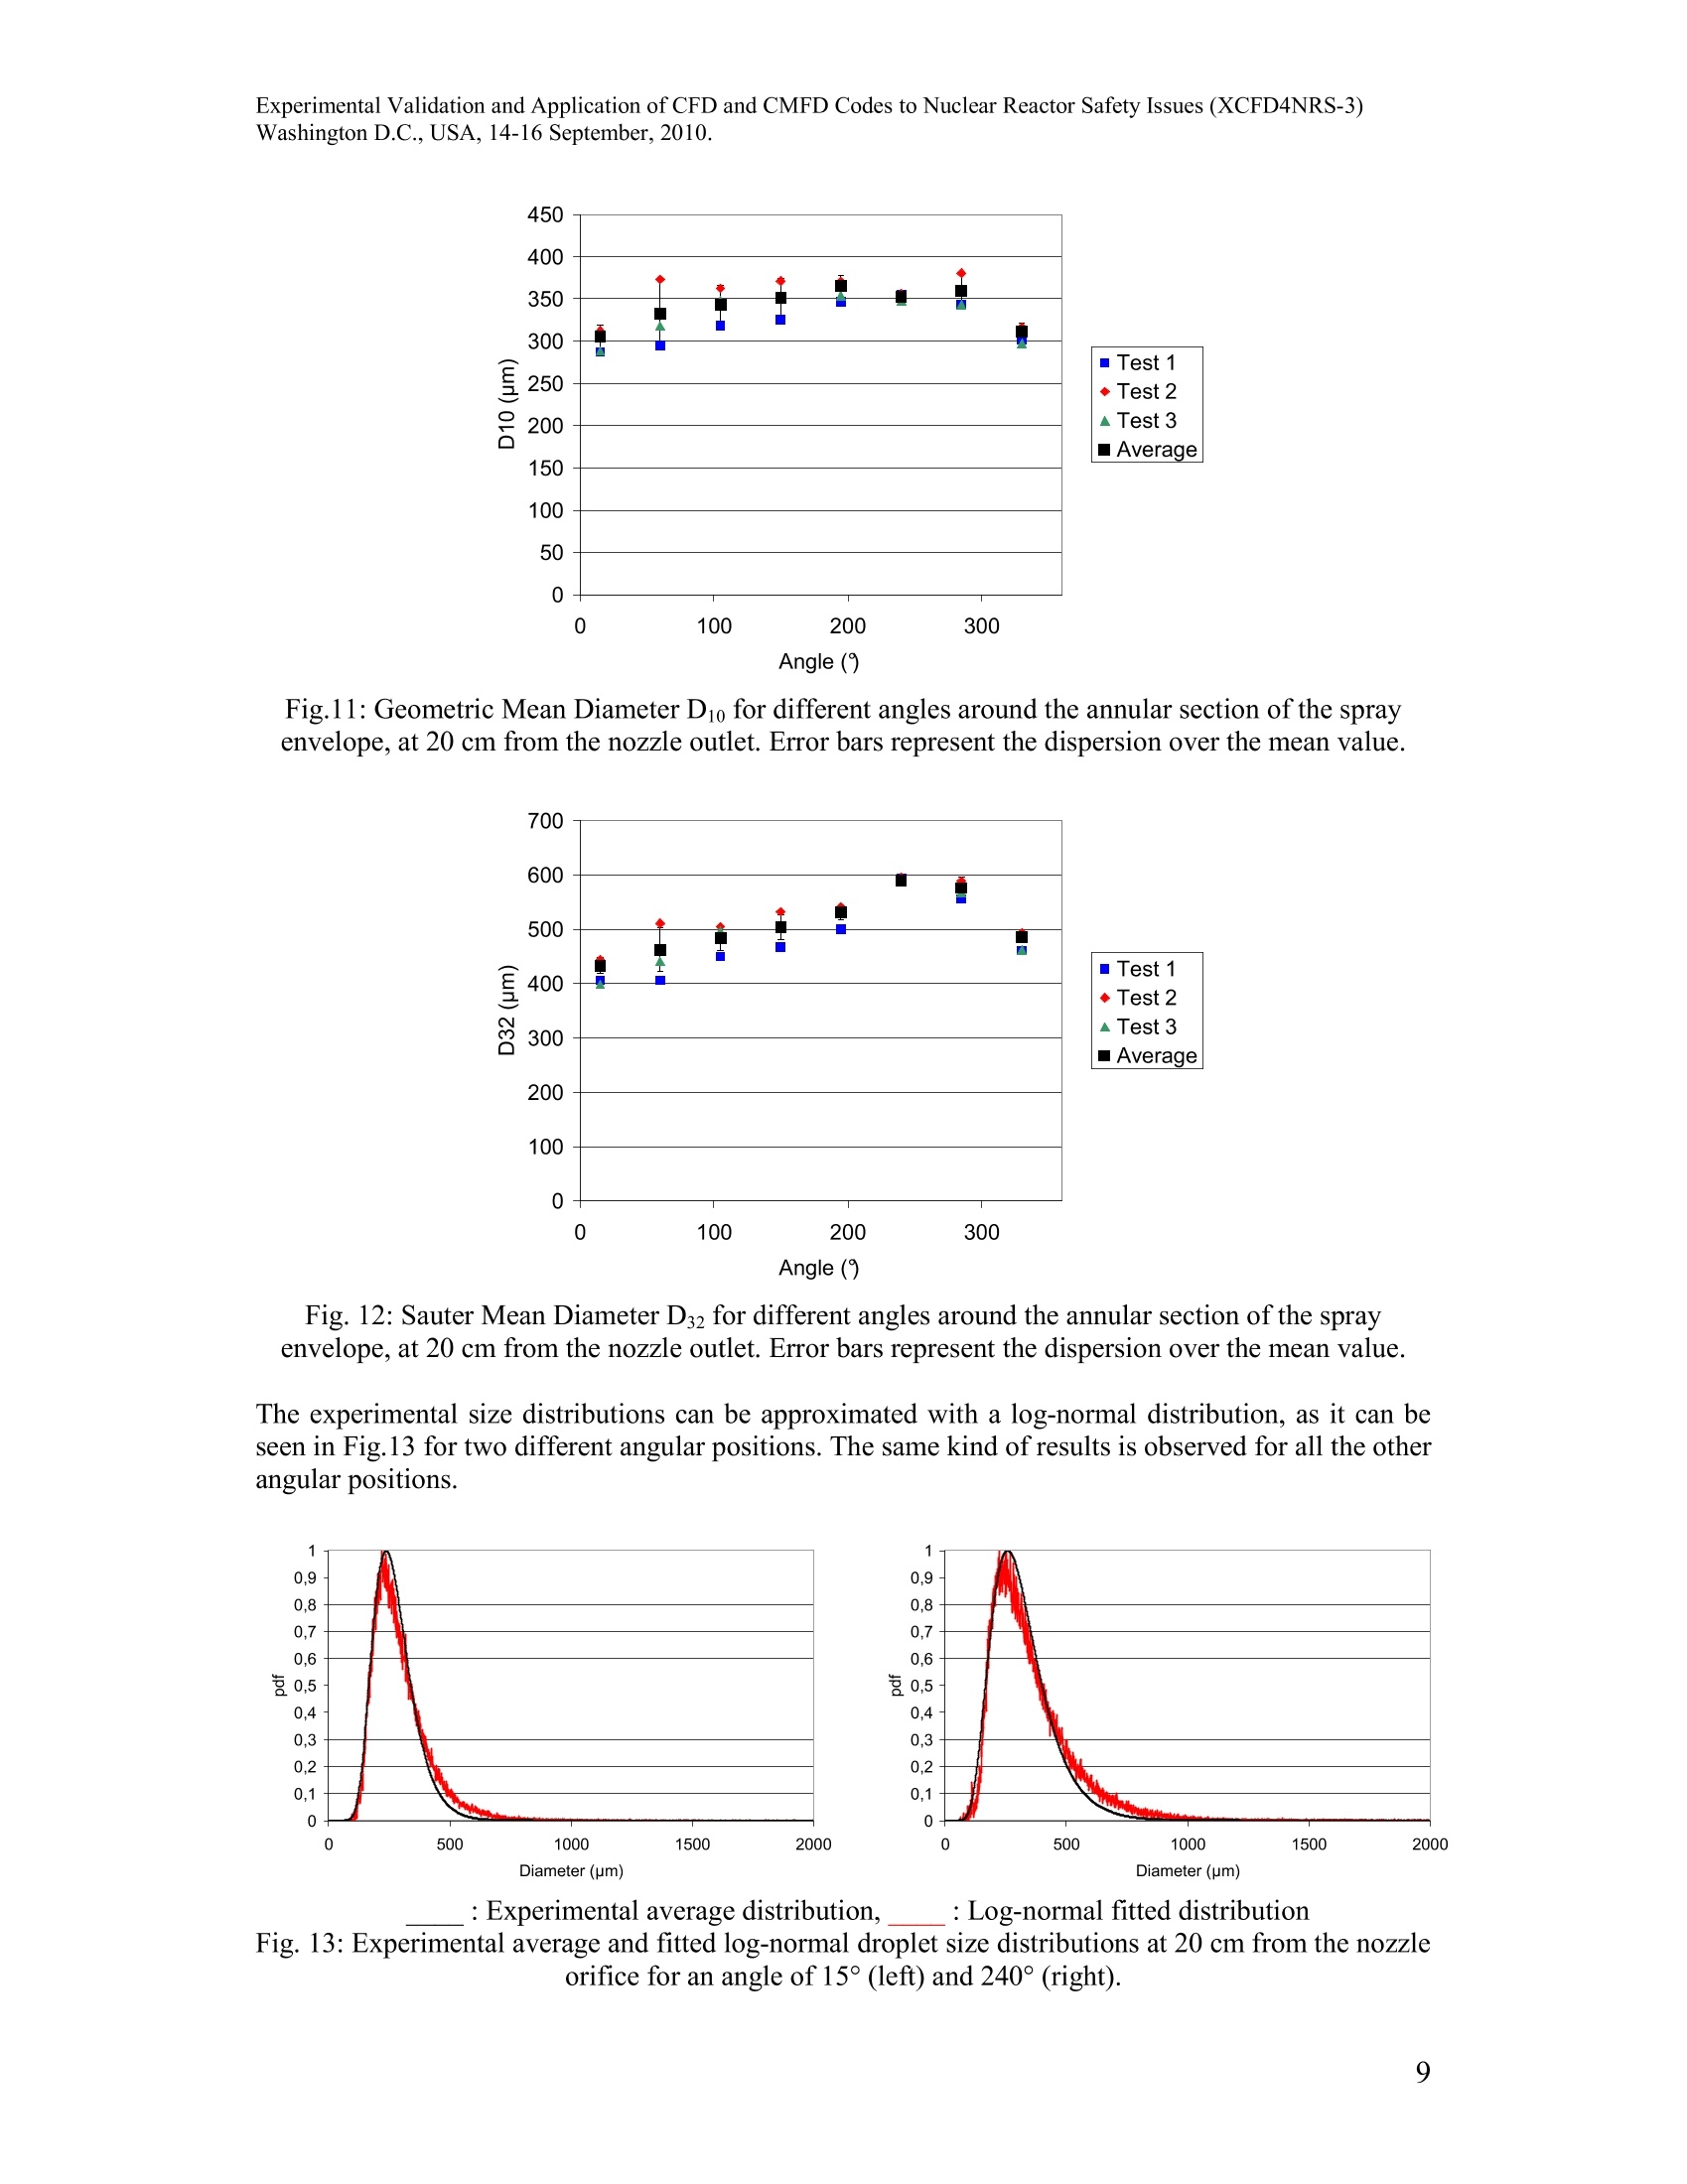
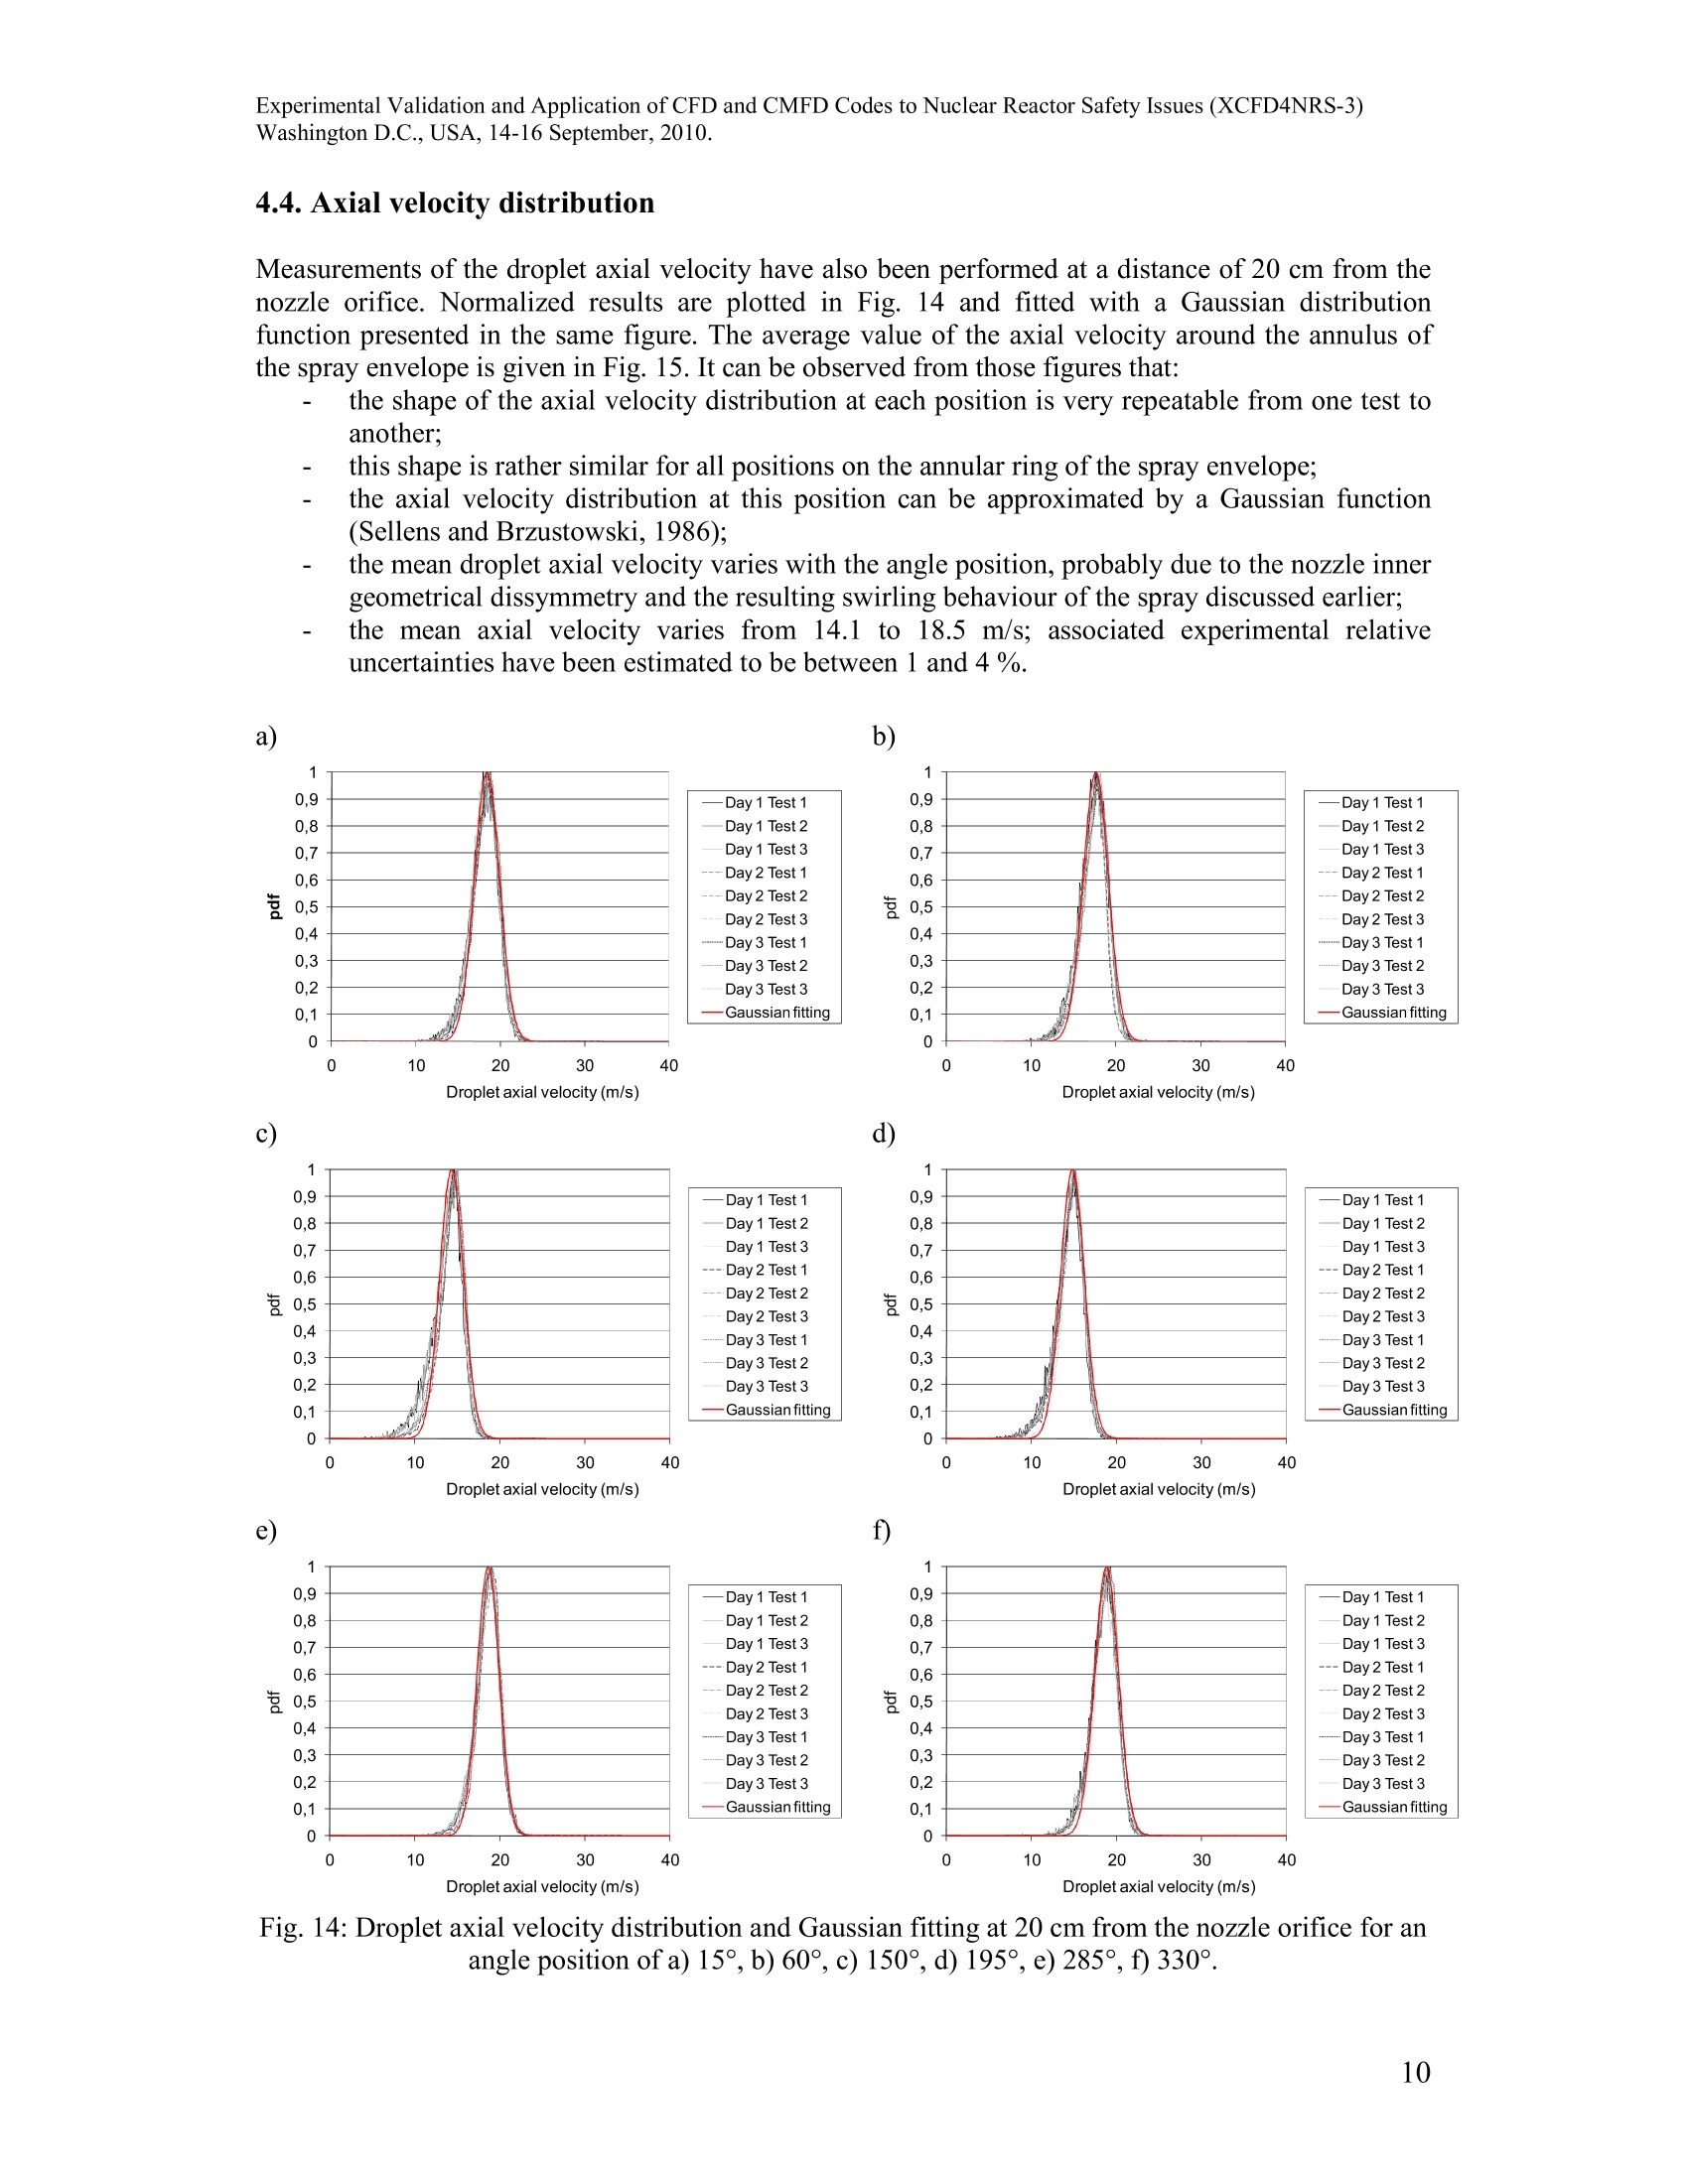
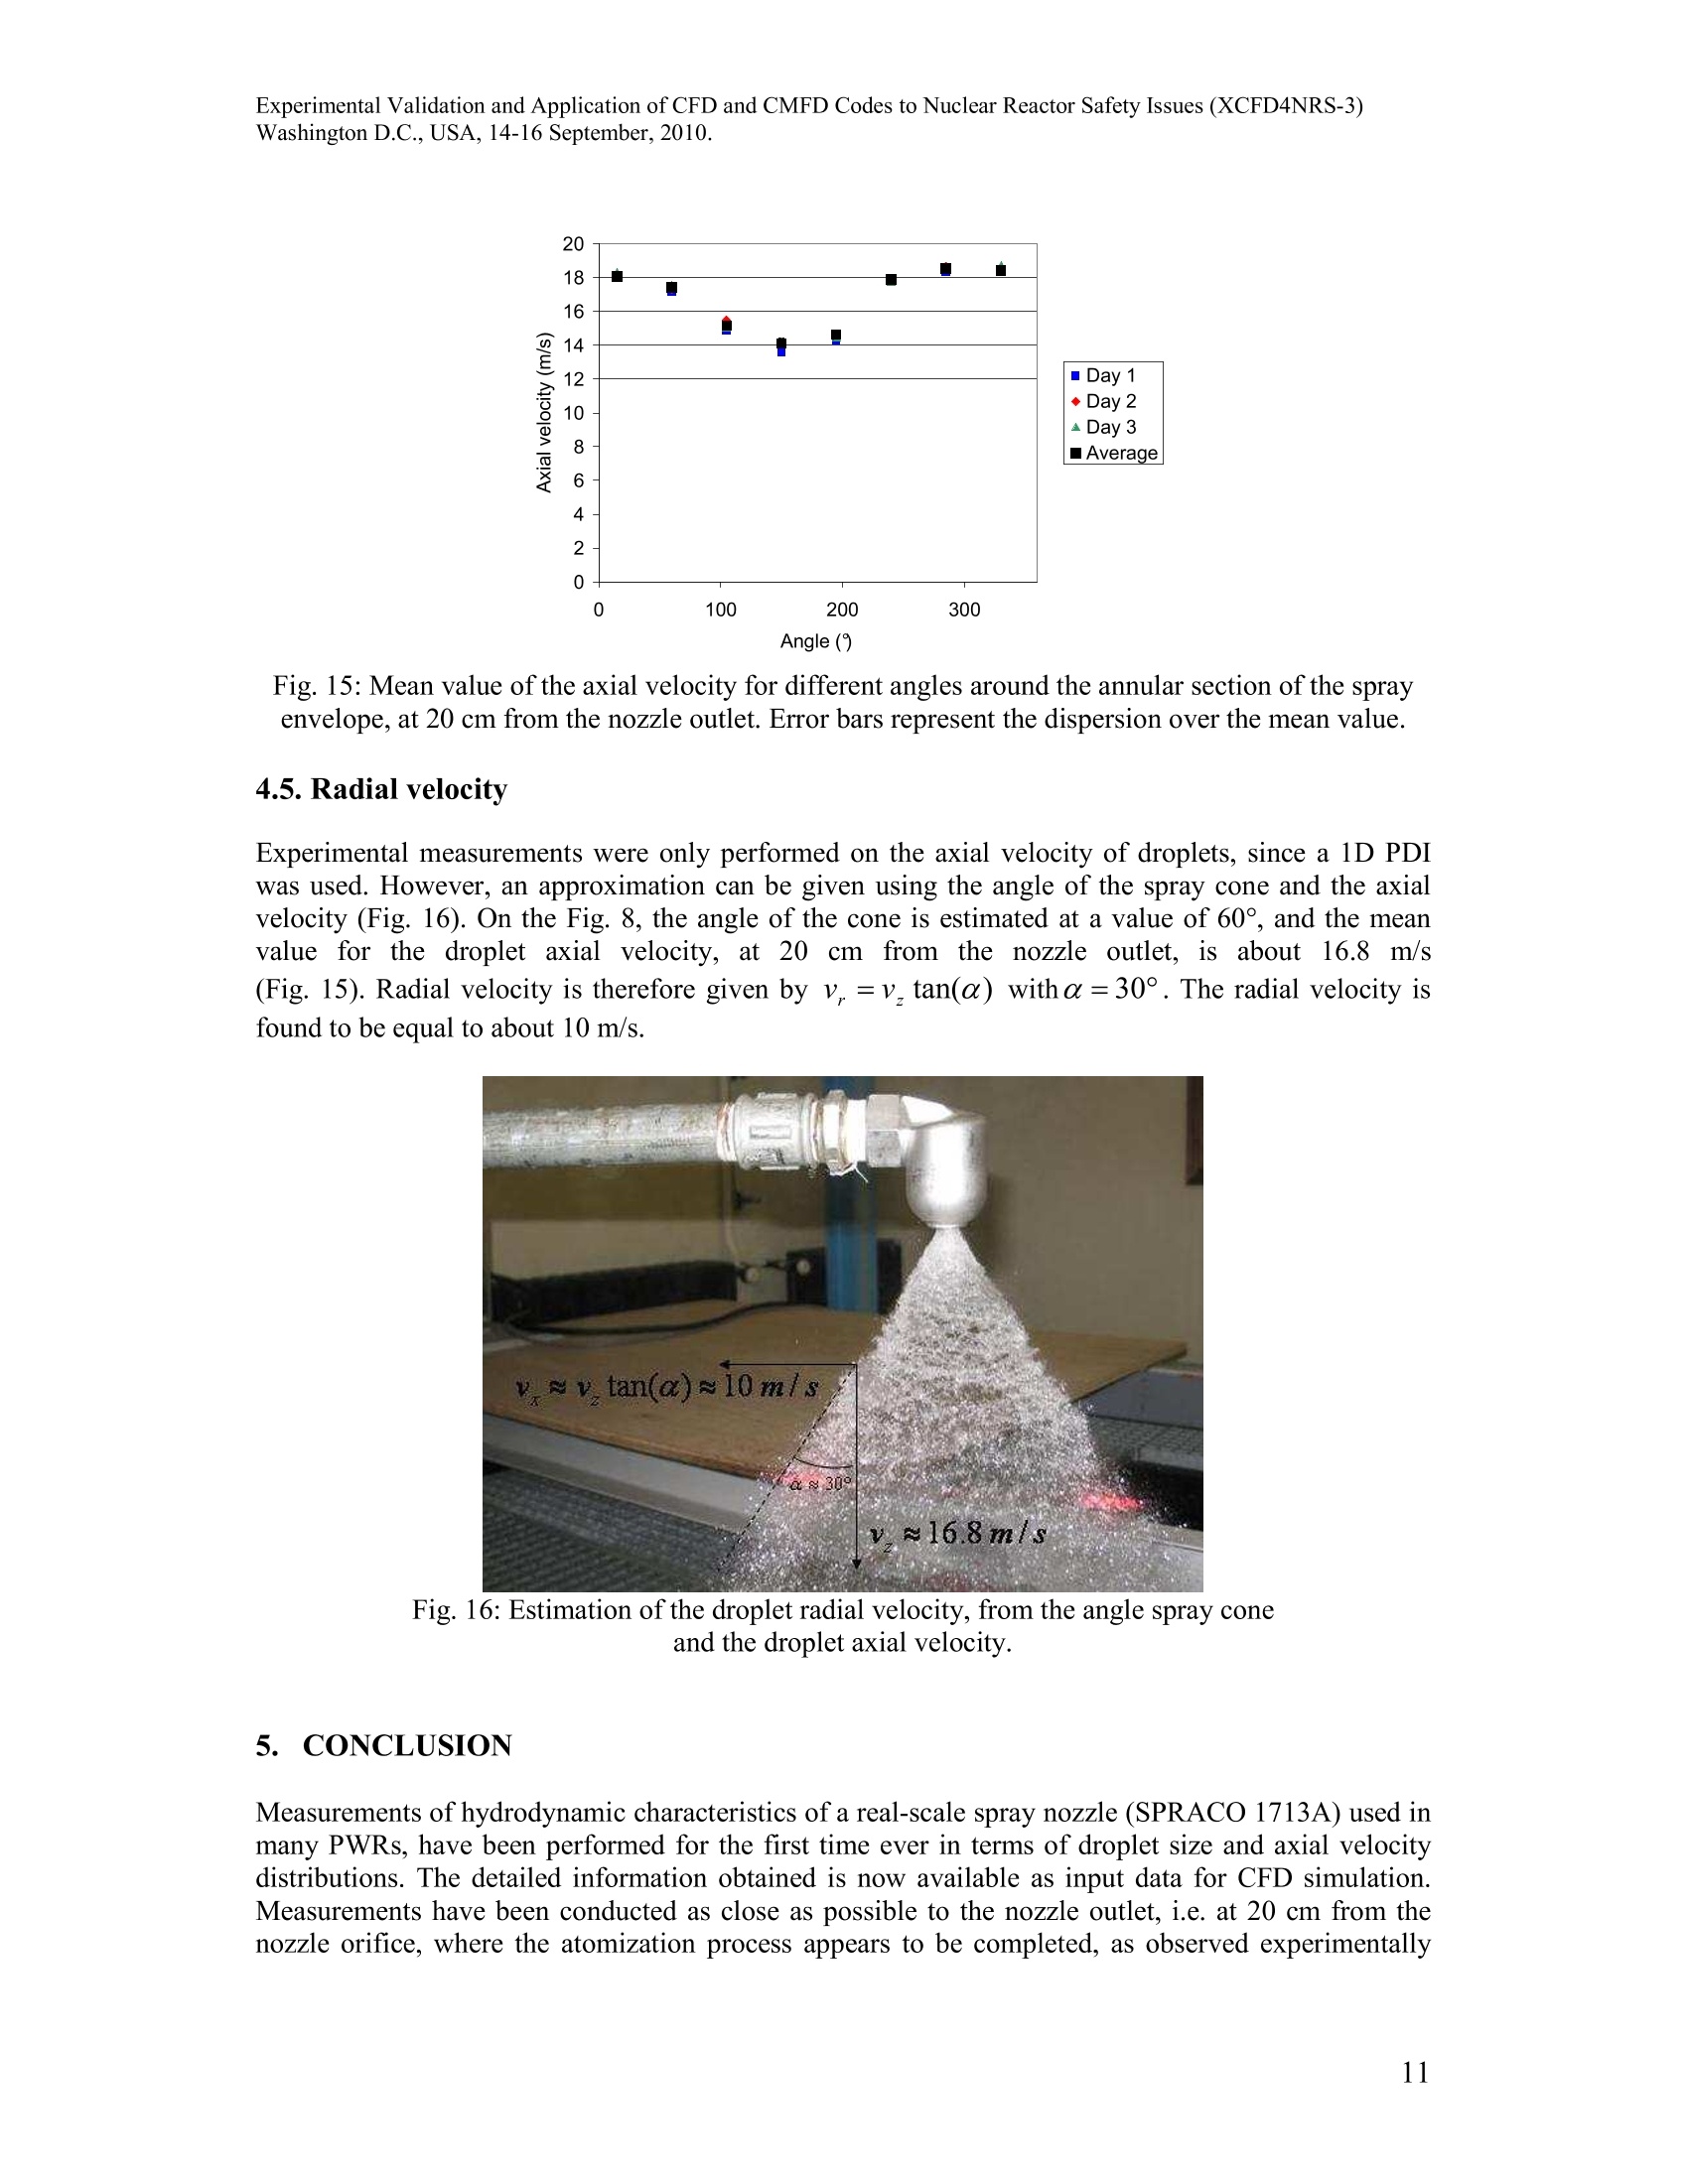
Experimental Validation and Application of CFD and CMFD Codes to Nuclear Reactor Safety Issues (XCFD4NRS-3)Washington D.C., USA, 14-16 September,2010. EXPERIMENTAL MEASUREMENTS OF DROPLET SIZE AND VELOCITYDISTRIBUTIONS AT THE OUTLET OF APRESSURIZED WATER REACTORCONTAINMENT SWIRLING SPRAYNOZZLE A. Foissac, J. Malet,R.M. Vetrano’,J.-M. Buchlin’,S. Mimouni, F. Feuillebois, O. Simonin 1 IRSN, DSU/SERAC/LEMAC, BP 68,F-91192 Gif-sur-Yvette Cedex, France 2 VKI, Chaussee de Waterloo, 7,B-1640 Rhode-St-Genese, Belgium 3 EDFR&D, MFEE, 6 quai Watier, F-78400 Chatou, France 4 LIMSI-CNRS, BP 133, F-91403 Orsay Cedex, France 5 IMFT, UMR CNRS/INPT/UPS, 1 allee du Prof. Camille Soula, F-31000 Toulouse, France arnaud.foissac@irsn.fr, jeanne.malet@irsn.fr Abstract During the course of a hypothetical severe accident in a nuclear Pressurized Water Reactor (PWR),hydrogen may be produced by the reactor core oxidation and distributed into the containment. Spraysystems are used in order to limit overpressure, to enhance the gas mixing to avoid hydrogenaccumulation, and to wash out the fission products. In order to simulate these phenomena with CFDcodes, it is first necessary to know the droplet size and velocity distributions close to the outlet nozzle.Furthermore, since most of the phenomena relative to droplets (condensation, gas entrainment,collision) are of particular importance in the region below the nozzle, accurate input data are neededfor real-scale PWR calculations. The objective is therefore to determine experimentally these inputdata. Experimental measurements were performed on a single spray nozzle which is routinely used in manyPWRs. This nozzle is generally used with water at a relative pressure supply of 350 kPa, producing amass flow rate of approximately 1 kg/s. At a distance of 20 cm, where atomization is just achieved, itis found that geometric mean diameter varies from 305 to 366 um, Sauter mean diameter from 430 to600 pm and mean axial velocity from 14.1 to 18.4 m/s. 1. INTRODUCTION One of the main contributors to the containment early failure during a PWR severe accident isassociated to the presence of hydrogen within the containment building. The hydrogen produced bythe reactor core oxidation and released from the reactor coolant system could mix or accumulate indifferent parts of the containment. If the composition of hydrogen-steam-air mixture reaches a certainthreshold, combustion could occur. In order to prevent such a risk, array of spray nozzles systems arepositioned at the top of the containment. They are used to limit overpressure, to enhance the gasmixing and avoid hydrogen accumulation, and to wash out fission products and structure materialswhich can be released. The spray system efficiency may depend on the evolution of the droplet sizeand velocity distributions during their fall (Rabe et al.,2009), especially in the region just below thes.cpray nozzle where most of the droplet phenomena occur: condensation (Mimouni et al., 2009), gasentrainment (Lavieville et al., 1995) and collision (Qian and Law, 1997, Rabe et al.,2010). Nozzles which are usually used for the spray system in many PWR have already been characterized byPowers and Burson (1993), using photographic and freezing methods, and Ducret et al. (1993), using amicro-video system. These data can be considered as a first approximation for this spray nozzlecharacterization. However, considering recent developments of CFD codes as well as experimentaltechniques involving laser diagnostics, improvement of this spray characterization is necessary andcan now be achieved. The objective of this work is thus to provide a more detailed characterization ofthe PWR spray nozzle, in terms of spray shape, spray size and axial velocity distributions as close aspossible to the nozzle outlet. Such measurements will give accurate and detailed boundary conditionsfor CFD numerical simulation spray of spray behaviour, which constitutes valuable improvement, since it is known that appropriate boundary conditions for CFD calculations are mandatory forrelevant CFD calculations. 2.. PWR CONTAINMENT SPRAY SYSTEMS Spray systems are emergency devices designed for preserving the containment integrity in case ofsevere accident in a PWR. The French PWR containments have generally two series of nozzles placedin circular rows (Coppolani et al., 2004). More precisely, for the 900 MWe PWR, there are exactlyfour rings of nozzles having the characteristics presented in Table 1. A schematic view of these sprayrings and the associated spray envelopes are given in Fig. 1. Table 1: Characteristics of spray rings for the French 900 MWe PWR. Height (m) Diameter (m) Number of nozzles Estimated minimum distance between nozzles(m) 1Ring 54.8 10.0 66 0.5 2ndRing 54.2 14.8 68 0.7 3 Ring 52.3 22.5 186 0.4 4 Ring 51.0 27.0 186 0.4 Fig. 1: Spray rings and envelopes in a French PWR (not at scale). The nozzle type used in many PWRs, in particularly French 900 MWe PWRs, is the so-calledSPRACO 1713A, distributed by Lechler (Fig. 2). This nozzle is generally used with water at a relativepressure of 350 kPa, producing a flow rate of approximately 1 1/s. The outlet orifice diameter is 9.5mm. The temperature of the injected water during a hypothetical nuclear reactor accident is eitherfrom 20℃ or 60℃ to 100 °C, depending on the kind of process (the 60℃ to 100℃ process is the so-called recirculation mode). Fig. 2: Spray nozzle SPRACO 1713A (Lechler). The droplet size distribution measured by Powers and Burson (1993) for this nozzle is presented inFig. 3 and the one obtained by Ducret et al. (1993) in Fig. 4. These results can be considered as a firstestimation of the size distribution. Nowadays, more information can be obtained using methods suchas Phase-Doppler Interferometer (PDI), Diffractometry or Shadowgraphy. Furthermore, the advancedtechniques as PDI allow the determination of the spatial distribution of the droplet size and velocityclose to the nozzle outlet. Droplet Diameter (um) Fig. 3: Droplet size distribution for the nozzle displayed in Fig. 2, as measured by Powers andBurson (1993) using photographic and freezing methods. Experimental Validation and Application of CFD and CMFD Codes to Nuclear Reactor Safety Issues (XCFD4NRS-3)Washington D.C., USA, 14-16 September,2010. Size distribution of the SPRACO nozzle (real-scale nozzle)for two different nozzle pressure drops DP Fig. 4: Droplet size distribution measured by Ducret et al. (1993), at 6 m under the nozzle, with amicro-video system, for two relative pressure supplies AP. 3. EXPERIMENTAL FACILITY The experiments have been carried out at the Von Karman Institute (VKI) in Belgium, in the VKI-Water-Spray facility sketched in Fig. 5. The set-up is composed of a hydraulic circuit supplying, forthose experiments, a single spray nozzle with a flow-rate of 1 1/s at 350 kPa. The pulverized water iscollected in a 12 mpool. The position of the spray nozzle may be changed using a monitored three-axes carriage. Fig. 5: VKI water-spray experimental facility. The measurement of the spray characteristics requires a technique such as the light diffraction,shadowgraphy or Phase-Doppler Interferometry (PDI). The latter was chosen since it provides localhigh resolution information about the spray drops. Indeed, PDI measures the size and velocity of dropspassing through an optically defined probe volume (Bachalo and Houser, 1984). The laser light sourceof the present ARTIUM PDI system is a continuous-wave He-Ne laser. The laser probe volume isformed by the intersection of two laser beams, depicted as blue lines on Fig. 5. The off-axis angle(scattering angle), at which the receiving optics unit is placed, is 30°. PDI can only measure droplets of spherical shape. In order to determine where atomization isachieved, visualization has been performed with a Phantom high-speed camera used with a resolutionof 800x600 pixels at a frequency of 4796 Hz, with an exposure time of 10 us. The spray close to thenozzle outlet, where atomization occurs, is illuminated from the back in order to obtain consistent andmachine readable images. 4. EXPERIMENTAL RESULTS 4.1. Global spray characterization A spray is usually created by the instability of either a liquid jet or sheet at the outcome of the nozzle(Dumouchel,2006). When surface forces become weaker than inertial forces, atomization occurs: theliquid jet/sheet breaks into filaments that shatter into droplets. The high-speed visualization shows thatthe distance from the nozzle exit at which most of the liquid is atomised into droplets (for a relativepressure of 350 kPa) is approximately at 20 cm as depicted in Fig. 6. Therefore, it can be anticipatedthat at such a distance, PDI measurements of droplets are reliable. It is also noticed that the spray isnot symmetrical, the droplet density being higher on the right side. This observation is probably due tothe inner geometry of the nozzle shown in Fig. 2. Fig. 6:High-speed camera imaging ofthe nozzle SPRACO 1713A at a relative pressure of 350 kPa. It is also found, as by the nozzle manufacturer, that the SPRACO 1713A nozzle creates a hollow conespray. No droplets are found in the core of the spray. The annular ring, in which droplets are found, ischaracterized by the internal and external diameters of the annulus, which are, respectively, about 18and 26 cm at a 20 cm distance from the nozzle outlet (Fig.7). Fig. 7: Annular cross-section of the hollow cone spray at a 20 cm distance from the nozzle outlet. The spray angle is found to be around 60°(Fig. 8). Fig. 8: Estimation of the spray angle. 4.2. Description of the measurement points PDI measurements of droplet size and velocity distributions are performed at 20 cm from the nozzleoutlet. Eight measurements points, separated by 45°angles, are chosen at a radial position situated atthe centre of the annular ring as described in Fig. 9. Fig.9: Position of the measurement points in the cross-section of the hollow cone spray, as viewedfrom the top. For each measurement point, droplet size and axial velocity distributions, are measured three times(three different days). 4.3. Drop size distribution Size distributions measured at different angles at a distance of 20 cm from the nozzle outlet arepresented in Fig. 10. For each graph of this figure, the three size distributions corresponding to thethree day tests are given, as well as an“average”distribution obtained from the three others. Thisaveraging has no physical meaning but helps to visualize the shape of the size distribution. Two mainconclusions can be drawn from Fig. 10: the shape of the droplet size distribution at each position is rather repeatable from test-to-test; this shape is rather similar for all positions on the annular ring of the spray envelope. For each measured size distribution, global spray features, as the Geometric Mean Diameter D1o or theSauter Mean Diameter D32, are calculated. Their evolution with the azimuthal angle is plotted inFig. 11 and Fig.12 respectively. On these figures, the specified diameter for each test is given, as wellas the average of this diameter on the three tests. These figures show that the tests exhibit goodrepeatability, even if small differences can be observed: the Dio diameter changes slightly with theangle position, from around 300 um to 350 um, and the Sauter mean diameter changes from around400 to 600 um. Two reasons may explain this dissymmetry: the liquid flow inside the spray nozzle is not symmetrical, since the inner geometry of thenozzle is not symmetrical; first CFD calculations with the CFX commercial code seem toconfirm this effect: an experimental bias can also occur: depending on the measurement position, the laser beamhas to cross more or less spray, and the gain of the receiver has to be adjusted so that thiscould influence the detection of the smallest or biggest droplets. The calculations of the meandiameters can then be modified by the presence of those smallest or largest droplets. This iswhy the use of the size distribution as an input data appears to be more accurate than the useof an average diameter in order to characterize the spray in CFD codes. b) Diameter (pm) c) d) e) f) g) h) : Test 1. : Test 2. : Test 3. : Average Fig. 10: Experimental droplet size distributions at 20 cm from the nozzle outlet for an angle of a) 15°,b) 60°, c)105°, d) 150°, e) 195°, f) 240°, g)285°,h) 330°. Experimental Validation and Application of CFD and CMFD Codes to Nuclear Reactor Safety Issues (XCFD4NRS-3)Washington D.C., USA, 14-16 September,2010. Fig.11: Geometric Mean Diameter D10 for different angles around the annular section of the sprayenvelope, at 20 cm from the nozzle outlet. Error bars represent the dispersion over the mean value. Fig.12: Sauter Mean Diameter D32 for different angles around the annular section of the sprayenvelope, at 20 cm from the nozzle outlet. Error bars represent the dispersion over the mean value. The experimental size distributions can be approximated with a log-normal distribution, as it can beseen in Fig. 13 for two different angular positions. The same kind of results is observed for all the otherangular positions. _: Experimental average distribution,_:Log-normal fitted distribution Fig. 13: Experimental average and fitted log-normal droplet size distributions at 20 cm from the nozzleorifice for an angle of 15° (left) and 240° (right). Experimental Validation and Application of CFD and CMFD Codes to Nuclear Reactor Safety Issues (XCFD4NRS-3)Washington D.C., USA, 14-16 September, 2010. 4.4. Axial velocity distribution Measurements of the droplet axial velocity have also been performed at a distance of 20 cm from thenozzle orifice. Normalized results are plotted in Fig. 14 and fitted with a Gaussian distributionfunction presented in the same figure. The average value of the axial velocity around the annulus ofthe spray envelope is given in Fig. 15. It can be observed from those figures that: the shape of the axial velocity distribution at each position is very repeatable from one test toanother: this shape is rather similar for all positions on the annular ring of the spray envelope; the axial velocity distribution at this position can be approximated by a Gaussian function(Sellens and Brzustowski, 1986); the mean droplet axial velocity varies with the angle position, probably due to the nozzle innergeometrical dissymmetry and the resulting swirling behaviour of the spray discussed earlier; the mean axial velocity varies from 14.1 to 18.5 m/s; associated experimental relativeuncertainties have been estimated to be between 1 and 4%. a) b) 0,6 ---Day 2 Test 2 Day 2 Test 2 0,5 Day 2 Test 3 Day 2 Test 3 -Day 3 Test 1 0,4 Day 3 Test 1 -Day 3 Test 2 0,3 Day 3 Test2 Day 3 Test 3 0,2 Day 3 Test 3 -Gaussian fitting 0,1 -Gaussian fitting 10 20 30 40 Droplet axial velocity (m/s) Fig. 14: Droplet axial velocity distribution and Gaussian fitting at 20 cm from the nozzle orifice for anangle position of a) 15°, b) 60°, c) 150°, d) 195°, e) 285°, f) 330°. Fig. 15: Mean value of the axial velocity for different angles around the annular section of the sprayenvelope, at 20 cm from the nozzle outlet. Error bars represent the dispersion over the mean value. 4.5. Radial velocity Experimental measurements were only performed on the axial velocity of droplets, since a 1D PDIwas used. However, an approximation can be given using the angle of the spray cone and the axialvelocity (Fig. 16). On the Fig.8, the angle of the cone is estimated at a value of 60°, and the meanvalue for the droplet axial velocity, at 20 cm from the nozzle outlet, is about 16.8 m/s(Fig. 15).Radial velocity is therefore given by v,=v tan(α) witha=30°. The radial velocity isfound to be equal to about 10 m/s. Fig. 16: Estimation of the droplet radial velocity, from the angle spray coneand the droplet axial velocity. 5. CONCLUSION Measurements of hydrodynamic characteristics of a real-scale spray nozzle (SPRACO 1713A) used inmany PWRs, have been performed for the first time ever in terms of droplet size and axial velocitydistributions. The detailed information obtained is now available as input data for CFD simulation.Measurements have been conducted as close as possible to the nozzle outlet, i.e. at 20 cm from thenozzle orifice, where the atomization process appears to be completed, as observed experimentally with a high-speed camera. Droplet size and velocity distribution have been obtained for typicalconditions used in nuclear reactors, i.e. a relative pressure supply of 350 kPa. Observations show differences across the spray section, in terms of droplet mean diameters anddroplet mean axial velocities. These differences are supposed to be mainly due to the inner geometryof the nozzle which leads to a non symmetrical liquid flow just at the outlet of the spray nozzle. It isalso found that the droplet size distribution can be well fitted by a Log-Normal distribution and thedroplet axial velocity distribution by a Gaussian distribution. It is recommended to use thesedistribution functions as input data for CFD calculations of real-scale sprays in nuclear reactors. Further improvements in the analysis of these experimental data will include the velocity-sizecorrelation and the axial velocity distribution for each droplet class. Other experimental data can alsobe obtained, in particular the radial and ortho-radial droplet velocities which are important quantities for the determination of the droplet cross-trajectories that lead to droplet collision. All these results are of particular importance to determine the input data for sprays in real-scale PWRcalculations, since most of the phenomena relative to droplets (condensation, gas entrainment,collision) are enhanced in the region below the spray nozzle. REFERENCES C. Dumouchel,“On the experimental investigation on primary atomization of liquid streams”,Experiments in fluids,Vol. 45,pp.371-422(2008) C. Rabe, J. Malet, F. Feuillebois,“Experimental investigation of water droplet binary collisions anddescription of outcomeswith aasymmetricWeber number”, Physics of fluids, Vol. 22.047101 (2010) C. Rabe,J. Malet, F. Feuillebois,“On the influence of droplet coalescence in spray systems forcontainment safety”, 13" International Topical Meeting on Nuclear Reactor Thermal Hydraulics,Kanazawa city, Japan (2009) D.A. Powers, S.B. Burson,66“A simplified model of aerosol removal by containment sprays”,NUREG/CR-5966 (1993) D. Ducret, J. Vendel, D. Vigla,“Etude preliminaire de Paspersion”IRSNTechnical reportIPSN/DSU/SERAC/LECEV 93/22 (1993) ( J. Lavieville , E. Deutch, O. Simonin, “ Large E d dy Si m ulation of int e raction be t ween col l idingparticles and a homogeneous isotropic turbulence field", 6" Int. Symp. On Gas-Solid Flows,FEDSM, Vol. 228, pp. 347-357 (1995) ) ( J. Qian, C.K. Law, “Regimes of c o alescence and se p aration in d r oplet collision”, J. Fluid Mech.,Vol.331,pp.59-80(1997) ) ( P. Coppolani et al., La Chaudiere des r e acteurs a eau sous pression, EDP science, France, 2004 ) R.W. Sellens, T.A. Brzustowski,“A simplified prediction of droplet velocity distributions in a spray”,Combustion and Flame,Vol. 65,pp.273-279(1986) S. Mimouni, A. Foissac, J. Lavieville,“CFD modelling of wall steam condensation by a two-phaseflow approach", Nucl. Eng. And Design, accepted (2010) ( W.D. B achalo, M .J. H ouser,“Phase/Doppler spray analyzer for simultaneous measurements of dropsize and velocity distributions”,Opt. E ng., V ol. 2 3,p p . 583-590 (1984) )
确定
还剩10页未读,是否继续阅读?

产品配置单


北京欧兰科技发展有限公司为您提供《喷雾,液滴中粒径、速度检测方案(气溶胶)》,该方案主要用于其他中粒径、速度检测,参考标准--,《喷雾,液滴中粒径、速度检测方案(气溶胶)》用到的仪器有Artium PDI-FP 双量程可机载飞行探头、激光相位多普勒干涉仪LDV,PDI,PDPA,PDA、激光诱导白炽光(LII)烟气分析仪
推荐专场


相关方案
更多
该厂商其他方案
更多