


方案详情
文
In this work the authors have added an additional sensor to the traditional Phase Doppler Interferometry (PDI) configuration yielding three independent measures of phase shift between detectors. This seemingly minor enhance-ment has a profound impact on the limitations of the PDI technique in two important areas: the minimum laser beam diameters and the ability of the technique to discriminate liquid droplets from solid particles.
Phase Doppler measurements can be impacted by reflection/refraction errors in which a droplet’s measured diameter is substantially different from its actual size. This is most critical when small droplets are measured as very large but the converse is possible as well. Consideration for this error source places a major constraint on the minimum laser beam diameter at the measurement volume. The addition of a third independent measure of phase shift effectively eliminates reflection/refraction errors allowing PDI measurements with smaller laser beams than would ordinarily be recommend-ed. The authors demonstrate this ability by measuring the same location of a spray with decreasing laser beam waists. Since the droplet number density limit of the Phase Doppler technique scales inverse to the square of the laser beam diameter, such an optical configuration would substantially enhance the instrument’s performance in dense sprays ap-plications.
For applications such as icing cloud measurements, the ability to discriminate and size only liquid droplets in a mixed-phase environment is an important capability of the PDI technique. The relationship between the phase shifts of Phase Doppler signals can be used to differentiate liquid droplets or other spherical particles from irregularly-shaped solids. The authors demonstrate that the addition of a third independent measure of phase shift reduces the number of false positives (solids measuring as droplets) by a large factor – from 11.7% to 0.33% in one example.
方案详情

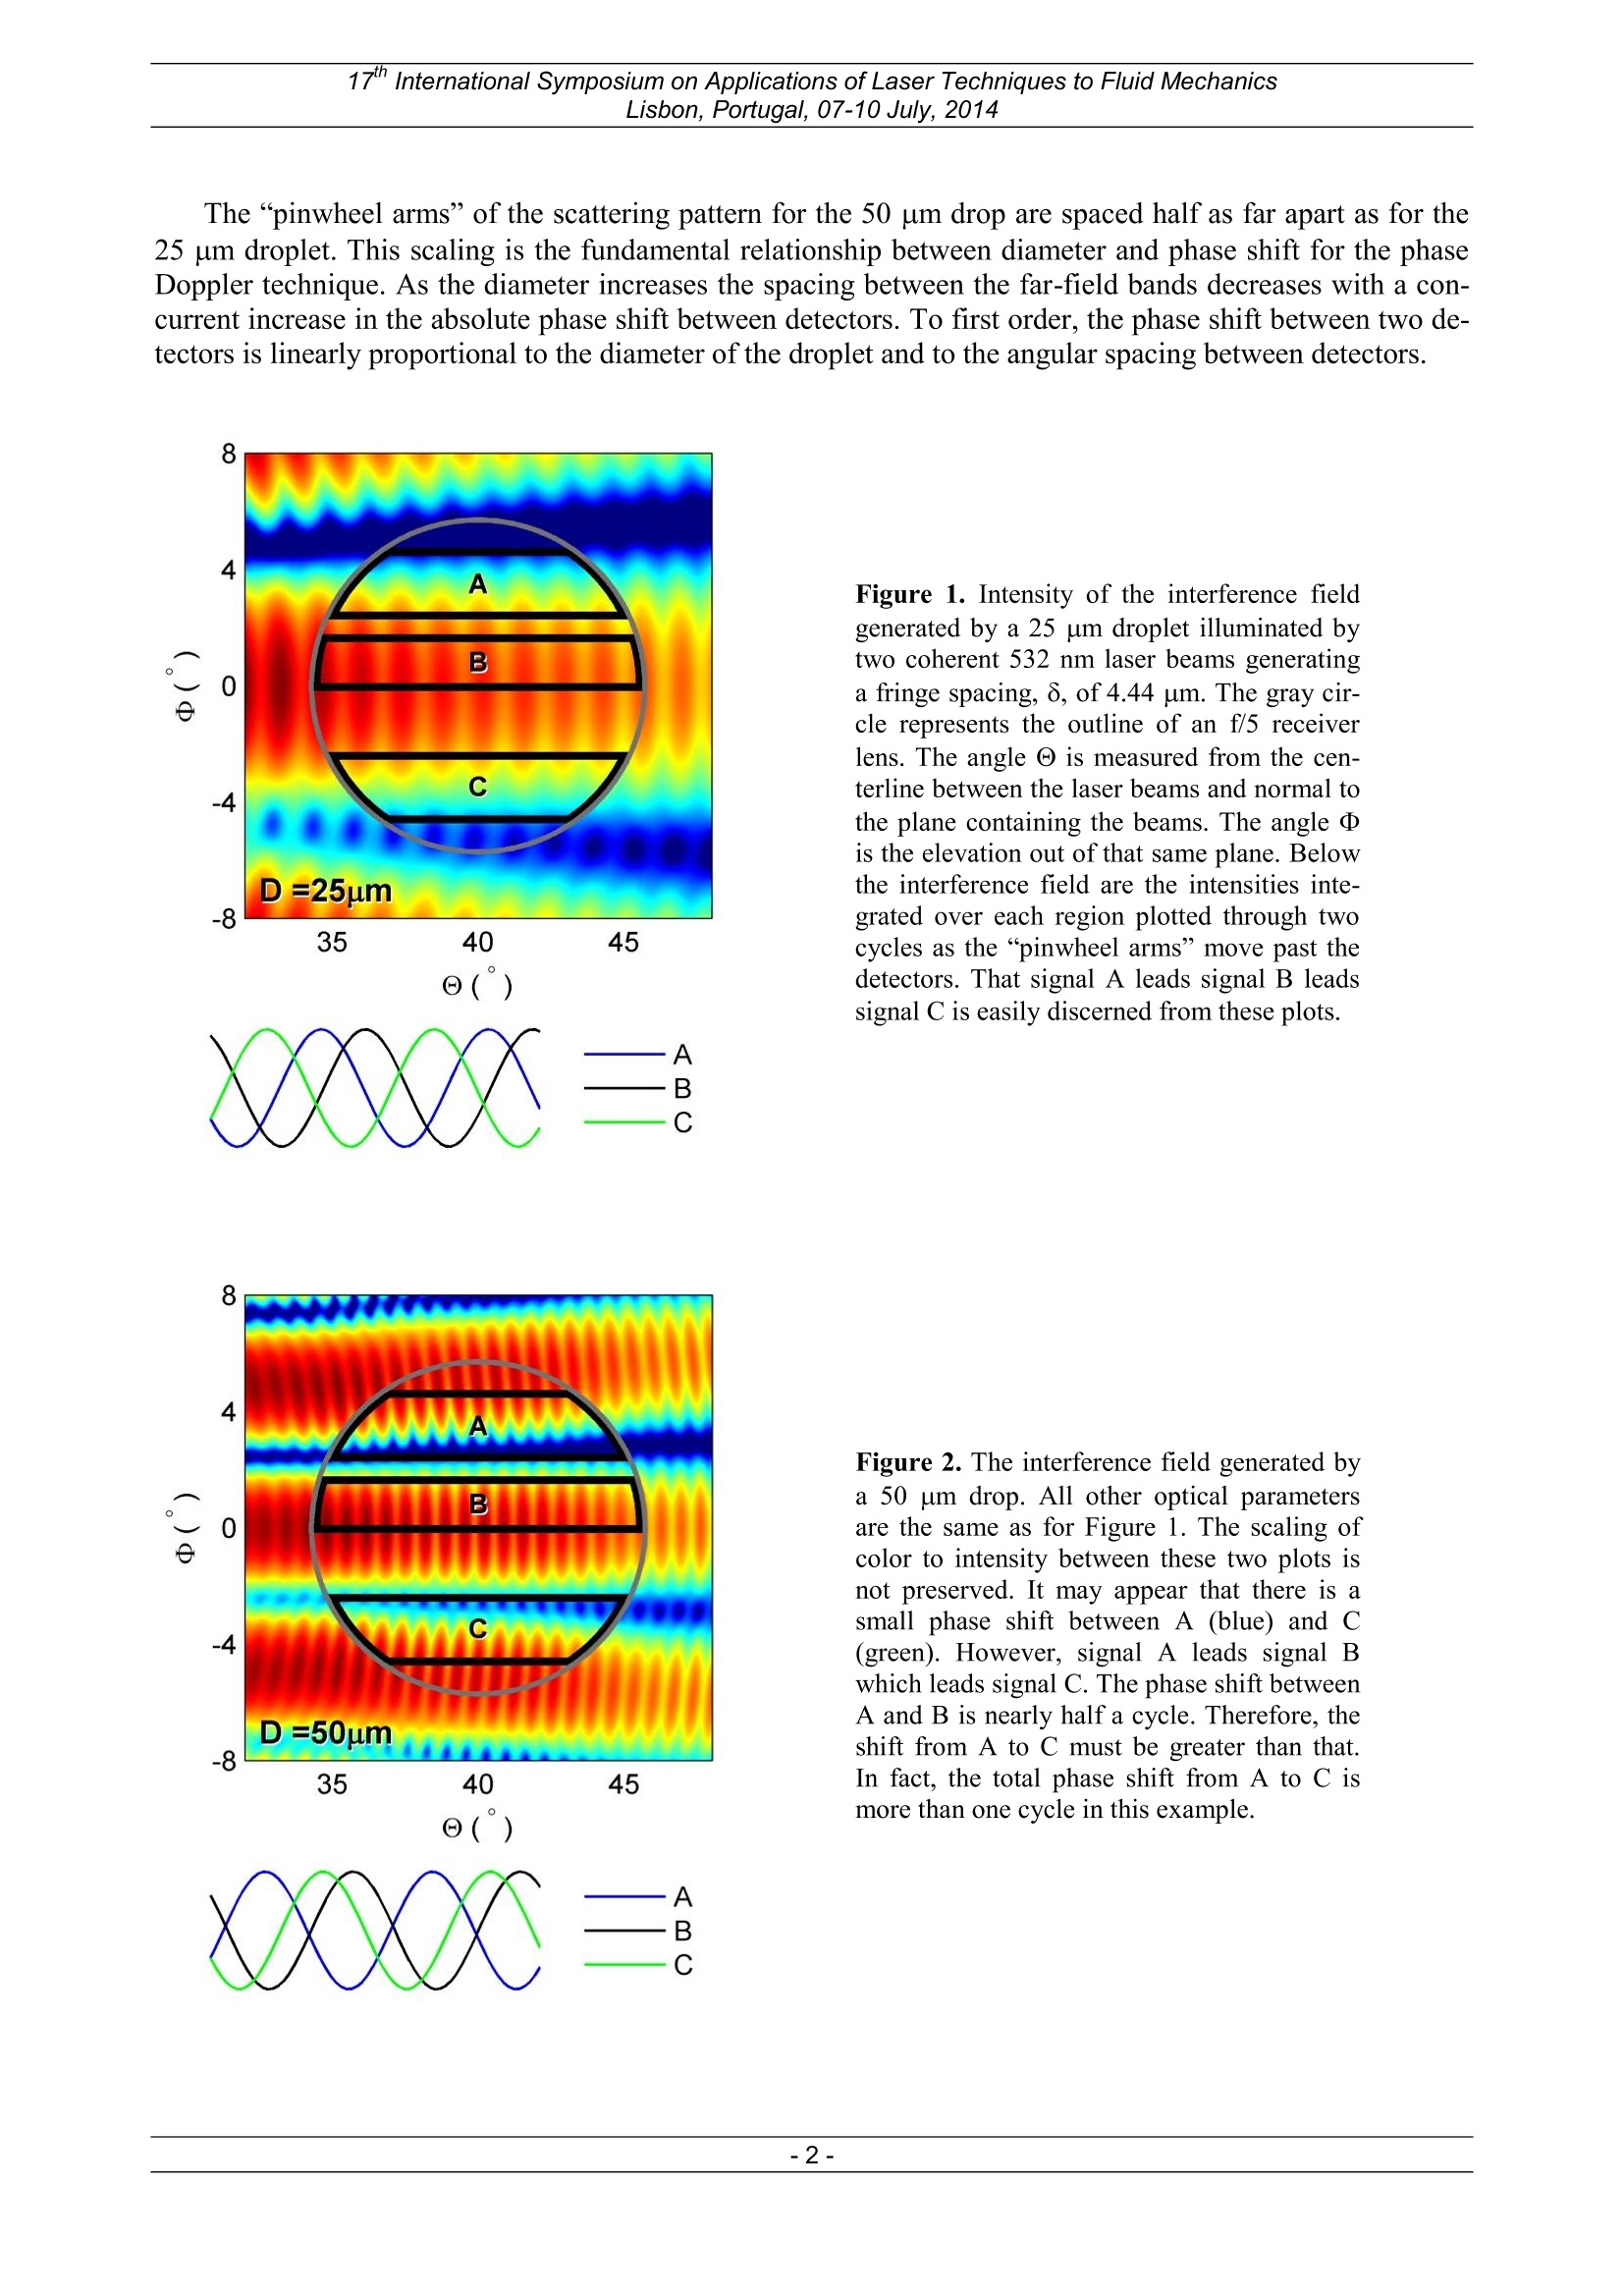
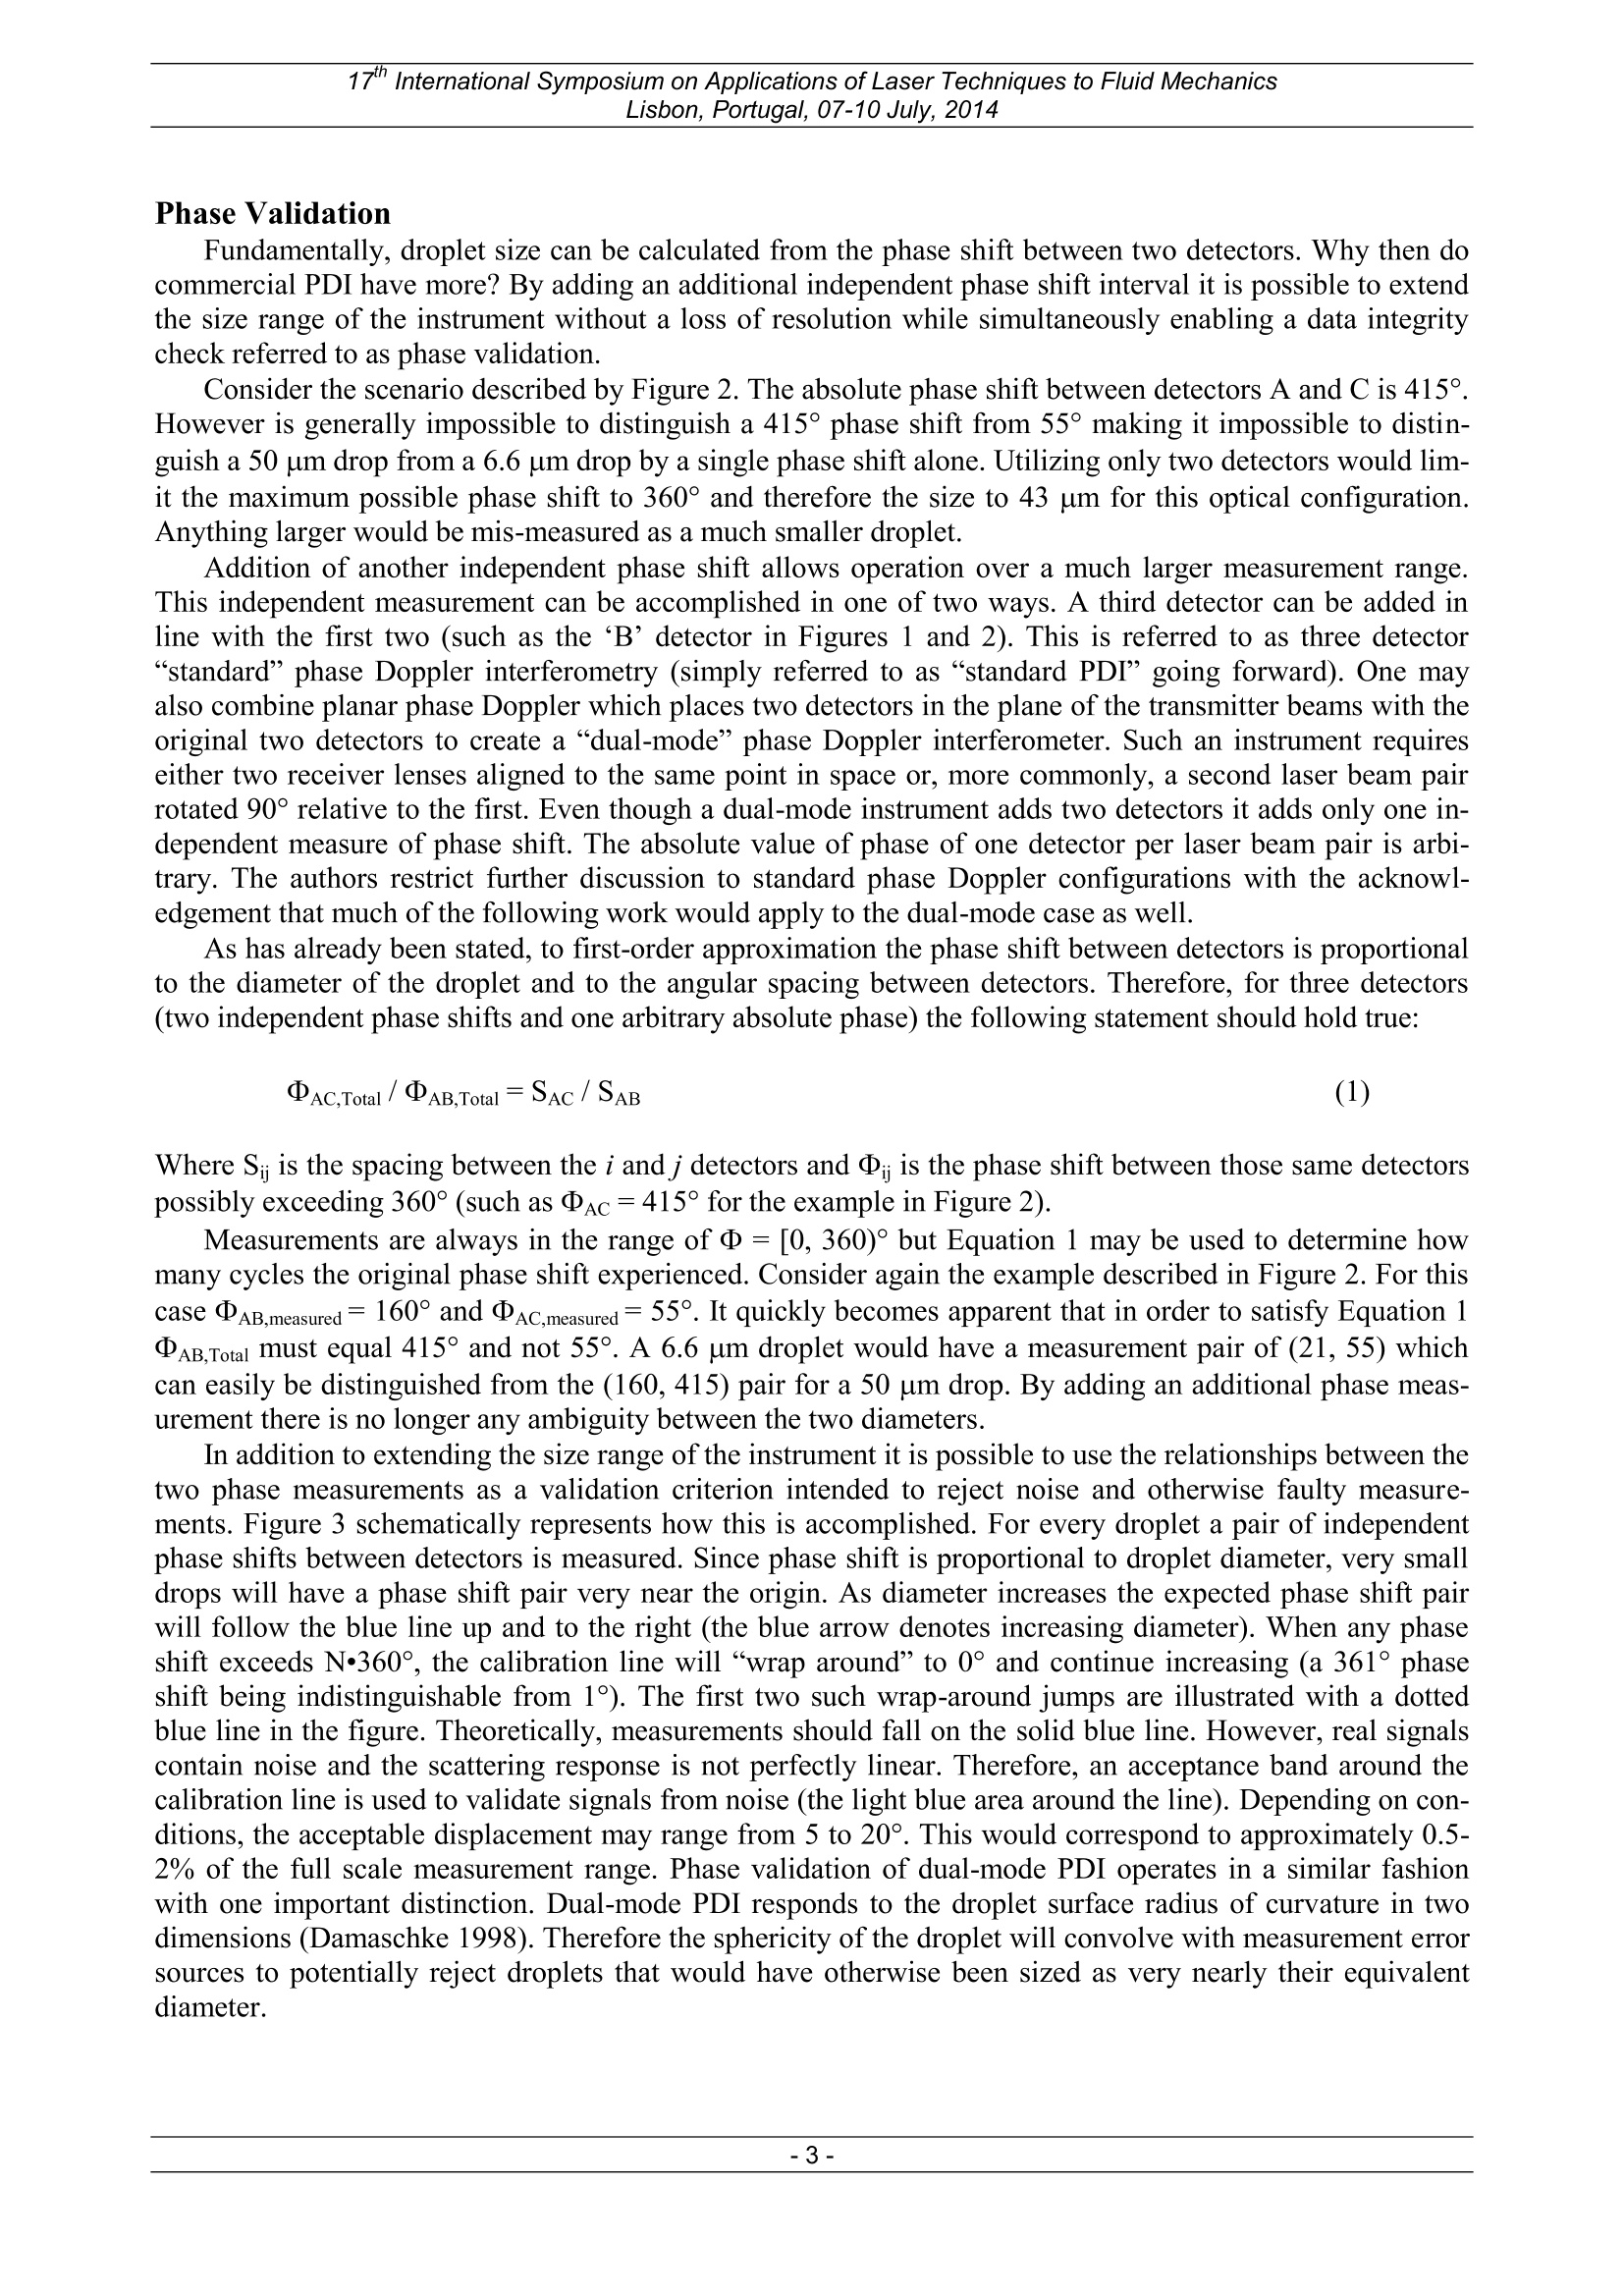
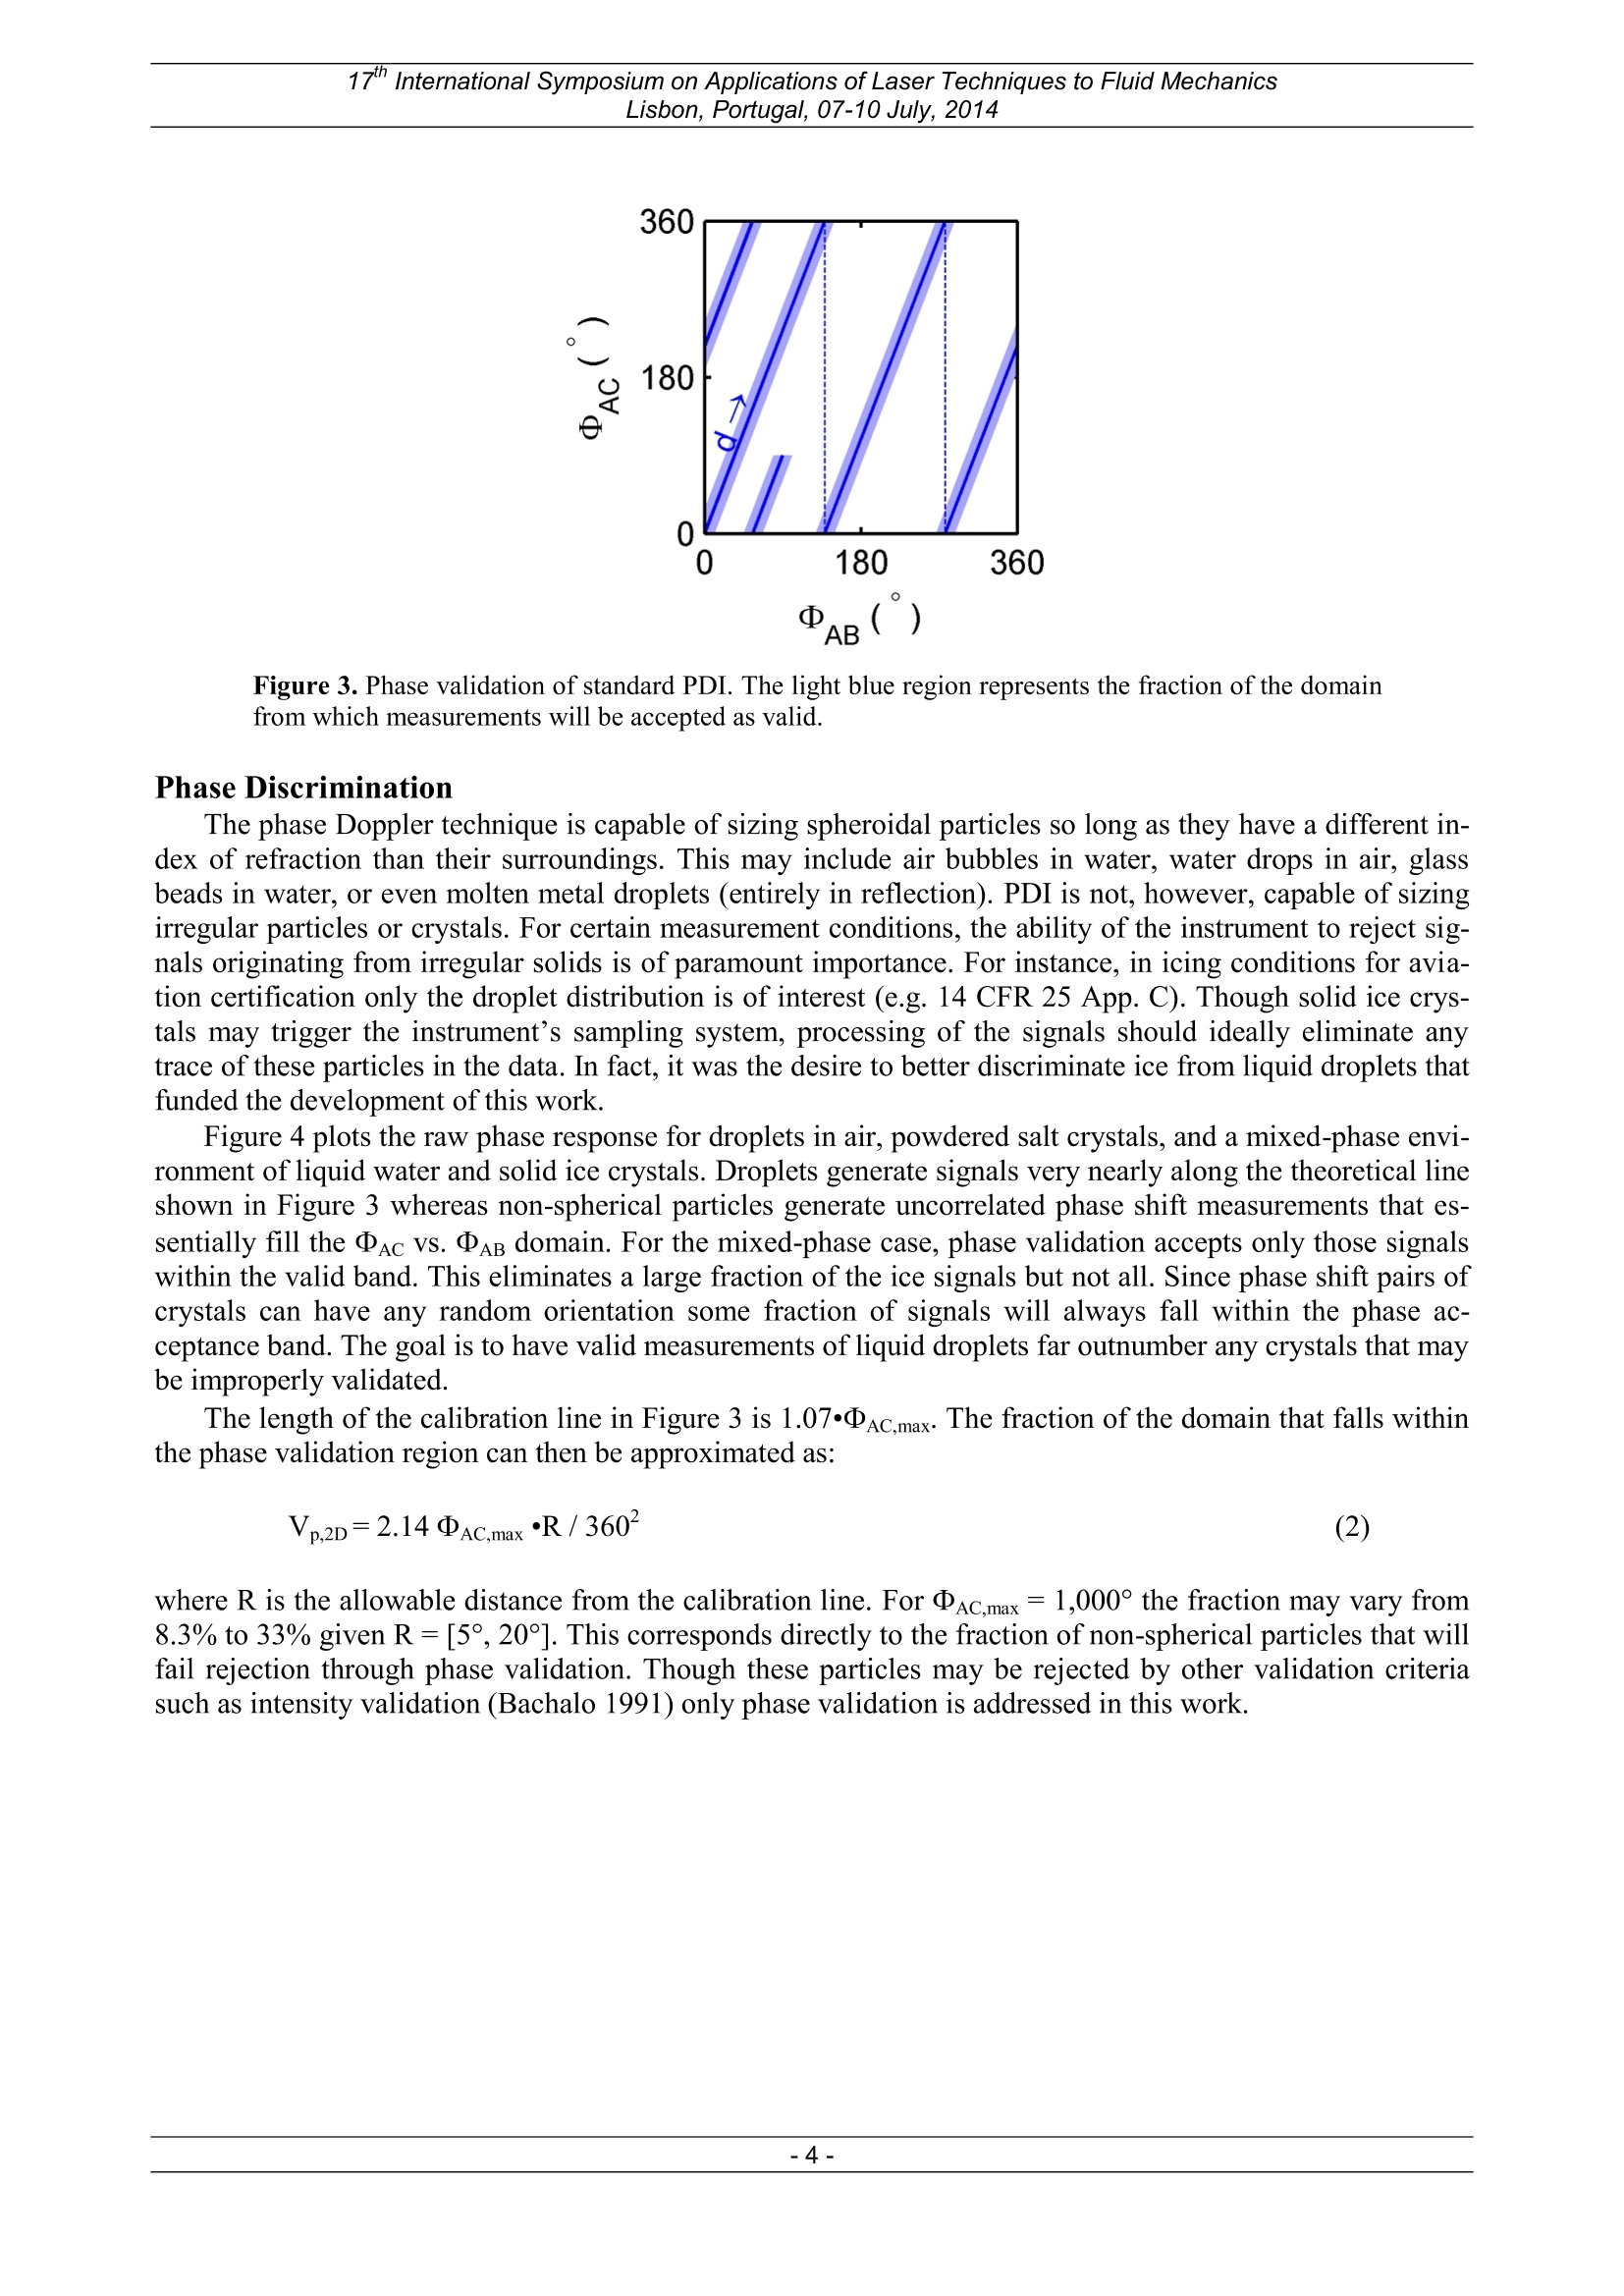
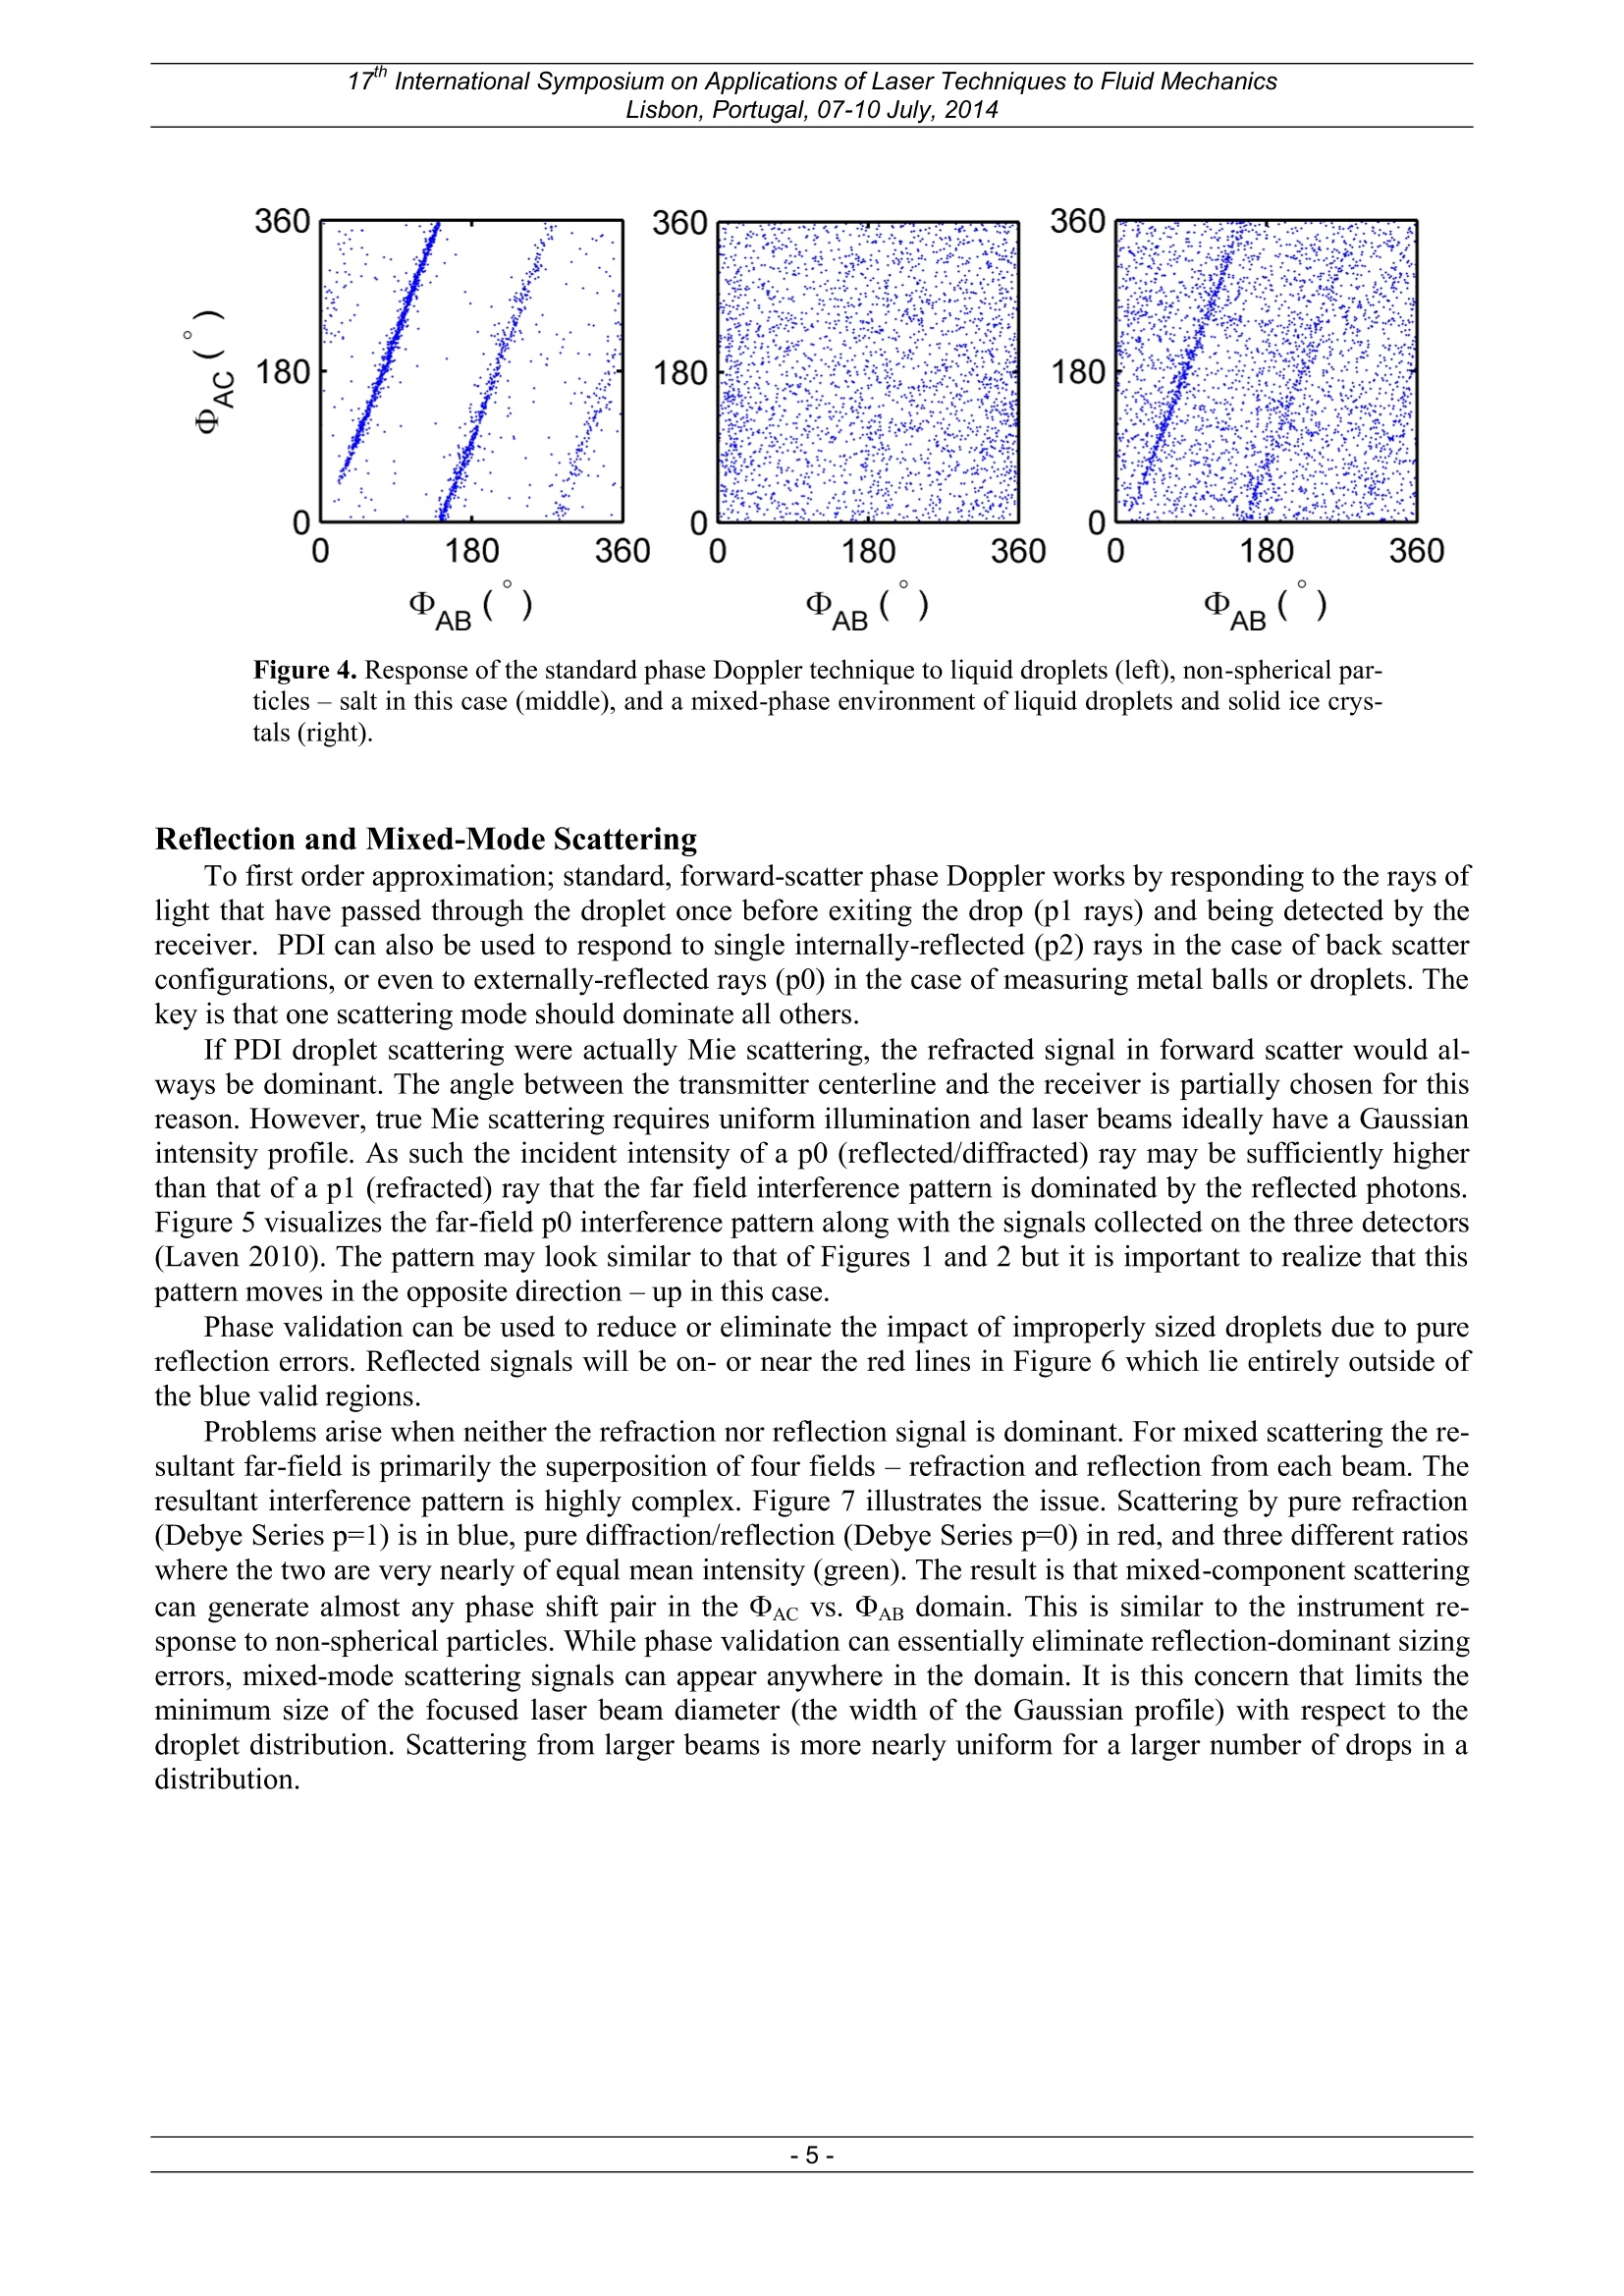
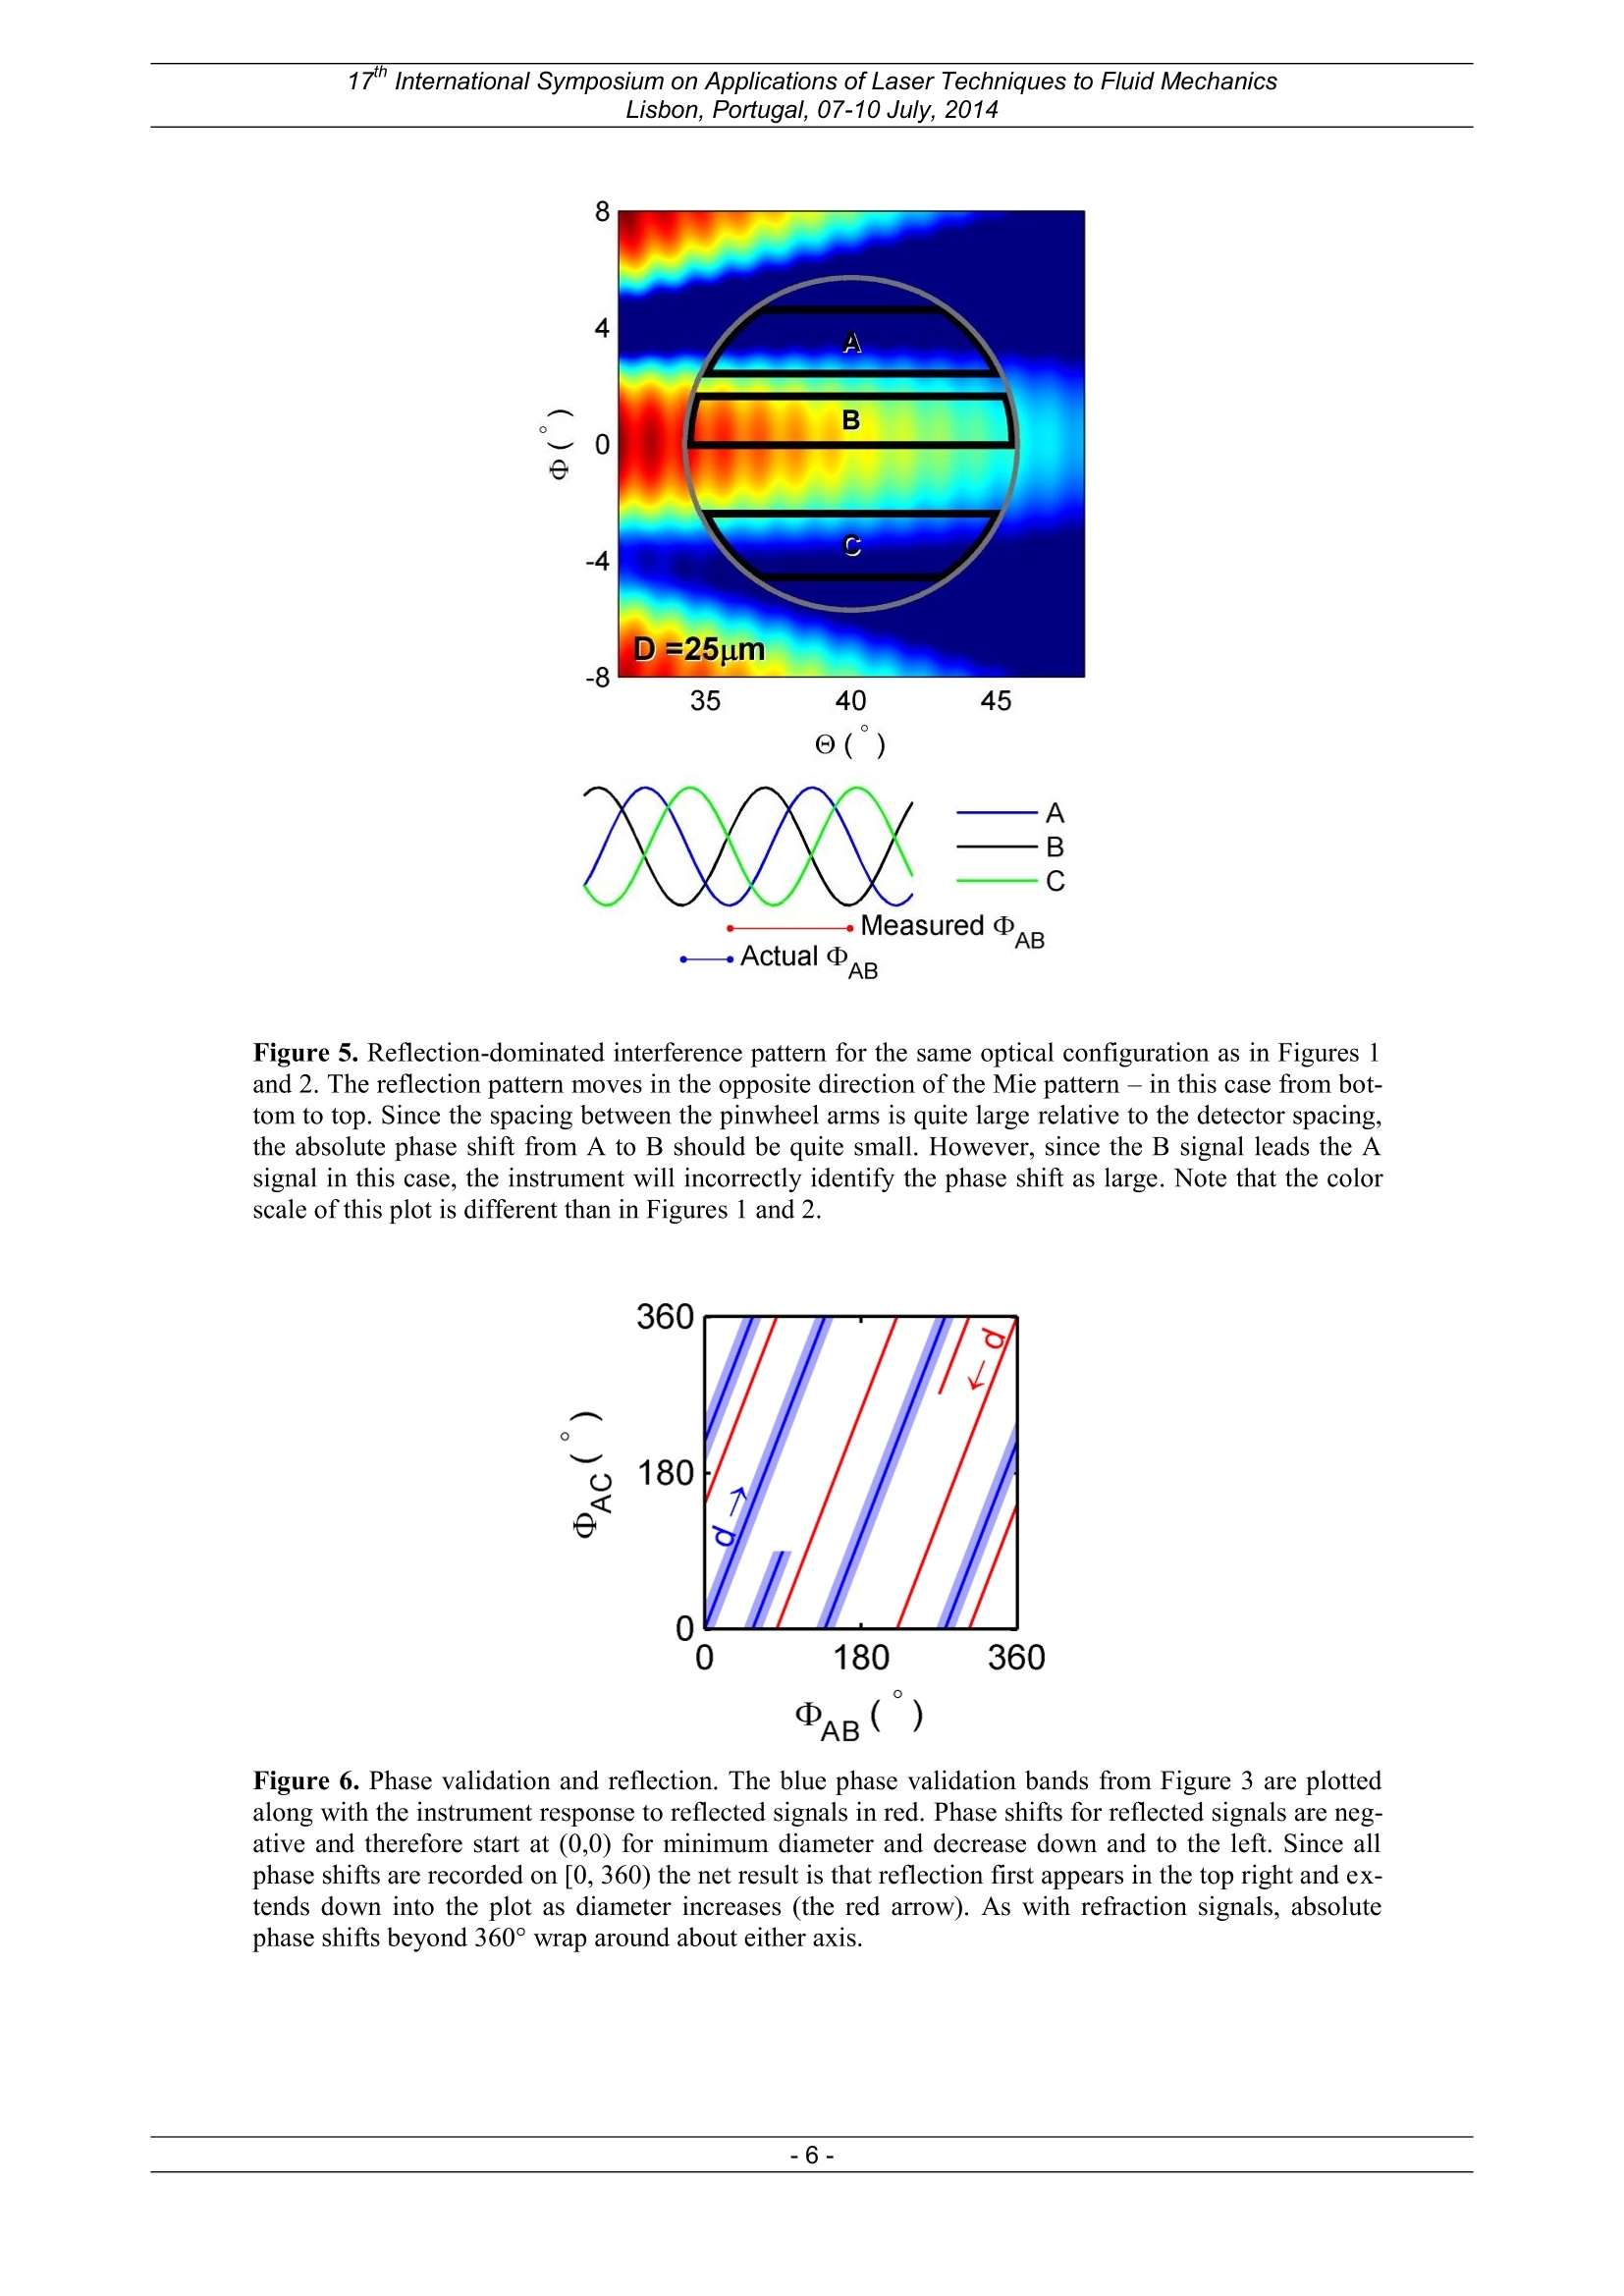
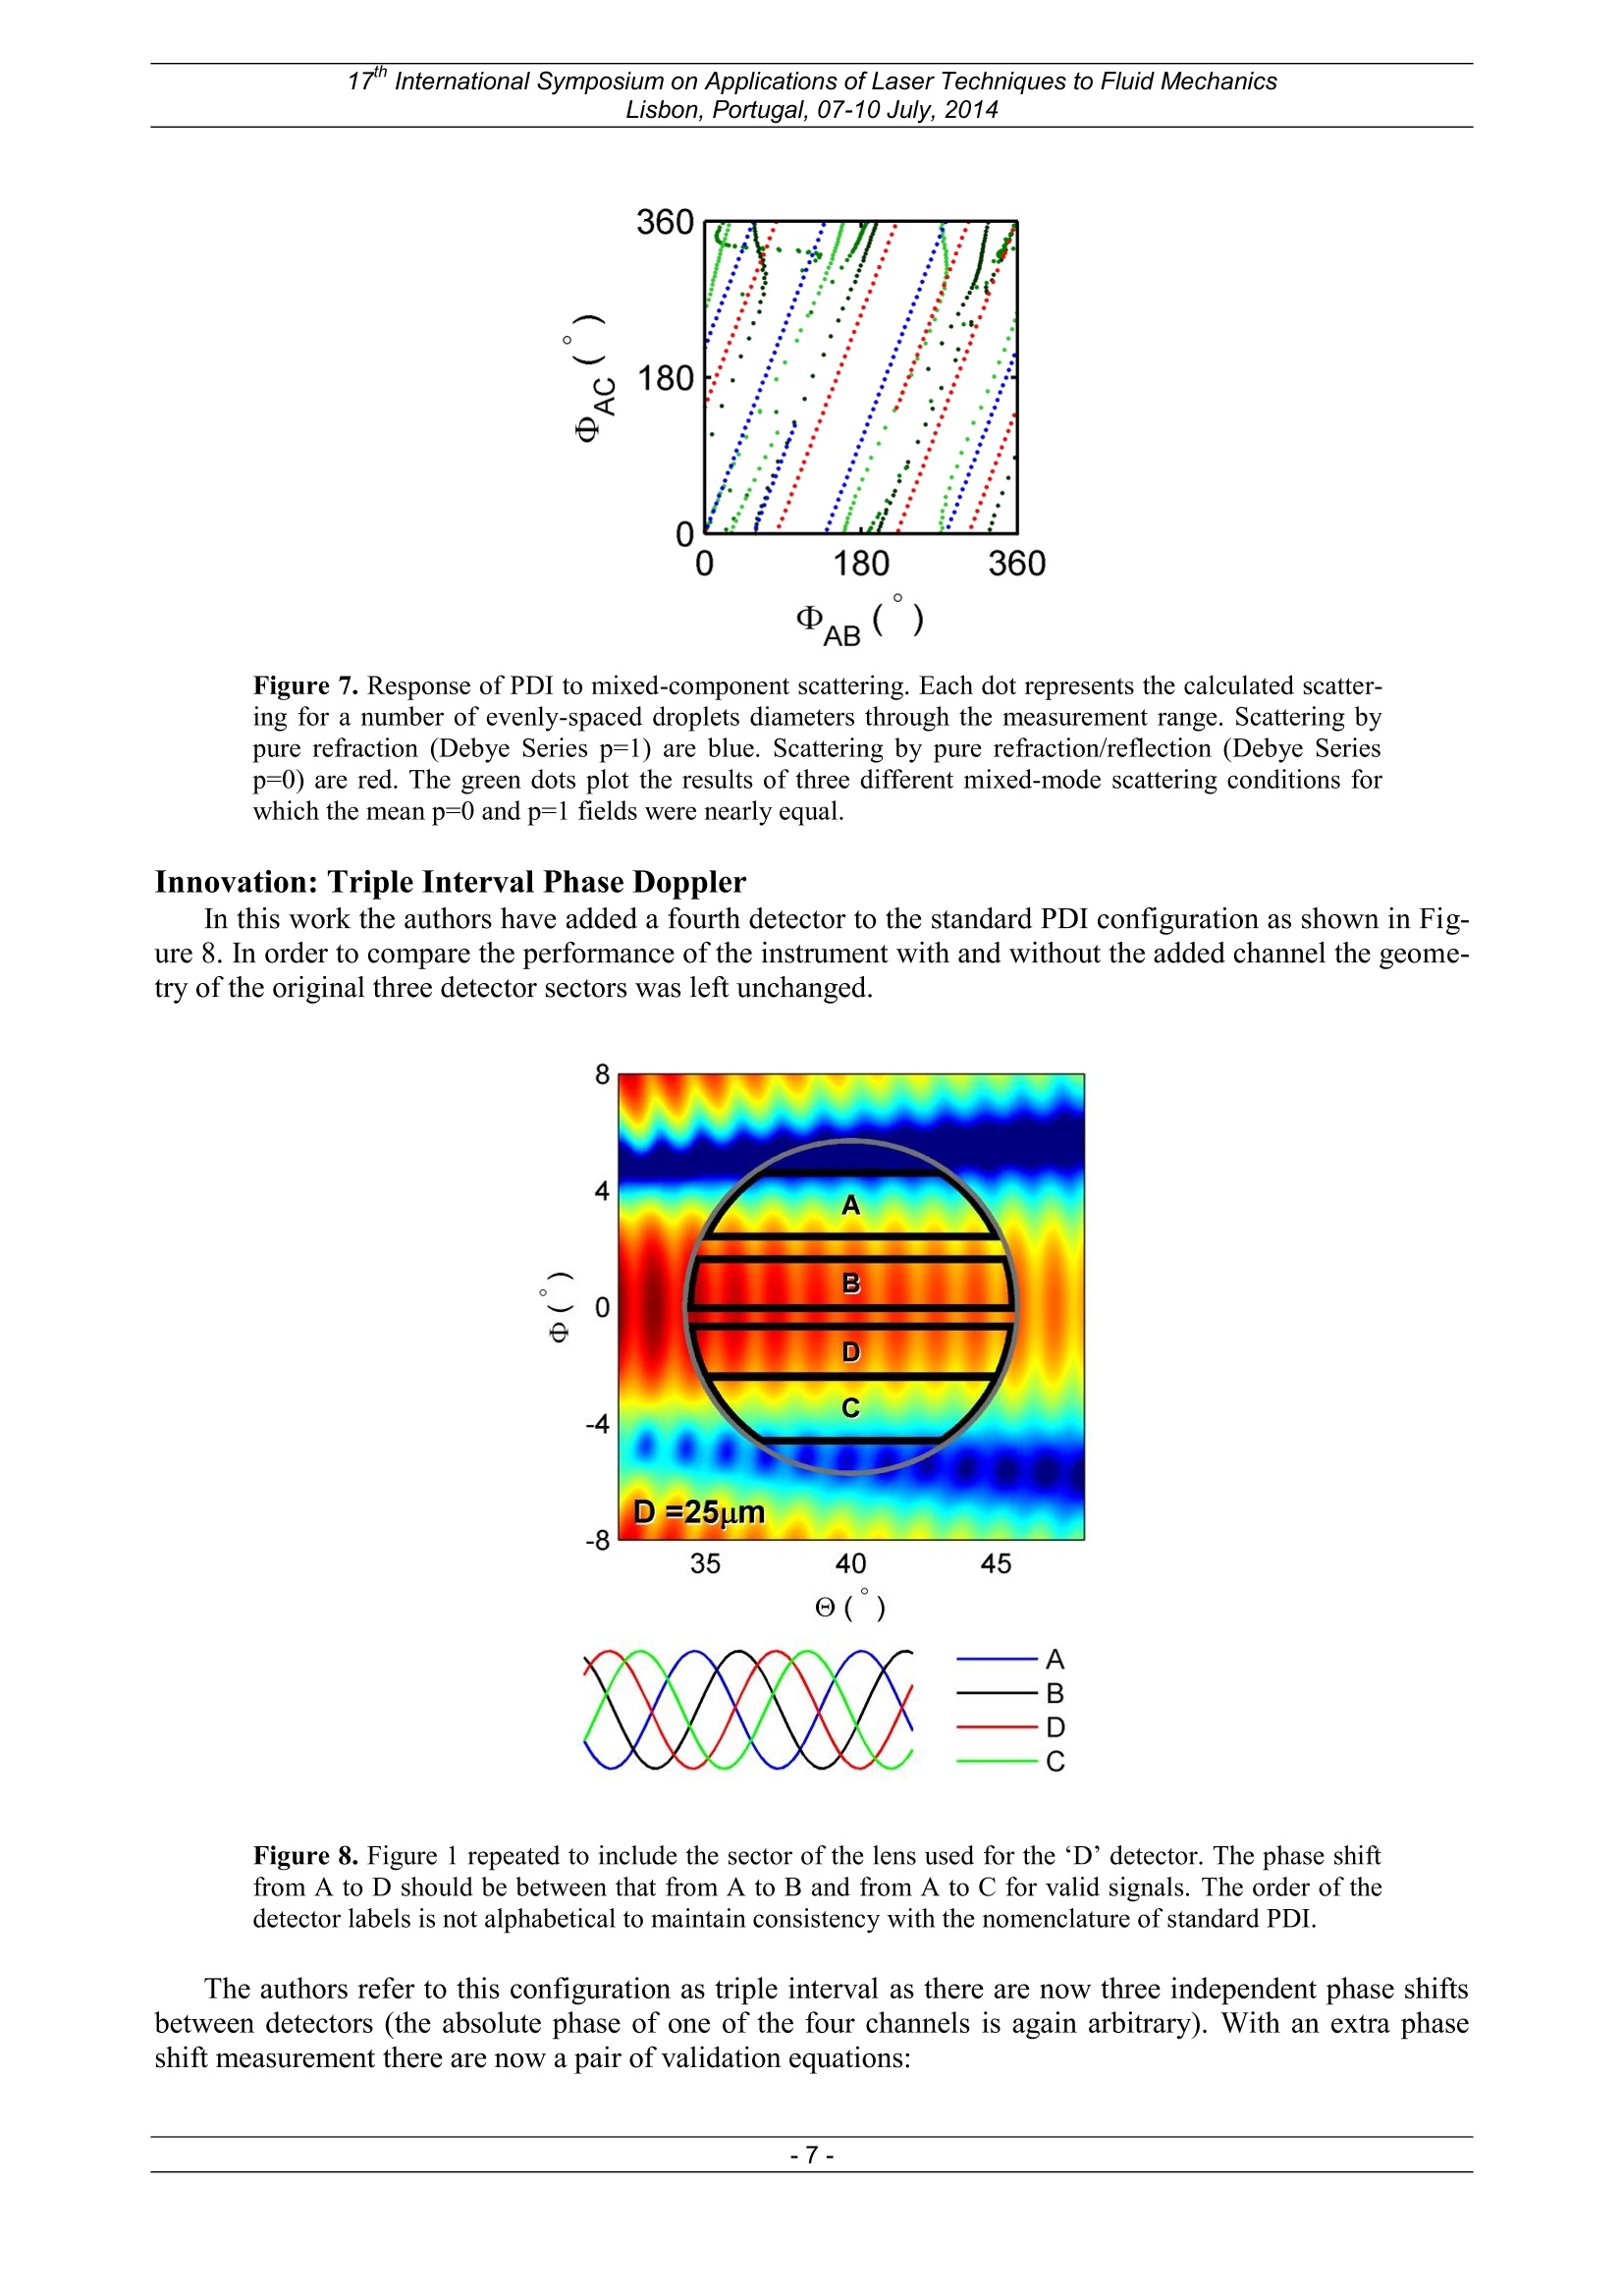
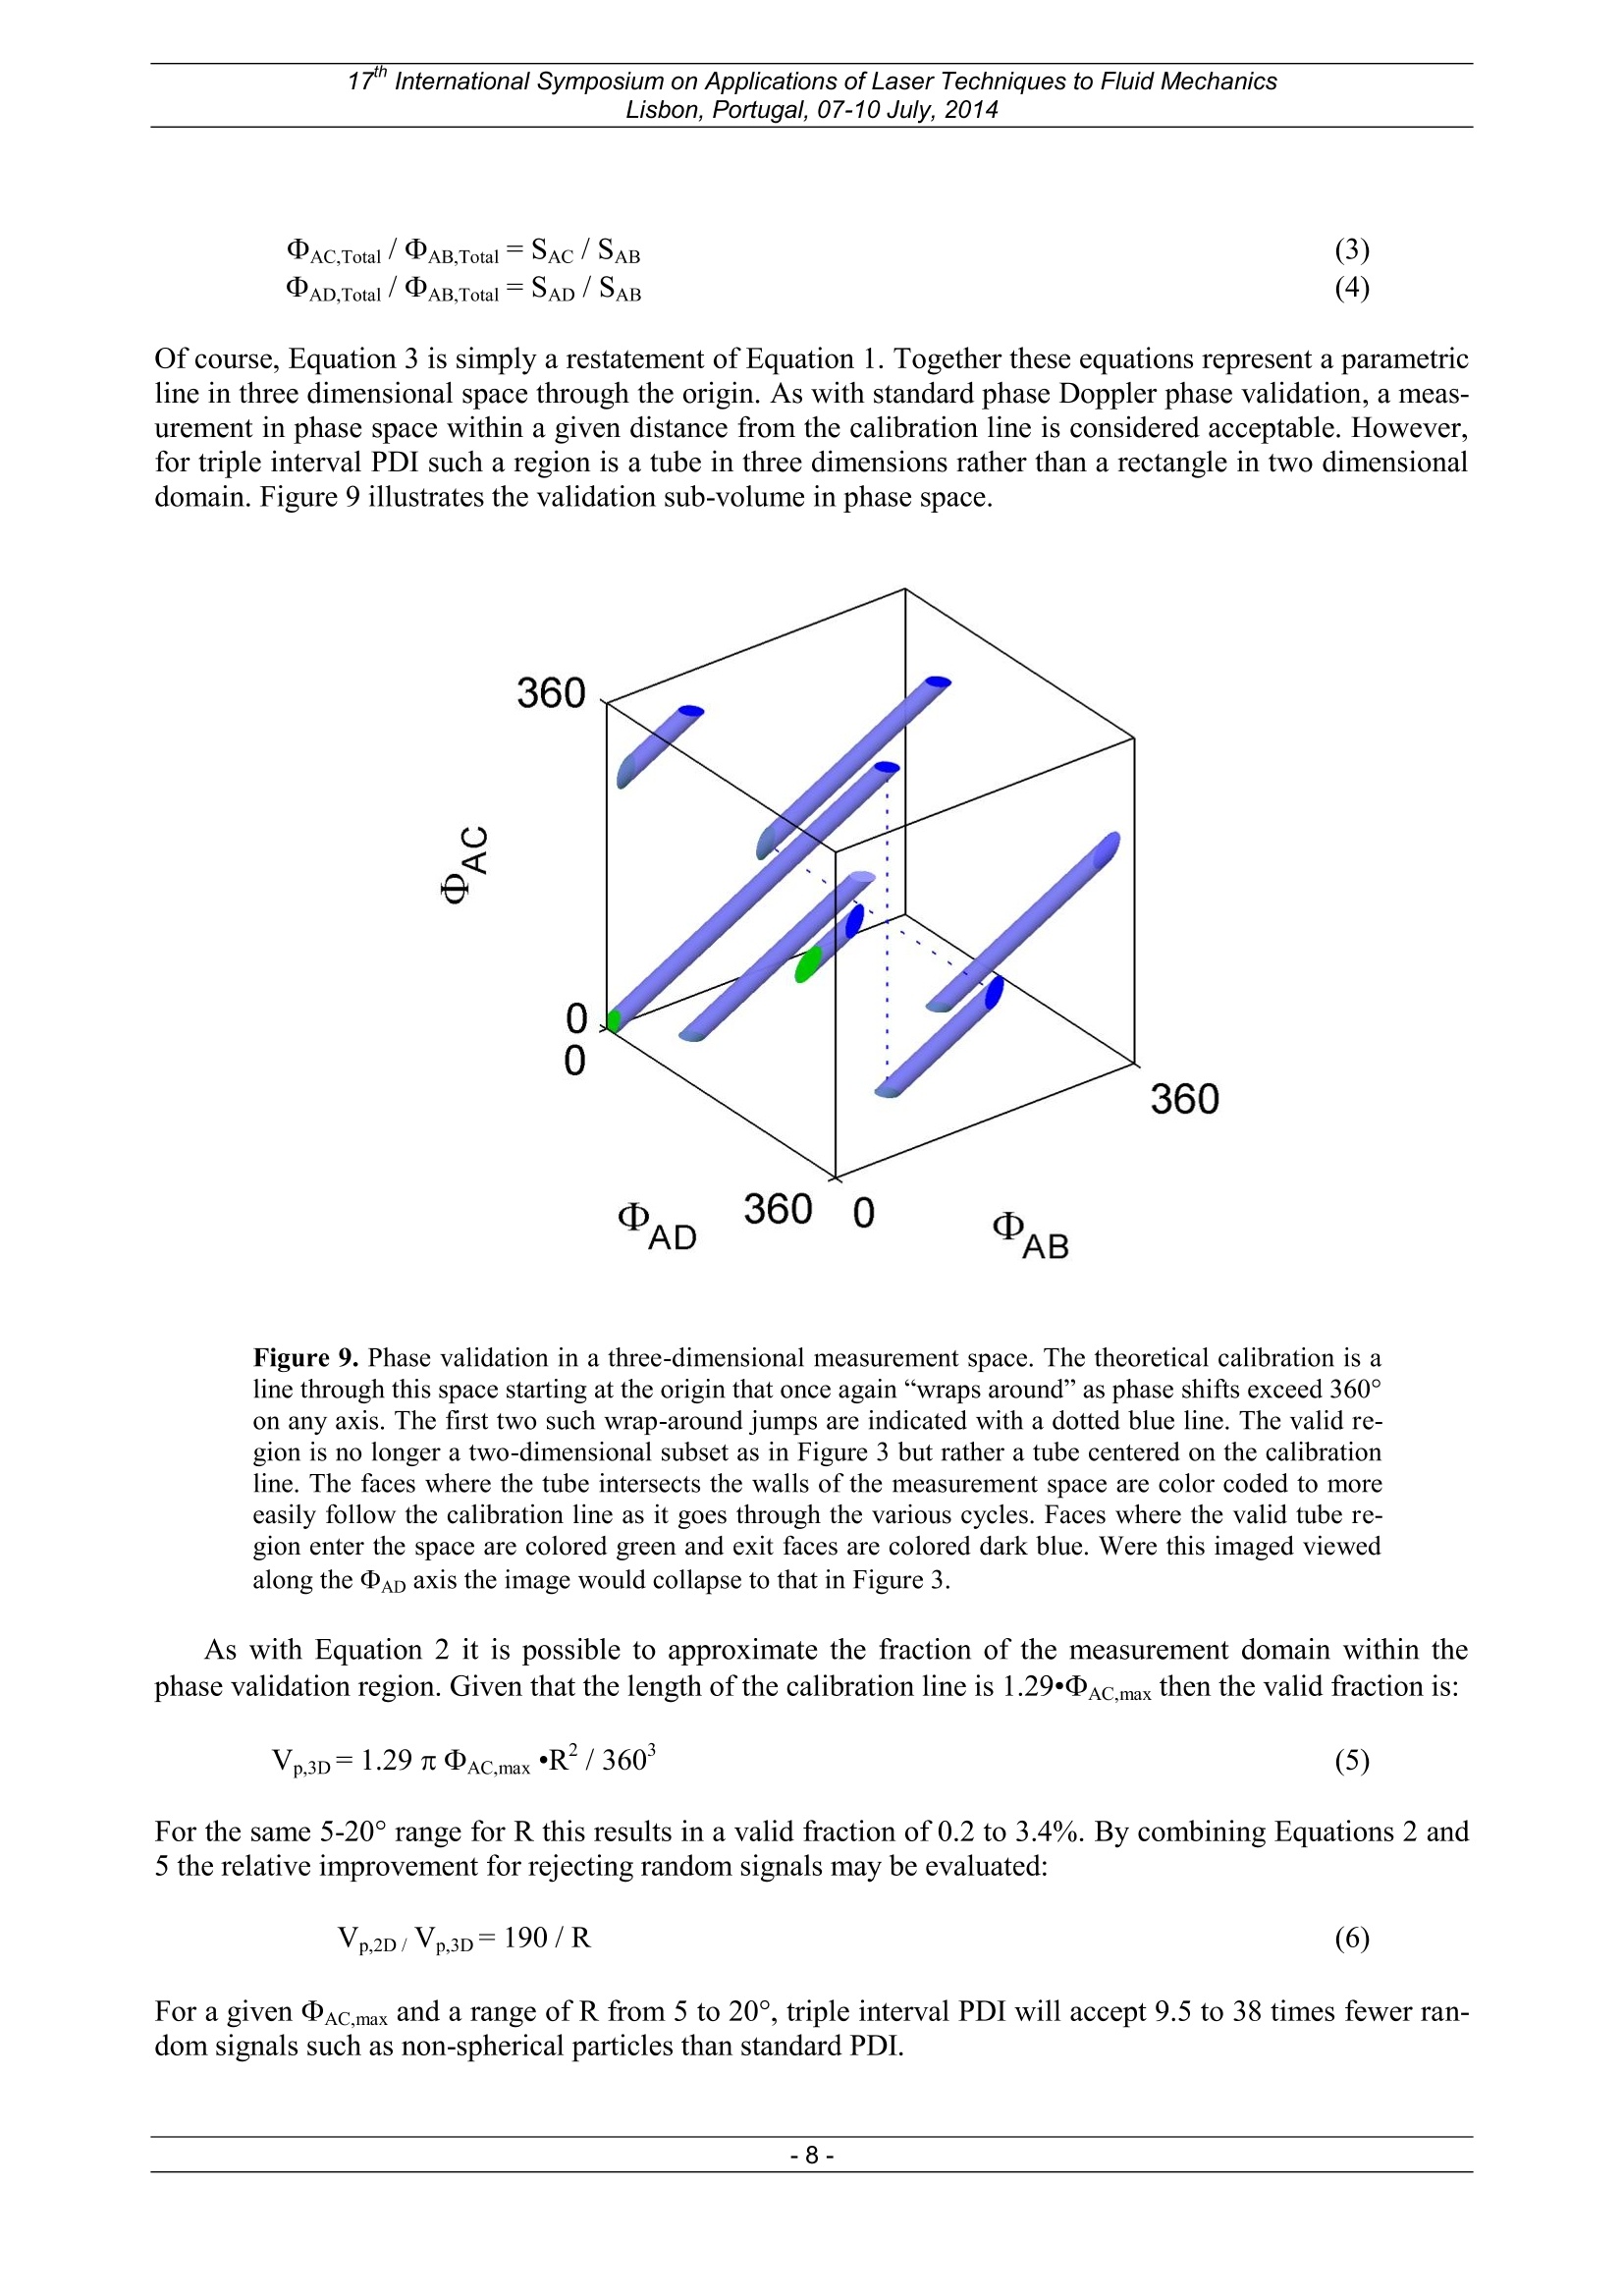
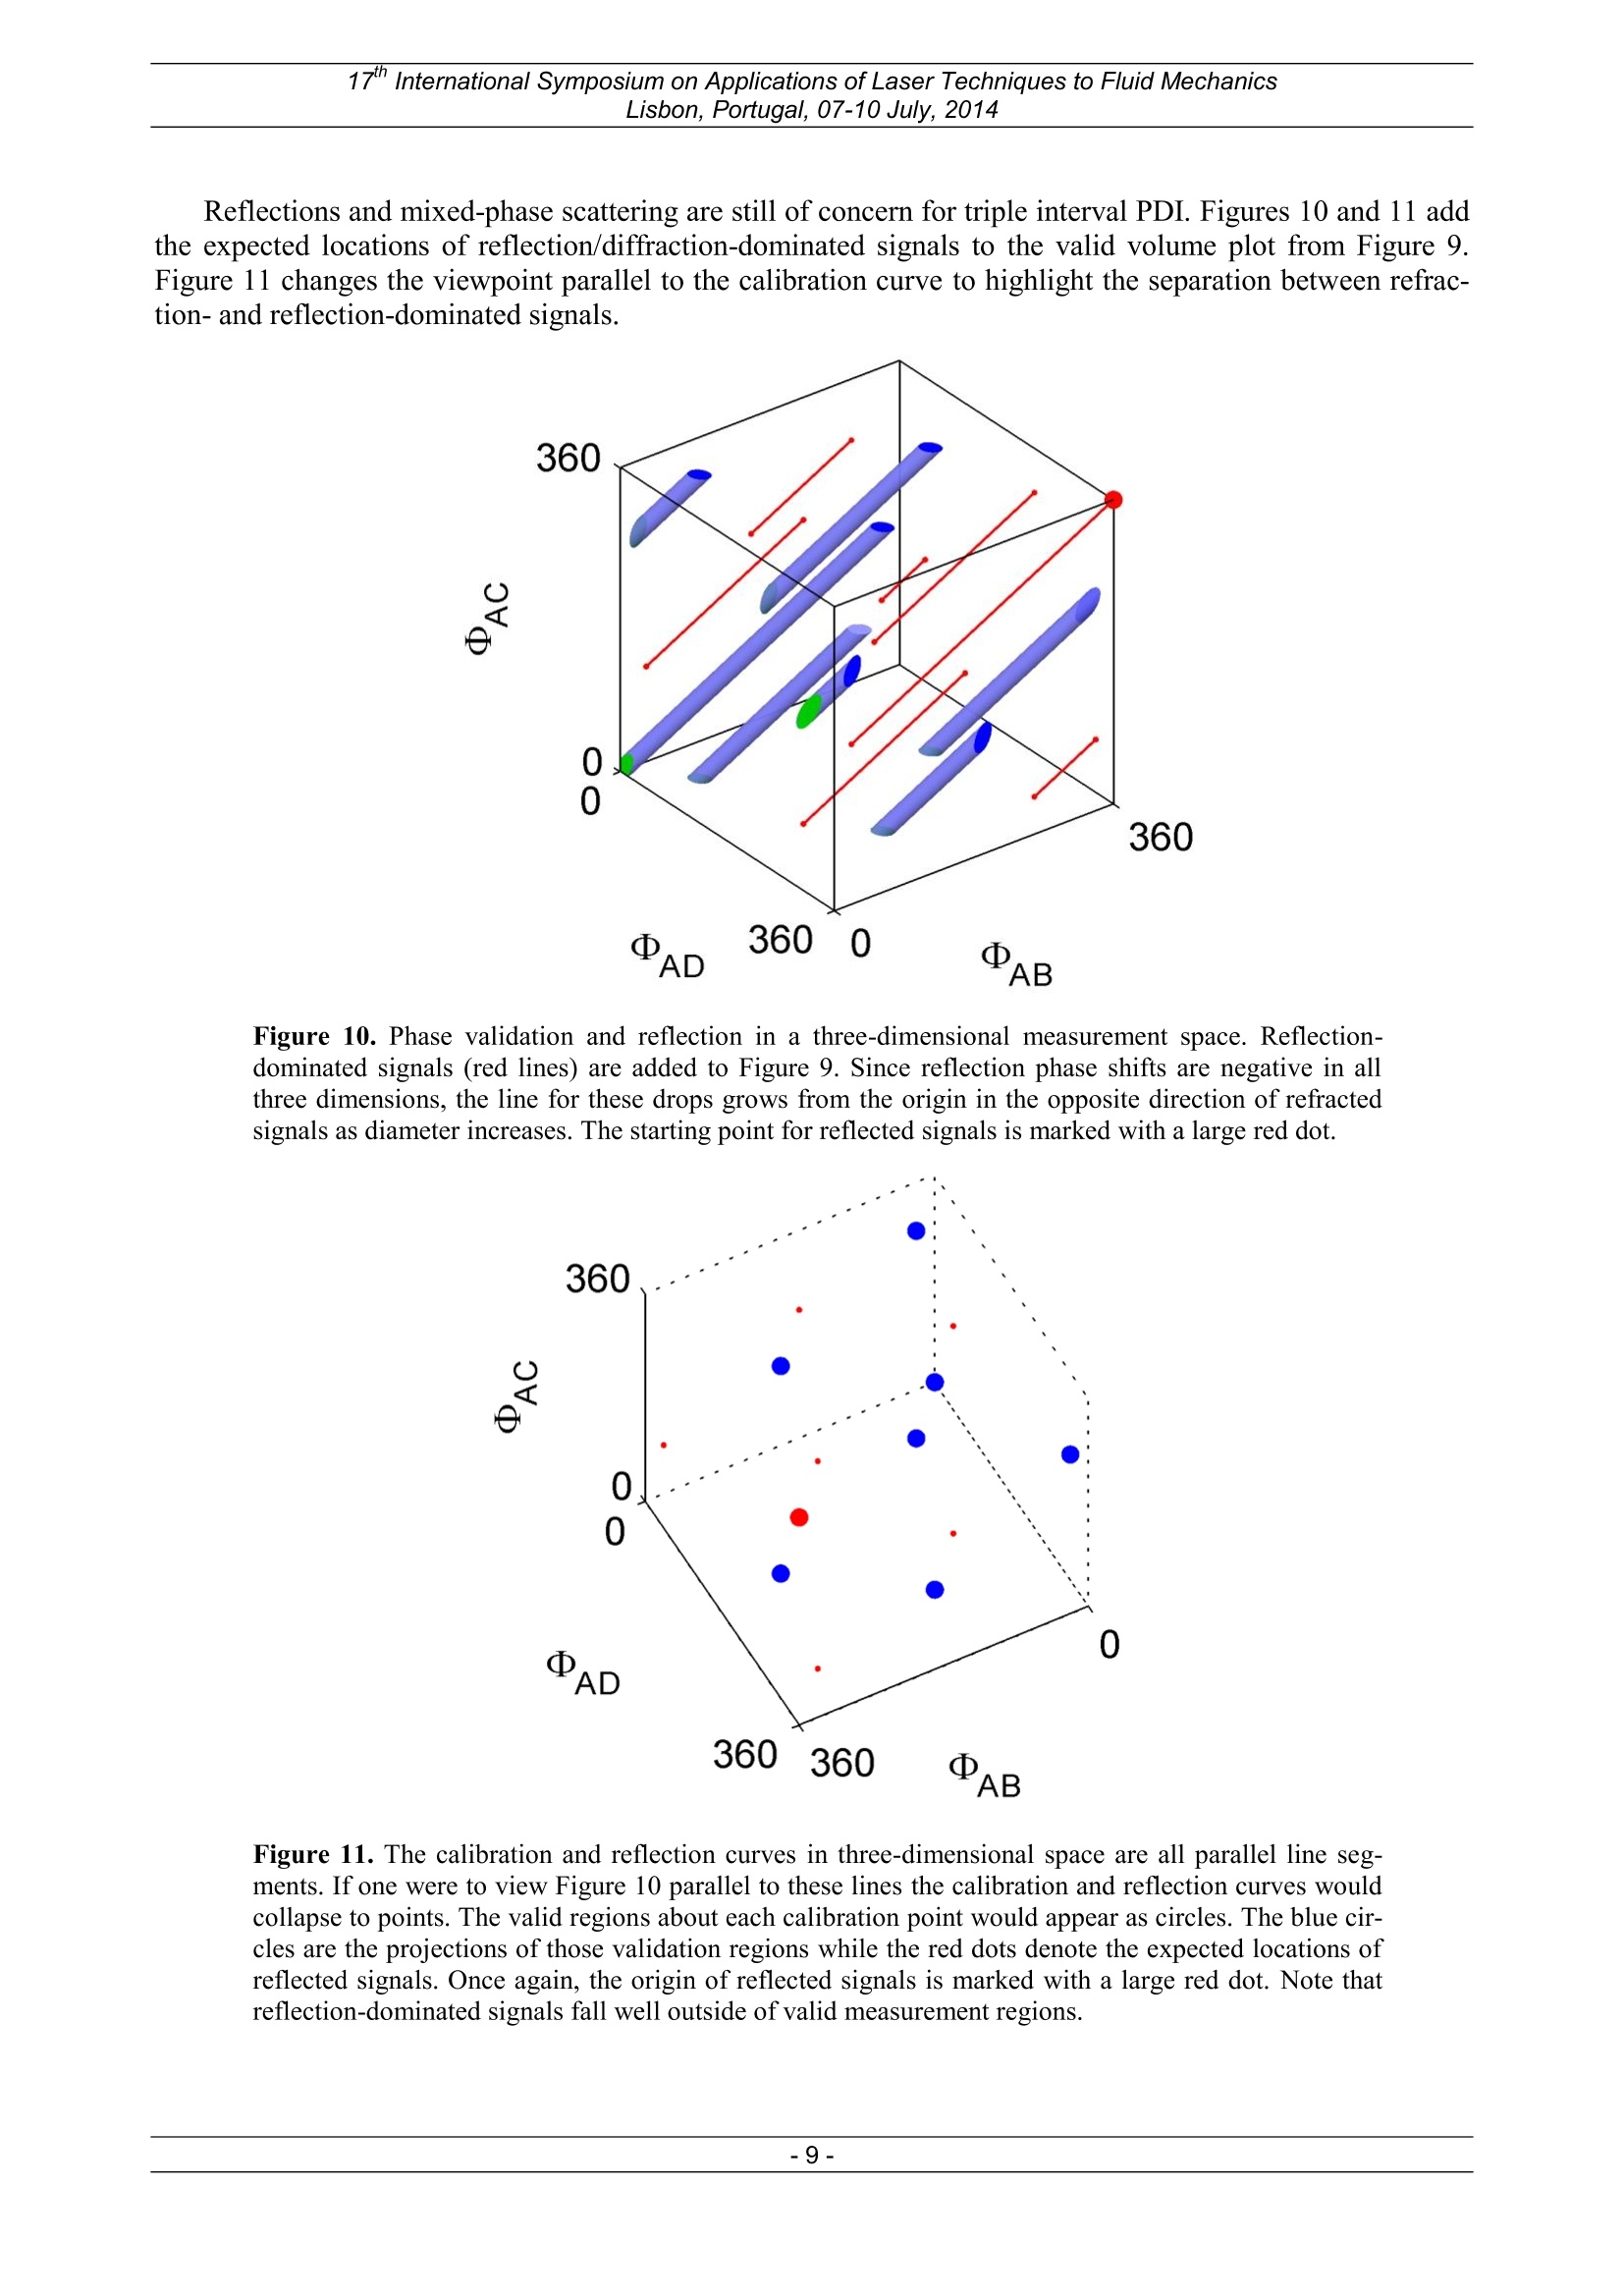
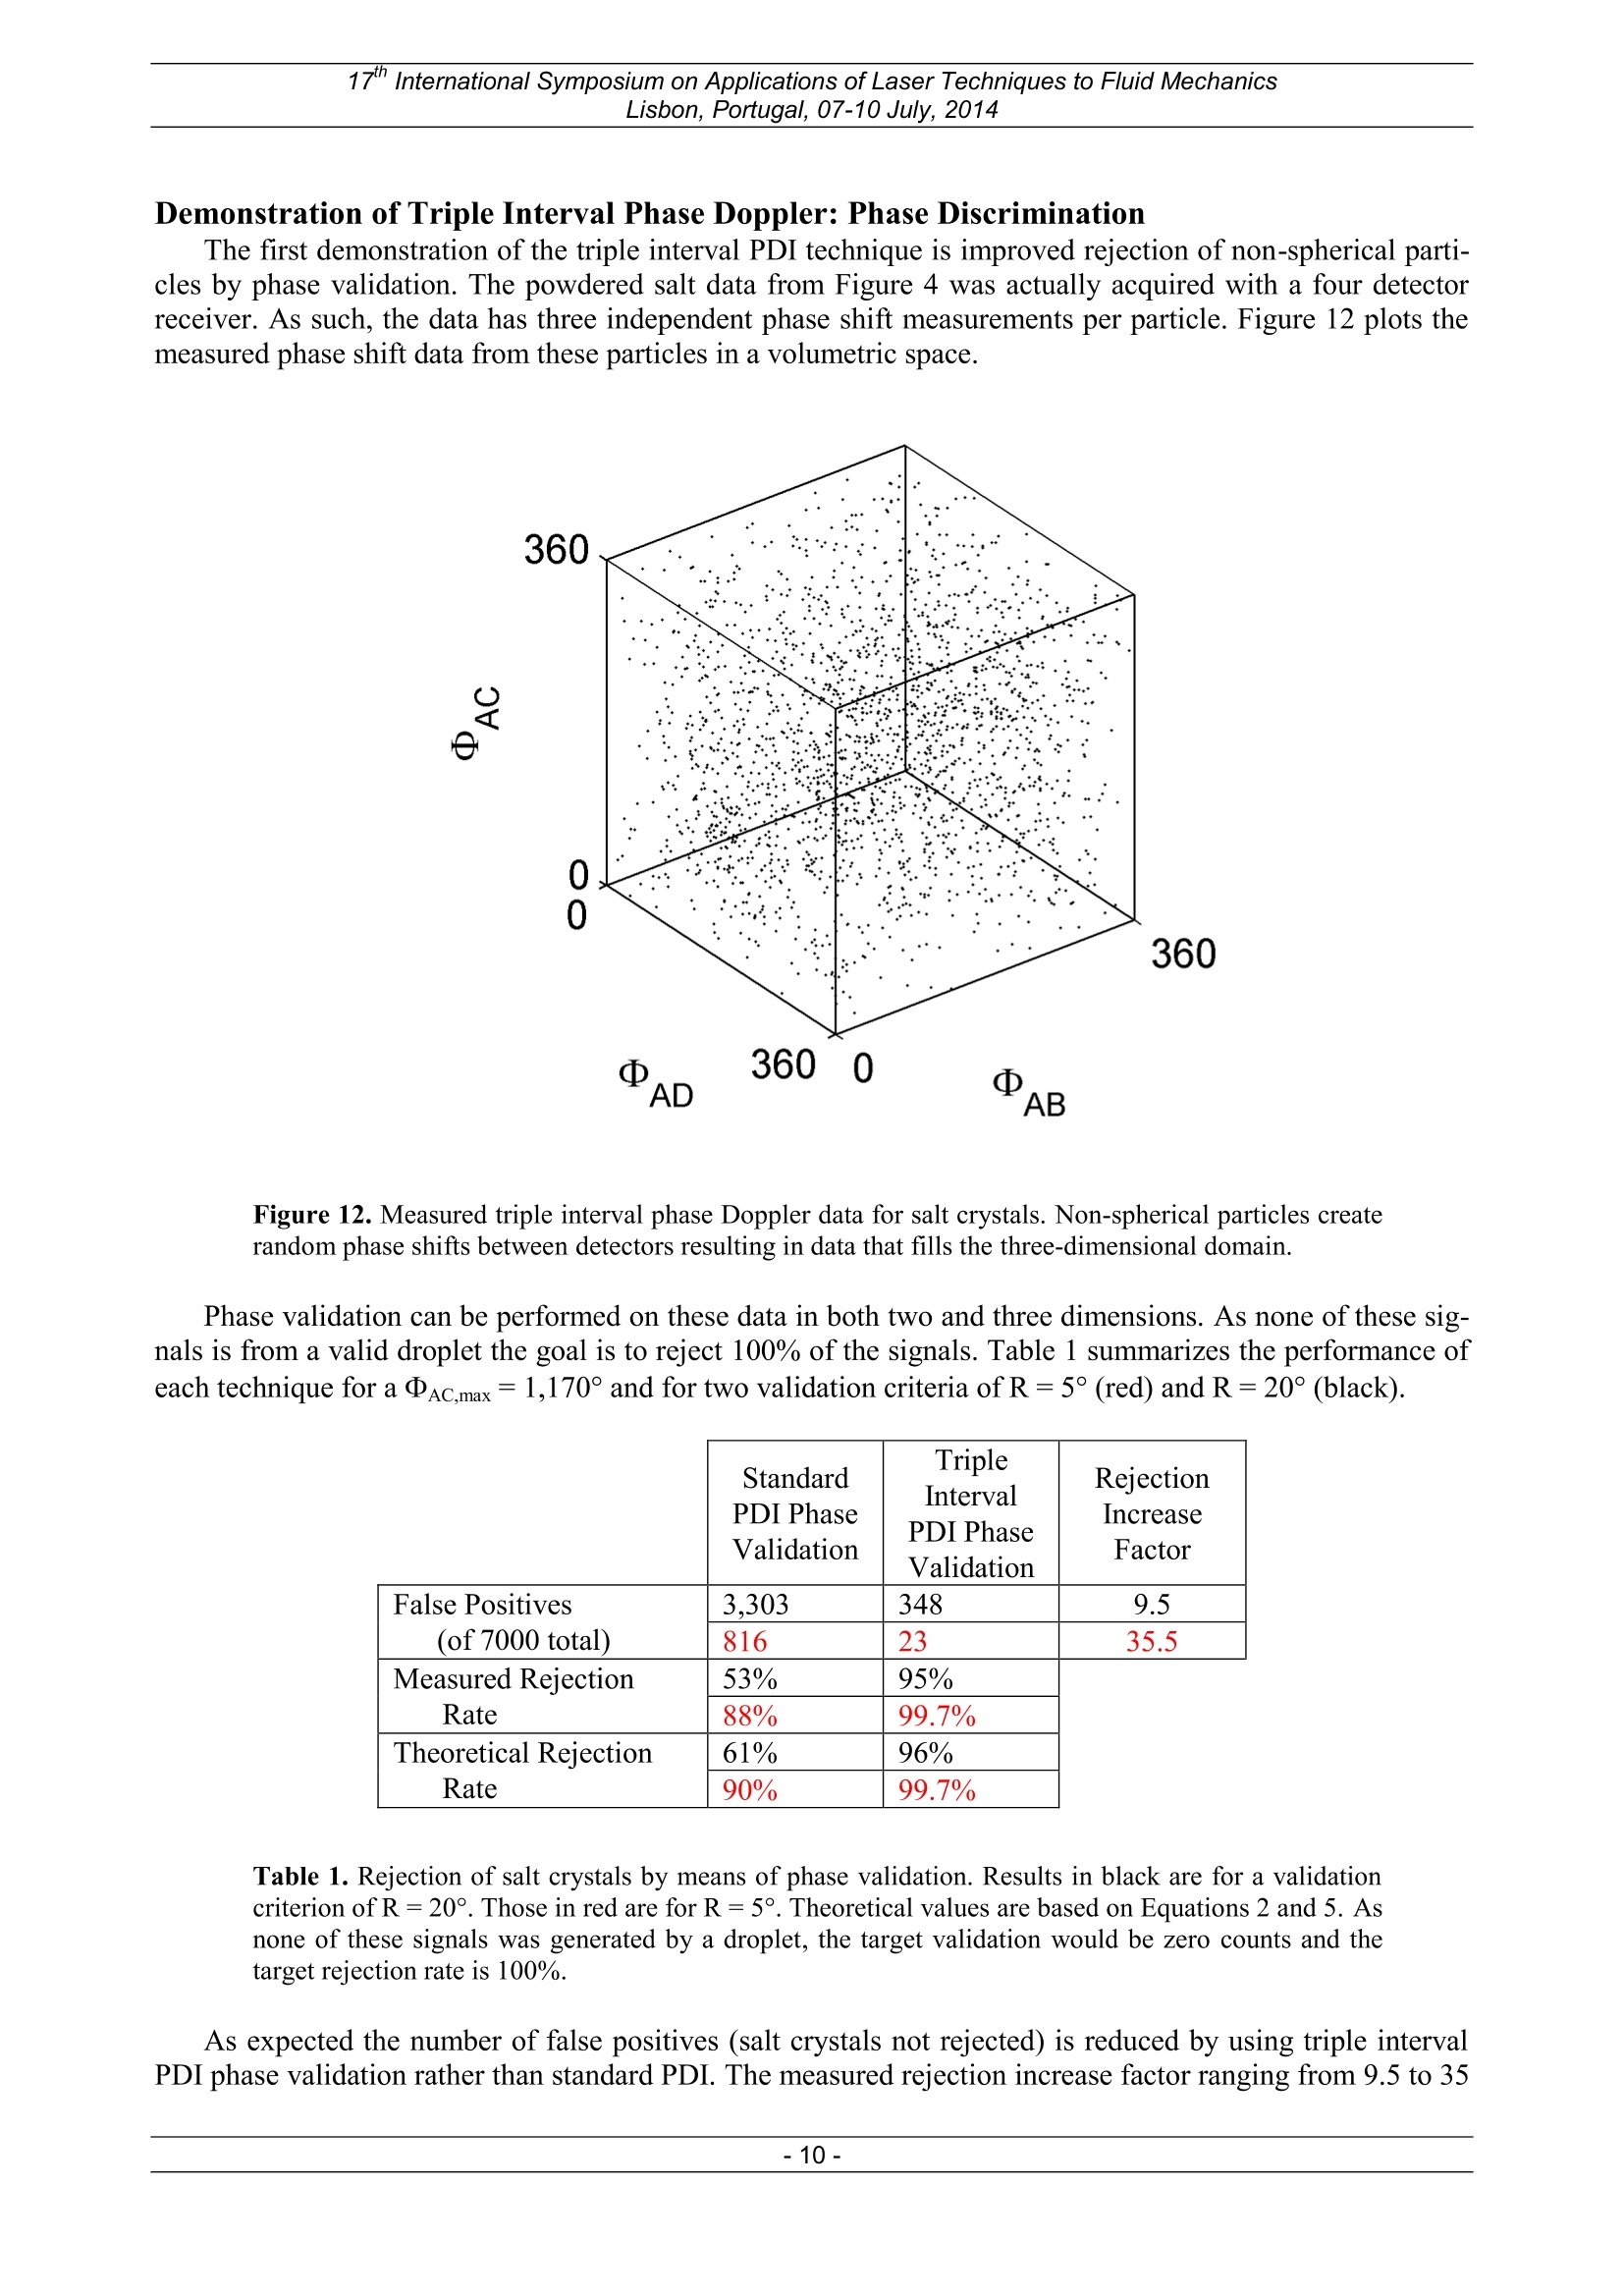
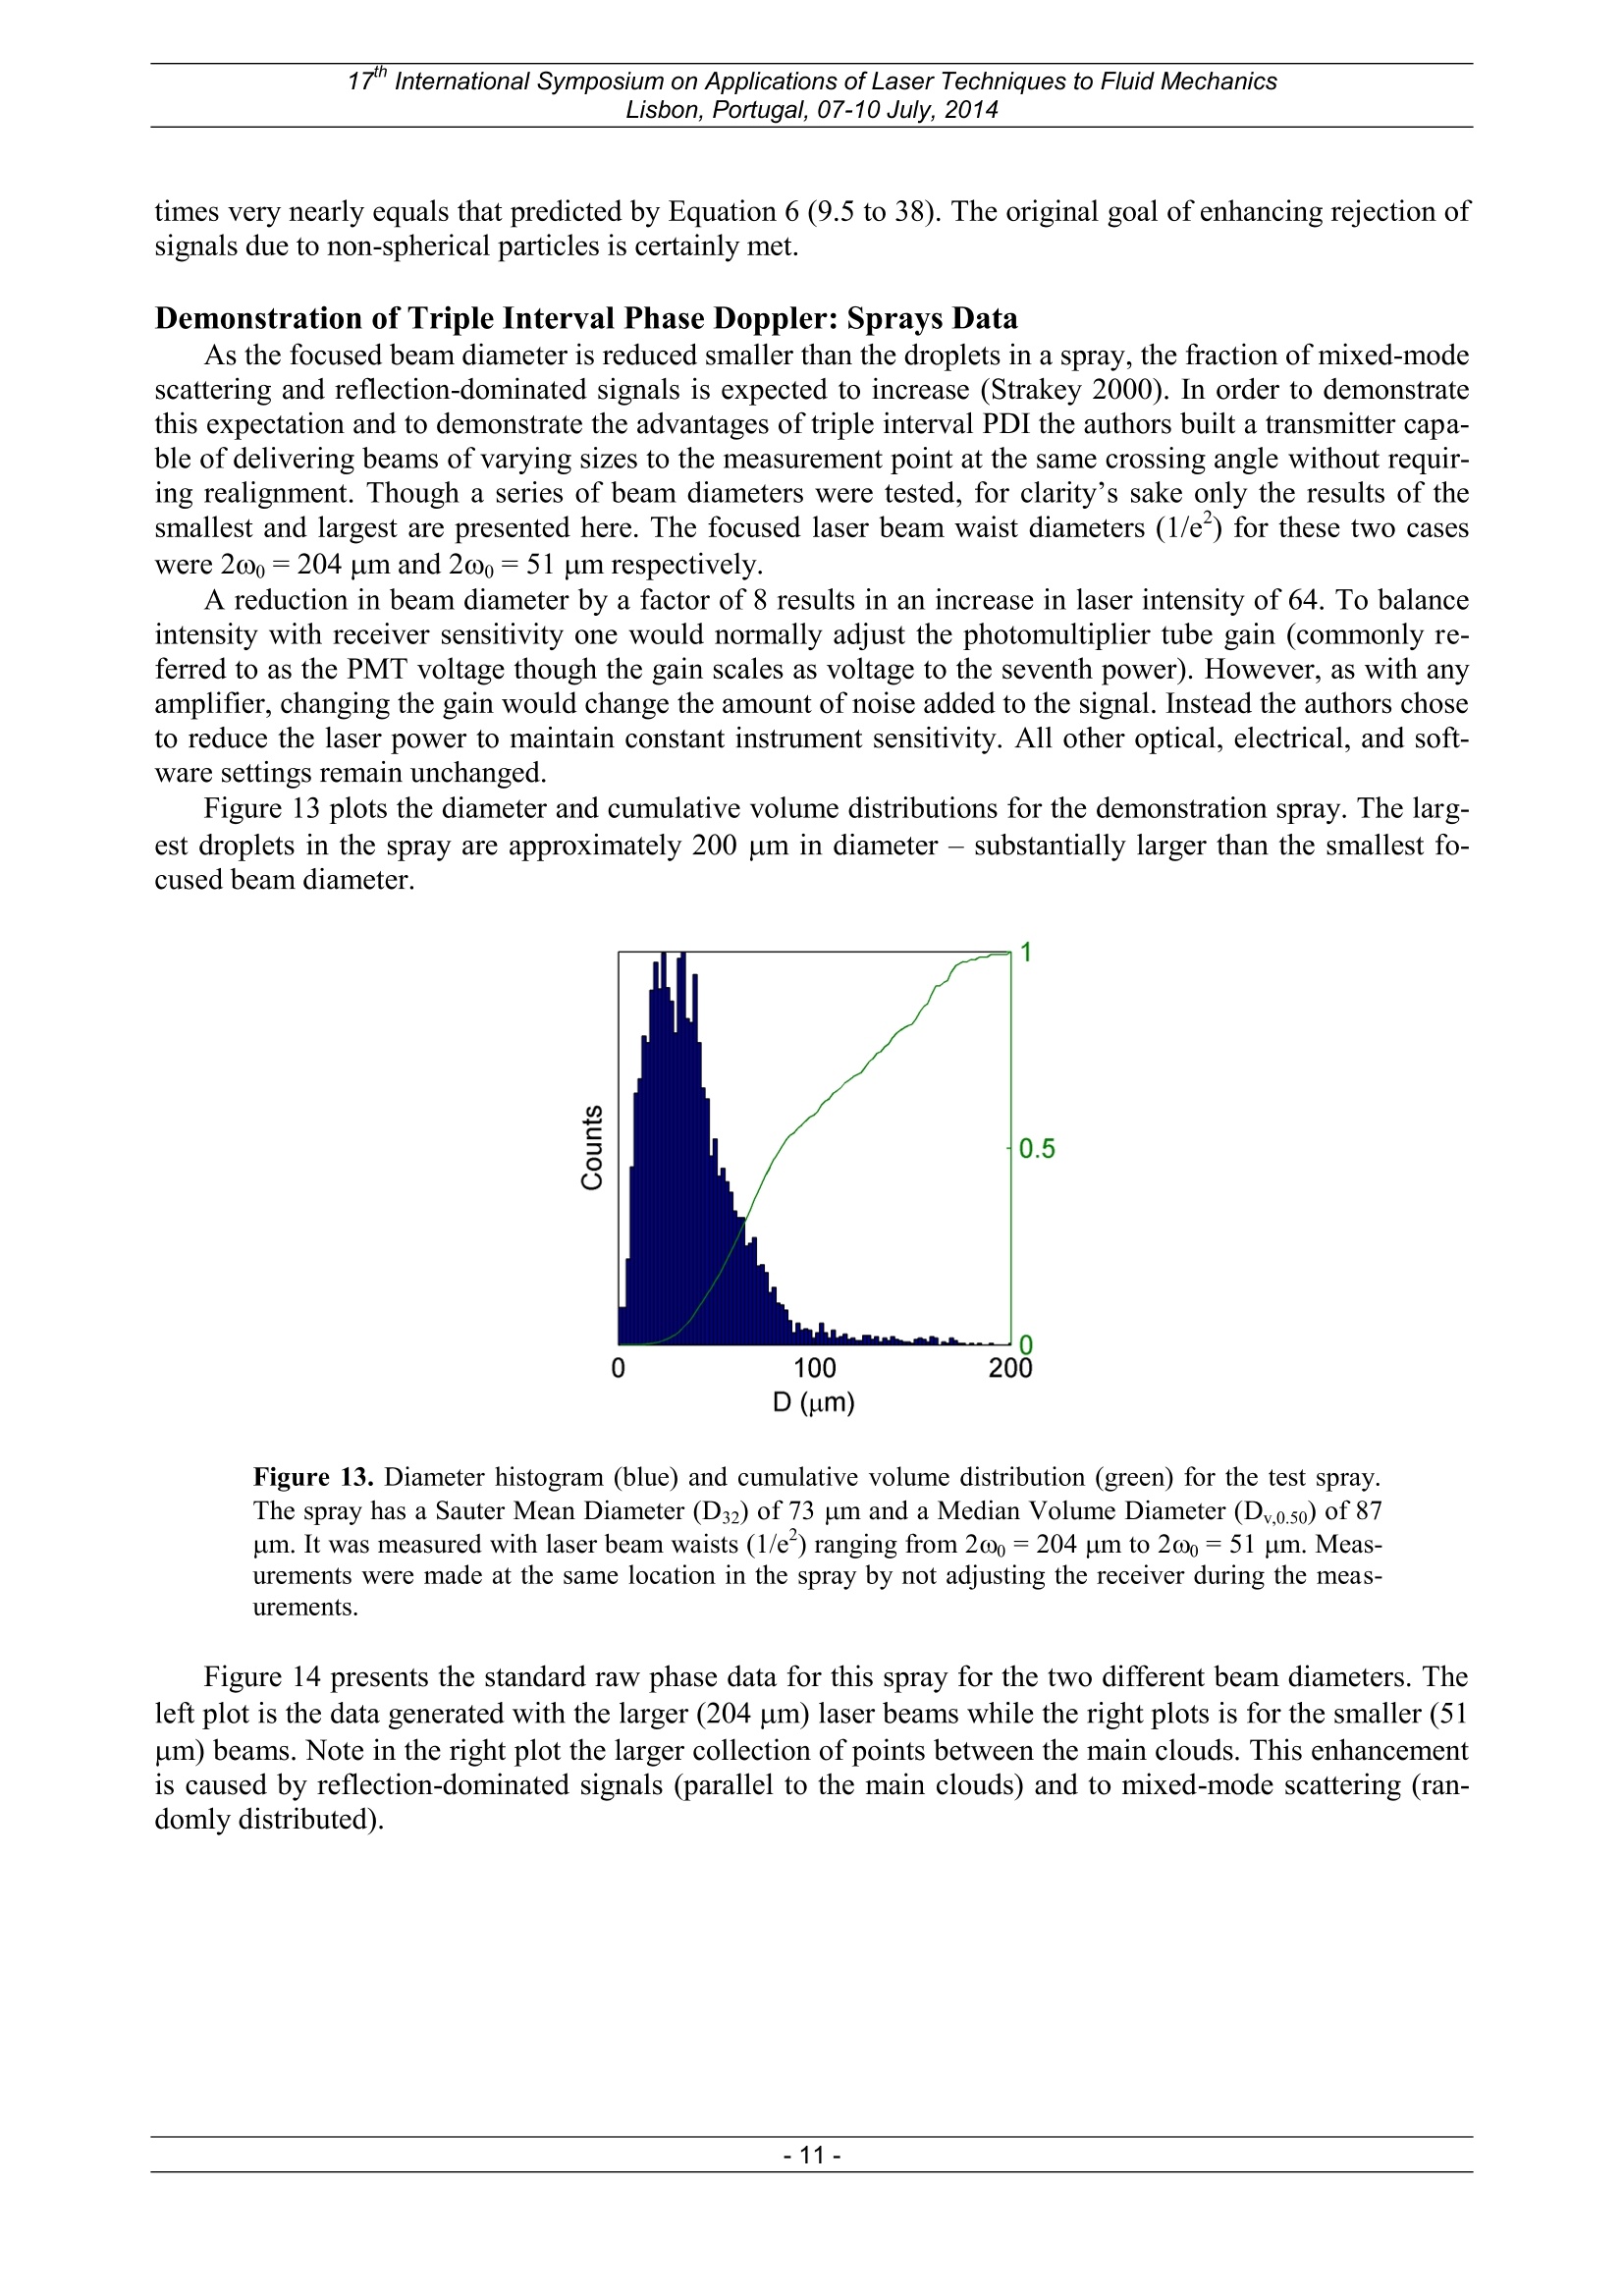
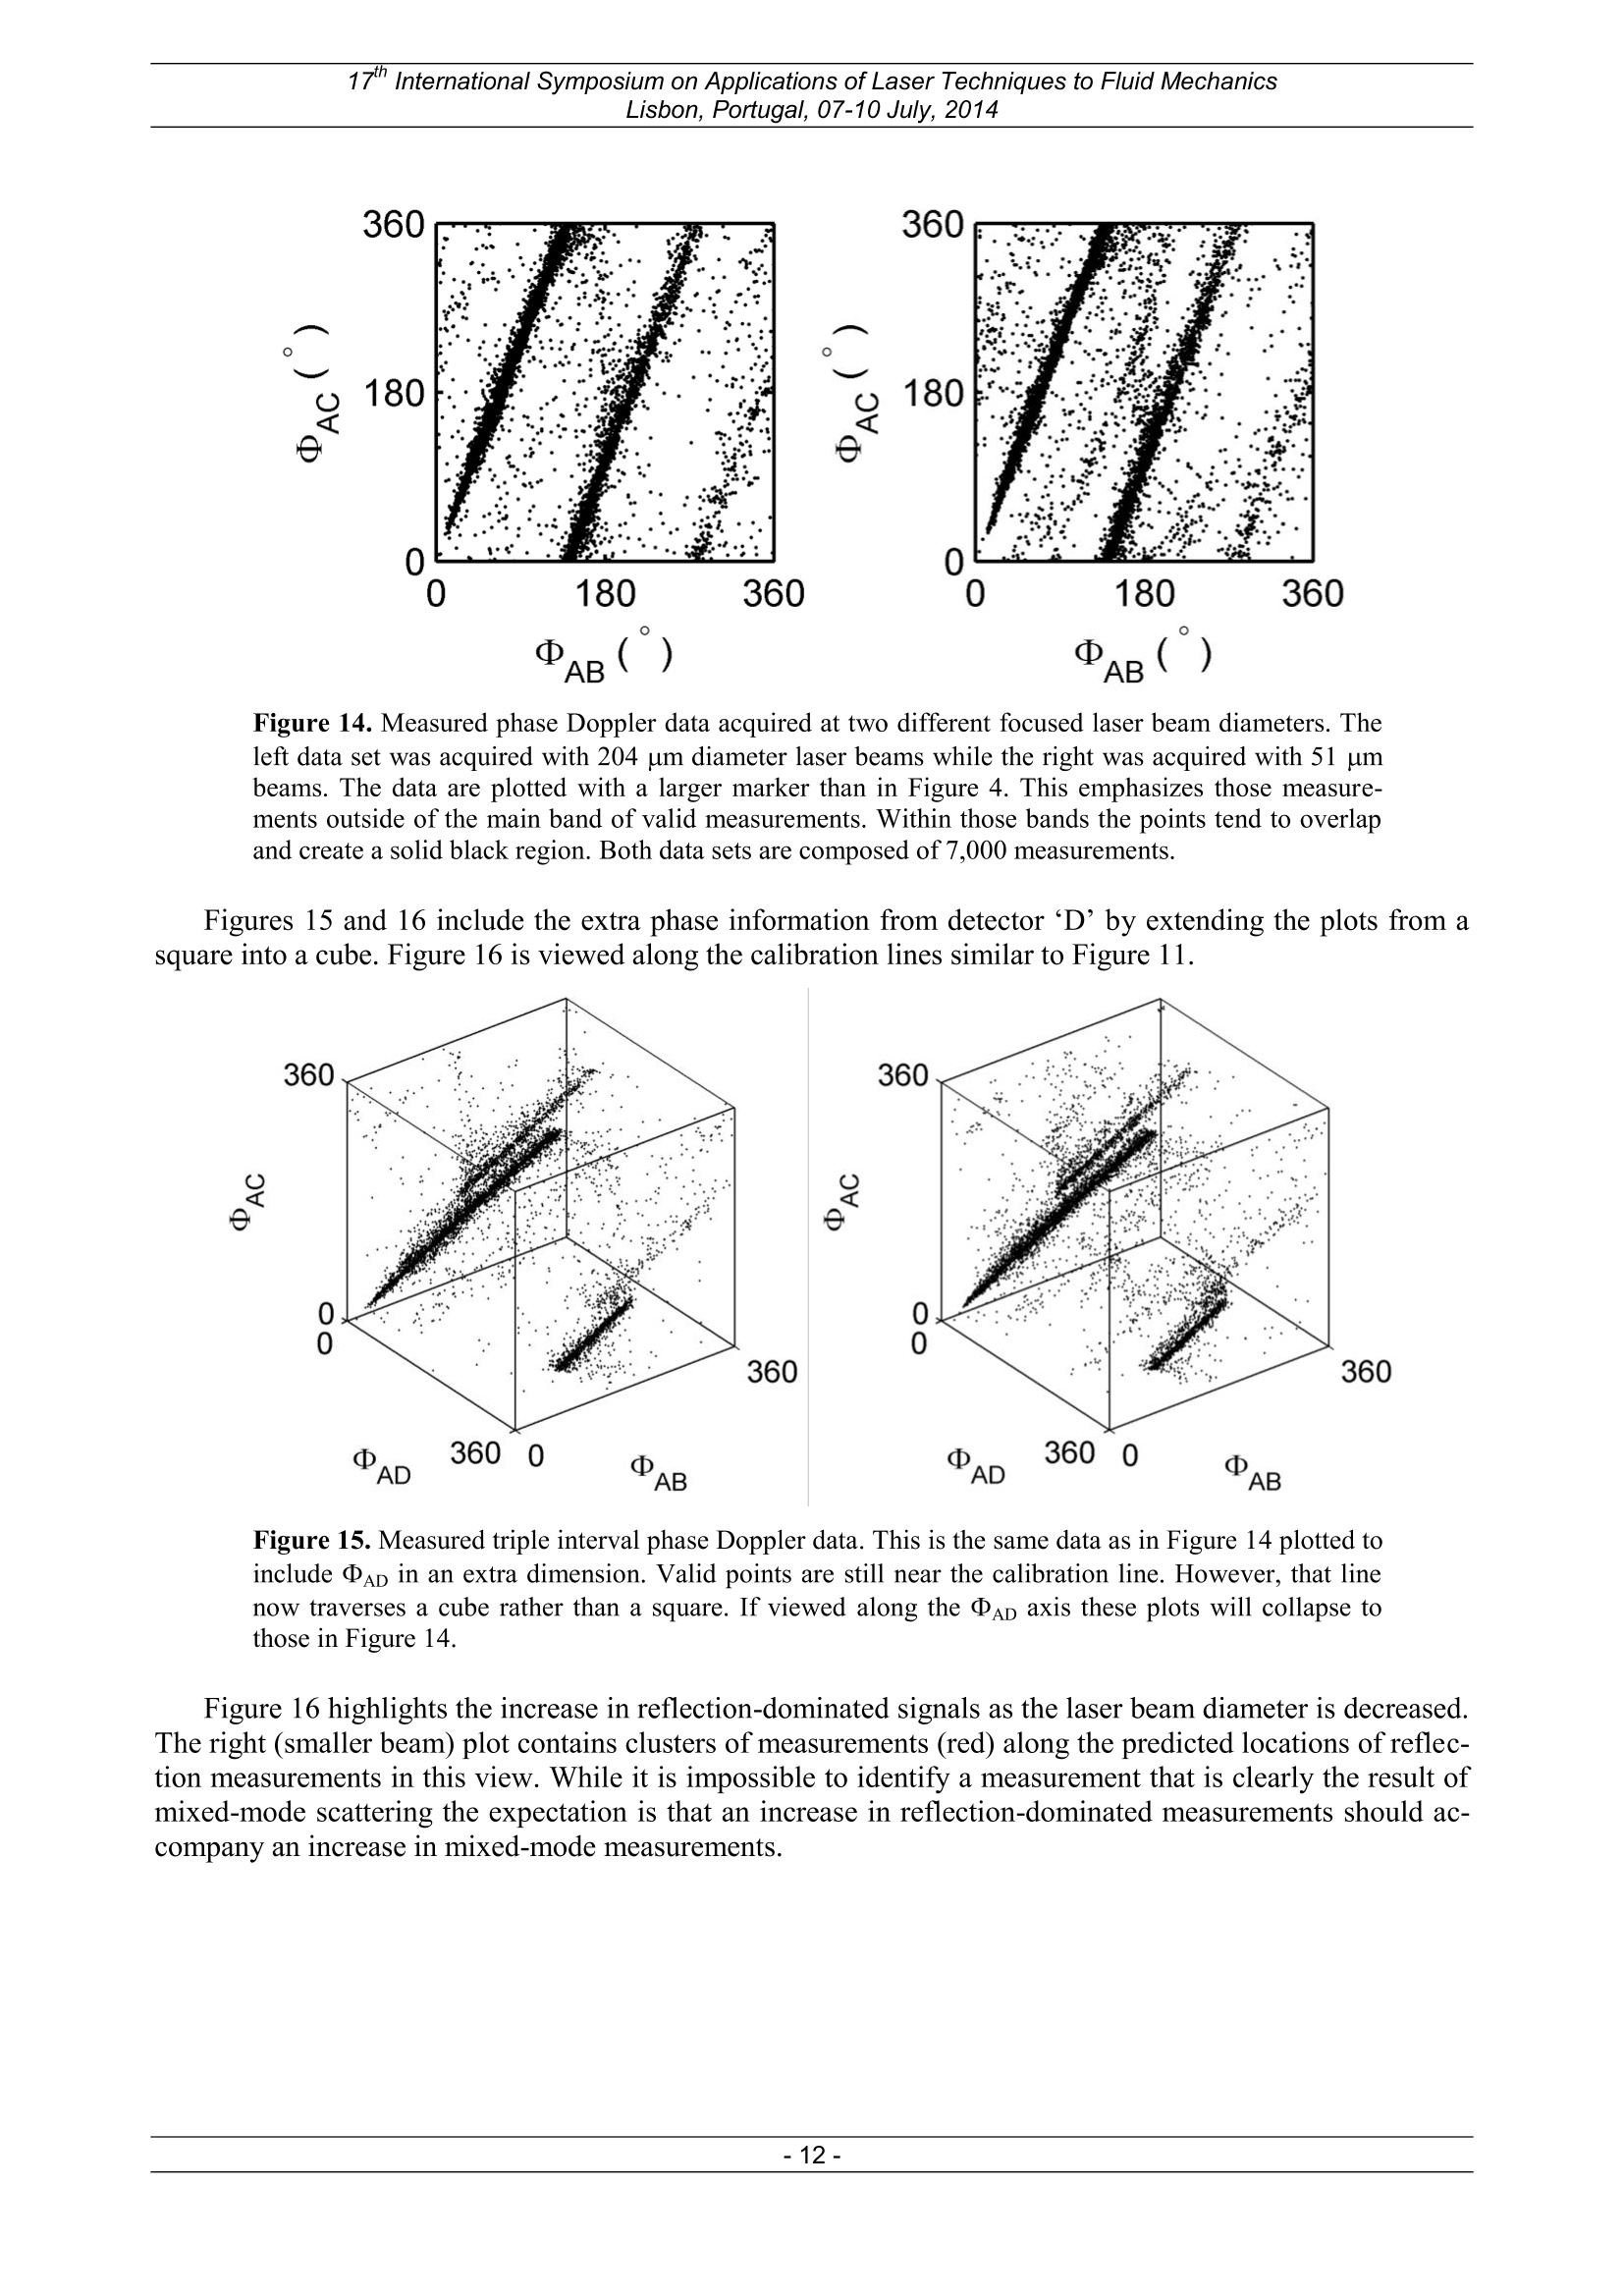
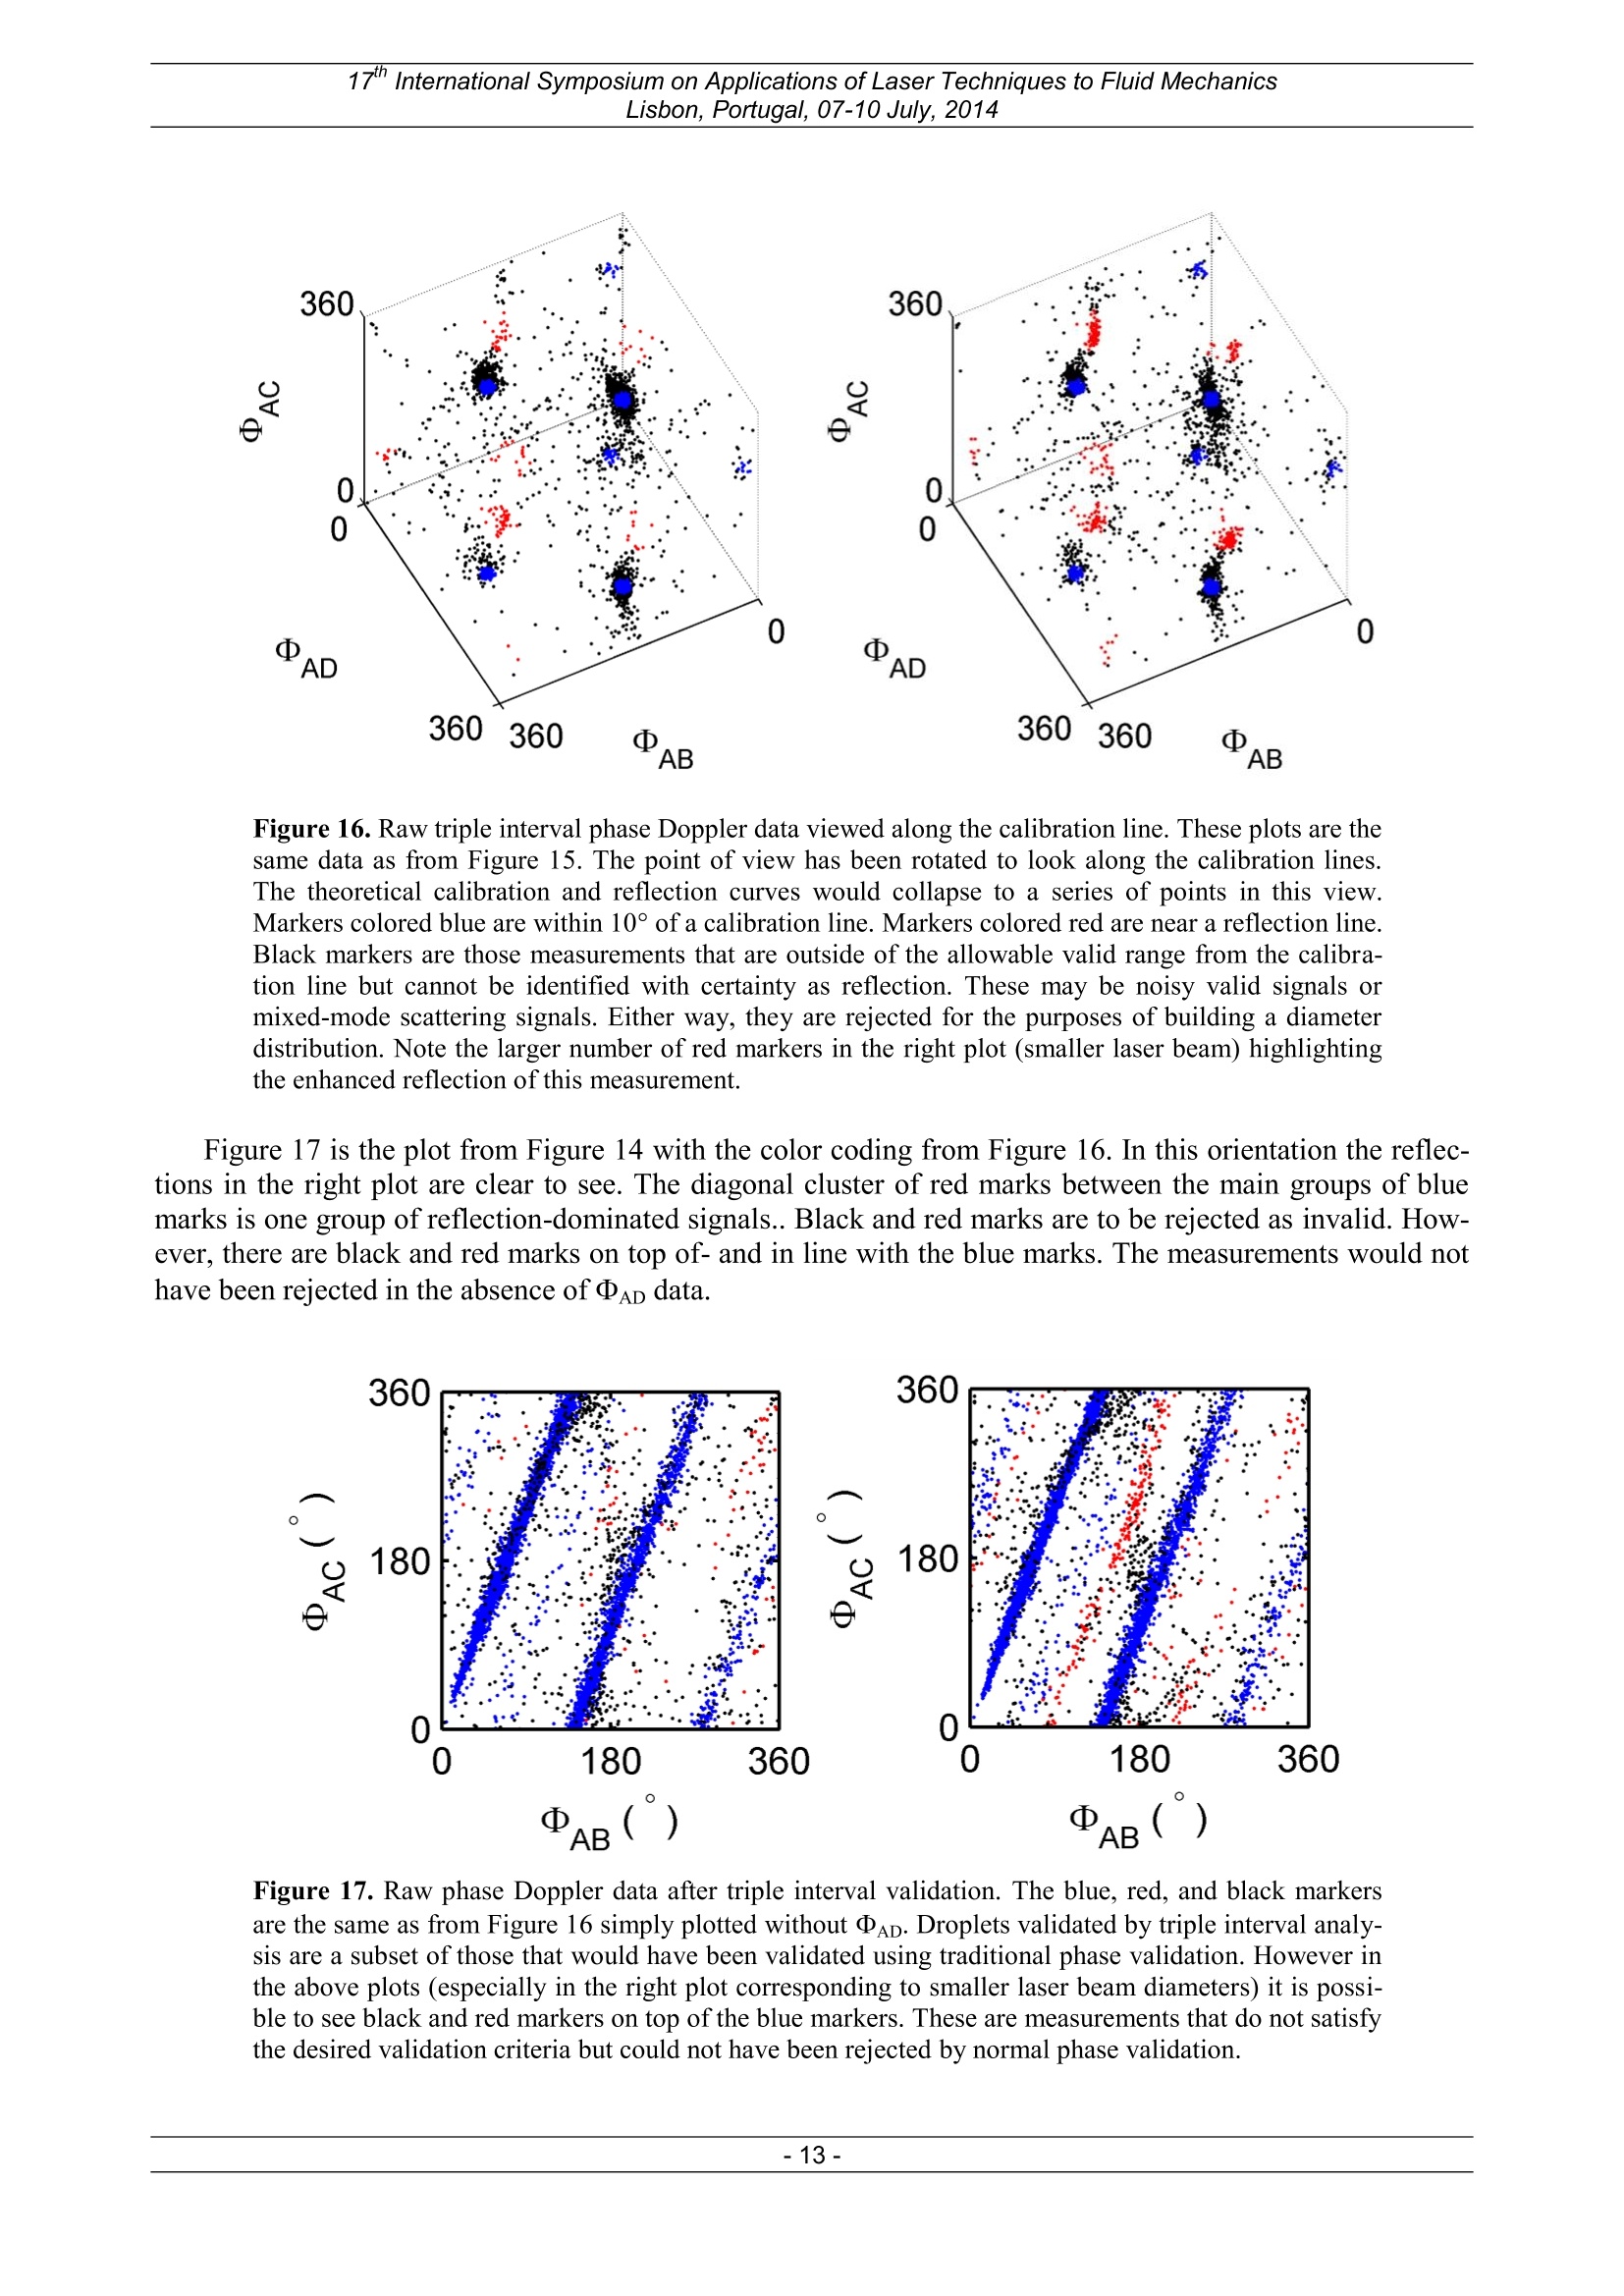
17" International Symposium on Applications of Laser Techniques to Fluid MechanicsLisbon, Portugal, 07-10 July, 2014 Triple Interval Phase Doppler Interferometry: Improved Dense SpraysMeasurements and Enhanced Phase Discrimination Chad M. Sipperley', William D. Bachalo 1: Artium Technologies, Inc., Sunnyvale, United States of America* correspondent author: csipperley@artium.com Abstract In this work the authors have added an additional sensor to the traditional Phase Doppler Interferometry (PDI)configuration yielding three independent measures of phase shift between detectors. This seemingly minor enhance-ment has a profound impact on the limitations ofthe PDI technique in two important areas: the minimum laser beamdiameters and the ability of the technique to discriminate liquid droplets from solid particles. Phase Doppler measurements can be impacted by reflection/refraction errors in which a droplet’s measured diameter issubstantially different from its actual size. This is most critical when small droplets are measured as very large but theconverse is possible as well. Consideration for this error source places a major constraint on the minimum laser beamdiameter at the measurement volume. The addition of a third independent measure of phase shift effectively eliminatesreflection/refraction errors allowing PDI measurements with smaller laser beams than would ordinarily be recommend-ed. The authors demonstrate this ability by measuring the same location of a spray with decreasing laser beam waists.Since the droplet number density limit of the Phase Doppler technique scales inverse to the square of the laser beamdiameter, such an optical configuration would substantially enhance the instrument’s performance in dense sprays ap-plications. For applications such as icing cloud measurements, the ability to discriminate and size only liquid droplets in a mixed-phase environment is an important capability ofthe PDI technique. The relationship between the phase shifts of PhaseDoppler signals can be used to differentiate liquid droplets or other spherical particles from irregularly-shaped solids.The authors demonstrate that the addition of a third independent measure of phase shift reduces the number of falsepositives (solids measuring as droplets) by a large factor - from 11.7% to 0.33% in one example. 1.Introduction Phase Doppler interferometry (PDI) is a robust and mature technique for measuring droplet size and ve-locities in sprays (Bachalo 1980, Bachalo and Houser 1984). One aspect of PDI is the ability to identify anddiscriminate signals generated by droplets vs. those created by non-spherical particles. In an effort to im-prove the phase discrimination of liquid water droplets from ice crystals in icing flows the authors have pro-posed and demonstrated the“triple intervalextension to the standard PDI. By adding a fourth detector tostandard three detector PDI configuration the authors have greatly enhanced the technique’s ability to rejectsignals associated with non-spherical particles and of random noise sources in general. It is the rejection ofrandom noise sources that extends the operation of general PDI to smaller focused laser beam diameters thanwould ordinarily be recommended. Far-Field Scattering In order to understand how triple-interval phase Doppler Interferometry improves on the standard tech-nique it is important to understand the far-field scattering of the laser beams by a droplet during measure-ment. For practical purposes, the scattering phenomenon may be treated as two superposed Mie scatteringfields. As the two fields are created by coherent sources they add in a vector rather than scalar sense resultingin constructive and destructive interference. Figures 1 and 2 visualize the interference patterns at the face ofthe receiver lens for two different droplet diameters from the same optical configuration (Bohren and Huff-man 1983 and Laven 2010). Due to droplet velocity and/or an induced frequency shift between the beams, the visualized pattern isnot static. It rotates nearly about (0,0) from the A detector towards the C detector (clockwise in Figures 1 and2). Each detector A, B and C collects light over a sub-region of the receiver lens. The integrated signals foreach sector are plotted relative to one another through two cycles. The “pinwheel arms” of the scattering pattern for the 50 um drop are spaced half as far apart as for the25 um droplet. This scaling is the fundamental relationship between diameter and phase shift for the phaseDoppler technique. As the diameter increases the spacing between the far-field bands decreases with a con-current increase in the absolute phase shift between detectors. To first order,the phase shift between two de-tectors is linearly proportional to the diameter of the droplet and to the angular spacing between detectors. 8 e e Phase Validation Fundamentally, droplet size can be calculated from the phase shift between two detectors. Why then docommercial PDI have more? By adding an additional independent phase shift interval it is possible to extendthe size range of the instrument without a loss of resolution while simultaneously enabling a data integritycheck referred to as phase validation. Consider the scenario described by Figure 2. The absolute phase shift between detectors A and C is 415°.However is generally impossible to distinguish a 415° phase shift from 55° making it impossible to distin-guish a 50 um drop from a 6.6 um drop by a single phase shift alone. Utilizing only two detectors would lim-it the maximum possible phase shift to 360° and therefore the size to 43 um for this optical configuration.Anything larger would be mis-measured as a much smaller droplet. Addition of another independent phase shift allows operation over a much larger measurement range.This independent measurement can be accomplished in one of two ways. A third detector can be added inline with the first two (such as the ‘B’detector in Figures 1 and 2). This is referred to as three detector“standard”phase Doppler interferometry (simply referred to as "standard PDI” going forward). One mayalso combine planar phase Doppler which places two detectors in the plane of the transmitter beams with theoriginal two detectors to create a“dual-mode”phase Doppler interferometer. Such an instrument requireseither two receiver lenses aligned to the same point in space or, more commonly,a second laser beam pairrotated 90° relative to the first. Even though a dual-mode instrument adds two detectors it adds only one in-dependent measure of phase shift. The absolute value of phase of one detector per laser beam pair is arbi-trary. The authors restrict further discussion to standard phase Doppler configurations with the acknowl-edgement that much of the following work would apply to the dual-mode case as well. As has already been stated, to first-order approximation the phase shift between detectors is proportionalto the diameter of the droplet and to the angular spacing between detectors. Therefore, for three detectors(two independent phase shifts and one arbitrary absolute phase) the following statement should hold true: Where Sj is the spacing between the i and j detectors and D is the phase shift between those same detectorspossibly exceeding 360° (such as DAc =415° for the example in Figure 2). Measurements are always in the range of D=[0, 360)° but Equation 1 may be used to determine howmany cycles the original phase shift experienced. Consider again the example described in Figure 2. For thiscase DAB,measured =160° and DAC,measured= 55°. It quickly becomes apparent that in order to satisfy Equation 1AB,Total must equal 415° and not 55°. A 6.6 um droplet would have a measurement pair of(21, 55) whichcan easily be distinguished from the (160, 415) pair for a 50 um drop. By adding an additional phase meas-urement there is no longer any ambiguity between the two diameters. In addition to extending the size range of the instrument it is possible to use the relationships between thetwo phase measurements as a validation criterion intended to reject noise and otherwise faulty measure-ments. Figure 3 schematically represents how this is accomplished. For every droplet a pair of independentphase shifts between detectors is measured. Since phase shift is proportional to droplet diameter, very smalldrops will have a phase shift pair very near the origin. As diameter increases the expected phase shift pairwill follow the blue line up and to the right (the blue arrow denotes increasing diameter). When any phaseshift exceeds N·360°, the calibration line will “wrap around" to 0°and continue increasing (a 361° phaseshift being indistinguishable from 1). The first two such wrap-around jumps are illustrated with a dottedblue line in the figure. Theoretically, measurements should fall on the solid blue line. However, real signalscontain noise and the scattering response is not perfectly linear. Therefore, an acceptance band around thecalibration line is used to validate signals from noise (the light blue area around the line). Depending on con-ditions, the acceptable displacement may range from 5 to 20°.This would correspond to approximately 0.5-2% of the full scale measurement range. Phase validation of dual-mode PDI operates in a similar fashionwith one important distinction. Dual-mode PDI responds to the droplet surface radius of curvature in twodimensions (Damaschke 1998). Therefore the sphericity of the droplet will convolve with measurement errorsources to potentially reject droplets that would have otherwise been sized as very nearly their equivalentdiameter. Figure 3. Phase validation of standard PDI. The light blue region represents the fraction of the domainfrom which measurements will be accepted as valid. Phase Discrimination The phase Doppler technique is capable of sizing spheroidal particles so long as they have a different in-dex of refraction than their surroundings. This may include air bubbles in water, water drops in air, glassbeads in water, or even molten metal droplets (entirely in reflection). PDI is not, however, capable of sizingirregular particles or crystals. For certain measurement conditions, the ability of the instrument to reject sig-nals originating from irregular solids is of paramount importance. For instance, in icing conditions for avia-tion certification only the droplet distribution is of interest (e.g. 14 CFR 25 App. C). Though solid ice crys-tals may trigger the instrument’s sampling system, processing of the signals should ideally eliminate anytrace of these particles in the data. In fact, it was the desire to better discriminate ice from liquid droplets thatfunded the development of this work. Figure 4 plots the raw phase response for droplets in air, powdered salt crystals, and a mixed-phase envi-ronment of liquid water and solid ice crystals. Droplets generate signals very nearly along the theoretical lineshown in Figure 3 whereas non-spherical particles generate uncorrelated phase shift measurements that es-sentially fill the DAc VS. DAB domain. For the mixed-phase case, phase validation accepts only those signalswithin the valid band. This eliminates a large fraction of the ice signals but not all. Since phase shift pairs ofcrystals can have any random orientation some fraction of signals will always fall within the phase ac-ceptance band. The goal is to have valid measurements of liquid droplets far outnumber any crystals that maybe improperly validated. The length of the calibration line in Figure 3 is 1.07·DAC,max. The fraction of the domain that falls withinthe phase validation region can then be approximated as: where R is the allowable distance from the calibration line. For DAC,max=1,000° the fraction may vary from8.3% to 33% given R=[5°, 20°]. This corresponds directly to the fraction of non-spherical particles that willfail rejection through phase validation. Though these particles may be rejected by other validation criteriasuch as intensity validation (Bachalo 1991) only phase validation is addressed in this work. Figure 4. Response of the standard phase Doppler technique to liquid droplets (left), non-spherical par-ticles - salt in this case (middle), and a mixed-phase environment of liquid droplets and solid ice crys-tals (right). Reflection and Mixed-Mode Scattering To first order approximation; standard, forward-scatter phase Doppler works by responding to the rays oflight that have passed through the droplet once before exiting the drop (p1 rays) and being detected by thereceiver. PDI can also be used to respond to single internally-reflected (p2) rays in the case of back scatterconfigurations, or even to externally-reflected rays (p0) in the case of measuring metal balls or droplets. Thekey is that one scattering mode should dominate all others. If PDI droplet scattering were actually Mie scattering, the refracted signal in forward scatter would al-ways be dominant. The angle between the transmitter centerline and the receiver is partially chosen for thisreason. However, true Mie scattering requires uniform illumination and laser beams ideally have a Gaussianintensity profile. As such the incident intensity of a p0 (reflected/diffracted) ray may be sufficiently higherthan that of a p1 (refracted) ray that the far field interference pattern is dominated by the reflected photons.Figure 5 visualizes the far-field p0 interference pattern along with the signals collected on the three detectors(Laven 2010). The pattern may look similar to that of Figures 1 and 2 but it is important to realize that thispattern moves in the opposite direction-up in this case. Phase validation can be used to reduce or eliminate the impact of improperly sized droplets due to purereflection errors. Reflected signals will be on- or near the red lines in Figure 6 which lie entirely outside ofthe blue valid regions. Problems arise when neither the refraction nor reflection signal is dominant. For mixed scattering the re-sultant far-field is primarily the superposition of four fields -refraction and reflection from each beam. Theresultant interference pattern is highly complex. Figure 7 illustrates the issue. Scattering by pure refraction(Debye Series p=1) is in blue, pure diffraction/reflection (Debye Series p=0) in red, and three different ratioswhere the two are very nearly of equal mean intensity (green). The result is that mixed-component scatteringcan generate almost any phase shift pair in the DAc VS. DAB domain. This is similar to the instrument re-sponse to non-spherical particles. While phase validation can essentially eliminate reflection-dominant sizingerrors, mixed-mode scattering signals can appear anywhere in the domain. It is this concern that limits theminimum size of the focused laser beam diameter (the width of the Gaussian profile) with respect to thedroplet distribution. Scattering from larger beams is more nearly uniform for a larger number of drops in adistribution. Figure 5. Reflection-dominated interference pattern for the same optical configuration as in Figures 1and 2. The reflection pattern moves in the opposite direction of the Mie pattern - in this case from bot-tom to top. Since the spacing between the pinwheel arms is quite large relative to the detector spacing,the absolute phase shift from A to B should be quite small. However, since the B signal leads the Asignal in this case, the instrument will incorrectly identify the phase shift as large. Note that the colorscale of this plot is different than in Figures 1 and 2. Figure 6. Phase validation and reflection. The blue phase validation bands from Figure 3 are plottedalong with the instrument response to reflected signals in red. Phase shifts for reflected signals are neg-ative and therefore start at (0,0) for minimum diameter and decrease down and to the left. Since allphase shifts are recorded on [0, 360) the net result is that reflection first appears in the top right and ex-tends down into the plot as diameter increases (the red arrow). As with refraction signals, absolutephase shifts beyond 360° wrap around about either axis. Figure 7. Response of PDI to mixed-component scattering. Each dot represents the calculated scatter-ing for a number of evenly-spaced droplets diameters through the measurement range. Scattering bypure refraction (Debye Series p=1) are blue. Scattering by pure refraction/reflection (Debye Seriesp=0) are red. The green dots plot the results of three different mixed-mode scattering conditions forwhich the mean p=0 and p=1 fields were nearly equal. Innovation: Triple Interval Phase Doppler In this work the authors have added a fourth detector to the standard PDI configuration as shown in Fig-ure 8. In order to compare the performance of the instrument with and without the added channel the geome-try of the original three detector sectors was left unchanged. Figure 8. Figure 1 repeated to include the sector of the lens used for the ‘D’detector. The phase shiftfrom A to D should be between that from A to B and from A to C for valid signals. The order of thedetector labels is not alphabetical to maintain consistency with the nomenclature of standard PDI. The authors refer to this configuration as triple interval as there are now three independent phase shiftsbetween detectors (the absolute phase of one of the four channels is again arbitrary). With an extra phaseshift measurement there are now a pair of validation equations: Of course, Equation 3 is simply a restatement of Equation 1. Together these equations represent a parametricline in three dimensional space through the origin. As with standard phase Doppler phase validation, a meas-urement in phase space within a given distance from the calibration line is considered acceptable. However,for triple interval PDI such a region is a tube in three dimensions rather than a rectangle in two dimensionaldomain. Figure 9 illustrates the validation sub-volume in phase space. Figure 9. Phase validation in a three-dimensional measurement space. The theoretical calibration is aline through this space starting at the origin that once again “wraps around”as phase shifts exceed 360°on any axis. The first two such wrap-around jumps are indicated with a dotted blue line. The valid re-gion is no longer a two-dimensional subset as in Figure 3 but rather a tube centered on the calibrationline. The faces where the tube intersects the walls of the measurement space are color coded to moreeasily follow the calibration line as it goes through the various cycles. Faces where the valid tube re-gion enter the space are colored green and exit faces are colored dark blue. Were this imaged viewedalong the DAD axis the image would collapse to that in Figure 3. As with Equation 2 it is possible to approximate the fraction of the measurement domain within thephase validation region. Given that the length of the calibration line is 1.29·DAC.max then the valid fraction is: For the same 5-20°range for R this results in a valid fraction of 0.2 to 3.4%. By combining Equations 2 and5 the relative improvement for rejecting random signals may be evaluated: For a given DAC,max and a range of R from 5 to 20°, triple interval PDI will accept 9.5 to 38 times fewer ran-dom signals such as non-spherical particles than standard PDI. Reflections and mixed-phase scattering are still of concern for triple interval PDI. Figures 10 and 11 addthe expected locations of reflection/diffraction-dominated signals to the valid volume plot from Figure 9.Figure 11 changes the viewpoint parallel to the calibration curve to highlight the separation between refrac-tion- and reflection-dominated signals. Figure 10. Phase validation and reflection in a three-dimensional measurement space. Reflection-dominated signals (red lines) are added to Figure 9. Since reflection phase shifts are negative in allthree dimensions, the line for these drops grows from the origin in the opposite direction of refractedsignals as diameter increases. The starting point for reflected signals is marked with a large red dot. Figure 11. The calibration and reflection curves in three-dimensional space are all parallel line seg-ments. If one were to view Figure 10 parallel to these lines the calibration and reflection curves wouldcollapse to points. The valid regions about each calibration point would appear as circles. The blue cir-cles are the projections of those validation regions while the red dots denote the expected locations ofreflected signals. Once again, the origin of reflected signals is marked with a large red dot. Note thatreflection-dominated signals fall well outside of valid measurement regions. Demonstration of Triple Interval Phase Doppler: Phase Discrimination The first demonstration of the triple interval PDI technique is improved rejection of non-spherical parti-cles by phase validation. The powdered salt data from Figure 4 was actually acquired with a four detectorreceiver. As such, the data has three independent phase shift measurements per particle. Figure 12 plots themeasured phase shift data from these particles in a volumetric space. Figure 12. Measured triple interval phase Doppler data for salt crystals. Non-spherical particles createrandom phase shifts between detectors resulting in data that fills the three-dimensional domain. Phase validation can be performed on these data in both two and three dimensions. As none of these sig-nals is from a valid droplet the goal is to reject 100% of the signals. Table 1 summarizes the performance ofeach technique for a DAC.max=1,170° and for two validation criteria of R=5° (red) and R=20° (black). StandardPDI PhaseValidation Triple IntervalPDI PhaseValidation RejectionIncrease Factor False Positives (of 7000 total) 3.303 348 9.5 816 23 35.5 Measured RejectionRate 53% 95% 88% 99.7% Theoretical RejectionRate 61% 96% 90% 99.7% Table 1. Rejection of salt crystals by means of phase validation. Results in black are for a validationcriterion ofR=20°.Those in red are for R=5°. Theoretical values are based on Equations 2 and 5. Asnone of these signals was generated by a droplet, the target validation would be zero counts and thetarget rejection rate is 100%. As expected the number of false positives (salt crystals not rejected) is reduced by using triple intervalPDI phase validation rather than standard PDI. The measured rejection increase factor ranging from 9.5 to 35 times very nearly equals that predicted by Equation 6 (9.5 to 38). The original goal of enhancing rejection ofsignals due to non-spherical particles is certainly met. Demonstration of Triple Interval Phase Doppler: Sprays Data As the focused beam diameter is reduced smaller than the droplets in a spray, the fraction of mixed-modescattering and reflection-dominated signals is expected to increase (Strakey 2000). In order to demonstratethis expectation and to demonstrate the advantages of triple interval PDI the authors built a transmitter capa-ble of delivering beams of varying sizes to the measurement point at the same crossing angle without requir-ing realignment. Though a series of beam diameters were tested, for clarity’s sake only the results of thesmallest and largest are presented here. The focused laser beam waist diameters (1/e) for these two caseswere 2ω0=204 um and 200=51 um respectively. A reduction in beam diameter by a factor of 8 results in an increase in laser intensity of 64. To balanceintensity with receiver sensitivity one would normally adjust the photomultiplier tube gain (commonly re-ferred to as the PMT voltage though the gain scales as voltage to the seventh power). However, as with anyamplifier, changing the gain would change the amount of noise added to the signal. Instead the authors choseto reduce the laser power to maintain constant instrument sensitivity. All other optical, electrical, and soft-ware settings remain unchanged. Figure 13 plots the diameter and cumulative volume distributions for the demonstration spray. The larg-est droplets in the spray are approximately 200 um in diameter - substantially larger than the smallest fo-cused beam diameter. Figure 13. Diameter histogram (blue) and cumulative volume distribution (green) for the test spray.The spray has a Sauter Mean Diameter (D32) of 73 um and a Median Volume Diameter (Dy,0.50) of 87um. It was measured with laser beam waists (1/e) ranging from 200=204 um to 200=51 um. Meas-urements were made at the same location in the spray by not adjusting the receiver during the meas-urements. Figure 14 presents the standard raw phase data for this spray for the two different beam diameters. Theleft plot is the data generated with the larger (204 um) laser beams while the right plots is for the smaller (51um) beams. Note in the right plot the larger collection of points between the main clouds. This enhancementis caused by reflection-dominated signals (parallel to the main clouds) and to mixed-mode scattering (ran-domly distributed). Figure 14. Measured phase Doppler data acquired at two different focused laser beam diameters. Theleft data set was acquired with 204 um diameter laser beams while the right was acquired with 51 umbeams. The data are plotted with a larger marker than in Figure 4. This emphasizes those measure-ments outside of the main band of valid measurements. Within those bands the points tend to overlapand create a solid black region. Both data sets are composed of 7,000 measurements. Figures 15 and 16 include the extra phase information from detector ‘D’by extending the plots from asquare into a cube. Figure 16 is viewed along the calibration lines similar to Figure 11. Figure 15. Measured triple interval phase Doppler data. This is the same data as in Figure 14 plotted toinclude DAp in an extra dimension. Valid points are still near the calibration line. However, that linenow traverses a cube rather than a square. If viewed along the DAp axis these plots will collapse tothose in Figure 14. Figure 16 highlights the increase in reflection-dominated signals as the laser beam diameter is decreased.The right (smaller beam) plot contains clusters of measurements (red) along the predicted locations of reflec-tion measurements in this view. While it is impossible to identify a measurement that is clearly the result ofmixed-mode scattering the expectation is that an increase in reflection-dominated measurements should ac-company an increase in mixed-mode measurements. Figure 16. Raw triple interval phase Doppler data viewed along the calibration line. These plots are thesame data as from Figure 15. The point of view has been rotated to look along the calibration lines.The theoretical calibration and reflection curves would collapse to a series of points in this view.Markers colored blue are within 10°of a calibration line. Markers colored red are near a reflection line.Black markers are those measurements that are outside of the allowable valid range from the calibra-tion line but cannot be identified with certainty as reflection. These may be noisy valid signals ormixed-mode scattering signals. Either way, they are rejected for the purposes of building a diameterdistribution. Note the larger number of red markers in the right plot (smaller laser beam) highlightingthe enhanced reflection of this measurement. Figure 17 is the plot from Figure 14 with the color coding from Figure 16. In this orientation the reflec-tions in the right plot are clear to see. The diagonal cluster of red marks between the main groups of bluemarks is one group of reflection-dominated signals.. Black and red marks are to be rejected as invalid. How-ever, there are black and red marks on top of- and in line with the blue marks. The measurements would nothave been rejected in the absence of DAp data. Figure 17. Raw phase Doppler data after triple interval validation. The blue, red, and black markersare the same as from Figure 16 simply plotted without DAD. Droplets validated by triple interval analy-sis are a subset of those that would have been validated using traditional phase validation. However inthe above plots (especially in the right plot corresponding to smaller laser beam diameters) it is possi-ble to see black and red markers on top of the blue markers. These are measurements that do not satisfythe desired validation criteria but could not have been rejected by normal phase validation. Extension to Dense Sprays The authors believe that the triple interval phase Doppler technique will increase the maximum practicalnumber density limit for PDI. Dense sprays PDI data are noisy due to multiple scattering near the measure-ment volume. Enhanced rejections of random noise is clearly demonstrated in this work. Additionally, reduc-ing the acceptable working beam diameter will reduce the probability of having multiple droplets in themeasurement region at a time (coincidence rejections). Since the measurement volume scales as the focusedbeam diameter squared, an improvement in allowable beam diameter of a factor of three would enable anorder ofmagnitude higher number density. Concurrent with a decrease in laser beam diameter is an expectedincrease in the number of mixed-mode or reflection-dominant signals. This work has demonstrated that tripleinterval PDI is able to substantially improve on standard PDI in rejecting such signals. Conclusions The authors have demonstrated an improvement to the standard phase Doppler technique that improvesliquid/solid phase discrimination, rejection of random noise, and rejection mixed-mode and reflection domi-nant signals. The improved validation allows the operation of PDI with smaller focused laser beams thanwould ordinarily be recommended. As such, this technique holds promise for improving measurements bothin multi-phase flows and in dense sprays applications. Acknowledgements The authors would like to thank NASA-Glenn Research Center for the generous funding of this researchunder SBIR Topic A1.02-9514. References ( 14 CFR 25 A p p. C: United St a tes Title 1 4 Code of Federal Regulation Pa r t 25 Appendix C. ) Bachalo W (1980)“A Method for Measuring the Size and Velocity of Spheres by Dual Beam Light ScatterInterferometry,”Applied Optics, Vol. 19, No. 3, February 1, 1980. Bachalo W, Houser M (1984)“Phase Doppler Spray Analyzer for Simultaneous Measurements of Drop Size andVelocity Distributions,”Optical Engineering, Vol.23,No.5, September-October, 1984. Bachalo W (1991) US Patent 4,986,659“Method for Measuring the Size and Velocity of Spherical Particles using thePhase and Intensity of the Scattered Light” Bohren C, Huffman D (1983) Absorption and Scattering of Light by Small Particles, John Wiley & Sons, Inc. ISBN978-0-471-29340-8. Damaschke N, Gouesbet G, Grehan G, Tropea C (1998)“Response of Phase Doppler Anemometer Systems toNonspherical Droplets,”Applied Optics 37:1752-1761. Laven P, (2010) MiePlot v4.205d, www.philiplaven.com/mieplot.htm. Strakey P, Talley D, Sankar S, Bachalo W (2000) “Phase-Doppler Ineterferometry With Probe-to-Droplet Size RatiosLess Than Unity. Trajectory Errors I,”Applied Optics, Vol. 39,No. 22, August 2000. -- --
确定
还剩12页未读,是否继续阅读?

产品配置单
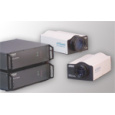
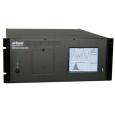
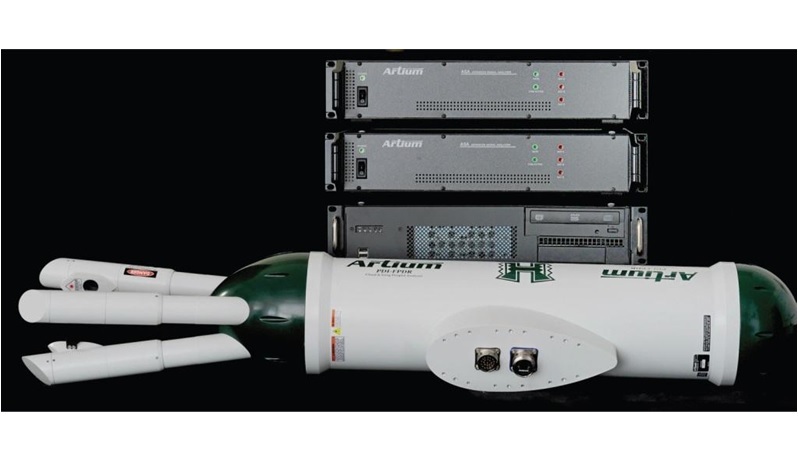
北京欧兰科技发展有限公司为您提供《喷雾,致密喷雾中液滴粒径,液滴速度检测方案(气溶胶)》,该方案主要用于其他中液滴粒径,液滴速度检测,参考标准--,《喷雾,致密喷雾中液滴粒径,液滴速度检测方案(气溶胶)》用到的仪器有Artium PDI-FP 双量程可机载飞行探头、激光相位多普勒干涉仪LDV,PDI,PDPA,PDA、激光诱导白炽光(LII)烟气分析仪
推荐专场


相关方案
更多
该厂商其他方案
更多