


方案详情
文
C焊料球连接完整性是设备制造中的一个重要问题,对于无铅焊接更是如此。 尽管无铅连接可能更牢固,但人们发现组件接口(金属间区域)的无铅焊接非常容易脆性断裂,而板接口处的无铅焊接则容易发生焊盘坑裂。 此类故障可能在连接的整个使用周期内发生,包括从制造到测试,再到产品的最终使用。 随着无铅材料的引入,此类故障事故也日益增多,因此,行业人士都认识到亟需改进测试技术。 但是,脆性断裂和焊盘坑裂的问题并不局限于无铅材料;许多焊料合金和焊盘表面保护层同样也存在这些问题。
焊锡球接头完整性始终是设备制造中的重要问题,但在引入无铅焊接后却变得更加重要。
虽然采用无铅接头会更加牢固,但目前已经发现在部件交接处(金属间的区域)特别容易发生脆性破裂,而板交接处也特别容易出 现焊盘坑裂。从制造到测试再到产品的最终使用,此类失效在接头的整个生命期中都可能会发生。
随着无铅材料的引入,此类失效的发生率在逐渐升高,业界也因此认识到迫切需要改进测试技术。然而,对于脆性破裂和焊盘坑裂的关注不仅限于无铅焊接;很多合金钎料和焊盘表面处理也同样存在问题。
以传统速度(低于 20mm/s)进行剪切力测试时,主要失效模式趋向于“焊锡球剪切力”,即焊接材料本身的破裂。
对于这种情况,从数据中得出的唯一结论便是焊接强度高于受剪焊锡球的强度。这种结论使得业界实际上不可能对不同的焊盘表面处理、焊盘构造和合金钎料对焊接强度的影响进行比较。进一步的研究证明,以更高的速度进行测试(如果测试潜在的脆性破裂,通常采用高于 1000mm/s 的速度)将产生更多的焊接失效,这样便可以比较不同部件和构造的性能。
方案详情

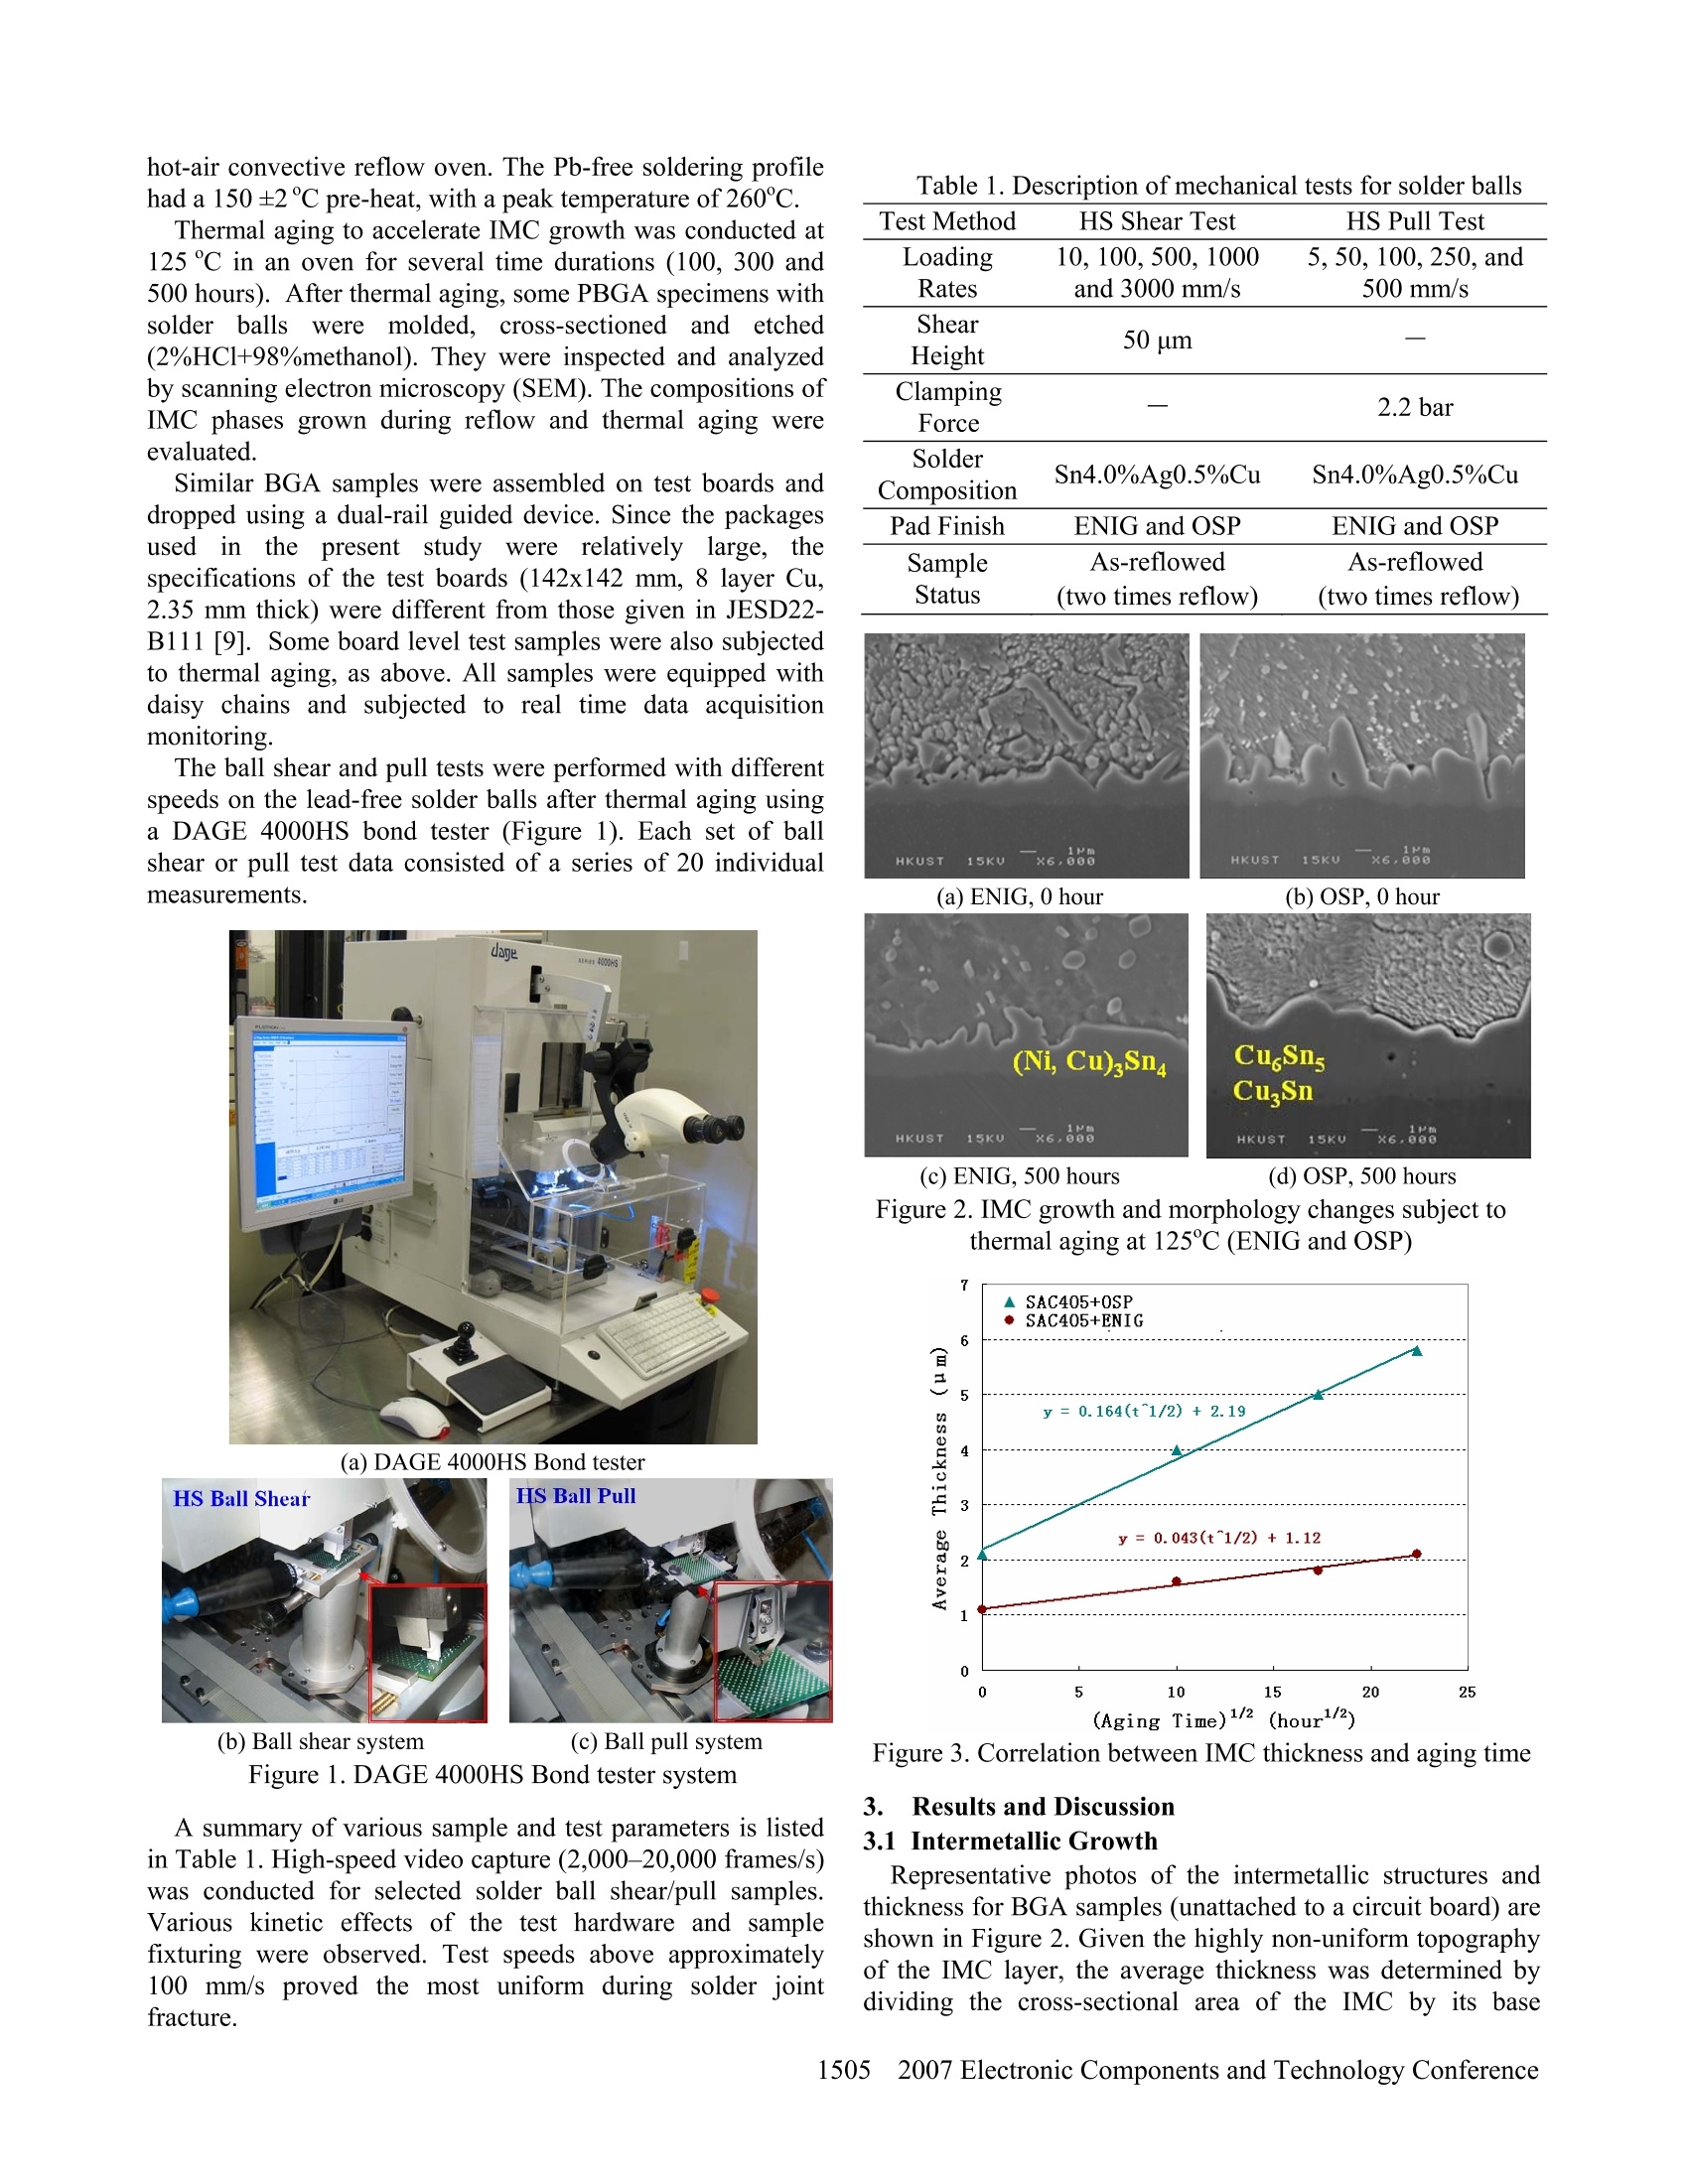
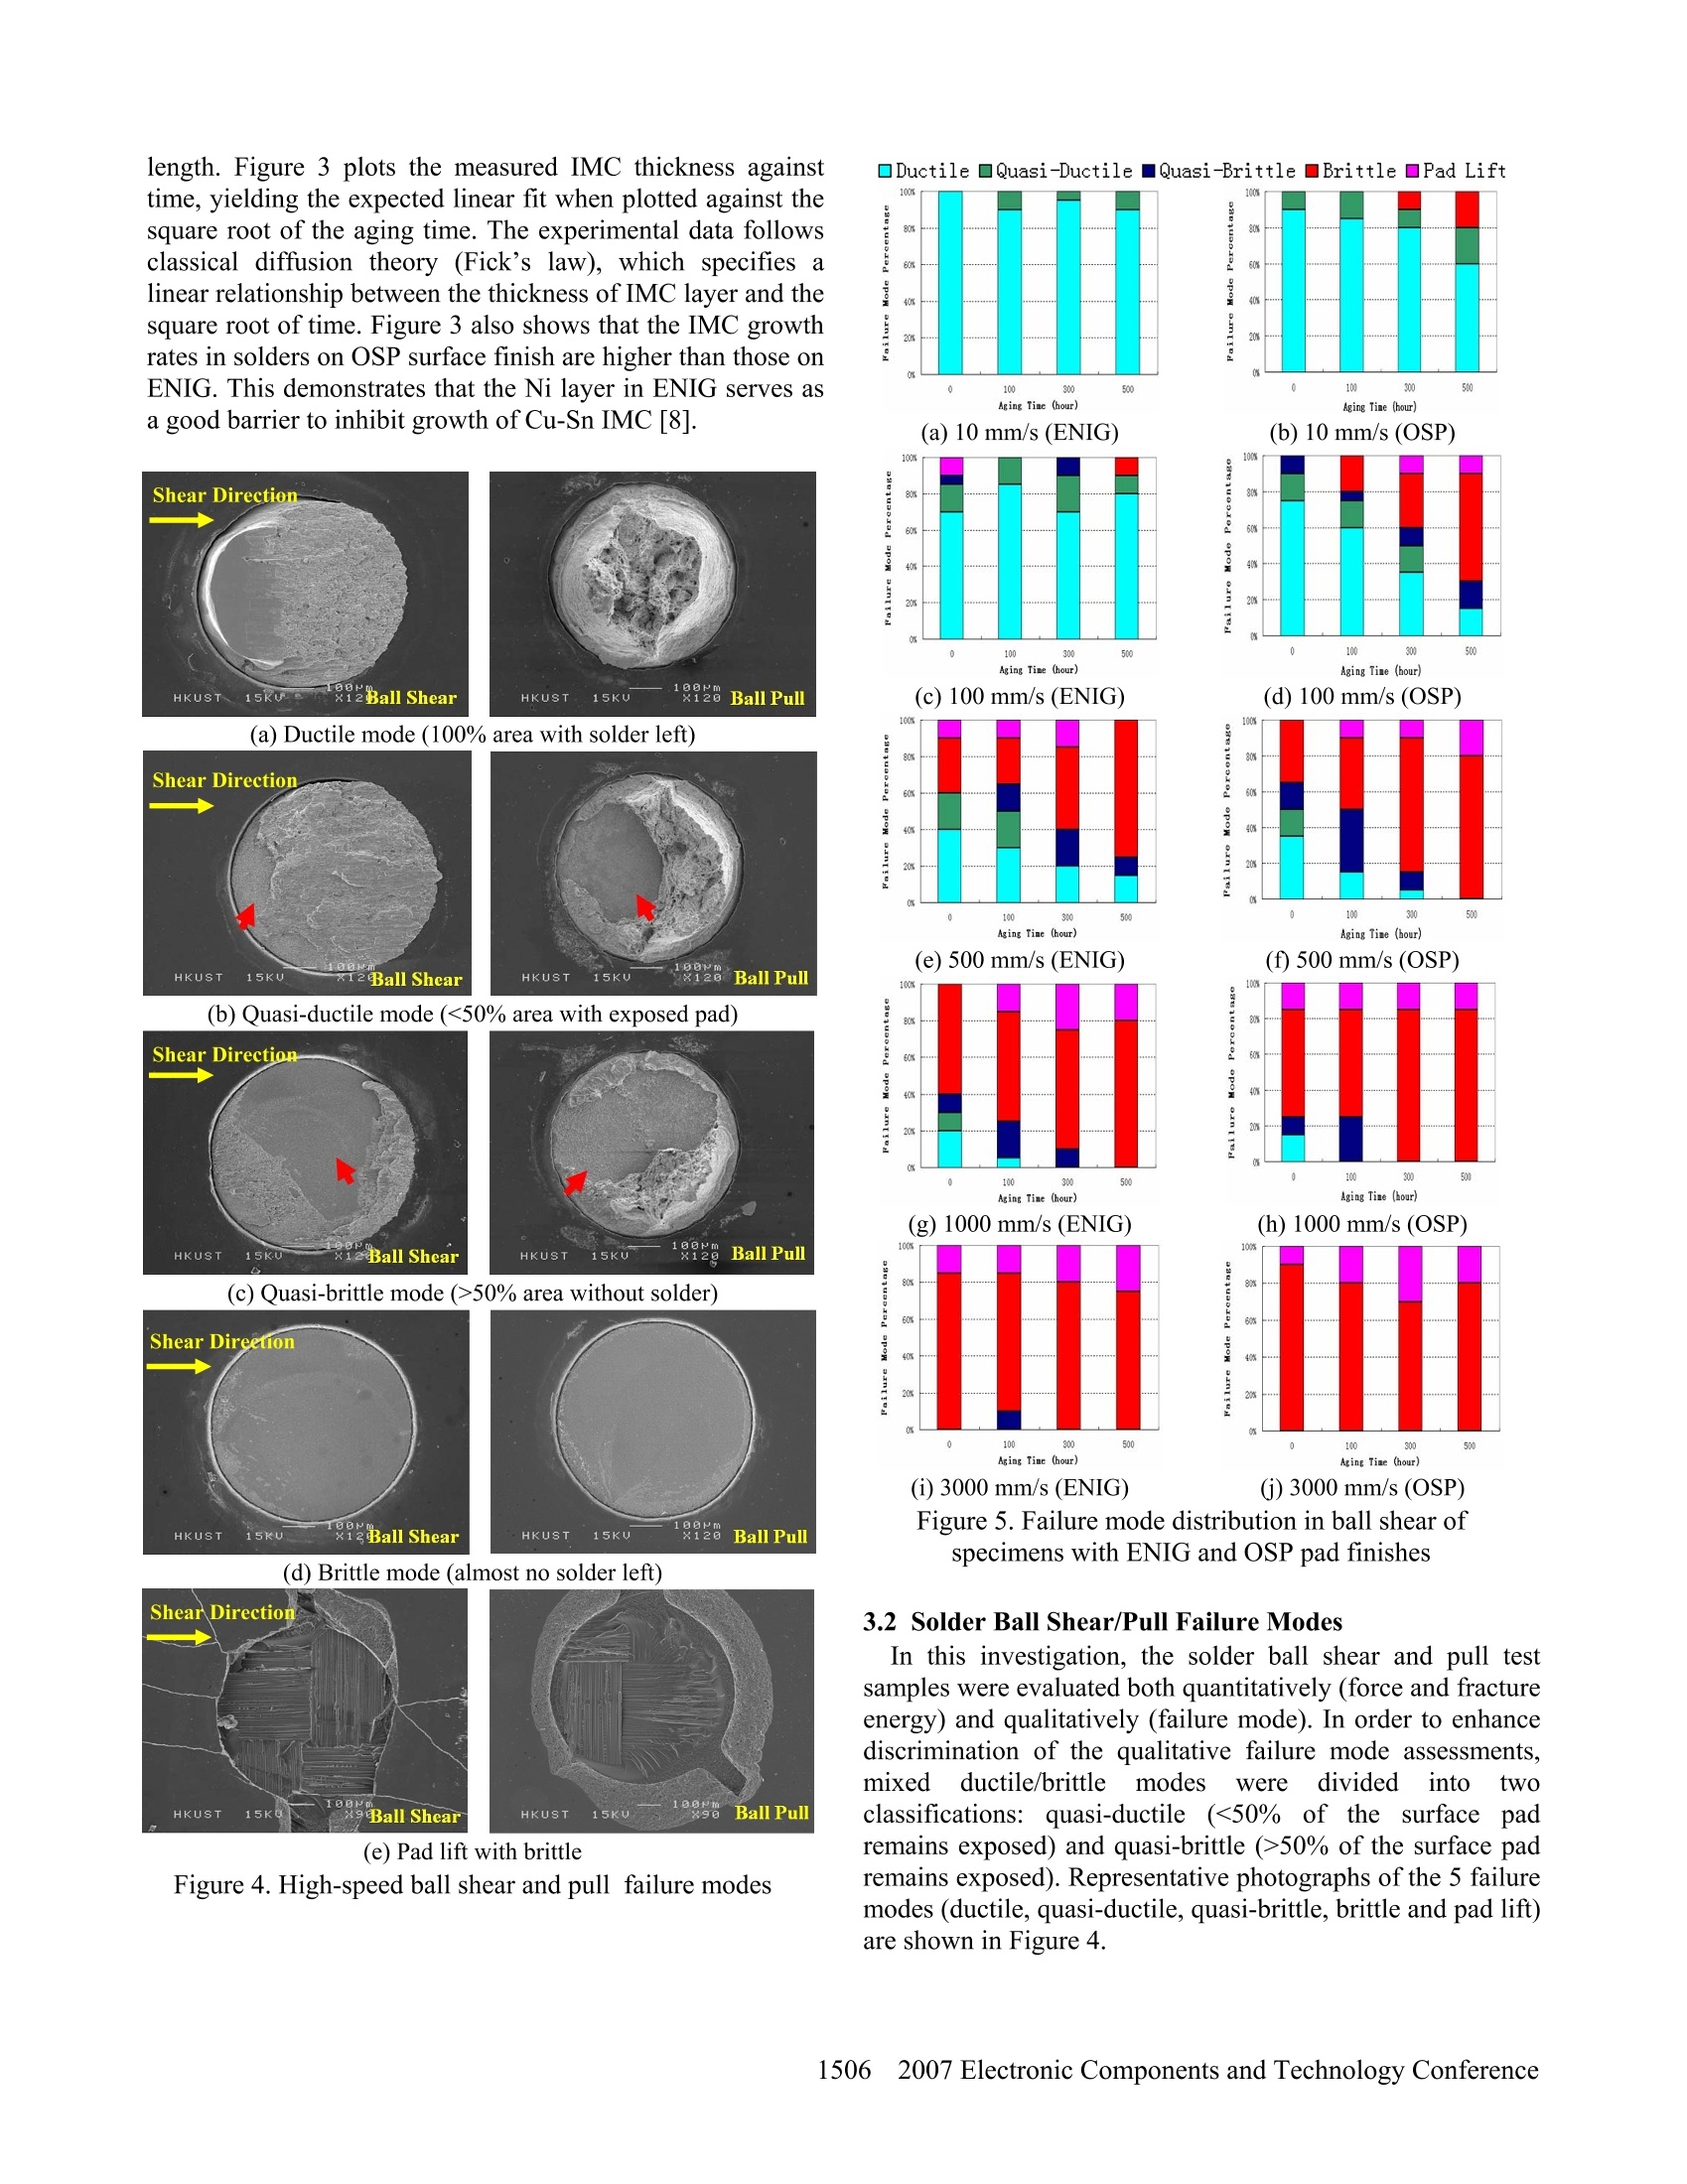
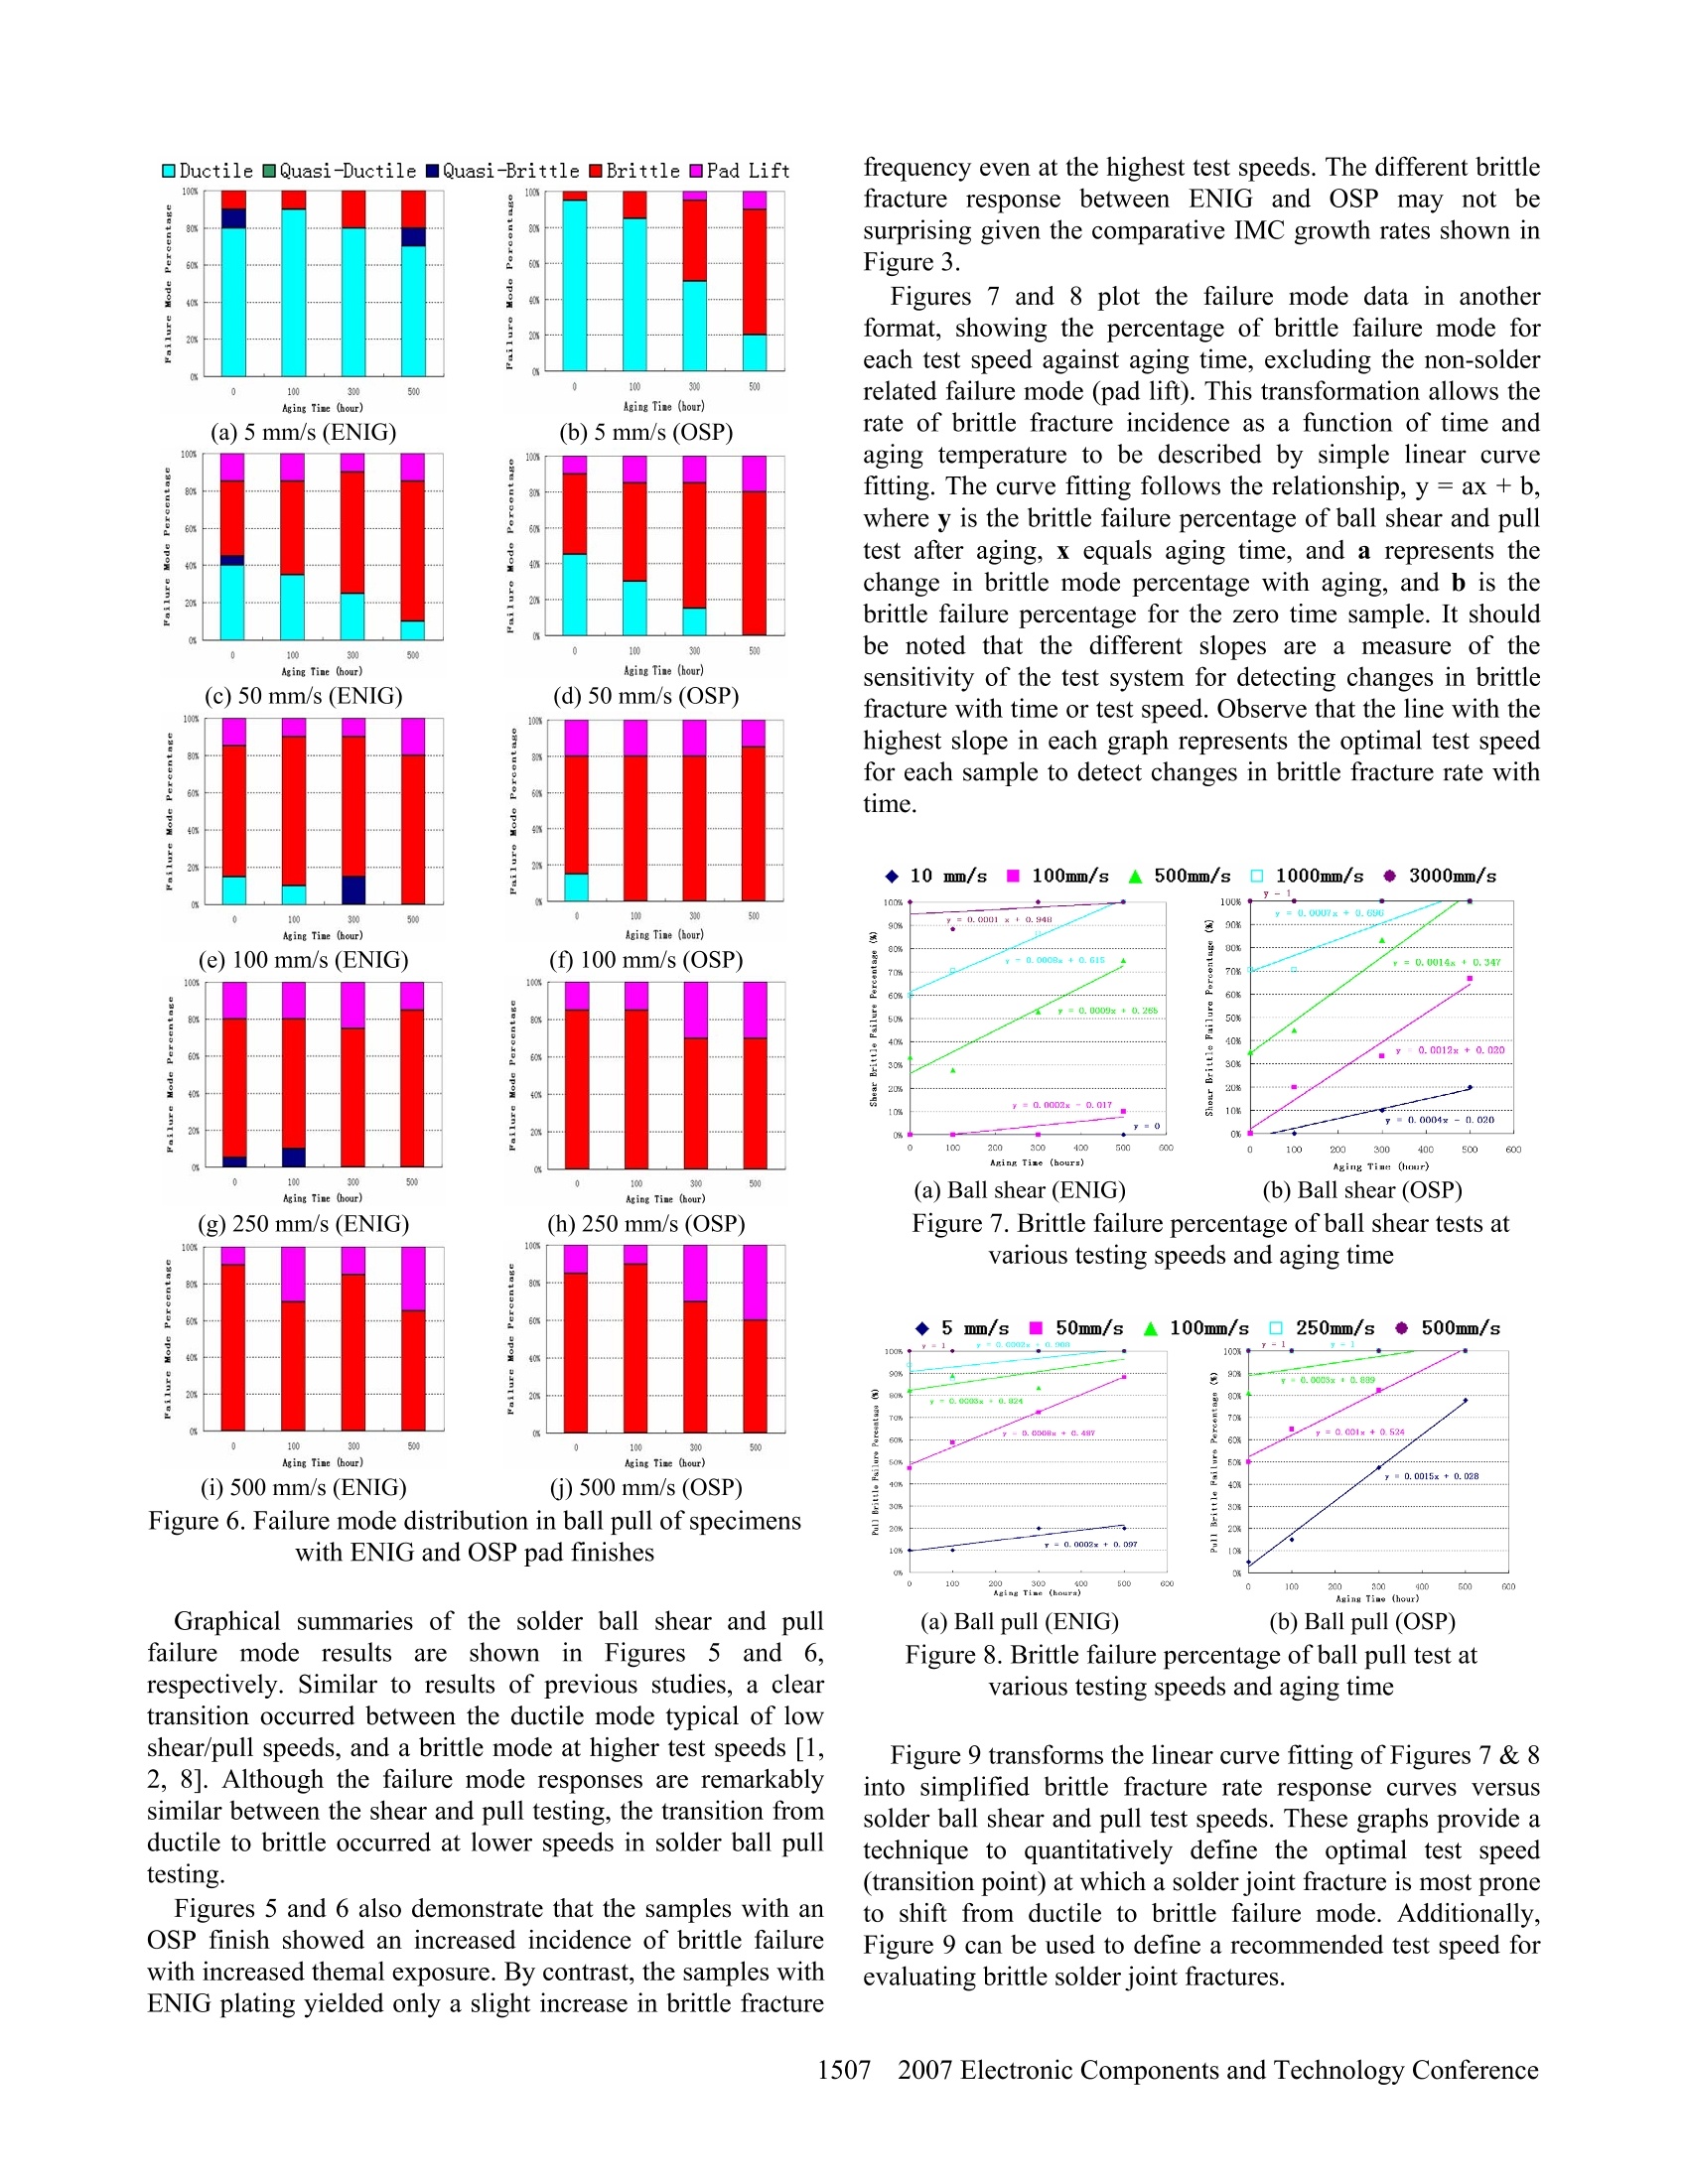
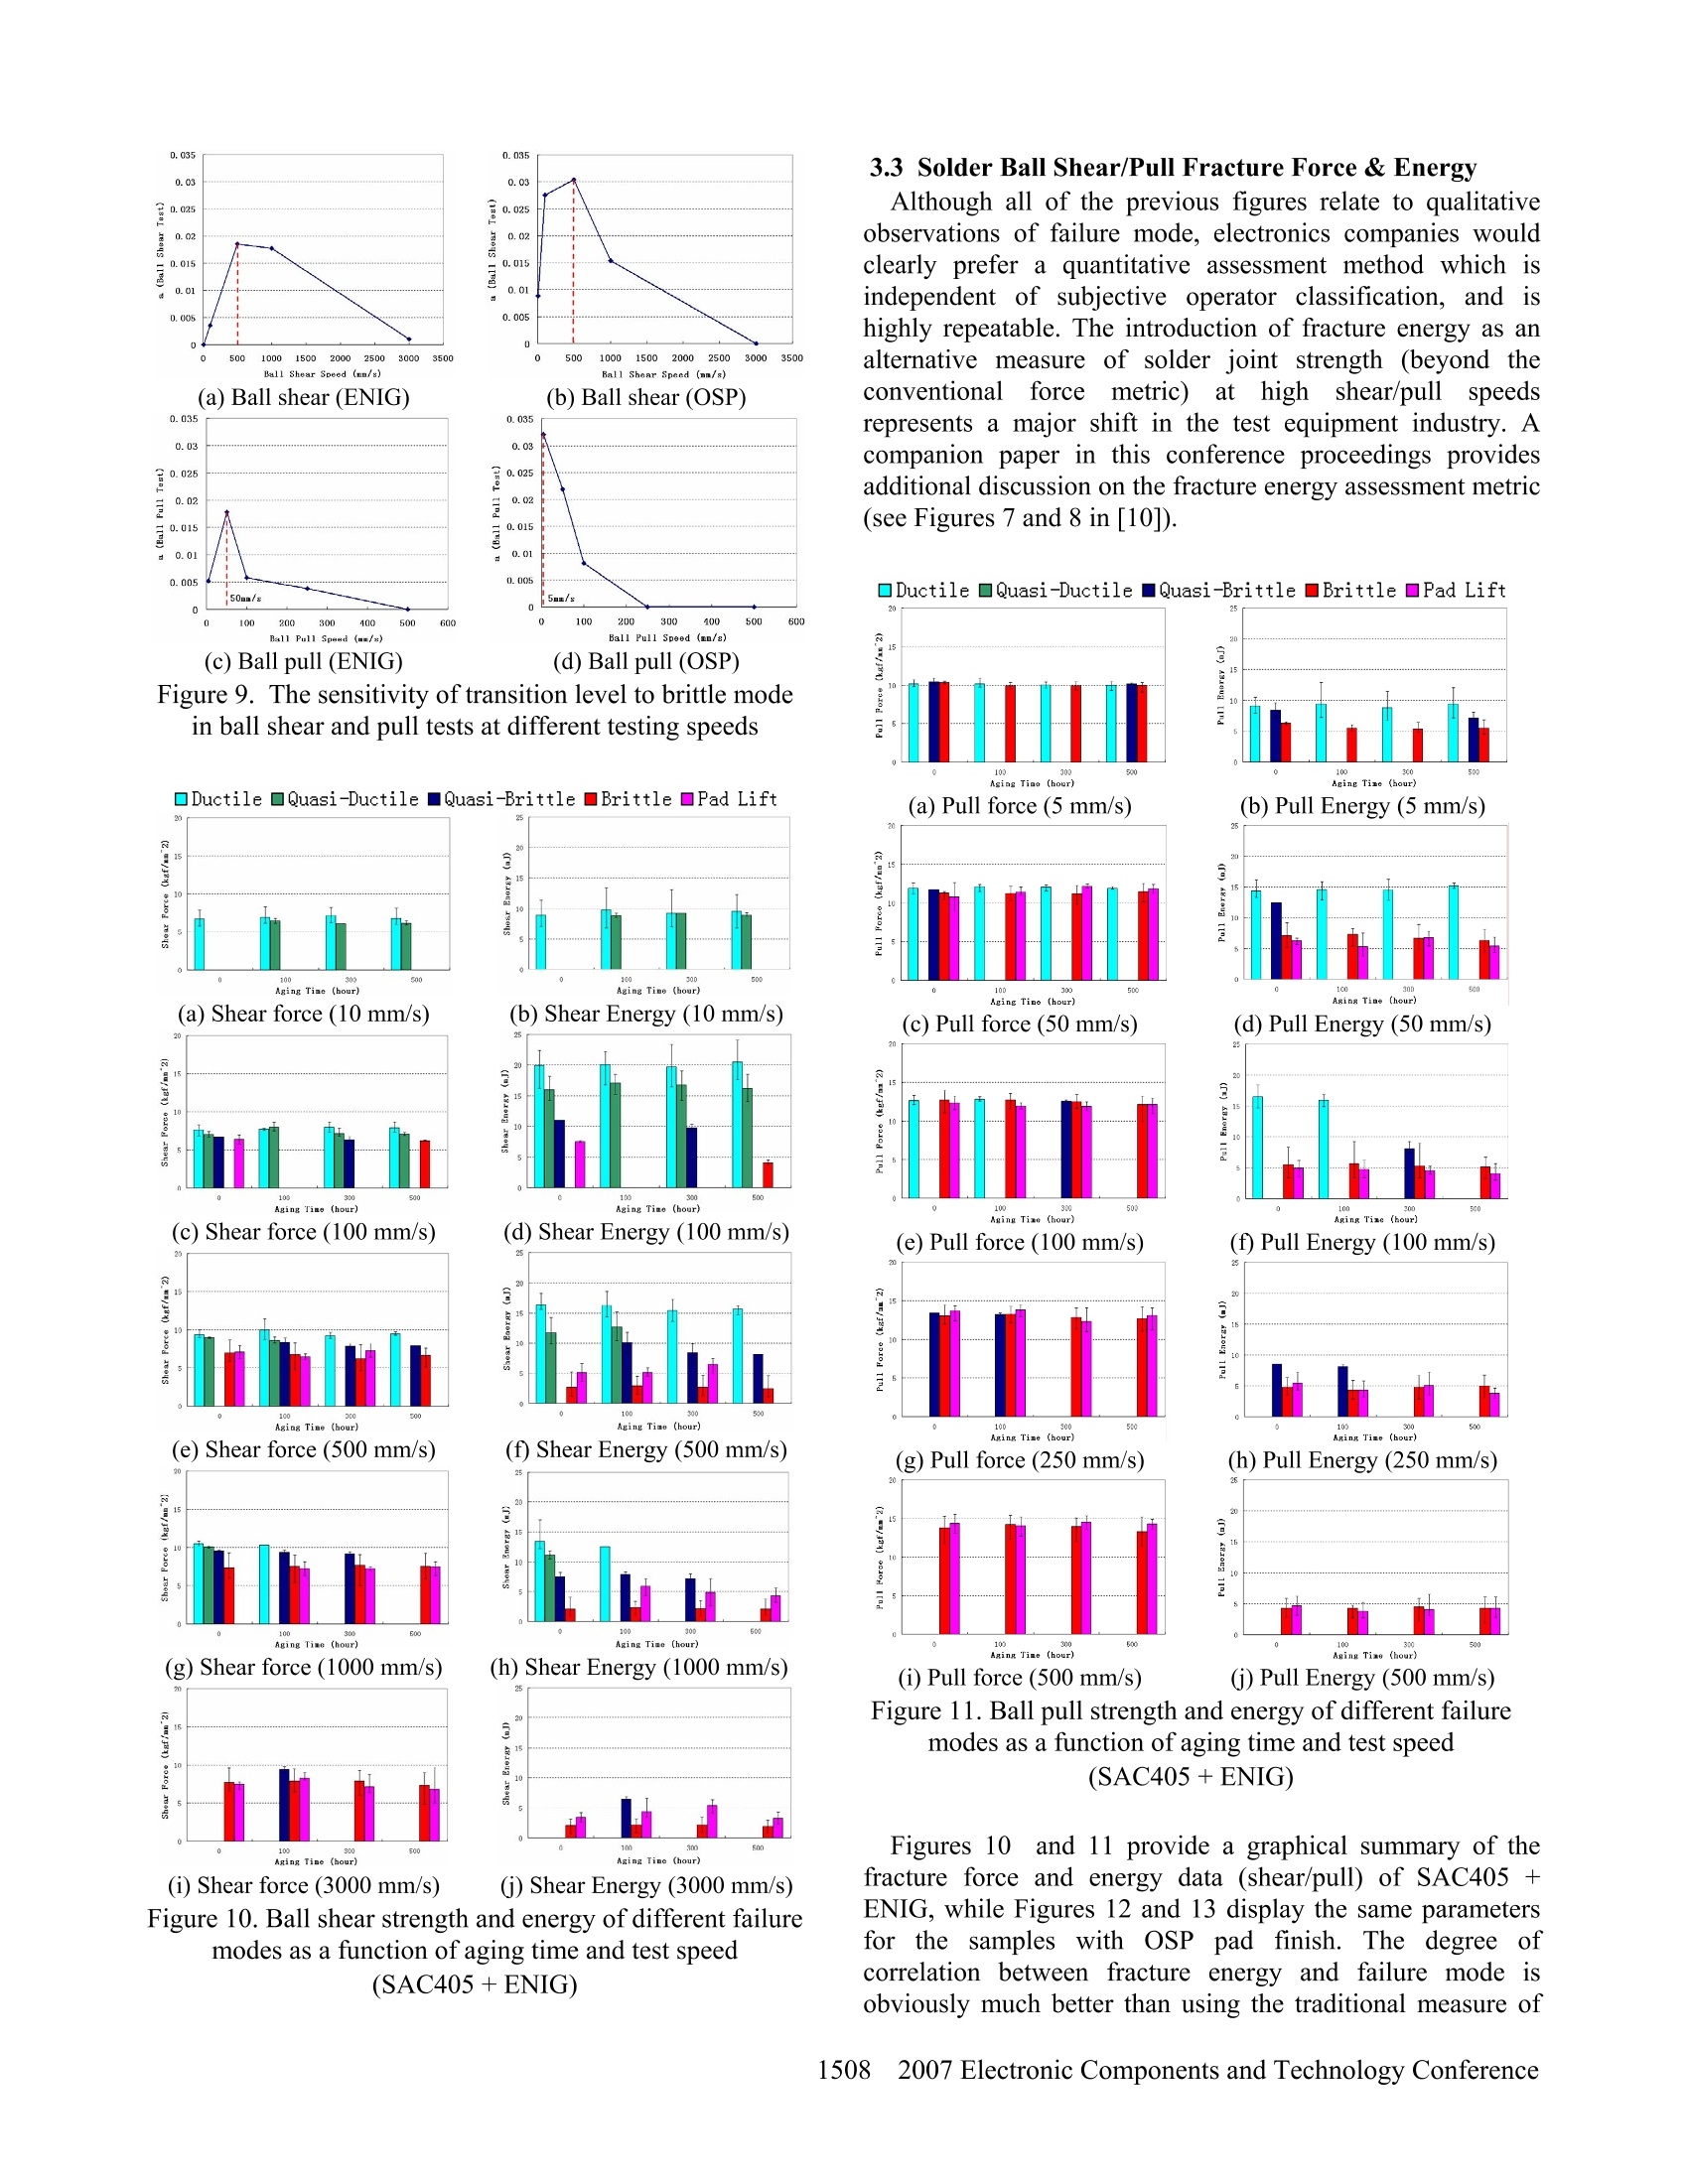
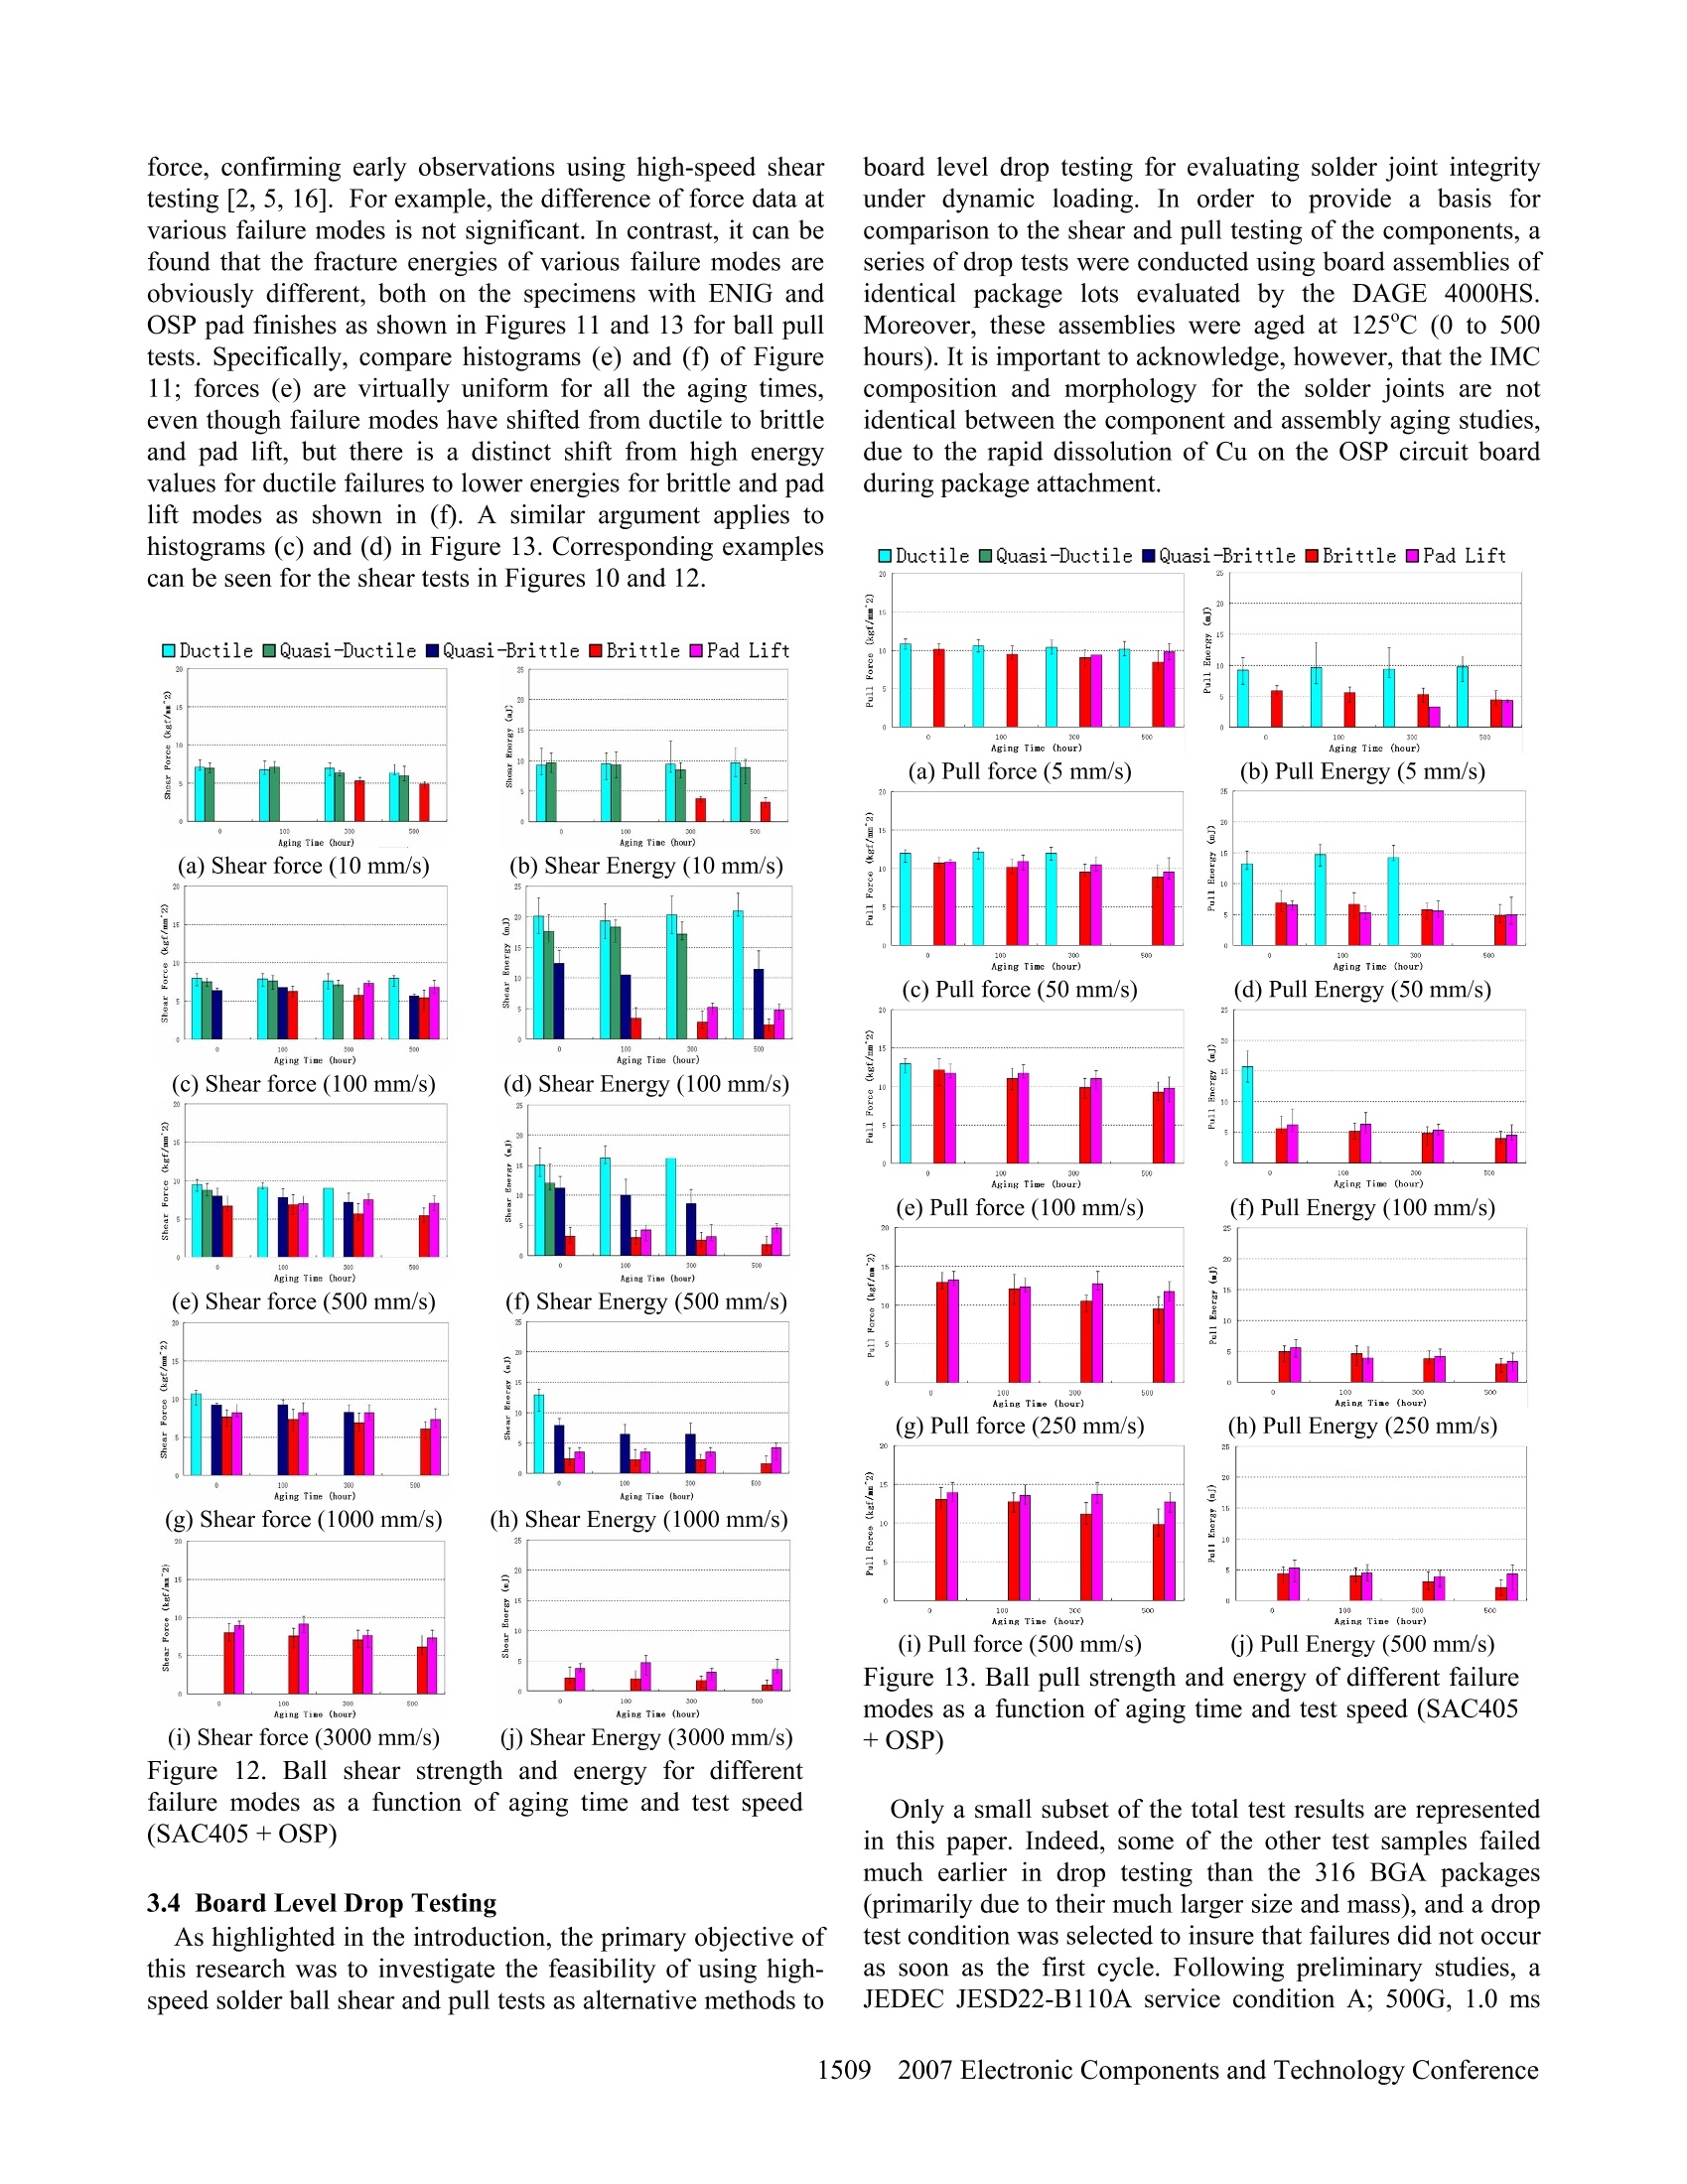
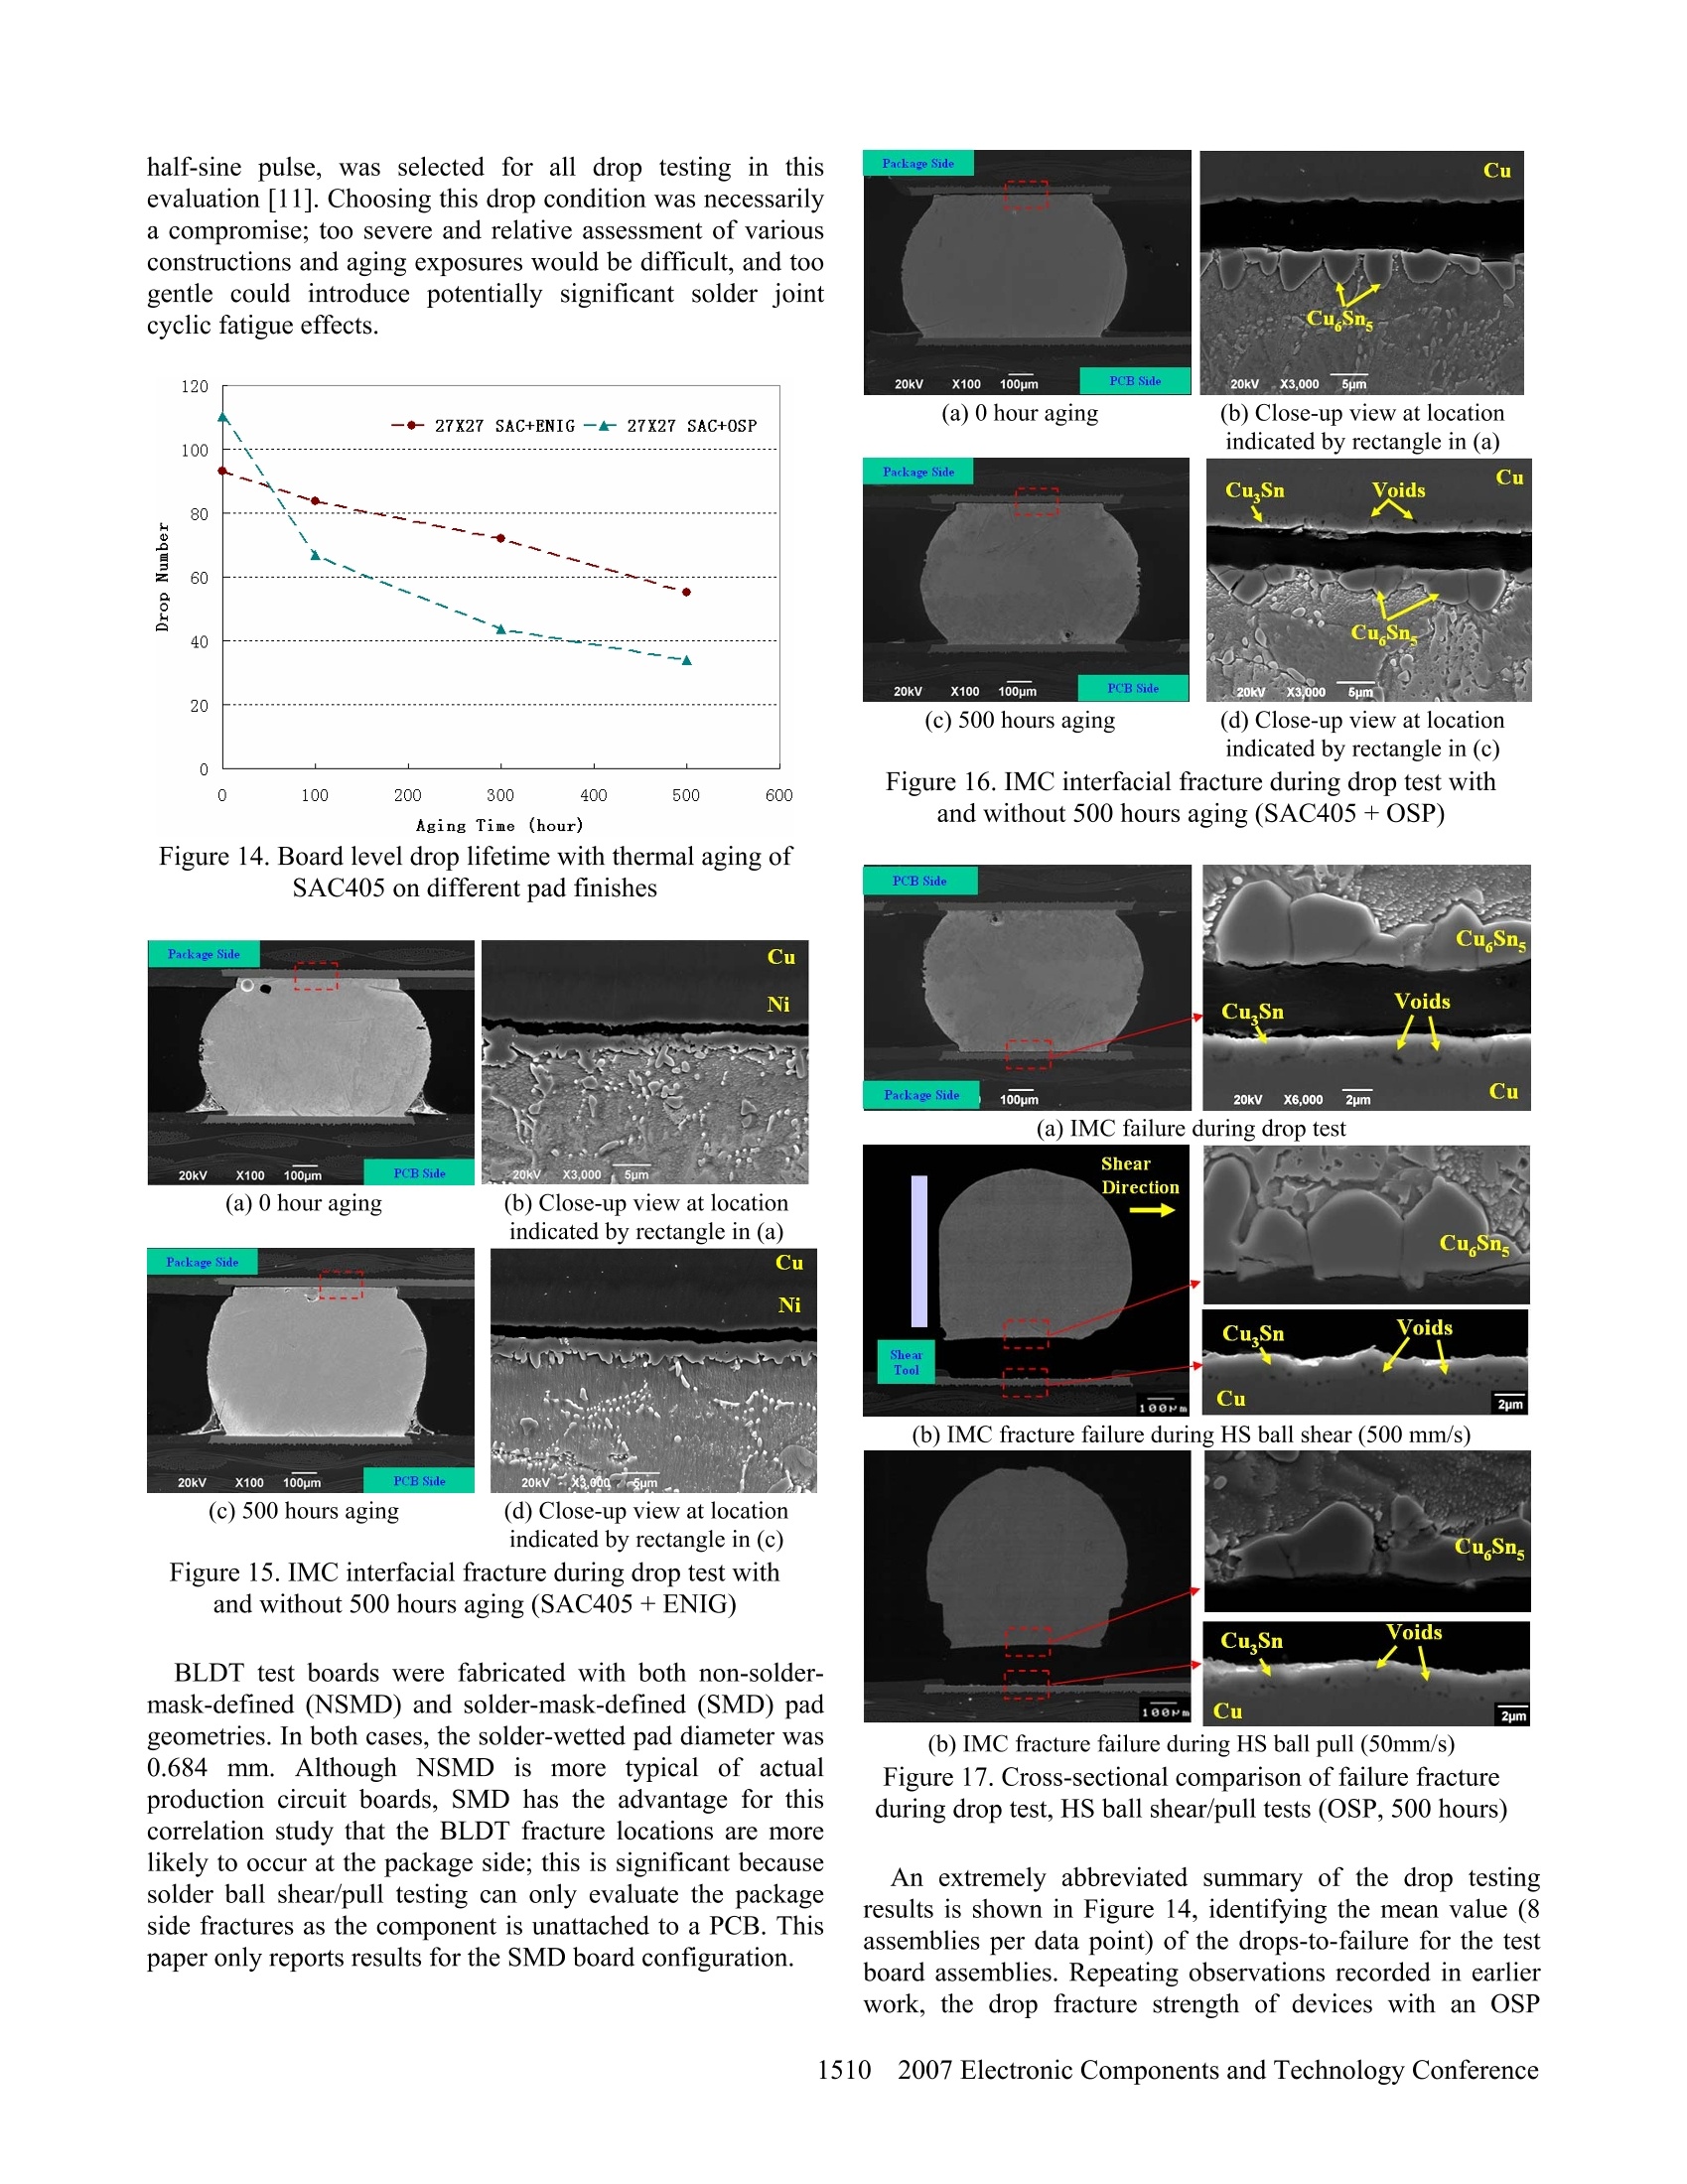
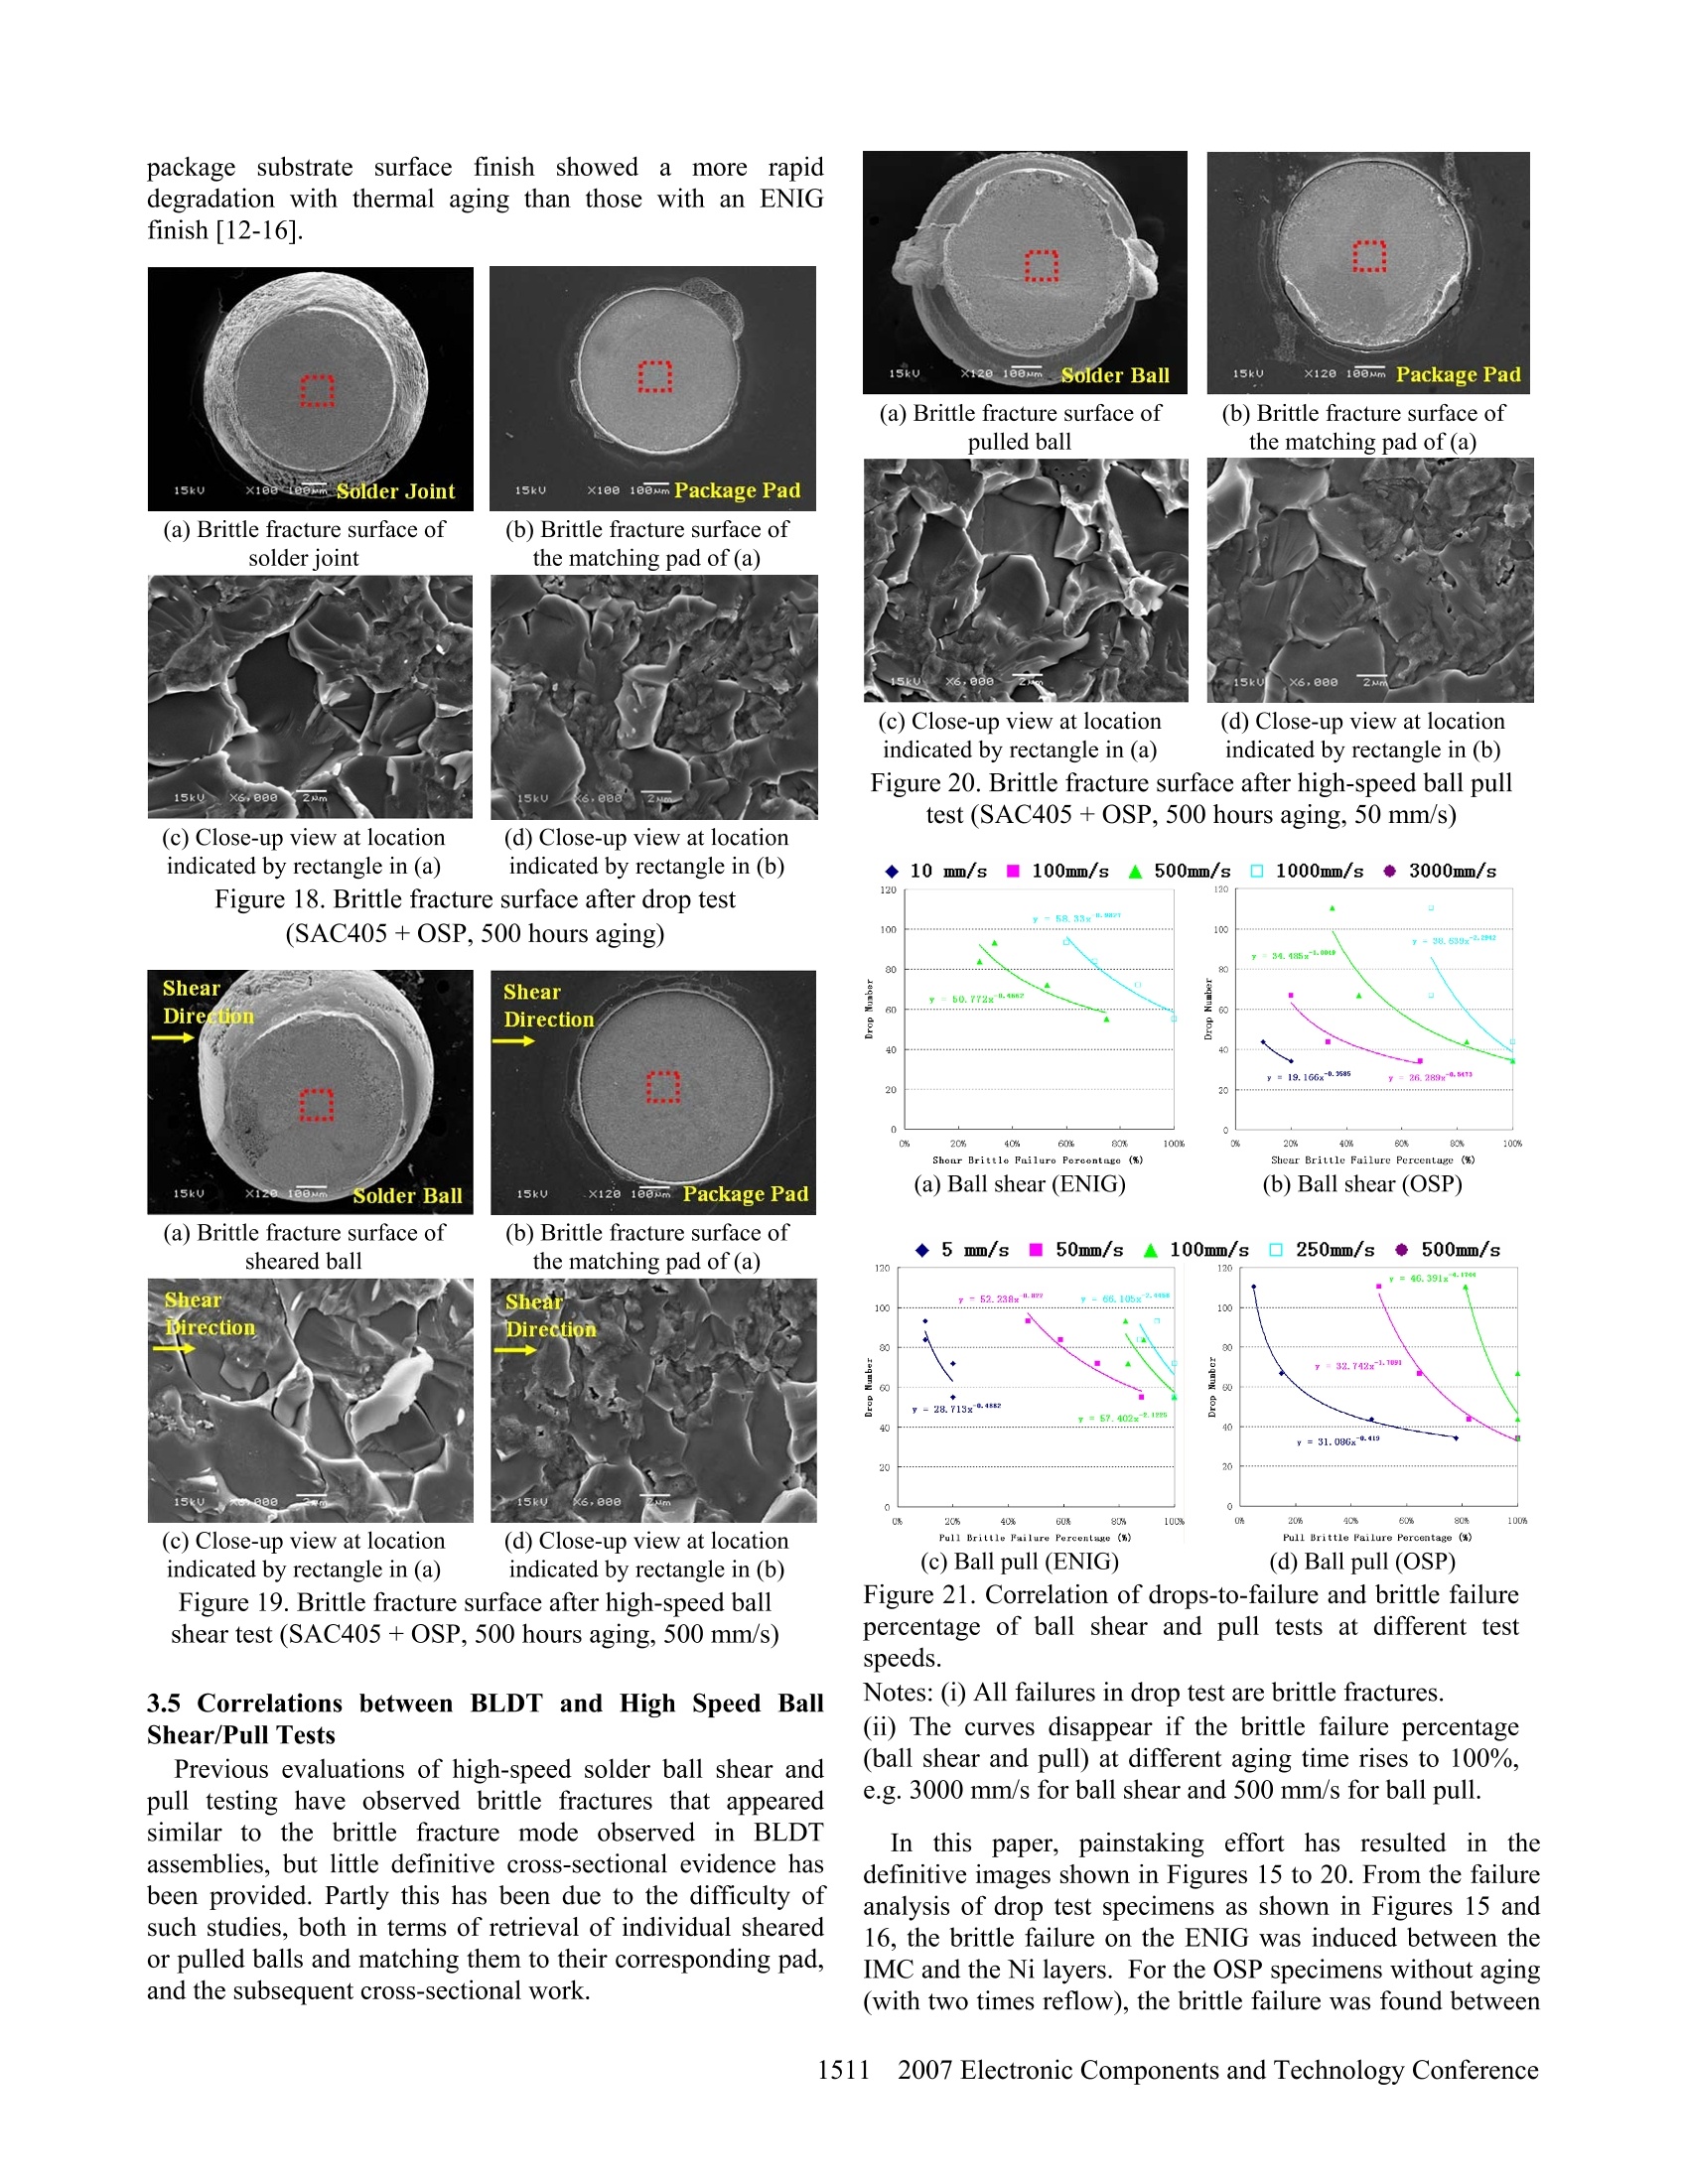
High-Speed Solder Ball Shear and Pull Tests vs. Board Level Mechanical Drop Tests:Correlation of Failure Mode and Loading Speed Fubin Song, S. W. Ricky Lee , Keith Newman, Bob Sykes, Stephen Clark’ EPACK Lab, Center for Advanced Microsystems Packaging, Hong Kong University of Science & TechnologySUN Microsystems DAGE Holdings Limited This study compares high-speed bondtesting (shear andpull) with board level drop testing (BLDT) of BGA packagesusing Sn4.0%Ag0.5%Cu solder balls and either an ENIG orOSP package substrate surface finish. High-speed shear andpull testing were carried out at various speeds; failure modeswere recorded, together with force and fracture energy data.In addition, detailed microscopic analysis (SEM and EDX)was executed on both complementary surfaces (ball and pad)of brittle fracture failures from both shear and pull testsamples. The results of these studies showed close similarityto those from brittle fractures generated during BLDT of thesame packages. Furthermore, there was strong correlationbetween various bondtesting parameters at which brittlefractures occurred and the number of drops to failure seen inBLDT. In summary, it is suggested that brittle fracturesobtained in high-speed bondtesting are a strong indicator ofBLDT behavior. 1. Introduction The reliability of lead-free solder joints under mechanicalshock loading is a major concern. Brittle fractures at theinterfaces between solder balls and package substrate bondpads are considered unacceptable. In principle, this kind ofsolder joint reliability should be characterized by board leveldrop testing. However, suchtitestinghasissome majordrawbacks. Firstly, each drop test will consume severalpaacckages iand hundredss of ssolder joints,incurringconsiderable expense. Secondly, the crack in the solder jointmay close after the impact, resulting in an undetectable failureunless there is a high-speed real time data acquisition systemavailable for in-situ monitoring. Thirdly, analysis of the datais very timeeconsuming, adding significanttexpense.Therefore, there is an imperative to find alternative methodsfor evaluating solder joint integrity under mechanical shockloading [1-3]. The present study was performed to compare high-speedsolder ball shear and pull tests with BLDT. Emphasis hasbeen placed on the correlation of failure mode and energyabsorption between the two methods. The objective was toinvestigate the feasibility of using high-speed solder ballshear and pull tests as an alternative method of evaluatingsolder joint integrity under dynamic loading [4-8]. During thecourse of this study, a comprehensive testing program wasconducted, which included BGA package constructionsemploying various combinations of solder alloys, surfacefinishes, substrate material, solder ball size and packagedimensions. Due to space constraints, however, this paper describesresults for a ssingle 316 PBGA(27mm x 27/mm)construction, using Sn4.0%Ag0.5%Cu (SAC405) solder balls,but fabricated with different surface finish options: electrolessnickel immersion gold (ENIG), and organic solderabilitypreservative (OSP). The samples were divided intoo groups whichl weresubjected to thermal aging at 125℃ (0 to 500 hours) in orderto accelerate the formation of intermetallic compound (IMC)at the package substrate/solder-joint interface. The ball sheartests ranged from 10 mm/s to 3000 mm/s and the ball pulltests ranged from 5 mm/s to 500 mm/s. An advanced, state-of-the-art machine, the DAGE 4000HS, was used to perform allof the tests. This high-speed testing machine was equippedwith the most updated control and analysis software and anew generation of force transducers, which are now able toevaluate the fracture energy of solder balls in both ball shearand ball pull tests. In the current testing program, the peak shear/pull forceand energy absorption were evaluated for each test, and thecorresponding failure mode documented. The second part ofthis study was BLDT. During each drop test, records ofelectrical resistance, circuit board strain,andfixtureacceleration were recorded. Detailed analyses were performedto identify the failed solder joints and corresponding failuremodes. The failure modes and loading speeds of solder ballshear andpull tests werecross-referenced withthemechanical drop tests for comparison. From the test results,various correlations between failure mode and loading speedhave been observed. Also, the energy absorption valuerecorded during solder ball shear and pull tests is consideredan effective index to interpret the solder joint failure mode.Future publications will document more thoroughly theanalytical relationships observed between BLDT, high-speedshear/pull and solder joint fracture energy. Unfortunately, thewide scope of the study precludes full description within anindividual paper. 2. Experimental Procedures Two types of substrate pad finishes were investigated inthis study: OSP and ENIG. The chemical composition oflead-free solder alloy used in this work is SAC405.Theobjective of the present study is to investigate the correlationof board level drop test and solder ball shear/pull tests. The316 PBGA samples used standard 0.76 mm(0.030 in.) dia.spheres. The package substrates were composed of BTlaminate, with a thickness of 0.36 mm. The solder bond padswere solder-mask-defined with an opening of 0.635 mm indiameter. The solder balls were attached to the substrates in a hot-air convective reflow oven. The Pb-free soldering profilehad a 150 ±2℃ pre-heat, with a peak temperature of 260℃. Thermal aging to accelerate IMC growth was conducted at125℃ in an oven for several time durations (100, 300 and500 hours). After thermal aging, some PBGA specimens withsolder ballswere molded, cross-sectioned and etched(2%HCl+98%methanol). They were inspected and analyzedby scanning electron microscopy (SEM). The compositions ofIMC phases grown during reflow and thermal aging wereevaluated. Similar BGA samples were assembled on test boards anddropped using a dual-rail guided device. Since the packagesused in theepresent study were relatively large,. thespecifications of the test boards (142x142 mm, 8 layer Cu,2.35 mm thick) were different from those given in JESD22-B111 [9]. Some board level test samples were also subjectedto thermal aging, as above. All samples were equipped withdaisy chains and subjected to real time data acquisitionmonitoring. The ball shear and pull tests were performed with differentspeeds on the lead-free solder balls after thermal aging usinga DAGE 4000HS bond tester (Figure1). Each set of ballshear or pull test data consisted of a series of 20 individualmeasurements. (a) DAGE 4000HS Bond tester HS Ball ShearHS Ball Pull (b) Ball shear system (c) Ball pull system Figure 1. DAGE 4000HS Bond tester system A summary of various sample and test parameters is listedin Table 1. High-speed video capture (2,000-20,000 frames/s)was conducted for selected solder ball shear/pull samples.Various kinetic effects of the test hardware and samplefixturing were observed. Test speeds above approximately100 mm/s proved the most uniform during solder jointfracture. Table 1. Description of mechanical tests for solder balls Test Method HS Shear Test HS Pull Test Loading 10,100,500,1000 5, 50,100,250, and Rates and 3000 mm/s 500 mm/s Shear Height 50 um Clamping 2.2 bar Force Solder Sn4.0%Ag0.5%Cu Sn4.0%Ag0.5%Cu Composition Pad Finish ENIG and OSP ENIG and OSP Sample As-reflowed As-reflowed Status (two times reflow) (two times reflow) Figure2. IMC growth and morphology changes subject tothermal aging at 125℃ (ENIG and OSP) Figure 3. Correlation between IMC thickness and aging time 3. Results and Discussion 3.1 Intermetallic Growth Representative photos of the intermetallic structures andthickness for BGA samples (unattached to a circuit board) areshown in Figure 2. Given the highly non-uniform topographyof the IMC layer, the average thickness was determined bydividing the cross-sectional area of the IMC by its base length. Figure 3 plots the measured IMC thickness againsttime, yielding the expected linear fit when plotted against thesquare root of the aging time. The experimental data followsclassical diffusion theory (Fick’s law), which specifies alinear relationship between the thickness of IMC layer and thesquare root of time. Figure 3 also shows that the IMC growthrates in solders on OSP surface finish are higher than those onENIG. This demonstrates that the Ni layer in ENIG serves asa good barrier to inhibit growth of Cu-Sn IMC [8]. (a) Ductile mode (100% area with solder left) (b) Quasi-ductile mode (<50% area with exposed pad) (c) Quasi-brittle mode (>50% area without solder) (d) Brittle mode (almost no solder left) (e) Pad lift with brittle Figure 4. High-speed ball shear and pull failure modes 口1Ductile ■Quasi-Ductile ■IQQuasi-BrittleBrittle Pad Lift (i) 3000 mm/s(ENIG) (j) 3000 mm/s (OSP) Figure 5. Failure mode distribution in ball shear ofspecimens with ENIG and OSP pad finishes 3.2 Solder Ball Shear/Pull Failure Modes In this investigation, the solder ball shear and pull testsamples were evaluated both quantitatively (force and fractureenergy) and qualitatively (failure mode). In order to enhancediscrimination of the qualitative failure mode assessments,mixedductile/brittlemodes were divided into twoclassifications::quasi-ductile (<50%6 of the surfacepadremains exposed) and quasi-brittle (>50% of the surface padremains exposed). Representative photographs of the 5 failuremodes (ductile, quasi-ductile, quasi-brittle, brittle and pad lift)are shown in Figure 4. ¥1Ductile ■Quasi-Ductile ■Quasi-Brittle Figure 6. Failure mode distribution in ball pull of specimenswith ENIG and OSP pad finishes Graphical summaries of the solder ball shear and pullfailure mode results are shown in Figures 55and 6.respectively. Similar to results of previous studies, a cleartransition occurred between the ductile mode typical of lowshear/pull speeds, and a brittle mode at higher test speeds [1,2, 8]. Although the failure mode responses are remarkablysimilar between the shear and pull testing, the transition fromductile to brittle occurred at lower speeds in solder ball pulltesting. Figures 5 and 6 also demonstrate that the samples with anOSP finish showed an increased incidence of brittle failurewith increased themal exposure. By contrast, the samples withENIG plating yielded only a slight increase in brittle fracture frequency even at the highest test speeds. The different brittlefracture response between ENIG and OSP may not besurprising given the comparative IMC growth rates shown inFigure 3. Figures 7 and 8 plot the failure mode data in anotherformat, showing the percentage of brittle failure mode foreach test speed against aging time, excluding the non-solderrelated failure mode (pad lift). This transformation allows therate of brittle fracture incidence as a function of time andaging temperature to be described by simple linear curvefitting. The curve fitting follows the relationship, y=ax+ b,where y is the brittle failure percentage of ball shear and pulltest after aging, x equals aging time, and a represents thechange in brittle mode percentage with aging, and b is thebrittle failure percentage for the zero time sample. It shouldbe noted that the different slopes are a measure of thesensitivity of the test system for detecting changes in brittlefracture with time or test speed. Observe that the line with thehighest slope in each graph represents the optimal test speedfor each sample to detect changes in brittle fracture rate withtime. Figure 7. Brittle failure percentage of ball shear tests at various testing speeds and aging time Figure 8. Brittle failure percentage of ball pull test atvarious testing speeds and aging time Figure 9 transforms the linear curve fitting of Figures 7 & 8into simplified brittle fracture rate response curves versussolder ball shear and pull test speeds. These graphs provide atechnique to quantitatively define the optimal test speed(transition point) at which a solder joint fracture is most proneto shift from ductile to brittle failure mode. Additionally,Figure 9 can be used to define a recommended test speed forevaluating brittle solder joint fractures. Figure 9. The sensitivity of transition level to brittle modein ball shear and pull tests at different testing speeds Figure 10. Ball shear strength and energy of different failuremodes as a function of aging time and test speed (SAC405+ENIG) 3.3 Solder Ball Shear/Pull Fracture Force & Energy Although all of the previous figures relate to qualitativeobservations of failure mode, electronics companies wouldclearly prefer a quantitative assessment method which isindependent of subjective operator classification, andishighly repeatable. The introduction of fracture energy as analternative measure of solder joint strength (beyond theconventionalforce metric)athhighshear/pull sspeedsrepresents a major shift in the test equipment industry. Acompanion paper in this conference proceedings providesadditional discussion on the fracture energy assessment metric(see Figures 7 and 8 in [10]). ■Ductile Quasi-Ductile ■: ■Quasi-BrittleBrittle Pad Lift Figure 11. Ball pull strength and energy of different failuremodes as a function of aging time and test speed(SAC405+ENIG) Figures 10 and 11 provide a graphical summary of thefracture force and energy data (shear/pull) of SAC405 +ENIG, while Figures 12 and 13 display the same parametersfor the samples with OSP pad finish. The degree ofcorrelation between fracture energy and failure mode isobviously much better than using the traditional measure of force, confirming early observations using high-speed sheartesting [2, 5, 16]. For example, the difference of force data atvarious failure modes is not significant. In contrast, it can befound that the fracture energies of various failure modes areobviously different, both on the specimens with ENIG andOSP pad finishes as shown in Figures 11 and 13 for ball pulltests. Specifically, compare histograms (e) and (f) of Figure11; forces (e) are virtually uniform for all the aging times,even though failure modes have shifted from ductile to brittleand pad lift, but there is a distinct shift from high energyvalues for ductile failures to lower energies for brittle and padlift modes as shown in (f). A similar argument applies tohistograms (C) and (d) in Figure 13. Corresponding examplescan be seen for the shear tests in Figures 10 and 12. Aging Time (hour) Aging Time (hour) (i) Shear force (3000 mm/s) (j) Shear Energy (3000 mm/s) Figure 12. Ball shear strength and energy for differentfailure modes as a function of aging time and test speed(SAC405+OSP) 3.4 Board Level Drop Testing As highlighted in the introduction, the primary objective ofthis research was to investigate the feasibility of using high-speed solder ball shear and pull tests as alternative methods to board level drop testing for evaluating solder joint integrityunder dynamic loading. In order to provide a basis forcomparison to the shear and pull testing of the components, aseries of drop tests were conducted using board assemblies ofidentical package lots evaluated by the DAGE 4000HS.Moreover, these assemblies were aged at 125C (0 to 500hours). It is important to acknowledge, however, that the IMCcomposition and morphology for the solder joints are notidentical between the component and assembly aging studies,due to the rapid dissolution of Cu on the OSP circuit boardduring package attachment. ■Ductile ■Quasi-Ductile ■■QQuasi-BrittleBrittle Pad Lift Figure 13. Ball pull strength and energy of different failuremodes as a function of aging time and test speed (SAC405+OSP) Only a small subset ofthe total test results are representedin this paper. Indeed, some of the other test samples failedmuch earlier in drop testing than the 316 BGA packages(primarily due to their much larger size and mass), and a droptest condition was selected to insure that failures did not occuras soon as the first cycle. Following preliminary studies, aJEDEC JESD22-B110A service condition A; 500G, 1.0 ms half-sine pulse, was selected for all drop testing in thisevaluation [11]. Choosing this drop condition was necessarilya compromise; too severe and relative assessment of variousconstructions and aging exposures would be difficult, and toogentle could introduce potentially significant solder jointcyclic fatigue effects. Figure 16. IMC interfacial fracture during drop test withand without 500 hours aging (SAC405+OSP) Figure 14. Board level drop lifetime with thermal aging ofSAC405 on different pad finishes PCB Side Cu Sn, Voids Cu Sn Package Side Cu Figure 15. IMC interfacial fracture during drop test withand without 500 hours aging (SAC405+ENIG) BLDT test boards were fabricated with both non-solder-mask-defined (NSMD) and solder-mask-defined (SMD) padgeometries. In both cases, the solder-wetted pad diameter was0.6844 mm. Although NSMD is more typical of actualproduction circuit boards, SMD has the advantage for thiscorrelation study that the BLDT fracture locations are morelikely to occur at the package side; this is significant becausesolder ball shear/pull testing can only evaluate the packageside fractures as the component is unattached to a PCB. Thispaper only reports results for the SMD board configuration. (b) IMC fracture failure during HS ball pull (50mm/s) Figure 17. Cross-sectional comparison of failure fractureduring drop test, HS ball shear/pull tests (OSP, 500 hours) An extremely abbreviated summary of the drop testingresults is shown in Figure 14, identifying the mean value (8assemblies per data point) of the drops-to-failure for the testboard assemblies. Repeating observations recorded in earlierwork, the drop fracture strength of devices with an OSP package substrate surface finish showeddaamore rapiddegradation with thermal aging than those with an ENIGfinish [12-16]. 15kU xiee leom Solder Joint15kU x108 188m Package Pad (a) Brittle fracture surface ofsolder joint (b) Brittle fracture surface ofthe matching pad of (a) 15kyX6,80口15kU (c) Close-up view at location (d) Close-up view at locationindicated by rectangle in (a) indicated by rectangle in (b) Figure 18. Brittle fracture surface after drop test (SAC405+OSP, 500 hours aging) indicated by rectangle in (a) indicated by rectangle in (b) Figure 19. Brittle fracture surface after high-speed ball shear test (SAC405+OSP, 500 hours aging, 500 mm/s) 3.5 Correlations between BLDT and High Speed BallShear/Pull Tests Previous evaluations of high-speed solder ball shear andpull testing have observed brittle fractures that appearedsimilar to the brittle fracture mode observed in BLDTassemblies, but little definitive cross-sectional evidence hasbeen provided. Partly this has been due to the difficulty ofsuch studies, both in terms of retrieval of individual shearedor pulled balls and matching them to their corresponding pad,and the subsequent cross-sectional work. 15kU x120 100MmSolder Ball15kU x12e 100MmPackage Pad (a) Brittle fracture surface ofpulled ball (b) Brittle fracture surface ofthe matching pad of (a) (c) Close-up view at location (d) Close-up view at locationindicated by rectangle in (a) indicated by rectangle in (b) Figure 20. Brittle fracture surface after high-speed ball pulltest (SAC405+OSP, 500 hours aging, 50 mm/s) 10 mm/s 100mm/s 500mm/s1000mm/s 3000mm/s (c) Ball pull (ENIG) (d) Ball pull (OSP) Figure 21. Correlation of drops-to-failure and brittle failurepercentage of ball shear and pull tests at different testspeeds. Notes: (i) All failures in drop test are brittle fractures. (ii) The curves disappear if the brittle failure percentage(ball shear and pull) at different aging time rises to 100%,e.g. 3000 mm/s for ball shear and 500 mm/s for ball pull. In thisSTpaper, painstaking effort has resulted in thedefinitive images shown in Figures 15 to 20. From the failureanalysis of drop test specimens as shown in Figures 15 and16, the brittle failure on the ENIG was induced between theIMC and the Ni layers. For the OSP specimens without aging(with two times reflow), the brittle failure was found between CuSns IMC and Cu layers. The brittle failure of the OSPspecimens after thermal aging occurred between the CuSnsand Cu3Sn IMC phases. From the comparison of Figures 15 to 17 (cross-section)and 18 to 20 (fracture surface), it is clear that brittle fractureinterfaces from drop testing show a striking similarity withthose from high-speed ball shear and pull tests. These figuresprovide clear evidence of a close resemblance between thebrittle fracture modes of BLDT and high-speed solder ballshear and pull. Figure 22. Correlation of drops-to-failure and normalizedball shear and pull force with the optimal testing speed Figure 23. Correlation of drops-to-failure and normalizedball shear and pull energy with the optimal testing speed Due to their complexity and requisite length of explanation,it is not possible in this brief paper to elaborate on the variousmathematical correlations relating the solder ball shear/pull and drop test results. Nonetheless, an innovative approach isgraphically summarized in Figures 21-23. Figure 21 relatesthe brittle fracture percentages from shear and pull solder balltesting to the drops-to-failure for the specific packages anddrop test conditions used in this study. Briefly, this plot isachieved by plotting the drops-to-failure number for eachtime point against the equivalent data from shear or pulltesting, followed by power law curve fitting. It should benoted that each curve in Figure 21 corresponds to one solderball shear or pull test speed. These curves can be employed toestimate thee“drops-to-failure” number from the brittlefracture percentage obtained in either the ball shear or pulltest with a specific test speed. For demonstration purpose, the5 mm/s ball pull test curve in Figure 21(d) is used as anexample. If 60% of brittle fracture percentage is observedduring this kind of test, then people can draw a vertical line at60% on the horizontal axis and going upwards. When thevertical line hits the designated curve,people can turn left andfind its corresponding vertical coordinate (or just plug 60%into the fitting function), which is 39. This value is theestimated “drops-to-failure” number for the same type ofspecimens subject to the mechanical drop test with theconditions used in the present study. In other words, thecurves innFigure 21 may provide people: withi certain“prediction” capability to estimate the drop test results fromthe high-speed ball shear or pull test data. Figure 22 details the exponential relationship betweennormalized solder ball shear/pull force and drops-to-failurefor the brittle failure mode data points only. The shear andpull data come from the optimal speeds for each time point.Figure 23 shows similar graphical summaries for the solderball shear/pull energy. These graphs highlight that a moderateshift in brittle fracture rate, fracture energy or force for high-speed solder ball shear/pull testing can have a significantimpact on the predicted drop testing lifetime. It is suggestedthat a manufacturer might establish solder ball shear/pullfailure mode, fracture energy or force acceptance criteria for aparticular product based upon a similar analysis. Future papers will further evaluate the various relationshipsbetween drops-to-failure, failure mode, force and fractureenergy, drawing upon the much larger database generated inthe full study (only a subset of the results are included in theFigures 21-23 correlations due to limitations on paper length). 4. Conclusions 1) Solder ball shear and ball pull tests produced a highincidence of brittle fracture with increasing test speed,independent of pad finish or aging time. 2)The IMC on packages with an OSP pad grew faster thanon devices with ENIG plating, and samples with OSPpads generated more brittle solder joint failures in ballshear/pull tests after thermal aging. 3) Solder ball pull testing (compared with shear) generated ahigher percentage of brittle failures at all test speeds. 4) Compared to the specimens with ENIG pad finish, theball shear/pull strength and fracture energy of specimenswith OSP decreased more rapidly with aging time. Thisphenomenon most likely relates to the thicker Cu-Sn phase IMC formed in OSP specimens compared to thosewith ENIG. 5) Thermal aging showed a significant effect on board leveldrop reliability in this study for both ENIG and OSPpackage substrate pad finishes. SAC + ENIG exhibitslonger drop impact life after thermal aging than that ofSAC +OSP. From SEM inspection, all drop test failureswere brittle fracture at an IMC interface, regardless ofpad finish or aging time. 6) From the failure analysis of drop test specimens, thebrittle failure on the ENIG was induced between the IMCand the Ni layers. For the OSP specimens without aging(with two times reflow), the brittle failure was foundbetween CuSns IMC and Cu layers. The brittle failure ofthe OSP specimens after thermal aging occurred betweenthe CuSns and CugSn IMC phases. 7) Detailed comparison of brittle fracture interfaces fromdrop testing with those from high-speed shear ball shearand pull tests showed a striking similarity. Therefore,based on these microstructural observations, high-speedball shear and pull tests can be used as an indicator ofboard level drop test performance. 8) Power law relationships can be obtained at differentshear/pull testing speeds using the combined results ofdrops-to-failure and brittle failure percentages of ballshear/pull tests with thermal aging time. Using thiscorrelation, drop impact lliifetime can be estimatedaccording to the brittle failure percentages obtained in thehigh-speed ball shear and pull tests. References 1.A. T. Valota, A. Losavio, et al“ High Speed Pull TestCharacterization of BGA (Solder Joints," Proc. 7thInternational Conference on Thermal, Mechanical andMultiphysics Simulation and Experiments in Micro-Electronics and Micro-Systems, 2006. EuroSime 2006.Milano, Italy, April2006. 2. C. L. Yeh, Y. S. Lai,“Insights into Correlation BetweenBoard-level Drop Reliability and Package-level BallImpact Test,” Proc. 56th Electronic Components &Technology Conference, San Diego, CA, June 2006, pp.455-461. 3. K. Newman,“BGA Brittle Fracture—Alternative Solderjoint Integrity Test Methods,” Proc. 55th ElectronicComponents & Technology Conference, Orlando, FL,June 2005, pp. 1194-1200. 4. JEDEC Standard JESD22-B117A,“Solder Ball Shear,”October 2006. 5. Julian Yan Hon Chia, et al.,“The mechanics of the solderball shear test and the effect of shear rate,”MaterialsScience and Engineering A 417 2006, pp. 259-274. 6. X. Huang, S. W. R. Lee, C. C. Yan and S. Hui,“Characterization and Analysis on the Solder Ball ShearTesting Conditions,” Proc. 51st Electronic Components& Technology Conference, Orlando, FL, June 2001, pp.1065-1071. 7. Raiser, G., et al.,“Solder Joint Reliability ImprovementUsing the Cold Ball Pull Metrology,” Proc InterPACK ( '05: :1 Intl Electronic Packaging Technical Conf a nd Exhibition, San Francisco, CA, July 17-22, 2005. ) 8. F. B. Song and S. W. R. Lee, “Investigation of IMCThicknessEffecton the Lead-freeeSolderr BallAttachment Strength-Comparison between Ball ShearTest and Cold Bump Pull Test Results,” Proc. 56thElectronic Components & Technology Conference, SanDiego, CA, June 2006, pp.1196-1203. 9.JEDEC Standard JESD22-B111,“Board Level Drop TestMethodof Components for IHandheld ElectronicProducts,”July2003. ( 10. F. B. Song, S. W. R. Lee, K. Newman, B. Sykes and S.Clark,“Brittle Failure Mechanism of SnAgCu and SnPbSolder Balls during High Speed Ball Shear and Cold Ball Pull Test, ” Proc. 57th Electronic Compoi ients & T echnology Conference, Reno, NV, June 2007. ) 11. JEDEC Standard JESD22-B110A, “SubassemblyMechanical Shock.”November 2004. 12. C. Brizer, et al“Drop Test Reliability Improvement ofLead-free Fine Pitch BGA Using Different Solder BallComposition,”Proc. 55thElectronic Components &Technology Conference, Orlando, FL, June 2005, pp.1194-1200. ( 1 3 . Yueli, ' “High Temperature Aging A f fects o n L ead Free CSPs - D rop T e st R e liability, ” IPC/ JEDEC c onf, August 2006, Santa Clara, CA. ) ( 14. T. C . C hiu, e t a l “Effect of Thermal A ging o n BoardLevel D rop Reliability for Pb-free BGA Packages,”Proc. 54th Electronic Components & T e chnology Conference, Las Vegas,NV, June 2004, pp. 1256-1262. ) ( 15. L. Xu a nd J . H. L . Pang,“E f fect of Im t ermetallic andKirkendal l Voids Growth 1 on 1 Board ILevel Drop Reliabilit y for SnAgCu Lead-free BGA S o lder Joint,” Proc. 56th Electroni c Components& TechnologyConference, San D iego, C A, June 2006, pp.275-282. ) ( 16. E. H. Wong, et al,“Drop Impact: F u ndamentals and I mpact Characterization o f S o lder J o ints,” Proc. 55" Electr. Comp. T echnol. C onf, L a ke Buena Vista, FL , 2005,pp.1202-1209. ) $CIEEEElectronic Components and Technology Conference Electronic Components and Technology Conference Conclusions1) Solder ball shear and ball pull tests produced a high incidence of brittle fracture with increasing test speed, independent of pad finish or aging time.2) The IMC on packages with an OSP pad grew faster than on devices with ENIG plating, and samples with OSP pads generated more brittle solder joint failures in ball shear/pull tests after thermal aging.3) Solder ball pull testing (compared with shear) generated a higher percentage of brittle failures at all test speeds.4) Compared to the specimens with ENIG pad finish, the ball shear/pull strength and fracture energy of specimens with OSP decreased more rapidly with aging time. This phenomenon most likely relates to the thicker Cu-Sn.
确定

还剩8页未读,是否继续阅读?

产品配置单


聚擘国际贸易(上海)有限公司为您提供《锡球中剪力和拉力检测方案(力学量测量仪表(位移、力等))》,该方案主要用于其他中剪力和拉力检测,参考标准--,《锡球中剪力和拉力检测方案(力学量测量仪表(位移、力等))》用到的仪器有DAGE4000HS高速推拉力测试机、DAGE4000Optima多功能推拉力测试机、DAGE4000多功能推拉力测试机
推荐专场


相关方案
更多
该厂商其他方案
更多