


方案详情
文
脆性材料(如硅和玻璃)的强度主要取决于是否存在诸如划痕和缺口之类的微裂纹和表面缺陷。 在这些材料中,裂纹尖端的高压力无法通过塑料流缓解,因此,即使是非常小的缺陷也可能会导致低故障负荷。
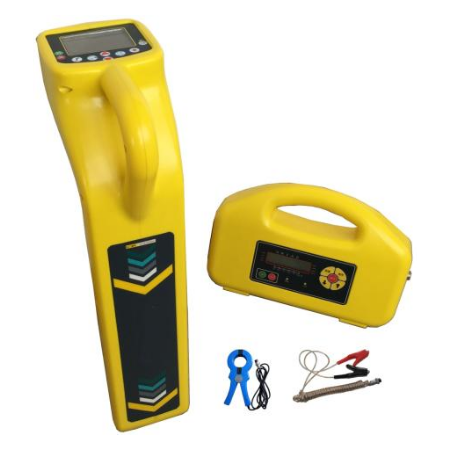
Nordson DAGE 4000Plus 测试系统低测试力功能加上我们的专用工具支持微材料弯曲测量,以评估缺陷的严重程度。 可以对尺寸小至 1 平方毫米的样本执行三点和四点以及球面弯曲测量。
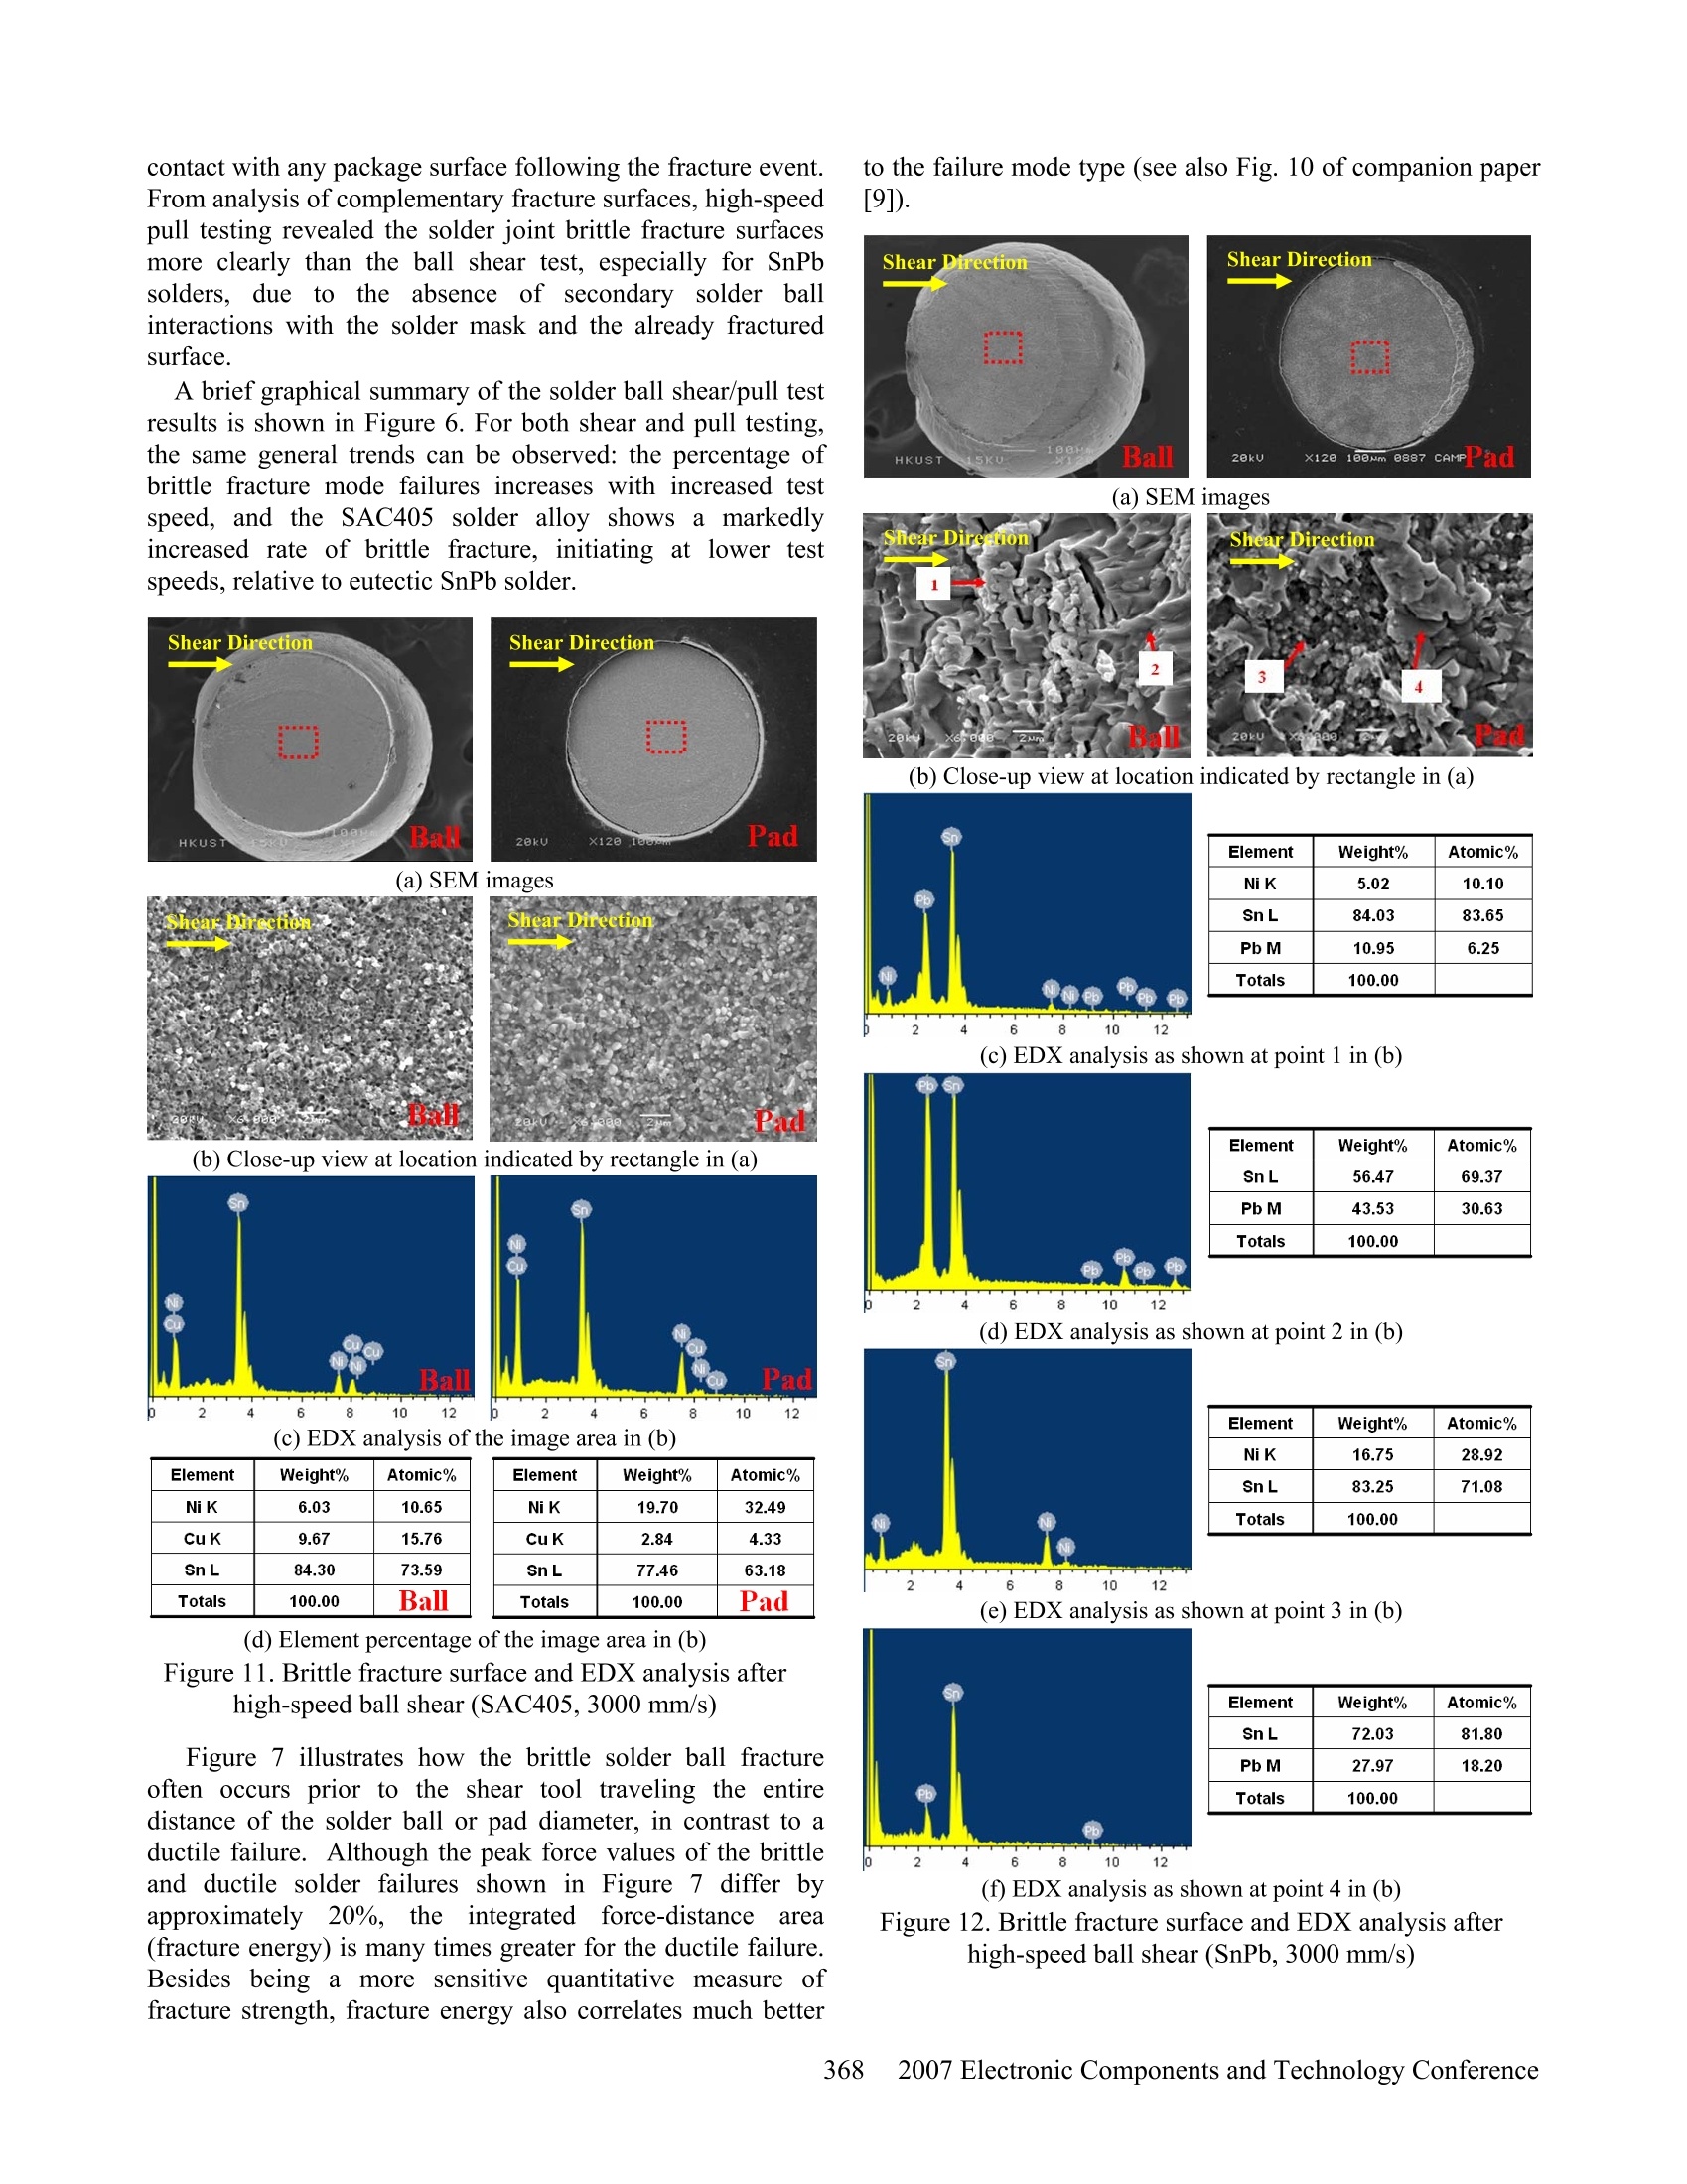
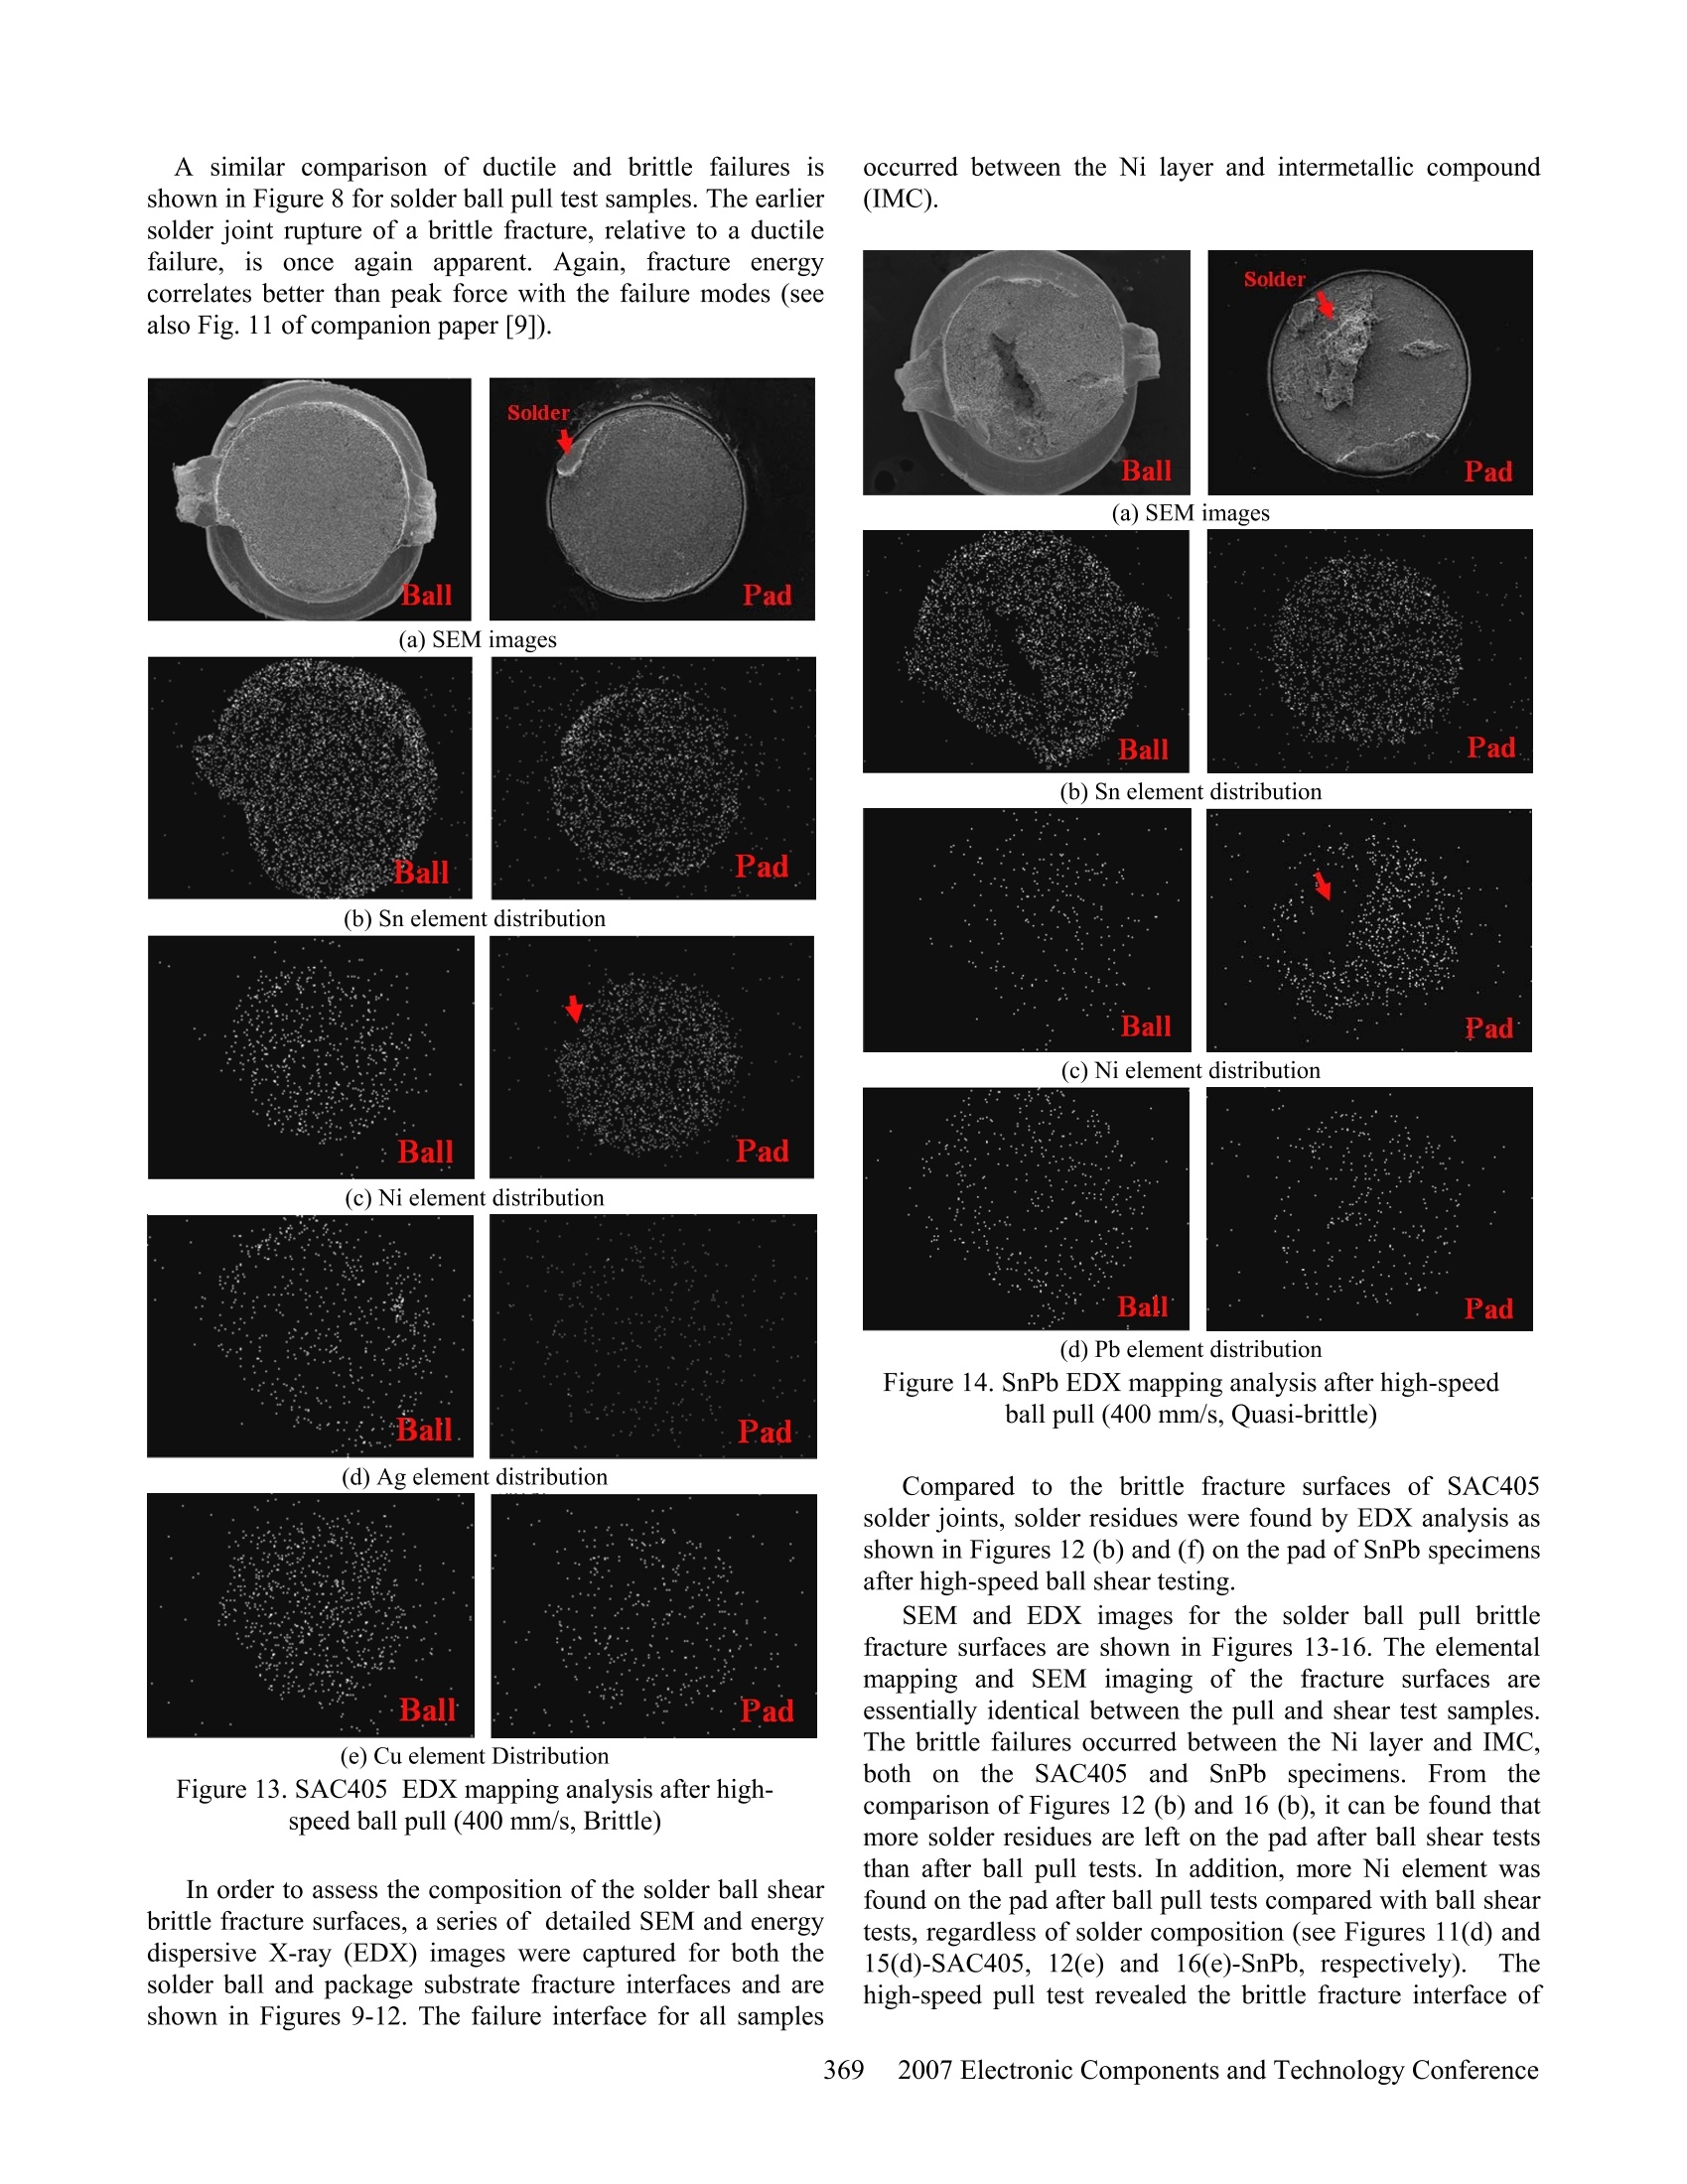
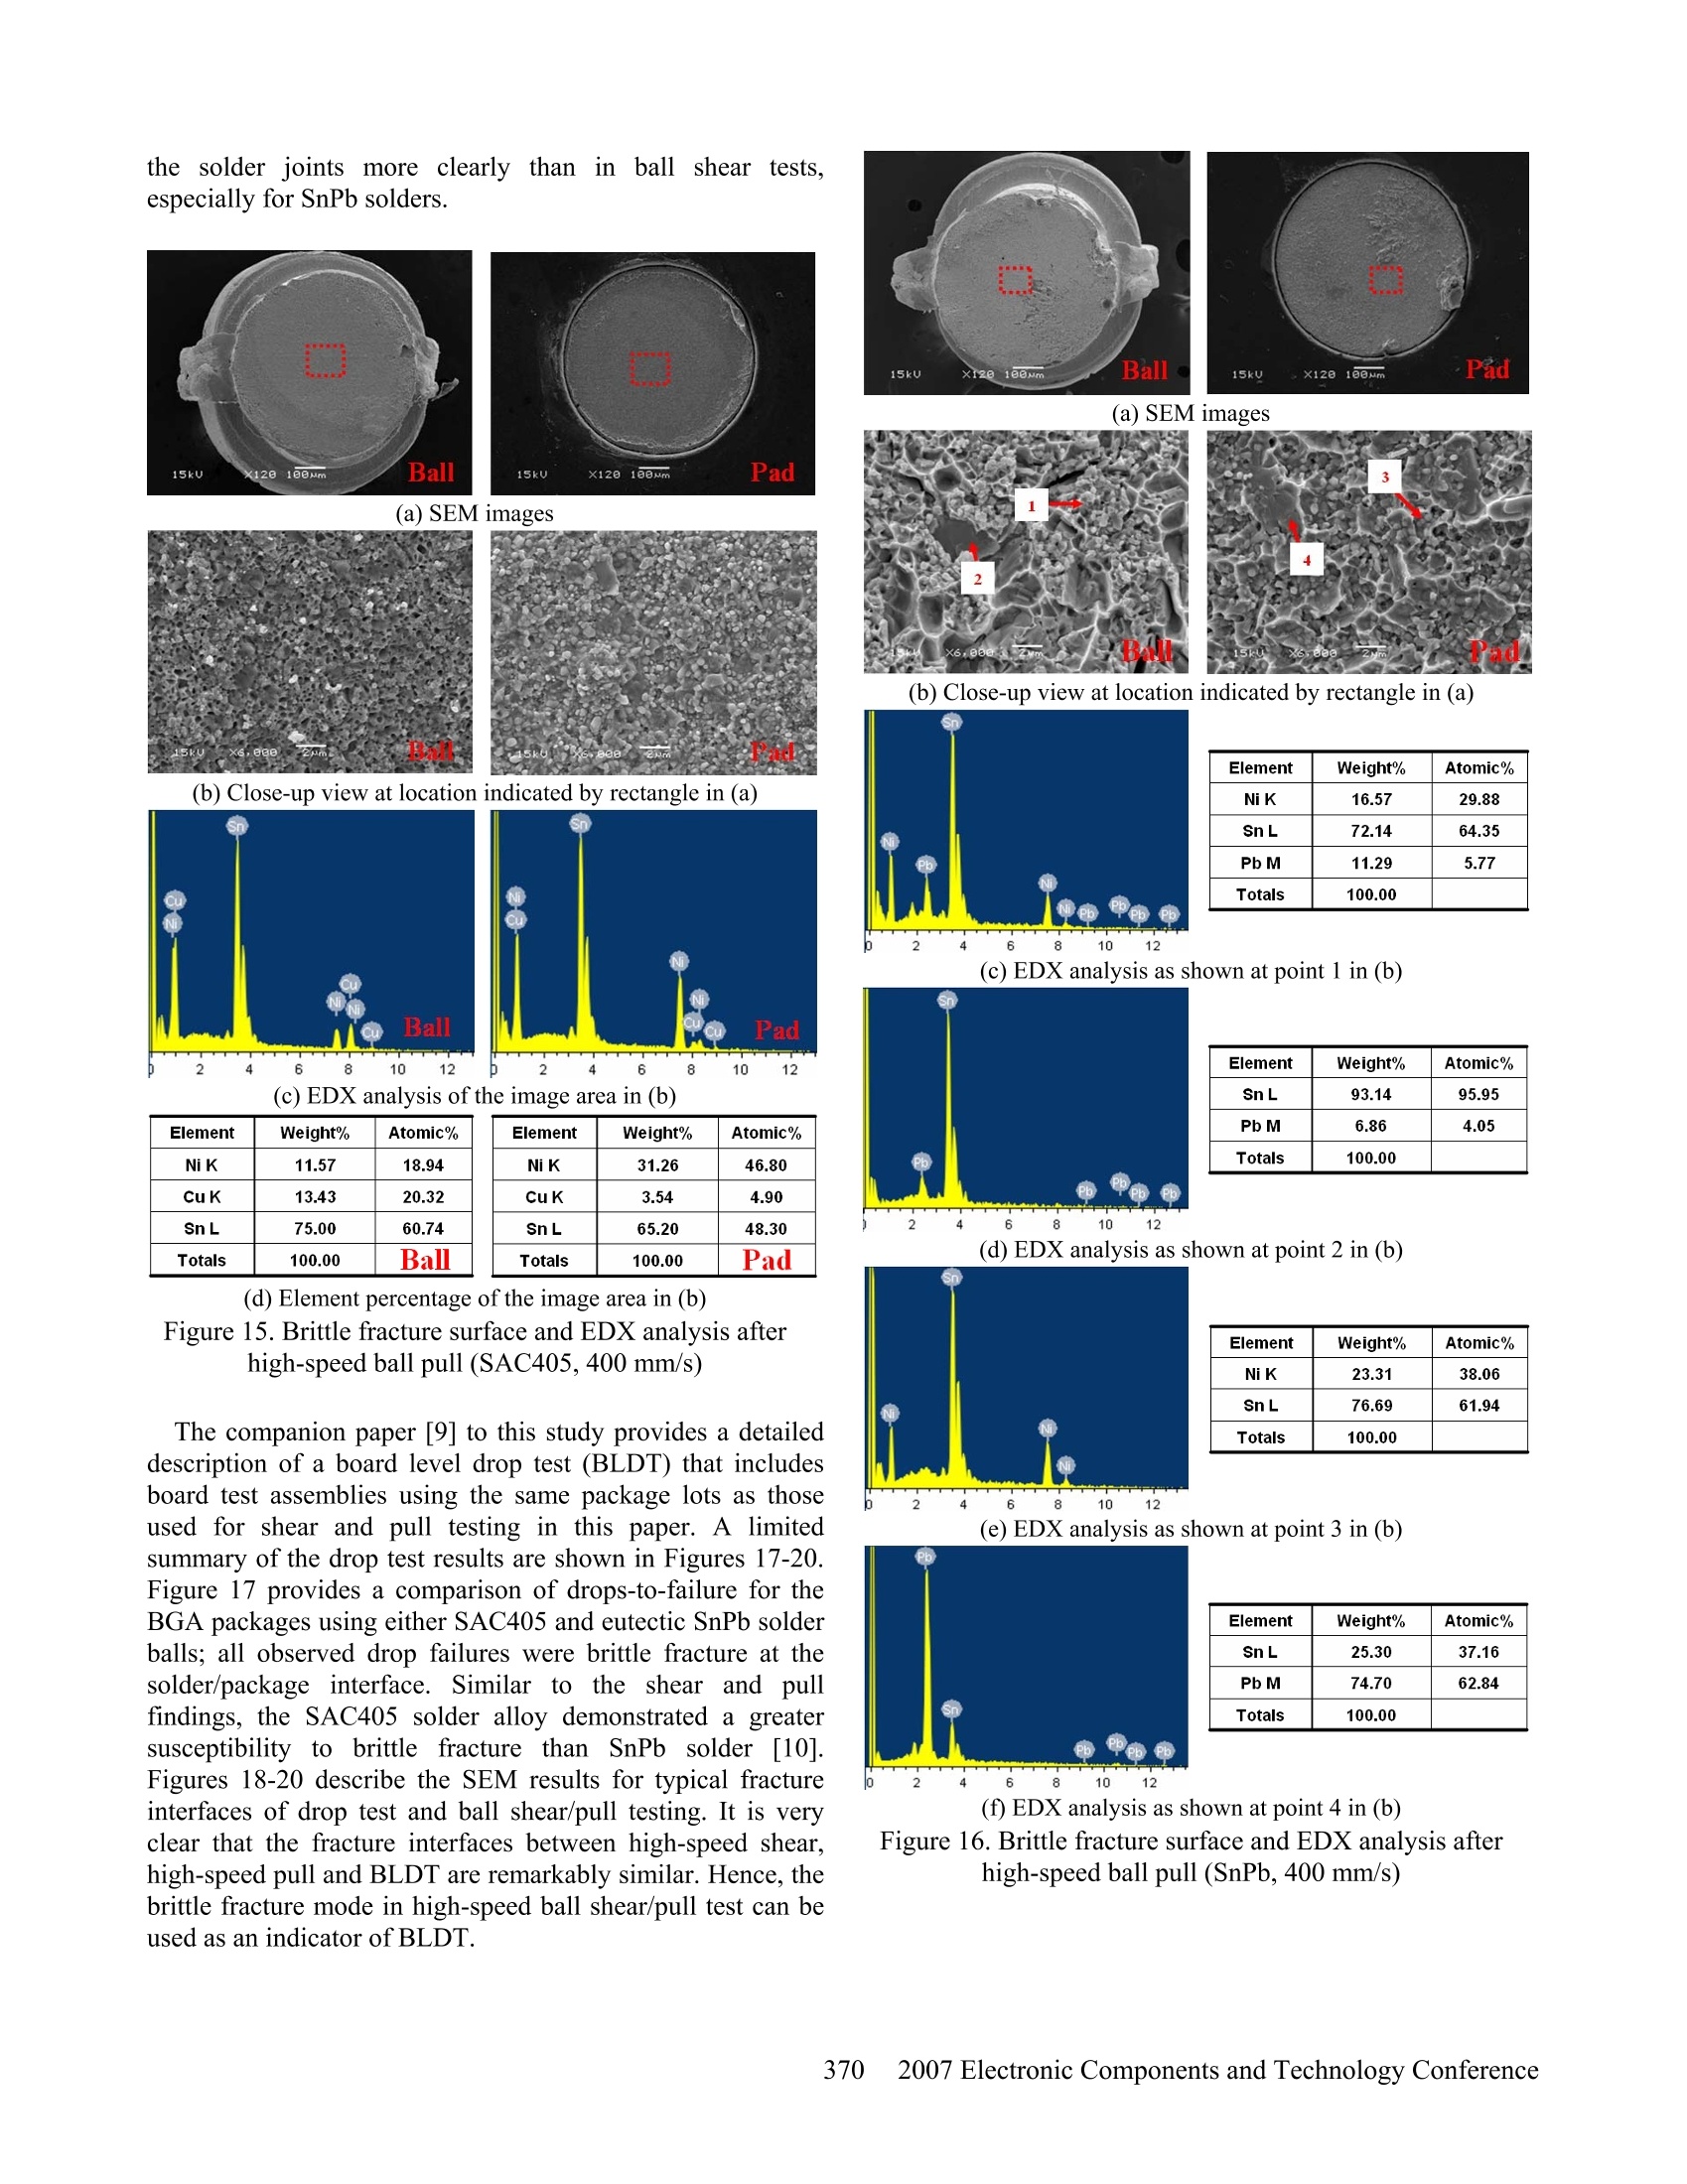
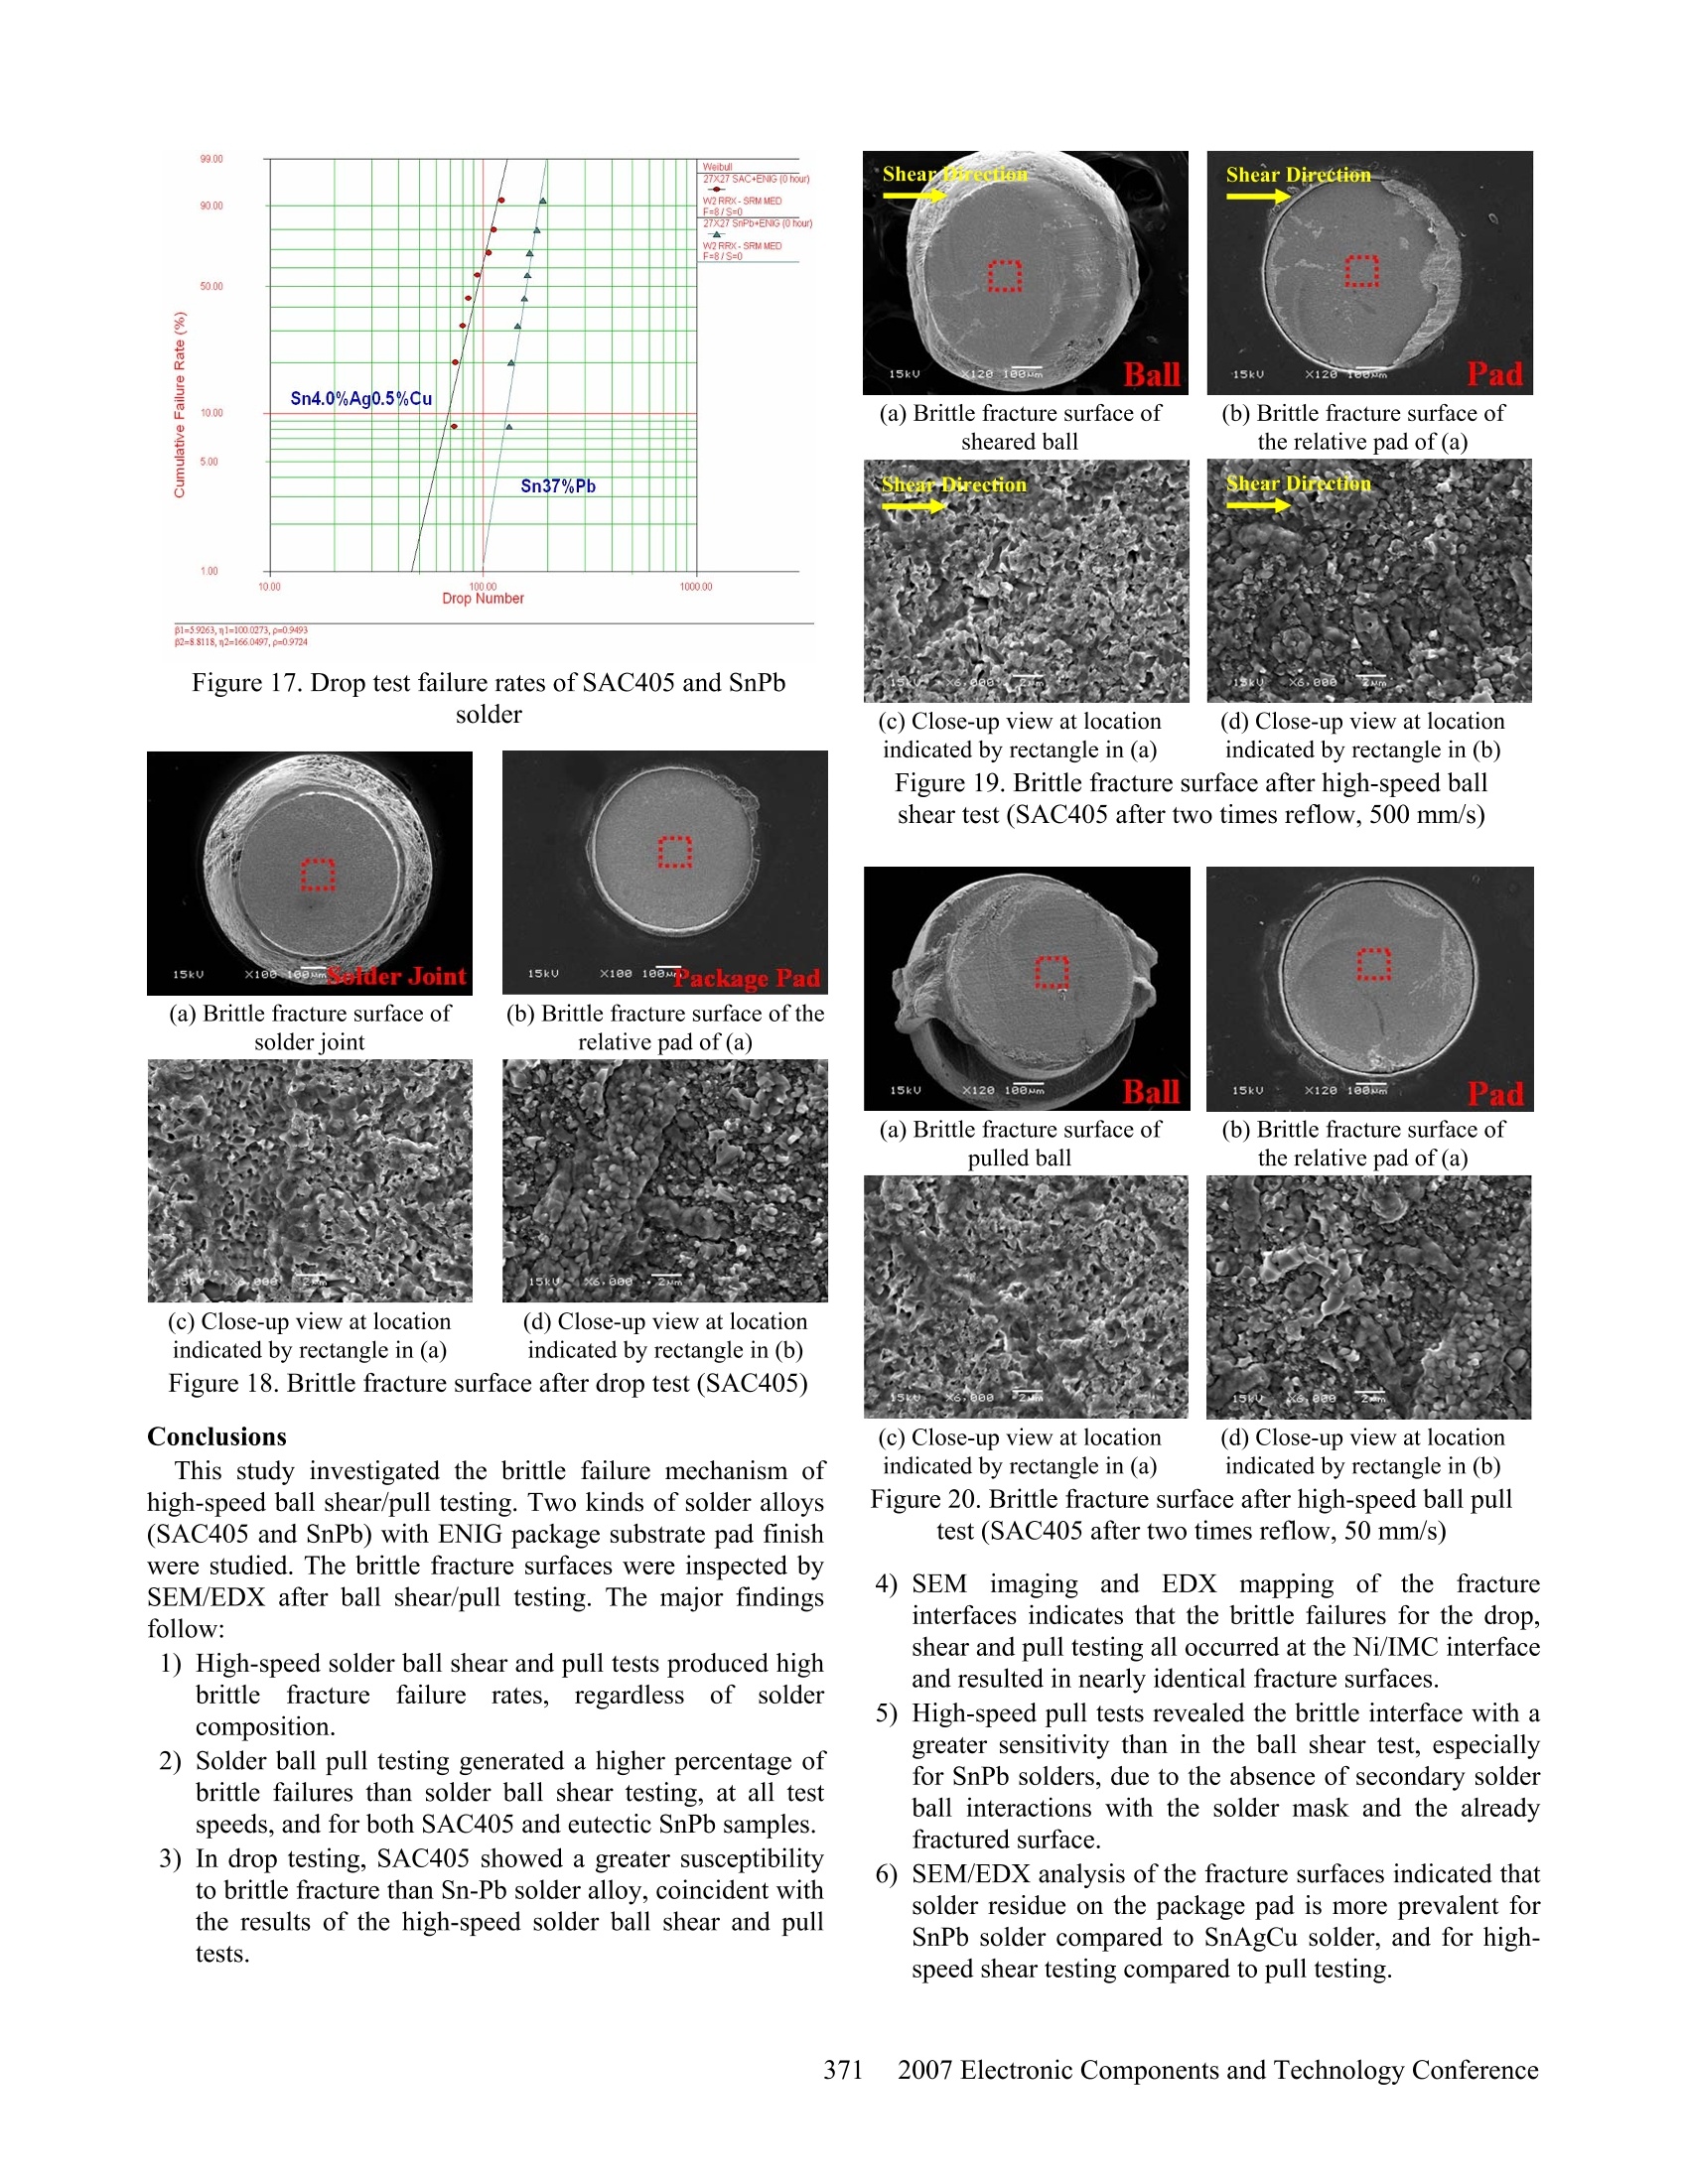
方案详情

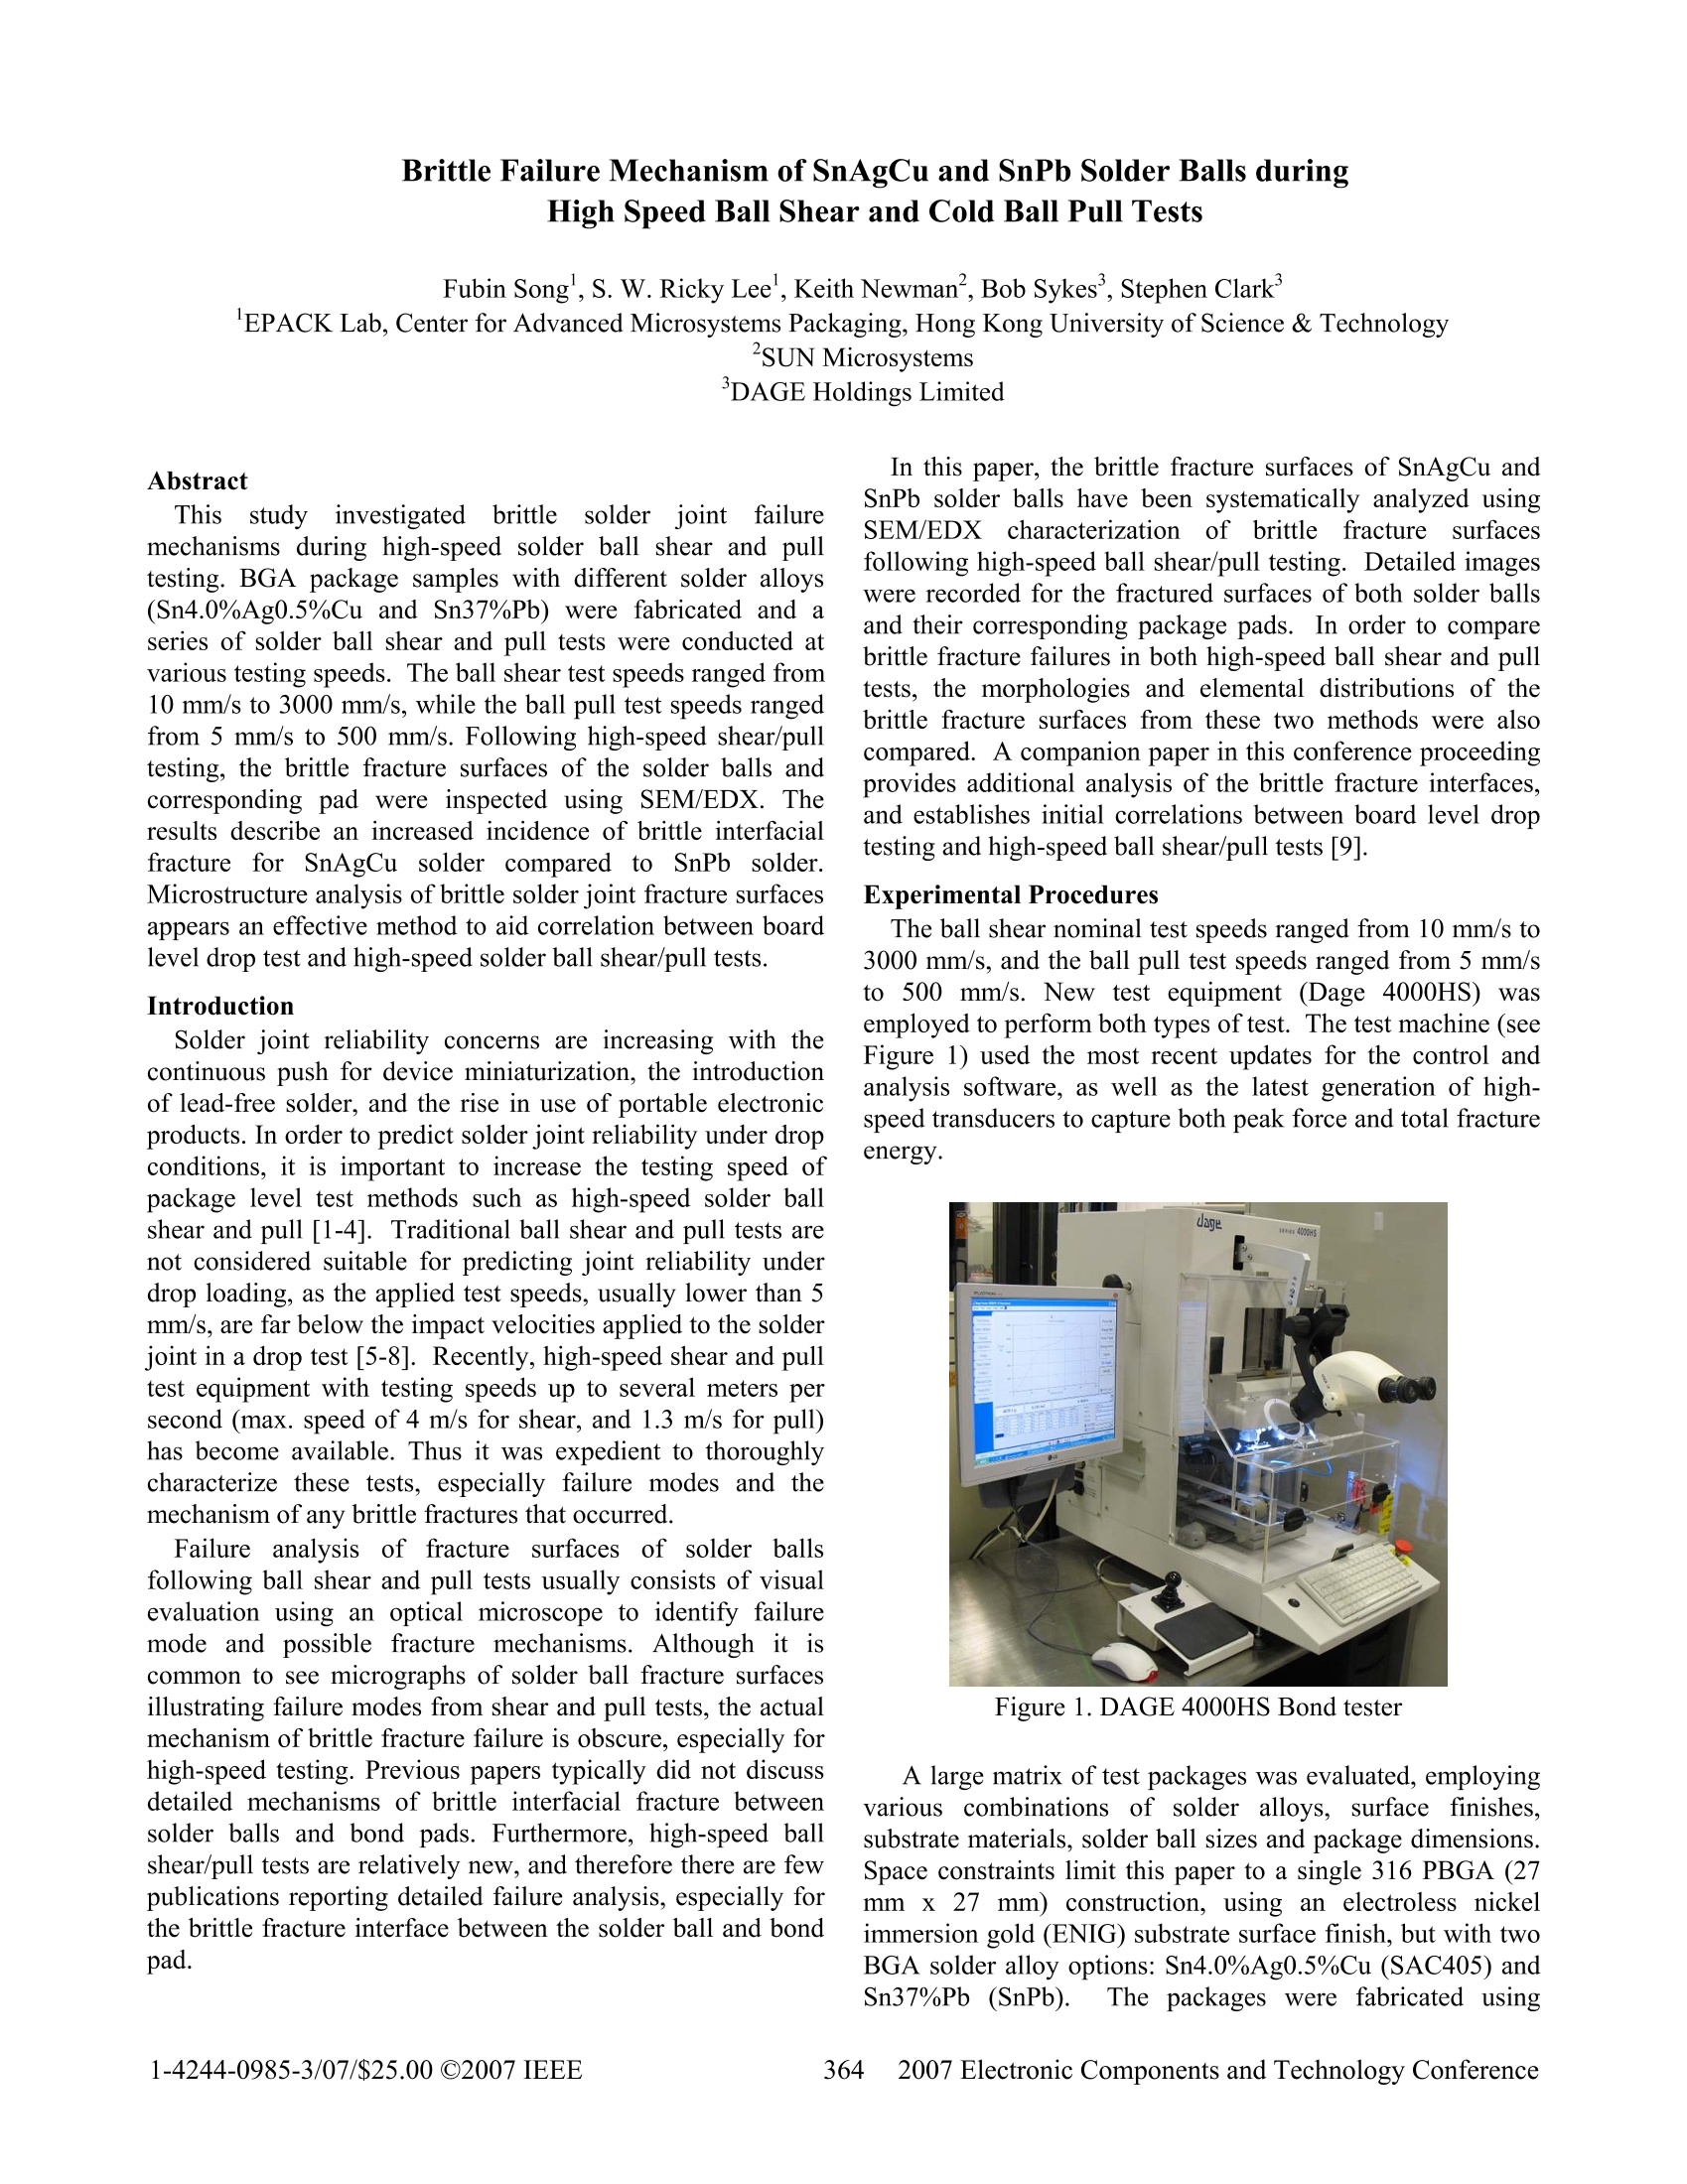
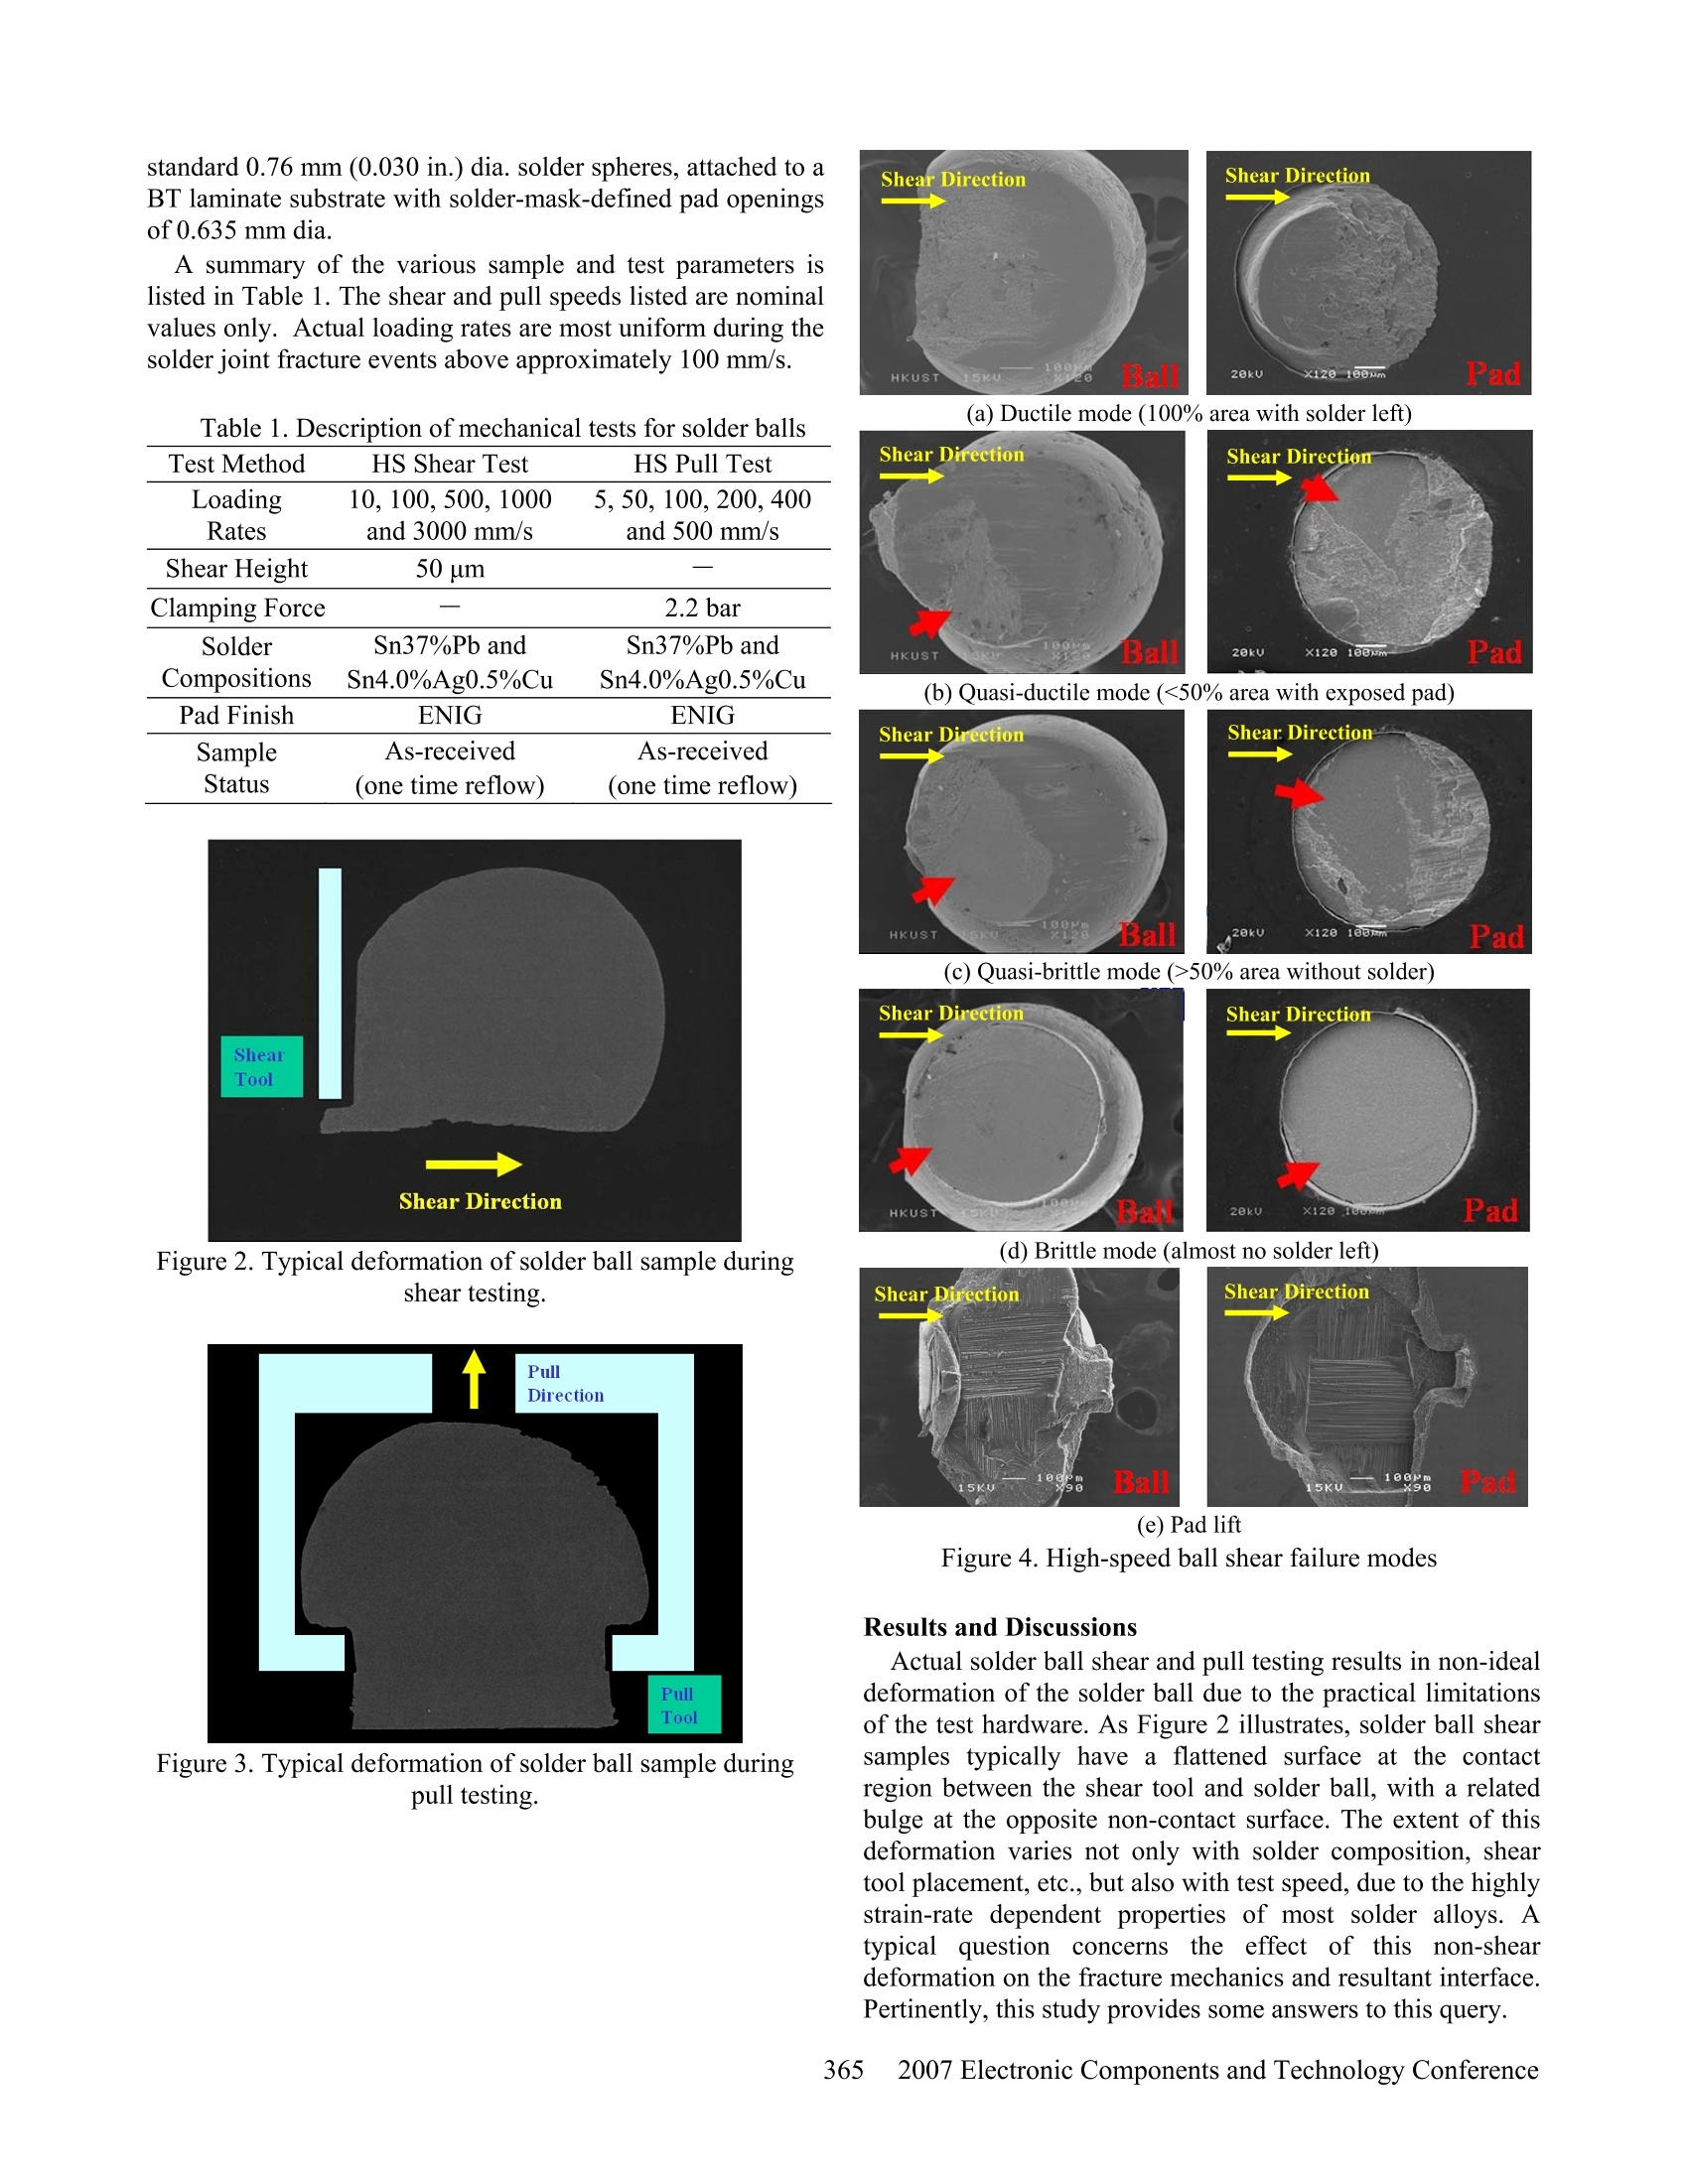
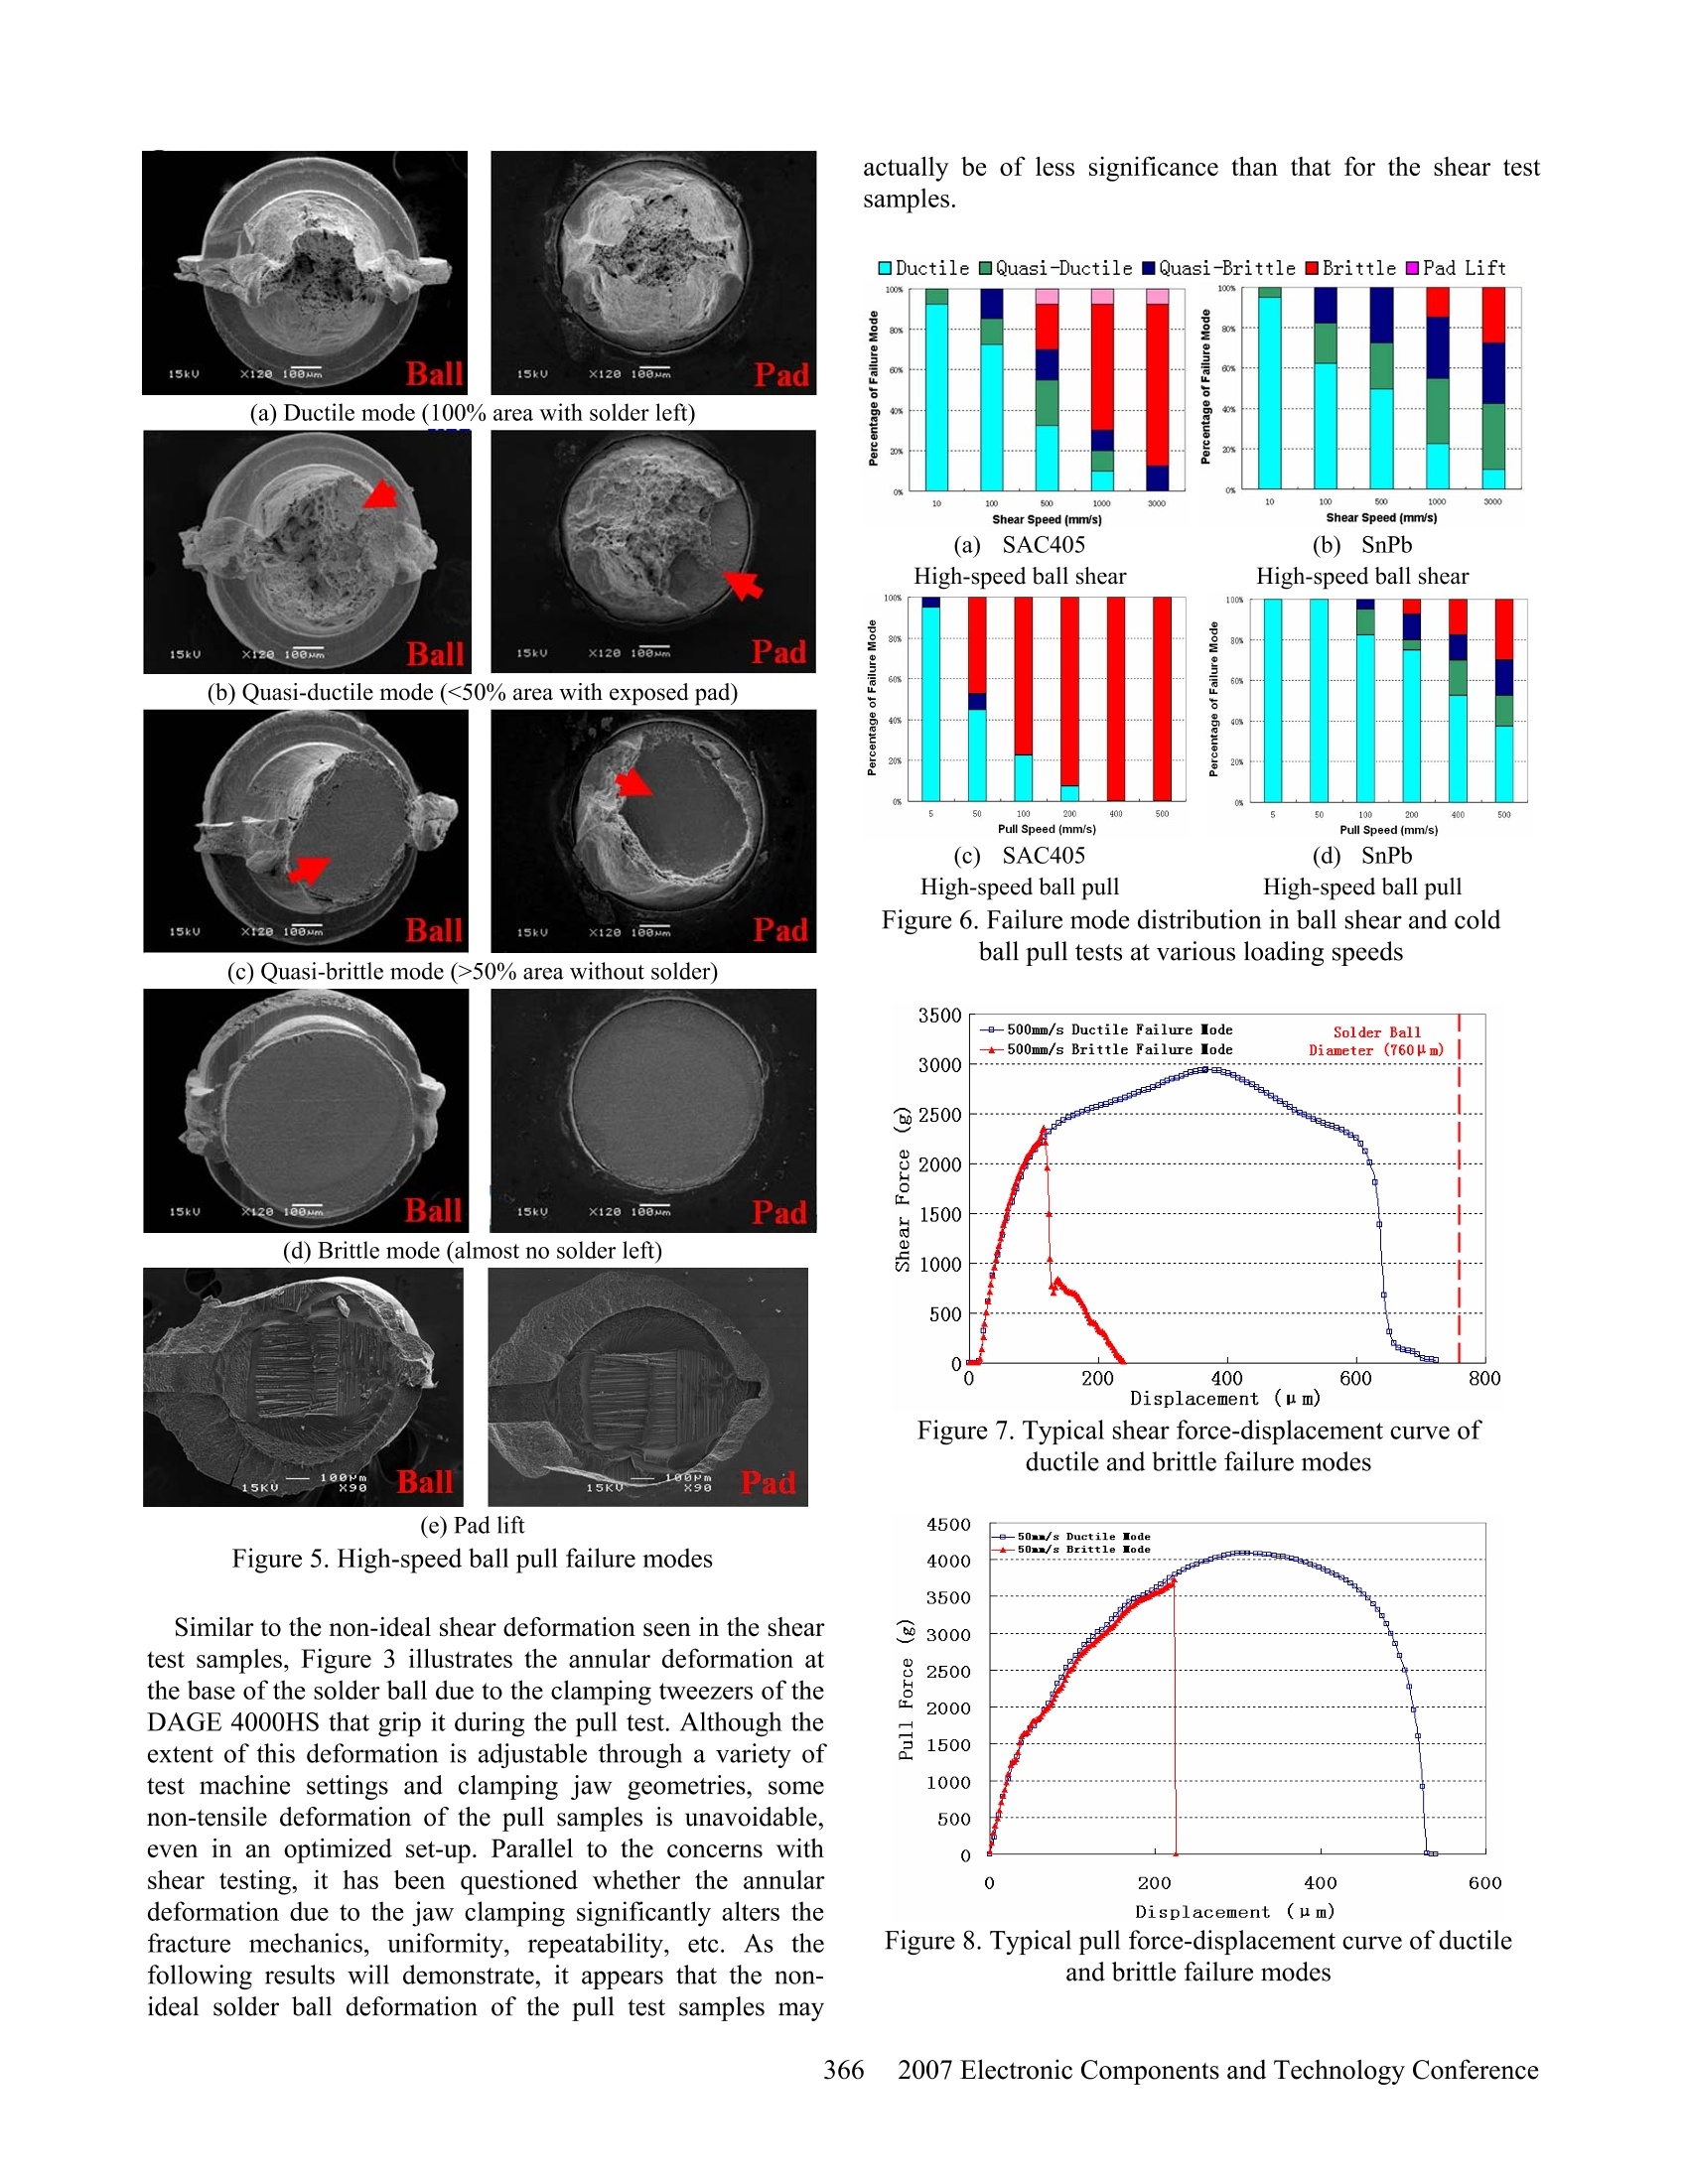
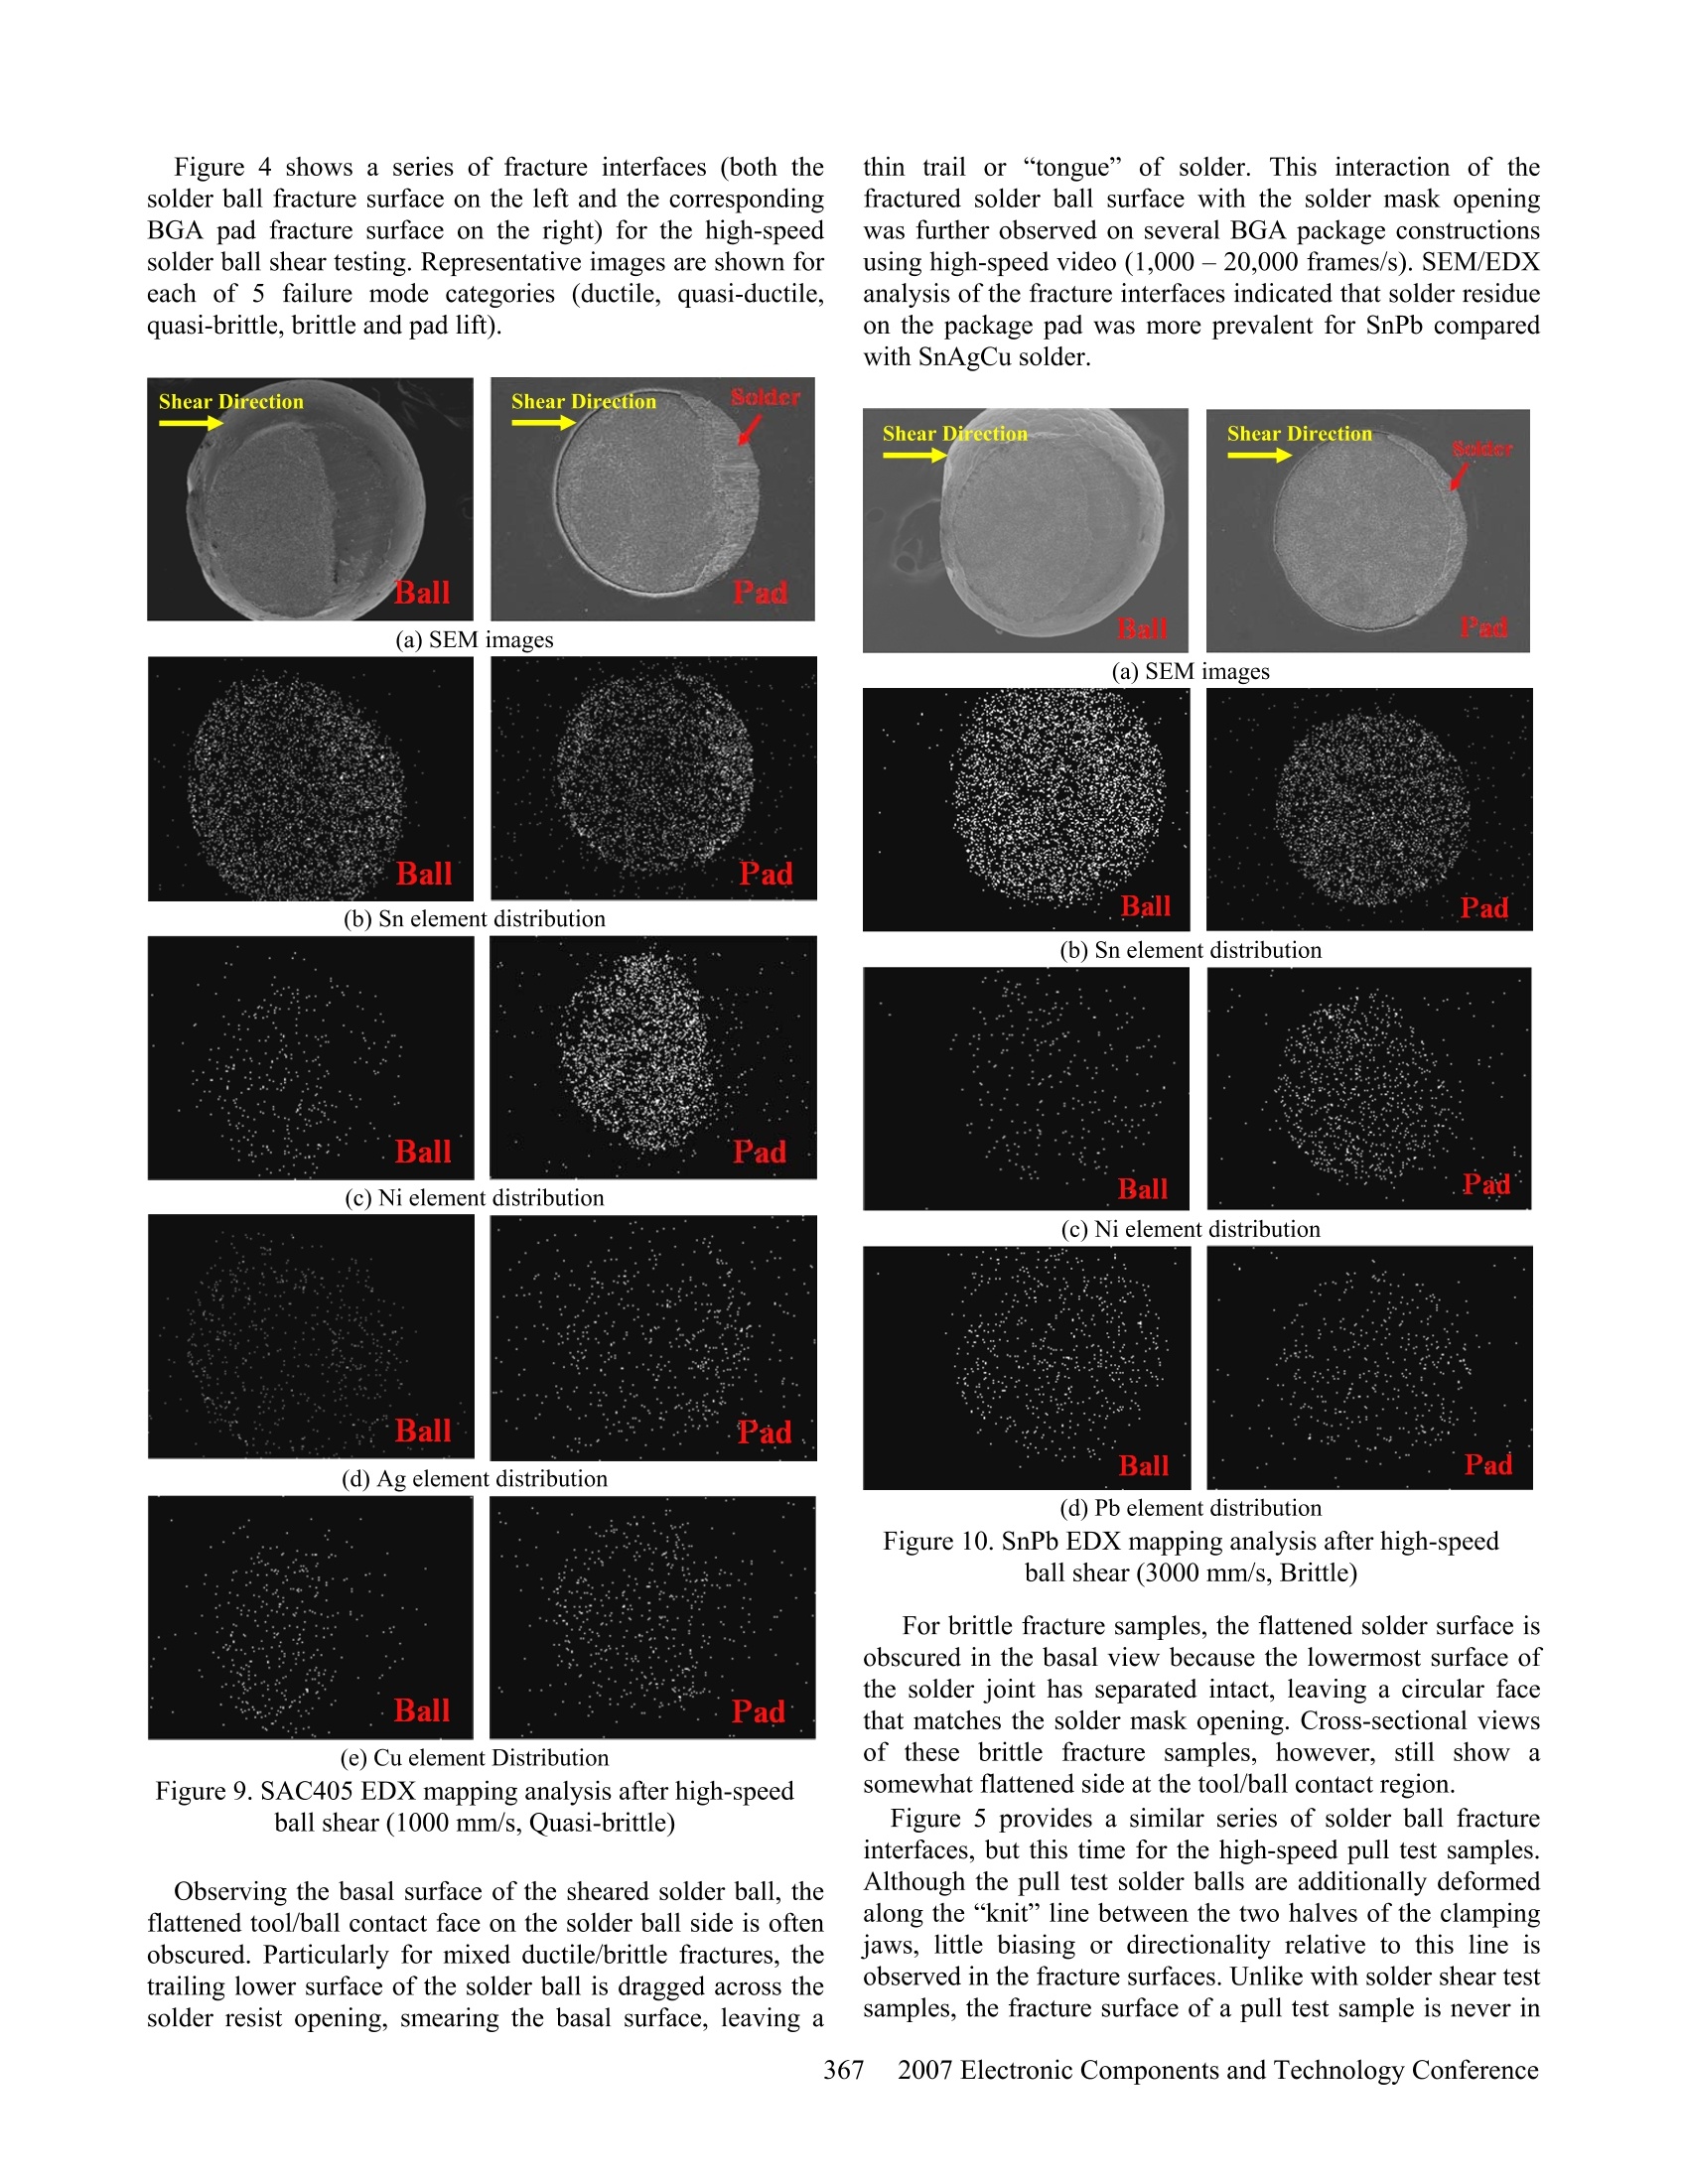
Brittle Failure Mechanism of SnAgCu and SnPb Solder Balls duringHigh Speed Ball Shear and Cold Ball Pull Tests Fubin Song, S. W. Ricky Lee, Keith Newman, Bob Sykes, Stephen Clark’ EPACK Lab, Center for Advanced Microsystems Packaging, Hong Kong University of Science & Technology SUN Microsystems 'DAGE Holdings Limited Abstract Thisstudyy investigateddbbrittlesolder jointfailuremechanisms during high-speed solder ball shear and pulltesting. BGA package samples with different solder alloys(Sn4.0%Ag0.5%Cu and Sn37%Pb) were fabricated and aseries of solder ball shear and pull tests were conducted atvarious testing speeds. The ball shear test speeds ranged from10 mm/s to 3000 mm/s, while the ball pull test speeds rangedfrom 5 mm/s to 500 mm/s. Following high-speed shear/pulltesting, the brittle fracture surfaces of the solder balls andcorresponding pad were inspected using SEM/EDX. Theresults describe an increased incidence of brittle interfacialfracture for SnAgCu solder compared to SnPb solder.Microstructure analysis of brittle solder joint fracture surfacesappears an effective method to aid correlation between boardlevel drop test and high-speed solder ball shear/pull tests. Introduction Solder joint reliability concerns are increasing with thecontinuous push for device miniaturization, the introductionof lead-free solder, and the rise in use of portable electronicproducts. In order to predict solder joint reliability under dropconditions, it is important to increase the testing speed ofpackage level test methods such as high-speed solder ballshear and pull [1-4]. Traditional ball shear and pull tests arenot considered suitable for predicting joint reliability unders. usidrop loading, as the applied test speeds, usually lower than 5mm/s, are far below the impact velocities applied to the solderjoint in a drop test [5-8]. Recently, high-speed shear and pulltest equipment with testing speeds up to several meters persecond (max. speed of 4 m/s for shear, and 1.3 m/s for pull)has become available. Thus it was expedient to thoroughlycharacterize these tests, especially failure modes and themechanism of any brittle fractures that occurred. Failure analysiss of fracture surfaces of solder ballsfollowing ball shear and pull tests usually consists of visualevaluation using an optical microscope to identify failuremode and possible fracture mechanisms. Although it iscommon to see micrographs of solder ball fracture surfacesillustrating failure modes from shear and pull tests, the actualmechanism of brittle fracture failure is obscure, especially forhigh-speed testing. Previous papers typically did not discussdetailed mechanisms of brittle interfacial fracture betweensolder balls and bond pads. Furthermore, high-speed ballshear/pull tests are relatively new, and therefore there are fewpublications reporting detailed failure analysis, especially forthe brittle fracture interface between the solder ball and bondpad. In this paper, the brittle fracture surfaces of SnAgCu andSnPb solder balls have been systematically analyzed usingSEM/EDX characterization of brittlee fracture surfacesfollowing high-speed ball shear/pull testing. Detailed imageswere recorded for the fractured surfaces of both solder ballsand their corresponding package pads. In order to comparebrittle fracture failures in both high-speed ball shear and pulltests, the morphologies and elemental distributions of thebrittle fracture surfaces from these two methods were alsocompared. A companion paper in this conference proceedingprovides additional analysis of the brittle fracture interfaces,and establishes initial correlations between board level droptesting and high-speed ball shear/pull tests [9]. Experimental Procedures The ball shear nominal test speeds ranged from 10 mm/s to3000 mm/s, and the ball pull test speeds ranged from 5 mm/sto 500 mm/s. New test equipment (Dage 4000HS) wasemployed to perform both types of test. The test machine (seeFigure 1) used the most recent updates for the control andanalysis software, as well as the latest generation of high-speed transducers to capture both peak force and total fractureenergy. Figure 1. DAGE 4000HS Bond tester A large matrix of test packages was evaluated, employingvarious combinations of solder alloys, surface finishes,substrate materials, solder ball sizes and package dimensions.Space constraints limit this paper to a single 316 PBGA (27mm x 27 mm) construction, using an electroless nickelimmersion gold (ENIG) substrate surface finish, but with twoBGA solder alloy options: Sn4.0%Ag0.5%Cu (SAC405) andSn37%Pb (SnPb). The packages were fabricated using standard 0.76 mm (0.030 in.) dia. solder spheres, attached to aBT laminate substrate with solder-mask-defined pad openingsof 0.635 mm dia. A summary of the various sample and test parameters islisted in Table 1. The shear and pull speeds listed are nominalvalues only. Actual loading rates are most uniform during thesolder joint fracture events above approximately 100 mm/s. Table 1. Description of mechanical tests for solder balls Test Method HS Shear Test HS Pull Test Loading 10,100,500,1000 5,50,100,200,400 Rates and 3000 mm/s and 500 mm/s Shear Height 50 um 一 Clamping Force 一 2.2 bar Solder Sn37%Pb and Sn37%Pb and Compositions Sn4.0%Ag0.5%Cu Sn4.0%Ag0.5%Cu Pad Finish ENIG ENIG Sample As-received As-received Status (one time reflow) (one time reflow) Figure 2. Typical deformation of solder ball sample duringshear testing. Figure 3. Typical deformation of solder ball sample duringpull testing. (a) Ductile mode (100% area with solder left) (b) Quasi-ductile mode (<50% area with exposed pad) (c) Quasi-brittle mode (>50% area without solder) (e) Pad lift Figure 4. High-speed ball shear failure modes Results and Discussions Actual solder ball shear and pull testing results in non-idealdeformation of the solder ball due to the practical limitationsof the test hardware. As Figure 2 illustrates, solder ball shearsamples typically have a flattened surface at the contactregion between the shear tool and solder ball, with a relatedbulge at the opposite non-contact surface. The extent of thisdeformation varies not only with solder composition, sheartool placement, etc., but also with test speed, due to the highlystrain-rate dependent properties of most solder alloys. Atypicall question concerns the effect of this; non-sheardeformation on the fracture mechanics and resultant interface.Pertinently, this study provides some answers to this query. (a) Ductile mode (100% area with solder left) (b) Quasi-ductile mode (<50% area with exposed pad) Figure 5. High-speed ball pull failure modes Similar to the non-ideal shear deformation seen in the sheartest samples, Figure 3 illustrates the annular deformation atthe base of the solder ball due to the clamping tweezers of theDAGE 4000HS that grip it during the pull test. Although theextent of this deformation is adjustable through a variety oftest machine settings and clamping jaw geometries, somenon-tensile deformation of the pull samples is unavoidable,even in an optimized set-up. Parallel to the concerns withshear testing, it has been questioned whether the annulardeformation due to the jaw clamping significantly alters thefracture mechanics, uniformity, repeatability, etc. As thefollowing results will demonstrate, it appears that the non-ideal solder ball deformation of the pull test samples may actually be of less significance than that for the shear testsamples. Ductile ■Quasi-Ductile ■Quasi-Brittle: ■Brittle Pad Lift Figure 6. Failure mode distribution in ball shear and coldball pull tests at various loading speeds Figure 7. Typical shear force-displacement curve ofductile and brittle failure modes Figure 8. Typical pull force-displacement curve of ductileand brittle failure modes Figure 4 shows a series of fracture interfaces (both thesolder ball fracture surface on the left and the correspondingBGA pad fracture surface on the right) for the high-speedsolder ball shear testing. Representative images are shown foreach of 5 failure mode categories (ductile, quasi-ductile,quasi-brittle, brittle and pad lift). thin trail or “tongue” of solder. This interaction of thefractured solder ball surface with the solder mask openingwas further observed on several BGA package constructionsusing high-speed video (1,000-20,000 frames/s). SEM/EDXanalysis of the fracture interfaces indicated that solder residueon the package pad was more prevalent for SnPb comparedwith SnAgCu solder. Shear Direction Shear Direction Solder Shear Direction Shear Direction Solder Ball(a) SEM images Pad BalI(a) SEM images Pad Ball Pad Ball Pad (b) Sn element distribution (b) Sn element distribution Pad (c) Ni element distribution .. mw Pad Ball Pad (d) Pb element distribution Figure 10. SnPb EDX mapping analysis after high-speedball shear (3000 mm/s, Brittle) (e) Cu element Distribution For brittle fracture samples, the flattened solder surface isobscured in the basal view because the lowermost surface ofthe solder joint has separated intact, leaving a circular facethat matches the solder mask opening. Cross-sectional viewsof these brittle fracture samples, however, still show asomewhat flattened side at the tool/ball contact region. Figure 9. SAC405 EDX mapping analysis after high-speedball shear (1000 mm/s, Quasi-brittle) Observing the basal surface of the sheared solder ball, theflattened tool/ball contact face on the solder ball side is oftenobscured. Particularly for mixed ductile/brittle fractures, thetrailing lower surface of the solder ball is dragged across thesolder resist opening, smearing the basal surface, leaving a Figure 5 provides a similar series of solder ball fractureinterfaces, but this time for the high-speed pull test samples.Although the pull test solder balls are additionally deformedalong the “knit"line between the two halves of the clampingjaws, little biasing or directionality relative to this line isobserved in the fracture surfaces. Unlike with solder shear testsamples, the fracture surface of a pull test sample is never in contact with any package surface following the fracture event.From analysis of complementary fracture surfaces, high-speedpull testing revealed the solder joint brittle fracture surfacesmore clearly than the ball shear test, especially for SnPbsolders, due to the absence of secondary solder ballinteractions with the solder mask and the already fracturedsurface. A brief graphical summary of the solder ball shear/pull testresults is shown in Figure 6. For both shear and pull testing,the same general trends can be observed: the percentage ofbrittle fracture mode failures increases with increased testspeed, and the SAC405 solder alloy shows aa markedlyincreased rate of brittle fracture, initiating at lower testspeeds, relative to eutectic SnPb solder. (a) SEM images (b) Close-up view at location indicated by rectangle in (a) (c) EDX analysis of the image area in (b) Element Weight% Atomic% Ni K 19.70 32.49 CuK 2.84 4.33 SnL 77.46 63.18 Totals 100.00 Pad (d) Element percentage of the image area in (b) Figure 11. Brittle fracture surface and EDX analysis afterhigh-speed ball shear (SAC405,3000 mm/s) Figure 7 illustrates how the brittle solder ball fractureoften occurs prior to the shear tool traveling the entiredistance of the solder ball or pad diameter, in contrast to aductile failure. Although the peak force values of the brittleand ductile solder failures shown in Figure 7 differ byapproximately20%,ttheintegrated force-distancearea(fracture energy) is many times greater for the ductile failure.Besides being a more sensitive quantitative measure offracture strength, fracture energy also correlates much better to the failure mode type (see also Fig. 10 of companion paper[9]). Shear Direction Shear Direction i: HKUST X128 188m8887 cAMPad (b) Close-up view at location indicated by rectangle in (a) (c) EDX analysis as shown at point 1 in (b) (d) EDX analysis as shown at point 2 in (b) (e) EDX analysis as shown at point 3 in (b) (f) EDX analysis as shown at point 4 in (b) Figure 12. Brittle fracture surface and EDX analysis afterhigh-speed ball shear (SnPb,3000 mm/s) A similar comparison of ductile and brittle failures isshown in Figure 8 for solder ball pull test samples. The earliersolder joint rupture of a brittle fracture, relative to a ductilefailure, isis once again apparent. Again, fracture energycorrelates better than peak force with the failure modes (seealso Fig. 11 of companion paper [9]). Solder Ball(a) SEM images Pad (b) Sn element distribution (c) Ni element distribution Ball(d) Ag element distribution Pad (e) Cu element Distribution Figure 13. SAC405 EDX mapping analysis after high-speed ball pull (400 mm/s, Brittle) In order to assess the composition of the solder ball shearbrittle fracture surfaces, a series of detailed SEM and energydispersive X-ray (EDX) images were captured for both thesolder ball and package substrate fracture interfaces and areshown in Figures 9-12. The failure interface for all samples occurred between the Ni layer and intermetallic compound(IMC). (a) SEM images (b) Sn element distribution (c) Ni element distribution (d) Pb element distribution Figure 14. SnPb EDX mapping analysis after high-speedball pull (400 mm/s,Quasi-brittle) Compared to the brittle fracture surfaces of SAC405solder joints, solder residues were found by EDX analysis asshown in Figures 12 (b)and (f) on the pad of SnPb specimensafter high-speed ball shear testing. SEM and EDX images for the solder ball pull brittlefracture surfaces are shown in Figures 13-16. The elementalmapping and SEM imaging of the fracture surfaces areessentially identical between the pull and shear test samples.The brittle failures occurred between the Ni layer and IMC,both on the SAC405 and SnPb specimens. From thecomparison of Figures 12 (b) and 16 (b), it can be found thatmore solder residues are left on the pad after ball shear teststhan after ball pull tests. In addition, more Ni element wasfound on the pad after ball pull tests compared with ball sheartests, regardless ofsolder composition (see Figures 11(d) and15(d)-SAC405, 12(e) and 16(e)-SnPb, respectively).. Thehigh-speed pull test revealed the brittle fracture interface of the solder joints more clearly than in ball shear tests,especially for SnPb solders. (a) SEM images (b) Close-up view at location indicated by rectangle in (a) (c) EDX analysis of the image area in (b) Element Weight% Atomic% Ni K 31.26 46.80 CuK 3.54 4.90 SnL 65.20 48.30 Totals 100.00 Pad (d) Element percentage of the image area in (b) Figure 15. Brittle fracture surface and EDX analysis afterhigh-speed ball pull (SAC405,400 mm/s) The companion paper [9] to this study provides a detaileddescription of a board level drop test (BLDT) that includesboard test assemblies using the same package lots as thoseused for shear and pull testing in this paper. A limitedsummary of the drop test results are shown in Figures 17-20.Figure 17 provides a comparison of drops-to-failure for theBGA packages using either SAC405 and eutectic SnPb solderballs; all observed drop failures were brittle fracture at thesolder/package interface. Similar to the shear and pullfindings, the SAC405 solder alloy demonstrated a greatersusceptibility to brittle fracture than SnPb solder [10].Figures 18-20 describe the SEM results for typical fractureinterfaces of drop test and ball shear/pull testing. It is veryclear that the fracture interfaces between high-speed shear,high-speed pull and BLDT are remarkably similar. Hence, thebrittle fracture mode in high-speed ball shear/pull test can beused as an indicator of BLDT. (b) Close-up view at location indicated by rectangle in (a) (c) EDX analysis as shown at point 1 in (b) (d) EDX analysis as shown at point 2 in (b) Element Weight% Atomic% Ni K 23.31 38.06 SnL 76.69 61.94 Totals 100.00 (e) EDX analysis as shown at point 3 in (b) (f) EDX analysis as shown at point 4 in (b) Figure 16. Brittle fracture surface and EDX analysis afterhigh-speed ball pull (SnPb, 400 mm/s) Figure 17. Drop test failure rates of SAC405 and SnPbsolder (c) Close-up view at location (d) Close-up view at location indicated by rectangle in(a) indicated by rectangle in (b) Figure 18. Brittle fracture surface after drop test (SAC405) Conclusions This study investigated the brittle failure mechanism ofhigh-speed ball shear/pull testing. Two kinds of solder alloys(SAC405 and SnPb) with ENIG package substrate pad finishwere studied. The brittle fracture surfaces were inspected bySEM/EDX after ball shear/pull testing. The major findingsfollow: 1) High-speed solder ball shear and pull tests produced highbrittlefracturefailureerates.regardlessS soldercomposition. 2) Solder ball pull testing generated a higher percentage ofbrittle failures than solder ball shear testing, at all testspeeds, and for both SAC405 and eutectic SnPb samples. 3) In drop testing,SAC405 showed a greater susceptibilityto brittle fracture than Sn-Pb solder alloy, coincident withthe results of the high-speed solder ball shear and pulltests. (a) Brittle fracture surface ofsheared ball (b) Brittle fracture surface ofthe relative pad of (a) hear DirectionShear Direction (c) Close-up view at location (d) Close-up view at locationindicated by rectangle in (a) indicated by rectangle in (b) Figure 19. Brittle fracture surface after high-speed ball shear test (SAC405 after two times reflow, 500 mm/s) (c) Close-up view at locationindicated by rectangle in (a) (d) Close-up view at locationindicated by rectangle in (b) Figure 20. Brittle fracture surface after high-speed ball pulltest (SAC405 after two times reflow, 50 mm/s) 4) SEM imagingg aanndd EDX mapping of the ifractureinterfaces indicates that the brittle failures for the drop,shear and pull testing all occurred at the Ni/IMC interfaceand resulted in nearly identical fracture surfaces. 5) High-speed pull tests revealed the brittle interface with agreater sensitivity than in the ball shear test, especiallyfor SnPb solders, due to the absence of secondary solderball interactions with the solder mask and the alreadyfractured surface. 6) SEM/EDX analysis of the fracture surfaces indicated thatsolder residue on the package pad is more prevalent forSnPb solder compared to SnAgCu solder, and for high-speed shear testing compared to pull testing. 1. A. T. Valota, A. Losavio, et al“High Speed Pull TestCharacterization of BGASolder Joints,” Proc.7thInternational Conference on Thermal, Mechanical andMultiphysics Simulation and Experiments inMicro-Electronics and Micro-Systems, 2006. EuroSime 2006.Milano, Italy,April (2006). 2. K. Newman,“BGA Brittle Fracture—Alternative Solderjoint Integrity Test Methods,” Proc. 55th ElectronicComponents & Technology Conference, Orlando, FL,June (2005), pp. 1194-1200. 3. Julian Yan Hon Chia, et al., “The mechanics of the solderball shear test and the effect of shear rate,” MaterialsScience and Engineering A 417 (2006)259-274. 4. E. H. Wong, et al,“Drop Impact: Fundamentals andImpact Characterization of Solder Joints,” Proc. 55"Electr. Comp. Technol. Conf, Lake Buena Vista, FL,2005,pp. 1202-1209. 5.X. Huang, S. W. R. Lee, C. C. Yan and S. Hui,“Characterization and Analysis on the Solder Ball ShearTesting Conditions,” Proc. 51st Electronic Components& Technology Conference, Orlando, FL, June (2001),pp.1065-1071. 6. S. Sane, S. Tandon and B, Chandran,“On Measurementof Effective Silicon Backend Strength using BumpPull/Shear Techniques,”Proc. ASME InterPACK 2005,San Francisco, CA, July (2005). 7. Raiser, G., et al.,“Solder Joint Reliability ImprovementUsing the Cold Ball Pull Metrology,”Proc. ASMEInterPACK 2005, San Francisco, CA, July 17-22,2005. 8. F. B. Song and S. W. R. Lee,“Investigation of IMCThicknessEffectontheeLead-freeesSolderBallAttachment Strength-Comparison between Ball ShearTest and Cold Bump Pull Test Results,” Proc. 56thElectronic Components & Technology Conference, SanDiego, CA,June 2006, pp.1196-1203. 9. F. B. Song,S. W. R. Lee, K. Newman, B. Sykes and S.Clark, “High Speed Solder Ball Shear and Pull Tests vs.Board Level Mechanical Drop Tests: Correlation ofFailure Mode and Loading Speed,” Proc. 57th ElectronicComponents & Technology Conference, Reno, NV, June2007. 10. C. Brizer, et al“Drop Test Reliability Improvement ofLead-free Fine Pitch BGA Using Different Solder BallComposition,” Proc. 55th Electronic Components &Technology Conference, Orlando, FL, June (2005), pp.1194-1200. $CIEEEElectronic Components and Technology Conference Electronic Components and Technology Conference ConclusionsThis study investigated the brittle failure mechanism of high-speed ball shear/pull testing. Two kinds of solder alloys (SAC405 and SnPb) with ENIG package substrate pad finish were studied. The brittle fracture surfaces were inspected by SEM/EDX after ball shear/pull testing. The major findings follow:1) High-speed solder ball shear and pull tests produced high brittle fracture failure rates, regardless of solder composition.2) Solder ball pull testing generated a higher percentage of brittle failures than solder ball shear testing, at all test speeds, and for both SAC405 and eutectic SnPb samples.3) In drop testing, SAC405 showed a greater susceptibility to brittle fracture than Sn-Pb solder alloy, coincident with the results of the high-speed solder ball shear and pull tests.4) SEM imaging and EDX mapping of the fracture interfaces indicates that the brittle failures for the drop, shear and pull testing all occurred at the Ni/IMC interface and resulted in nearly identical fracture surfaces.5) High-speed pull tests revealed the brittle interface with a greater sensitivity than in the ball shear test, especially for SnPb solders, due to the absence of secondary solder ball interactions with the solder mask and the already fractured surface.6) SEM/EDX analysis of the fracture surfaces indicated that solder residue on the package pad is more prevalent for SnPb solder compared to SnAgCu solder, and for highspeed shear testing compared to pull testing.
确定
还剩7页未读,是否继续阅读?

产品配置单

聚擘国际贸易(上海)有限公司为您提供《SnAgCu和SnPb焊料球中脆性破坏机制检测方案(力学量测量仪表(位移、力等))》,该方案主要用于其他中脆性破坏机制检测,参考标准--,《SnAgCu和SnPb焊料球中脆性破坏机制检测方案(力学量测量仪表(位移、力等))》用到的仪器有DAGE4000HS高速推拉力测试机、DAGE4000多功能推拉力测试机
推荐专场

相关方案
更多
该厂商其他方案
更多