


方案详情
文
The separation bubble on a NACA 0012 airfoil with a two-dimensional, constant span,
simulated leading-edge glaze-ice accretion is investigated using Particle Image Velocimetry
(PIV). Chordwise PIV measurements, or those along the separation bubble cross-section,
are obtained at a Reynolds number of 0.9x10⁶, Mach number of 0.20, and between 0 deg
and 5 deg angle-of-attack. Mean reattachment estimated from surface oil-flow visualization
indicates increasing bubble length and unsteadiness (based on reattachment zone width)
with angle-of-attack, consistent with results extracted from PIV measurements. Timeaveraged
streamlines and forward flow intermittency reveal a primary recirculation with
clockwise rotation defined by a shear layer and a smaller, secondary recirculation with
counter-clockwise rotation directly downstream of the point of separation, both consistent
with backward-facing step type flowfields. Mean and RMS velocity component contours
highlight these features and wall-normal profiles are extracted and compared to other
separation bubble data including those over a backward-facing step and blunt flat plate.
方案详情

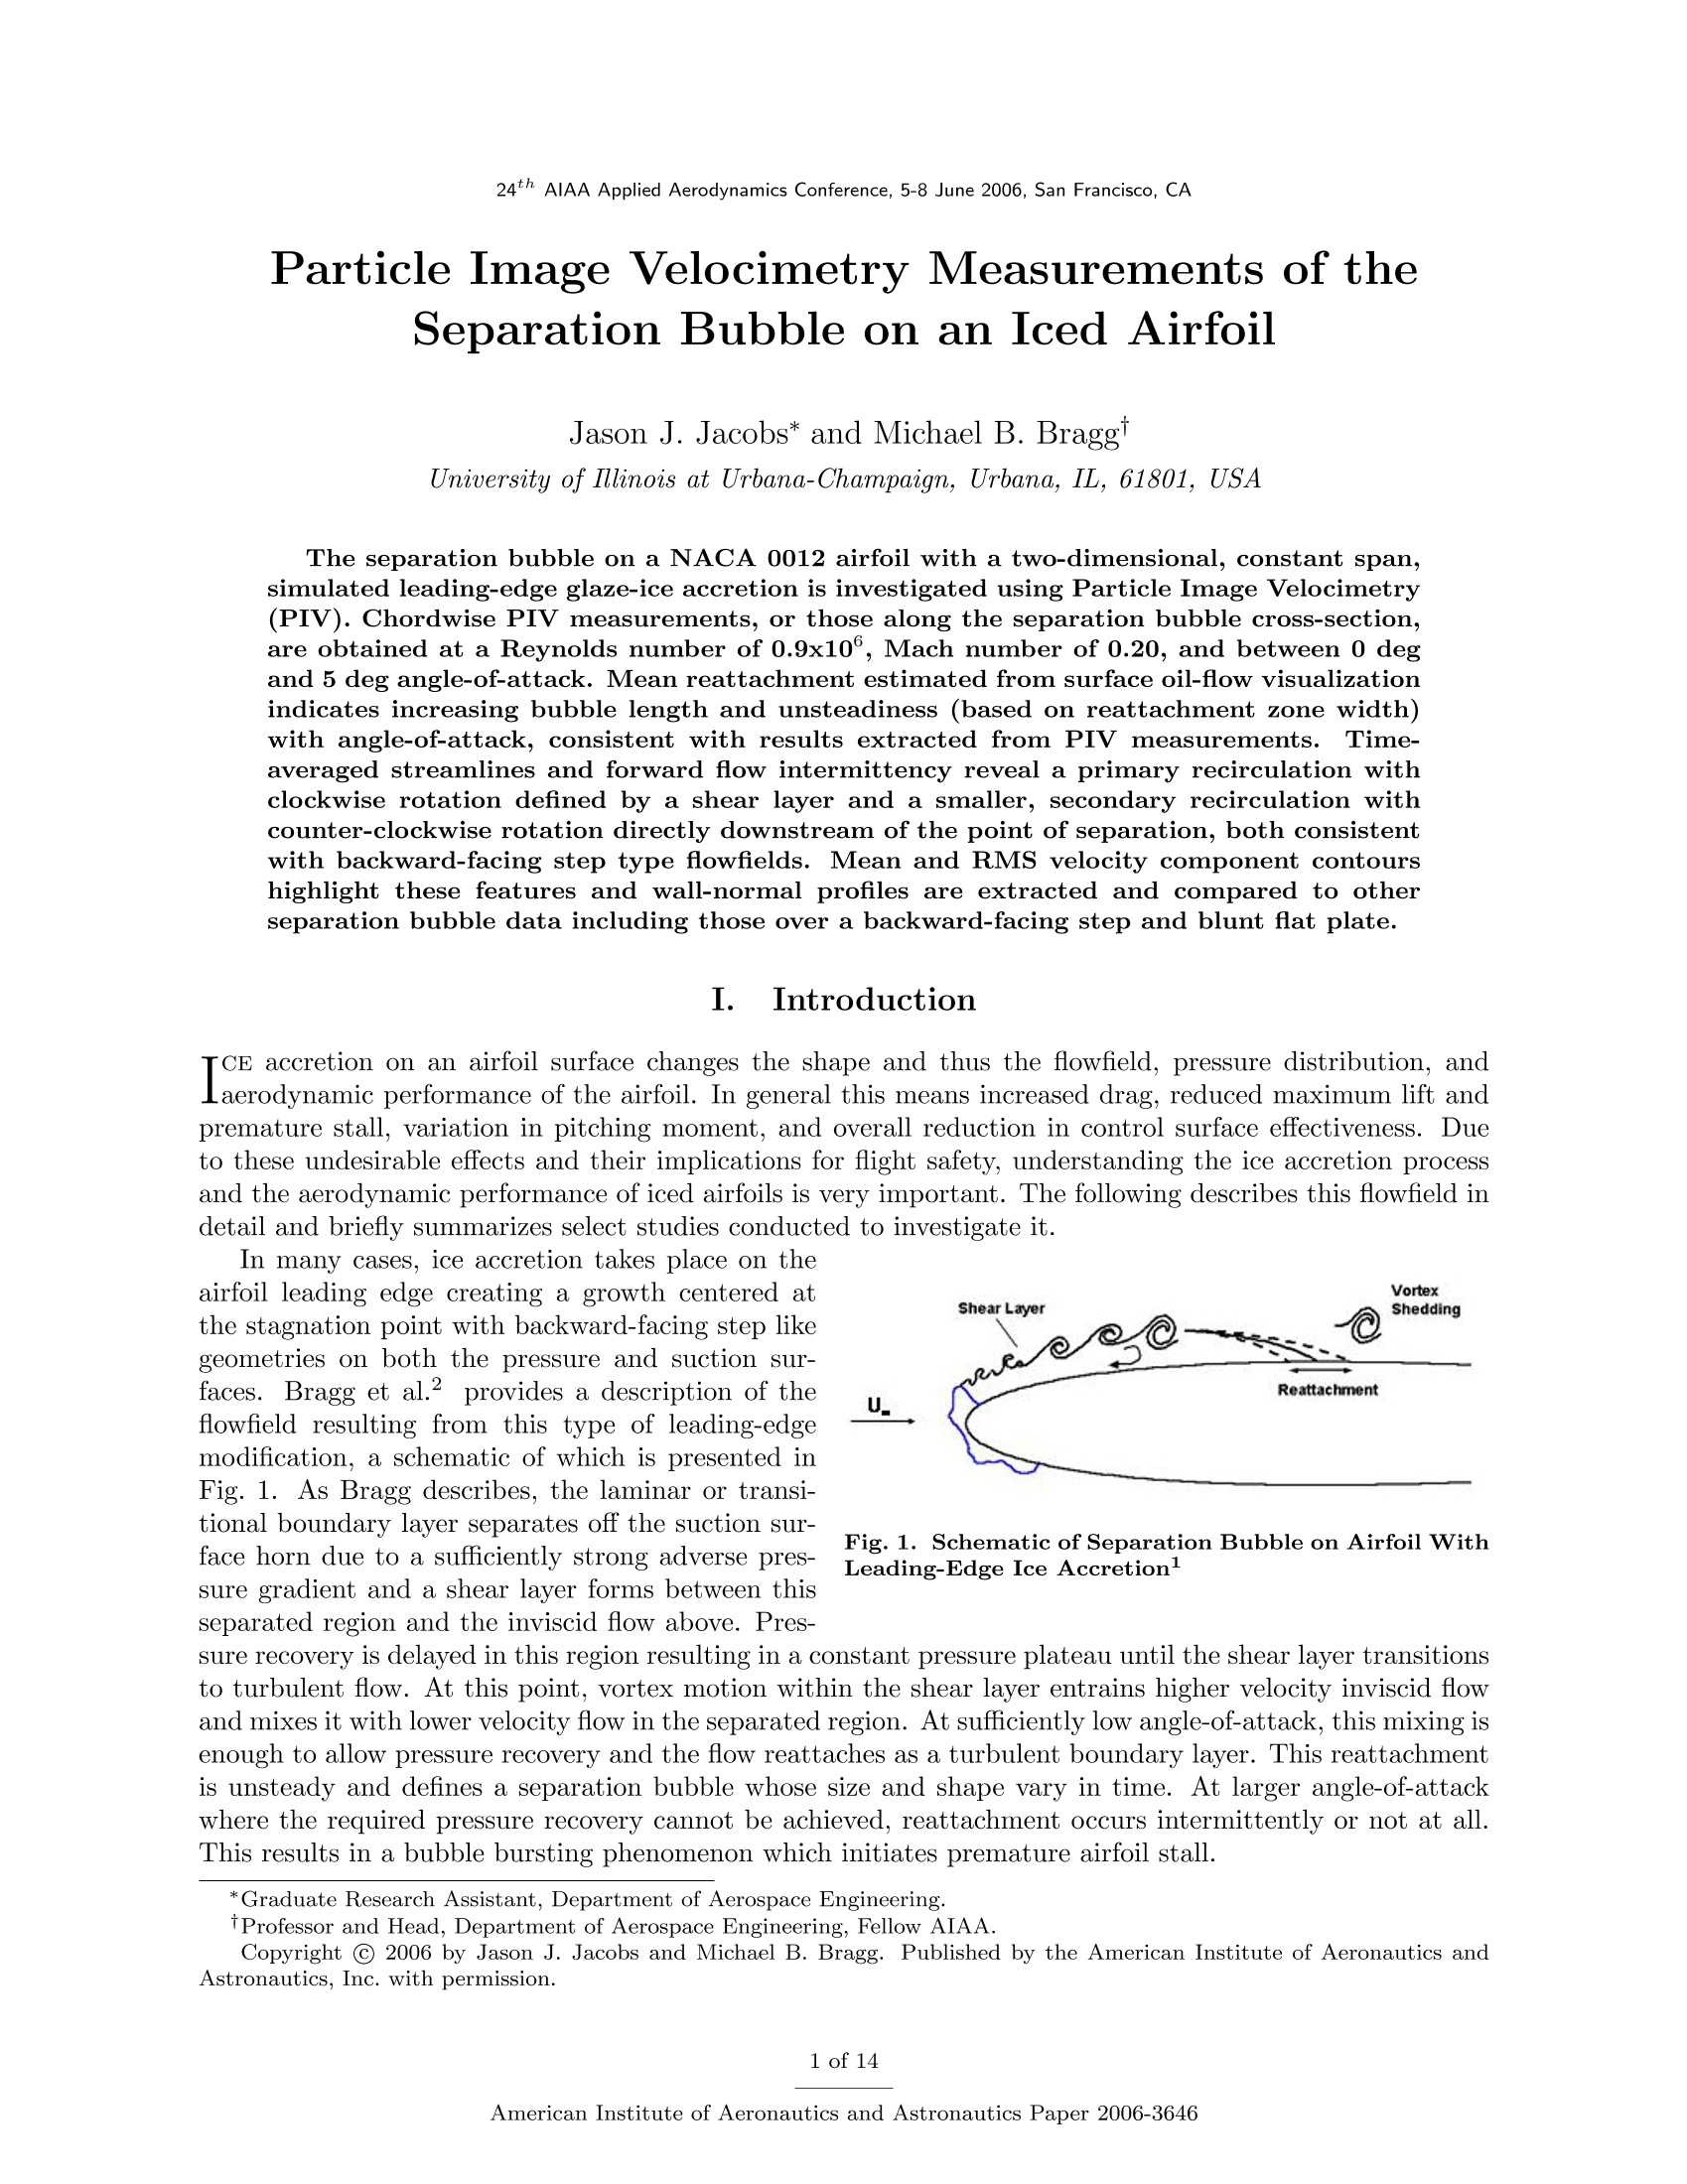
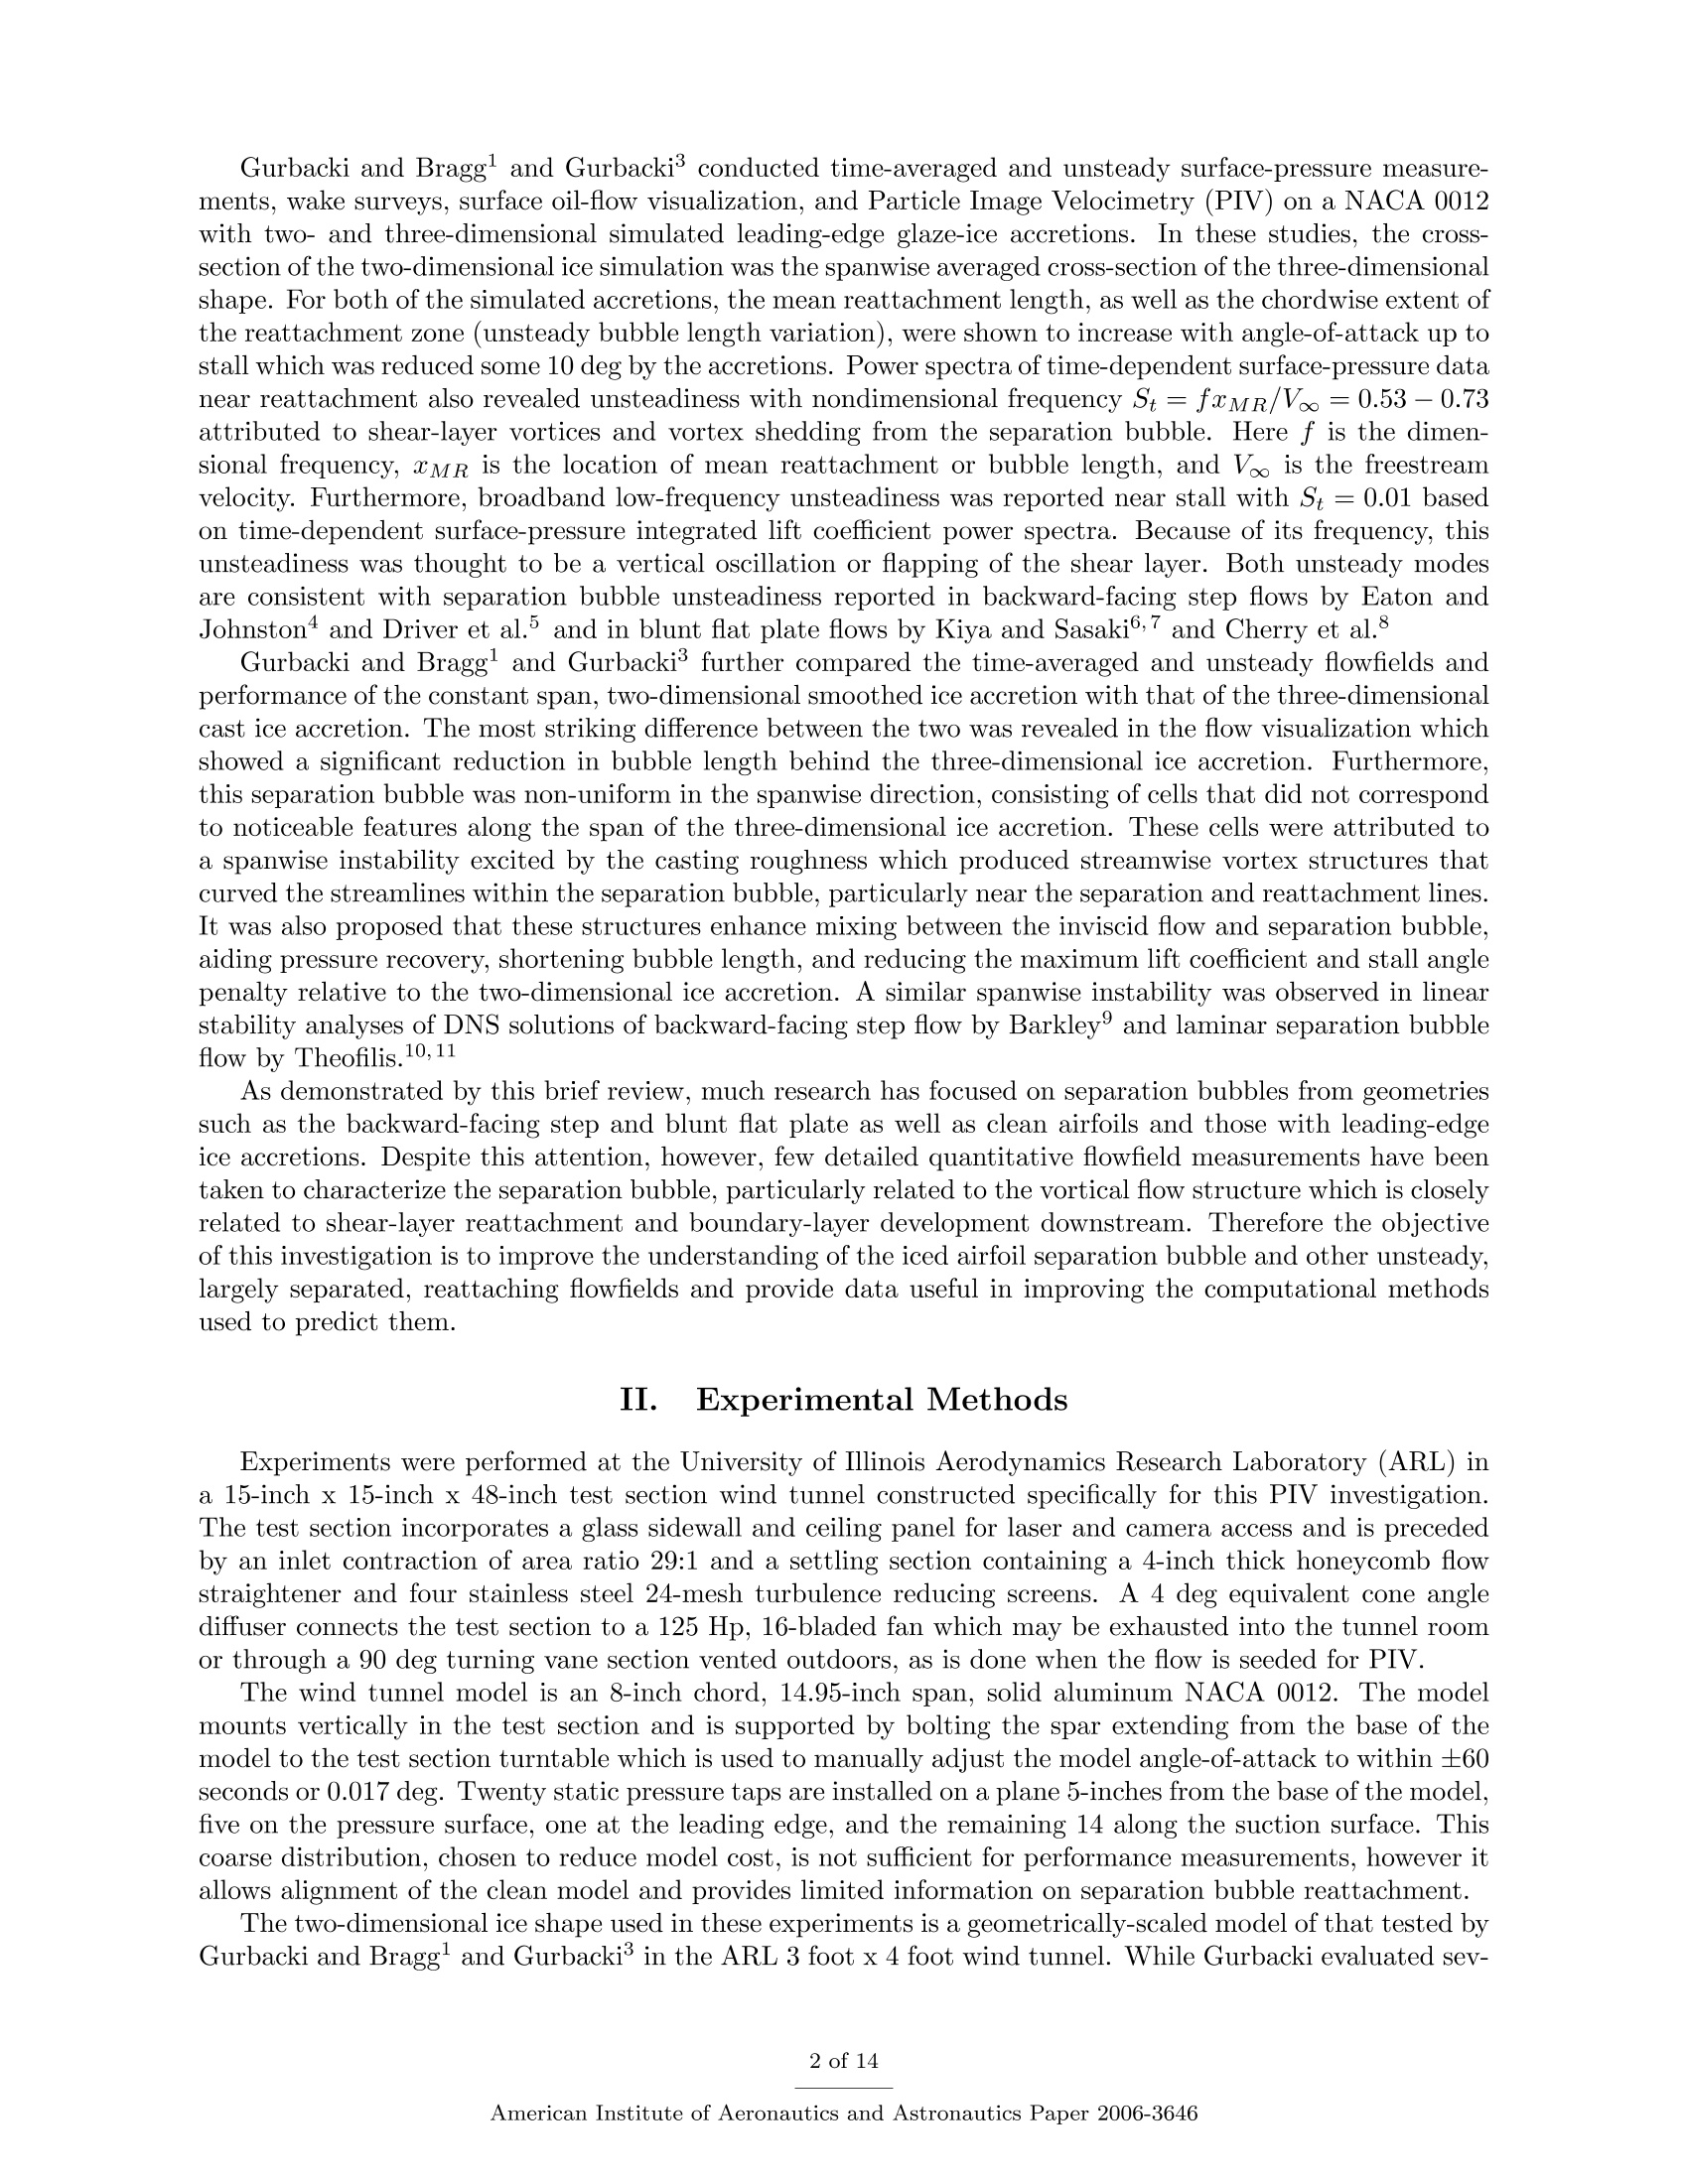
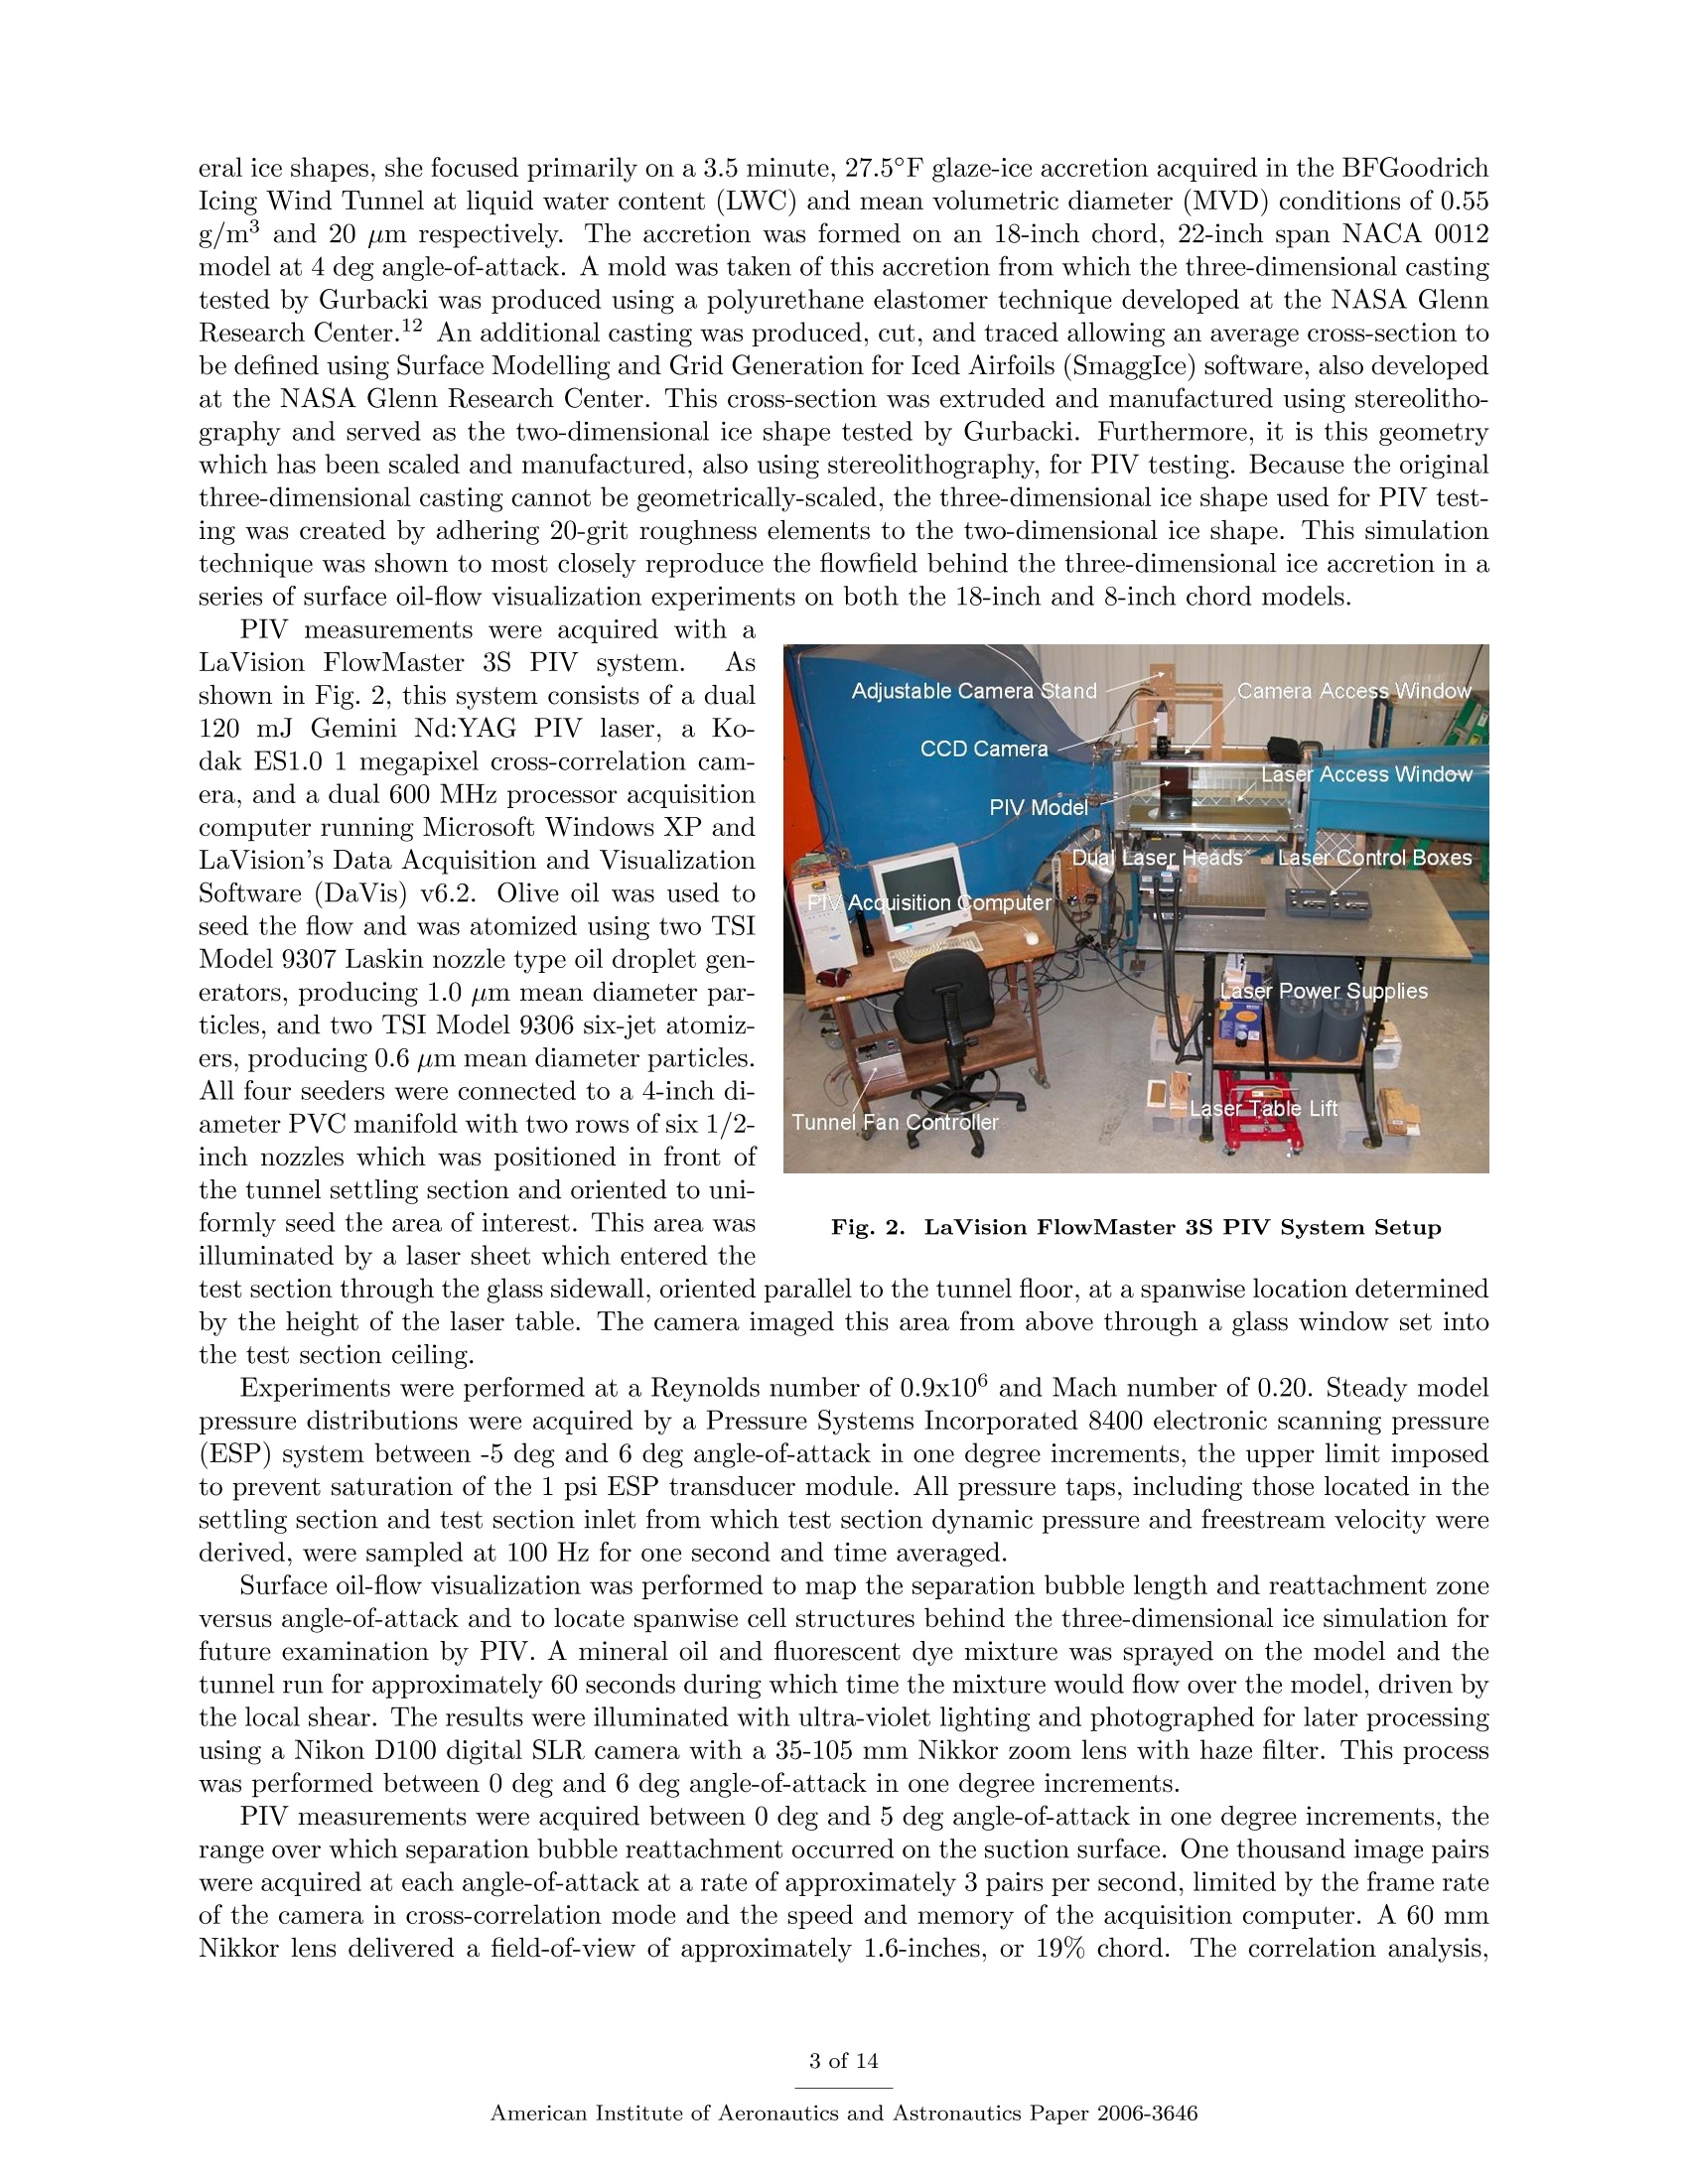
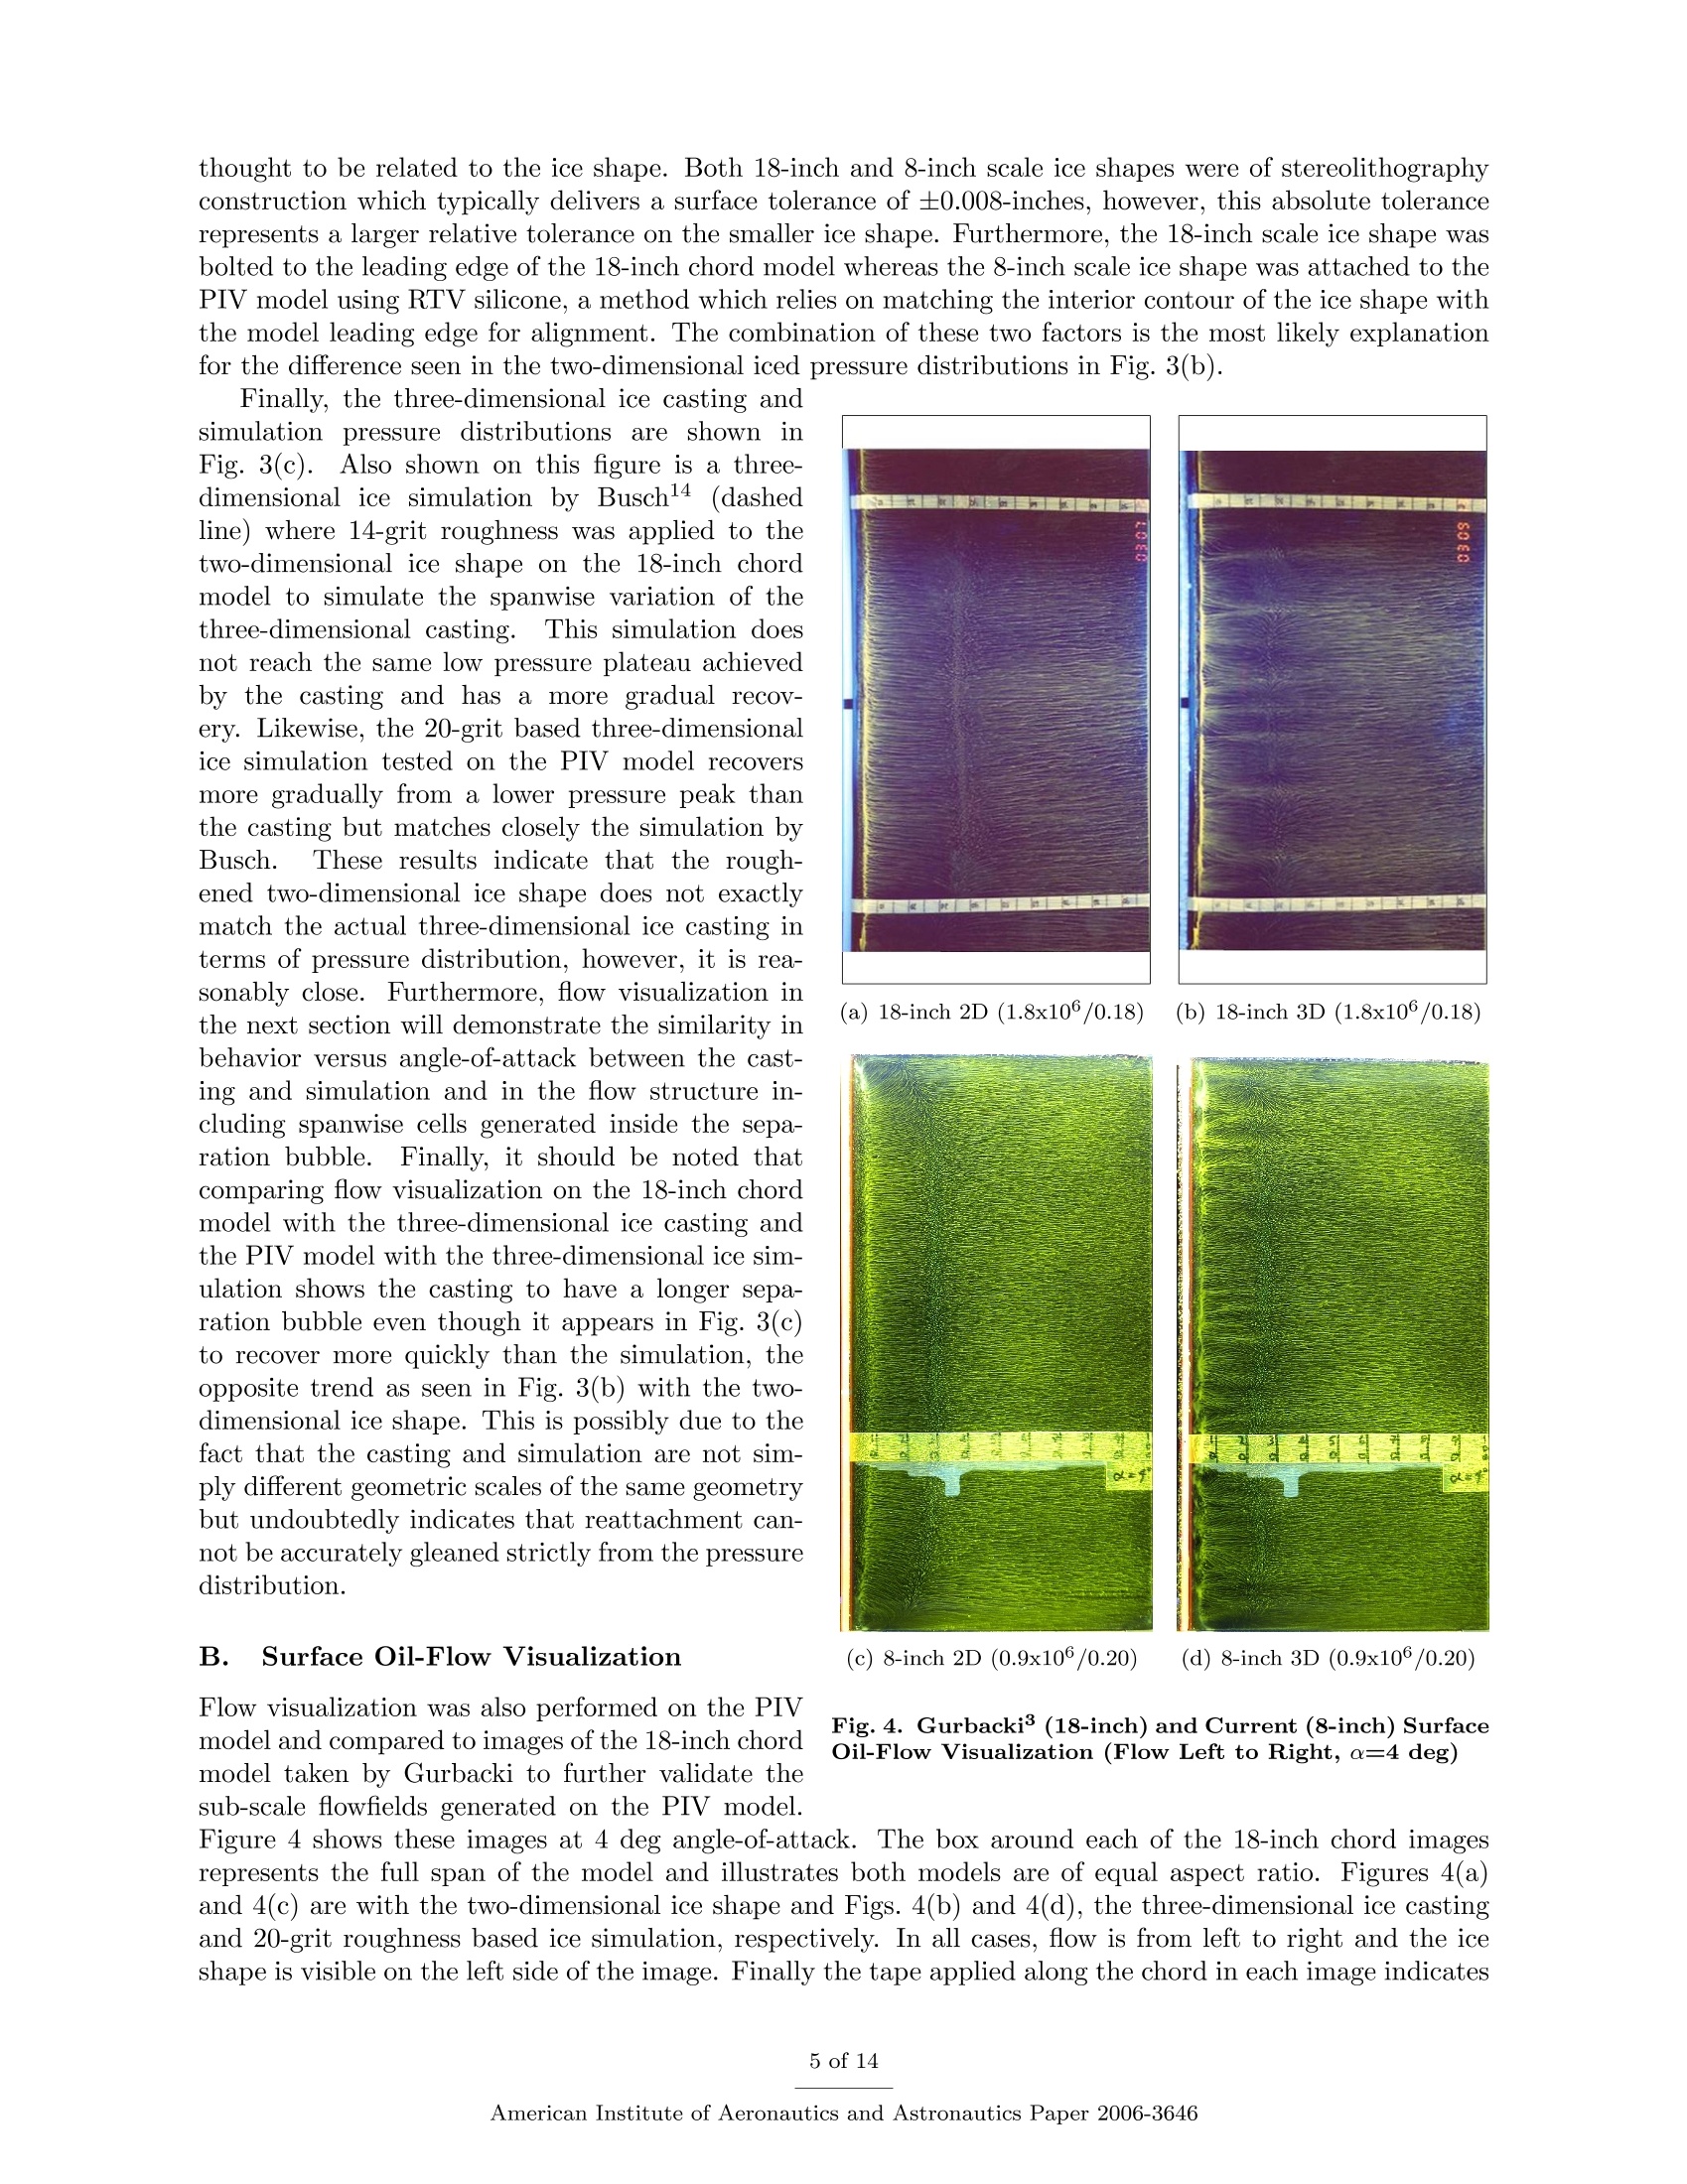
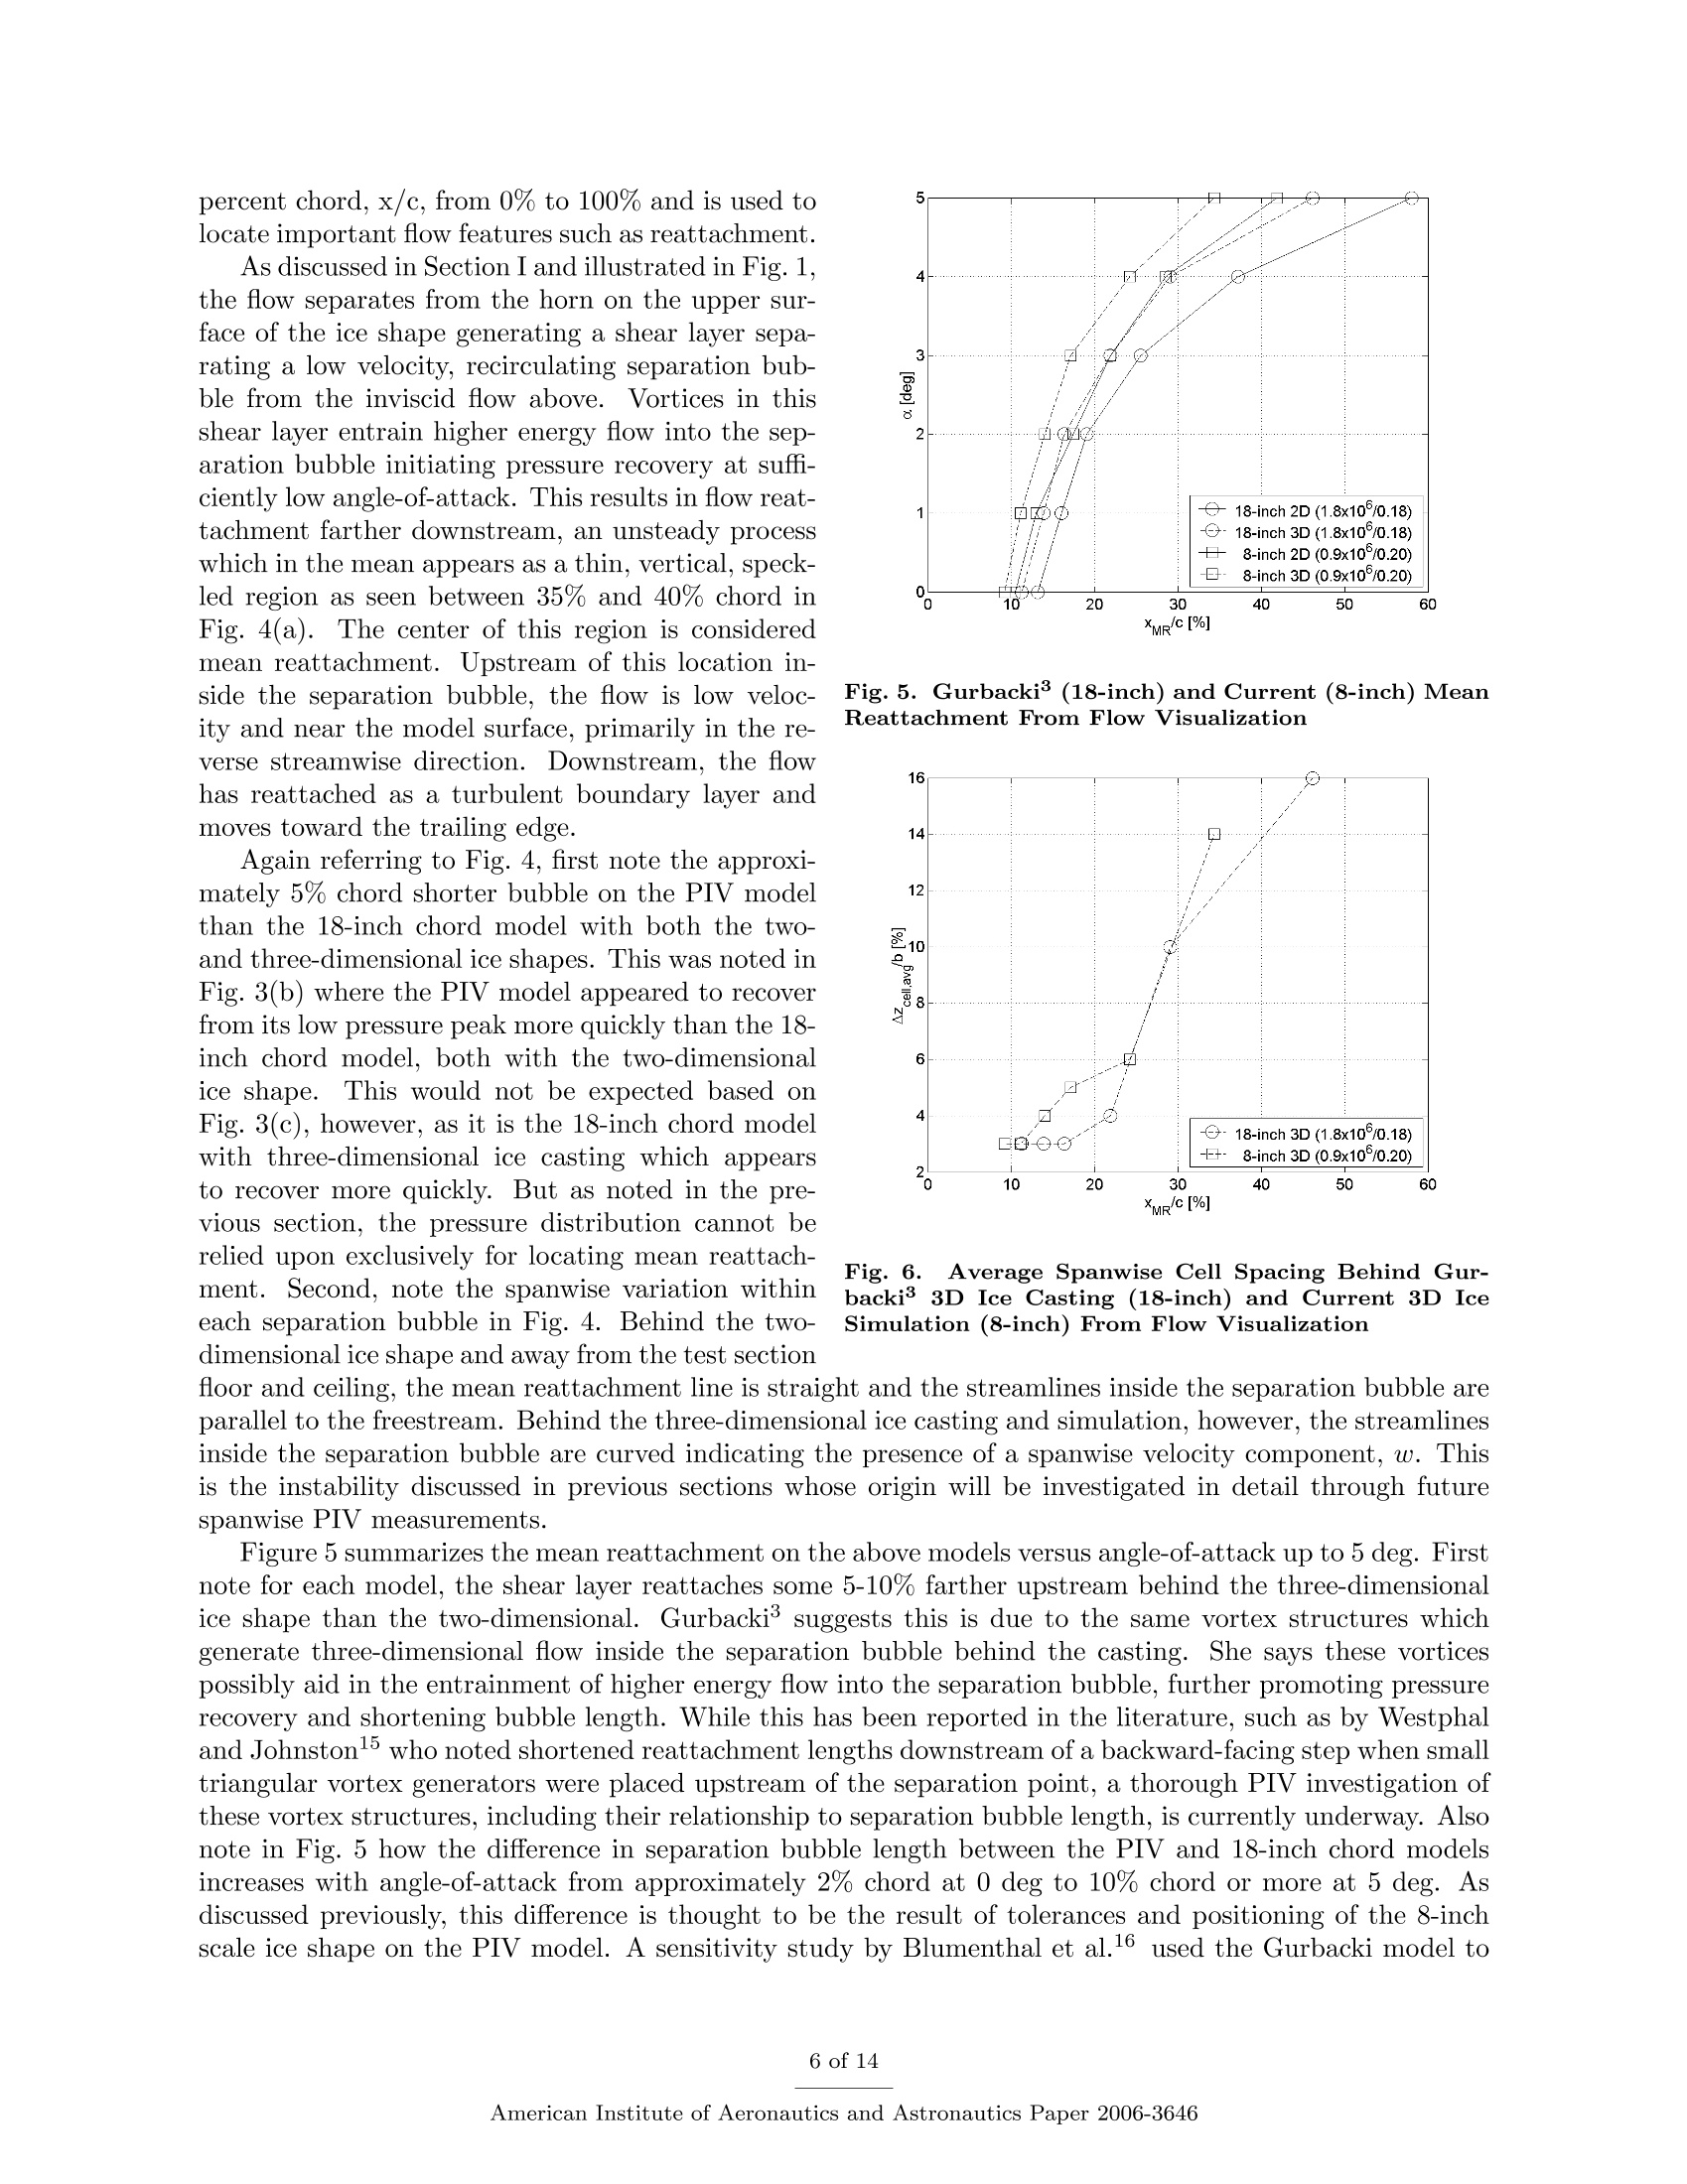
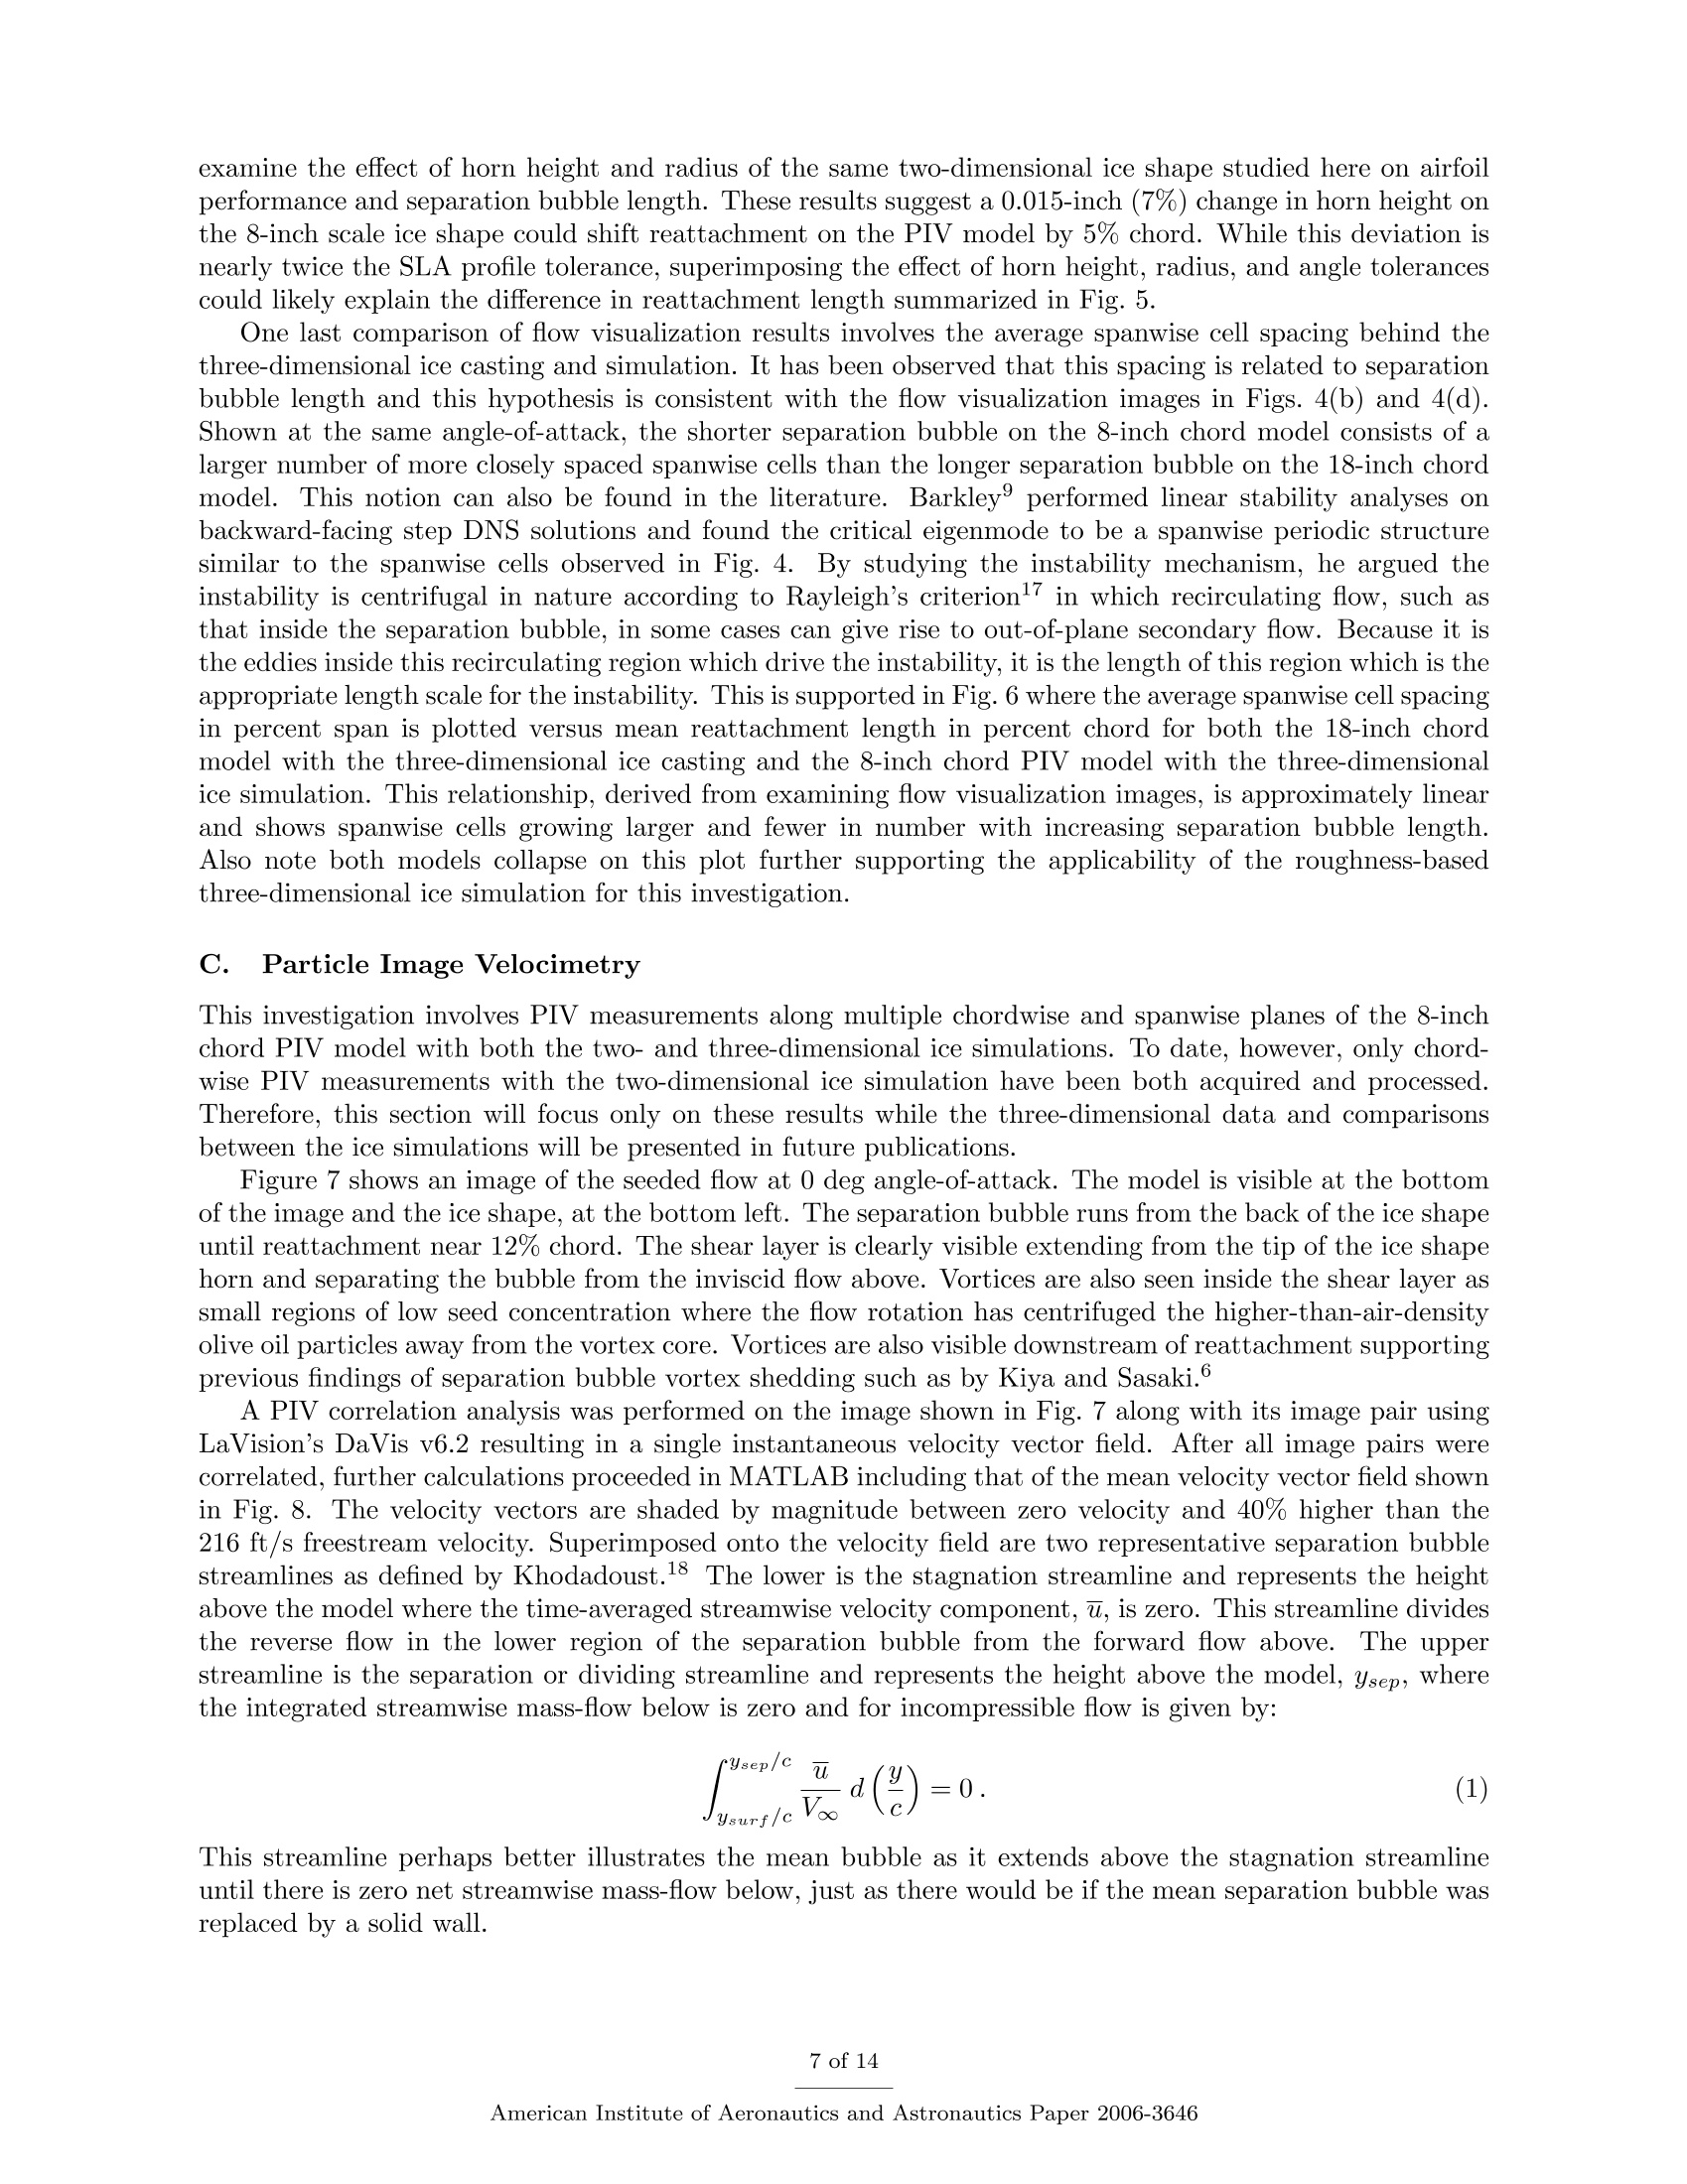
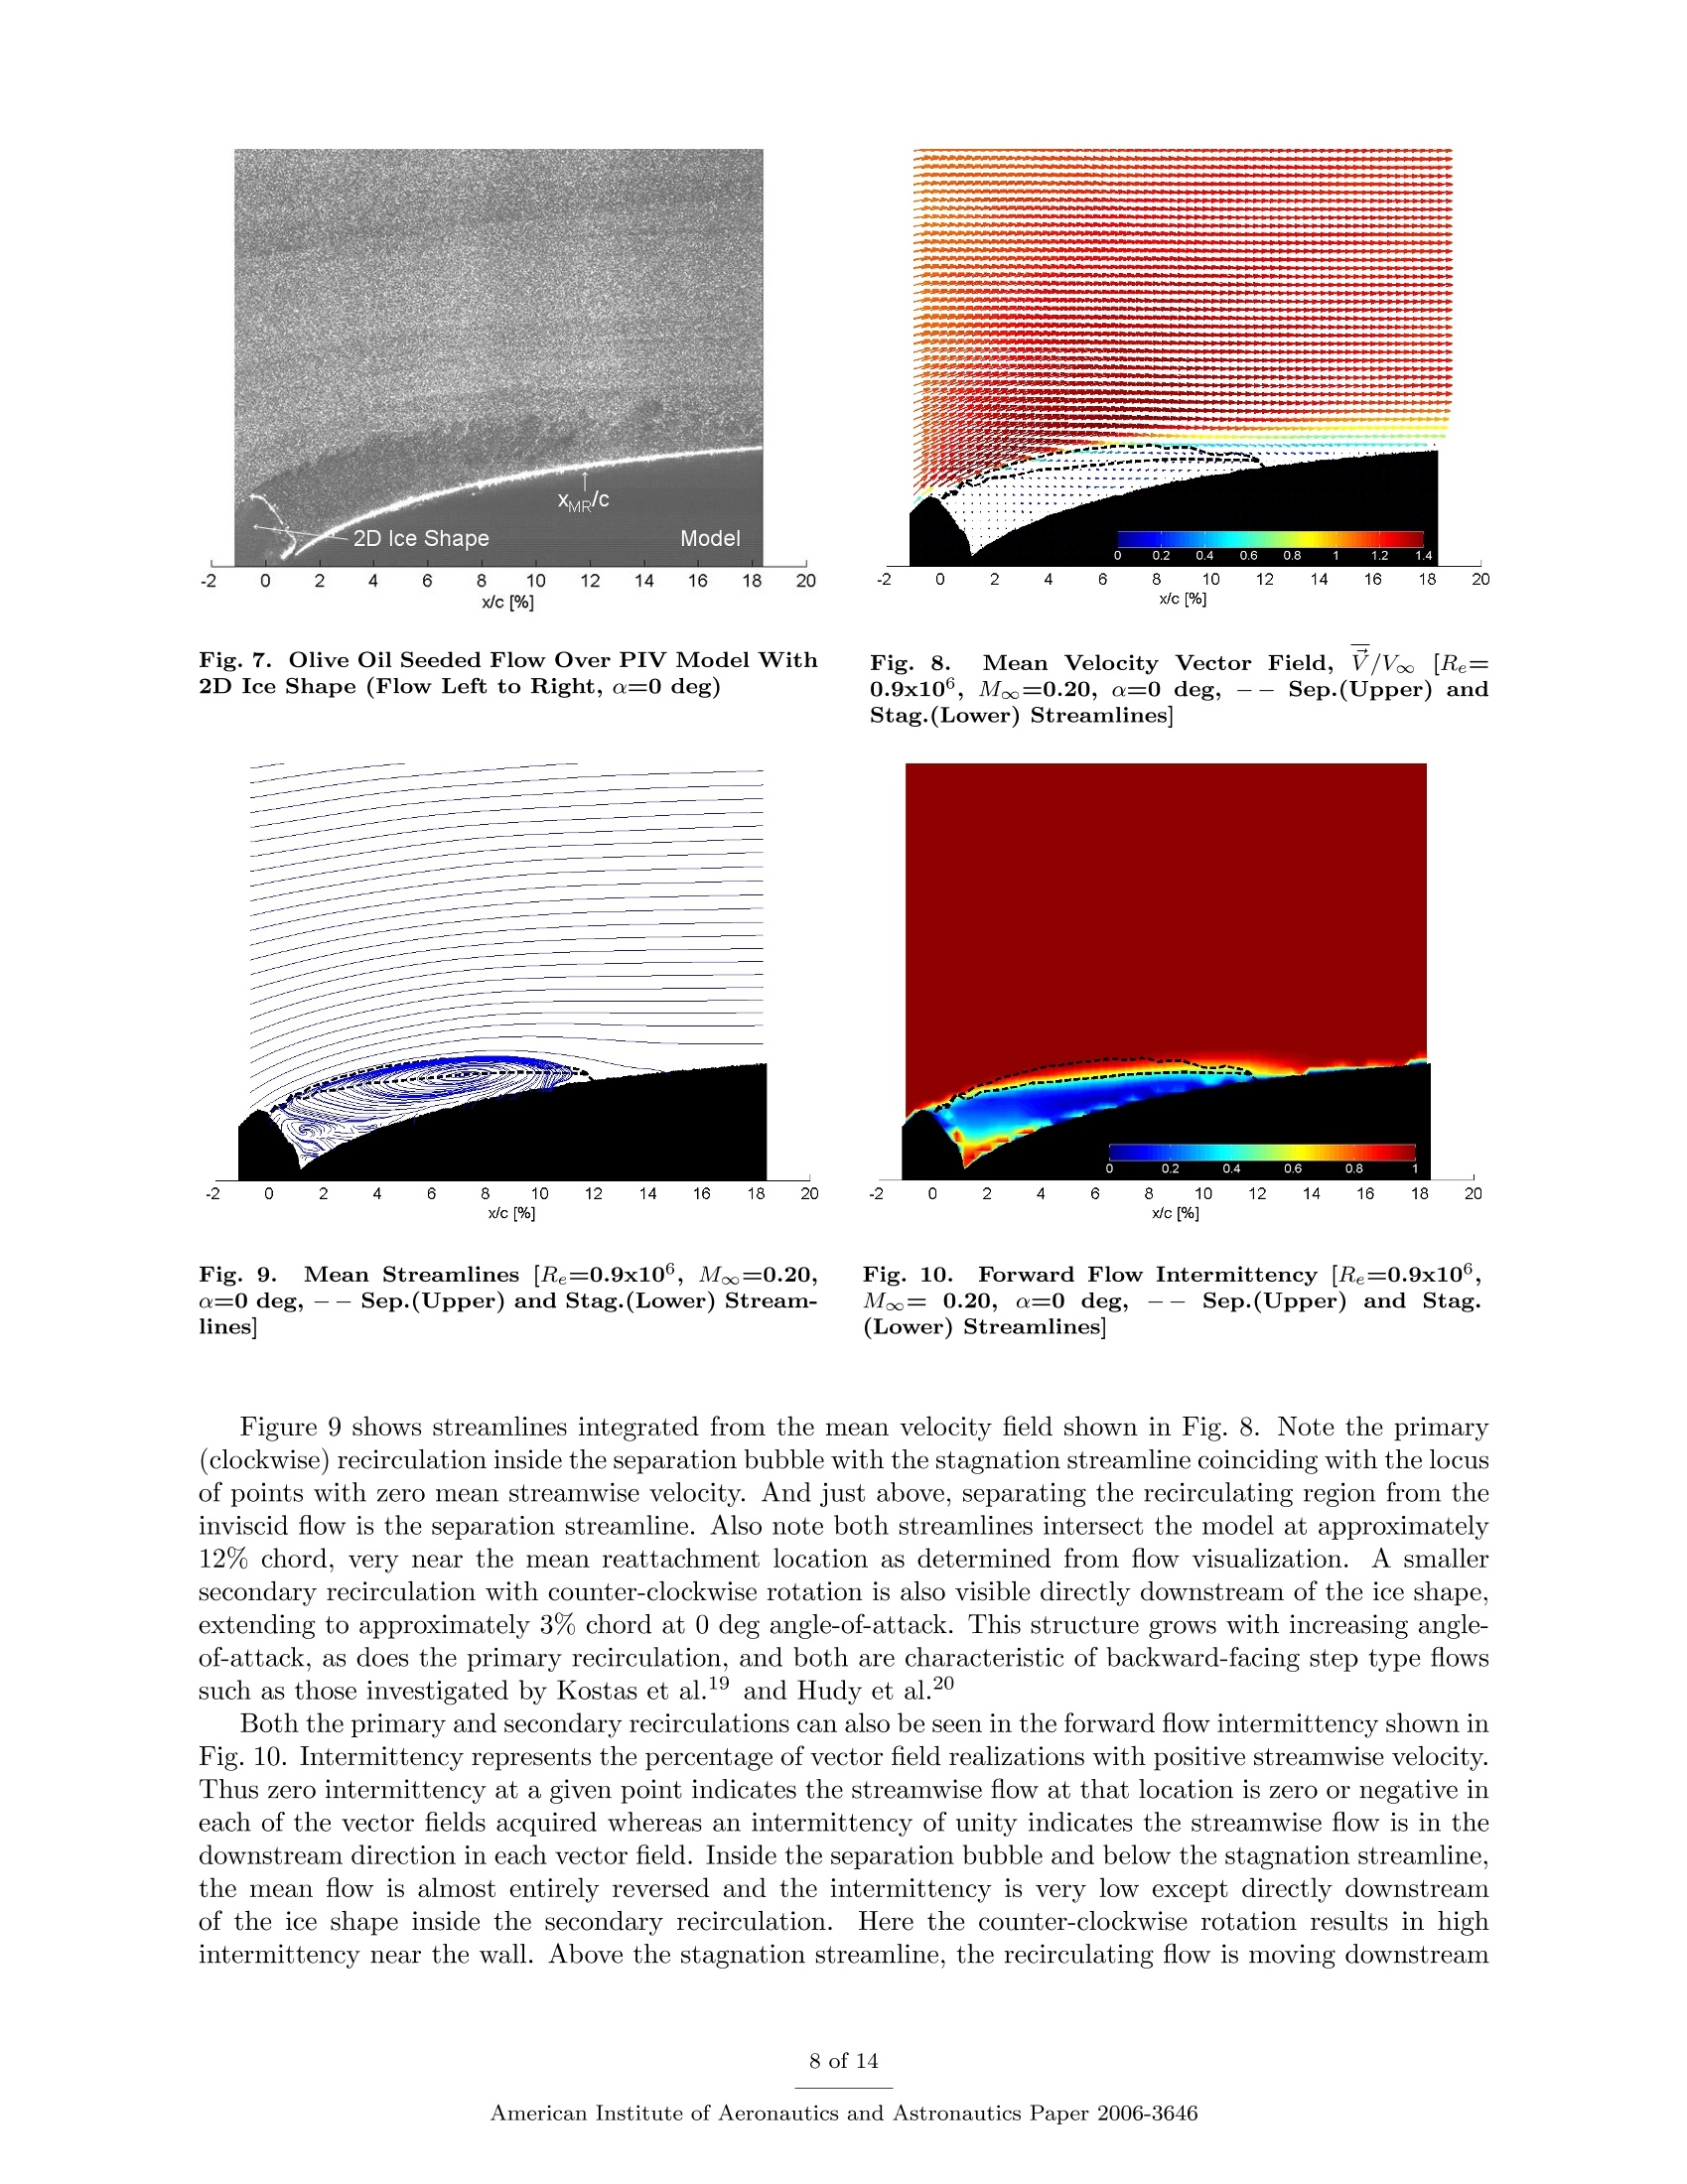
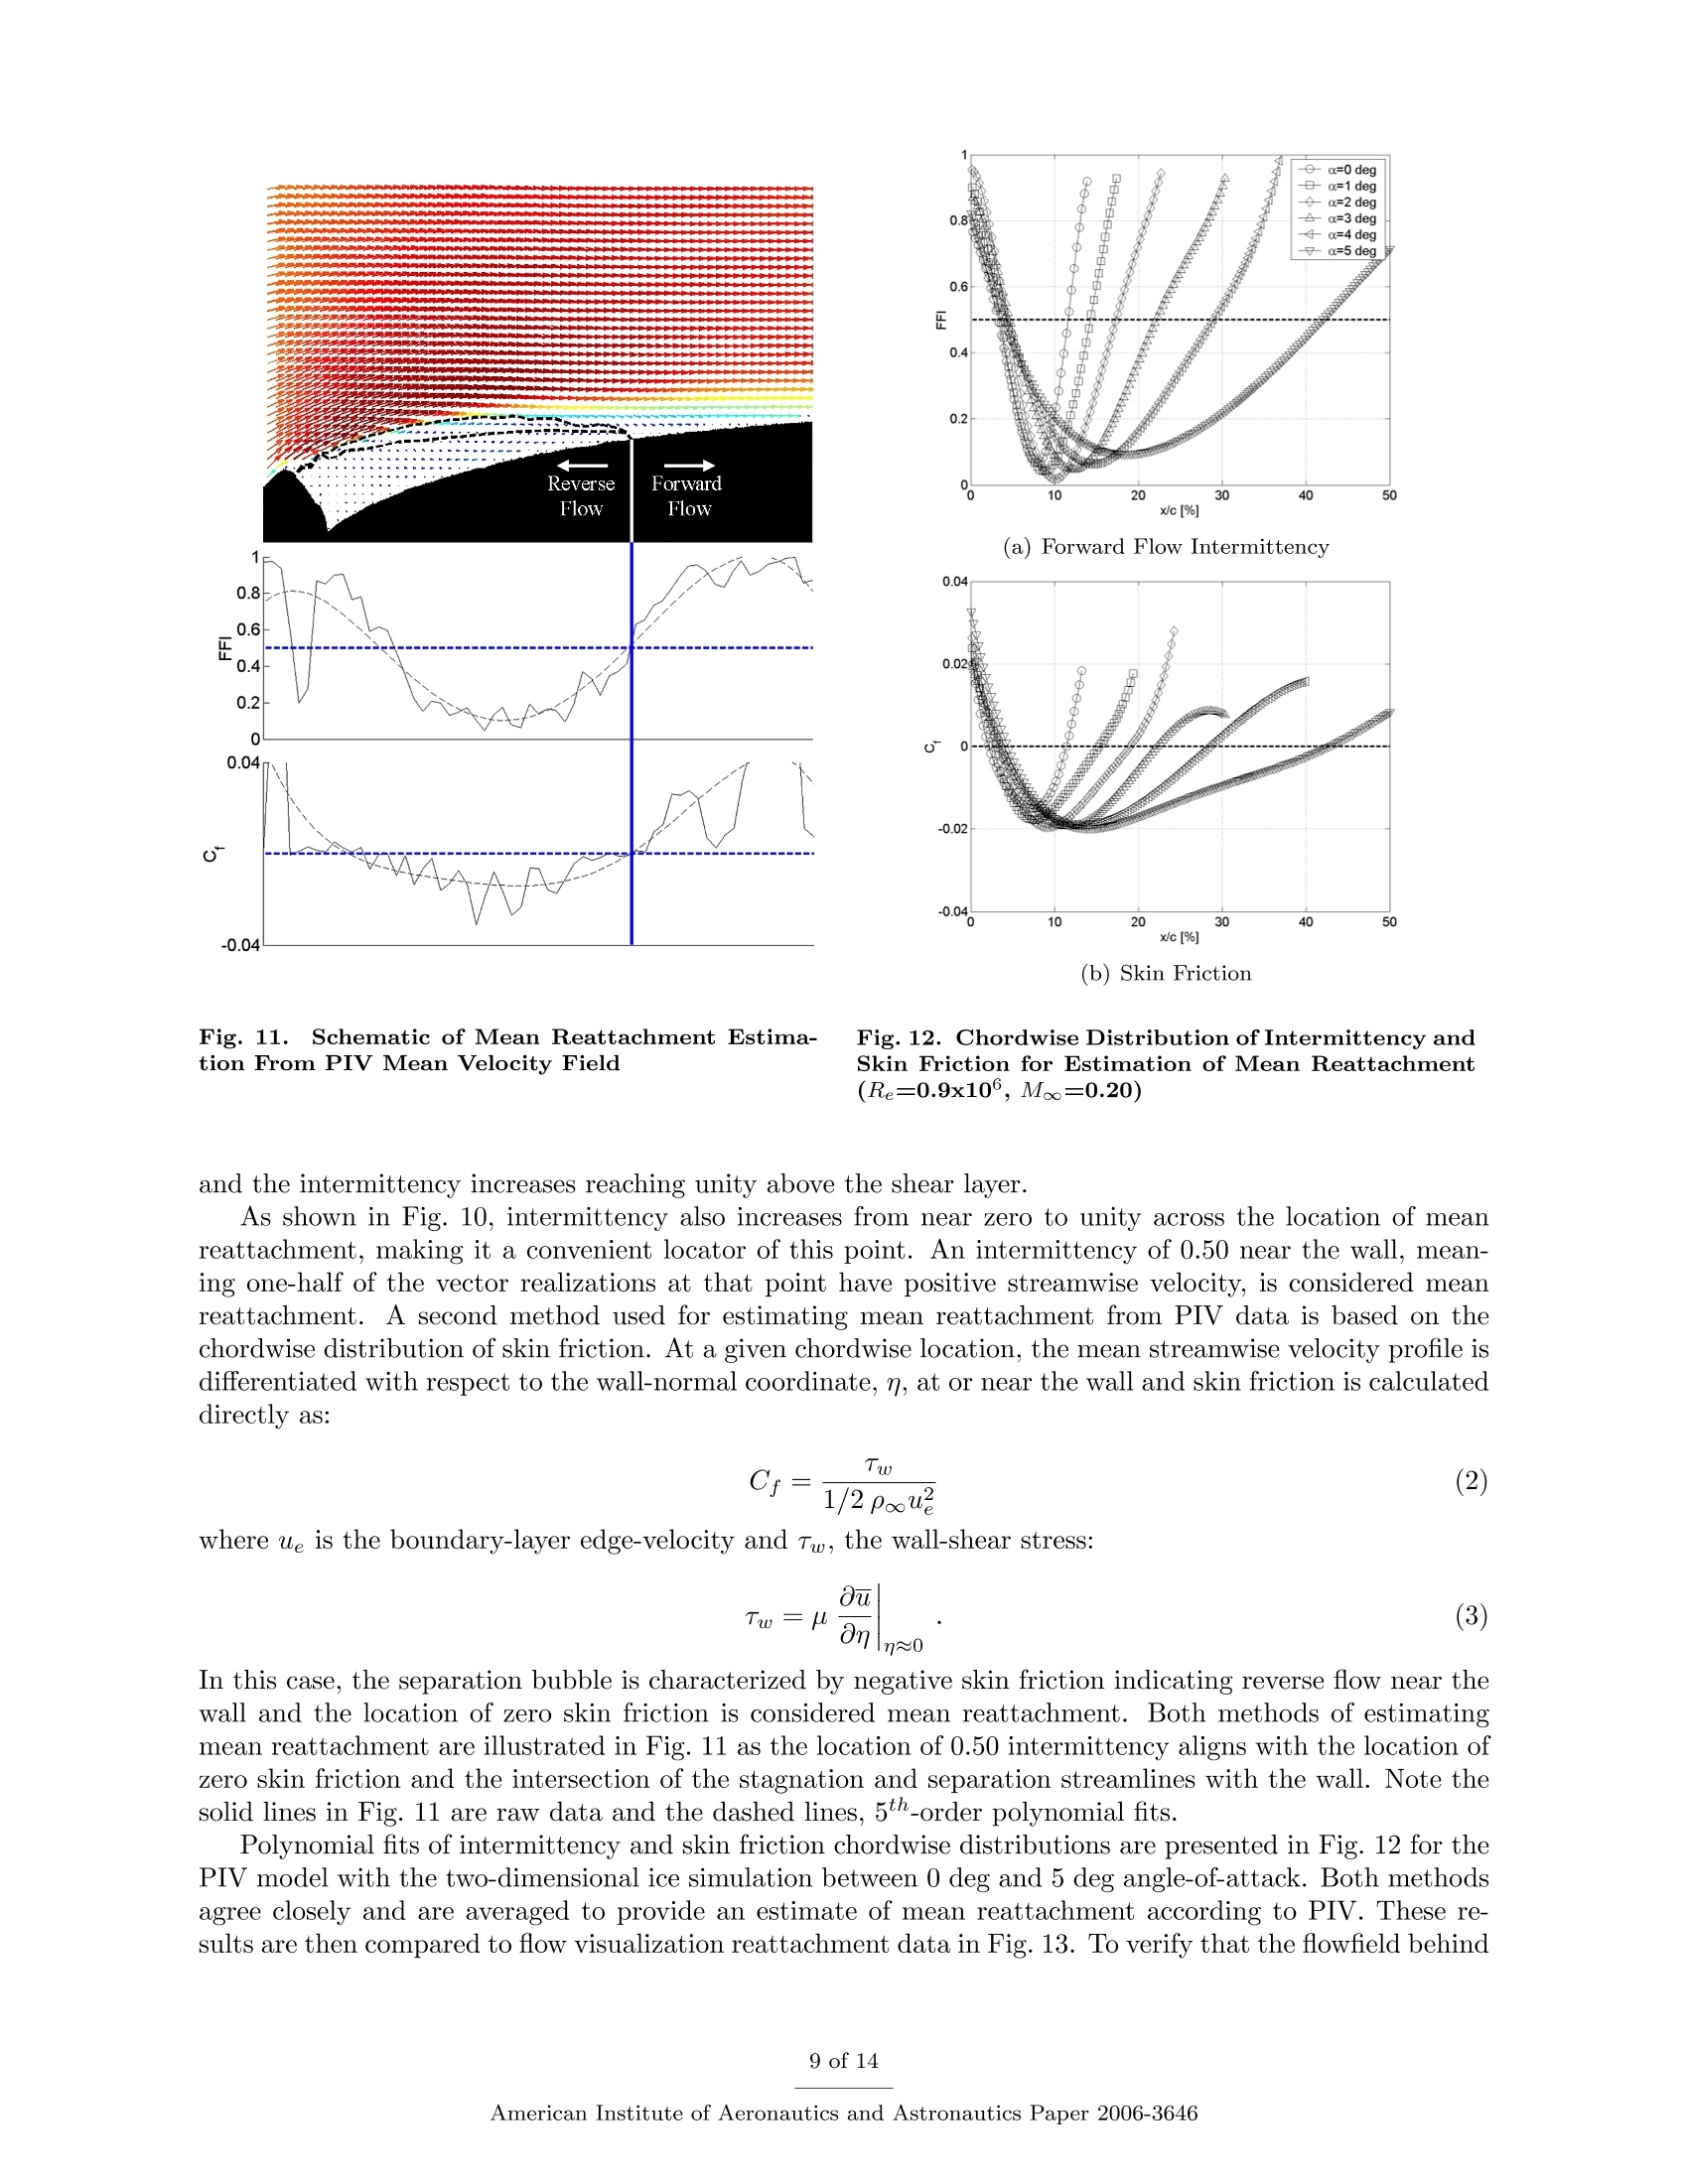
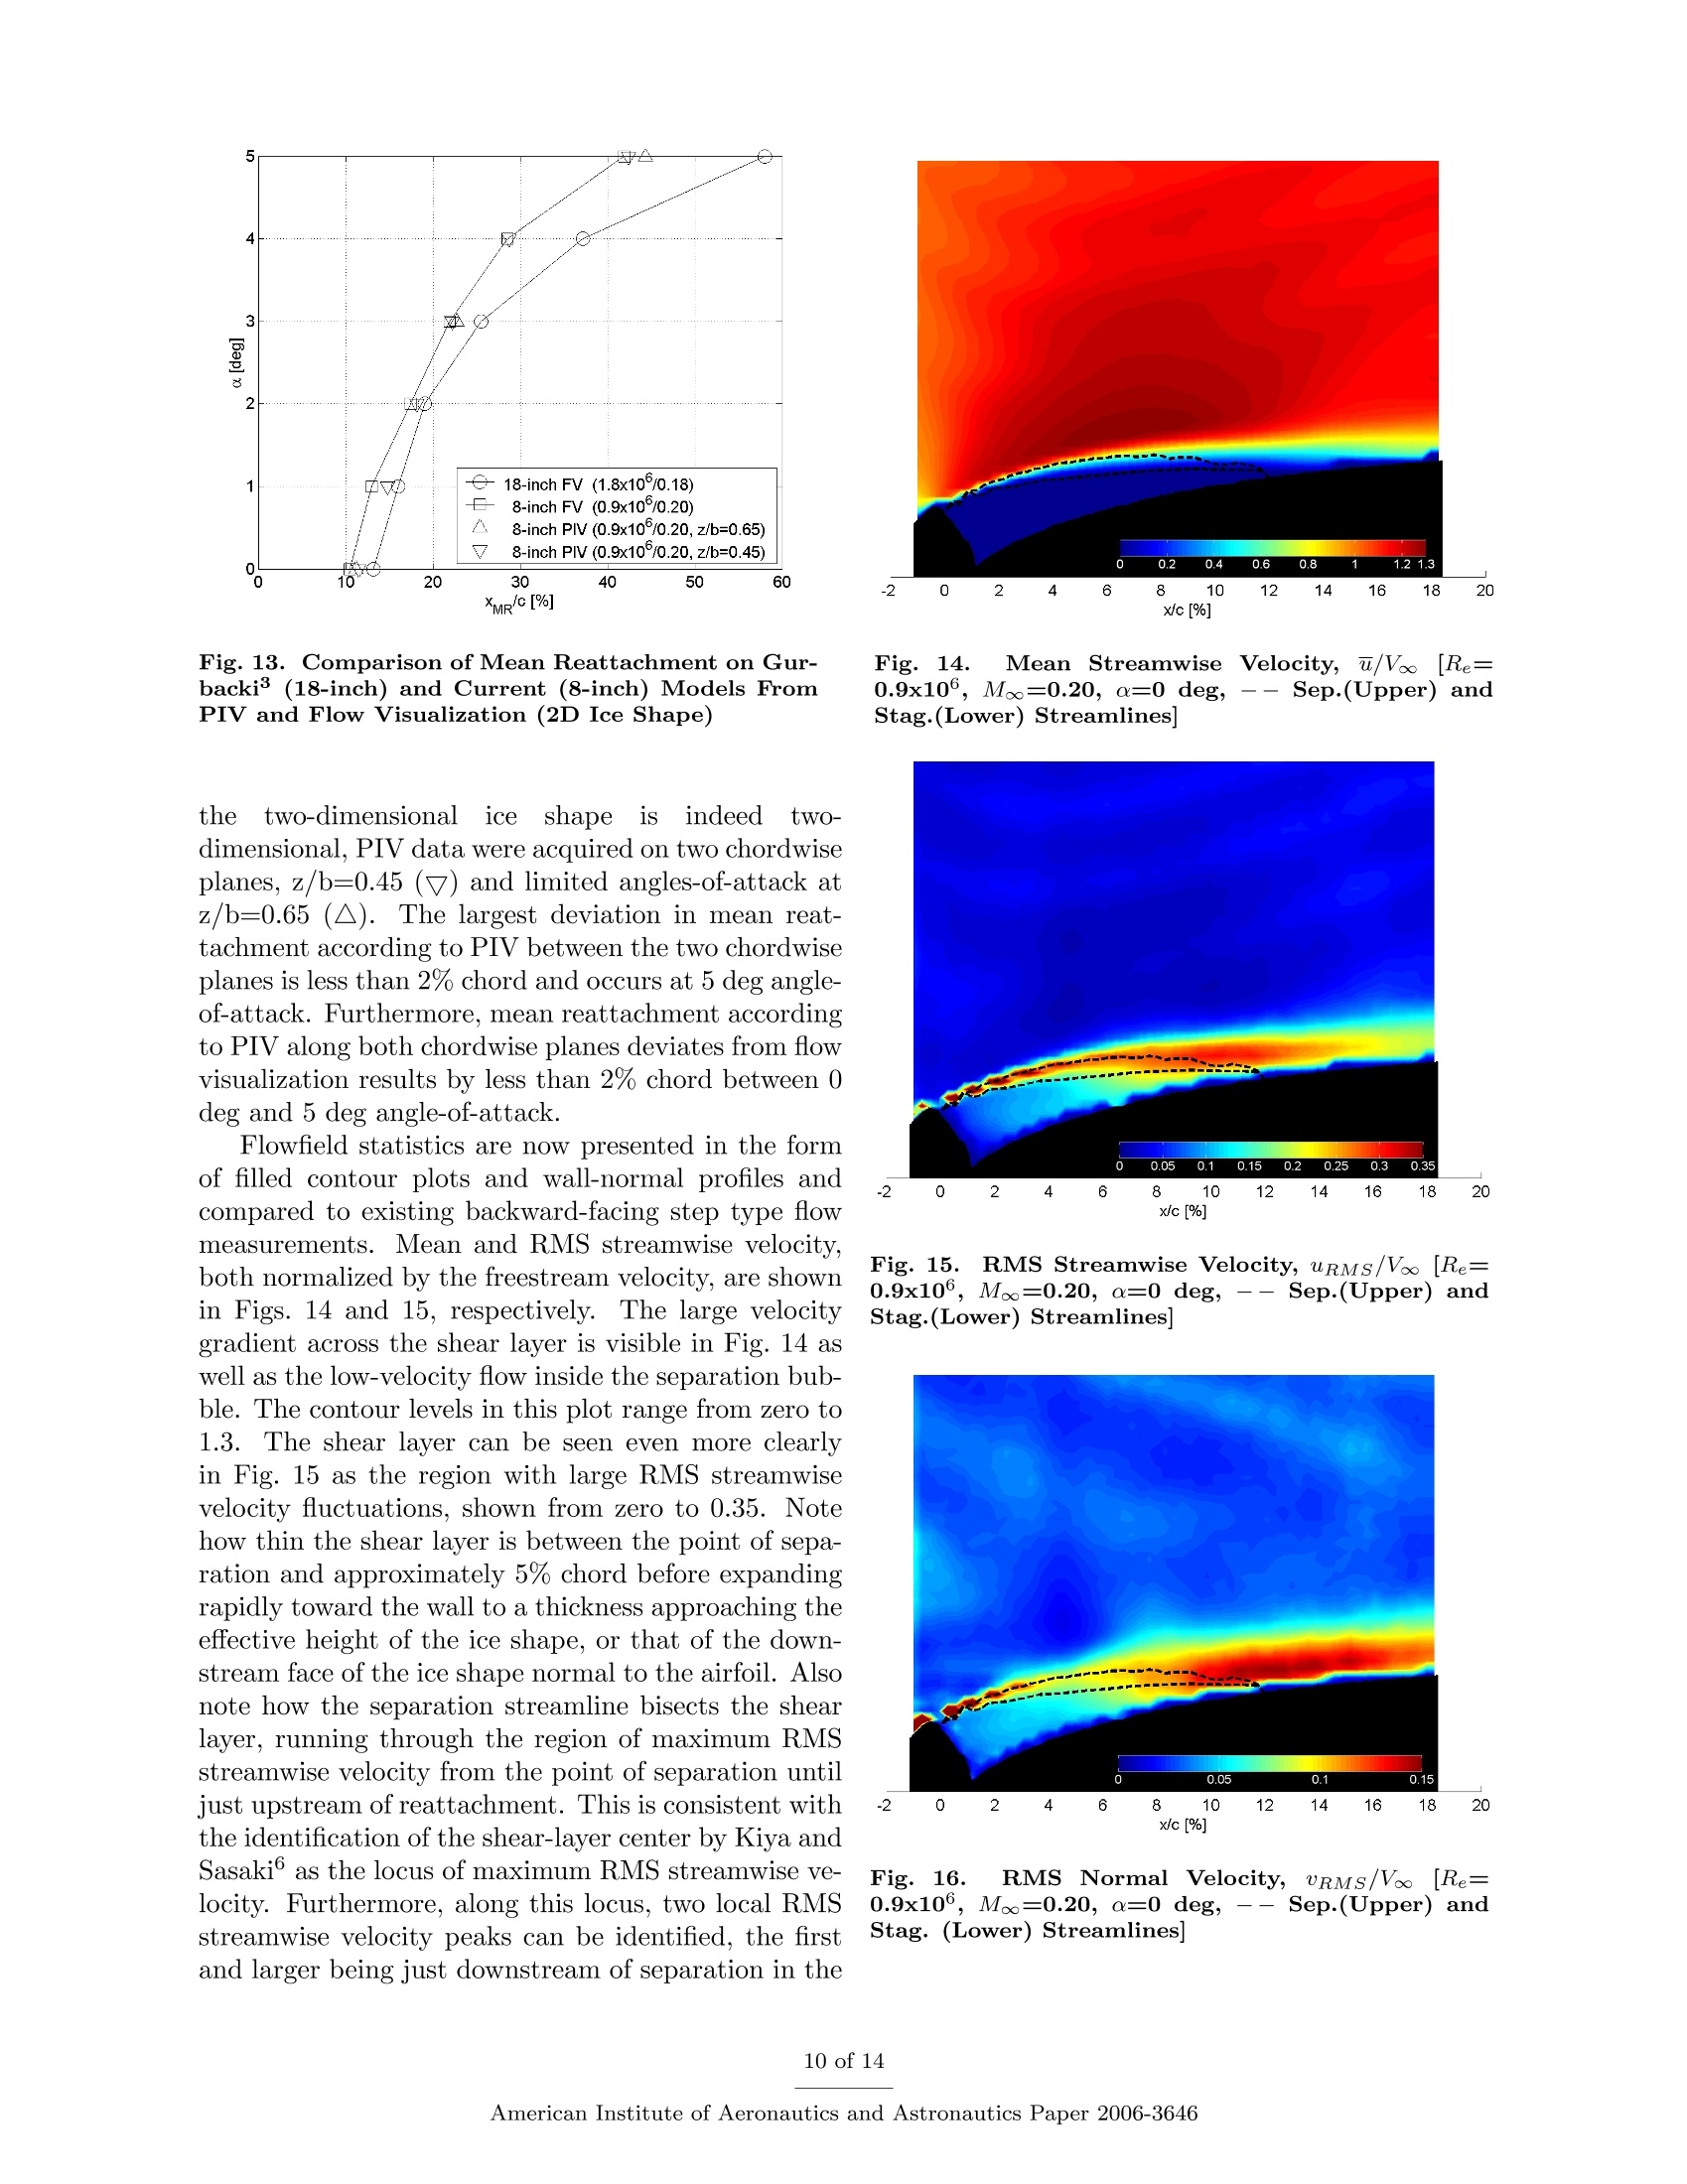
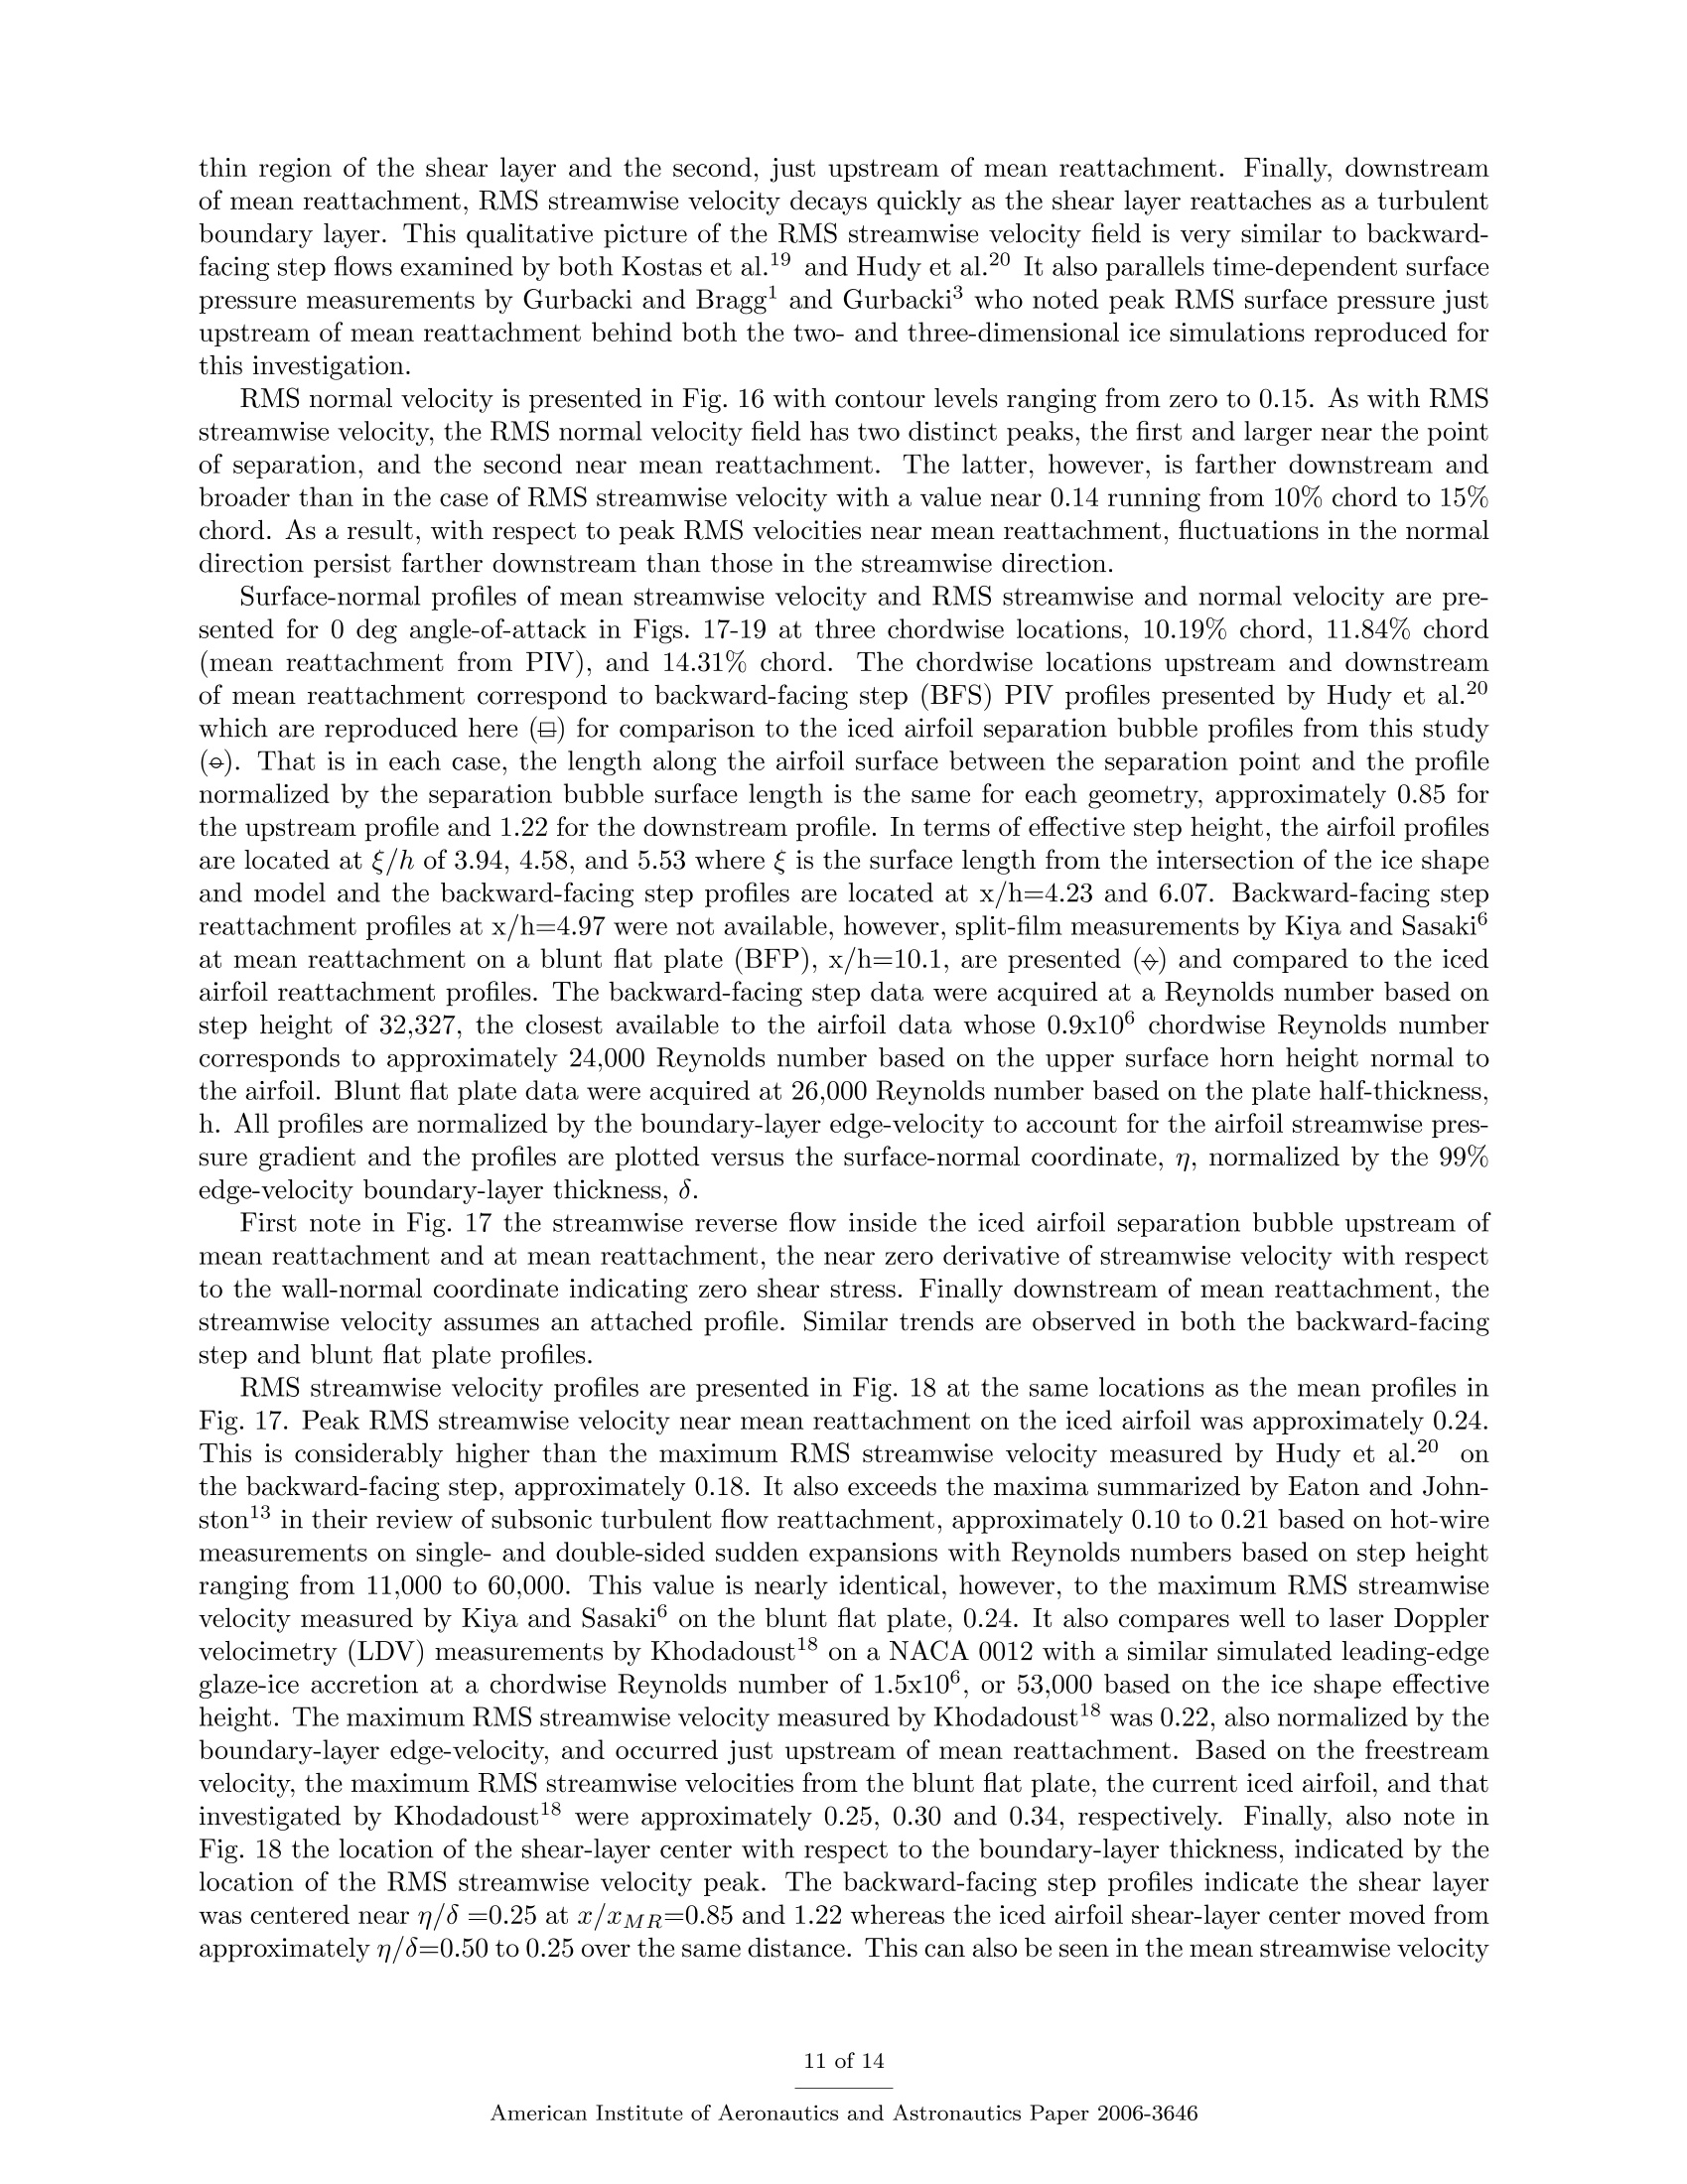
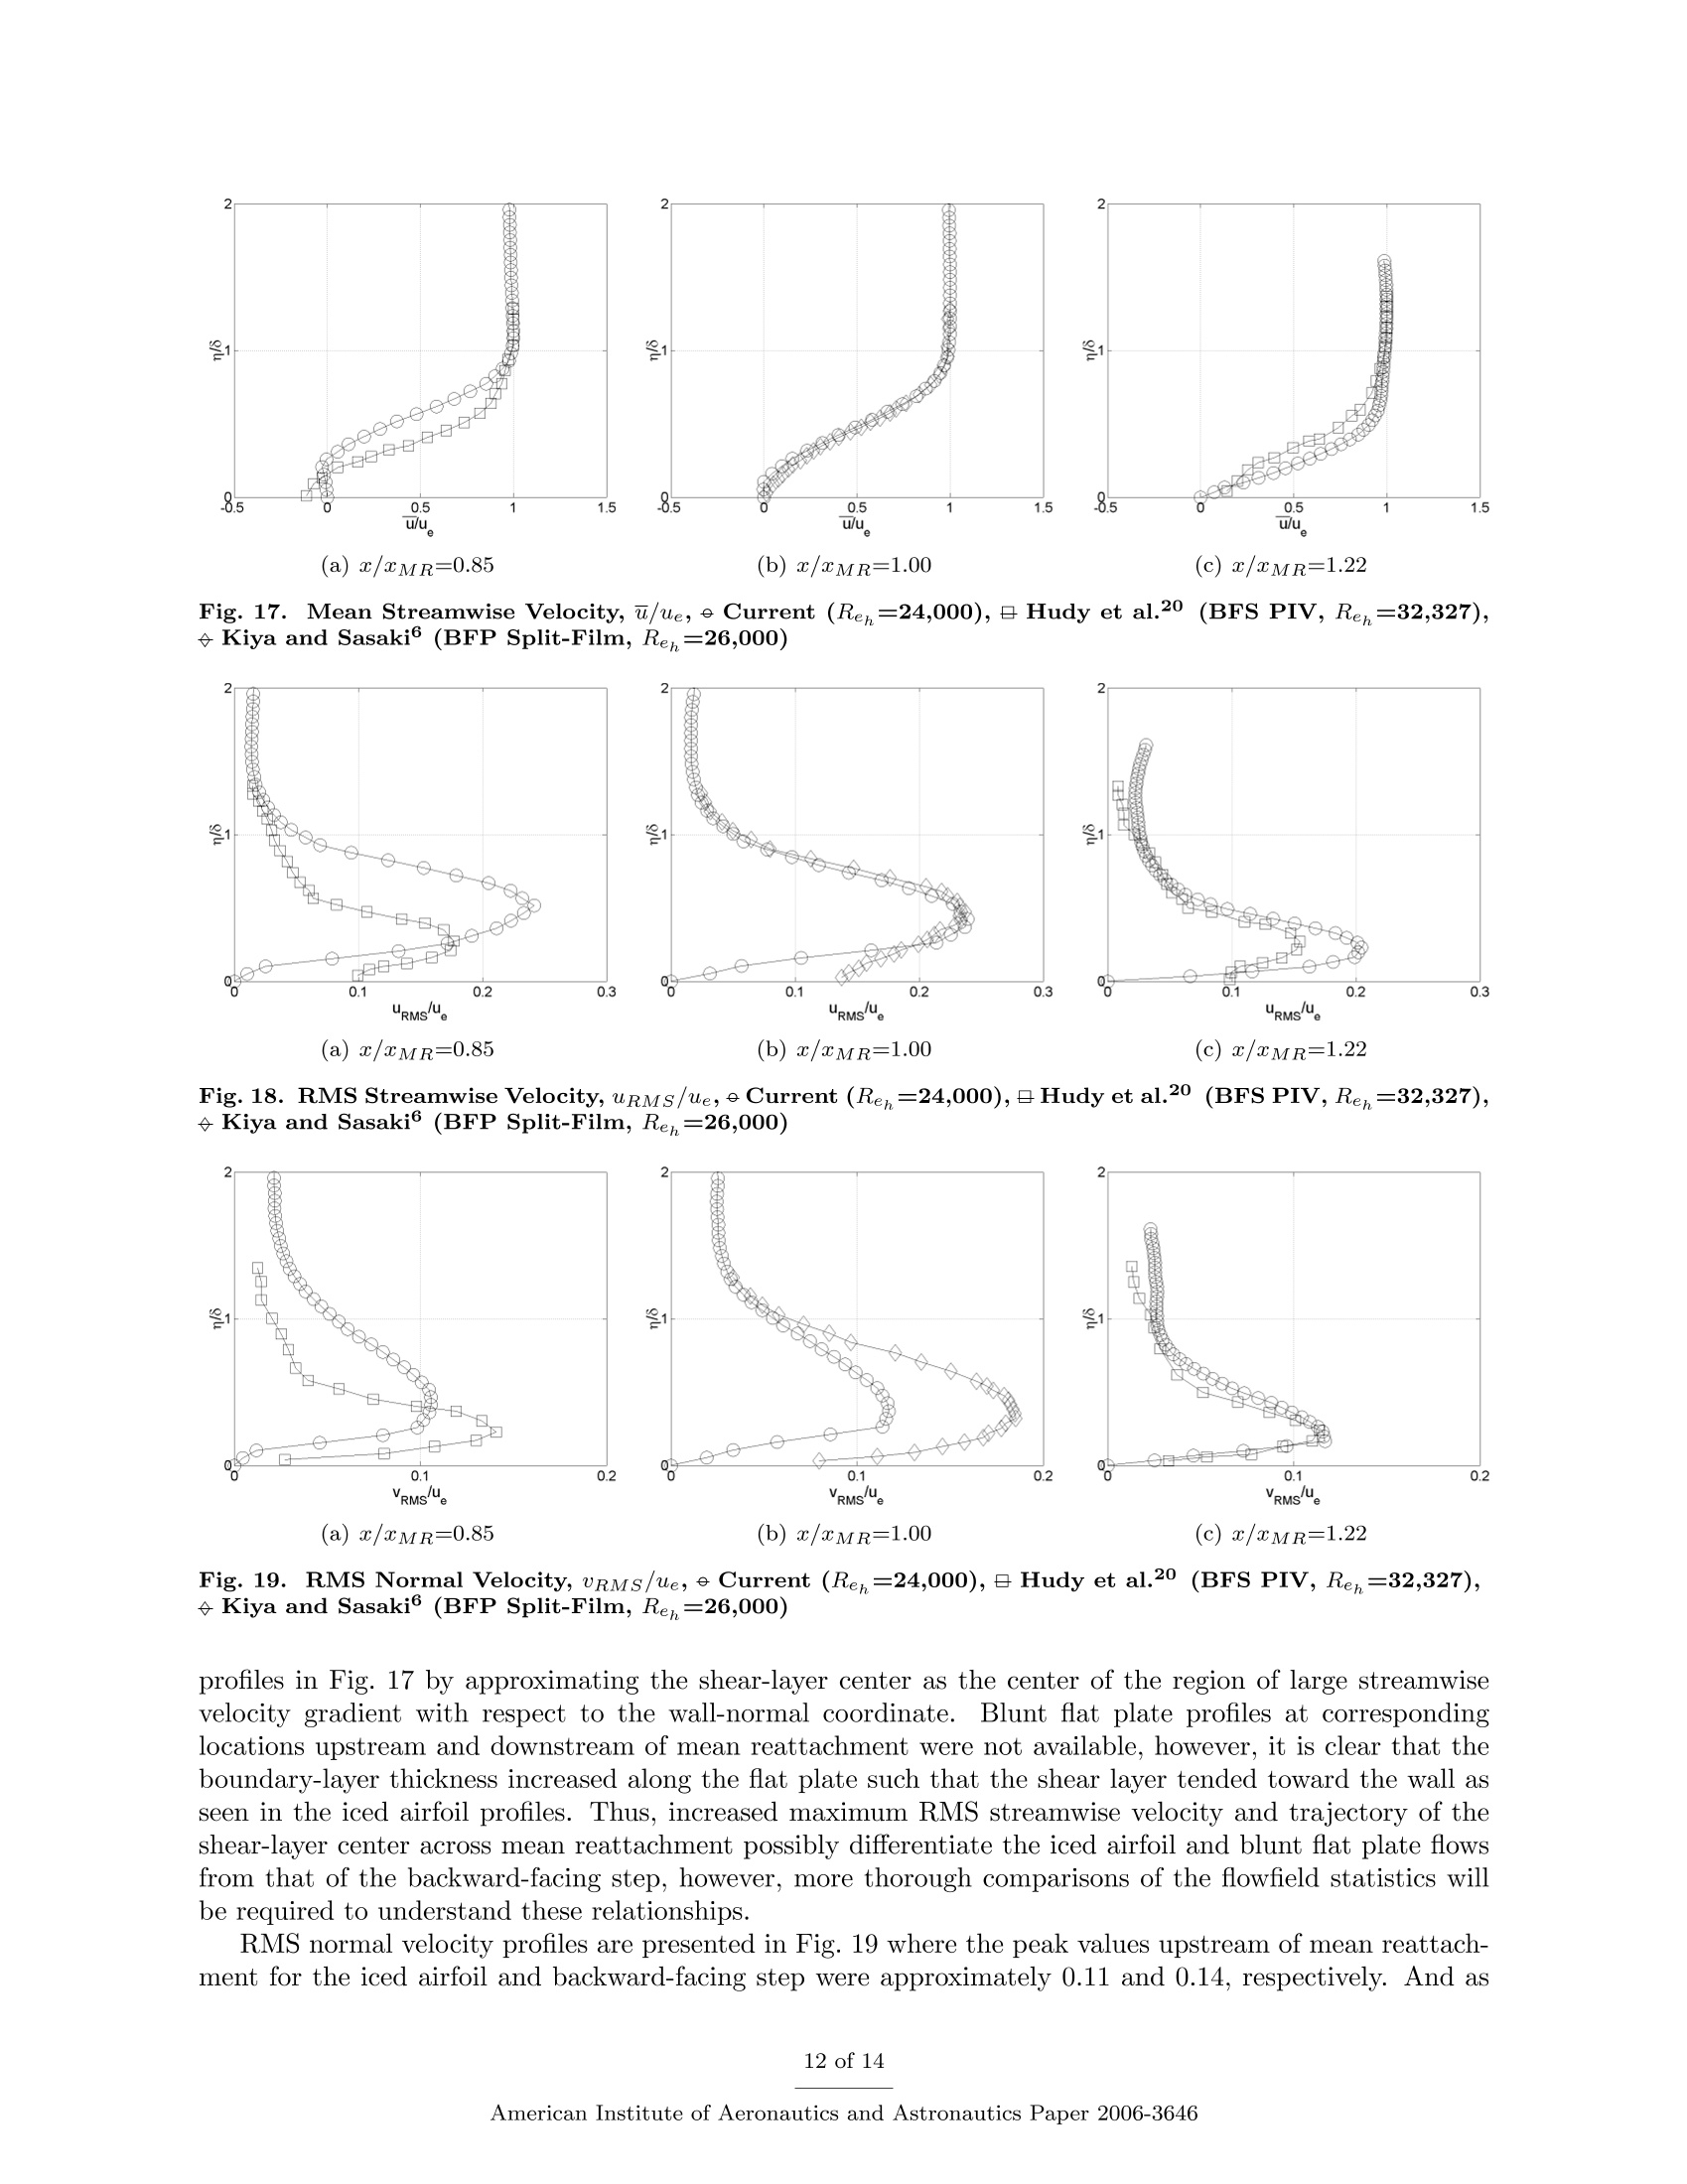
24*h AIAA Applied Aerodynamics Conference, 5-8 June 2006, San Francisco, CA Particle Image Velocimetry Measurements of theSeparation Bubble on an Iced Airfoil Jason J. Jacobs* and Michael B. Bragg University of Illinois at Urbana-Champaign, Urbana, IL, 61801, USA The separation bubble on a NACA 0012 airfoil with a two-dimensional, constant span,simulated leading-edge glaze-ice accretion is investigated using Particle Image Velocimetry(PIV). Chordwise PIV measurements, or those along the separation bubble cross-section,are obtained at a Reynolds number of 0.9x10, Mach number of 0.20, and between 0 degand 5 deg angle-of-attack. Mean reattachment estimated from surface oil-flow visualizationindicates increasing bubble length and unsteadiness (based on reattachment zone width)with angle-of-attack, consistent with results extracted from PIV measurements..Time-averaged streamlines and forward flow intermittency reveal a primary recirculation withclockwise rotation defined by a shear layer and a smaller, secondary recirculation withcounter-clockwise rotation directly downstream of the point of separation, both consistentwith backward-facing step type flowfields. Mean and RMS velocity component contourshighlight these features and wall-normal profiles are extracted and compared to otherseparation bubble data including those over a backward-facing step and blunt flat plate. I. Introduction TCE accretion on an airfoil surface changes the shape and thus the flowfield, pressure distribution, andLaerodynamic performance of the airfoil. In general this means increased drag, reduced maximum lift andpremature stall, variation in pitching moment, and overall reduction in control surface effectiveness. Dueto these undesirable effects and their implications for flight safety, understanding the ice accretion processand the aerodynamic performance of iced airfoils is very important. The following describes this flowfield indetail and briefly summarizes select studies conducted to investigate it. In many cases, ice accretion takes place on theairfoil leading edge creating a growth centered atthe stagnation point with backward-facing step likegeometries on both the pressure and suction sur-faces.BBragg et al.2 provides a description of theflowfield resulting from this type of leading-edgemodification, a schematic of which is presented inFig. 1. As Bragg describes, the laminar or transi-tional boundary layer separates off the suction sur-face horn due to a sufficiently strong adverse pres-sure gradient and a shear layer forms between thisseparated region and the inviscid flow above. Pres- Fig. 1. Schematic of Separation Bubble on Airfoil WithLeading-Edge Ice Accretion- sure recovery is delayed in this region resulting in a constant pressure plateau until the shear layer transitionsto turbulent flow. At this point, vortex motion within the shear layer entrains higher velocity inviscid flowand mixes it with lower velocity flow in the separated region. At sufficiently low angle-of-attack, this mixing isenough to allow pressure recovery and the flow reattaches as a turbulent boundary layer. This reattachmentis unsteady and defines a separation bubble whose size and shape vary in time. At larger angle-of-attackwhere the required pressure recovery cannot be achieved, reattachment occurs intermittently or not at all.This results in a bubble bursting phenomenon which initiates premature airfoil stall. ( *Graduate Research Assistant, D epartment o f Aerospace Engineering. ) ( TProfessor and Head, Department o f Aerospace Engineering, Fellow AIAA. ) ( Copyright C 2 0 06 by J a son J . Jacobs and M i chael B. Bragg. P u blished b y the American Institute o f Aeronautics and Astronautics, Inc. with permission. ) Gurbacki and Bragg and Gurbacki’conducted time-averaged and unsteady surface-pressure measure-ments, wake surveys, surface oil-flow visualization, and Particle Image Velocimetry (PIV)on a NACA 0012with two- and three-dimensional simulated leading-edge glaze-ice accretions. In these studies, the cross-section of the two-dimensional ice simulation was the spanwise averaged cross-section of the three-dimensionalshape. For both of the simulated accretions, the mean reattachment length, as well as the chordwise extent ofthe reattachment zone (unsteady bubble length variation), were shown to increase with angle-of-attack up tostall which was reduced some 10 deg by the accretions. Power spectra of time-dependent surface-pressure datanear reattachment also revealed unsteadiness with nondimensional frequency St=faMR/V.。=0.53-0.73attributed to shear-layer vortices and vortex shedding from the separation bubble. Here f is the dimen-sional frequency, CMR is the location of mean reattachment or bubble length, and V is the freestreamvelocity. Furthermore, broadband low-frequency unsteadiness was reported near stall with St=0.01 basedon time-dependent surface-pressure integrated lift coefficient power spectra. Because of its frequency, thisunsteadiness was thought to be a vertical oscillation or flapping of the shear layer. Both unsteady modesare consistent with separation bubble unsteadiness reported in backward-facing step flows by Eaton andJohnston4 and Driver et al. and in blunt flat plate flows by Kiya and Sasaki6,7 and Cherry et al.8 Gurbacki and Bragg and Gurbacki further compared the time-averaged and unsteady flowfields andperformance of the constant span,two-dimensional smoothed ice accretion with that of the three-dimensionalcast ice accretion. The most striking difference between the two was revealed in the flow visualization whichshowed a significant reduction in bubble length behind the three-dimensional ice accretion. Furthermore,this separation bubble was non-uniform in the spanwise direction, consisting of cells that did not correspondto noticeable features along the span of the three-dimensional ice accretion. These cells were attributed toa spanwise instability excited by the casting roughness which produced streamwise vortex structures thatcurved the streamlines within the separation bubble, particularly near the separation and reattachment lines.It was also proposed that these structures enhance mixing between the inviscid flow and separation bubble,aiding pressure recovery, shortening bubble length, and reducing the maximum lift coefficient and stall anglepenalty relative to the two-dimensional ice accretion. A similar spanwise instability was observed in linearstability analyses of DNS solutions of backward-facing step flow by Barkley’ and laminar separation bubbleflow by Theofilis.10,11 As demonstrated by this brief review, much research has focused on separation bubbles from geometriessuch as the backward-facing step and blunt flat plate as well as clean airfoils and those with leading-edgeice accretions. Despite this attention, however, few detailed quantitative flowfield measurements have beentaken to characterize the separation bubble, particularly related to the vortical flow structure which is closelyrelated to shear-layer reattachment and boundary-layer development downstream. Therefore the objectiveof this investigation is to improve the understanding of the iced airfoil separation bubble and other unsteady,largely separated, reattaching flowfields and provide data useful in improving the computational methodsused to predict them. IIL.。 Experimental Methods Experiments were performed at the University of Illinois Aerodynamics Research Laboratory (ARL) ina 15-inch x 15-inch x 48-inch test section wind tunnel constructed specifically for this PIV investigation.The test section incorporates a glass sidewall and ceiling panel for laser and camera access and is precededby an inlet contraction of area ratio 29:1 and a settling section containing a 4-inch thick honeycomb flowstraightener and four stainless steel 24-mesh turbulence reducing screens. A 4 deg equivalent cone anglediffuser connects the test section to a 125 Hp, 16-bladed fan which may be exhausted into the tunnel roomor through a 90 deg turning vane section vented outdoors, as is done when the flow is seeded for PIV. The wind tunnel model is an 8-inch chord, 14.95-inch span, solid aluminum NACA 0012. The modelmounts vertically in the test section and is supported by bolting the spar extending from the base of themodel to the test section turntable which is used to manually adjust the model angle-of-attack to within ±60seconds or 0.017 deg. Twenty static pressure taps are installed on a plane 5-inches from the base of the model,five on the pressure surface, one at the leading edge, and the remaining 14 along the suction surface. Thiscoarse distribution, chosen to reduce model cost, is not sufficient for performance measurements, however itallows alignment of the clean model and provides limited information on separation bubble reattachment. The two-dimensional ice shape used in these experiments is a geometrically-scaled model of that tested byGurbacki and Bragg and Gurbacki in the ARL 3 foot x 4 foot wind tunnel. While Gurbacki evaluated sev- eral ice shapes, she focused primarily on a 3.5 minute, 27.5°F glaze-ice accretion acquired in the BFGoodrichIcing Wind Tunnel at liquid water content (LWC) and mean volumetric diameter (MVD) conditions of 0.55g/m’ and 20 um respectively. The accretion was formed on an 18-inch chord, 22-inch span NACA 0012model at 4 deg angle-of-attack. A mold was taken of this accretion from which the three-dimensional castingtested by Gurbacki was produced using a polyurethane elastomer technique developed at the NASA GlennResearch Center.2 An additional casting was produced, cut, and traced allowing an average cross-section tobe defined using Surface Modelling and Grid Generation for Iced Airfoils (SmaggIce) software, also developedat the NASA Glenn Research Center. This cross-section was extruded and manufactured using stereolitho-graphy and served as the two-dimensional ice shape tested by Gurbacki. Furthermore, it is this geometrywhich has been scaled and manufactured, also using stereolithography, for PIV testing. Because the originalthree-dimensional casting cannot be geometrically-scaled, the three-dimensional ice shape used for PIV test-ing was created by adhering 20-grit roughness elements to the two-dimensional ice shape. This simulationtechnique was shown to most closely reproduce the flowfield behind the three-dimensional ice accretion in aseries of surface oil-flow visualization experiments on both the 18-inch and 8-inch chord models. PIV measurements were acquired with aLaVision FlowMaster 3S PIVsystem. Asshown in Fig. 2, this system consists of a dual120 mJ Gemini Nd:YAG PIV llaser, a Ko-dak ES1.0 1 megapixel cross-correlation cam-era, and a dual 600 MHz processor acquisitioncomputer running Microsoft Windows XP andLaVision’s Data Acquisition and VisualizationSoftware (DaVis) v6.2. Olive oil was used toseed the flow and was atomized using two TSIModel 9307 Laskin nozzle type oil droplet gen-erators, producing 1.0 um mean diameter par-ticles, and two TSI Model 9306 six-jet atomiz-ers, producing 0.6 um mean diameter particles.All four seeders were connected to a 4-inch di-ameter PVC manifold with two rows of six 1/2-inch nozzles which was positioned in front ofthe tunnel settling section and oriented to uni-formly seed the area of interest. This area wasilluminated by a laser sheet which entered the Fig. 2. LaVision FlowMaster 3S PIV System Setup test section through the glass sidewall, oriented parallel to the tunnel floor, at a spanwise location determinedby the height of the laser table. The camera imaged this area from above through a glass window set intothe test section ceiling. Experiments were performed at a Reynolds number of 0.9x10 and Mach number of 0.20. Steady modelpressure distributions were acquired by a Pressure Systems Incorporated 8400 electronic scanning pressure(ESP) system between -5 deg and 6 deg angle-of-attack in one degree increments, the upper limit imposedto prevent saturation of the 1 psi ESP transducer module. All pressure taps, including those located in thesettling section and test section inlet from which test section dynamic pressure and freestream velocity werederived, were sampled at 100 Hz for one second and time averaged. Surface oil-flow visualization was performed to map the separation bubble length and reattachment zoneversus angle-of-attack and to locate spanwise cell structures behind the three-dimensional ice simulation forfuture examination by PIV. A mineral oil and fluorescent dye mixture was sprayed on the model and thetunnel run for approximately 60 seconds during which time the mixture would flow over the model, driven bythe local shear. The results were illuminated with ultra-violet lighting and photographed for later processingusing a Nikon D100 digital SLR camera with a 35-105 mm Nikkor zoom lens with haze filter. This processwas performed between 0 deg and 6 deg angle-of-attack in one degree increments. PIV measurements were acquired between 0 deg and 5 deg angle-of-attack in one degree increments,therange over which separation bubble reattachment occurred on the suction surface. One thousand image pairswere acquired at each angle-of-attack at a rate of approximately 3 pairs per second, limited by the frame rateof the camera in cross-correlation mode and the speed and memory of the acquisition computer. A 60 mmNikkor lens delivered a field-of-view of approximately 1.6-inches, or 19% chord. The correlation analysis, performed on a 2.6 GHz Windows machine using LaVision's DaVis v6.2, was a multi-pass adaptive algorithmwith an interrogation cell size of 32 pixels square yielding a vector spacing of approximately 0.025-inchesat 50% overlap. Vector validation was by a median filter routine which identified spurious vectors basedon spatial RMS variation and replaced them with the average of neighboring vectors. All other processingoccurred in MATLAB 6.0 using subroutines developed at Illinois III. Results and Discussion A. Steady Pressure Distributions Clean PIV model steady pressure distributions alongwith those with the two- and three-dimensional ice sim-ulations were acquired and compared to data by Gur-backi. These measurements, along with surface oil-flowvisualization comparisons presented in the next section,show that the flowfields generated on the 8-inch modelfor PIV investigation are consistent with those examinedby Gurbacki and Bragg and Gurbacki’on the 18-inchchord model. Results are presented for 4 deg angle-of-attack, however, the level of agreement shown is presentacross the full range of angle-of-attack examined withthe tunnel exhausted both indoors and out. Figure 3 shows steady pressure distributions on the 8-inch chord PIV model compared to those on the 18-inchchord model tested by Gurbacki, all at 4 deg angle-of-attack. The PIV model, identified as “8-inch”, was runat 0.9x10 Reynolds number and 0.20 Mach number andthe 18-inch chord model, at 1.8x10 Reynolds numberand 0.18 Mach number. Clean pressure distributions arepresented in Fig. 3(a) where the PIV model is virtuallyidentical to the 18-inch chord model. Pressure distributions with the two-dimensional iceshape are shown in Fig. 3(b). The ice shape ends atapproximately 1% chord on the suction surface but theflow separation behind it results in a constant pressureregion covering nearly the first 15% chord.At thispoint pressure recovery begins allowing reattachment far-ther downstream, approximately 29% chord on the PIVmodel at this angle-of-attack according to flow visualiza-tion. Reattachment on the 18-inch chord model appearsto be even farther downstream as indicated by the moregradual pressure recovery and confirmed by flow visual-ization. This difference was first thought to be due to theincreased freestream turbulence in the PIV tunnel rela-tive to the 3 foot x 4 foot tunnel, a trend noted by Eatonand Johnston13 in their review of turbulent reattachmentresearch and by Kiya and Sasaki in their blunt flat plateexperiments. This could potentially hasten transition toturbulence of the shear layer resulting in earlier reat-tachment and shorter separation bubble length. How-ever, comparing the pressure data on the PIV modelfrom open return and exhausted tunnel configurations,where turbulence intensity at this speed increases fromapproximately 0.36% to 0.42% of the freestream or by17%, shows no difference. Because of this fact and theprevious clean airfoil agreement, this difference is now (b) With 2D Ice Simulation (c) With 3D Ice Casting/Simulation Fig. 3.Gurbacki (18-inch) and Current (8-inch)Steady Pressure Distributions (α=4 deg) thought to be related to the ice shape. Both 18-inch and 8-inch scale ice shapes were of stereolithographyconstruction which typically delivers a surface tolerance of ±0.008-inches, however, this absolute tolerancerepresents a larger relative tolerance on the smaller ice shape. Furthermore, the 18-inch scale ice shape wasbolted to the leading edge of the 18-inch chord model whereas the 8-inch scale ice shape was attached to thePIV model using RTV silicone, a method which relies on matching the interior contour of the ice shape withthe model leading edge for alignment. The combination of these two factors is the most likely explanationfor the difference seen in the two-dimensional iced pressure distributions in Fig. 3(b). Finally, the three-dimensional ice casting and simulation pressure distributions; are shown inFig. 3(c). Also shown on this figure is a three-dimensional ice simulation by Busch14 (dashedline) where 14-grit roughness was applied to thetwo-dimensional ice shape on the 18-inch chordmodel to simulate the spanwise variation of thethree-dimensional casting. This simulation doesnot reach the same low pressure plateau achievedby the casting and has a more gradual recov-ery. Likewise, the 20-grit based three-dimensionalice simulation tested on the PIV model recoversmore gradually from a lower pressure peak thanthe casting but matches closely the simulation byBusch. These results indicate that the rough-ened two-dimensional ice shape does not exactlymatch the actual three-dimensional ice casting interms of pressure distribution, however, it is rea-sonably close. Furthermore,flow visualization inthe next section will demonstrate the similarity inbehavior versus angle-of-attack between the cast-ing and simulation and in the flow structure in-cluding spanwise cells generated inside the sepa-ration bubble.Finally, it should be noted thatcomparing flow visualization on the 18-inch chordmodel with the three-dimensional ice casting andthe PIV model with the three-dimensional ice sim-ulation shows the casting to have a longer sepa-ration bubble even though it appears in Fig. 3(c)to recover more quickly than the simulation, theopposite trend as seen in Fig. 3(b) with the two-dimensional ice shape. This is possibly due to thefact that the casting and simulation are not sim-ply different geometric scales of the same geometrybut undoubtedly indicates that reattachment can-not be accurately gleaned strictly from the pressuredistribution. (a) 18-inch 2D (1.8x10/0.18) (b) 18-inch 3D (1.8x10⁶/0.18) B. Surface Oil-Flow Visualization (c) 8-inch 2D (0.9x10⁶/0.20) (d) 8-inch 3D (0.9x10⁶/0.20) Flow visualization was also performed on the PIVmodel and compared to images of the 18-inch chordmodel taken by Gurbacki to further validate thesub-scale flowfields generated on the PIV model. Fig.4. Gurbackis(18-inch) and Current (8-inch) SurfaceOil-Flow Visualization (Flow Left to Right, a=4 deg) Figure 4 shows these images at 4 deg angle-of-attack. The box around each of the 18-inch chord imagesrepresents the full span of the model and illustrates both models are of equal aspect ratio. Figures 4(a)and 4(c) are with the two-dimensional ice shape and Figs.4(b) and 4(d), the three-dimensional ice castingand 20-grit roughness based ice simulation, respectively. In all cases, flow is from left to right and the iceshape is visible on the left side of the image. Finally the tape applied along the chord in each image indicates percent chord, x/c, from 0% to 100% and is used tolocate important flow features such as reattachment. As discussed in Section I and illustrated in Fig. 1,the flow separates from the horn on the upper sur-face of the ice shape generating a shear layer sepa-rating a low velocity, recirculating separation bub-ble from the inviscid flow above. Vortices in thisshear layer entrain higher energy flow into the sep-aration bubble initiating pressure recovery at suffi-ciently low angle-of-attack. This results in flow reat-tachment farther downstream, an unsteady processwhich in the mean appears as a thin, vertical, speck-led region as seen between 35% and 40% chord inFig. 4(a).IThe center of this region is consideredmean reattachment. Upstream of this location in-side the separation bubble, the flow is low veloc-ity and near the model surface, primarily in the re-verse streamwise direction. Downstream, the flowhas reattached as a turbulent boundary layer andmoves toward the trailing edge. Again referring to Fig. 4, first note the approxi-mately 5% chord shorter bubble on the PIV modelthan the 18-inch chord model with both the two-and three-dimensional ice shapes. This was noted inFig.3(b) where the PIV model appeared to recoverfrom its low pressure peak more quickly than the 18-inch chord model, both with the two-dimensionalice shape. This would not be expected based onFig. 3(c), however, as it is the 18-inch chord modelwith three-dimensional ice casting which appearsto recover more quickly. But as noted in the pre-vious section, the pressure distribution cannot berelied upon exclusively for locating mean reattach-ment. Second, note the spanwise variation withineach separation bubble in Fig. 4. Behind the two-dimensional ice shape and away from the test section Fig. 5. Gurbacki (18-inch) and Current (8-inch) MeanReattachment From Flow Visualization Fig. 6. Average Spanwise Cell Spacing Behind Gur-backi’ 3D Ice Casting (18-inch) and Current 3D IceSimulation (8-inch) From Flow Visualization floor and ceiling, the mean reattachment line is straight and the streamlines inside the separation bubble areparallel to the freestream. Behind the three-dimensional ice casting and simulation, however, the streamlinesinside the separation bubble are curved indicating the presence of a spanwise velocity component, w. Thisis the instability discussed in previous sections whose origin will be investigated in detail through futurespanwise PIV measurements. Figure 5 summarizes the mean reattachment on the above models versus angle-of-attack up to 5 deg. Firstnote for each model, the shear layer reattaches some 5-10% farther upstream behind the three-dimensionalice shape than the two-dimensional. Gurbacki suggests this is due to the same vortex structures whichgenerate three-dimensional flow inside the separation bubble behind the casting. She says these vorticespossibly aid in the entrainment of higher energy flow into the separation bubble, further promoting pressurerecovery and shortening bubble length. While this has been reported in the literature, such as by Westphaland Johnston15 who noted shortened reattachment lengths downstream of a backward-facing step when smalltriangular vortex generators were placed upstream of the separation point, a thorough PIV investigation ofthese vortex structures, including their relationship to separation bubble length,is currently underway. Alsonote in Fig. 5 how the difference in separation bubble length between the PIV and 18-inch chord modelsincreases with angle-of-attack from approximately 2% chord at 0 deg to 10% chord or more at 5 deg. Asdiscussed previously, this difference is thought to be the result of tolerances and positioning of the 8-inchscale ice shape on the PIV model. A sensitivity study by Blumenthal et al.16used the Gurbacki model to examine the effect of horn height and radius of the same two-dimensional ice shape studied here on airfoilperformance and separation bubble length. These results suggest a 0.015-inch (7%) change in horn height onthe 8-inch scale ice shape could shift reattachment on the PIV model by 5% chord. While this deviation isnearly twice the SLA profile tolerance, superimposing the effect of horn height, radius, and angle tolerancescould likely explain the difference in reattachment length summarized in Fig. 5. One last comparison of flow visualization results involves the average spanwise cell spacing behind thethree-dimensional ice casting and simulation. It has been observed that this spacing is related to separationbubble length and this hypothesis is consistent with the flow visualization images in Figs. 4(b) and 4(d).Shown at the same angle-of-attack, the shorter separation bubble on the 8-inch chord model consists of alarger number of more closely spaced spanwise cells than the longer separation bubble on the 18-inch chordmodel. This notion can also be found in the literature. ]Barkley°performed linear stability analyses onbackward-facing step DNS solutions and found the critical eigenmode to be a spanwise periodic structuresimilar to the spanwise cells observed in Fig. 4. By studying the instability mechanism, he argued theinstability is centrifugal in nature according to Rayleigh’s criterion1 in which recirculating flow, such asthat inside the separation bubble, in some cases can give rise to out-of-plane secondary flow. Because it isthe eddies inside this recirculating region which drive the instability, it is the length of this region which is theappropriate length scale for the instability. This is supported in Fig. 6 where the average spanwise cell spacingin percent span is plotted versus mean reattachment length in percent chord for both the 18-inch chordmodel with the three-dimensional ice casting and the 8-inch chord PIV model with the three-dimensionalice simulation. This relationship, derived from examining flow visualization images, is approximately linearand shows spanwise cells growing larger and fewer in number with increasing separation bubble length.Also note both models collapse on this plot further supporting the applicability of the roughness-basedthree-dimensional ice simulation for this investigation. C. Particle Image Velocimetry This investigation involves PIV measurements along multiple chordwise and spanwise planes of the 8-inchchord PIV model with both the two- and three-dimensional ice simulations. To date, however, only chord-wise PIV measurements with the two-dimensional ice simulation have been both acquired and processed.Therefore, this section will focus only on these results while the three-dimensional data and comparisonsbetween the ice simulations will be presented in future publications. Figure 7 shows an image of the seeded flow at 0 deg angle-of-attack. The model is visible at the bottomof the image and the ice shape, at the bottom left. The separation bubble runs from the back of the ice shapeuntil reattachment near 12% chord. The shear layer is clearly visible extending from the tip of the ice shapehorn and separating the bubble from the inviscid flow above. Vortices are also seen inside the shear layer assmall regions of low seed concentration where the flow rotation has centrifuged the higher-than-air-densityolive oil particles away from the vortex core. Vortices are also visible downstream of reattachment supportingprevious findings of separation bubble vortex shedding such as by Kiya and Sasaki. A PIV correlation analysis was performed on the image shown in Fig. 7 along with its image pair usingLaVision's DaVis v6.2 resulting in a single instantaneous velocity vector field. After all image pairs werecorrelated,further calculations proceeded in MATLAB including that of the mean velocity vector field shownin Fig. 8. The velocity vectors are shaded by magnitude between zero velocity and 40% higher than the216 ft/s freestream velocity. Superimposed onto the velocity field are two representative separation bubblestreamlines as defined by Khodadoust.18 The lower is the stagnation streamline and represents the heightabove the model where the time-averaged streamwise velocity component, u, is zero. This streamline dividesthe reverse flow in the lower region of the separation bubble from the forward flow above.. The upperstreamline is the separation or dividing streamline and represents the height above the model, ysep, wherethe integrated streamwise mass-flow below is zero and for incompressible flow is given by: This streamline perhaps better illustrates the mean bubble as it extends above the stagnation streamlineuntil there is zero net streamwise mass-flow below, just as there would be if the mean separation bubble wasreplaced by a solid wall. -2 20 -2 20 Fig. 7. Olive Oil Seeded Flow Over PIV Model With2D Ice Shape (Flow Left to Right, a=0 deg) Fig. 8.Mean Velocity Vector Field, v/V。 [Re=0.9x10⁶, Mo.=0.20, α=0 deg, --Sep.(Upper) andStag.(Lower) Streamlines] -2 20 -2 20 x/c [%] Fig. 9. Mean Streamlines [Re=0.9x10⁶, M。=0.20,a=0 deg,--Sep.(Upper) and Stag.(Lower) Stream-lines Fig. 10.Forward Flow Intermittency [Re=0.9x10,Mo=0.20, a=0 deg,——· Sep.(Upper) and Stag.(Lower) Streamlines] Figure 9 shows streamlines integrated from the mean velocity field shown in Fig.8. Note the primary(clockwise) recirculation inside the separation bubble with the stagnation streamline coinciding with the locusof points with zero mean streamwise velocity. And just above, separating the recirculating region from theinviscid flow is the separation streamline. Also note both streamlines intersect the model at approximately12% chord, very near the mean reattachment location as determined from flow visualization. A smallersecondary recirculation with counter-clockwise rotation is also visible directly downstream of the ice shape,extending to approximately 3% chord at 0 deg angle-of-attack. This structure grows with increasing angle-of-attack, as does the primary recirculation, and both are characteristic of backward-facing step type flowssuch as those investigated by Kostas et al.19 and Hudy et al.20 Both the primary and secondary recirculations can also be seen in the forward flow intermittency shown inFig. 10. Intermittency represents the percentage of vector field realizations with positive streamwise velocity.Thus zero intermittency at a given point indicates the streamwise flow at that location is zero or negative ineach of the vector fields acquired whereas an intermittency of unity indicates the streamwise flow is in thedownstream direction in each vector field. Inside the separation bubble and below the stagnation streamline,the mean flow is almost entirely reversed and the intermittency is very low except directly downstreamof the ice shape inside the secondary recirculation. ]Here the counter-clockwise rotation results in highintermittency near the wall. Above the stagnation streamline, the recirculating flow is moving downstream Fig. 11. Schematic of Mean Reattachment Estima-tion From PIV Mean Velocity Field 10 20 30x/c [%] 40 50 (a) Forward Flow Intermittency Fig. 12. Chordwise Distribution of Intermittency andSkin Friction for Estimation of Mean Reattachment(Re=0.9x10⁶,M.=0.20) and the intermittency increases reaching unity above the shear layer. As shown in Fig. 10, intermittency also increases from near zero to unity across the location of meanreattachment, making it a convenient locator of this point. An intermittency of 0.50 near the wall, mean-ing one-half of the vector realizations at that point have positive streamwise velocity, is considered meanreattachment. A second method used for estimating mean reattachment from PIV data is based on thechordwise distribution of skin friction. At a given chordwise location, the mean streamwise velocity profile isdifferentiated with respect to the wall-normal coordinate,n, at or near the wall and skin friction is calculateddirectly as: where ue is the boundary-layer edge-velocity and Tu, the wall-shear stress: In this case, the separation bubble is characterized by negative skin friction indicating reverse flow near ve1thewall and the location of zero skin friction is considered mean reattachment. Both methods of estimatingmean reattachment are illustrated in Fig. 11 as the location of 0.50 intermittency aligns with the location ofzero skin friction and the intersection of the stagnation and separation streamlines with the wall. Note thesolid lines in Fig. 11 are raw data and the dashed lines, 5th-order polynomial fits. Polynomial fits of intermittency and skin friction chordwise distributions are presented in Fig. 12 for thePIV model with the two-dimensional ice simulation between 0 deg and 5 deg angle-of-attack. Both methodsagree closely and are averaged to provide an estimate of mean reattachment according to PIV. These re-sults are then compared to flow visualization reattachment data in Fig. 13. To verify that the flowfield behind Fig. 13. Comparison of Mean Reattachment on Gur-backi (18-inch) and Current (8-inch) Models FromPIV and Flow Visualization (2D Ice Shape) the two-dimensional ice shapeis indeedtwo-dimensional, PIV data were acquired on two chordwiseplanes, z/b=0.45 (√) and limited angles-of-attack atz/b=0.65 (A)..The largest deviation in mean reat-tachment according to PIV between the two chordwiseplanes is less than 2% chord and occurs at 5 deg angle-of-attack.Furthermore, mean reattachment accordingto PIV along both chordwise planes deviates from flowvisualization results by less than 2% chord between Odeg and 5 deg angle-of-attack. Flowfield statistics are now presented in the formof filled contour plots and wall-normal profiles andcompared to existing backward-facing step type flowmeasurements. Mean and RMS streamwise velocity,both normalized by the freestream velocity, are shownin Figs. 14 and 15, respectively. The large velocitygradient across the shear layer is visible in Fig. 14 aswell as the low-velocity flow inside the separation bub-ble. The contour levels in this plot range from zero to1.3...The shear layer can be seen even more clearlyin Fig. 15 as the region with large RMS streamwisevelocity fluctuations, shown from zero to 0.35. Notehow thin the shear layer is between the point of sepa-ration and approximately 5% chord before expandingrapidly toward the wall to a thickness approaching theeffective height of the ice shape, or that of the down-stream face of the ice shape normal to the airfoil. Alsonote how the separation streamline bisects the shearlayer, running through the region of maximum RMSstreamwise velocity from the point of separation untiljust upstream of reattachment. This is consistent withthe identification of the shear-layer center by Kiya andSasaki as the locus of maximum RMS streamwise ve-locity. Furthermore, along this locus, two local RMSstreamwise velocity peaks can be identified, the firstand larger being just downstream of separation in the -2 20 Fig. 14. Mean Streamwise Velocity, u/V.。 [Re=0.9x10⁶, M=0.20, α=0 deg,——Sep.(Upper) andStag.(Lower) Streamlines] -2 20 Fig.15.i. RMS Streamwise Velocity, uRMs/V.. [Re=0.9x10⁶, M.=0.20, a=0 deg, Sep.(Upper) andStag.(Lower) Streamlines] -2 20 x/c [%] Fig. 16. RMS Normal Velocity,y, URMS/V.。 [Re=0.9x10⁶, Mo=0.20,a=0 deg,-- Sep.(Upper) andStag. (Lower) Streamlines thin region of the shear layer and the second, just upstream of mean reattachment. Finally, downstreamof mean reattachment, RMS streamwise velocity decays quickly as the shear layer reattaches as a turbulentboundary layer. This qualitative picture of the RMS streamwise velocity field is very similar to backward-facing step flows examined by both Kostas et al.19 and Hudy et al.20 It also parallels time-dependent surfacepressure measurements by Gurbacki and Bragg and Gurbacki’who noted peak RMS surface pressure justupstream of mean reattachment behind both the two- and three-dimensional ice simulations reproduced forthis investigation. RMS normal velocity is presented in Fig. 16 with contour levels ranging from zero to 0.15. As with RMSstreamwise velocity, the RMS normal velocity field has two distinct peaks, the first and larger near the pointof separation, and the second near mean reattachment.The latter, however, is farther downstream andbroader than in the case of RMS streamwise velocity with a value near 0.14 running from 10% chord to 15%chord. As a result, with respect to peak RMS velocities near mean reattachment, fluctuations in the normaldirection persist farther downstream than those in the streamwise direction. Surface-normal profiles of mean streamwise velocity and RMS streamwise and normal velocity are pre-sented for 0 deg angle-of-attack in Figs. 17-19 at three chordwise locations, 10.19% chord, 11.84% chord(mean reattachment from PIV), and 14.31% chord. The chordwise locations upstream and downstreamof mean reattachment correspond to backward-facing step (BFS) PIV profiles presented by Hudy et al.2which are reproduced here () for comparison to the iced airfoil separation bubble profiles from this study(e). That is in each case, the length along the airfoil surface between the separation point and the profilenormalized by the separation bubble surface length is the same for each geometry, approximately 0.85 forthe upstream profile and 1.22 for the downstream profile. In terms of effective step height, the airfoil profilesare located atf/h of 3.94, 4.58, and 5.53 where is the surface length from the intersection of the ice shapeand model and the backward-facing step profiles are located at x/h=4.23 and 6.07. Backward-facing stepreattachment profiles at x/h=4.97 were not available, however, split-film measurements by Kiya and Sasakiat mean reattachment on a blunt flat plate (BFP),x/h=10.1, are presented (+) and compared to the icedairfoil reattachment profiles. The backward-facing step data were acquired at a Reynolds number based onstep height of 32,327, the closest available to the airfoil data whose 0.9x10 chordwise Reynolds numbercorresponds to approximately 24,000 Reynolds number based on the upper surface horn height normal tothe airfoil. Blunt flat plate data were acquired at 26,000 Reynolds number based on the plate half-thickness,h. All profiles are normalized by the boundary-layer edge-velocity to account for the airfoil streamwise pres-sure gradient and the profiles are plotted versus the surface-normal coordinate, n, normalized by the 99%edge-velocity boundary-layer thickness, 6. First note in Fig. 17 the streamwise reverse flow inside the iced airfoil separation bubble upstream ofmean reattachment and at mean reattachment, the near zero derivative of streamwise velocity with respectto the wall-normal coordinate indicating zero shear stress. Finally downstream of mean reattachment, thestreamwise velocity assumes an attached profile. Similar trends are observed in both the backward-facingstep and blunt flat plate profiles. RMS streamwise velocity profiles are presented in Fig. 18 at the same locations as the mean profiles inFig. 17. Peak RMS streamwise velocity near mean reattachment on the iced airfoil was approximately 0.24.This is considerably higher than the maximum RMS streamwise velocity measured by Hudy et al.20 onthe backward-facing step, approximately 0.18. It also exceeds the maxima summarized by Eaton and John-ston13 in their review of subsonic turbulent flow reattachment, approximately 0.10 to 0.21 based on hot-wiremeasurements on single- and double-sided sudden expansions with Reynolds numbers based on step heightranging from 11,000 to 60,000. This value is nearly identical, however, to the maximum RMS streamwisevelocity measured by Kiya and Sasaki on the blunt flat plate, 0.24. It also compares well to laser Dopplervelocimetry (LDV) measurements by Khodadoust18 on a NACA 0012 with a similar simulated leading-edgeglaze-ice accretion at a chordwise Reynolds number of 1.5x10°, or 53,000 based on the ice shape effectiveheight. The maximum RMS streamwise velocity measured by Khodadoust18 was 0.22, also normalized by thebounday-llaavyer edge-velocity, and occurred just upstream of mean reattachment. Based on the freestreamvelocity, the maximum RMS streamwise velocities from the blunt flat plate, the current iced airfoil, and thatinvestigated by Khodadoust18 were approximately 0.25, 0.30 and 0.34, respectively. Finally, also note inFig. 18 the location of the shear-layer center with respect to the boundary-layer thickness, indicated by thelocation of the RMS streamwise velocity peak. The backward-facing step profiles indicate the shear layerwas centered near n/; =0.25 at c/sMR=0.85 and 1.22 whereas the iced airfoil shear-layer center moved fromapproximately n/6=0.50 to 0.25 over the same distance. This can also be seen in the mean streamwise velocity 2 1 85 1.5 Fig. 17. Mean Streamwise Velocity, u/ue, e Current (Ren=24,000),8 Hudy et al.20 ((BFS PIV, Ren=32,327),◇Kiya and Sasaki (BFP Split-Film, Re=26,000) 91 冷O e令 0.3 Fig. 18. RMS Streamwise Velocity,uRMs/ue, o Current (Re =24,000),8Hudy et al.20 (BFS PIV, Re =32,327),+Kiya and Sasaki (BFP Split-Film, Re =26,000) (a)x/xMR=0.85 Fig. 19. RMS Normal Velocity, URMs/ue, e Current (Ren=24,000),8 Hudy et al.20 (BFS PIV, Ren=32,327),+Kiya and Sasaki (BFP Split-Film, Re,=26,000) profiles in Fig. 17 by approximating the shear-layer center as the center of the region of large streamwisevelocity gradient with respect to the wall-normal coordinate..Blunt flat plate profiles at correspondinglocations upstream and downstream of mean reattachment were not available, however, it is clear that theboundary-layer thickness increased along the flat plate such that the shear layer tended toward the wall asseen in the iced airfoil profiles. Thus, increased maximum RMS streamwise velocity and trajectory of theshear-layer center across mean reattachment possibly differentiate the iced airfoil and blunt flat plate flowsfrom that of the backward-facing step, however, more thorough comparisons of the flowfield statistics willbe required to understand these relationships. RMS normal velocity profiles are presented in Fig.19 where the peak values upstream of mean reattach-ment for the iced airfoil and backward-facing step were approximately 0.11 and 0.14, respectively. And as with the RMS streamwise velocity, the iced airfoil peak occurred nearly twice the distance from the wall, interms of the boundary-layer thickness, as did the backward-facing step peak. Downstream of reattachment,the iced airfoil RMS normal velocity peak likewise shifted toward the wall, however, its magnitude remainedrelatively constant as the backward-facing step peak decayed to approximately 0.11. At mean reattachment,the iced airfoil and blunt flat plate RMS normal velocity peaks aligned with magnitudes approximately 0.12and 0.19 respectively. IV. Conclusions The primary objective of this research was to understand the similarities and differences between theflowfield structure of the separation bubbles formed on a NACA 0012 airfoil with simulated leading-edgetwo- and three-dimensional glaze-ice accretions.AA new 15-inch x 15-inch test section wind tunnel hasbeen assembled for PIV experiments to investigate these flowfields. An appropriate aspect ratio modeland three-dimensional ice simulation have been identified which generate sub-scale flowfields consistent withthose examined by Gurbacki and Bragg and Gurbacki’ and hardware has been fabricated. Time-averagedpressure distributions and surface oil-flow visualization on this new hardware confirmed that these flowfieldsare indeed consistent with the full-scale flowfields of interest in terms of mean reattachment behavior withangle-of-attack and spanwise cell structure and spacing. Chordwise PIV images of the seeded flow over the model with the two-dimensional ice simulation showedsmall vortex structures inside the shear layer emanating from the suction surface horn and larger vortexactivity downstream. A large clockwise recirculating region enclosed by the shear layer and small counter-clockwise recirculating region centered at the interface of the ice shape and model were also visible andgrew with increasing angle-of-attack. The mean location of shear-layer reattachment, determined from thechordwise distribution of forward flow intermittency and skin friction, was very near the location of meanreattachment according to surface oil-flow visualization. This location also corresponded to the intersectionof the model and the bubble stagnation and separation streamlines, the later of which connected the locusof points with maximum RMS streamwise velocity defining the center of the shear layer. Wall-normal mean streamwise velocity profiles were interpolated indicating reverse flow near the modelsurface inside the separation bubble, zero gradient or skin friction at mean reattachment, and an attachedprofile downstream. These results were consistent with backward-facing step PIV profiles acquired by Hudy etal.20 and blunt flat plate split-film measurements acquired by Kiya and Sasaki.6 Maximum RMS streamwisevelocity near mean reattachment was approximately 0.24 normalized by the boundary-layer edge-velocity.This value was considerably higher than the maximum RMS streamwise velocity of 0.18 recorded by Hudy etal.20 It was much closer, however, to the maximum RMS streamwise velocity measured by Kiya and Sasaki,60.24, and by Khodadoust,18 0.22, who acquired LDV data on a NACA 0012 with a similar leading-edge iceaccretion. Also, the location of the maximum RMS streamwise velocity above the wall, which defines theshear-layer center, was shown to be relatively constant across mean reattachment in the backward-facing stepprofiles but shifted toward the wall in both the iced airfoil and blunt flat plate profiles. These similarities inboth the value and trajectory of the peak RMS streamwise velocity between the iced airfoil and blunt flatplate suggest a relationship which will be examined by more thorough comparisons ofthe flowfield statistics. Finally, the trajectories of peak RMS normal velocity were shown to be similar to those of the peak RMSstreamwise velocity.The magnitude of the iced airfoil normal fluctuations, however, remained relativelyconstant several percent chord downstream of mean reattachment while the backward-facing step fluctuationsdecayed as in the streamwise direction. The maximum RMS normal velocities near mean reattachment for theiced airfoil, backward-facing step, and blunt flat plate were approximately 0.12, 0.14, and 0.19, respectively. V..Acknowledgment This work was supported by a NASA Graduate Student Researchers Program (GSRP) fellowship incooperation with the NASA Glenn Research Center. The authors would like to thank NASA Glenn contractmonitor Dr. Mark Potapczuk for his guidance throughout this study and Dr. Andy Broeren, University ofIllinois Research Scientist, for his assistance during wind tunnel construction, data acquisition, and initialsetup of the PIV experiment. References Gurbacki, H. M. and Bragg, M. B.,“Unsteady Aerodynamic Measurements on an Iced Airfoil,”AIAA Paper 2002-0241,40th AIAA Aerospace Sciences Meeting & Exhibit, Reno, NV, January 2002. "Bragg, M. B., Khodadoust, A., and Spring, S. A.,“Measurements in a Leading-Edge Separation Bubble due to a SimulatedAirfoil Ice Accretion," AIAA Journal, Vol. 30, No. 6, 1992, pp. 1462-1467. Gurbacki, H. M., Ice-Induced Unsteady Flowfield Effects On Airfoil Performance, Ph.D. thesis, University of Illinois atUrbana-Champaign, Urbana, IL, 2003. 4Eaton, J. K. and Johnston, J. P., “Low frequency unsteadiness of a reattaching turbulent shear layer," Turbulent ShearFlows III,Third International Symposium on Turbulent Shear Flows, University of California at Davis, September 1981, pp.162-170. Driver, D. M., Seegmiller, H. L., and Marvin, J. G.,“Time-Dependent Behavior of a Reattaching Shear Layer,"”AIAAJournal, Vol. 25, No. 7, 1987, pp. 914-919. Kiya, M. and Sasaki, K., “Structure of a turbulent separation bubble,” Journal of Fluid Mechanics, Vol. 137, 1983,pp. 83-113. Kiya, M. and Sasaki, K., “Structure of large-scale vortices and unsteady reverse flow in the reattaching zone of a turbulentseparation bubble,” Journal of Fluid Mechanics, Vol.154, 1985, pp. 463-491. Cherry, N. J., Hillier, R., and Latour, M. E. M. P., “Unsteady measurements in a separated and reattaching flow,"Journal of Fluid Mechanics, Vol. 144,1984, pp. 13-46. Barkley, D., Gomes, M. G. M., and Henderson, R. D.,“Three-Dimensional instability in flow over a backward-facingstep,”Journal of Fluid Mechanics, Vol. 473, 2002, pp. 167-190. 10Theofilis, V., Hein, S., and Dallmann, U., “On the origins of unsteadiness and three-dimensionality in a laminar separationbubble,”The Philosophical Transactions of the Royal Society of London, Series A, Vol. 358, 2000, pp. 3229-3246. Theofilis, V., “On the spatial structure of global linear instabilities and their experimental identification,” AerospaceScience and Technology, Vol.4, 2000, pp. 249-262. 12Reehorst, A. L. and Richter, G. P., “New Methods and Materials for Molding and Casting Ice Formations,”NASA TM100126, September 1987. 13Eaton, J. K. and Johnston, J. P.,“A Review of Research on Subsonic Turbulent Flow Reattachment,” AIAA Journal,Vol. 19, No. 9, 1981, pp. 1093-1100. 14Busch, G., private communication, University of Illinois at Urbana-Champaign, Urbana, IL, July 2005. 15 Westphal, R. V. and Johnston, J. P.,“Effect of Initial Conditions on Turbulent Reattachment Downstream of a Backward-Facing Step,” AIAA Journal, Vol. 22, No. 12, 1984, pp. 1727-1732. 16Blumenthal, L., Busch, G., Broeren, A. P., and Bragg, M. B.,“Issues in Ice Accretion Aerodynamic Simulation on aSubscale Model,”AIAA Paper 2006-262, 44th AIAA Aerospace Sciences Meeting & Exhibit, Reno, NV, January 2006. l Bayly, B. J., “Three-Dimensional centrifugal-type instabilities in inviscid two-dimensional flows,” Physics of Fluids,Vol.31, 1988, pp. 56-64. 18Khodadoust, A., An Experimental Study Of The Flowfield On A Semispan Rectangular Wing With Simulated Glaze IceAccretion, Ph.D. thesis, University of Illinois at Urbana-Champaign, Urbana, IL, 1993. 19Kostas, J., Soria, J., and Chong, M. S., “Particle image velocimetry measurements of a backward-facing step flow,Eaperiments in Fluids, Vol. 33,2002, pp. 838-853. 20Hudy, L. M., Naguib, A. M., Humphreys, W. M., and Bartram, S. M., “Particle Image Velocimetry Measurements ofa Two/Three-dimensional Separating/Reattaching Boundary Layer Downstream of an Axisymmetric Backward-facing Step,”AIAA Paper 2005-0114,43th AIAA Aerospace Sciences Meeting & Exhibit, Reno, NV, January 2005. of merican Institute of Aeronautics and Astronautics Paper
确定
还剩12页未读,是否继续阅读?

产品配置单


北京欧兰科技发展有限公司为您提供《翼型,冰风洞中速度矢量场检测方案(粒子图像测速)》,该方案主要用于其他中速度矢量场检测,参考标准--,《翼型,冰风洞中速度矢量场检测方案(粒子图像测速)》用到的仪器有德国LaVision PIV/PLIF粒子成像测速场仪、Imager sCMOS PIV相机
推荐专场


相关方案
更多
该厂商其他方案
更多