


The wake of a circular cylinder at Re = 2700 is investigated by means of Tomographic PIV
(Tomo-PIV), a recently developed three-dimensional velocimetry technique. The paper presents the
principles of Tomo-PIV and discusses in details the implementation of the technique to the experimental
conditions. With a measurement volume of approximately 40x40x10 mm2 two configurations are chosen in
order to describe both the 2D wake features and the span wise organization of secondary rollers dominating
the 3D flow organization. The present data allow to directly evaluate the measurement error imposing mass
conservation inside the volume (viz. solenoidal velocity field). The visualization of the wake instantaneous
structure is obtained by means of vorticity vector magnitude iso-surfaces, or decomposing the vorticity in the
span wise and stream-wise(normal)/bi-normal component, which return the separate contribution of the
Kármán rollers and the interconnecting structures between them respectively. The properties of the
secondary rollers are given in terms of span wise wavelength, peak vorticity, vorticity stretching and their
size and shape. A value of the span wise wavelength λ
z/D = 1.2 is recurring and the rollers organization into
pairs is found to be similar to the instability Mode B occurring in lower Reynolds number wakes investigated
with previous studies.
方案详情

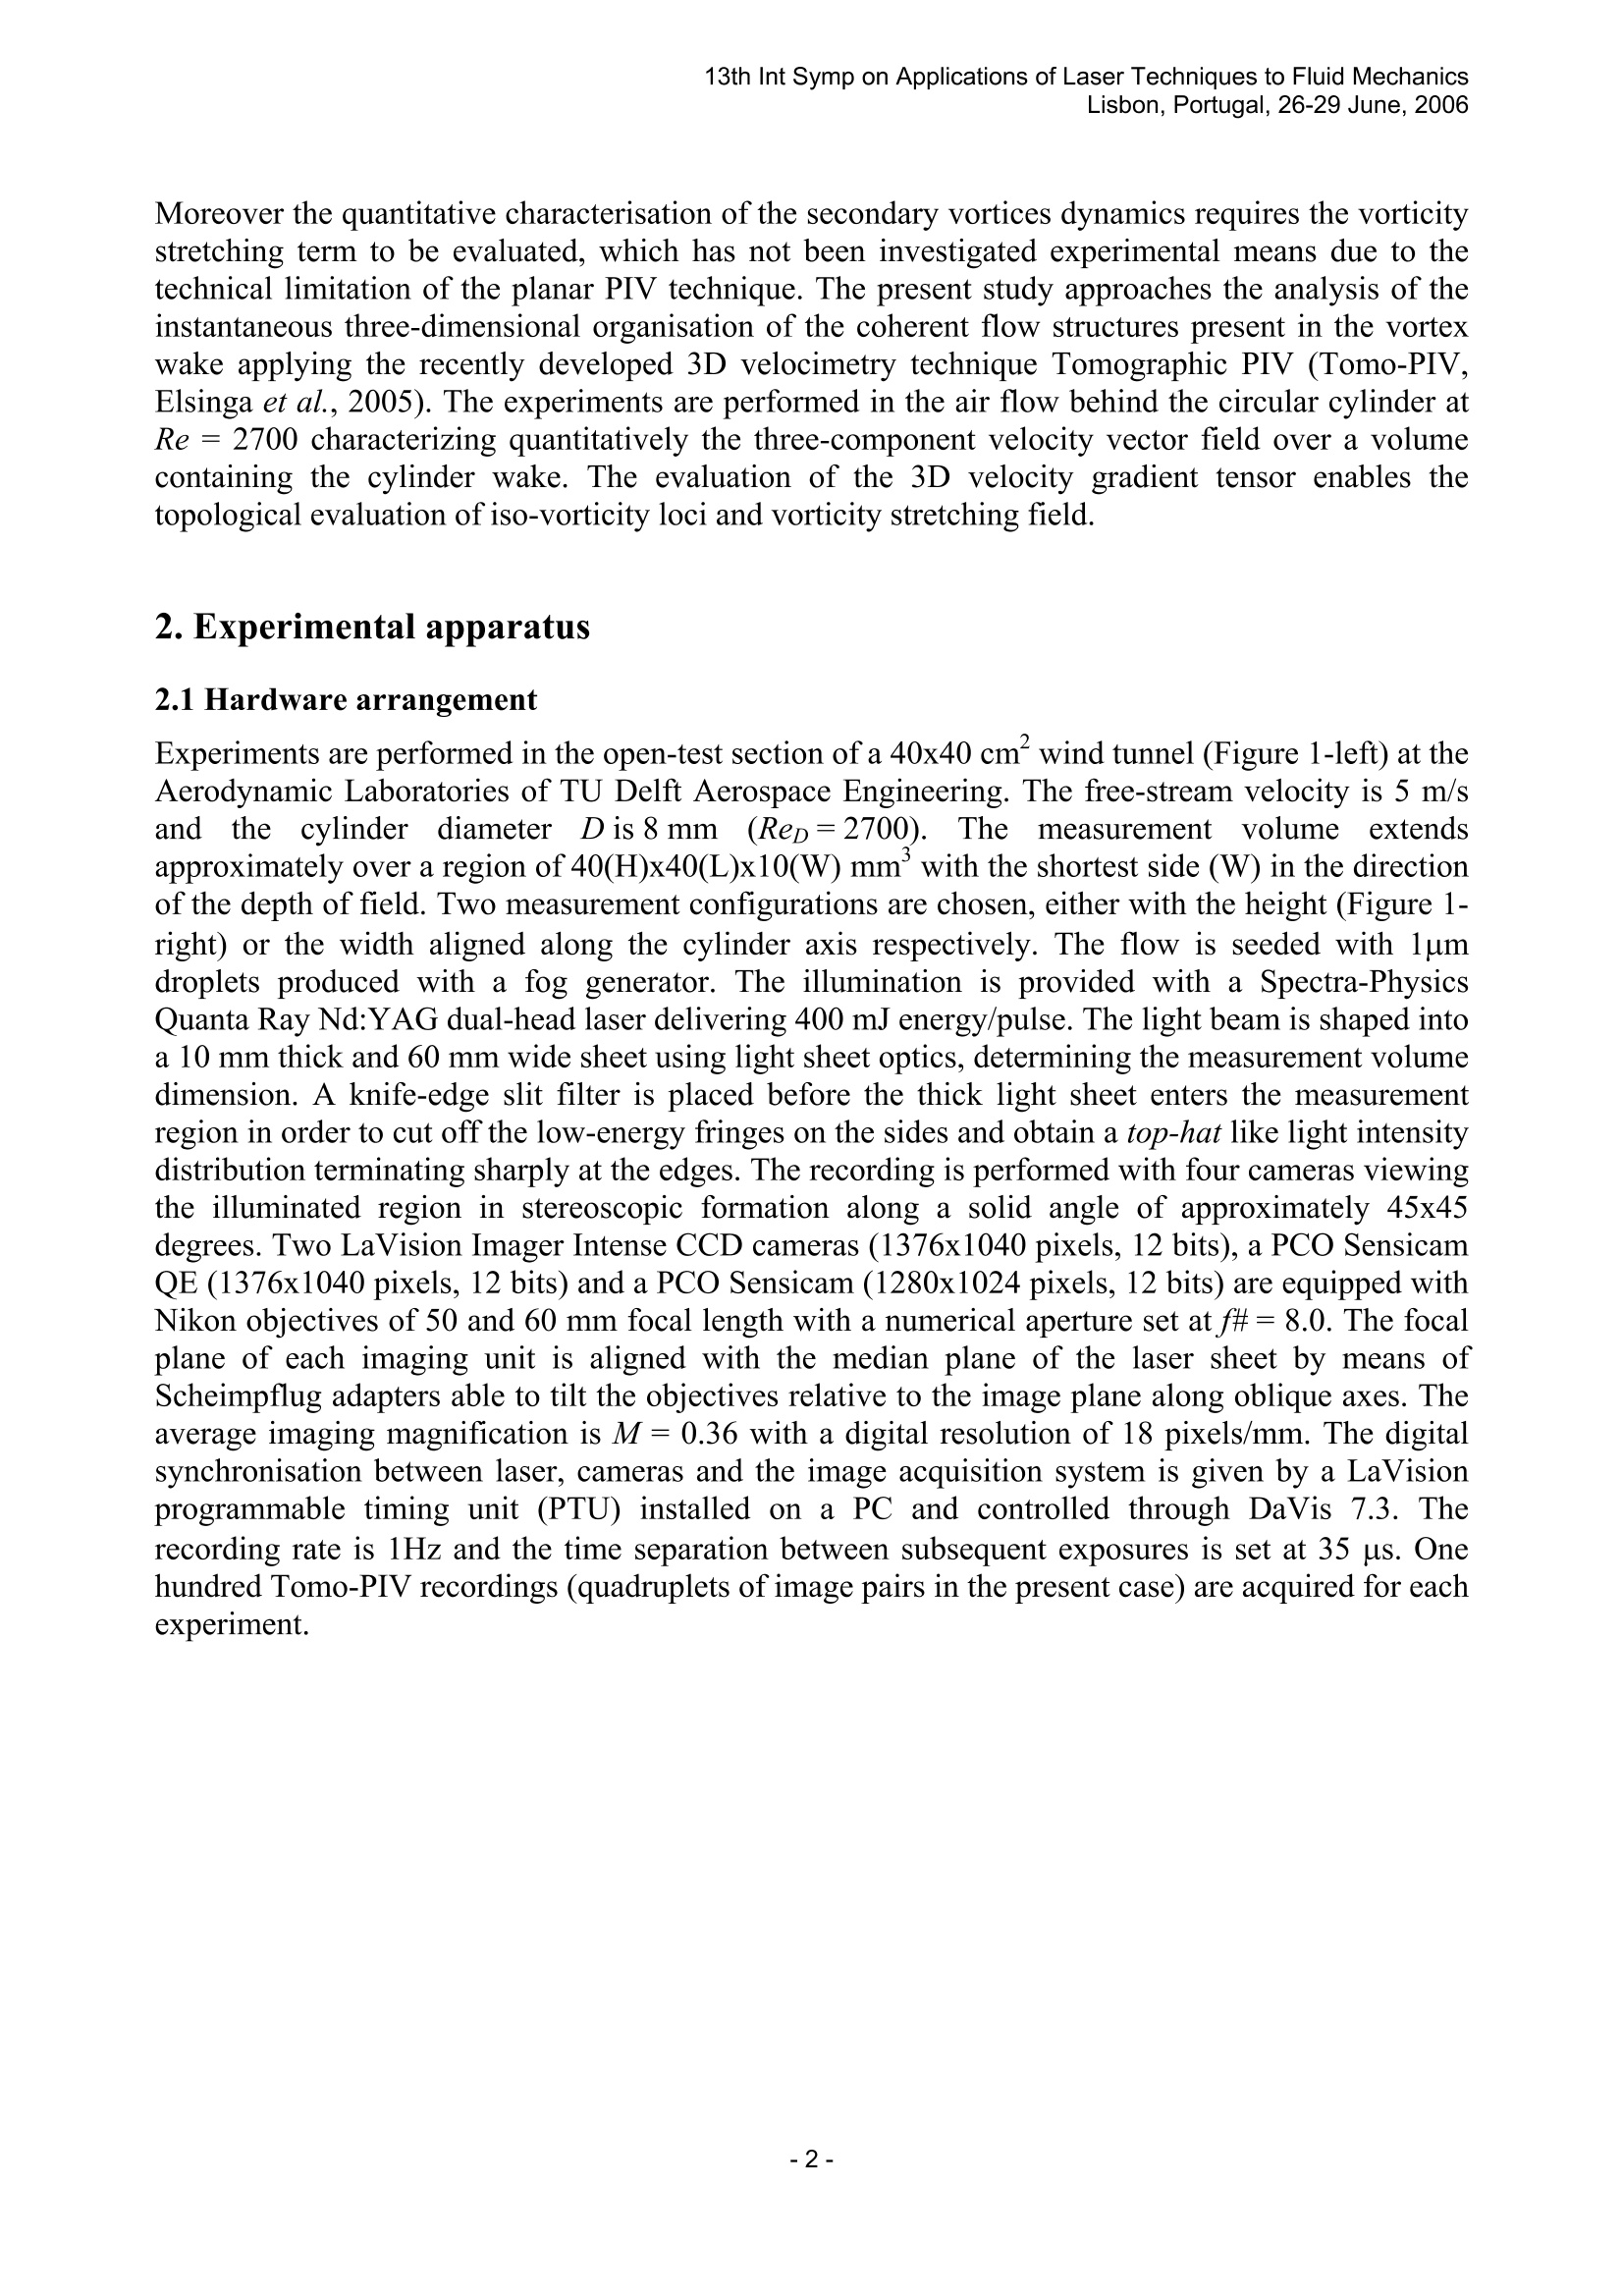
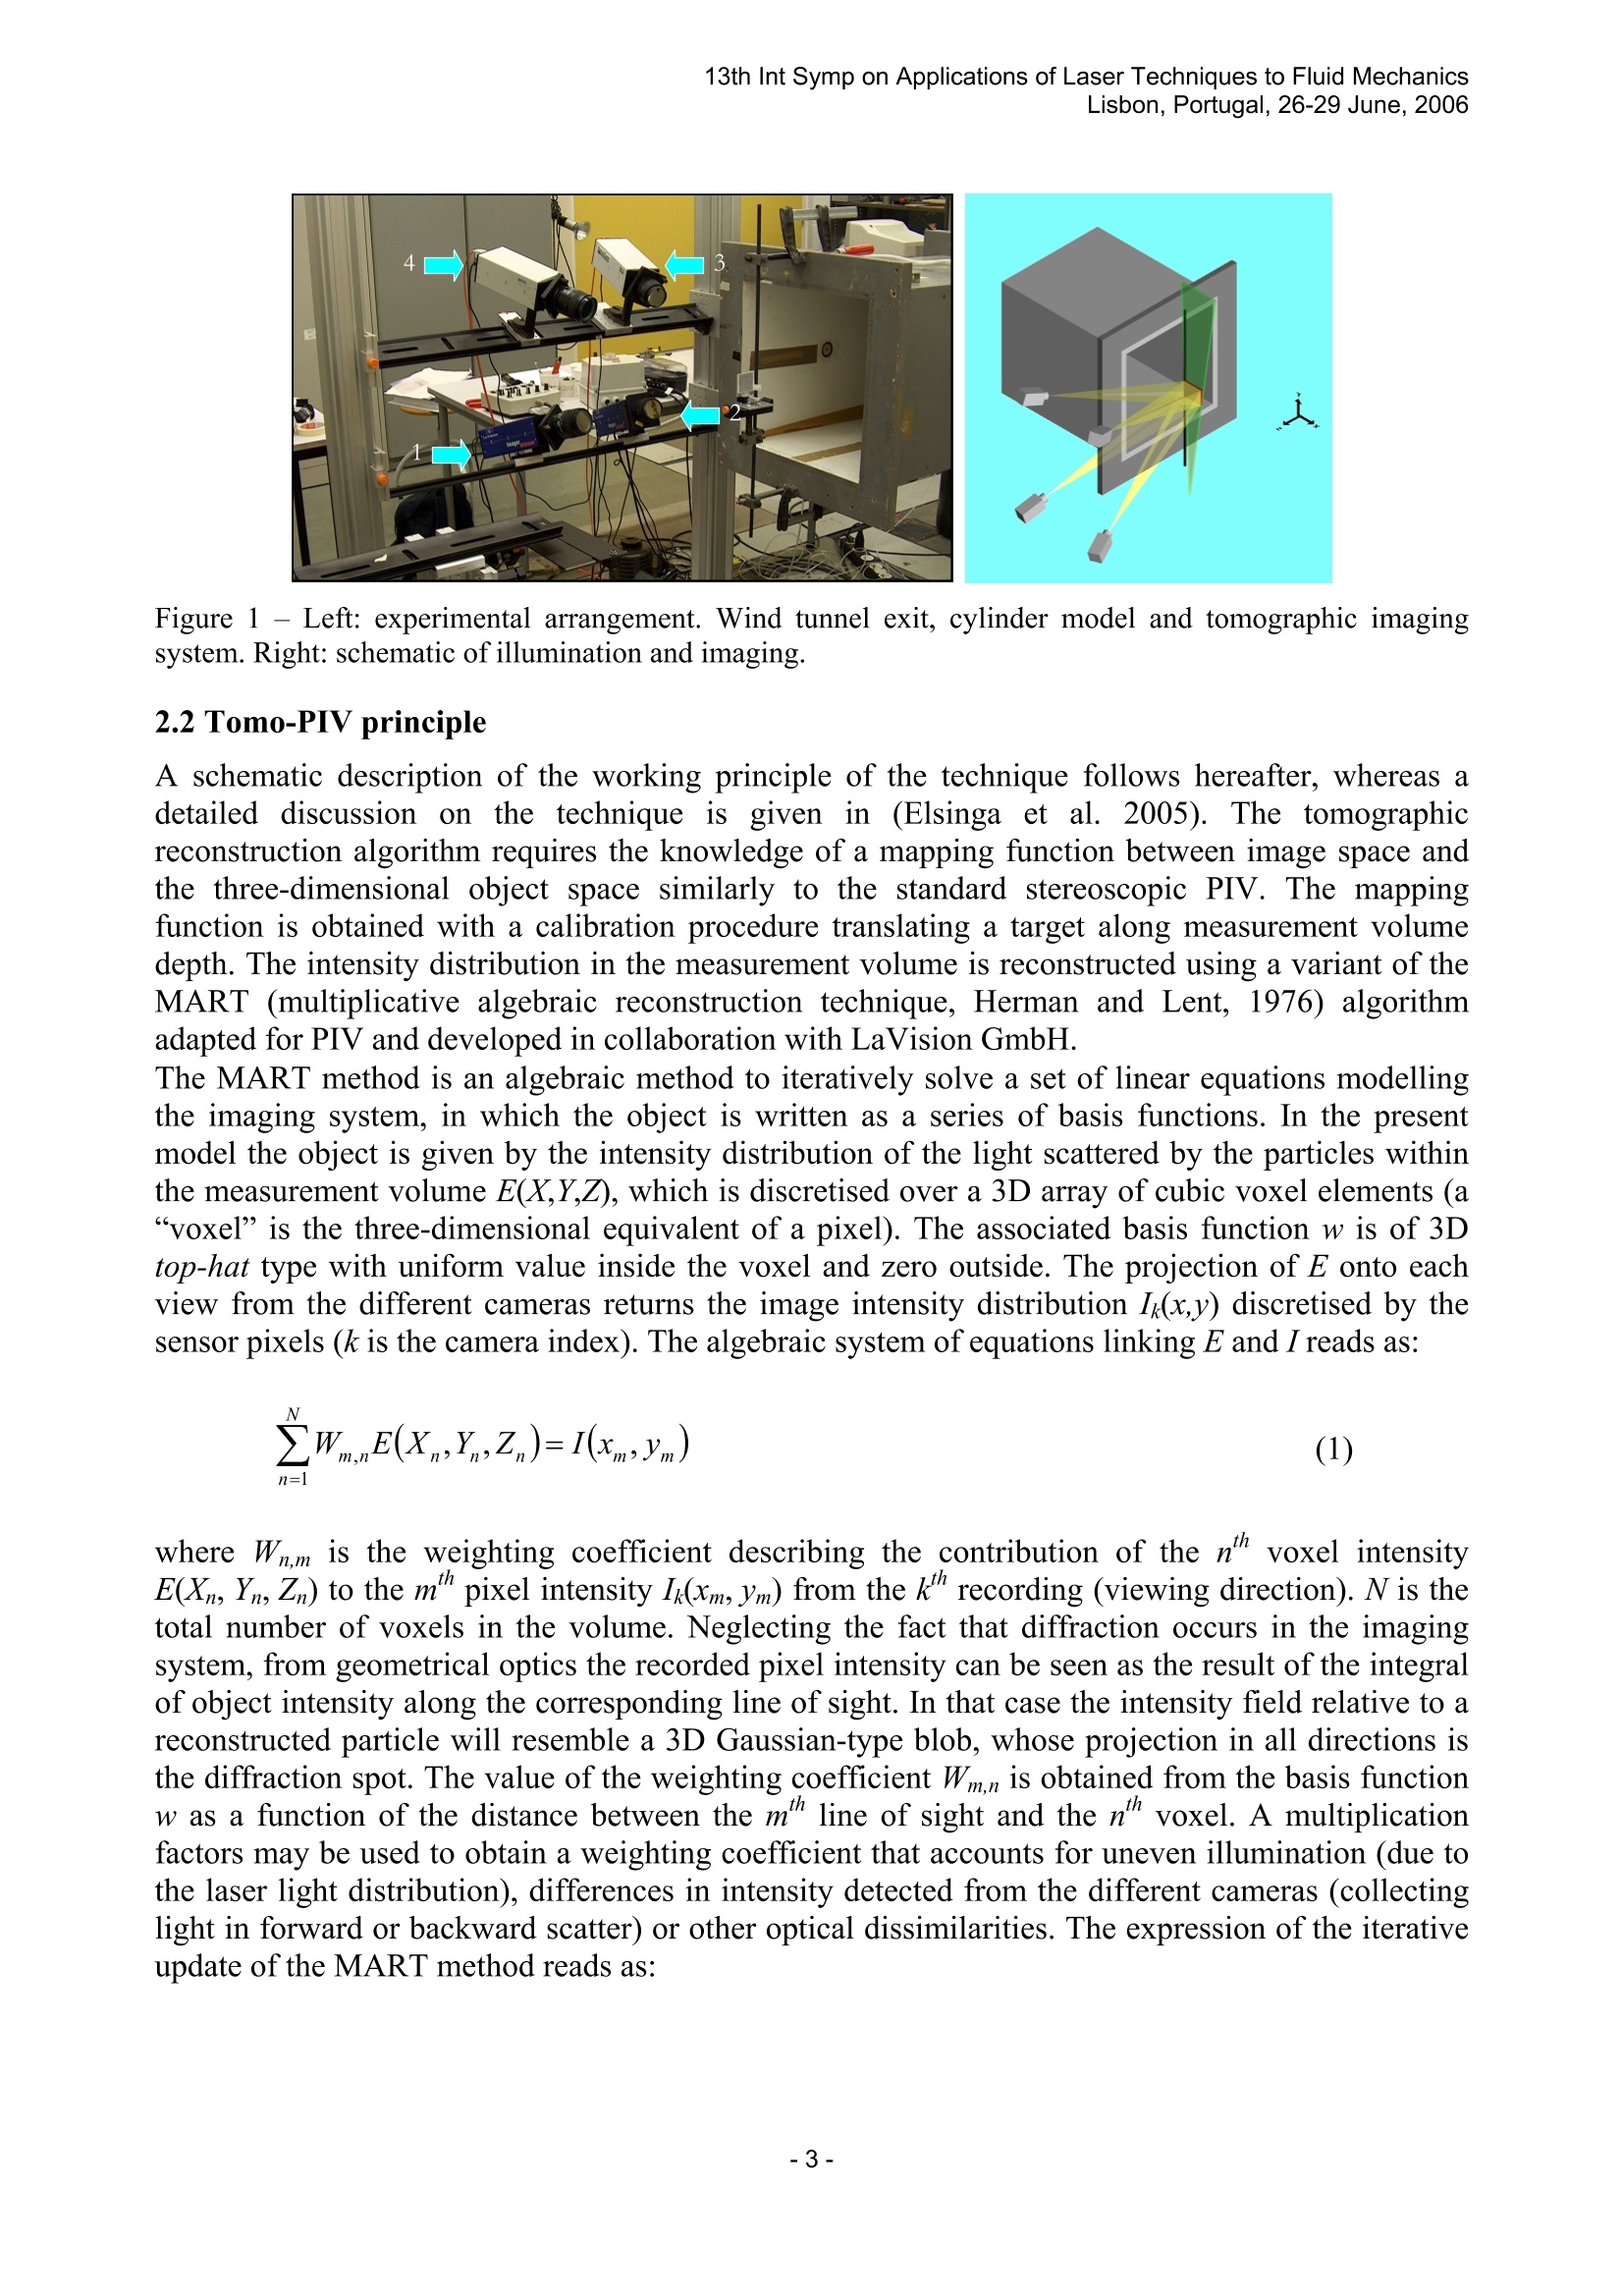
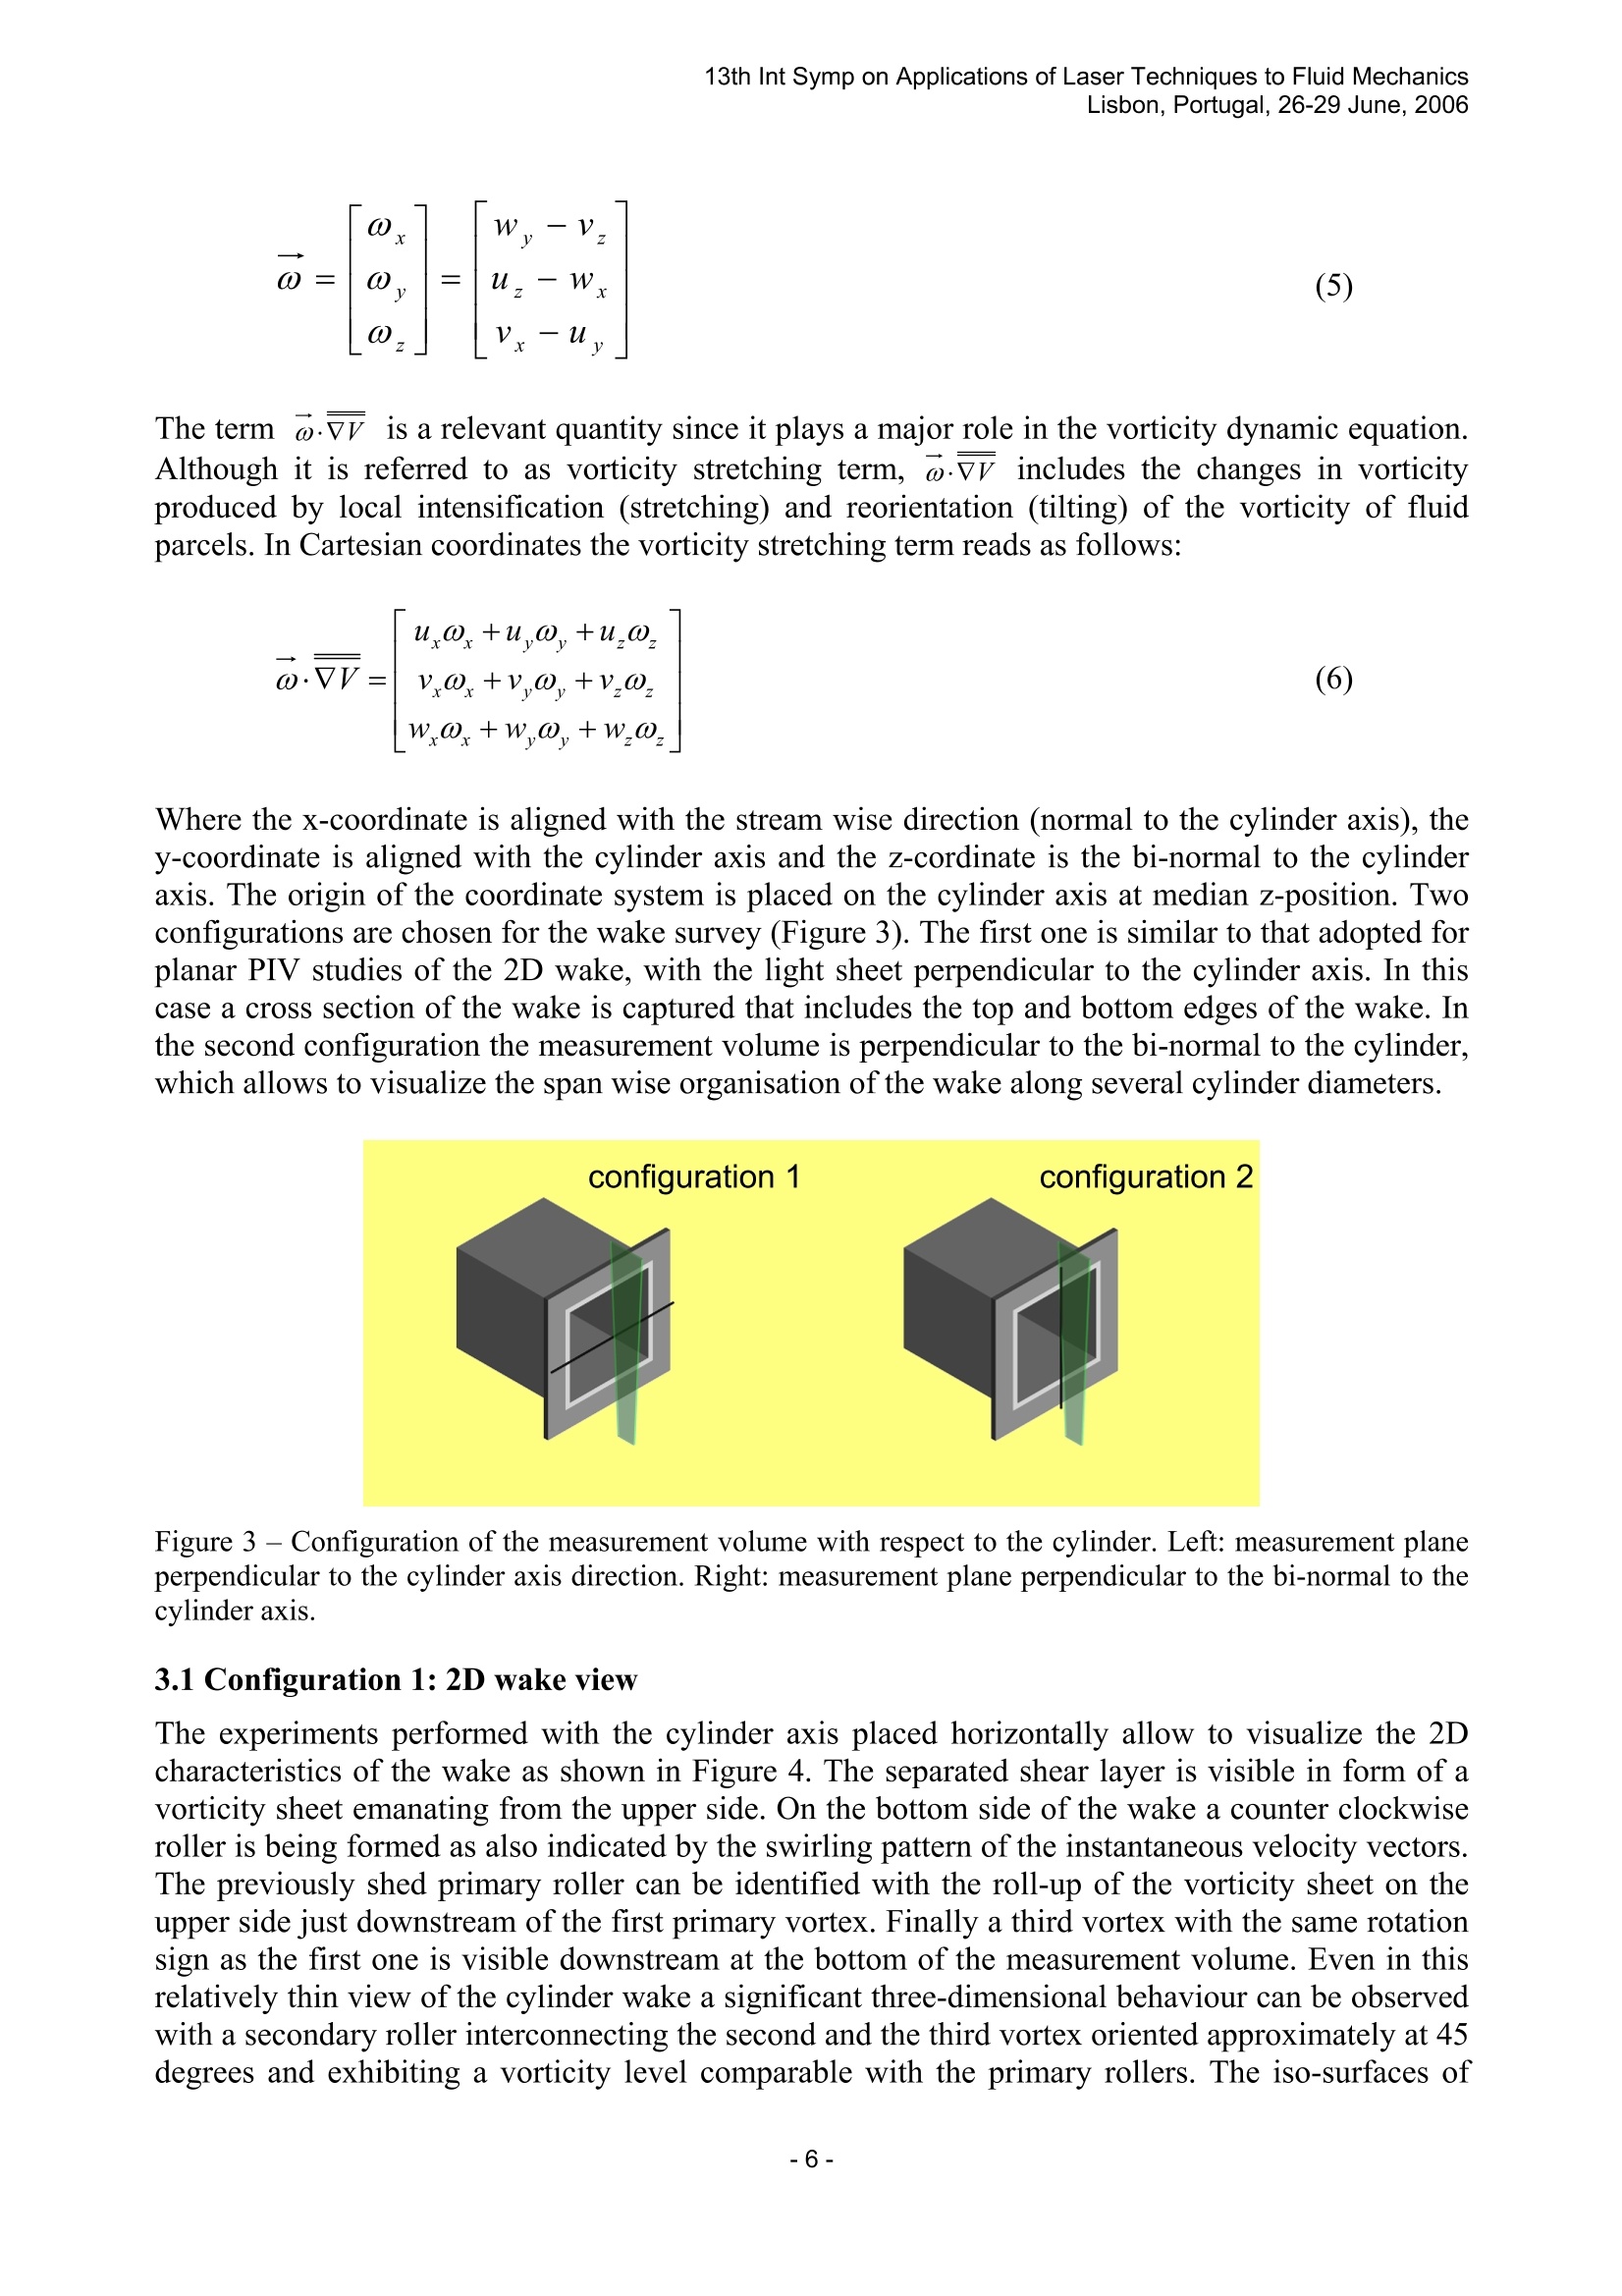
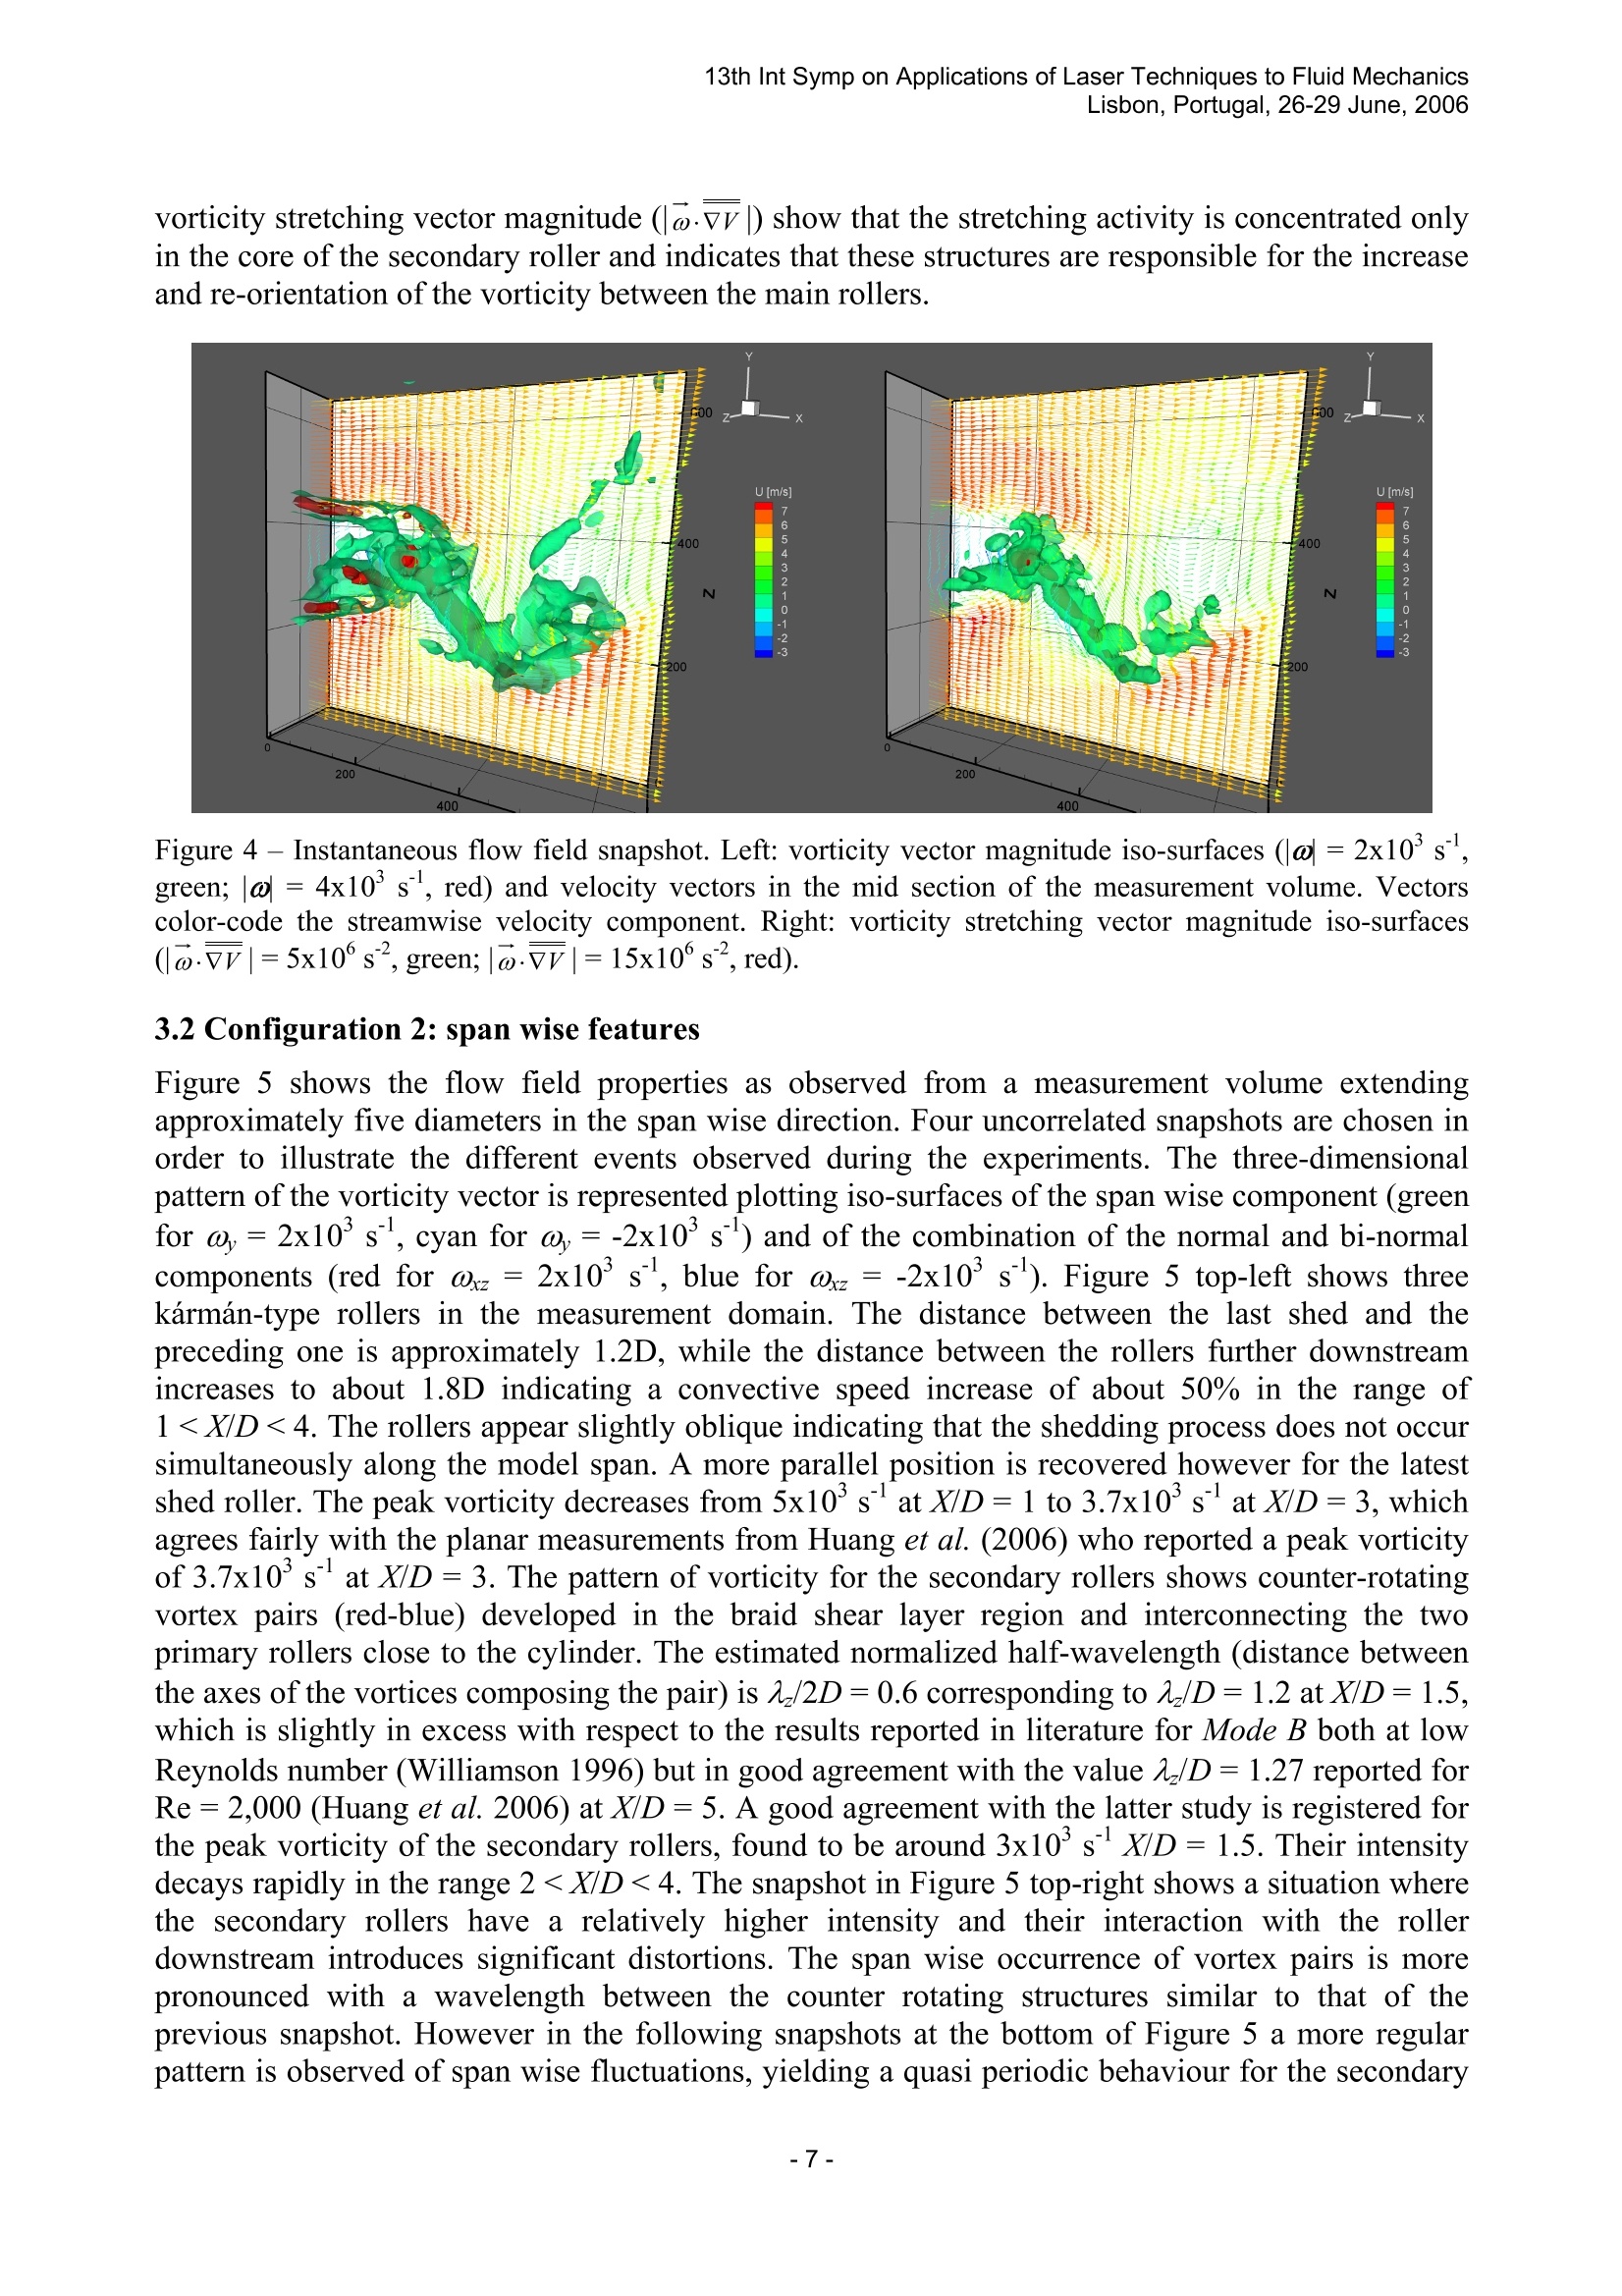
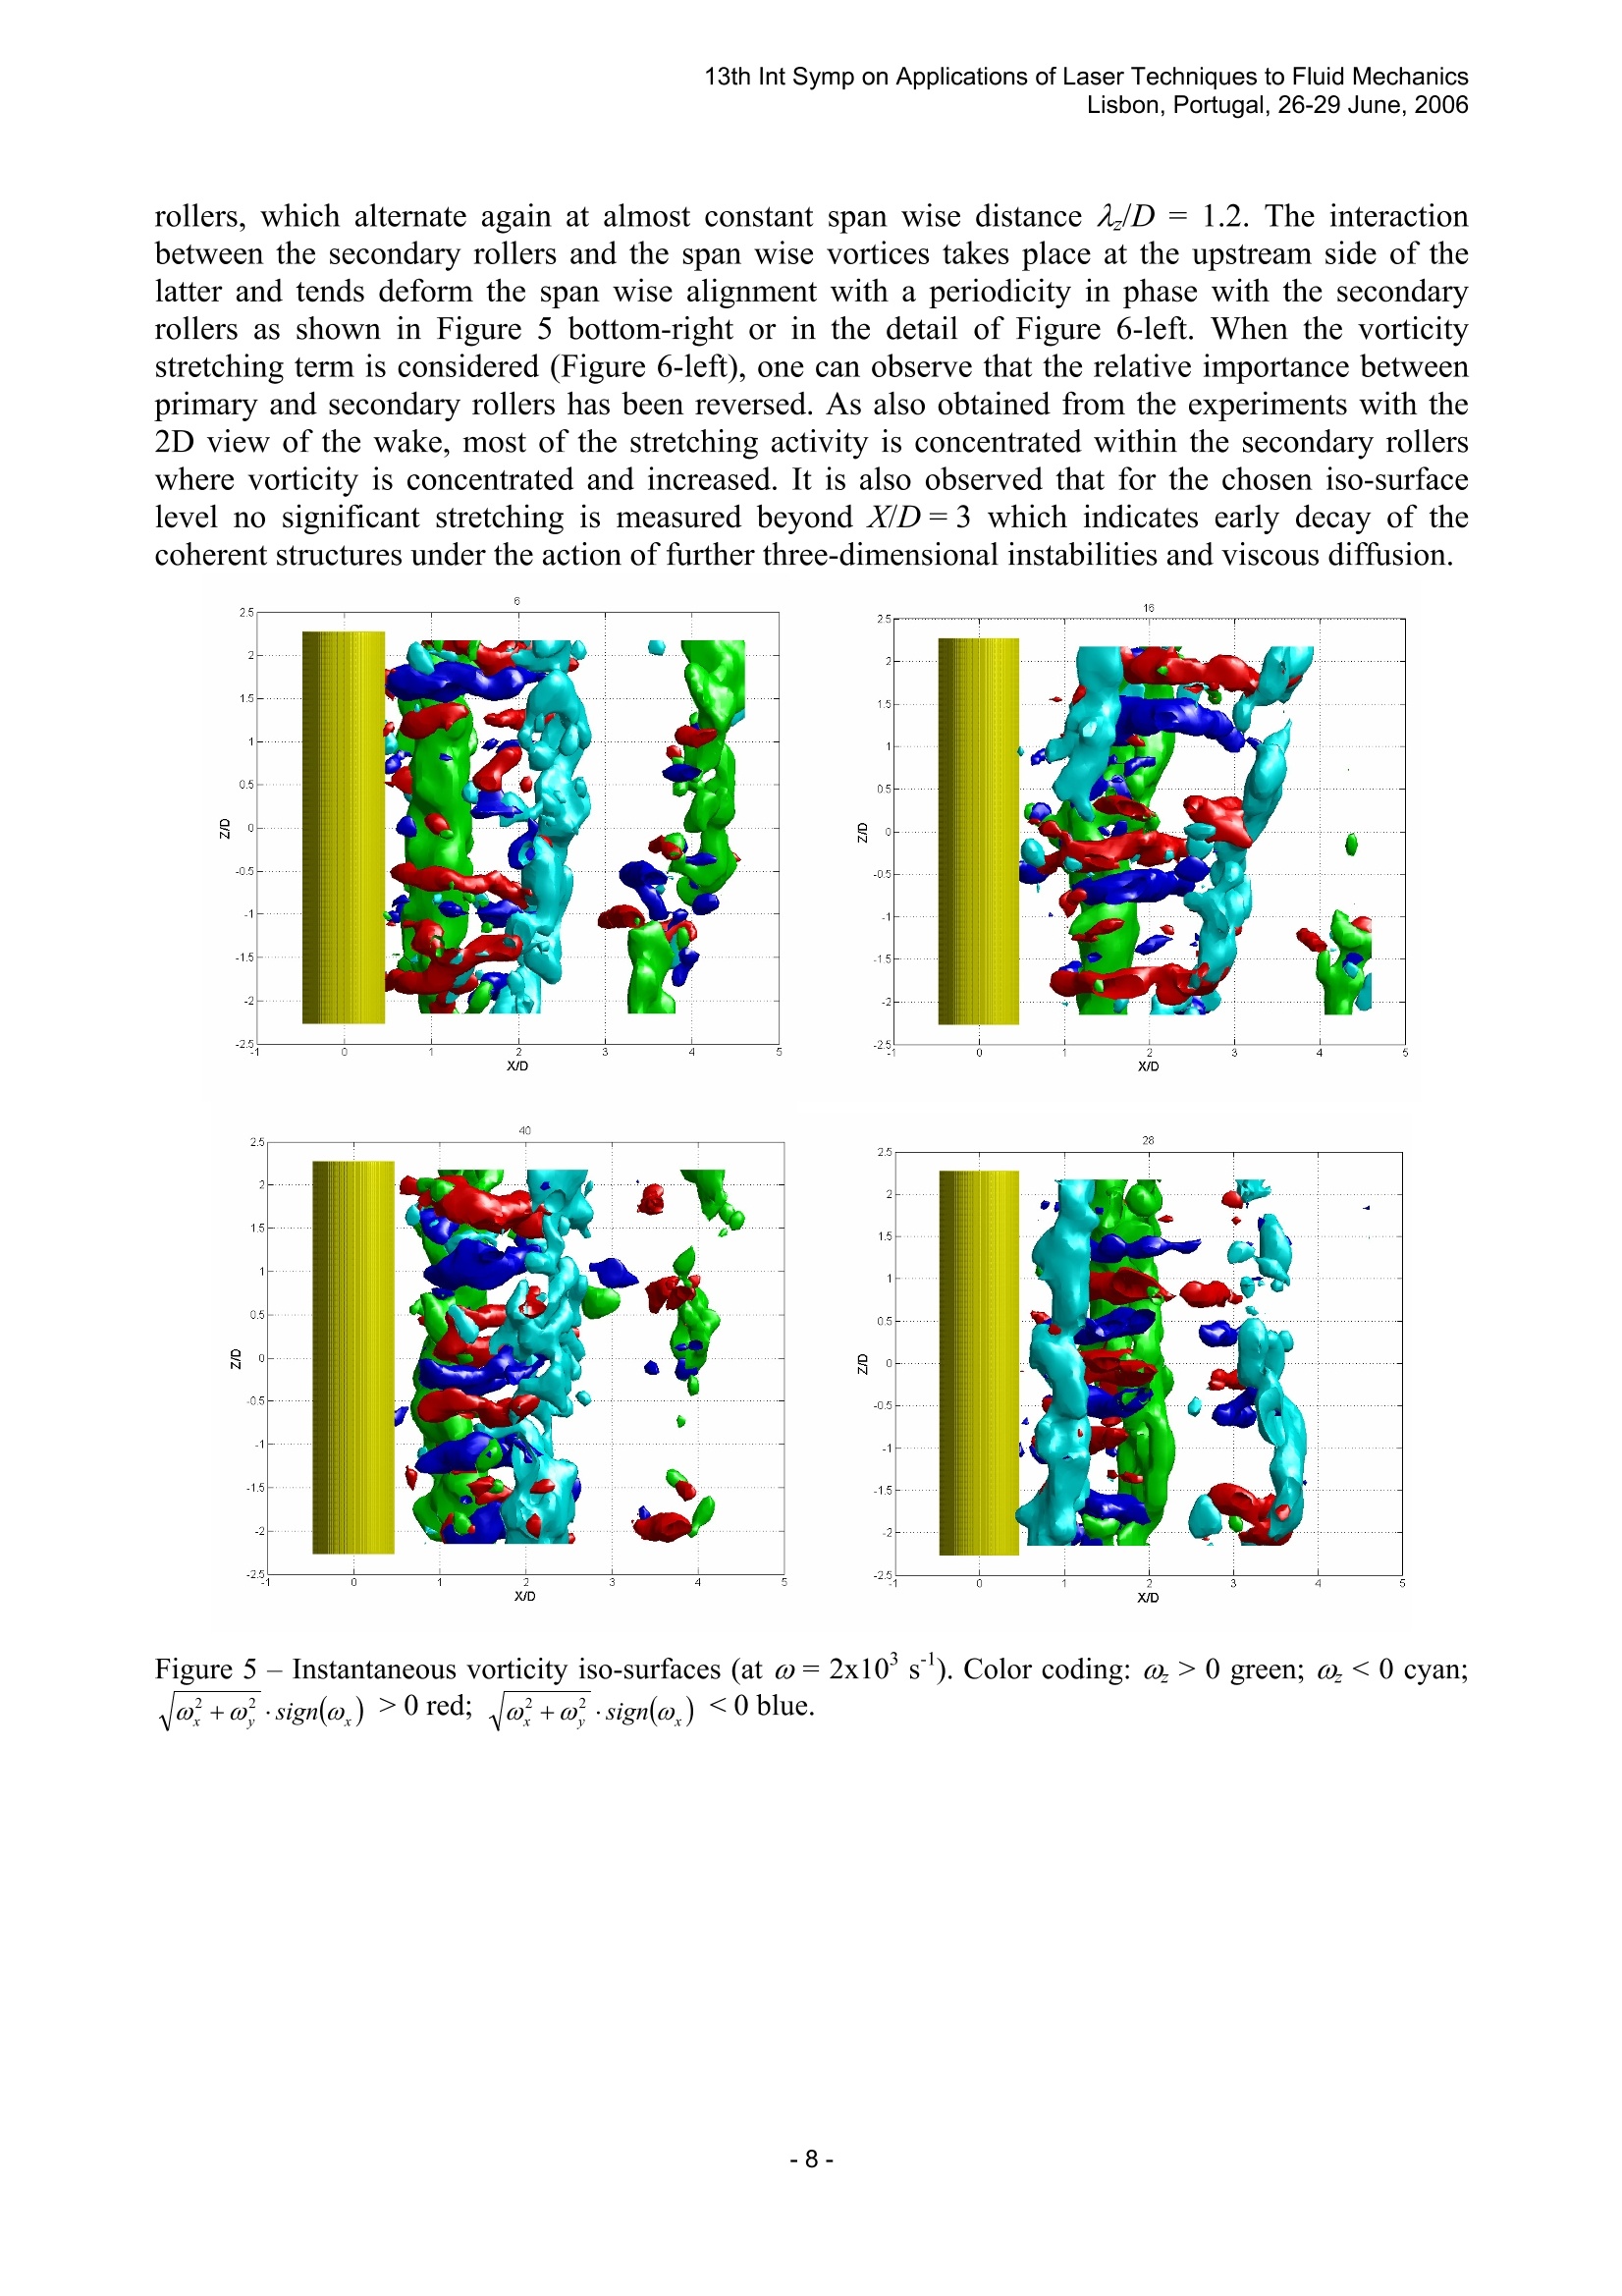
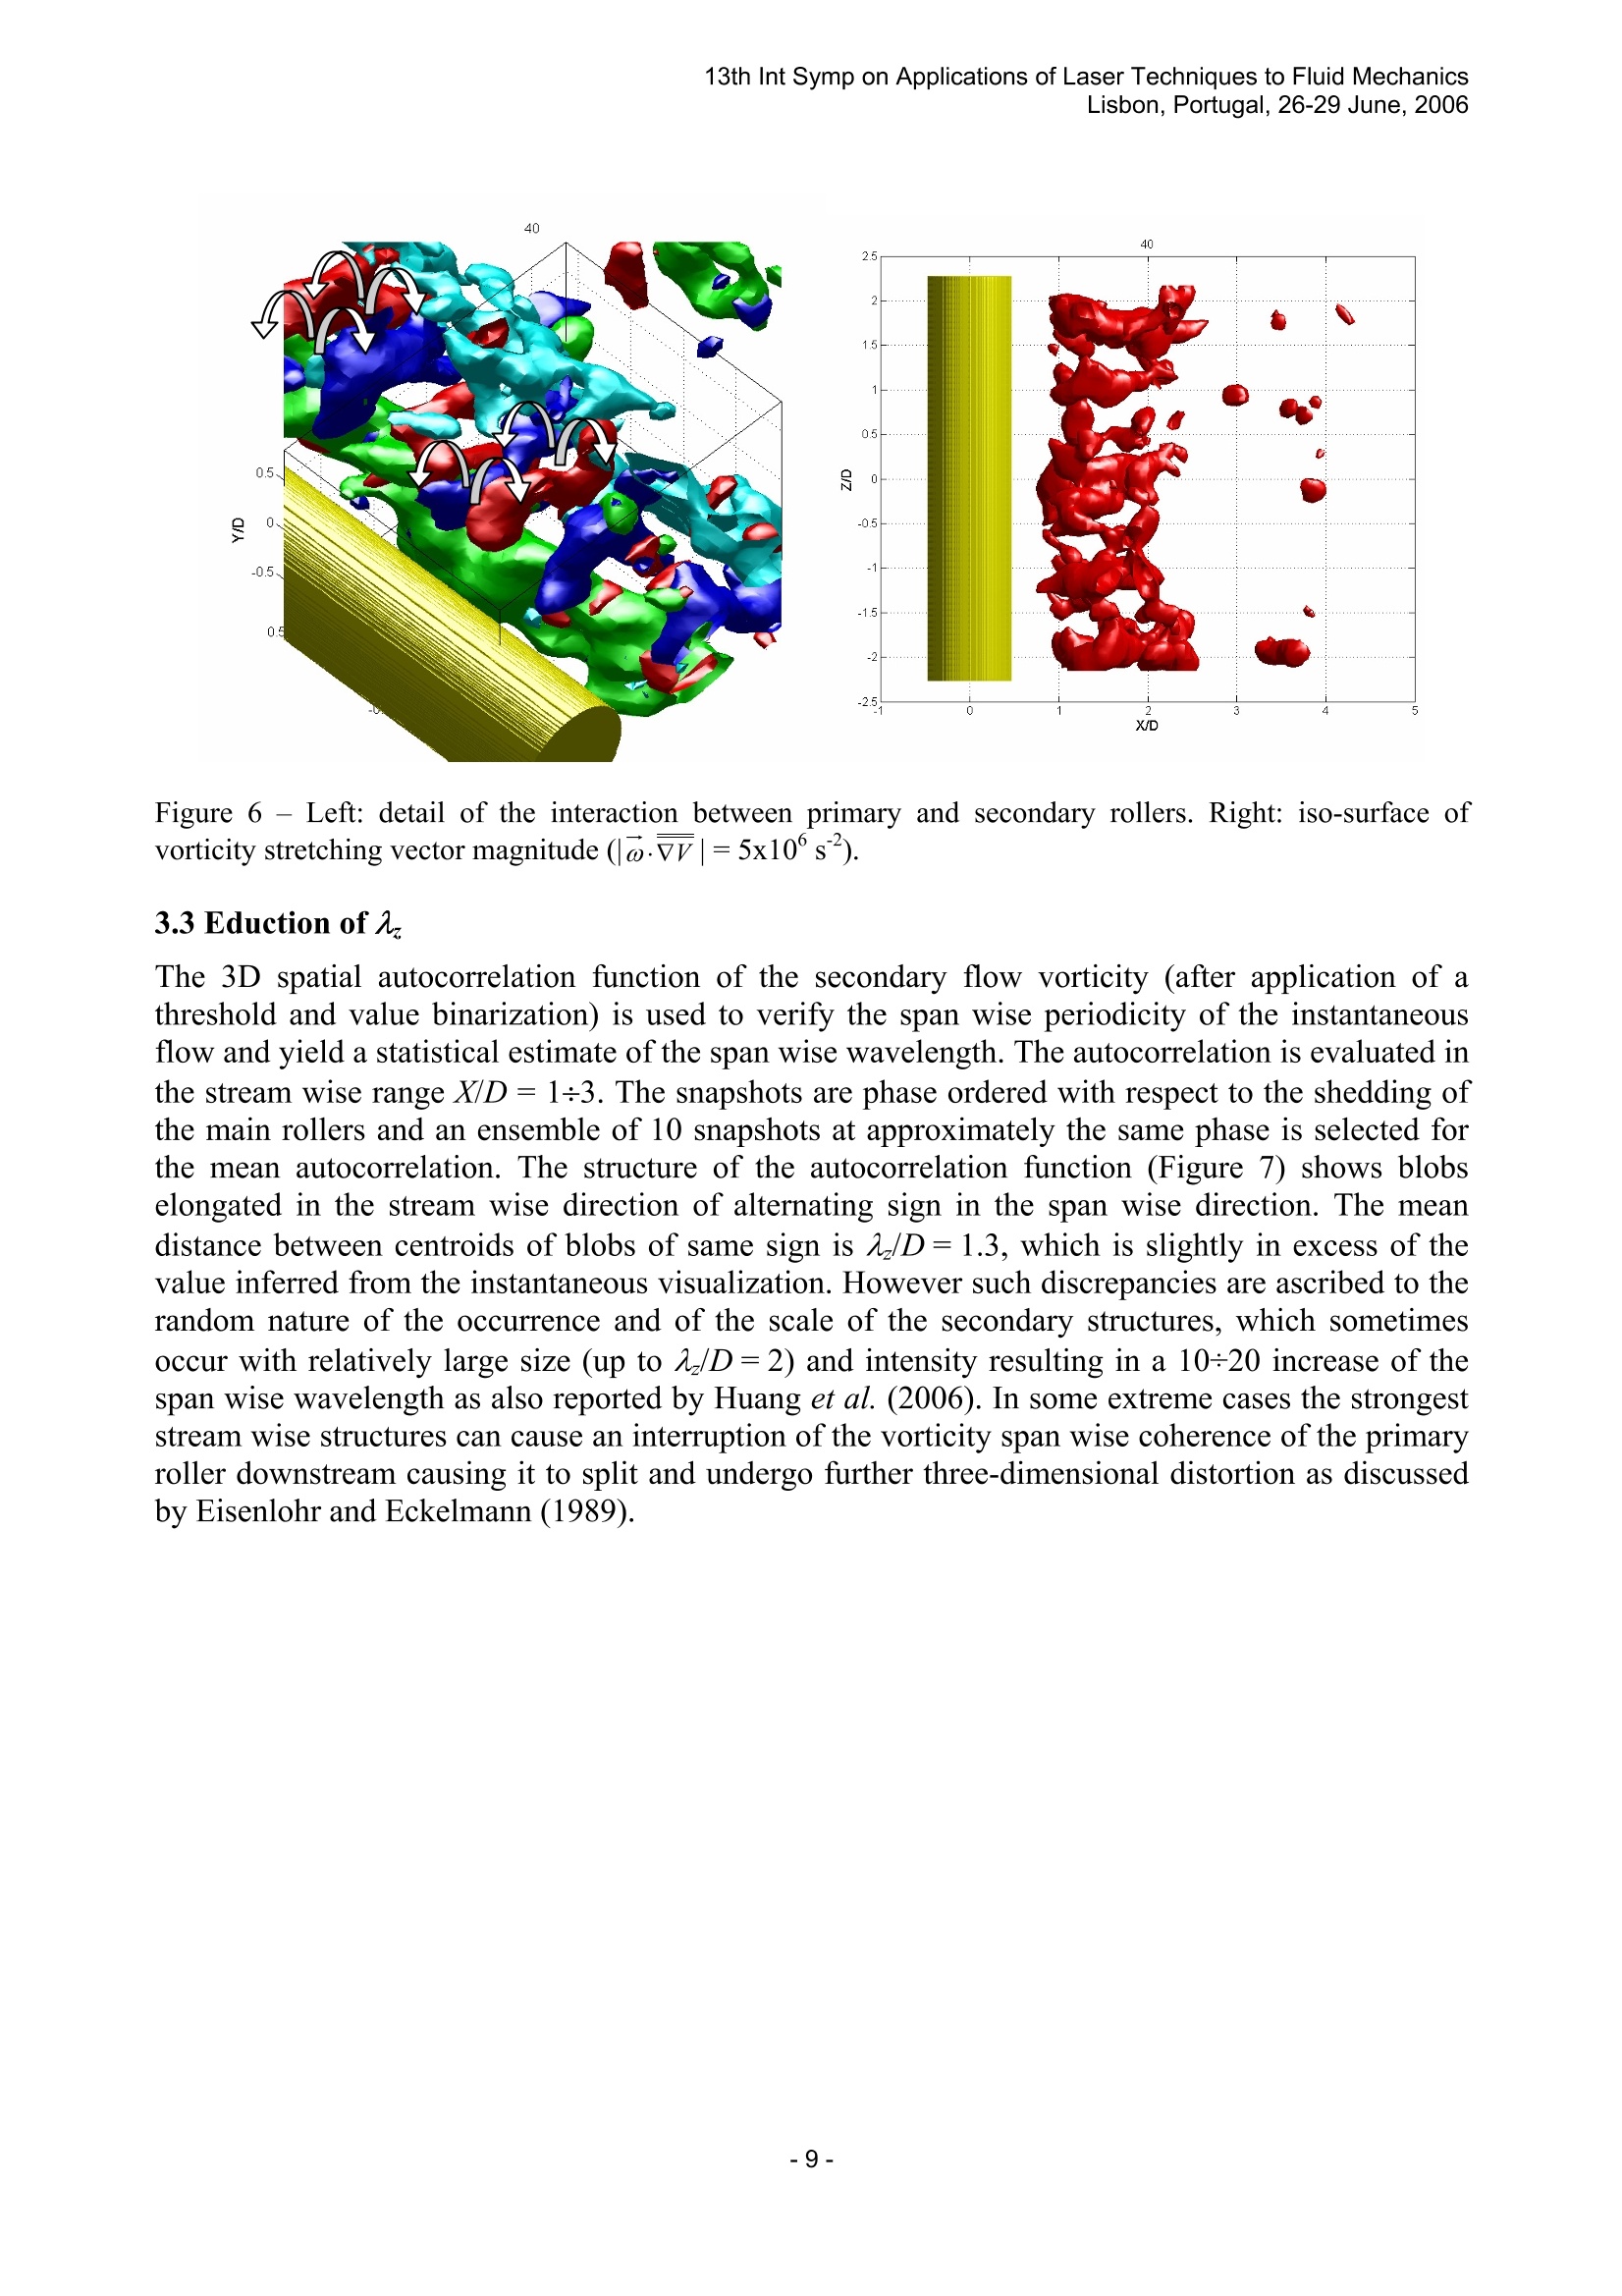
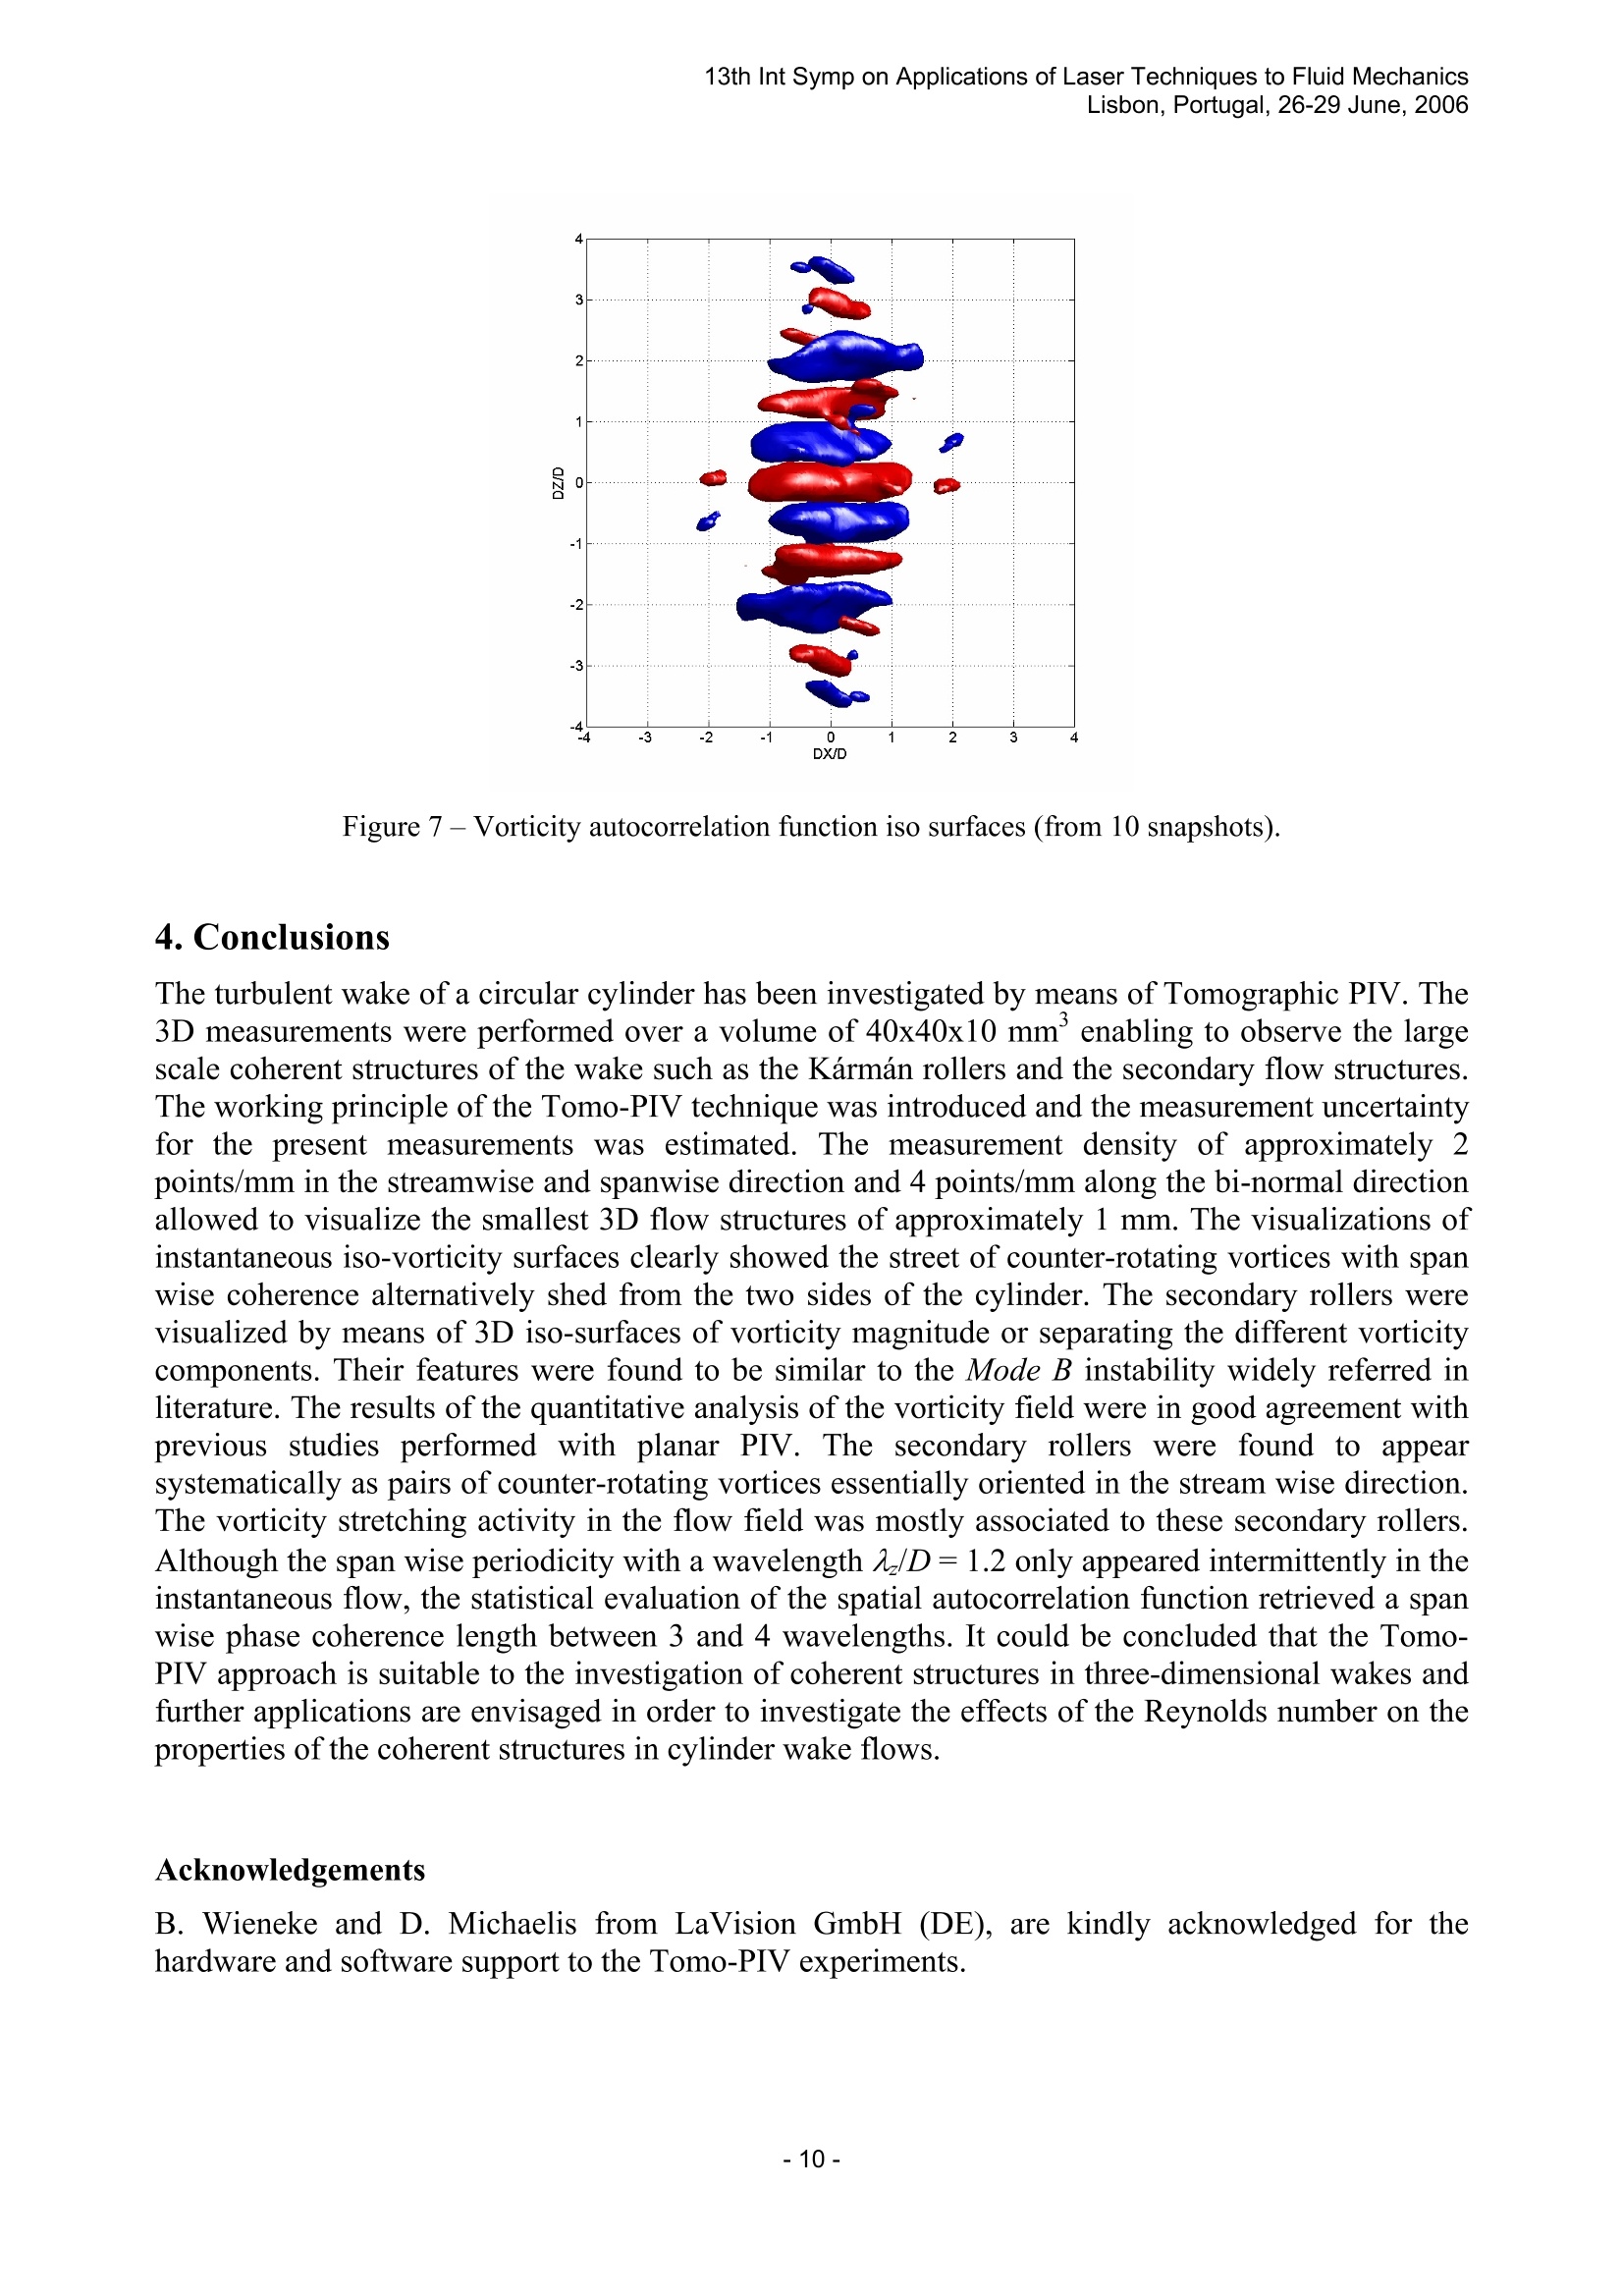
13th Int Symp on Applications of Laser Techniques to Fluid MechanicsLisbon, Portugal, 26-29 June, 2006 Investigation of 3-D Coherent Structures in the Turbulent Cylinder Wake usingTomo-PIV Fulvio Scarano, Gerrit E. Elsinga , Elisabetta Bocci, Bas W. van Oudheusden AbstractThe wake of a circular cylinder at Re =2700 is investigated by means of Tomographic PIV(Tomo-PIV), a recently developed three-dimensional velocimetry technique. The paper presents theprinciples of Tomo-PIV and discusses in details the implementation of the technique to the experimentalconditions. With a measurement volume of approximately 40x40x10 mmtwo configurations are chosen inorder to describe both the 2D wake features and the span wise organization of secondary rollers dominatingthe 3D flow organization. The present data allow to directly evaluate the measurement error imposing massconservation inside the volume (viz. solenoidal velocity field). The visualization of the wake instantaneousstructure is obtained by means of vorticity vector magnitude iso-surfaces, or decomposing the vorticity in thespan wise and stream-wise(normal)/bi-normal component, which return the separate contribution of theKarman rollers and the interconnecting structures between them respectively. The properties of thesecondary rollers are given in terms of span wise wavelength, peak vorticity, vorticity stretching and theirsize and shape. A value of the span wise wavelength A/D=1.2 is recurring and the rollers organization intopairs is found to be similar to the instability Mode B occurring in lower Reynolds number wakes investigatedwith previous studies. 1. Introduction The transition from the two-dimensional vortex shedding regime behind circular cylinders to three-dimensional flow governed by the Reynolds number has been investigated extensively especially atReynolds numbers in the order of 10+ 10'. The earliest 3D transition is associated to the inceptionof vortex loops in the main rollers around Re = 190, which distort the primary rollers with aspanwise wavelength a between 3 and 4 diameters (Mode A, Williamson and Roshko, 1990).Increasing the Reynolds number to about 250, a transition from Mode A (vortex loops) to Mode B(stream-wise vortex pairs, Williamson, 1996) was observed. These two modes were identified asthe two dominant modes for the three-dimensional organisation of coherent structures in the 3Dcylinder wake regime. In particular Mode B is characterised by a shorter span wise wavelength(A/D=1 between counter-rotating stream-wise rollers). The application of PIV allowed to performquantitative analysis of the secondary vortices. Brede et al. (1996) obtained A/D =4.5 for Mode Aand confirmed 1/D=1.0 for Mode B. At Reynolds numbers exceeding 10 the interaction betweenthe streamwise and the Karmán rollers has been investigated by Muchmore and Ahmed (1993) whovisualised mushroom shaped structures interconnecting the span wise rollers by means of planarlaser fluorescence. A reecceenntt PPIIVV survey along orthogonal planes performed in the rangeRe=2,000-10,000 by Huang et al. (2006) showed a more chaotic wake structure, ascribed to thetransition occurring within the separated shear layers. The full three-dimensional wake structure cannowadays be simulated with DNS as performed by Thompson et al., 1994 however experimentaldata is lacking for a comparison of the full three-dimensional wake structure and even the latestplanar velocimetry surveys do not render the instantaneous 3D organisation of the wake. From theabove experimental studies, a number of issues are not yet elucidated. In particular at higherReynolds numbers, the secondary vortices model is based on planar cross sections and theinstantaneous three dimensional organisation of the flow field has not been sufficiently understood. Moreover the quantitative characterisation of the secondary vortices dynamics requires the vorticitystretching term to be evaluated, which has not been investigated experimental means due to thetechnical limitation of the planar PIV technique. The present study approaches the analysis of theinstantaneous three-dimensional organisation of the coherent flow structures present in the vortexwake applying the recently developed 3D velocimetry technique Tomographic PIV (Tomo-PIV,Elsinga et al., 2005). The experiments are performed in the air flow behind the circular cylinder atRe =2700 characterizing quantitatively the three-component velocity vector field over a volumecontaining the cylinder wake. The evaluation of the 3D velocity gradient tensor enables thetopological evaluation of iso-vorticity loci and vorticity stretching field. 2. Experimental apparatus 2.1 Hardware arrangement Experiments are performed in the open-test section of a 40x40 cm’wind tunnel (Figure 1-left) at theAerodynamic Laboratories of TU Delft Aerospace Engineering. The free-stream velocity is 5 m/sand the cylinder diameter D is 8 mm(Rep=2700). Thee measurementvolume extendsapproximately over a region of 40(H)x40(L)x10(W) mm’with the shortest side (W) in the directionof the depth of field. Two measurement configurations are chosen, either with the height (Figure 1-right) or the width aligned along the cylinder axis respectively. The flow is seeded with 1umdroplets produced with a fog generator. The illumination is provided with a Spectra-PhysicsQuanta Ray Nd:YAG dual-head laser delivering 400 mJ energy/pulse. The light beam is shaped intoa 10 mm thick and 60 mm wide sheet using light sheet optics, determining the measurement volumedimension. A knife-edge slit filter is placed before the thick light sheet enters the measurementregion in order to cut off the low-energy fringes on the sides and obtain a top-hat like light intensitydistribution terminating sharply at the edges. The recording is performed with four cameras viewingthe illuminated region in stereoscopic formation along a solid angle of approximately 45x45degrees. Two LaVision Imager Intense CCD cameras (1376x1040 pixels, 12 bits), a PCO SensicamQE (1376x1040 pixels, 12 bits) and a PCO Sensicam (1280x1024 pixels, 12 bits) are equipped withNikon objectives of 50 and 60 mm focal length with a numerical aperture set at f#= 8.0. The focalplane of each imaging unit is aligned with the median plane of the laser sheet by means ofScheimpflug adapters able to tilt the objectives relative to the image plane along oblique axes. Theaverage imaging magnification is M =0.36 with a digital resolution of 18 pixels/mm. The digitalsynchronisation between laser, cameras and the image acquisition system is given by a LaVisionprogrammable timing unit (PTU) installed on a PC and controlled through DaVis7.3. Therecording rate is 1Hz and the time separation between subsequent exposures is set at 35 us. Onehundred Tomo-PIV recordings (quadruplets of image pairs in the present case) are acquired for eachexperiment. Figure 1 - Left: experimental arrangement. Wind tunnel exit, cylinder model and tomographic imagingsystem. Right: schematic of illumination and imaging. 2.2 Tomo-PIV principle A schematic description of the working principle of the technique follows hereafter, whereas adetailed discussion on the technique is given in (Elsinga et al. 2005). The tomographicreconstruction algorithm requires the knowledge of a mapping function between image space andthe three-dimensional object space similarly to the standard stereoscopic PIV. The mappingfunction is obtained with a calibration procedure translating a target along measurement volumedepth. The intensity distribution in the measurement volume is reconstructed using a variant of theMART (multiplicative algebraic reconstruction technique, Herman and Lent, 1976) algorithmadapted for PIV and developed in collaboration with LaVision GmbH. The MART method is an algebraic method to iteratively solve a set of linear equations modellingthe imaging system, in which the object is written as a series of basis functions. In the presentmodel the object is given by the intensity distribution of the light scattered by the particles withinthe measurement volume E(X,Y,Z), which is discretised over a 3D array of cubic voxel elements (a“voxel" is the three-dimensional equivalent of a pixel). The associated basis function w is of 3Dtop-hat type with uniform value inside the voxel and zero outside. The projection of E onto eachview from the different cameras returns the image intensity distribution I(x,y) discretised by thesensor pixels (k is the camera index). The algebraic system of equations linking E and I reads as: where Wrm is the weighting coefficient describing the contribution of the nh voxel intensityE(X,Y,Z) to the m" pixel intensity I(xm, ym) from the k"recording (viewing direction). N is thetotal number of voxels in the volume. Neglecting the fact that diffraction occurs in the imagingsystem, from geometrical optics the recorded pixel intensity can be seen as the result of the integralof object intensity along the corresponding line of sight. In that case the intensity field relative to areconstructed particle will resemble a 3D Gaussian-type blob, whose projection in all directions isthe diffraction spot. The value of the weighting coefficient Wm,n is obtained from the basis functionw as a function of the distance between the m" line of sight and the n" voxel. A multiplicationfactors may be used to obtain a weighting coefficient that accounts for uneven illumination (due tothe laser light distribution), differences in intensity detected from the different cameras (collectinglight in forward or backward scatter) or other optical dissimilarities. The expression of the iterativeupdate of the MART method reads as: \uWm, where u is a scalar coefficient intended as relaxation parameter. The magnitude of the update isdetermined by the ratio between the measured pixel intensity I(xm,)m) and the projection of theobject at the current iteration. The weighting W function at the exponent ensures that only theelements in E(X,Y,Z) affecting the m" pixel are updated. Furthermore the MART scheme requiresthat I and E are both definite positive. The reconstruction performance of the MART a;gorithapplied to PIV recordings has been assessed by means of synthetic 3D particle field simulation(Elsinga et al. 2005). The simulation showed that the coefficient obtained correlating thereconstructed intensity field with the exact distribution is above 0.9 for a four views system with aseeding level of approximately 0.05 particles per pixel, which has been chosen as the workingconfiguration for the present experiments. The actual measurement volume of 40x40x10 mm’is discretised over 730x730x184 voxels at aspatial resolution of 18 voxels/mm (pixel-to-voxel ratio of 1). The reconstructed volume size is41x41x10 mm. The seeding density in the individual images is approximately 0.05 ppp, yielding5x10" recorded particle images, which are reconstructed in the volume. The DaVis 7.3 software isused for the tomographic reconstruction. Approximately 1 hour is required for the reconstruction ofone 3D object applying the MART algorithm with 5 iterations. Figure 2 - Left: cross sectionof the reconstructed light intensity distribution (left). Coordinates are in voxelunits, axes are not at scale. Right: reconstructed particle field distribution. Red and yellow indicate the firstand second exposure respectively. Blob size is proportional to the square-root of the particle intensity. An indicator of the quality of reconstruction in real experimental conditions is given by the ratio oflight intensity within the illuminated region (signal) and that obtained outside of the reconstructedvolume, which is representative of the reconstruction process noise. Figure 2-left shows a crosssection of the light intensity in the reconstructed volume. The reconstruction domain slightlyexceeds the illuminated one in order to avoid that spurious light intensity reconstructed at thedomain boundary affects the reconstruction in the illuminated region. The light intensity profilereturns a reconstruction signal-to-noise ratio of 3 in the present experiment. Figure 2-right shows aschematic 3D representation of the reconstructed intensity field by plotting spherical blobs in thethree-dimensional space where an intensity maximum is detected in the reconstructed scalar field.Yellow and red blobs correspond to the particles recorded at the first and second exposurerespectively. A visual inspection returns particle pairs in many cases, however also a significant number of unpaired particles is observed, which is ascribed to the limited reconstruction accuracyassociated to the high seedin一1g density of the present experiments. The displacement occurring between the reconstructed 3D intensity fields E(t) and E(t+At) isevaluated by means of spatial cross correlation analysis. The normalized cross-correlation functionR(4X,AY,AZ) reads as: The analysis is performed with an iterative technique based on the WIDIM algorithm (Scarano andRiethmuller, 2000) extended to three dimensional intensity fields, where the interrogation boxes aredisplaced/deformed on the basis of the result from the previous interrogation. The intensity field ofthe deformed volume at the k+Iiteration is obtained from the original intensity and the predictorvelocity field according to the expression: Where va=(uvwa) reprreepsreesrents the particle pattern deformation field obtained at the khinterrogation. The interrogation box size is progressively decreased from 121x121x61 to 41x41x21voxels in order to increase the dynamic range and decrease the number of spurious vectors. A 75%overlap factor is applied between neighboring boxes returning a vector spacing of 0.55 mm alongheight and length and 0.28 mm along the width respectively. The overall measurement grid counts64x64x30 vectors. Data validation based on a signal-to-noise ratio minimum threshold of 1.2, andon the normalized median test with maximum threshold of2, (Westerweel and Scarano, 2005)returns approximately 4% spurious vectors. The computation is performed with a custom madesoftware in MATLAB environment and takes approximately 12 hours (five iterations). However apreliminary analysis performed with DaVis 7.3 could be performed within 2 hours. The measurement precision is estimated observing the spatial distribution of velocity divergenceVV=0u/Ox+0v/0y+ow/Oz, whichcan be evaluated entirelyi ni nthree-dimensions. Intheincompressible flow regime the velocity field is solenoidal therefore VV is virtually zeroeverywhere, therefore the divergence RMS fluctuations can be considered as a directevaluation of the measurement error affecting the differential quantities. The present experimentreturned=0.02 voxels/voxel, which may be assumed also as a conservative estimate for thesmallest measurable value of other differential quantities such as the vorticity vector. It wasestimated that with the measured vorticity measured range of o0f. 205.25 voxels/voxel yieldsameasurement uncertainty of about 8%. However, the uncertainty on the measured velocity is lower,approximately 1% considering that the smallest displacement is determined within 0.05 pixels andthe maximum range is about 4 pixels. 3.Results The experimental results are shown terms of velocity vectors spatial distribution.Thevisualisation of the coherent structures is made by means of iso-surfaces of the vorticity vector0. The term ω·vv is a relevant quantity since it plays a major role in the vorticity dynamic equation.Although it is referred to as vorticity stretching term, ω.vv includes the changes in vorticityproduced by local intensification (stretching) and reorientation (tilting) of the vorticity of fluidparcels. In Cartesian coordinates the vorticity stretching term reads as follows: Where the x-coordinate is aligned with the stream wise direction (normal to the cylinder axis), they-coordinate is aligned with the cylinder axis and the z-cordinate is the bi-normal to the cylinderaxis. The origin of the coordinate system is placed on the cylinder axis at median z-position. TwoconfiDguTraVticonhs darie 。chosen for the wake survey (Figure 3). The first one is similar to that adopted forplanar PIV studies of the 2D wake, with the light sheet perpendicular to the cylinder axis. In thiscase a cross section of the wake is captured that includes the top and bottom edges of the wake. Inthe second configuration the measurement volume is perpendicular to the bi-normal to the cylinder,which allows to visualize the span wise organisation of the wake along several cylinder diameters. Figure 3 - Configuration of the measurement volume with respect to the cylinder. Left: measurement planeperpendicular to the cylinder axis direction. Right: measurement plane perpendicular to the bi-normal to thecylinder axis. 3.1 Configuration 1: 2D wake view The experiments performed with the cylinder axis placed horizontally allow to visualize the 2Dcharacteristics of the wake as shown in Figure 4. The separated shear layer is visible in form of avorticity sheet emanating from the upper side. On the bottom side of the wake a counter clockwiseroller is being formed as also indicated by the swirling pattern of the instantaneous velocity vectors.The previously shed primary roller can be identified with the roll-up of the vorticity sheet on theupper side just downstream of the first primary vortex. Finally a third vortex with the same rotationsign as the first one is visible downstream at the bottom of the measurement volume. Even in thisrelatively thin view of the cylinder wake a significant three-dimensional behaviour can be observedwith a secondary roller interconnecting the second and the third vortex oriented approximately at 45degrees and exhibiting a vorticity level comparable with the primary rollers. The iso-surfaces of vorticity stretching vector magnitude (|ω·v|) show that the stretching activity is concentrated onlyin the core of the secondary roller and indicates that these structures are responsible for the increaseand re-orientation of the vorticity between the main rollers. Figure 4 - Instantaneous flow field snapshot. Left: vorticity vector magnitude iso-surfaces (|ω|=2x10's,green; |ω|=4x10's, red) and velocity vectors in the mid section of the measurement volume. Vectorscolor-code the streamwise velocity component. Right: vorticity stretching vector magnitude iso-surfaces(|ω-vv|=5x10°s,green;|ω.vv|=15x10°s",red). 3.2 Configuration 2: span wise features Figure 5 shows the flow field properties as observed from a measurement volume extendingapproximately five diameters in the span wise direction. Four uncorrelated snapshots are chosen inorder to illustrate the different events observed during the experiments. The three-dimensionalpattern of the vorticity vector is represented plotting iso-surfaces of the span wise component (greenfor ay=2x10’s, cyan for ay=-2x10’s) and of the combination of the normal and bi-normalcomponents (red for xz =2x10's, blue for axz=-2x10’s). Figure 5 top-left shows threekarman-type rollers in the measurement domain. The distance between the last shed and thepreceding one is approximately 1.2D, while the distance between the rollers further downstreamincreases to about 1.8D indicating a convective speed increase of about 50% in the range of1 0 green; ar<0 cyan;o?+ωsign(@.)>0 red; a?+ωsign(@.)<0 blue. Figure 6 - Left: detail of the interaction between primary and secondary rollers. Right: iso-surface ofvorticity stretching vector magnitude (ωvv|=5x10's). 3.3 Eduction of 2, The 3D spatial autocorrelation function of the secondary flow vorticity (after application of athreshold and value binarization) is used to verify the span wise periodicity of the instantaneousflow and yield a statistical estimate of the span wise wavelength. The autocorrelation is evaluated inthe stream wise range X/D=1+3. The snapshots are phase ordered with respect to the shedding ofthe main rollers and an ensemble of 10 snapshots at approximately the same phase is selected forthe mean autocorrelation. The structure of the autocorrelation function (Figure 7) shows blobselongated in the stream wise direction of alternating sign in the span wise direction. The meandistance between centroids of blobs of same sign is a/D=1.3, which is slightly in excess of thevalue inferred from the instantaneous visualization. However such discrepancies are ascribed to therandom nature of the occurrence and of the scale of the secondary structures, which sometimesoccur with relatively large size (up to a/D=2) and intensity resulting in a 10-20 increase of thespan wise wavelength as also reported by Huang et al. (2006). In some extreme cases the strongeststream wise structures can cause an interruption of the vorticity span wise coherence of the primaryroller downstream causing it to split and undergo further three-dimensional distortion as discussedby Eisenlohr and Eckelmann (1989). Figure 7-Vorticity autocorrelation function iso surfaces (from 10 snapshots). 4. Conclusions The turbulent wake of a circular cylinder has been investigated by means of Tomographic PIV. The3D measurements were performed over a volume of 40x40x10mm’enabling to observe the largescale coherent structures of the wake such as the Karmán rollers and the secondary flow structures.The working principle of the Tomo-PIV technique was introduced and the measurement uncertaintyfor the present measurements was estimated. The measurement density of approximately 2points/mm in the streamwise and spanwise direction and 4 points/mm along the bi-normal directionallowed to visualize the smallest 3D flow structures of approximately 1 mm. The visualizations ofinstantaneous iso-vorticity surfaces clearly showed the street of counter-rotating vortices with spanwise coherence alternatively shed from the two sides of the cylinder. The secondary rollers werevisualized by means of 3D iso-surfaces of vorticity magnitude or separating the different vorticitycomponents. Their features were found to be similar to the Mode B instability widely referred inliterature. The results of the quantitative analysis of the vorticity field were in good agreement withprevious studies performed with planar PIV. The secondary rollers were found to appearsystematically as pairs of counter-rotating vortices essentially oriented in the stream wise direction.The vorticity stretching activity in the flow field was mostly associated to these secondary rollers.Although the span wise periodicity with a wavelength A/D=1.2 only appeared intermittently in theinstantaneous flow, the statistical evaluation of the spatial autocorrelation function retrieved a spanwise phase coherence length between 3 and 4 wavelengths. It could be concluded that the Tomo-PIV approach is suitable to the investigation of coherent structures in three-dimensional wakes andfurther applications are envisaged in order to investigate the effects of the Reynolds number on theproperties of the coherent structures in cylinder wake flows. Acknowledgements B. Wieneke and D. Michaelis from LaVision GmbH (DE), are kindly acknowledged for thehardware and software support to the Tomo-PIV experiments. References Brede M., Eckelmann H., Rockwell D. (1996) On secondary vortices in the cylinder wake. Phys. Fluids, 8,2117 Eisenlohr H., Eckelmann H. (1989) Vortex splitting and its consequences in the vortex street wake ofcylinders at low Reynolds number. Phys. Fluids A 1, 1989 Elsinga G.E., Wieneke B., F. Scarano and van Oudheusden B.W. (2005) Tomographic particle imagevelocimetry. 6" Int. Symp. on PIV, Pasadena, USA Elsinga G.E., Wieneke B., F. Scarano and van Oudheusden B.W. (2005) Assessment of Tomo-PIV for three-dimensional flows. 6" Int. Symp. on PIV, Pasadena, USA Herman G.T., Lent A. (1976) Iterative reconstruction algorithms. Compt Biol Med, Vol 6, 273-294 Huang J.F., Zhou Y., Zhou T. (2006) Three-dimensional wake structure measurement using a modified PIVtechnique. Exp. Fluids, DOI10.1007/s00348-006-0126-9 Muchmorea B., Ahmed A. (1992) On streamwise vortices in turbulent wakes of cylinders. Phys. Fluids A 5,387 Scarano F., Riethmuller M. L. (2000) Advances in iterative Multigrid PIV image processing. Exp. Fluids,Suppl., S51 Thompson M., Hourigan K. and Sheridan J. (1994) Three-dimensional instabilities in the cylinder wake. Int.Colloq. Jets, Wakes, Shear Layers, Melbourne, AUS Williamson C. H. K. (1996) Three-dimensional wake transition. J. Fluid Mech. 328, 345 Williamson C. H. K. (1996) Vortex dynamics in the cylinder wake. Annu Rev Flu Mech. 28, 477 Williamson C. H. K., Roshko A (1990) Measurement of base pressure in the wake of a cylinder at lowReynolds number. Flugwiss Z. Weltraumforsch, 14, 38 Westeerweel J., Scarano F. (2005) A universal detection criterion for the median test. Exp. Fluids 39-6, 1096 -- --
确定
还剩9页未读,是否继续阅读?

产品配置单

北京欧兰科技发展有限公司为您提供《圆柱尾迹,湍流,三维相干结构中3D3C速度矢量场,速度场,体视速度场,层析速度场检测方案(粒子图像测速)》,该方案主要用于其他中3D3C速度矢量场,速度场,体视速度场,层析速度场检测,参考标准--,《圆柱尾迹,湍流,三维相干结构中3D3C速度矢量场,速度场,体视速度场,层析速度场检测方案(粒子图像测速)》用到的仪器有体视层析粒子成像测速系统(Tomo-PIV)
推荐专场


相关方案
更多
该厂商其他方案
更多