


The present work describes a new method which allows the spatially resolved quantitative determination of gaseous hydrocarbon densities in droplet laden flows. The technique is especially dedicated to a quantitative and linearly spatially resolved measurement of air/fuel ratio (λ-value) in direct injection Otto engines under stratified
operation and by use of regular gasoline (Euro Super). The new method is based on spontaneous Raman scattering. It is applied to the investigation of the air/fuel ratio distribution inside and in the close surroundings of the spray cone of different DI-fuel injectors under stratified and homogeneous engine operation conditions. Both crank angle resolved snap shot and cyclical averaged measurements are presented. Simultaneously the planar gasoline distribution is detected by LIF of aromatic hydrocarbons which are native constituents of regular gasoline. It is shown, that the
linear spatially resolved air/fuel distributions measured by means of LIF correlate well with the Raman data.
方案详情

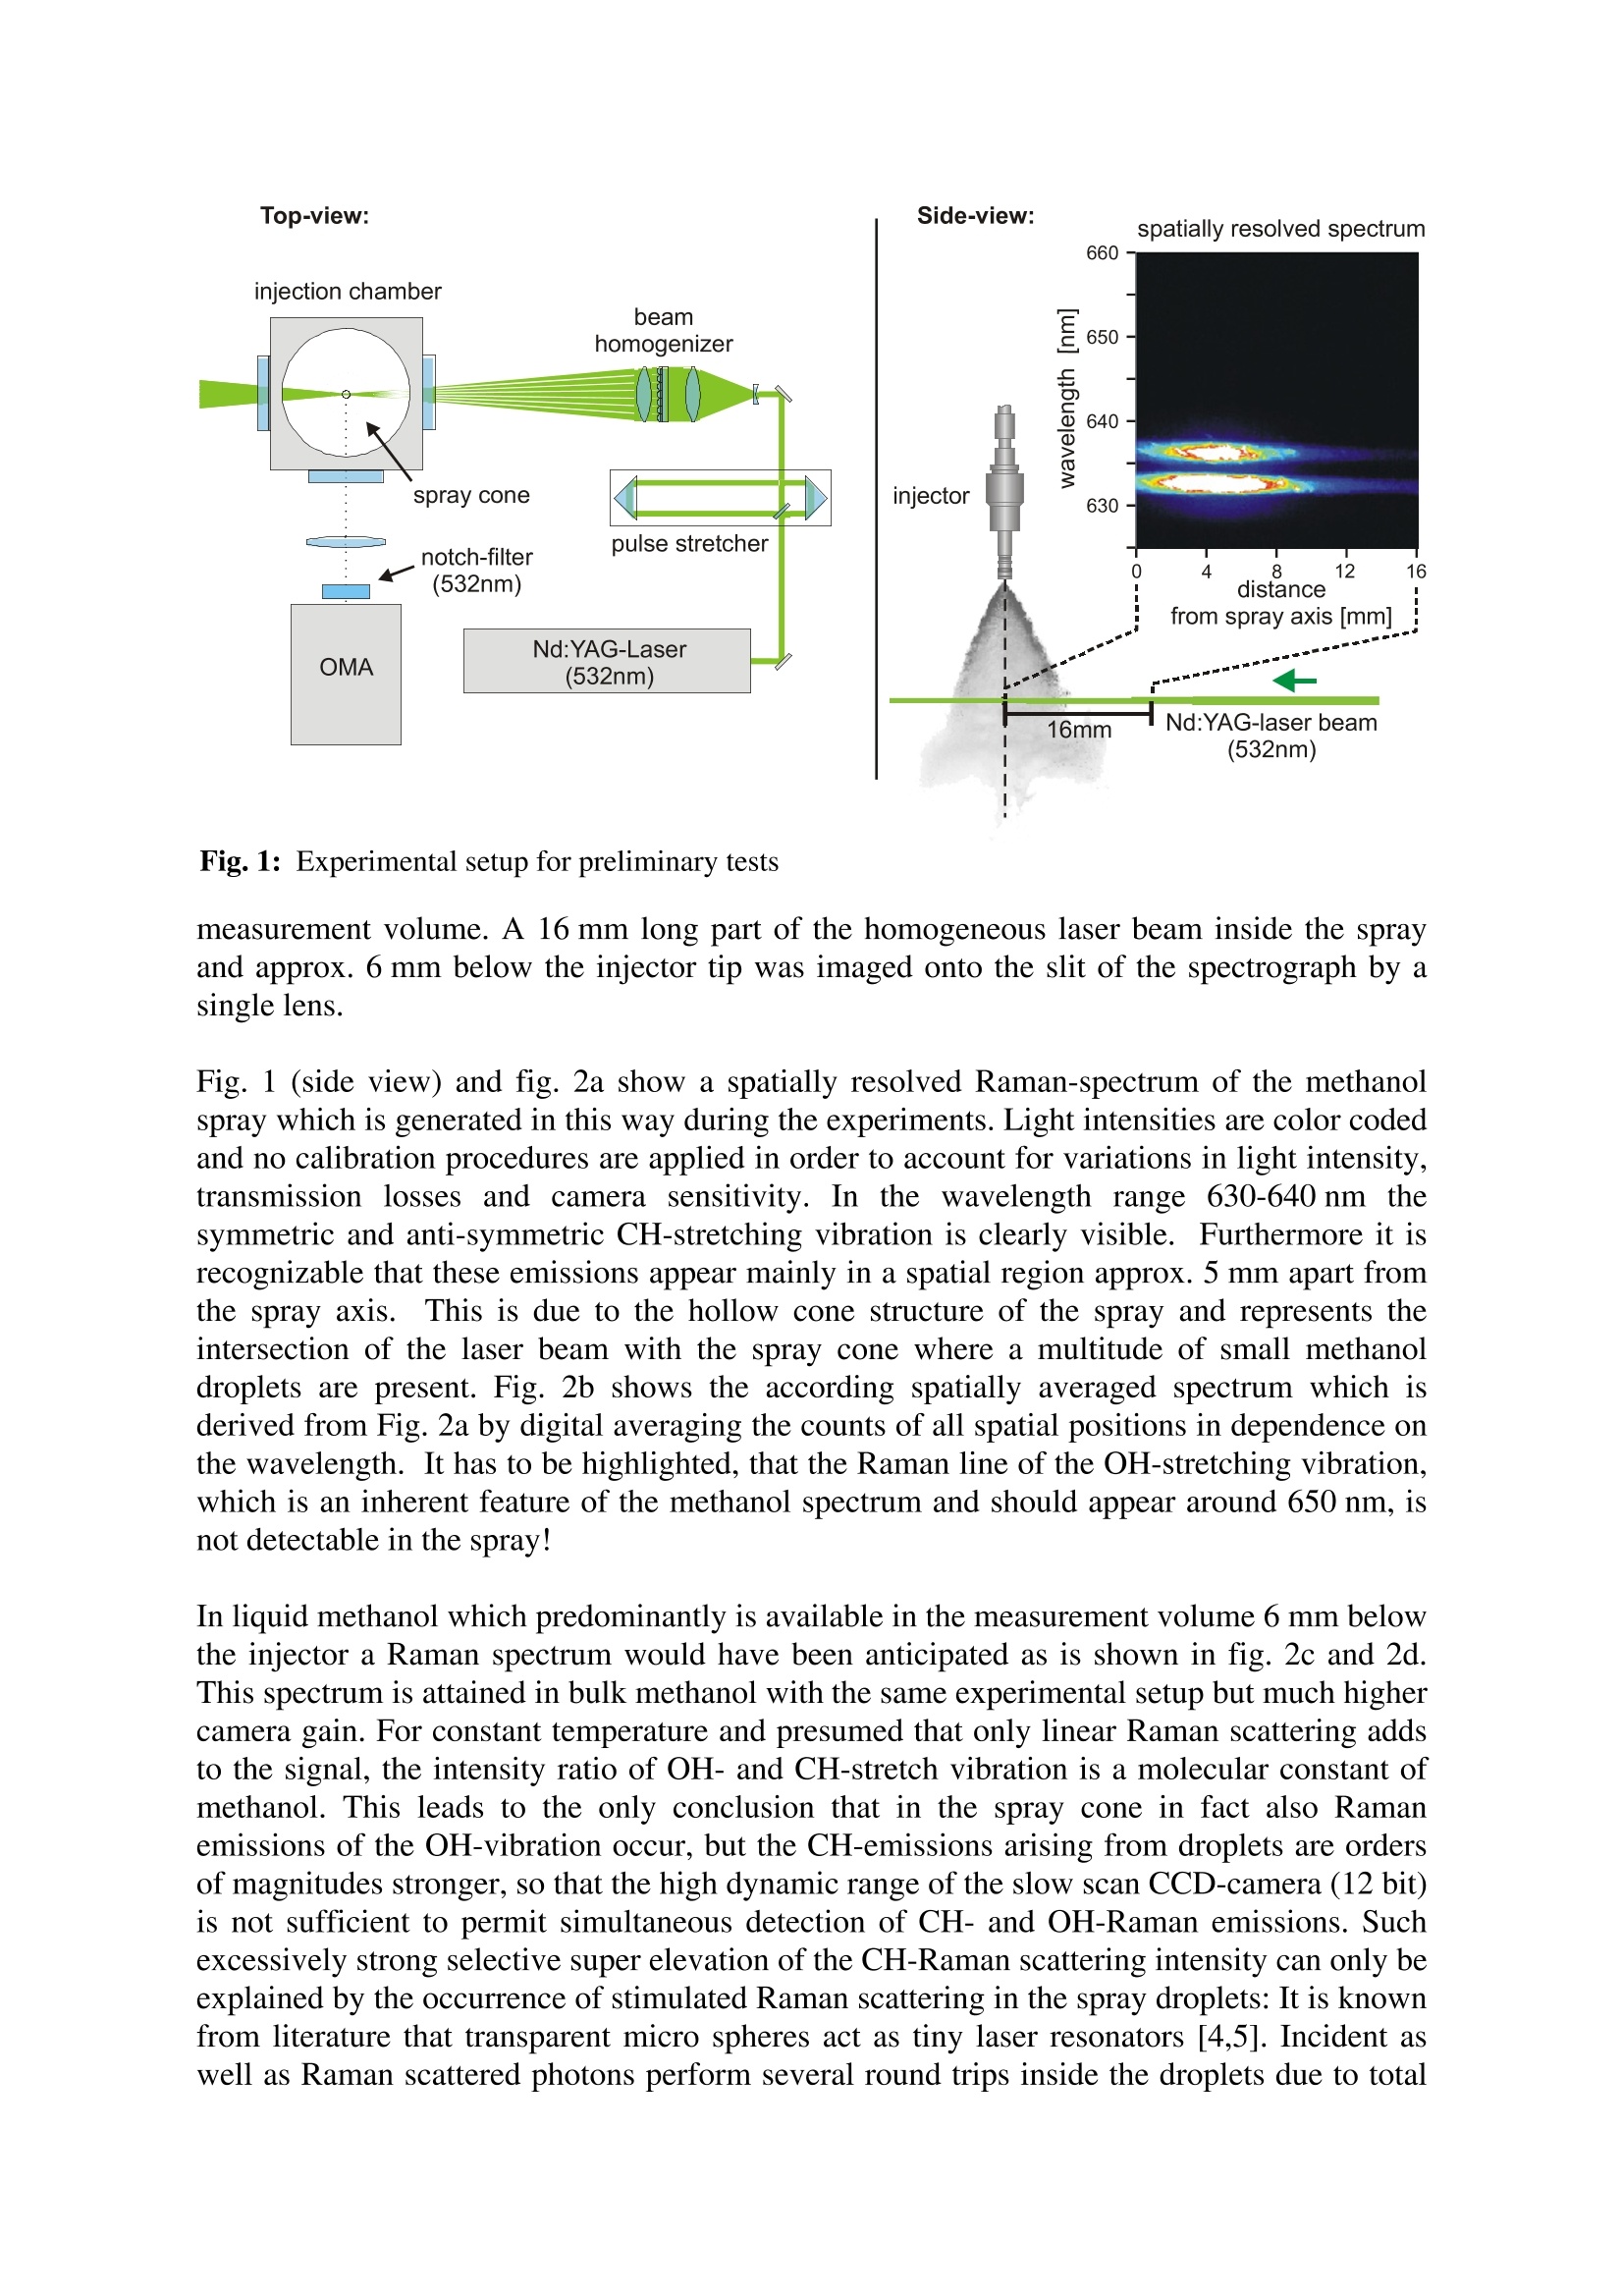
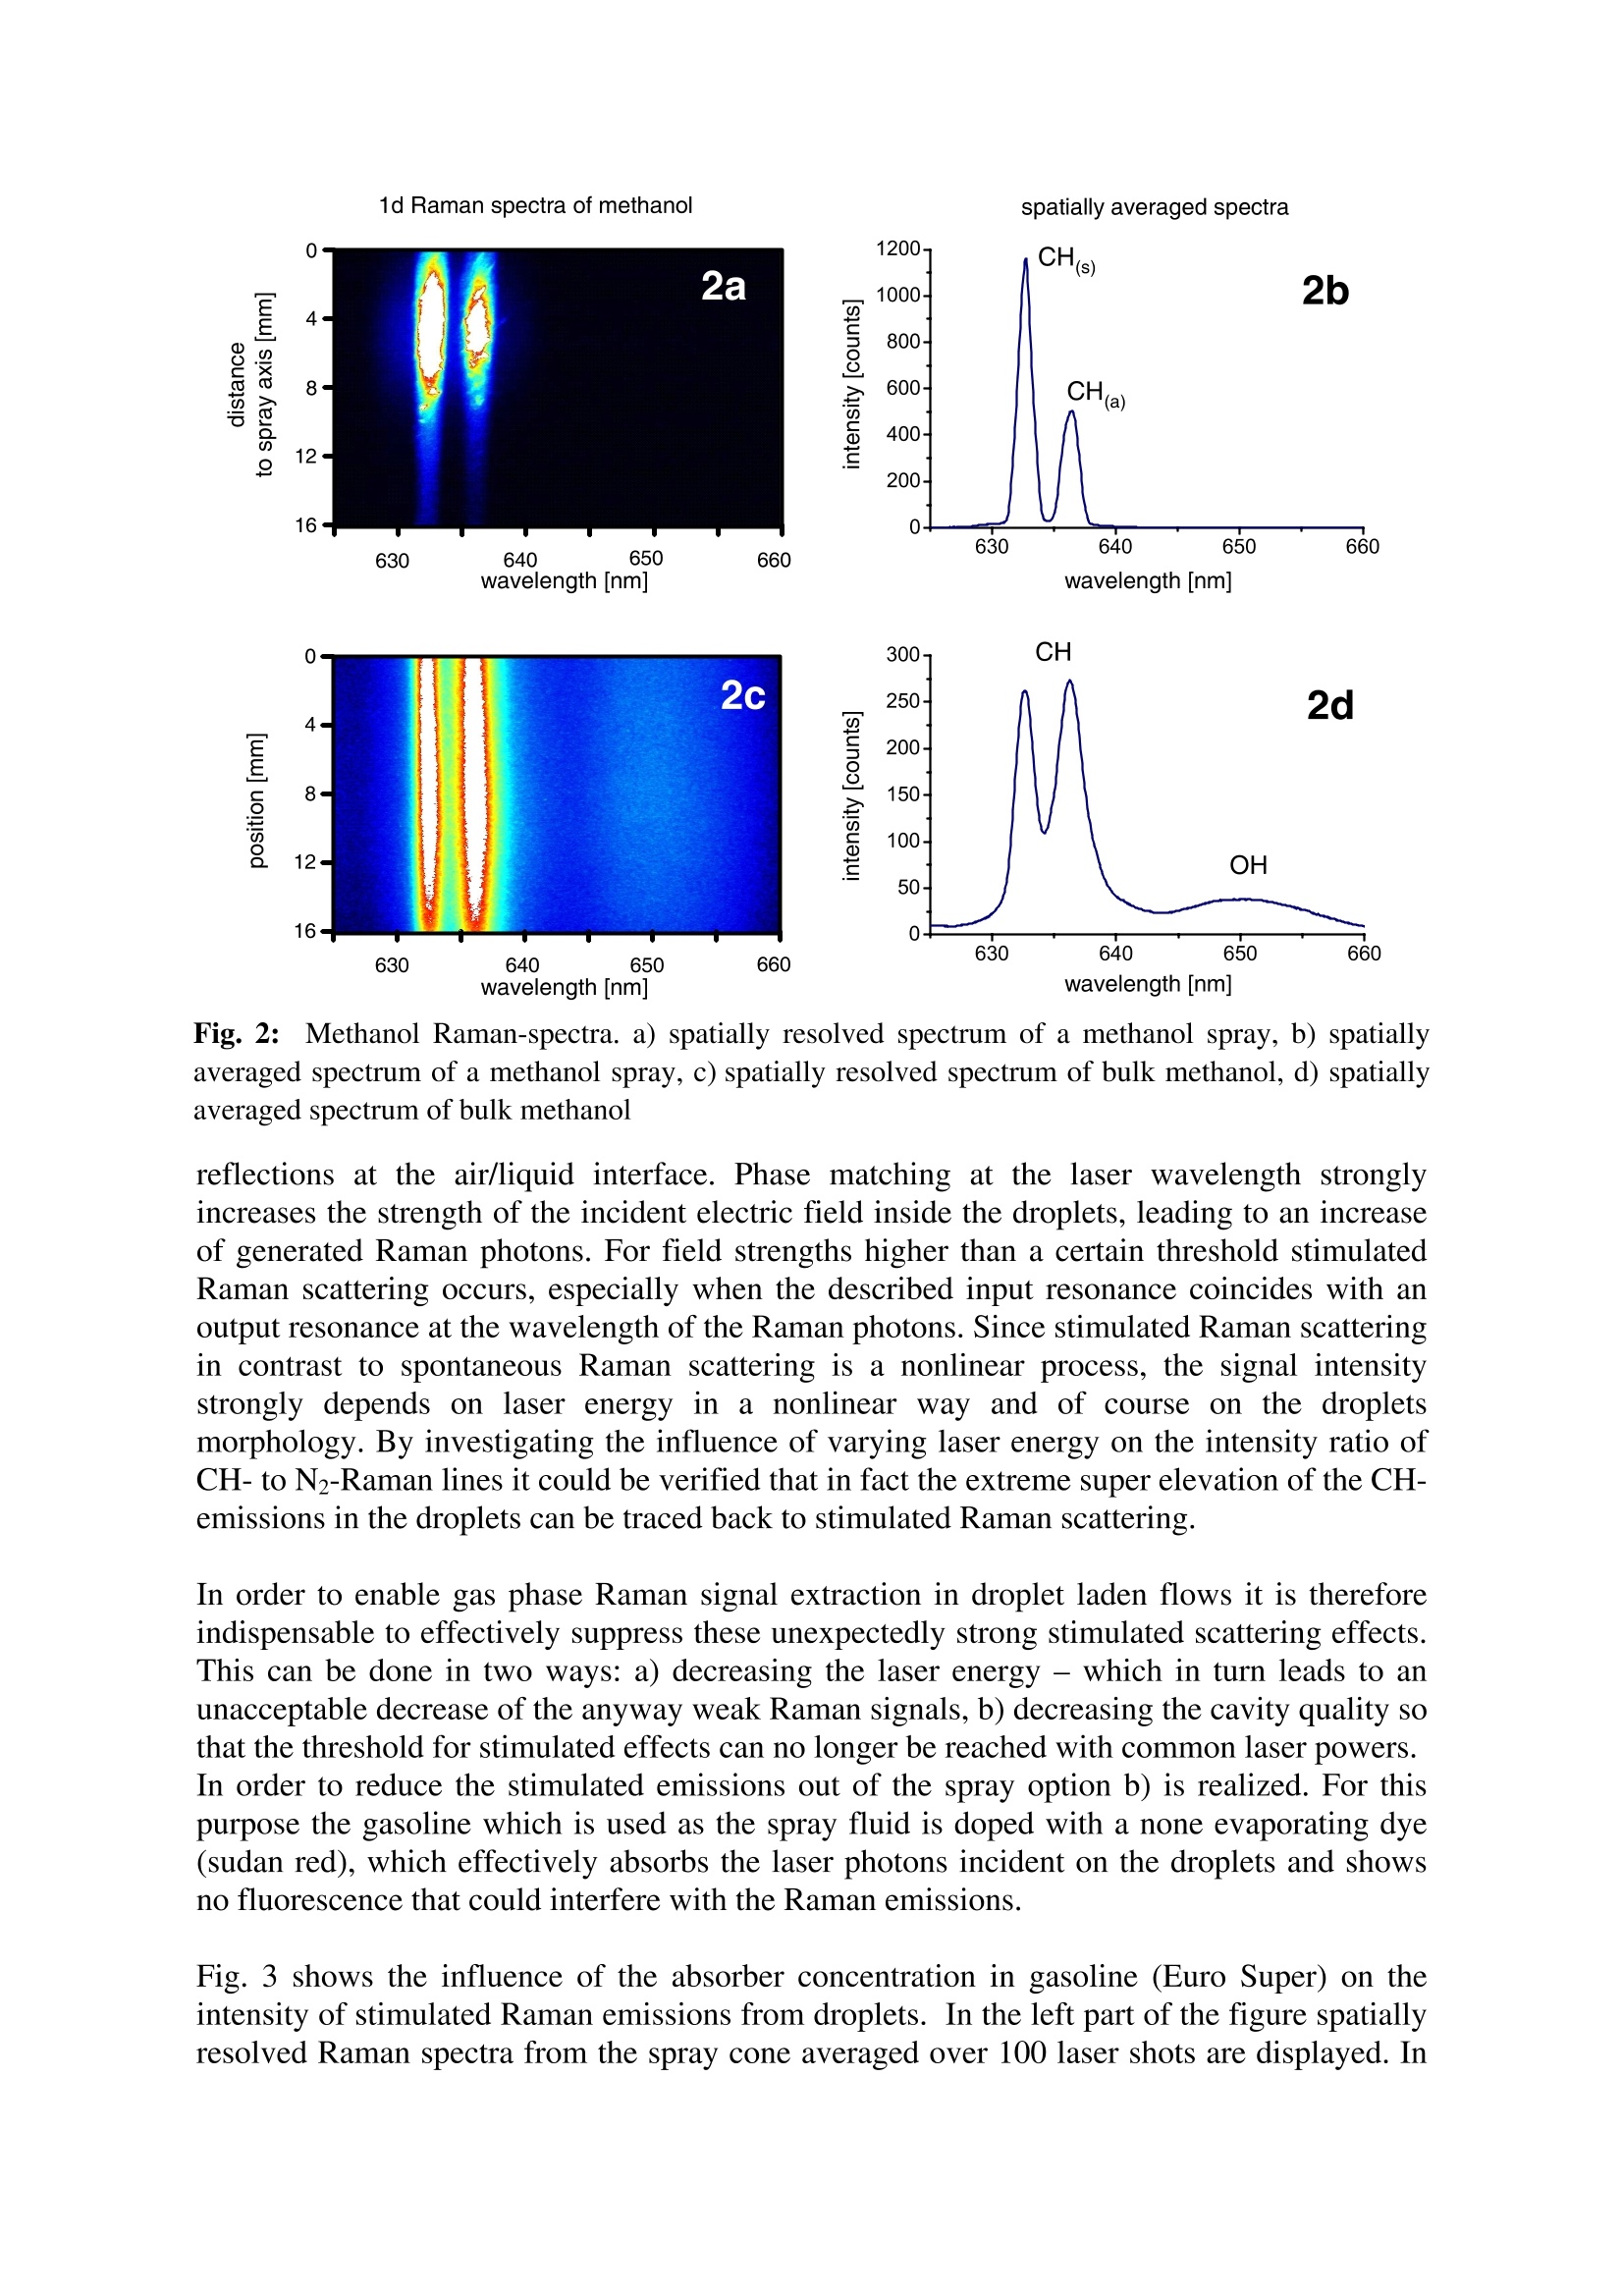
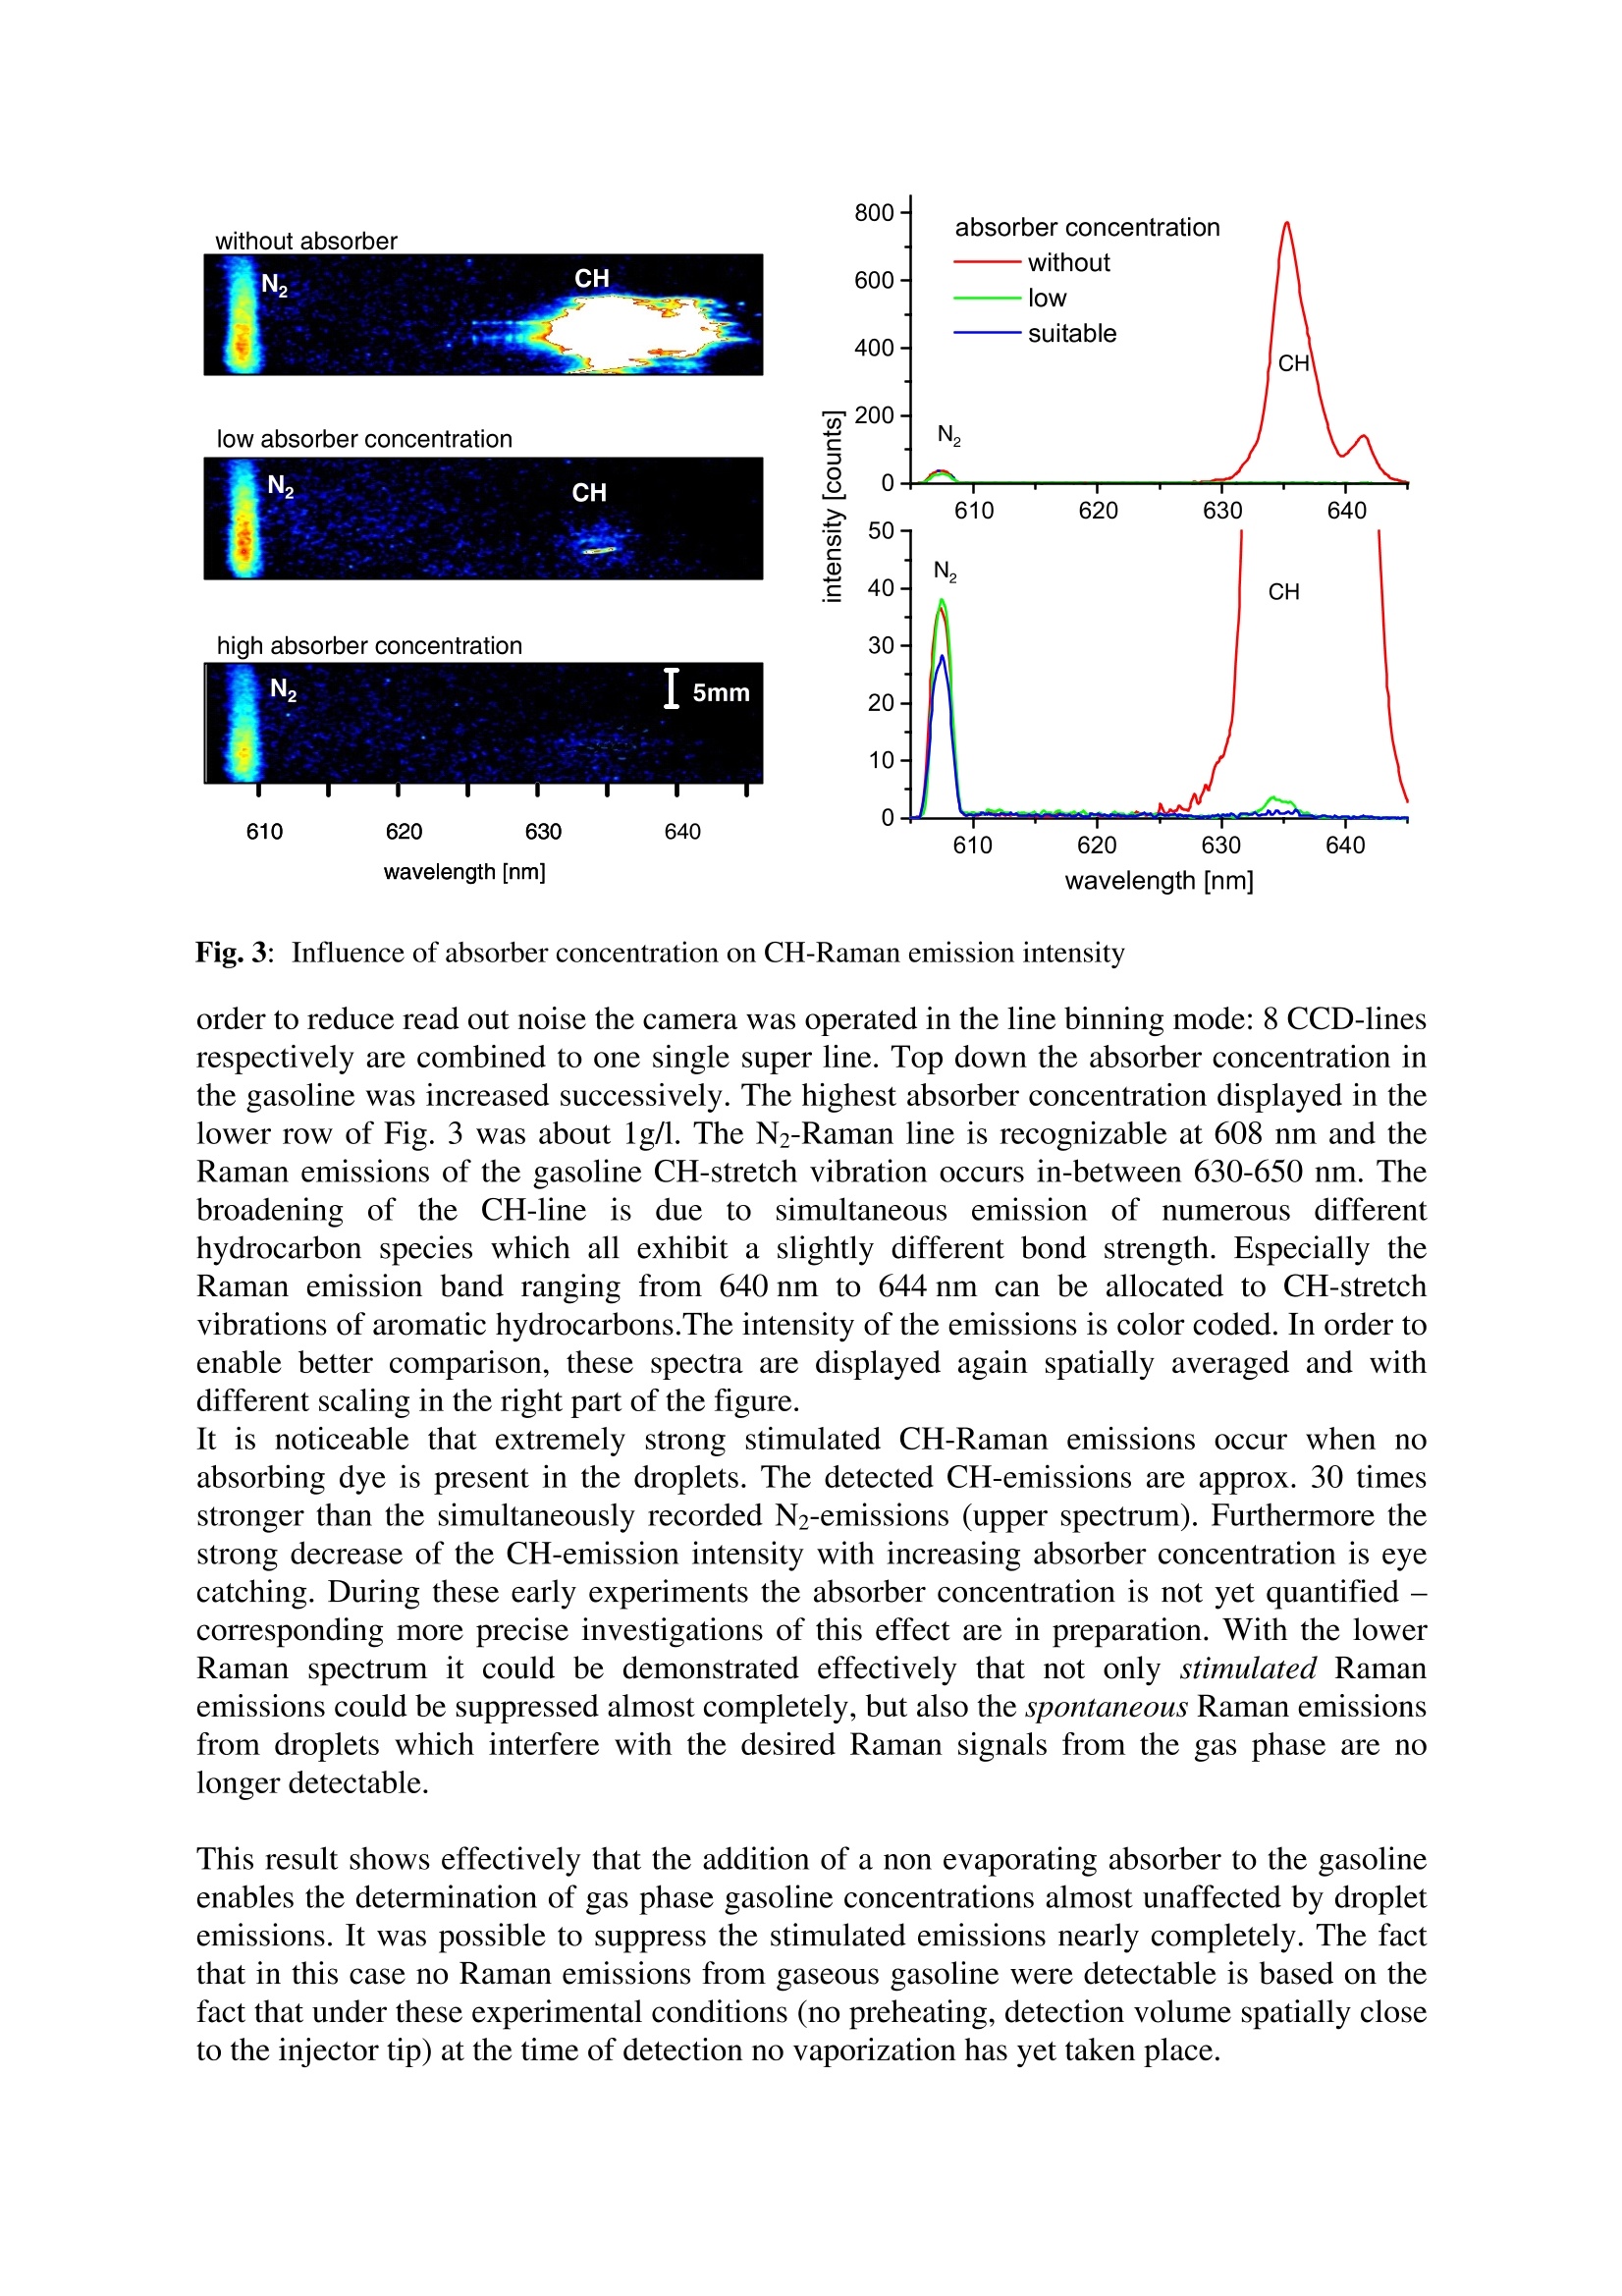
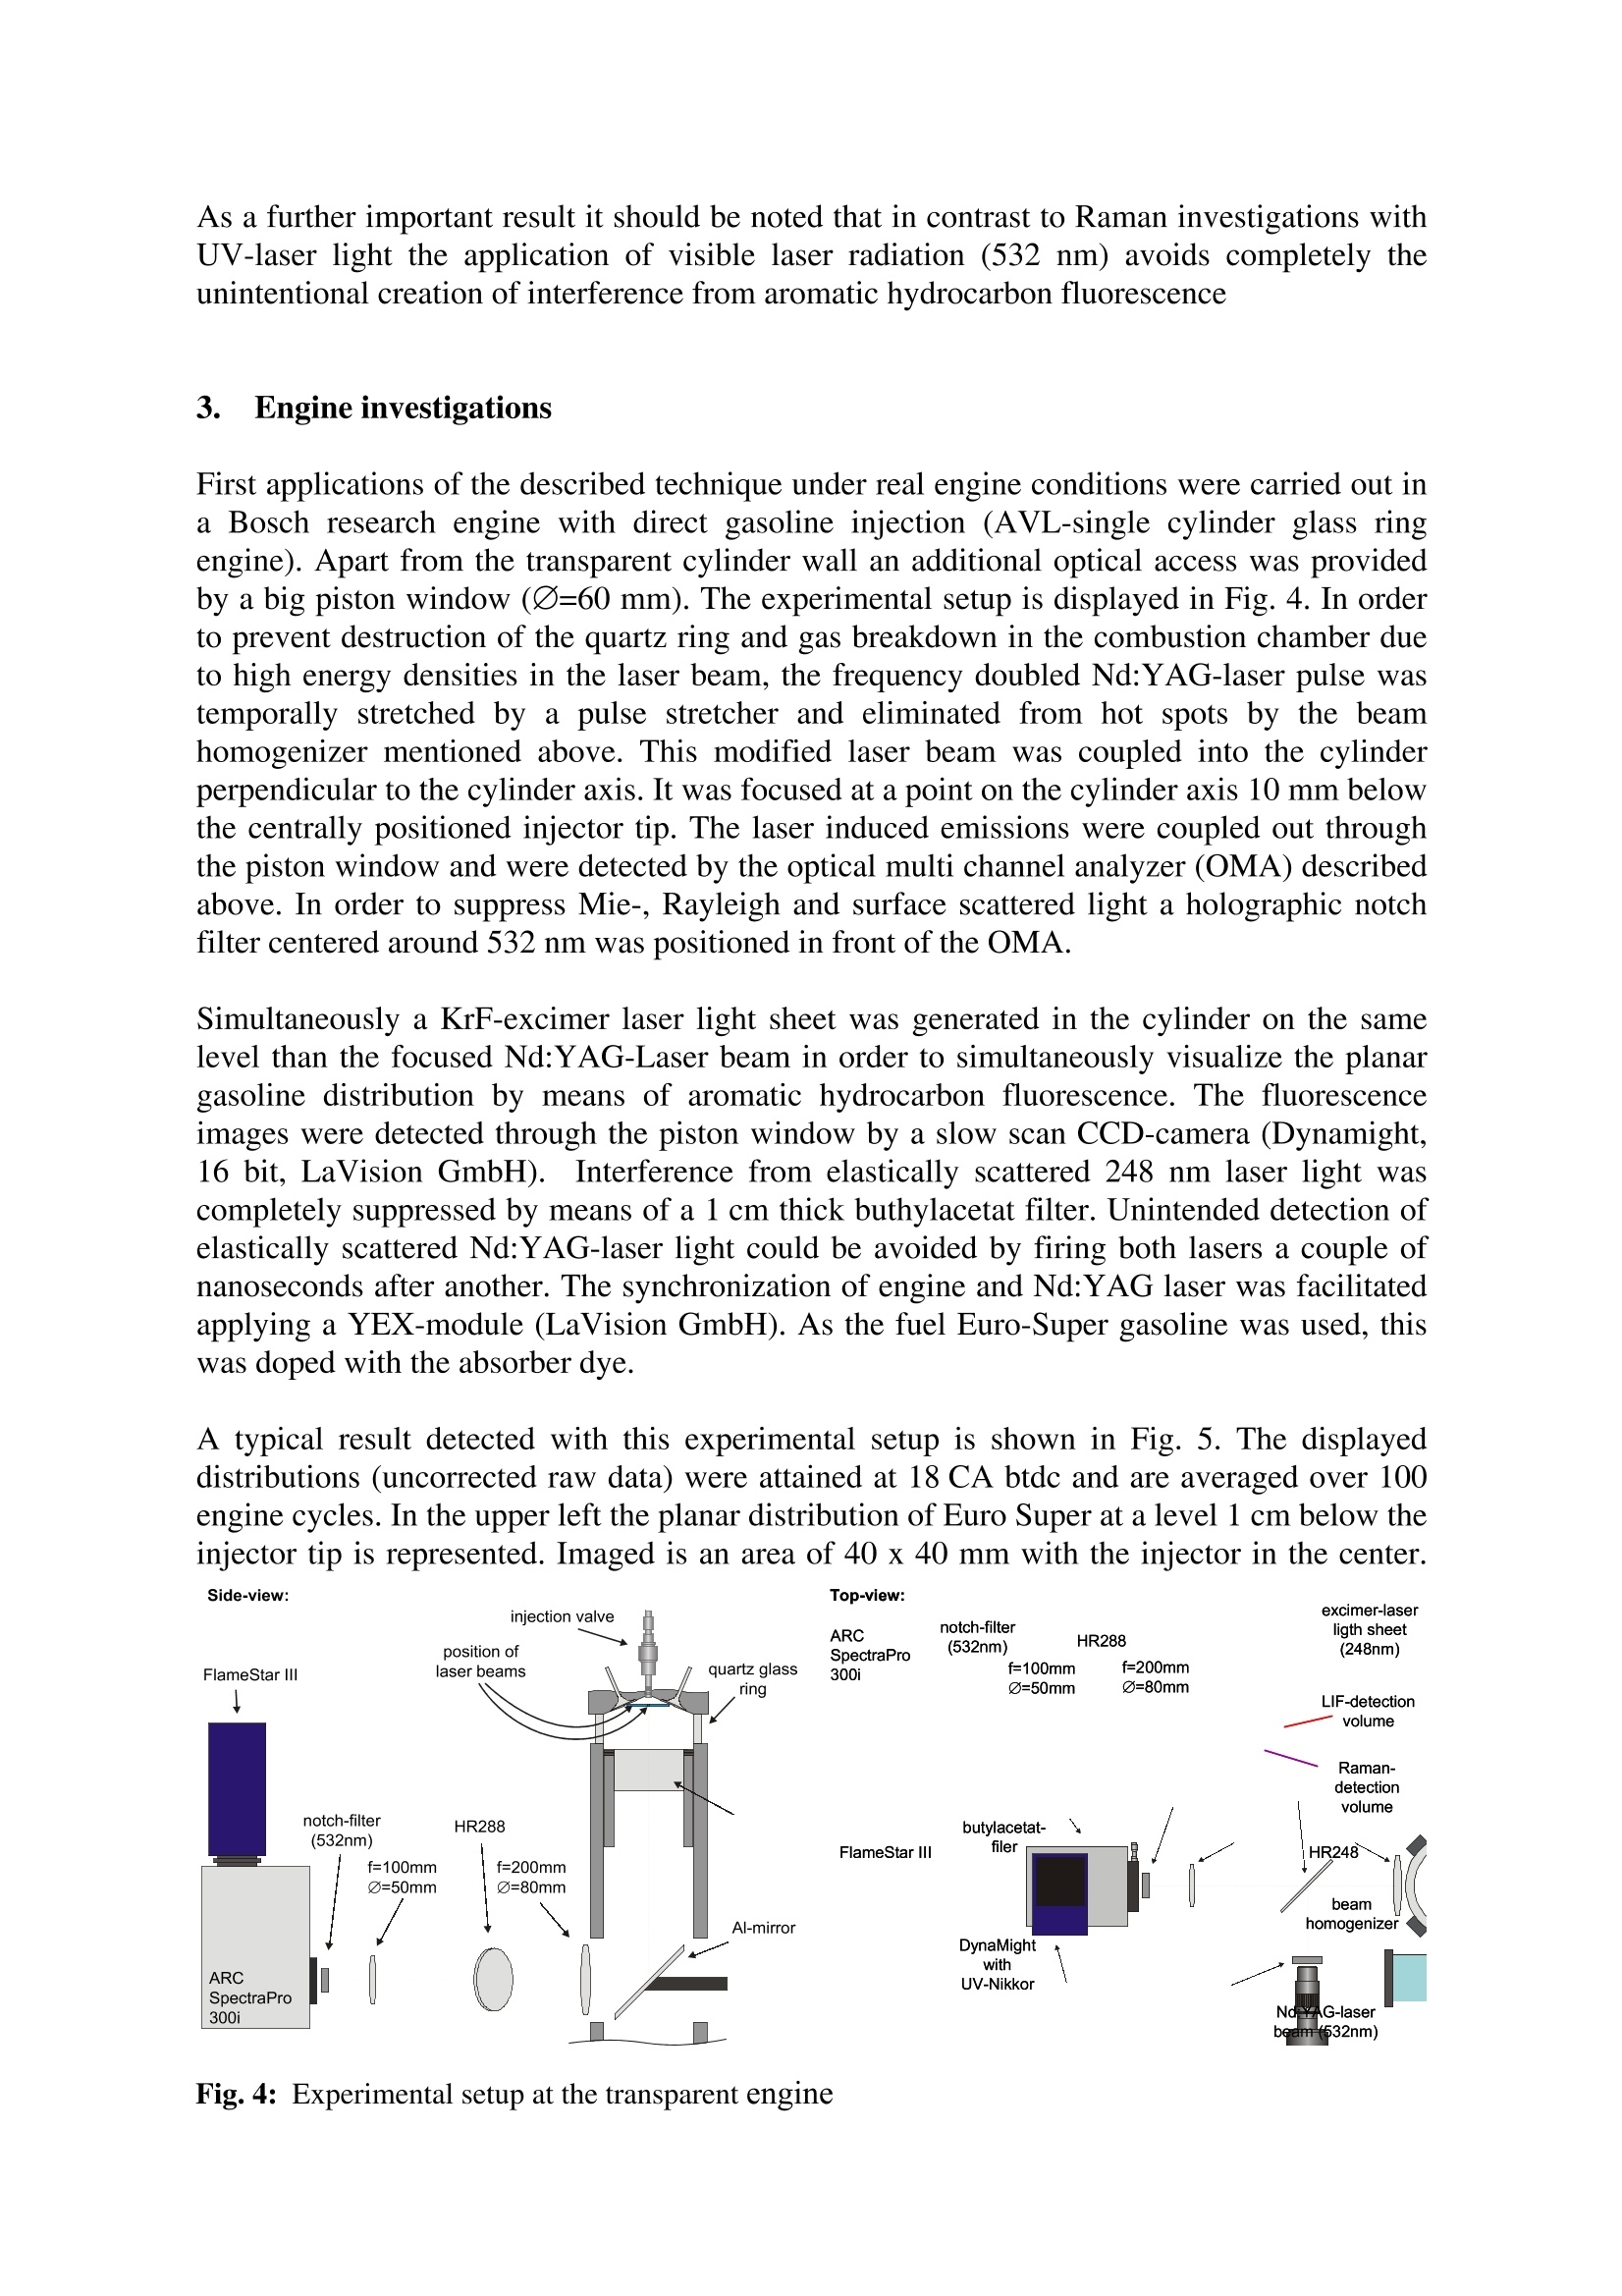
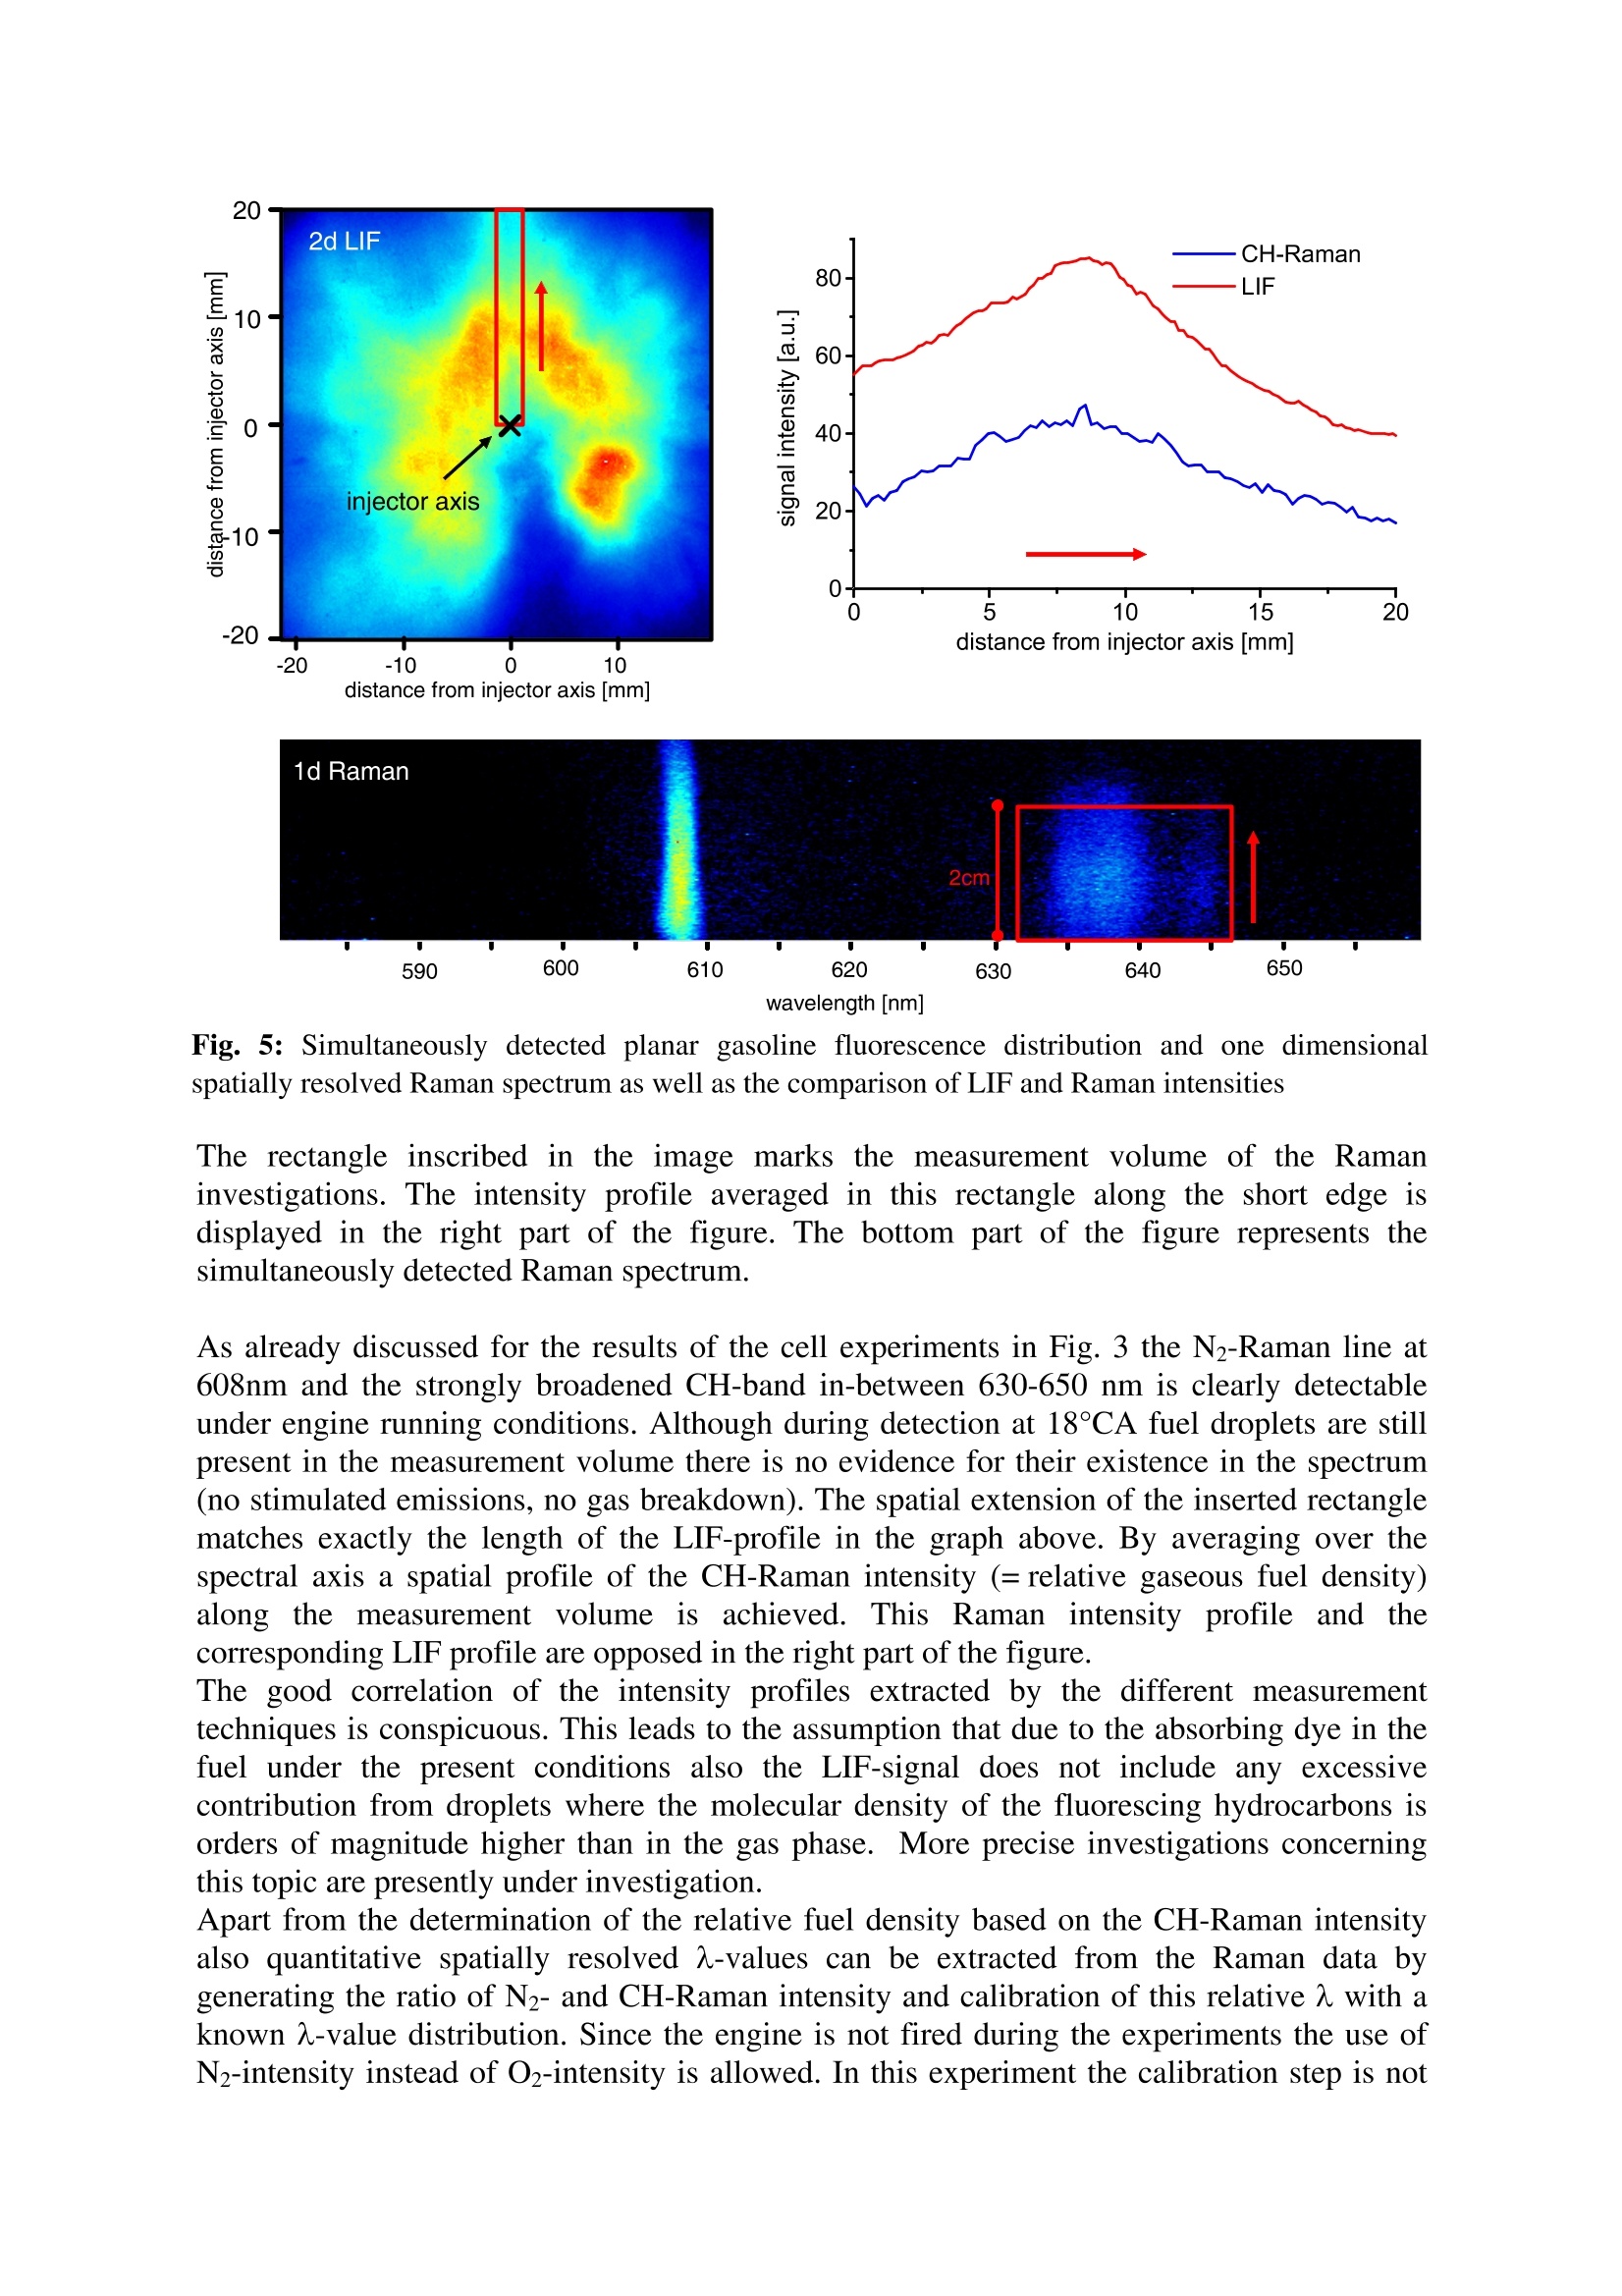
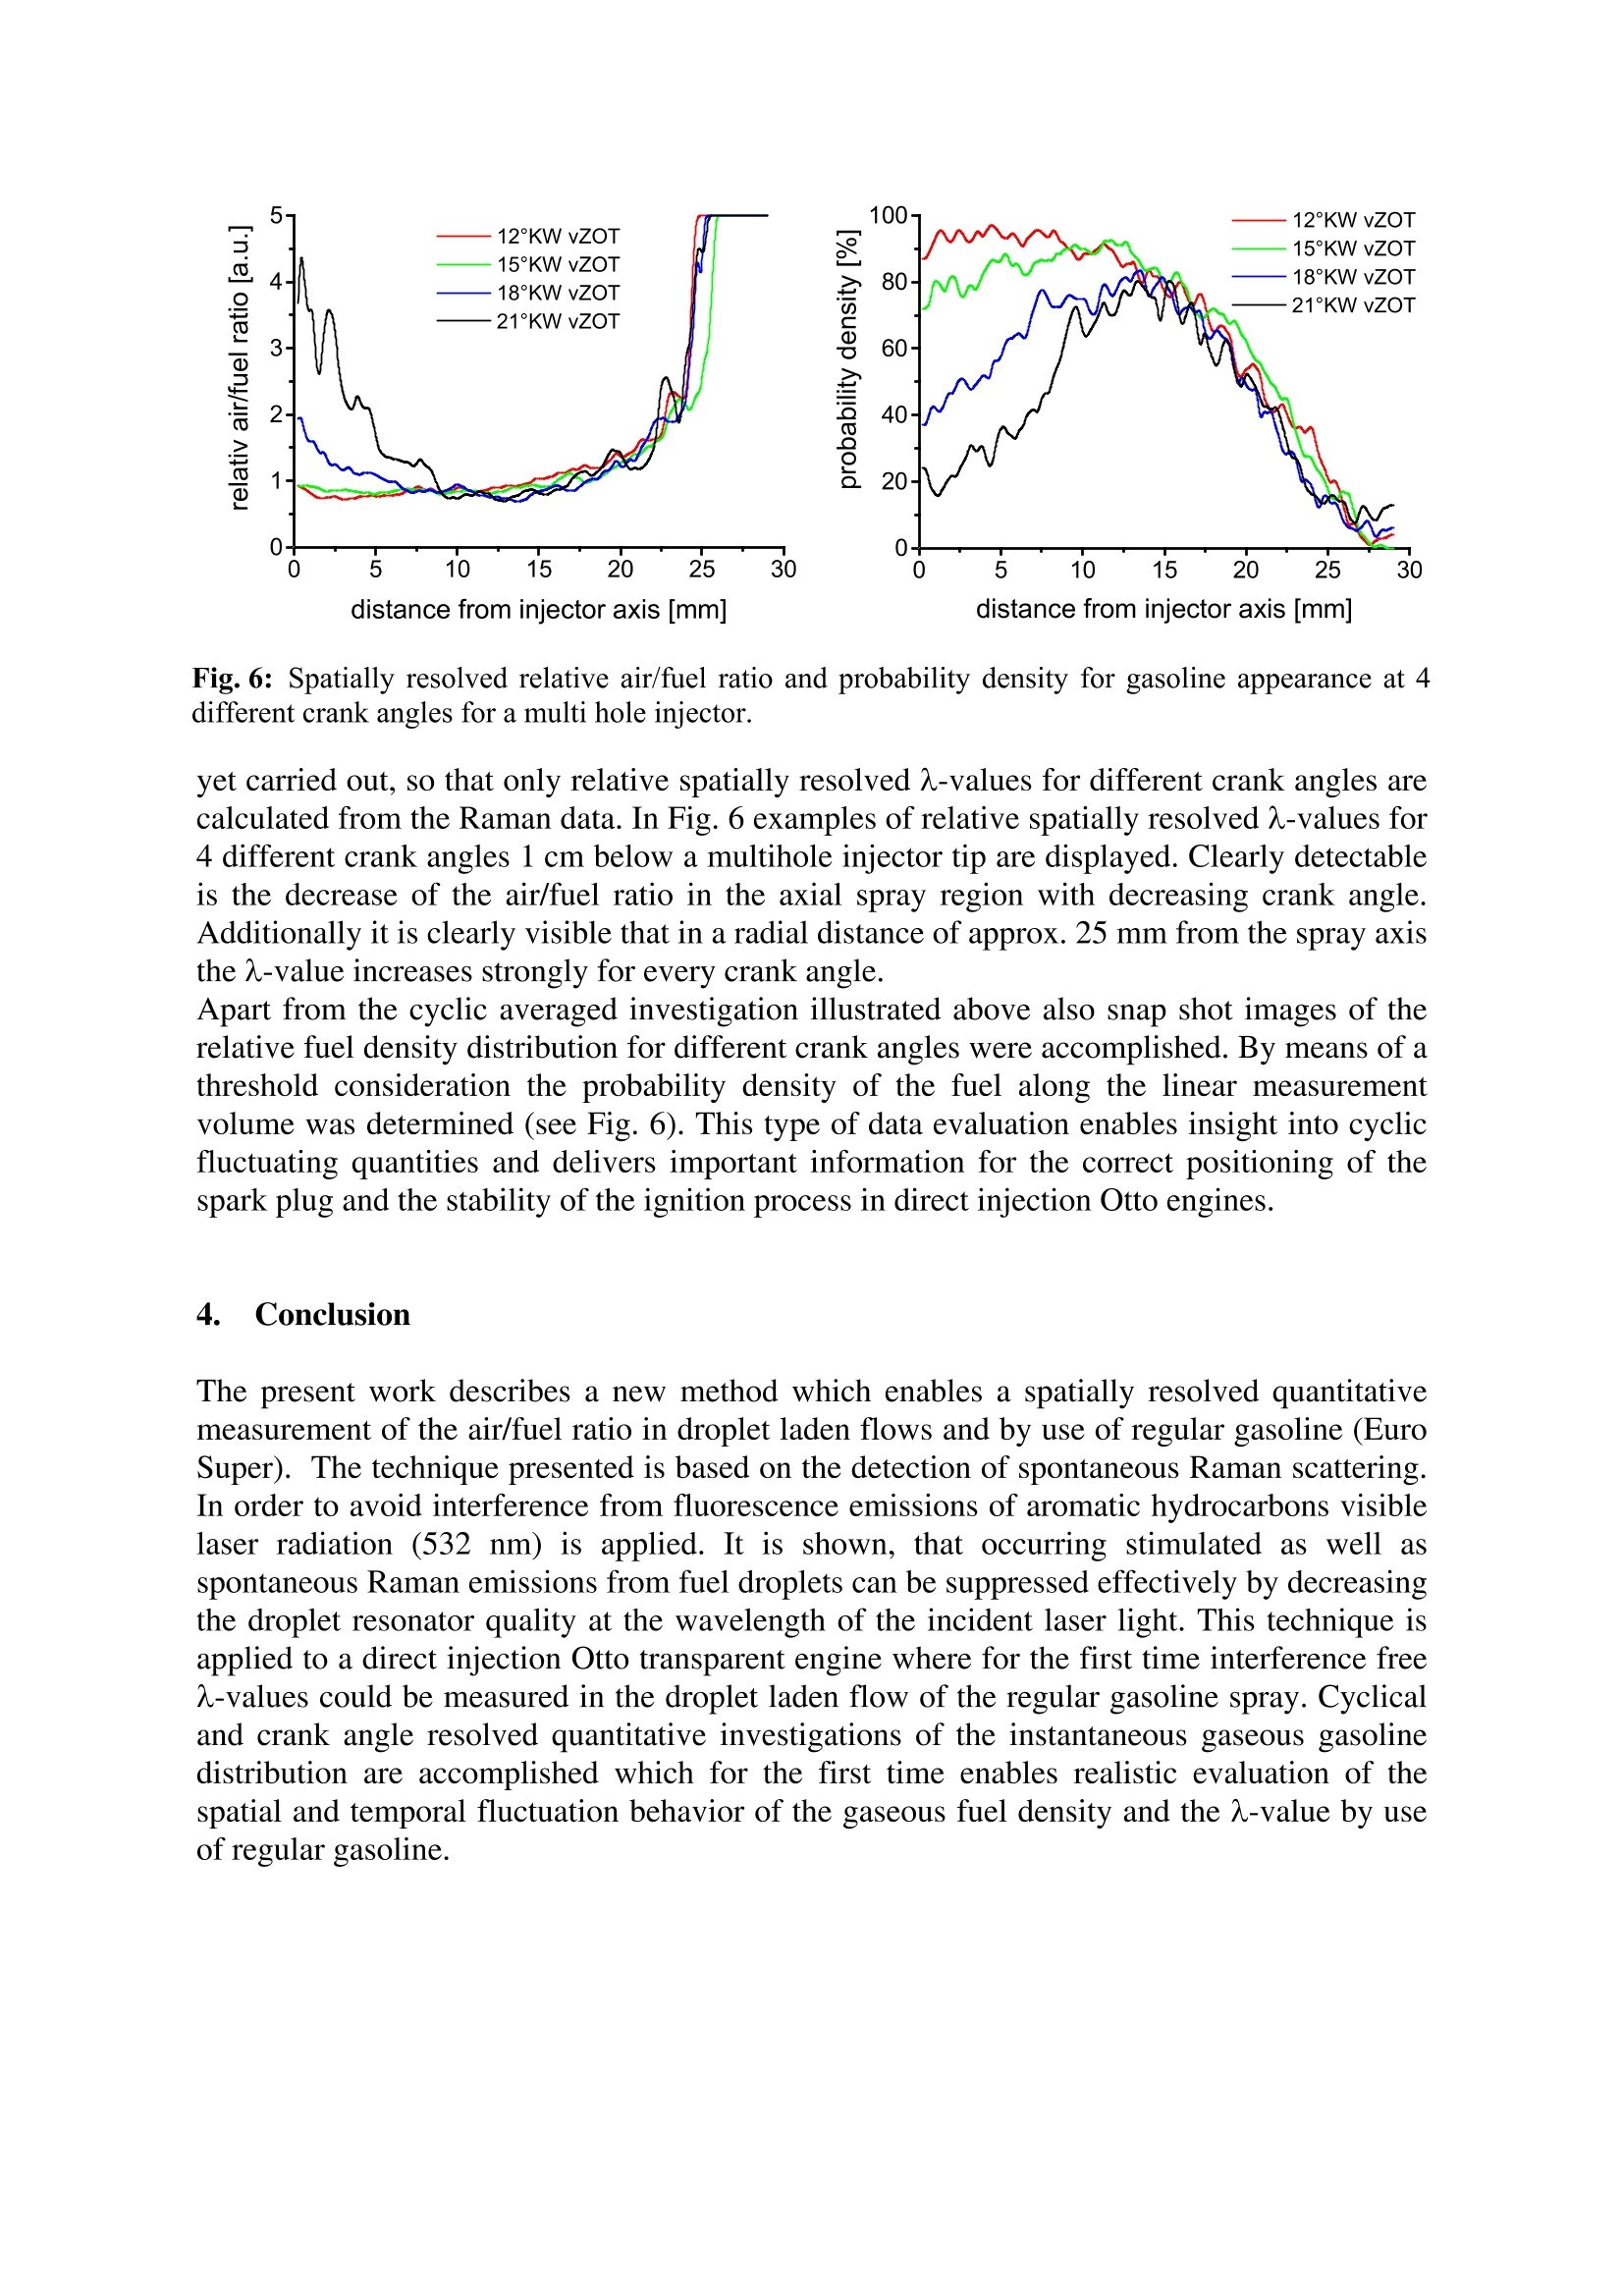
Spatially Resolved Determination of Fuel/Air Ratio Insidea Direct Injection SI-Engine Under Real Fuel Conditions V. Beushausen, T. Mueller", O. Thiele", T. Wesker, R. Grzeszik?,J. Raimann’, S. Arndt "Laser-Laboratorium Goettingen e.V., Hans-Adolf-Krebs-Weg 1, D-37077Goettingen,Germany, Phone: +49 551 5035 23, e-mail: Volker.Beushausen@llg.gwdg.de 2 Robert Bosch GmbH, FV/SLE2-Sh, PF 106050,D-70049 Stuttgart, Germany The present work describes a new method which allows the spatially resolvedquantitative determination of gaseous hydrocarbon densities in droplet laden flows. Thetechnique is especially dedicated to a quantitative and linearly spatially resolvedmeasurement of air/fuel ratio (A-value) in direct injection Otto engines under stratifiedoperation and by use of regular gasoline (Euro Super). The new method is based onspontaneous Raman scattering. It is applied to the investigation of the air/fuel ratiodistribution inside and in the close surroundings of the spray cone of different DI-fuelinjectors under stratified and homogeneous engine operation conditions. Both crankangle resolvedSsnap shot and1 cyclicalaveraged1measurements are presented.Simultaneously the planar gasoline distribution is detected by LIF of aromatichydrocarbons which are native constituents of regular gasoline. It is shown, that thelinear spatially resolved air/fuel distributions measured by means of LIF correlate wellwith the Raman data. 1.。Introduction Quantitative determination of air/fuel ratio (A-value) inside gasoline SI-engines by means ofspontaneous Raman scattering is generally carried out with ultraviolet laser radiation due tothe stronger Raman cross sections in the UV-spectral range [1,2]. The application of UV-lightdetermines the use of none fluorescing and therefore aromatic hydrocarbon free model fuels,so that real engine conditions cannot be realized. Additionally the development of directinjection combustion processes complicates the application of spontaneous Raman scatteringfor A-value determination due to the simultaneous appearance of gaseous fuel and fueldroplets in the measurement volume. On the one hand the Raman signal originating from theliquid phase falsifies the measured A-value, which is defined by the ratio of air and gaseousfuel only. On the other hand additional interfering effects occur, when high laser powerdensities interact with small transparent droplets. First, the droplets focus the laser light,which strongly increases the local power density. This frequently generates air breakdownresulting in very bright broadband atomic emissions, which strongly interfere with the weakvibrational Raman signals of the molecules. Secondly, the spherical shape of the dropletscauses the appearance of morphology dependent resonances (MDRs) [3,4], leading to a non-linear rise of the Raman signal. For these reasons the quantitative determination of A-value by means of UV-Raman-scattering inside the cylinder of Direct Injection (DI)-engines is only possible on twoconditions: a) Use of non fluorescing model fuels and b) existence of a droplet fre measurement volume. The first restriction implies, that realistic mixture formation as itappears with regular gasoline is very difficult to simulate with model fuels like isooctane.The second restriction results from the fact, that a quantitative measurement of A-value willbe strongly aggravated due to interference from plasma emissions and excessive Raman-scattering intensities from the liquid phase. Due to the fact that the appearance of droplets inthe measurement volume is hardly avoidable, a correct spatially resolved determination ofair/fuel ratio in stratified engine operation is nearly impossible with previous methods. The present work describes a new approach which overcomes these limitations and permits aspatially resolved measurement of the A-value in droplet laden gas flows and the applicationof regular gasoline (Euro Super). Just like the previous methods the technique presented isalso based on spontaneous Raman scattering. In order to avoid interference from fluorescenceof aromatic hydrocarbons visible laser radiation (second harmonic Nd:YAG: 532 nm) is used.The investigations are carried out in a single cylinder DI-glass ring engine (AVL) in closecooperation with Robert Bosch GmbH. 2. Preliminary tests In order to separate the Raman emissions of gaseous and liquid gasoline and to determine theA-value in the droplet laden flow following principle is applied: A dye is dissolved in thegasoline which strongly absorbs the green frequency doubled Nd:YAG-laser light and re-emits the absorbed energy in a spectral region where it does not interfere with the desiredRaman lines of oxygen, nitrogen and hydrocarbons. The dye concentration is chosen suchthat the excitation light is already absorbed by the dye in a very thin outer spherical layer ofthe droplets so that only minor Raman emissions from the droplet will occur. Applying thisprinciple a selective detection of Raman scattering from gaseous gasoline should be possible.The capability of this procedure is checked by means of a technique developed by Mueller etal.[5]. This technique makes use of the special properties of alcanoles whose vibrational OH-Raman emission in the liquid phase is spectrally shifted to shorter wavelengths compared tothe gaseous phase. This is due to hydrogen bonding in liquid alcanoles which slightly shiftsthe molecular energy levels. With this technique it is possible to spectrally separate liquid andgaseous gasoline so that the feasibility of the proposed method for suppressing Raman signalsfrom liquid gasoline can be evaluated. Since the method of Mueller et al. relies on theexistence of OH-groups in the molecules (e.g. alcanoles and water) these preliminaryinvestigations are carried out using methanol as the fluid. The preliminary experiments are carried out in an optically accessible injection chamberwhere a methanol spray is generated by means of a Bosch BDI-injector (see fig. 1). Thefocused beam of a frequency doubled Nd:YAG-laser (LOT, Brilliant B, 50 mJ) was coupledin perpendicular to the spray axis and the generated Raman scattered laser light is detected byan optical multichannel analyzer (OMA) consisting of a spatially resolving spectrograph(Acton Research Corporation, Spectra Pro 300i) and an intensified CCD-Camera (LaVision,Flamestar 3). In order to avoid droplet induced gas breakdown the very short Nd:YAG-laserpulse (pulse length 5 ns) was stretched to 20 ns pulse length by a homebuilt pulse stretcherconsisting of delay line and beam splitter. This task reduced air breakdown significantly butstill single breakdown events could be observed which could falsify the measurements. Forthis reason additionally a beam homogenizer consisting of a beam expander, two crossedcylindrical lens arrays and a focusing lens was utilized in order to avoid hot spots in the beamprofile. The homogenizer creates a tall homogeneous beam waist with 1.5 mm diameter in the Fig. 1: Experimental setup for preliminary tests measurement volume. A 16 mm long part of the homogeneous laser beam inside the sprayand approx. 6 mm below the injector tip was imaged onto the slit of the spectrograph by asingle lens. Fig. 1 (side view) and fig. 2a show a spatially resolved Raman-spectrum of the methanolspray which is generated in this way during the experiments. Light intensities are color codedand no calibration procedures are applied in order to account for variations in light intensity,transmission losses and camera sensitivity. In the wavelength range 630-640 nm thesymmetric and anti-symmetric CH-stretching vibration is clearly visible. Furthermore it isrecognizable that these emissions appear mainly in a spatial region approx. 5 mm apart fromthe spray axis.This is due to the hollow cone structure of the spray and represents theintersection of the laser beam with the spray cone where a multitude of small methanoldroplets are present. Fig. 2b shows the according spatially averaged spectrum which isderived from Fig. 2a by digital averaging the counts of all spatial positions in dependence onthe wavelength. It has to be highlighted, that the Raman line of the OH-stretching vibration,which is an inherent feature of the methanol spectrum and should appear around 650 nm, isnot detectable in the spray! In liquid methanol which predominantly is available in the measurement volume 6 mm belowthe injector a Raman spectrum would have been anticipated as is shown in fig. 2c and 2d.This spectrum is attained in bulk methanol with the same experimental setup but much highercamera gain. For constant temperature and presumed that only linear Raman scattering addsto the signal, the intensity ratio of OH- and CH-stretch vibration is a molecular constant ofmethanol. This leads to the only conclusion that in the spray cone in fact also Ramanemissions of the OH-vibration occur, but the CH-emissions arising from droplets are ordersof magnitudes stronger, so that the high dynamic range of the slow scan CCD-camera (12 bit)is not sufficient to permit simultaneous detection of CH- and OH-Raman emissions. Suchexcessively strong selective super elevation of the CH-Raman scattering intensity can only beexplained by the occurrence of stimulated Raman scattering in the spray droplets: It is knownfrom literature that transparent micro spheres act as tiny laser resonators [4,5]. Incident aswell as Raman scattered photons perform several round trips inside the droplets due to total Fig. 2: Methanol Raman-spectra. a) spatially resolved spectrum of a methanol spray, b) spatiallyaveraged spectrum of a methanol spray,c) spatially resolved spectrum of bulk methanol, d) spatiallyaveraged spectrum of bulk methanol reflections at the air/liquid interface. Phase matching at the laser wavelength stronglyincreases the strength of the incident electric field inside the droplets, leading to an increaseof generated Raman photons. For field strengths higher than a certain threshold stimulatedRaman scattering occurs, especially when the described input resonance coincides with anoutput resonance at the wavelength of the Raman photons. Since stimulated Raman scatteringin contrast to spontaneous Raman scattering is a nonlinear process, the signal intensitystrongly depends on laser energy in a nonlinear way and of course on the dropletsmorphology. By investigating the influence of varying laser energy on the intensity ratio ofCH-to N2-Raman lines it could be verified that in fact the extreme super elevation of the CH-emissions in the droplets can be traced back to stimulated Raman scattering. In order to enable gas phase Raman signal extraction in droplet laden flows it is thereforeindispensable to effectively suppress these unexpectedly strong stimulated scattering effects.This can be done in two ways: a) decreasing the laser energy - which in turn leads to anunacceptable decrease of the anyway weak Raman signals, b) decreasing the cavity quality sothat the threshold for stimulated effects can no longer be reached with common laser powers.In order to reduce the stimulated emissions out of the spray option b) is realized. For thispurpose the gasoline which is used as the spray fluid is doped with a none evaporating dye(sudan red), which effectively absorbs the laser photons incident on the droplets and showsno fluorescence that could interfere with the Raman emissions. Fig. 3 shows the influence of the absorber concentration in gasoline (Euro Super) on theintensity of stimulated Raman emissions from droplets. In the left part of the figure spatiallyresolved Raman spectra from the spray cone averaged over 100 laser shots are displayed. In Fig.3: Influence of absorber concentration on CH-Raman emission intensity order to reduce read out noise the camera was operated in the line binning mode: 8 CCD-linesrespectively are combined to one single super line. Top down the absorber concentration inthe gasoline was increased successively. The highest absorber concentration displayed in thelower row of Fig. 3 was about 1g/l. The N2-Raman line is recognizable at 608 nm and theRaman emissions of the gasoline CH-stretch vibration occurs in-between 630-650 nm. Thebroadening of the CH-line is due to simultaneous6emission of numerousdifferenthydrocarbon species which all exhibit a slightly different bond strength. Especially theRaman emission band ranging from 640 nm to 644 nm can be allocated to CH-stretchvibrations of aromatic hydrocarbons.The intensity of the emissions is color coded. In order toenable better comparison, these spectra are displayed again spatially averaged and withdifferent scaling in the right part of the figure. It is noticeable that extremely strong stimulated CH-Raman emissions occur when noabsorbing dye is present in the droplets. The detected CH-emissions are approx. 30 timesstronger than the simultaneously recorded N2-emissions (upper spectrum). Furthermore thestrong decrease of the CH-emission intensity with increasing absorber concentration is eyecatching. During these early experiments the absorber concentration is not yet quantified -corresponding more precise investigations of this effect are in preparation. With the lowerRaman spectrum it could be demonstrated effectively that not only stimulated Ramanemissions could be suppressed almost completely, but also the spontaneous Raman emissionsfrom droplets which interfere with the desired Raman signals from the gas phase are nolonger detectable. This result shows effectively that the addition of a non evaporating absorber to the gasolineenables the determination of gas phase gasoline concentrations almost unaffected by dropletemissions. It was possible to suppress the stimulated emissions nearly completely. The factthat in this case no Raman emissions from gaseous gasoline were detectable is based on thefact that under these experimental conditions (no preheating, detection volume spatially closeto the injector tip) at the time of detection no vaporization has yet taken place. As a further important result it should be noted that in contrast to Raman investigations withUV-laser light the application of visible laser radiation (532 nm) avoids completely theunintentional creation of interference from aromatic hydrocarbon fluorescence 3. Engine investigations First applications of the described technique under real engine conditions were carried out ina Bosch research engine with direct gasoline injection (AVL-single cylinder glass ringengine). Apart from the transparent cylinder wall an additional optical access was providedby a big piston window (@=60 mm). The experimental setup is displayed in Fig. 4. In orderto prevent destruction of the quartz ring and gas breakdown in the combustion chamber dueto high energy densities in the laser beam, the frequency doubled Nd:YAG-laser pulse wastemporally stretched by a pulse stretcher and eliminated from hot spots by the beamhomogenizer mentioned above. This modified laser beam was coupled into the cylinderperpendicular to the cylinder axis. It was focused at a point on the cylinder axis 10 mm belowthe centrally positioned injector tip. The laser induced emissions were coupled out throughthe piston window and were detected by the optical multi channel analyzer (OMA) describedabove. In order to suppress Mie-, Rayleigh and surface scattered light a holographic notchfilter centered around 532 nm was positioned in front of the OMA. Simultaneously a KrF-excimer laser light sheet was generated in the cylinder on the samelevel than the focused Nd:YAG-Laser beam in order to simultaneously visualize the planargasoline distribution by means of aromatic hydrocarbon fluorescence. The fluorescenceimages were detected through the piston window by a slow scan CCD-camera (Dynamight,16 bit, LaVision GmbH).Interference from elastically scattered 248 nm laser light wascompletely suppressed by means of a 1 cm thick buthylacetat filter. Unintended detection ofelastically scattered Nd:YAG-laser light could be avoided by firing both lasers a couple ofnanoseconds after another. The synchronization of engine and Nd:YAG laser was facilitatedapplying a YEX-module (LaVision GmbH). As the fuel Euro-Super gasoline was used, thiswas doped with the absorber dye. A typical result detected with this experimental setup is shown in Fig. 5. The displayeddistributions (uncorrected raw data) were attained at 18 CA btde and are averaged over 100engine cycles. In the upper left the planar distribution of Euro Super at a level 1 cm below theinjector tip is represented. Imaged is an area of 40 x 40 mm with the injector in the center. Fig. 4: Experimental setup at the transparent engine 20 Fig. 5: Simultaneously detected planar gasoline fluorescence distribution and one dimensionalspatially resolved Raman spectrum as well as the comparison of LIF and Raman intensities The rectangle inscribed in the image marks the measurement volume of the Ramaninvestigations. The intensity profile averaged in this rectangle along the short edge isdisplayed in the right part of the figure. The bottom part of the figure represents thesimultaneously detected Raman spectrum. As already discussed for the results of the cell experiments in Fig. 3 the N-Raman line at608nm and the strongly broadened CH-band in-between 630-650 nm is clearly detectableunder engine running conditions. Although during detection at 18CA fuel droplets are stillpresent in the measurement volume there is no evidence for their existence in the spectrum(no stimulated emissions, no gas breakdown). The spatial extension of the inserted rectanglematches exactly the length of the LIF-profile in the graph above. By averaging over thespectral axis a spatial profile of the CH-Raman intensity (=relative gaseous fuel density)along the measurement volume isachieved.ThisRaman intensity profile and thecorresponding LIF profile are opposed in the right part of the figure. The good correlation of the intensity profiles extracted by the different measurementtechniques is conspicuous. This leads to the assumption that due to the absorbing dye in thefuel under the present conditions also the LIF-signal does not include any excessivecontribution from droplets where the molecular density of the fluorescing hydrocarbons isorders of magnitude higher than in the gas phase. More precise investigations concerningthis topic are presently under investigation. Apart from the determination of the relative fuel density based on the CH-Raman intensityalso quantitative spatially resolved A-values can be extracted from the Raman data bygenerating the ratio of N2- and CH-Raman intensity and calibration of this relative A with aknown A-value distribution. Since the engine is not fired during the experiments the use ofN2-intensity instead of O2-intensity is allowed. In this experiment the calibration step is not Fig. 6: Spatially resolved relative air/fuel ratio and probability density for gasoline appearance at 4different crank angles for a multi hole injector. yet carried out, so that only relative spatially resolved A-values for different crank angles arecalculated from the Raman data. In Fig. 6 examples of relative spatially resolved A-values for4 different crank angles 1 cm below a multihole injector tip are displayed. Clearly detectableis the decrease of the air/fuel ratio in the iaax1idali cstopnreay region with decreasing crank angle.Additionally it is clearly visible that in a radial distance of approx. 25 mm from the spray axisthe A-value increases strongly for every crank angle. Apart from the cyclic averaged investigation illustrated above also snap shot images of therelative fuel density distribution for different crank angles were accomplished. By means of athreshold consideration the probability density of the fuel along the linear measurementvolume was determined (see Fig. 6). This type of data evaluation enables insight into cyclicfluctuating quantities and delivers important information for the correct positioning of thespark plug and the stability of the ignition process in direct injection Otto engines. 4. Conclusion The present work describes a new method which enables a spatially resolved quantitativemeasurement of the air/fuel ratio in droplet laden flows and by use of regular gasoline (EuroSuper). The technique presented is based on the detection of spontaneous Raman scattering.In order to avoid interference from fluorescence emissions of aromatic hydrocarbons visiblelaser radiation (532 nm) is applied. It is shown, that occurring stimulated as well asspontaneous Raman emissions from fuel droplets can be suppressed effectively by decreasingthe droplet resonator quality at the wavelength of the incident laser light. This technique isapplied to a direct injection Otto transparent engine where for the first time interference freeA-values could be measured in the droplet laden flow of the regular gasoline spray. Cyclicaland crank angle resolved quantitative investigations of the instantaneous gaseous gasolinedistribution are accomplished which for the first time enables realistic evaluation of thespatial and temporal fluctuation behavior of the gaseous fuel density and the A-value by useof regular gasoline. ( 5. References ) [1] Schuette M., Gruenefeld G., Nassif-Pugsley D., Andresen P., Hentschel W., Homburg A.,Air/Fuel-Ratio Measurementsin Direct -Injection Gasoline Spraysusing 1-D RamanScattering, SAE Technical Paper No. 2000-01-0244(2000) 2 Knapp M., Beushausen V., Hentschel W., Manz P., Gruenefeld G., Andresen P., In-CylinderMixture Formation Analysis with Spontaneous Raman Scattering Applied to a Mass-ProductionSI Engine, SAE Technical Paper No. 970827 (1997) [3] Borchers M. A., Esen, C. Schweiger G., Cascade lasing with spherical micro particles, Opt.Lett. 26,346-348 (2001) [4] Esen C., Janetta F., Borchers M. A., Laseremission in spharischen Mikropartikeln, LaserOpto32(6),41-46 (2000) [5] Mueller T., Gruenefeld G., Beushausen V., High-Precision Measurement of the Temperature ofMethanol and Ethanol Droplets using Spontaneous Raman Scattering, Appl. Phys. B 70,55-158(2000)
确定
还剩7页未读,是否继续阅读?

产品配置单


北京欧兰科技发展有限公司为您提供《汽车发动机中空燃比,空间分辨空燃比,燃料浓度检测方案(尾气检测)》,该方案主要用于汽车电子电器中空燃比,空间分辨空燃比,燃料浓度检测,参考标准--,《汽车发动机中空燃比,空间分辨空燃比,燃料浓度检测方案(尾气检测)》用到的仪器有汽车发动机多参量测试系统、德国LaVision PIV/PLIF粒子成像测速场仪、PLIF平面激光诱导荧光火焰燃烧检测系统
推荐专场


相关方案
更多
该厂商其他方案
更多