


方案详情
文
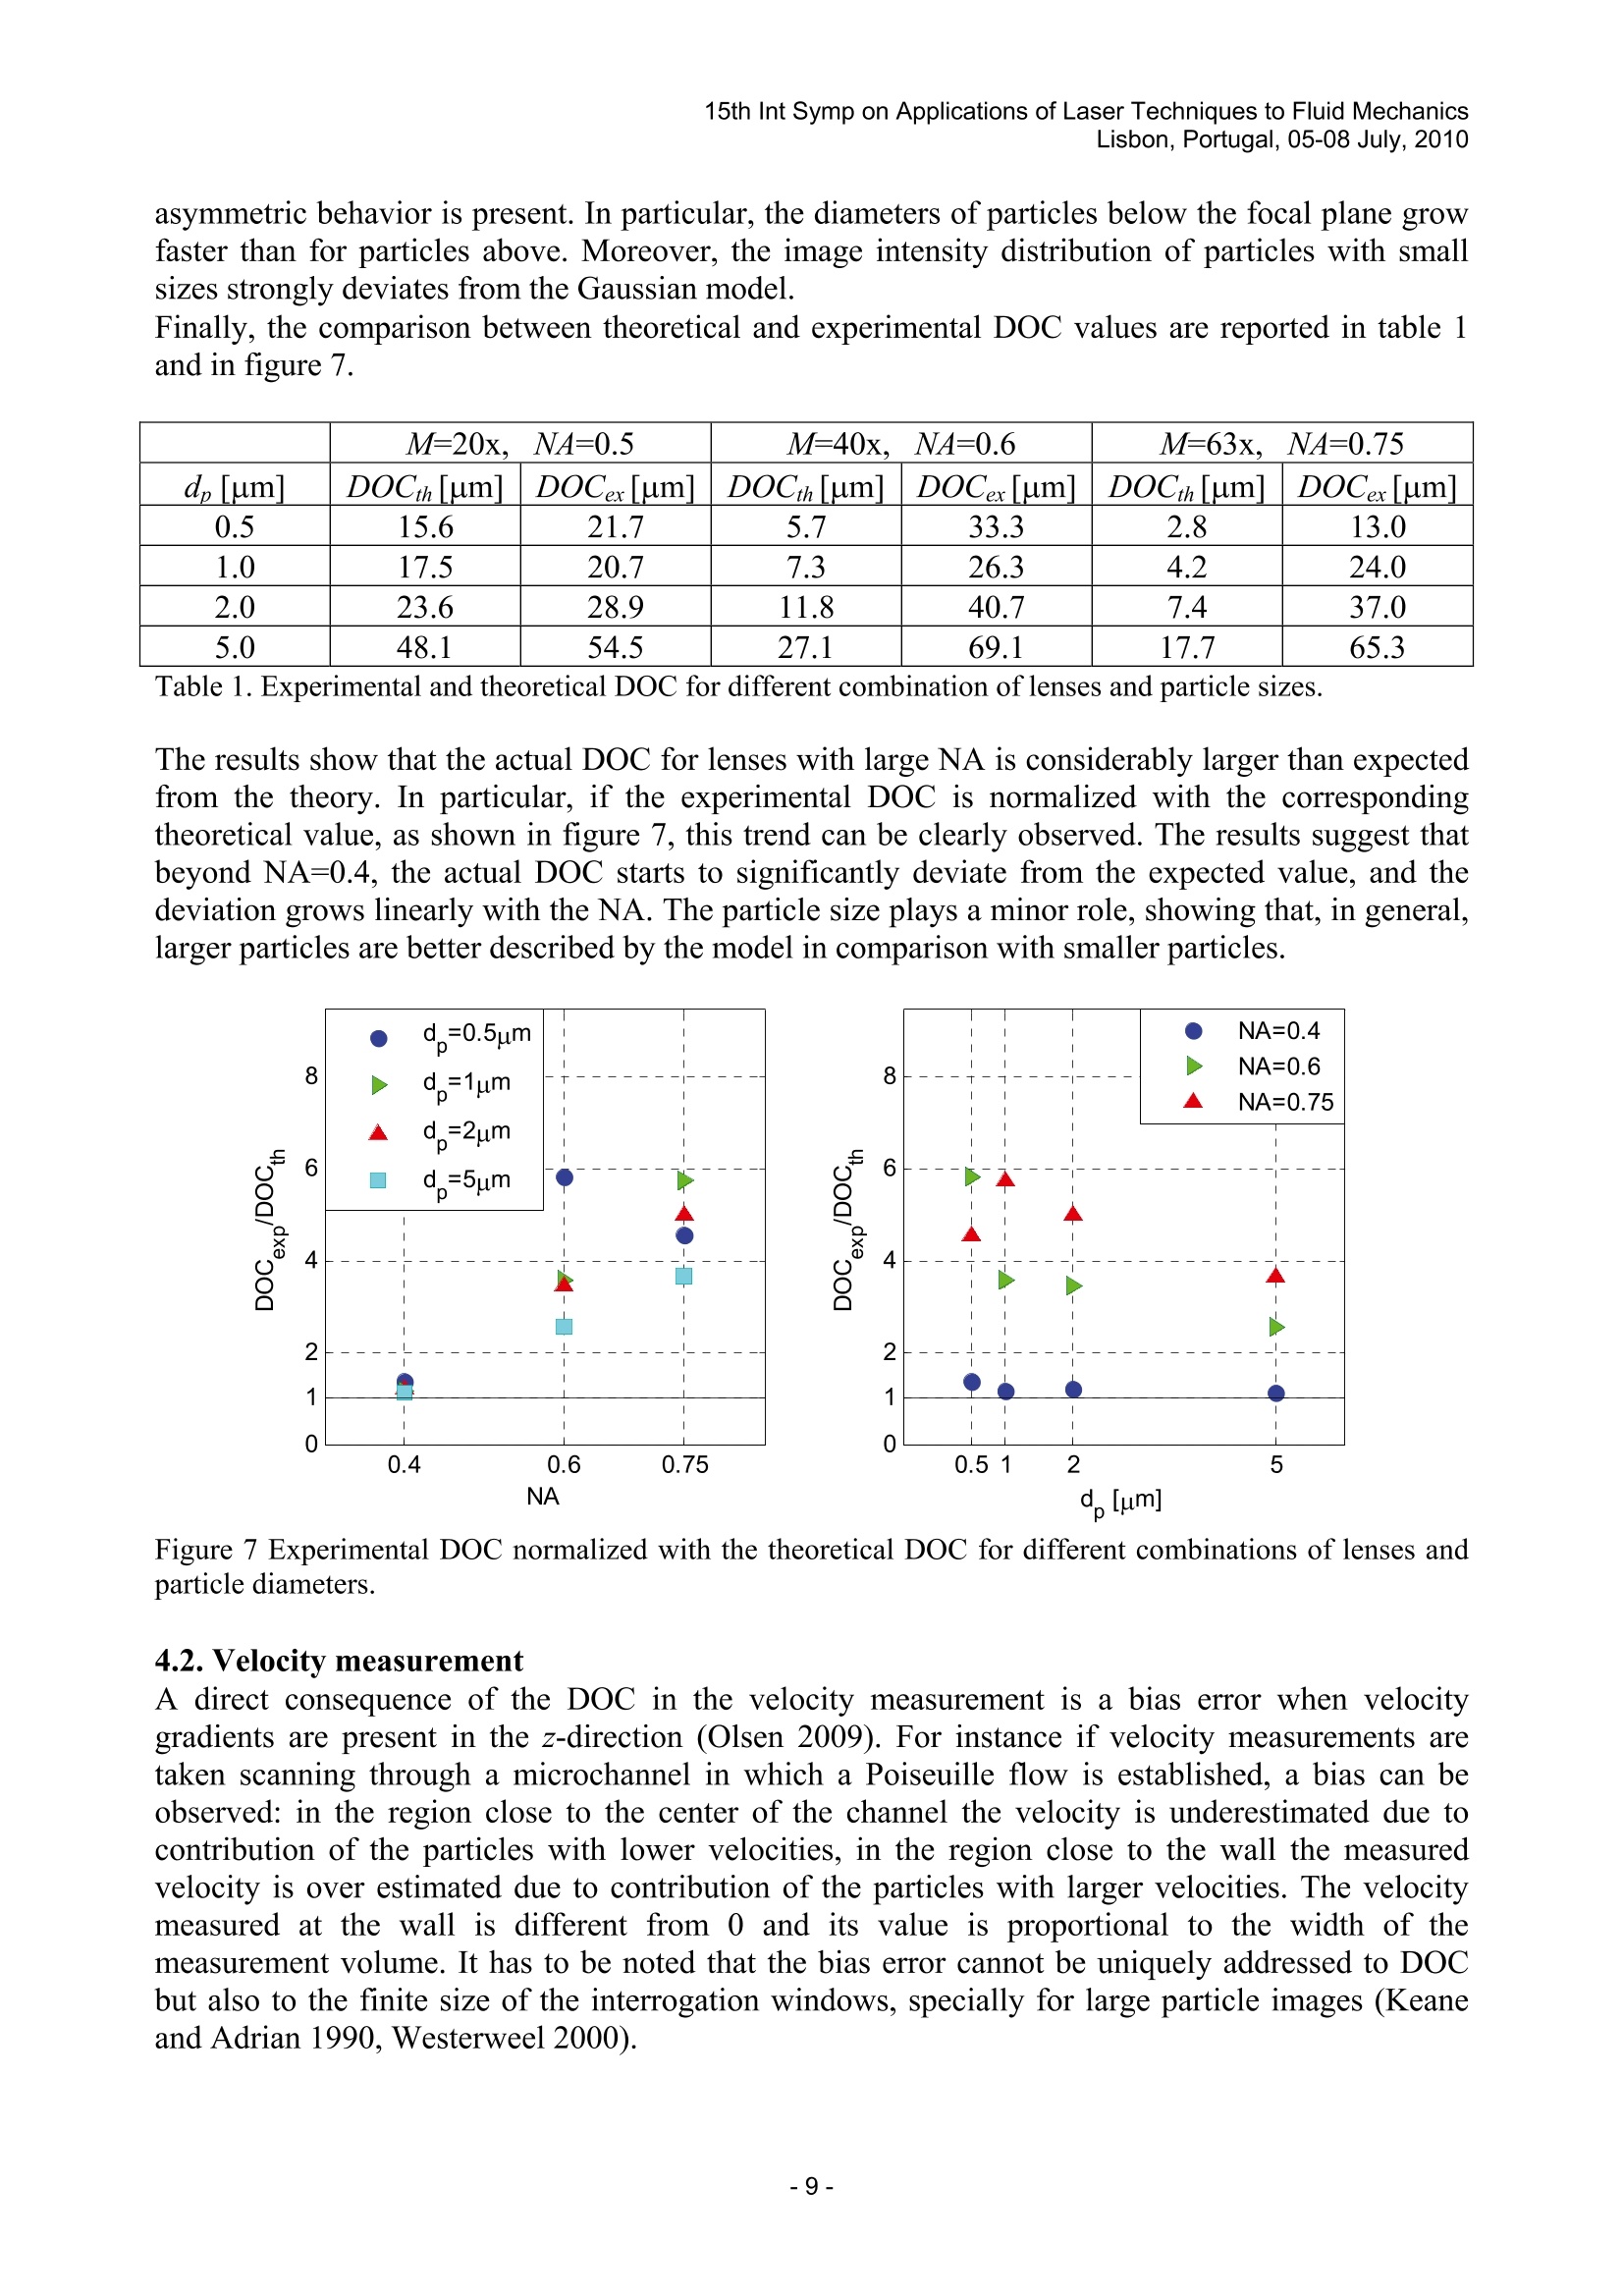
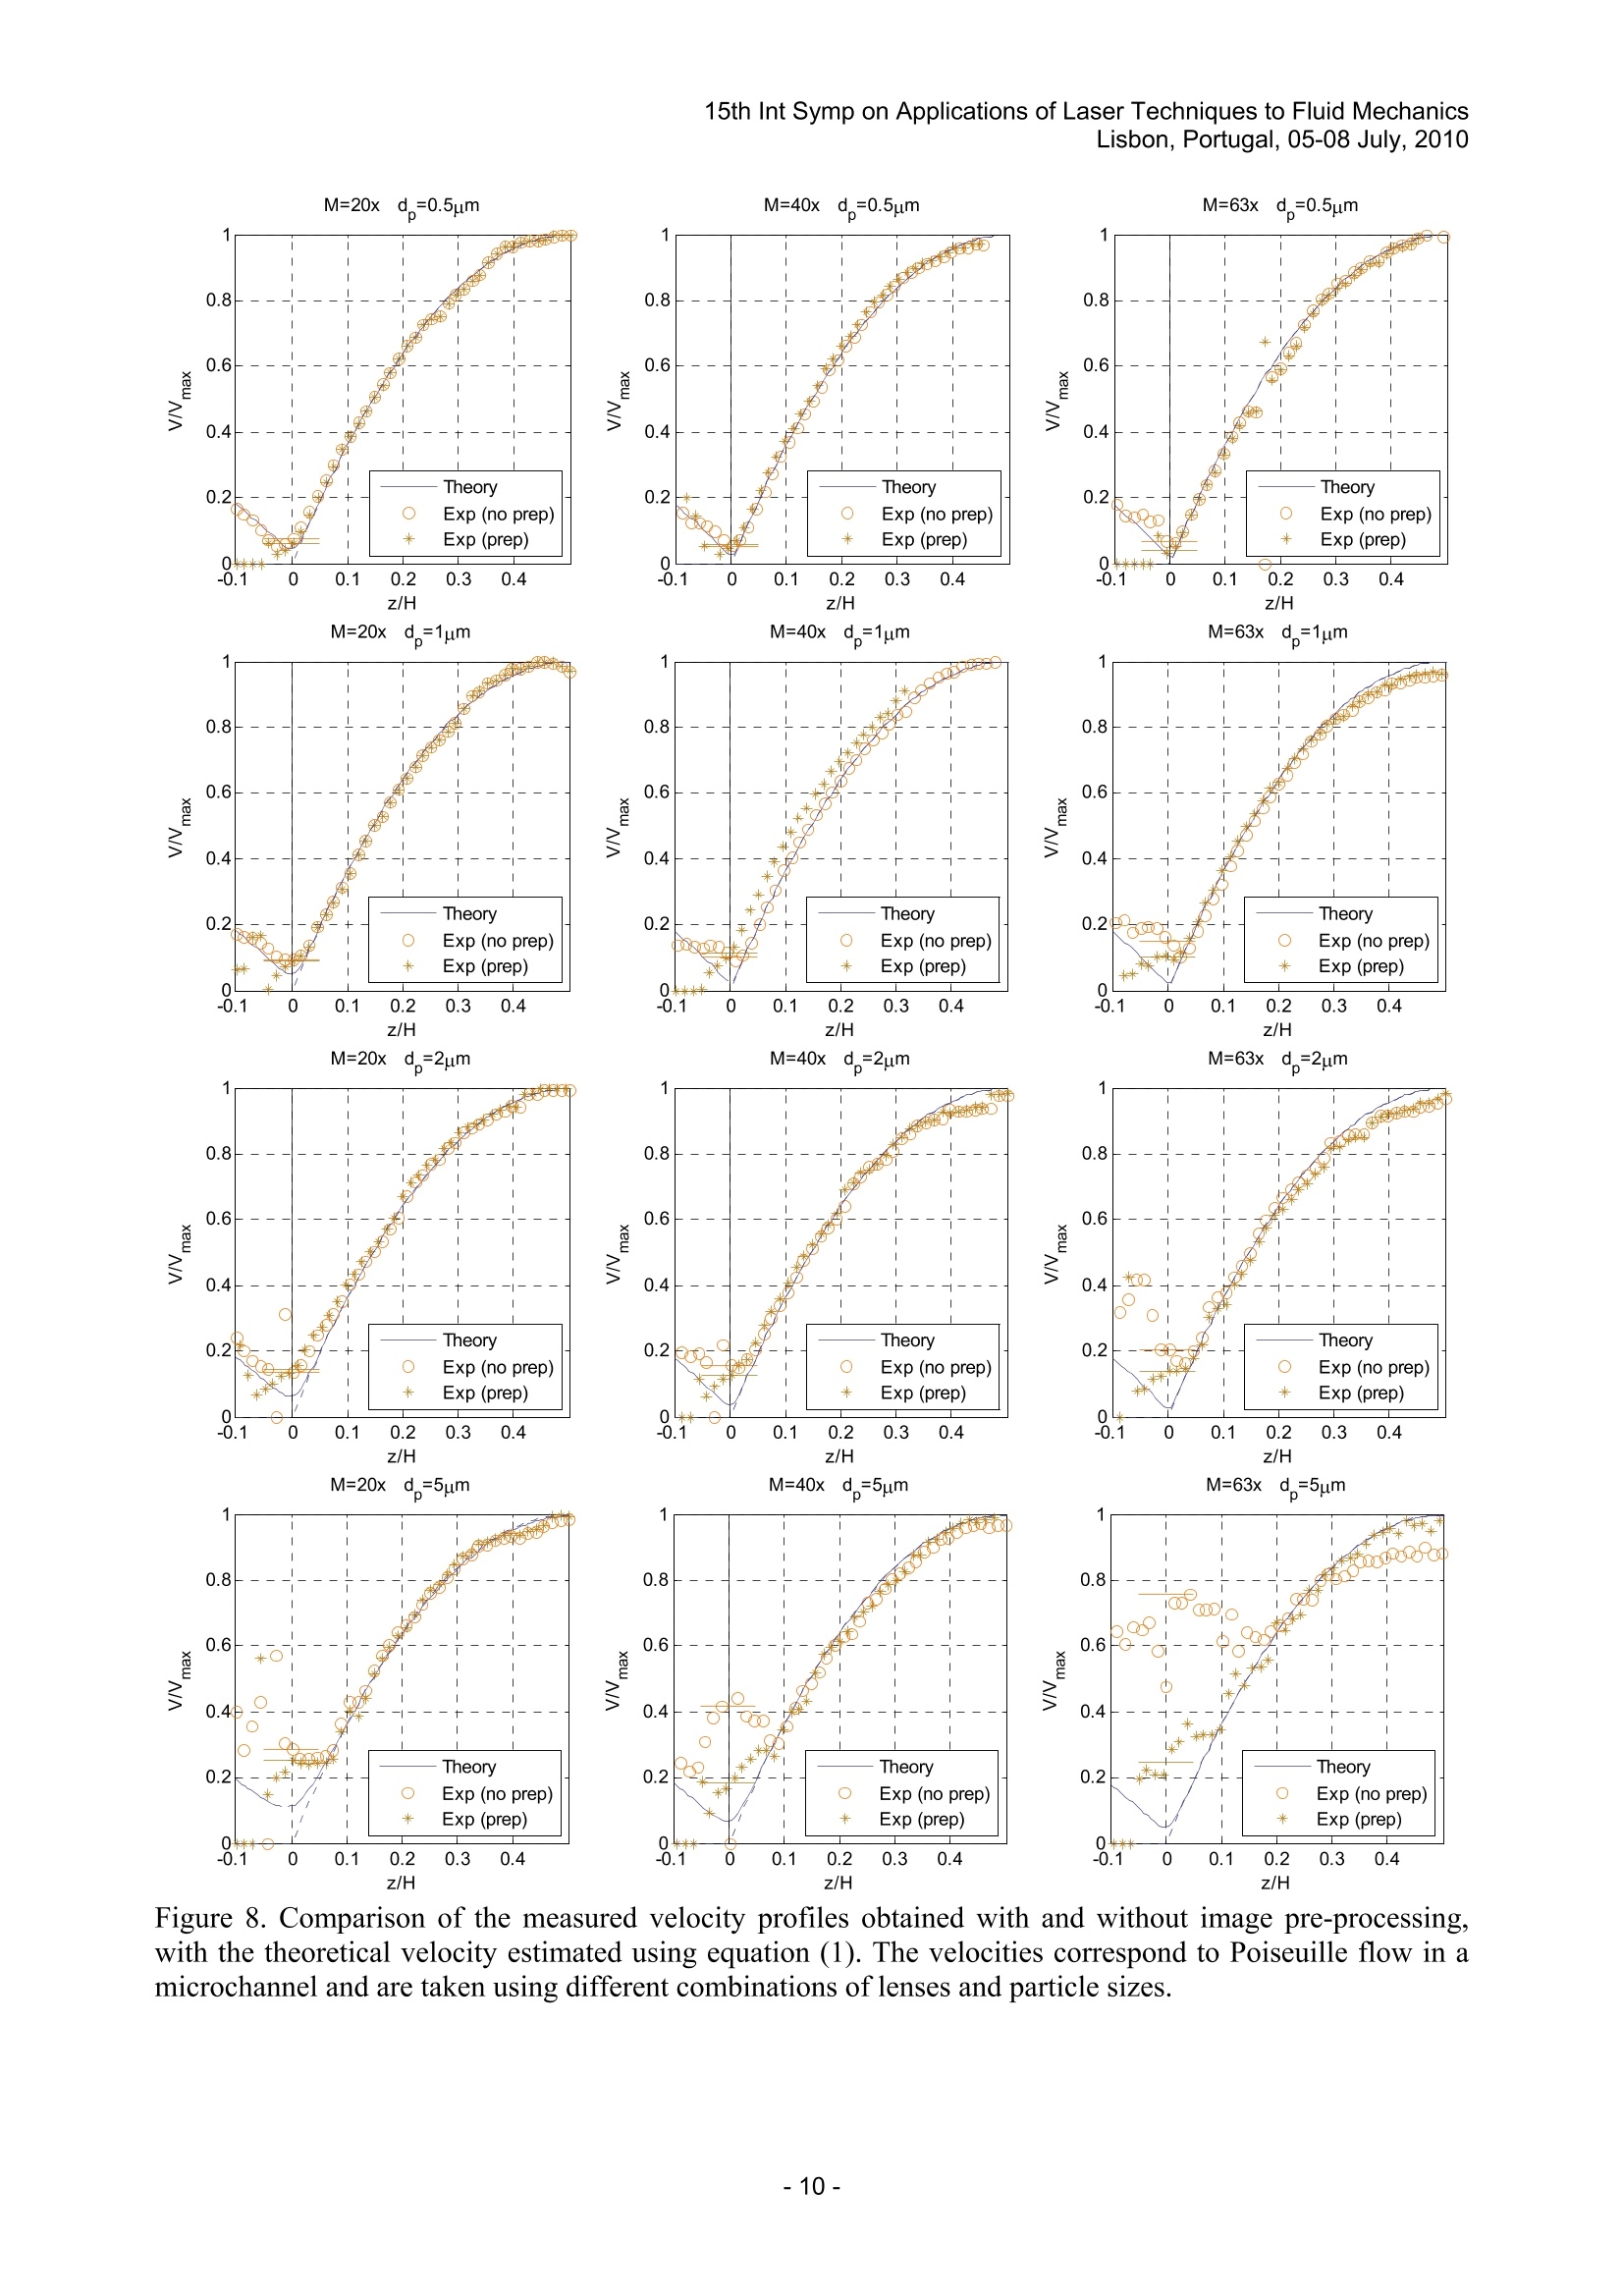
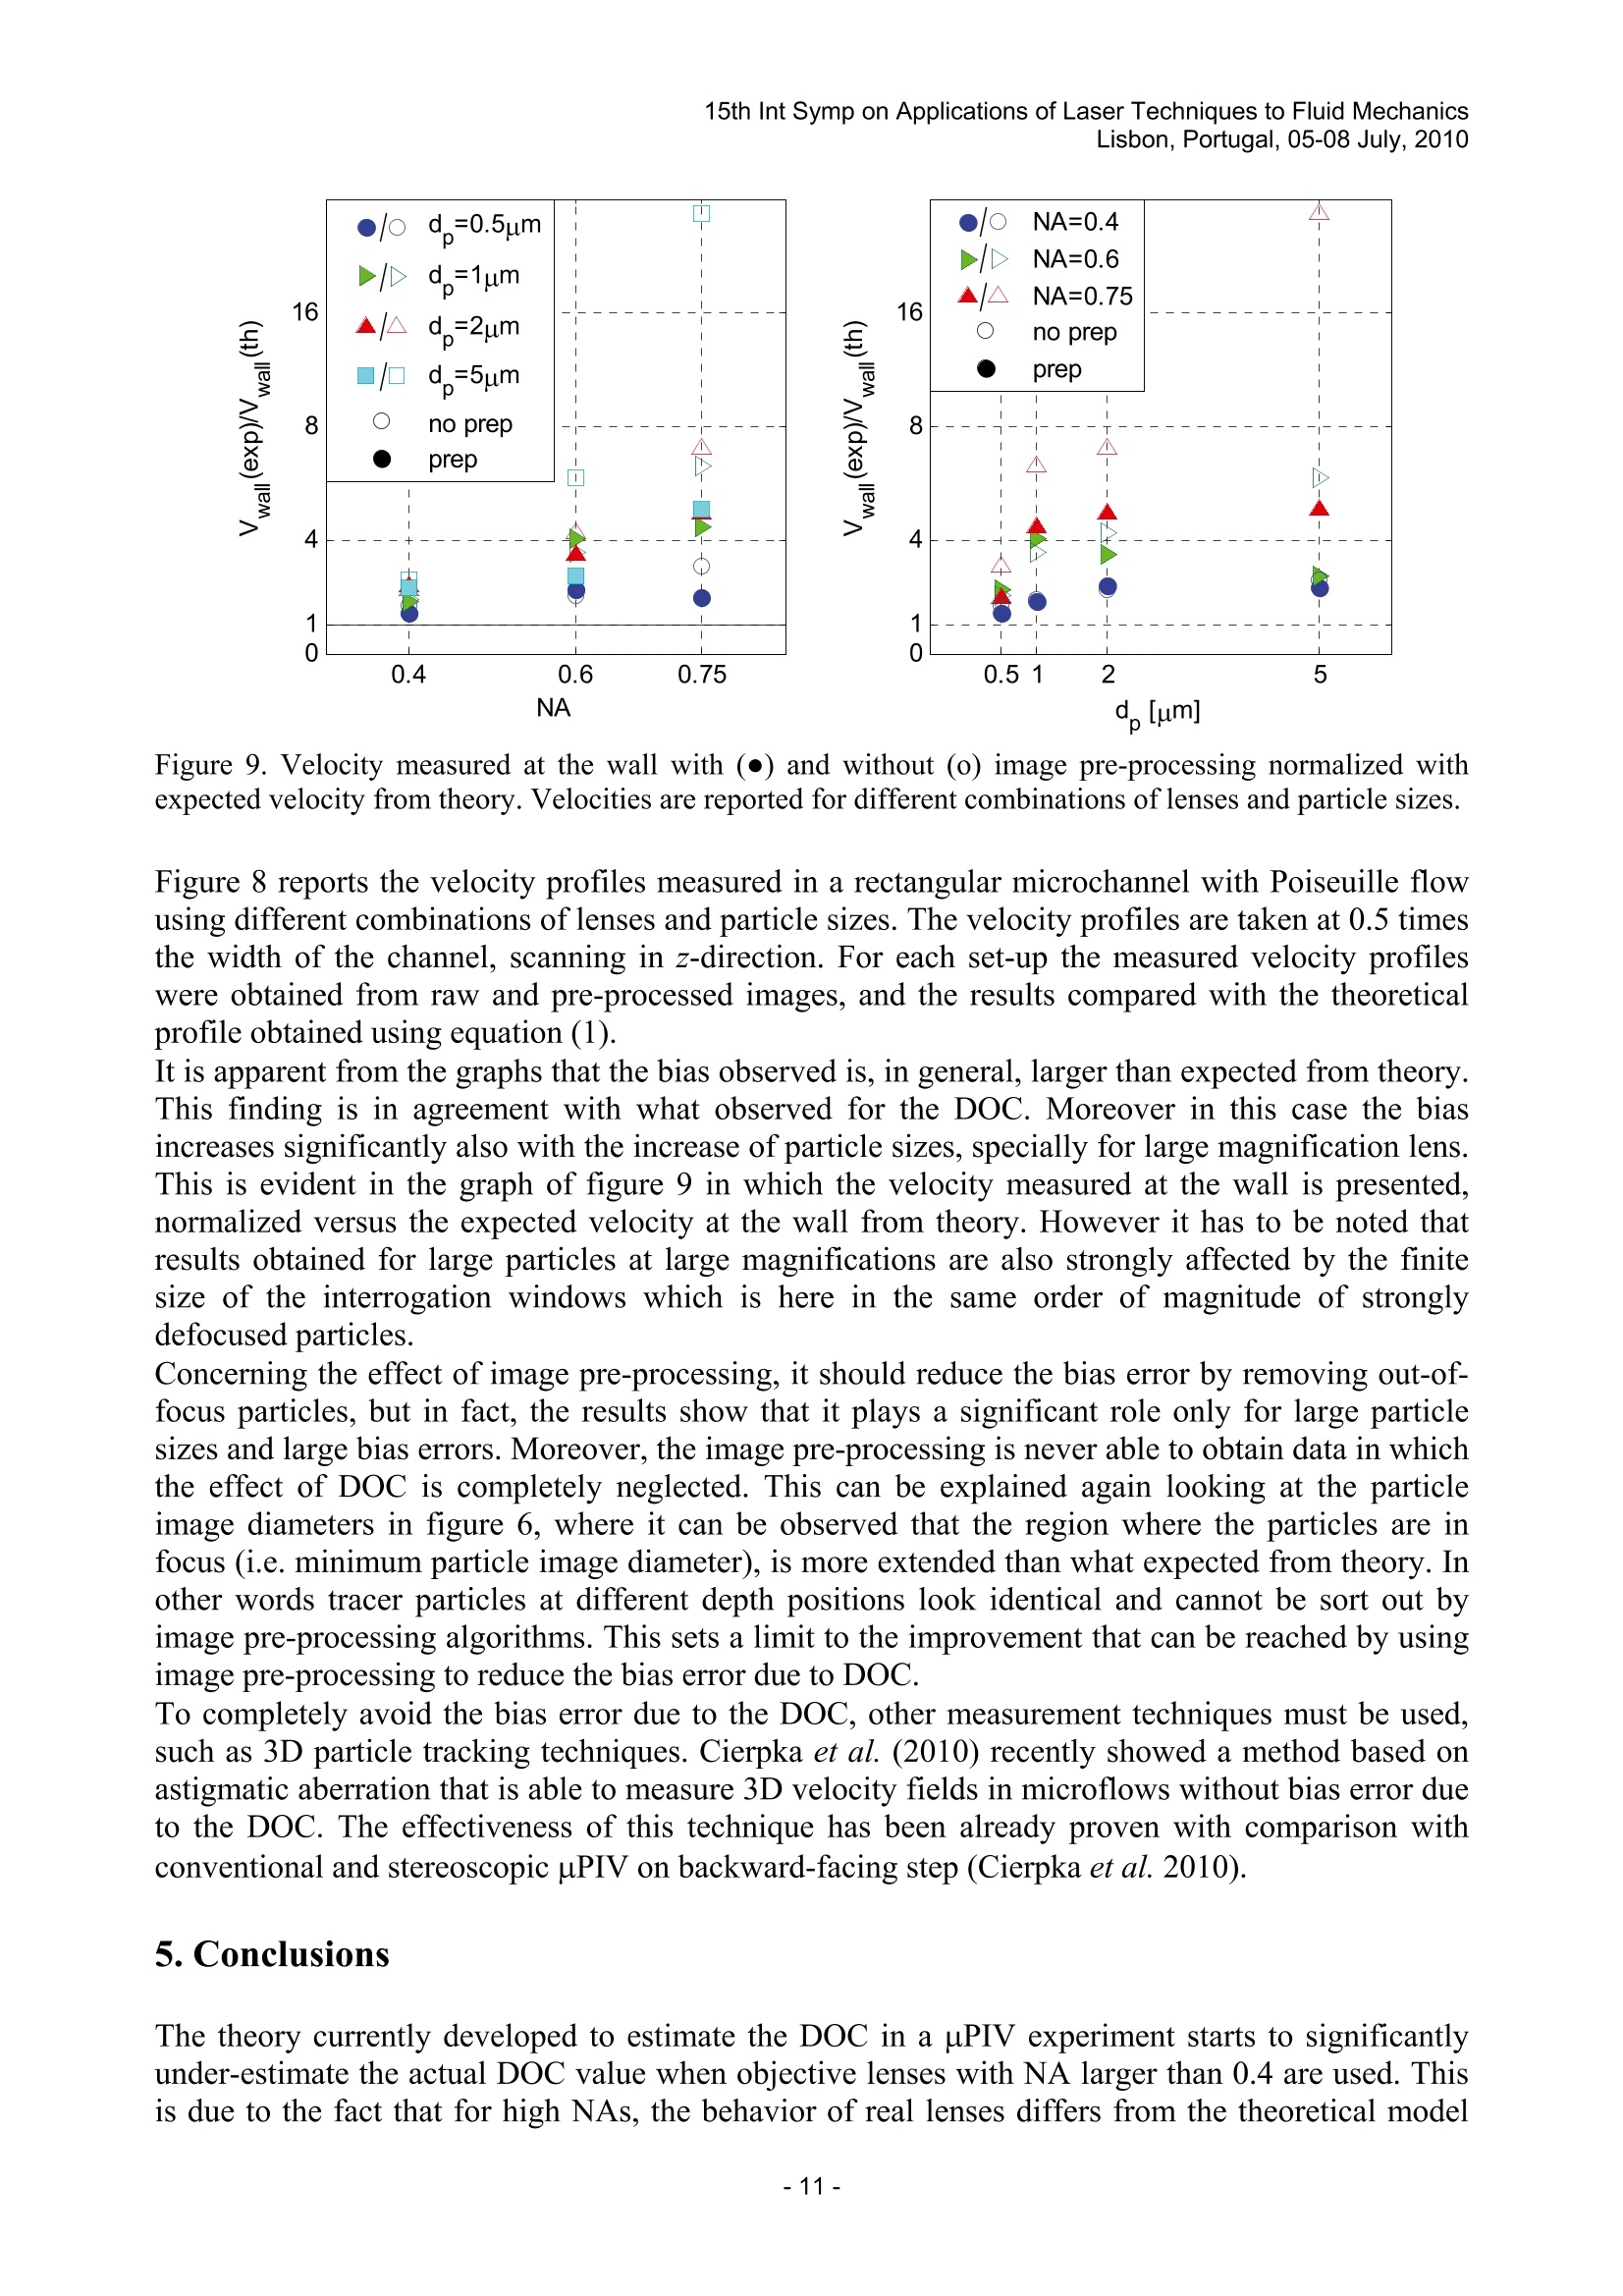
The depth of correlation (DOC) is an experimental parameter, introduced to quantify the thickness of the measurement volume and thus the depth resolution in microscopic particle image velocimetry (μPIV). The theory developed to estimate the value of the DOC relies on some approximations that are not always verified in actual experiments, such as the use of a Gaussian function to describe the particle image intensity distribution. In addition, the application of image pre-processing, widely used in μPIV evaluations, significantly contributes to modify the actual size of the DOC. In the presented paper, the effect of real particle image intensity distribution and image pre-processing on the thickness of the measurement volume is investigated. Furthermore, the bias error induced by the DOC in μPIV measurements is qualified on a Poiseuille flow in a microchannel. Results and guidelines to appropriately reduce the bias error due to DOC are discussed.
方案详情

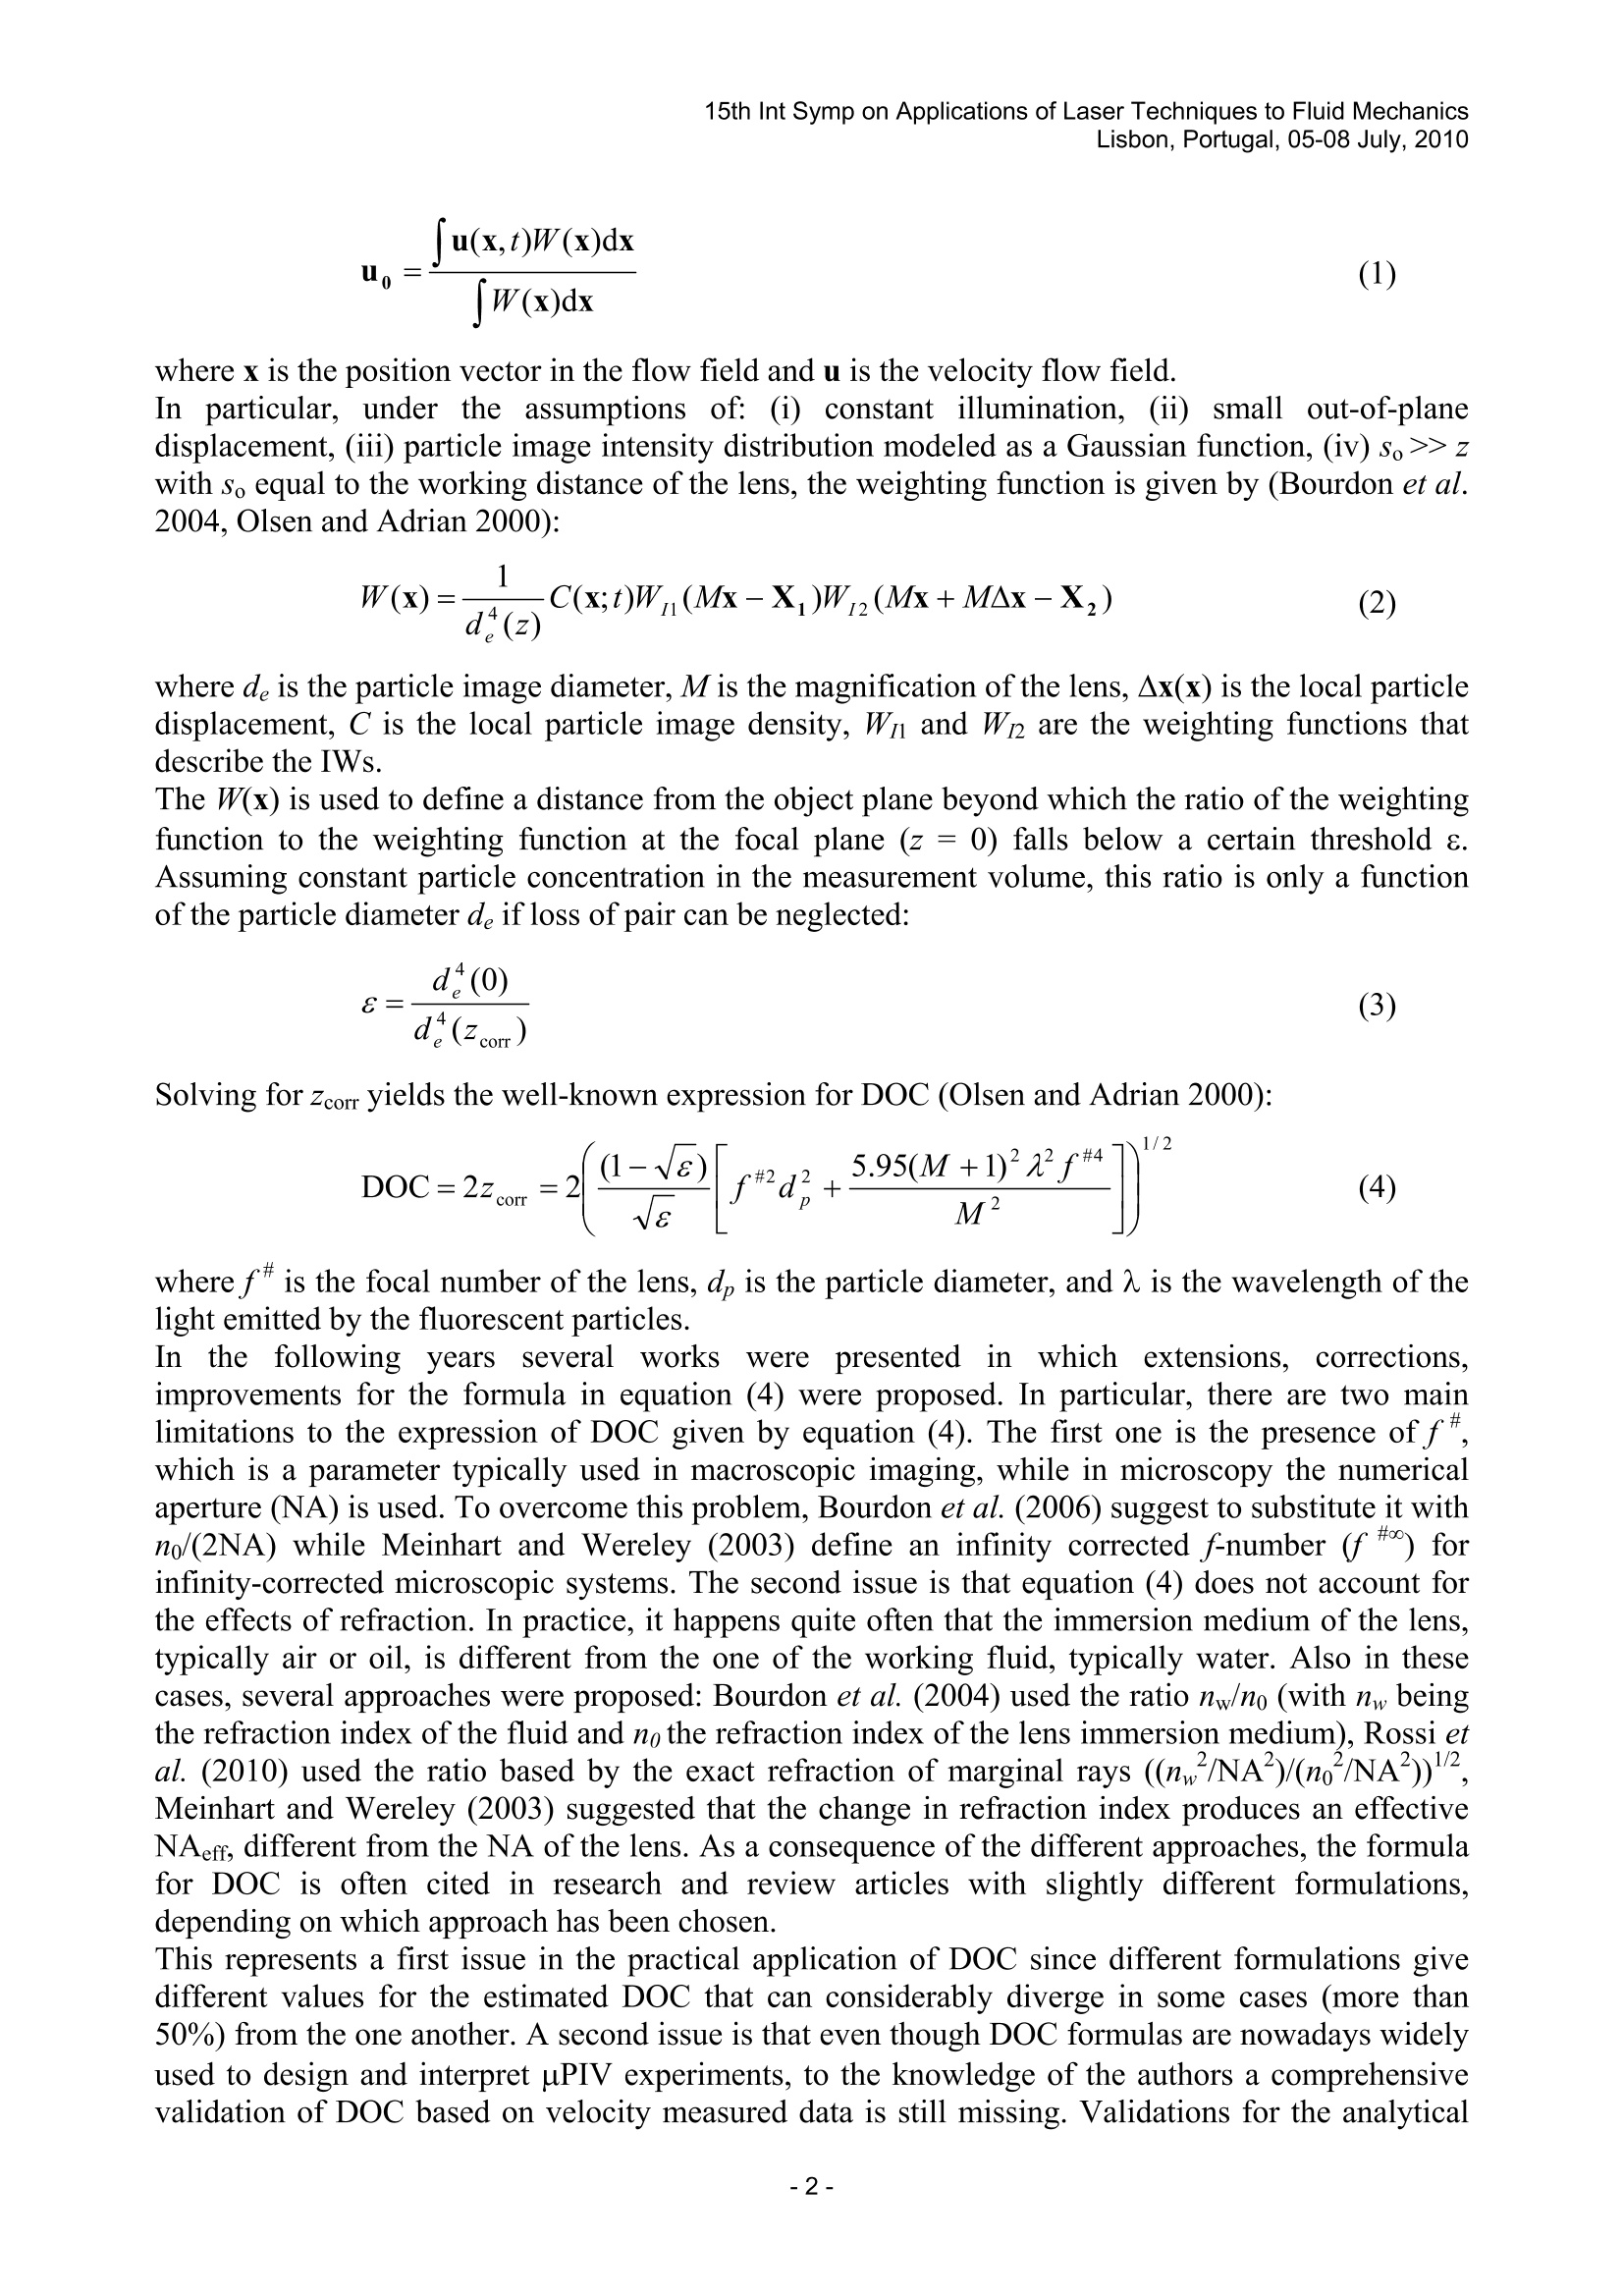
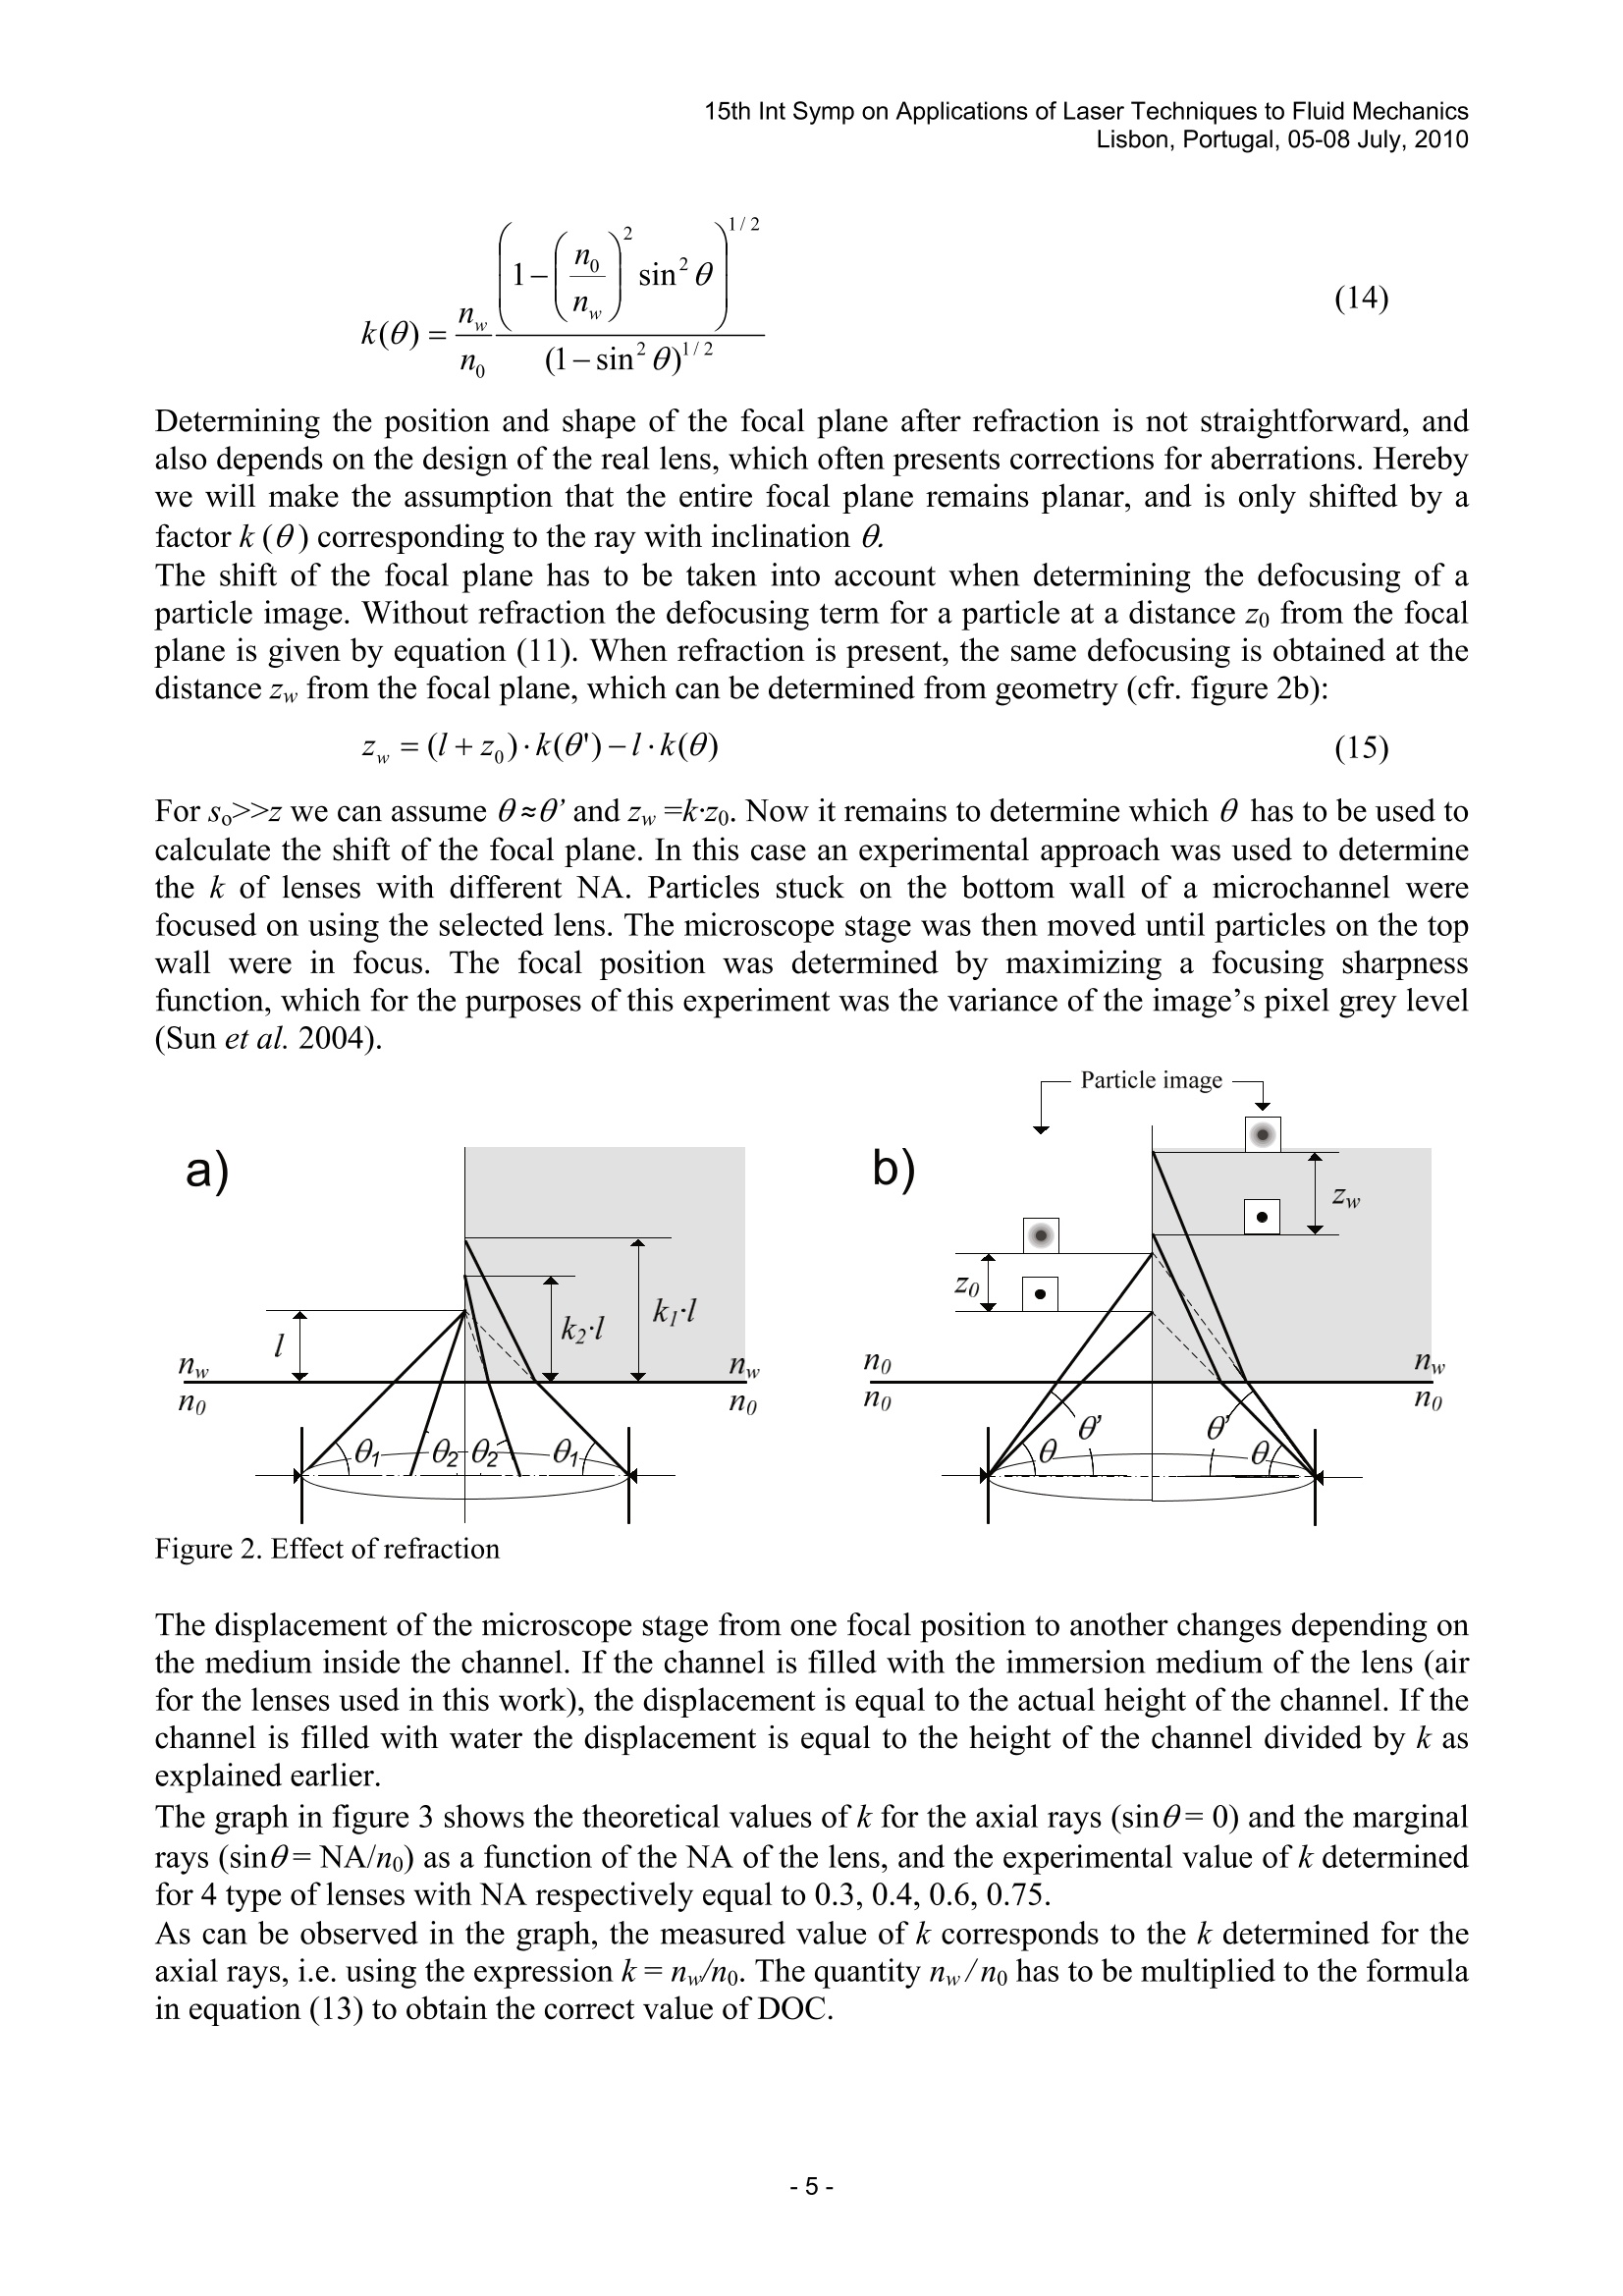
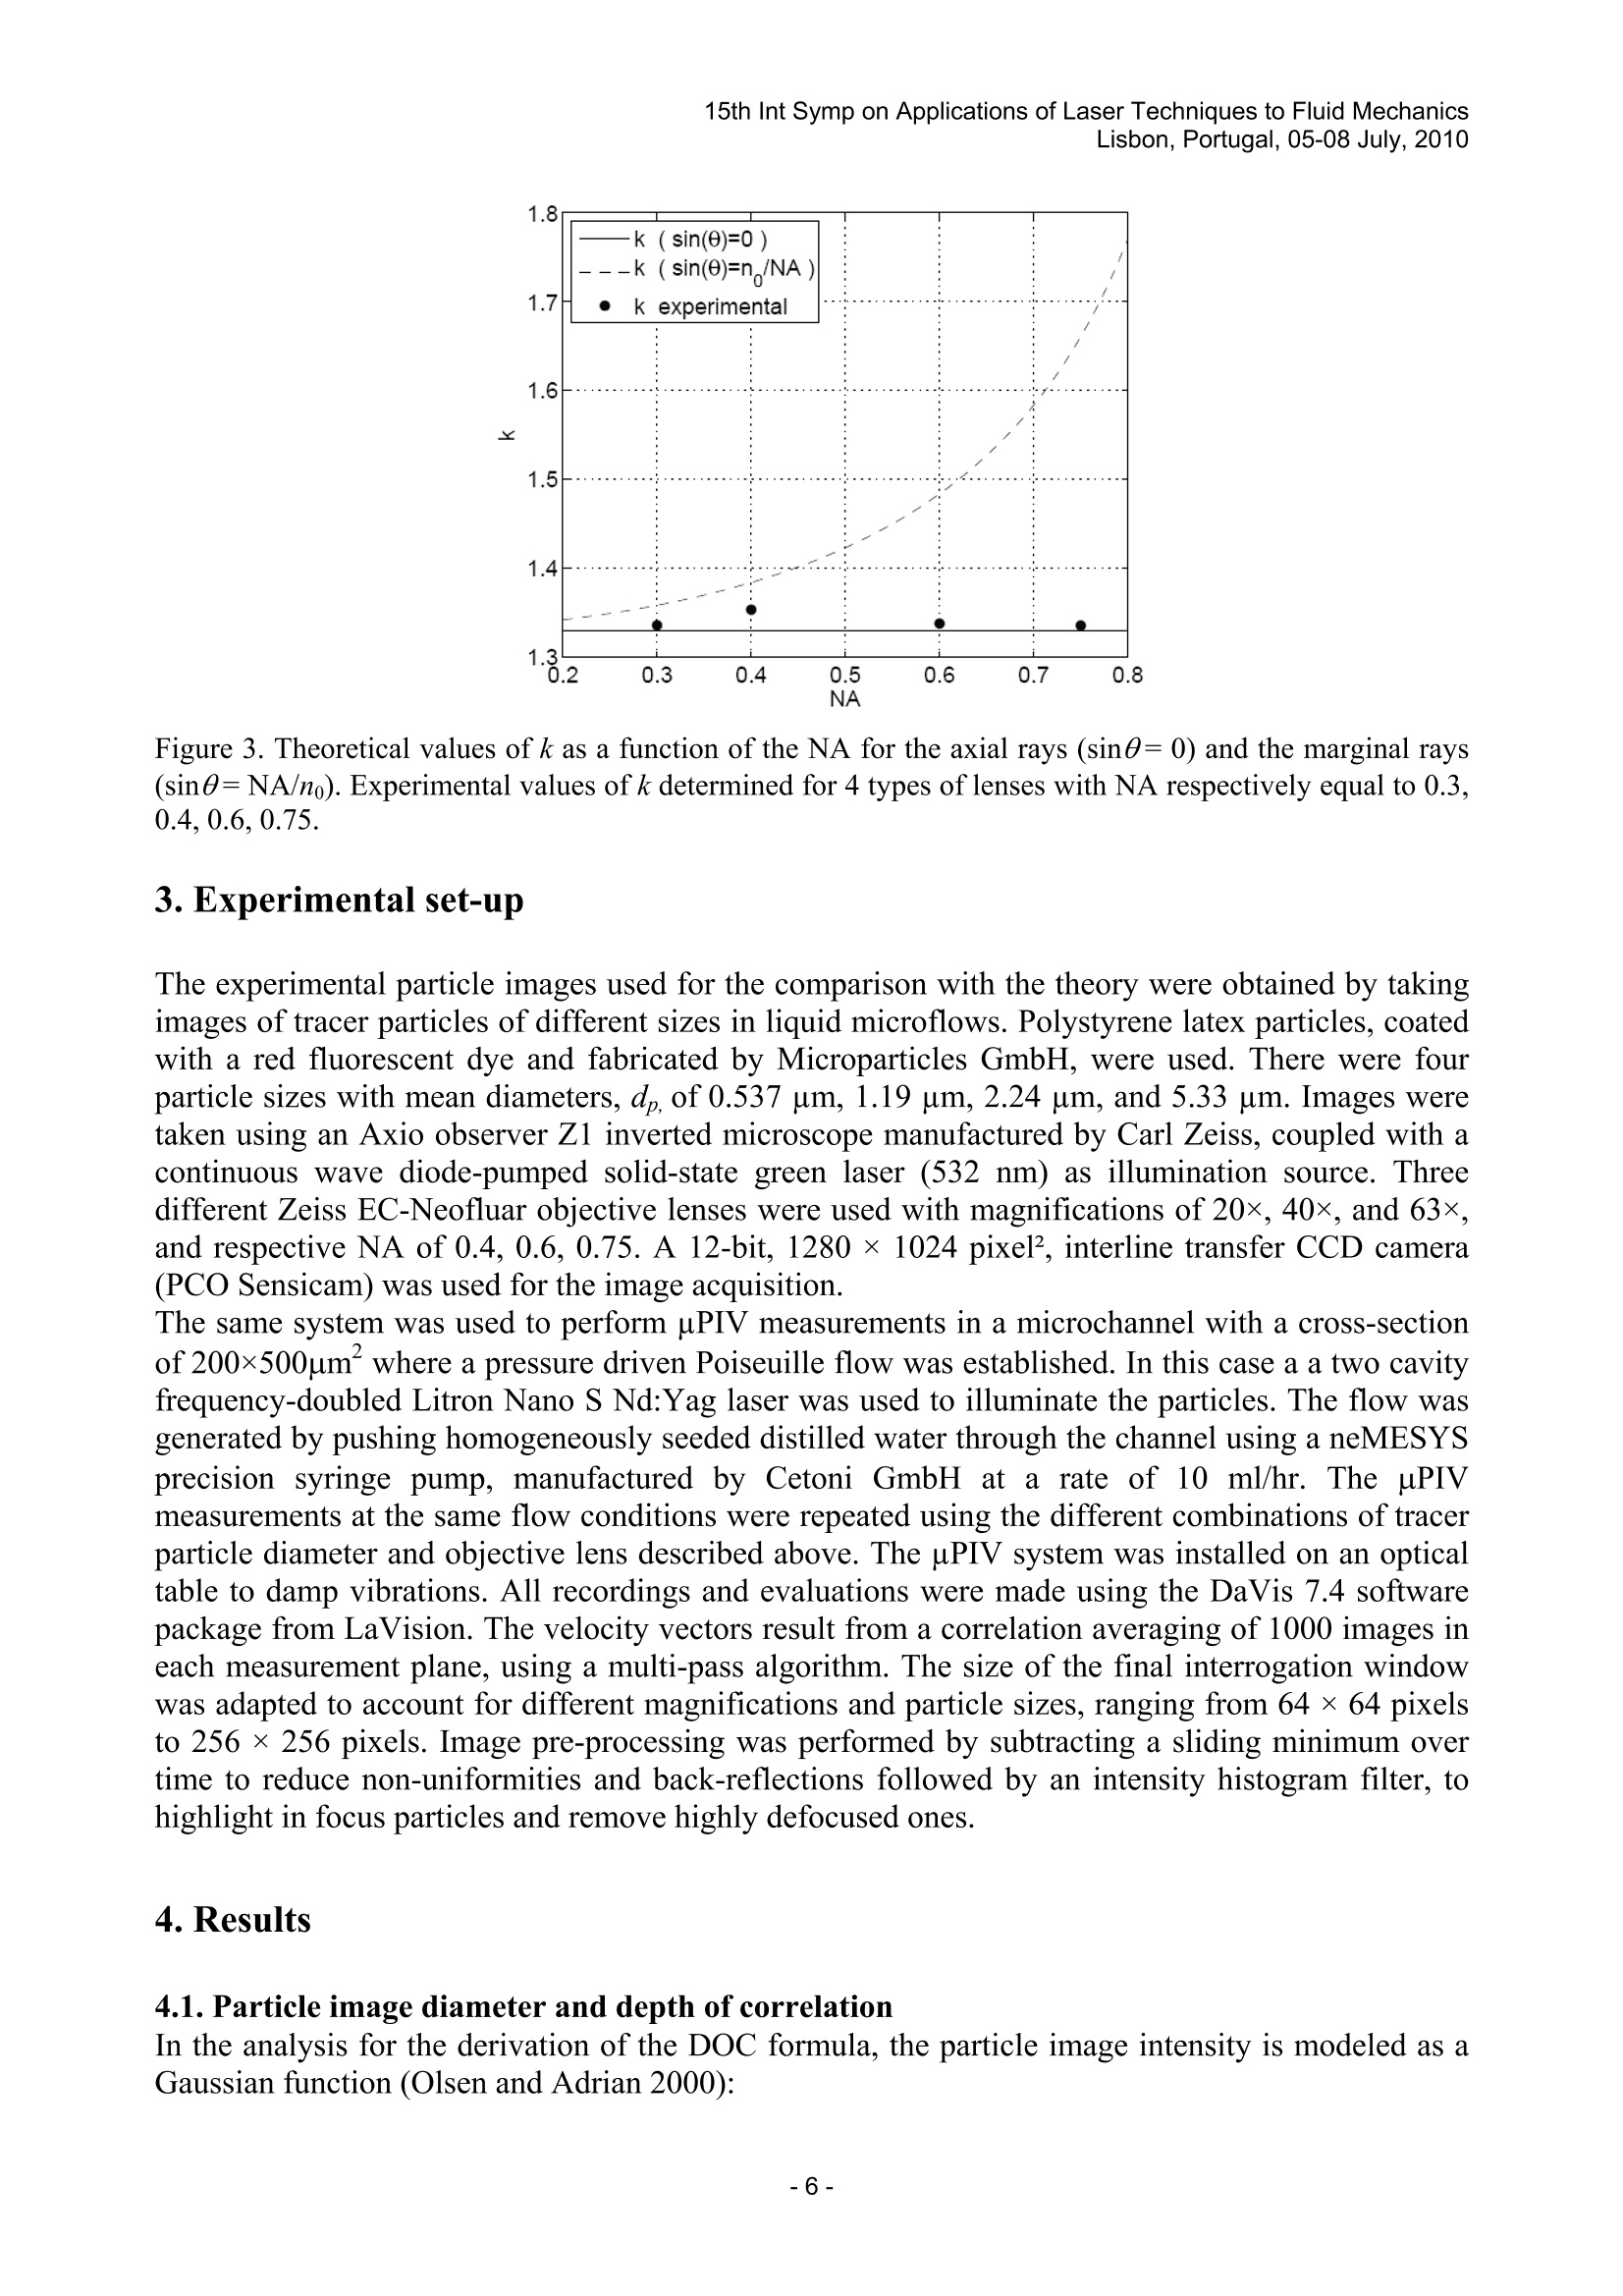
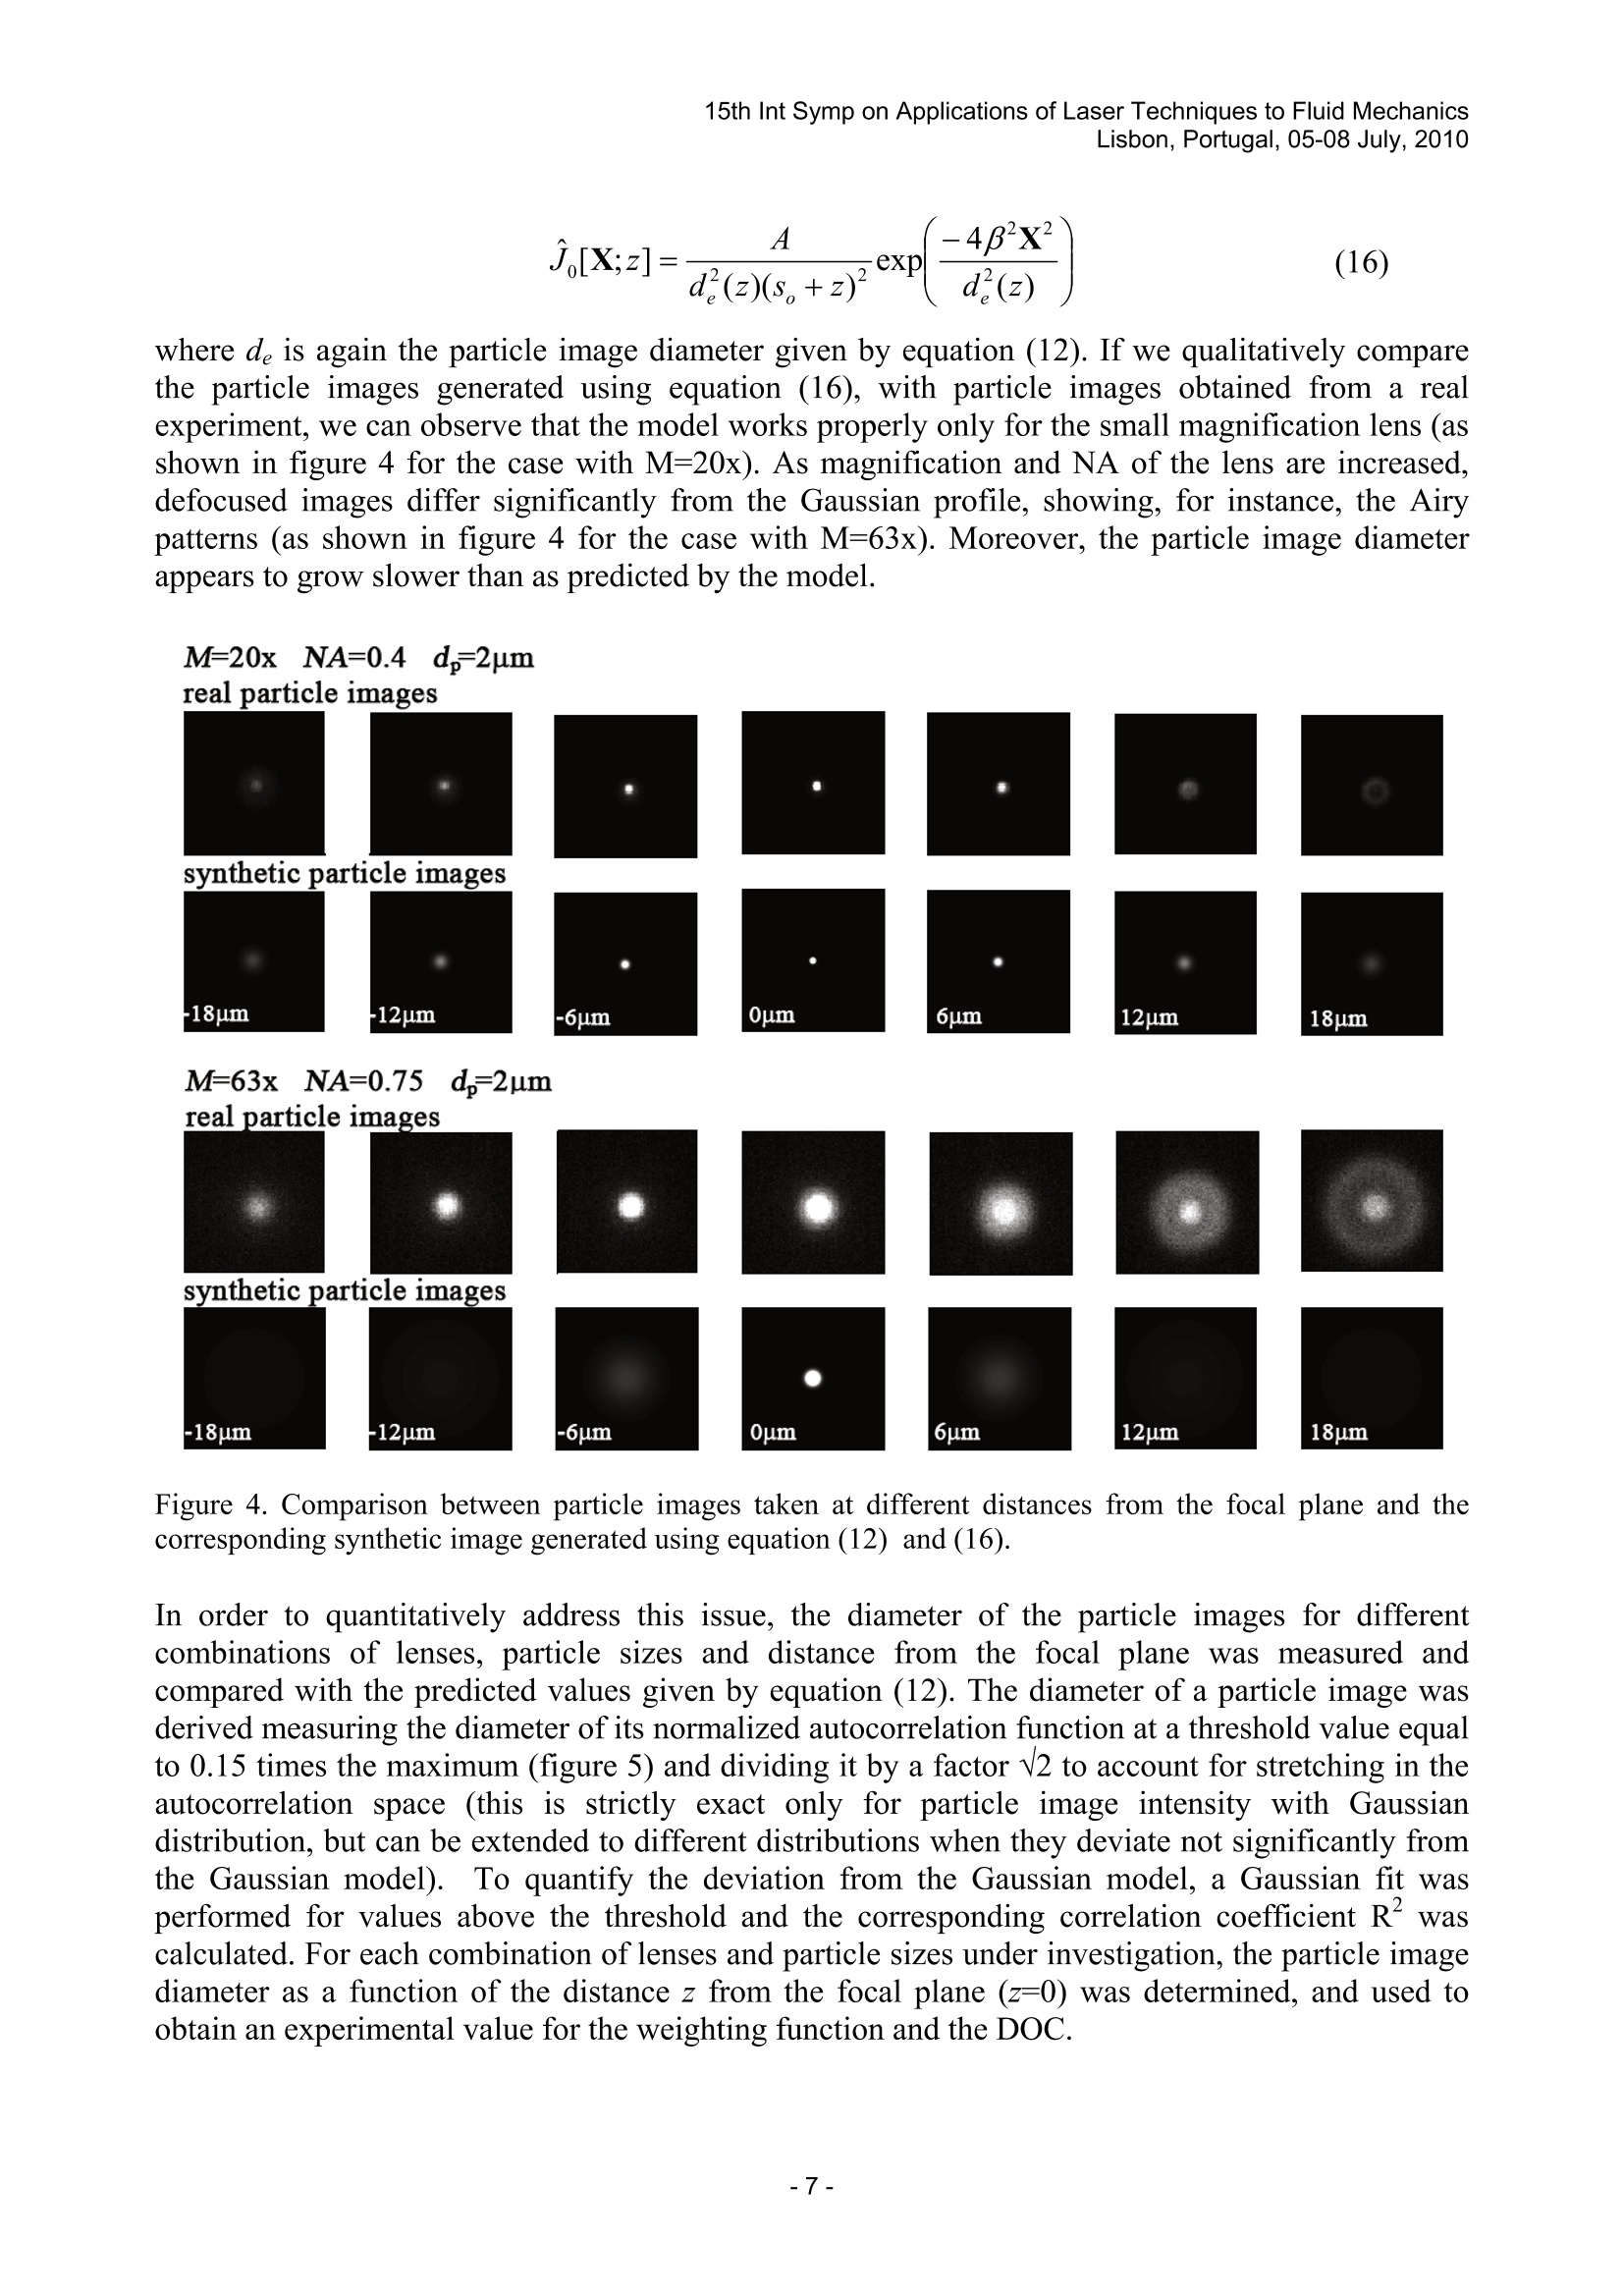
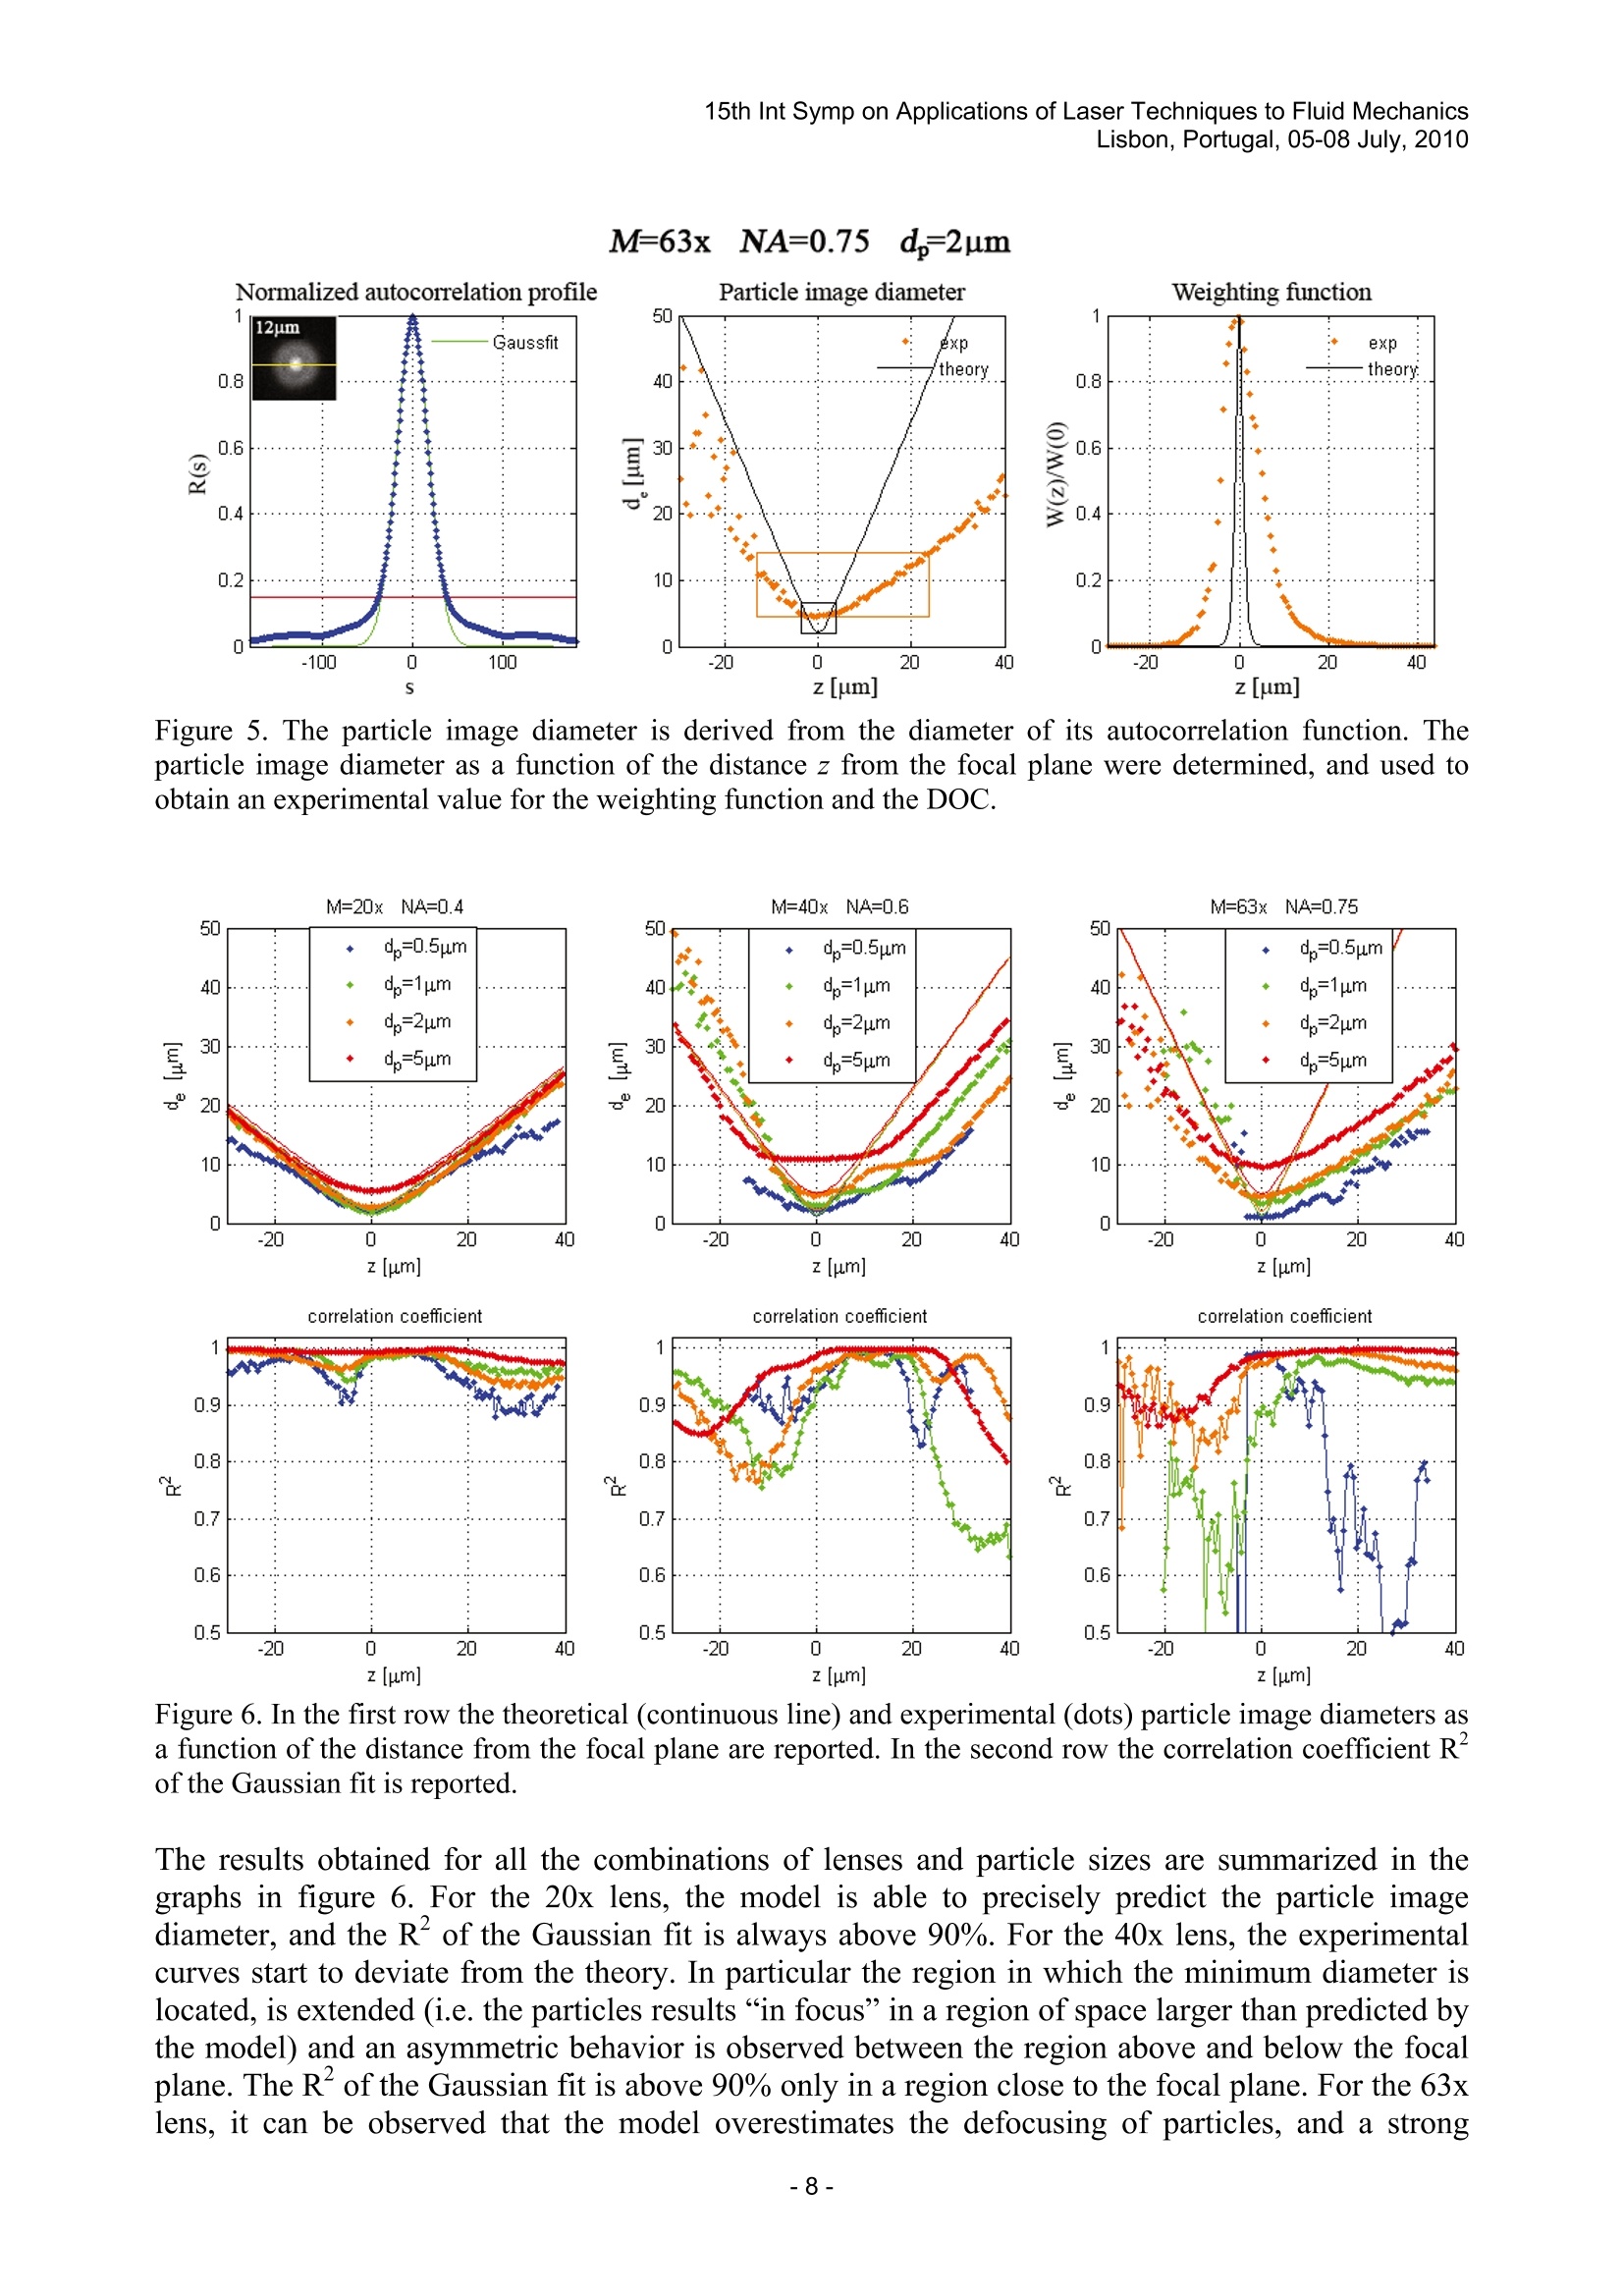
15th Int Symp on Applications of Laser Techniques to Fluid MechanicsLisbon, Portugal, 05-08July, 2010 On the effect of particle image intensity and image preprocessing on depth ofcorrelation in micro-PIV Massimiliano Rossi, Christian Cierpka, Rodrigo Segura, Christian J. Kahler Institute of Fluid Dynamics and Aerodynamics, Universitat der Bundeswehr Miinchen, Neubiberg, Germany. [Christian.Cierpka, Massimiliano.Rossi, Rodrigo.Segura, Christian.Kaehler]@unibw.de Abstract The depth of correlation (DOC) is an experimental parameter, introduced to quantify the thicknessof the measurement volume and thus the depth resolution in microscopic particle image velocimetry (uPIV).The theory developed to estimate the value of the DOC relies on some approximations that are not alwaysverified in actual experiments, such as the use of a Gaussian function to describe the particle image intensitydistribution. In addition, the application of image pre-processing, widely used in uPIV evaluations,significantly contributes to modify the actual size of the DOC. In the presented paper, the effect of realparticle image intensity distribution and image pre-processing on the thickness of the measurement volume isinvestigated. Furthermore, the bias error induced by the DOC in uPIV measurements is qualified on aPoiseuille flow in a microchannel. Results and guidelines to appropriately reduce the bias error due to DOCare discussed. 1. Introduction Micro-particle image velocimetry (uPIV) (Santiago et al. 1998) is nowadays a well-established,widely-used technique to measure the fluid motion in microfluidic devices (Lindken et al. 2009).uPIV is a variation of the well-known technique for macroscopic flows known as particle imagevelocimetry (PIV). Both techniques derive the velocity from the measured displacement of tracerparticles suspended in the fluid. The displacement is obtained from the comparison of twosubsequent digital images (image pair) of the particles in the flow, separated by a known timeinterval. The images are then divided in small regions, referred to as interrogation windows (IW)and the mean particle image displacement in each IW is determined performing a cross-correlationbetween the two images. One of the most critical points in the application ofuPIV, and main difference with macroscopicPIV, concerns the illumination ofthe particles. In standard PIV, a laser light sheet is generated toilluminate a region in the flow. The depth of field of the camera is typically larger than thethickness of the laser sheet and therefore the thickness of the measurement plane is mainly definedby the thickness of the light sheet, more precisely also the light sheet intensity distribution, the sizeof the particles and the camera sensitivity have to be taken into account. Creating a thin laser sheetis obviously very difficult, or not possible at all, in a device with micrometric dimensions.Therefore, in uPIV, the entire flow field is illuminated. As a consequence of this, all the particles inthe volume are illuminated and the thickness of the measurement plane is defined by the depth offield of the microscope objective. In uPIV experiments, the concept of depth of correlation (DOC)is commonly adopted, defined as twice the distance from the object plane to the nearest plane inwhich a particle becomes sufficiently defocused so that it no longer contributes significantly to thecross-correlation analysis (Meinhart et al. 2000). Precisely quantifying the DOC for a specific uPIV set-up is an important issue to properly designthe experiment and correctly interpret the data. An analytical expression for the DOC was providedfirst by Olsen and Adrian (2000). Their analysis began by deriving a weighting function that couldbe used to calculate the measurement bias due to DOC, defined as: where x is the position vector in the flow field and u is the velocity flow field.In particular, under the assumptions of: (i) constant illumination, (ii) small out-of-planedisplacement, (iii) particle image intensity distribution modeled as a Gaussian function, (iv) s,>> zwith s, equal to the working distance of the lens, the weighting function is given by (Bourdon et al.2004,Olsen and Adrian 2000): where de is the particle image diameter, M is the magnification of the lens, Ax(x) is the local particledisplacement, C is the local particle image density, Wn and Wn are the weighting functions thatdescribe the IWs. The W(x) is used to define a distance from the object plane beyond which the ratio of the weightingfunction to the weighting function at the focal plane (z=0) falls below a certain threshold e.Assuming constant particle concentration in the measurement volume, this ratio is only a functionof the particle diameter de if loss of pair can be neglected: Solving for Zcor yields the well-known expression for DOC (Olsen and Adrian 2000): where f"is the focal number of the lens, d, is the particle diameter, and is the wavelength of thelight emitted by the fluorescent particles. In the following years several works werepresentteedd in which extensions.. corrections.improvements for the formula in equation (4) were proposed. In particular, there are two mainlimitations to the expression of DOC given by equation (4). The first one is the presence of f",which is a parameter typically used in macroscopic im2aging0, whi0le i6n microscopy the numericalaperture (NA) is used. To overcome this problem, Bourdon et al. (2006) suggest to substitute it withno/(2NA) while Meinhart and Wereley (2003) define an infinity corrected f-number (f ") forinfinity-corrected microscopic systems. The second issue is that equation (4) does not account forthe effects of refraction. In practice, it happens quite often that the immersion medium of the lens,typically air or oil, is different from the one of the working fluid, typically water. Also in thesecases, several approaches were proposed: Bourdon et al. (2004) used the ratio nw/no (with nw beingthe refraction index of the fluid and no the refraction index of the lens immersion medium), Rossi etal. (2010) used the ratio based by the exact refraction of marginal rays ((nw/NA)/(no/NA2)),Meinhart and Wereley (2003) suggested that the change in refraction index produces an effectiveNAeff, different from the NA of the lens. As a consequence of the different approaches, the formulafor DOC is often cited in research and review articles with slightly different formulations,depending on which approach has been chosen. This represents a first issue in the practical application of DOC since different formulations givedifferent values for the estimated DOC that can considerably diverge in some cases (more than50%) from the one another. A second issue is that even though DOC formulas are nowadays widelyused to design and interpret uPIV experiments, to the knowledge of the authors a comprehensivevalidation ofDOC based on velocity measured data is still missing. Validations for the analytical expression of the DOC have been shown in (Bourdon et al. 2004, Bourdon et al. 2006), but theyrefer only to the weighting function, and for magnification up to 40x. Preliminary results on theeffect of DOC on velocity measurements in a capillary were shown by Kloostermann et al. (2009).An indirect measure of DOC based from the analysis of random error due to velocity gradients canbe found in (Rossi et al. 2010), but in that case it was only a marginal aspect of the work and wasreferring only to a single experimental set-up. This paper intends to address these two issues in the practical application of DOC. First, the mainaspects related to the modification of the formula in equation (4) will be revised and discussed, anda consistent formulation for the DOC will be proposed. Next, the validity of the theoretical modelwill be tested on real particle images. Finally, experiments in a Poiseuille flow inside amicrochannel with a rectangular cross-section will be used to qualify the bias error introduced byDOC in pPIV measurements. The effect of particle image preprocessing is studied as well. Theoutcome of the experiments will be discussed and guidelines to reduce the bias error due to DOCwill be indicated. 2. Theoretical framework 2.1. Particle image diameter and depth of correlation As shown from equation (3) and (4), the DOC value can be directly related to the particle imagediameter. To derive the model to predict the particle image diameter, a 1-lens optical geometry wasused as depicted in figure 1. The lens corresponds to the objective lens of the microscope, Da is theobjective lens diameter and s, is the working distance of the lens. Figure 1. Optical geometry used in deriving the particle image diameter The diameter of a particle in the image plane is the result of three contribution: a contribution due togeometrical dimensions of the particle, a contribution due to diffraction and a contribution due tothe distance of the particle from the focal plane (defocusing). Under the assumption that the threecontributions can be modeled as Gaussian functions, the resulting particle image diameter is givenby: the contribution due to diffraction is given by the diameter of the point response system of adiffraction-limited lens (Adrian and Yao 1985): considering the definition of j*-flDa, the expression of M=si/s, and the Gaussian lens formula: we can rewrite equation (6) as: From trigonometry we have that: Substituting equation (9) in (8) and using the definition of NA=nosin, we obtain the diffractionterm as a function of the NA: Note that this expression coincides with the one derived by Meinhart and Wereley (2003) forinfinity corrected systems. The contribution due to defocusing is derived using geometrical optics and is given by: assuming so>>z, and substituting equations (9), (10) and (11) in (5), yields the particle imagediameter as a function of z and NA: 71/2 Substituting the formula for the particle image diameter in equation (3) and solving for Zcorr wederive the following expression for the DOC: 2.2. Effect of refraction When the refraction index of the immersion medium of the lens no is different from the one of theworking fluid nw, there will be a deflection of the rays at the interface due to refraction. A ray isdeflected depending on its angle of incidence according to the Snell’s law: nosinG=nw sinw. Thismeans that a ray focusing at a distance l from the interface when no=nw, will focus at a distance k.lwhen nonw The factor k depends on the incidence angle Oas shown in figure 2.a and can be determined fromthe Snell's law and trigonometry: 1/2 Determining the position and shape of the focal plane after refraction is not straightforward, andalso depends on the design of the real lens, which often presents corrections for aberrations. Herebywe will make the assumption that the entire focal plane remains planar, and is only shifted by afactor k (0) corresponding to the ray with inclination 0. The shift of the focal plane has to be taken into account when determining the defocusing of aparticle image. Without refraction the defocusing term for a particle at a distance zo from the focalplane is given by equation (11). When refraction is present, the same defocusing is obtained at thedistance zw from the focal plane, which can be determined from geometry (cfr. figure 2b): For so>>z we can assume 00'and zw=kzo. Now it remains to determine which 0 has to be used tocalculate the shift of the focal plane. In this case an experimental approach was used to determinethe k of lenses with different NA. Particles stuck on the bottom wall of a microchannel werefocused on using the selected lens. The microscope stage was then moved until particles on the topwall were in focus. The focal position was determined by maximizing a focusing sharpnessfunction, which for the purposes of this experiment was the variance of the image’s pixel grey level(Sun et al.2004). —Particle imagee- Figure 2. Effect of refraction The displacement of the microscope stage from one focal position to another changes depending onthe medium inside the channel. If the channel is filled with the immersion medium of the lens (airfor the lenses used in this work), the displacement is equal to the actual height of the channel. If thechannel is filled with water the displacement is equal to the height of the channel divided by k asexplained earlier. The graph in figure 3 shows the theoretical values ofk for the axial rays (sin0=0) and the marginalrays (sin0=NA/no) as a function of the NA of the lens, and the experimental value of k determinedfor 4 type of lenses with NA respectively equal to 0.3, 0.4, 0.6, 0.75. As can be observed in the graph, the measured value of k corresponds to the k determined for theaxial rays, i.e. using the expression k=nw/no. The quantity nw/no has to be multiplied to the formulain equation (13) to obtain the correct value of DOC. NA Figure3. Theoretical values of k as a function of the NA for the axial rays (sin0=0) and the marginal rays(sin0=NA/no). Experimental values of k determined for 4 types of lenses with NA respectively equal to 0.3,0.4,0.6,0.75. 3. Experimental set-up The experimental particle images used for the comparison with the theory were obtained by takingimages of tracer particles of different sizes in liquid microflows. Polystyrene latex particles, coatedwith a red fluorescent dye and fabricated by Microparticles GmbH, were used. There were fourparticle sizes with mean diameters, dp, of 0.537 um, 1.19 um, 2.24 um, and 5.33 um. Images weretaken using an Axio observer Z1 inverted microscope manufactured by Carl Zeiss, coupled with acontinuous wave diode-pumped solid-state green laser (532 nm) as illumination source. Threedifferent Zeiss EC-Neofluar objective lenses were used with magnifications of 20x, 40x, and 63x,and respective NA of 0.4, 0.6, 0.75. A 12-bit, 1280×1024 pixel, interline transfer CCD camera(PCO Sensicam) was used for the image acquisition. The same system was used to perform uPIV measurements in a microchannel with a cross-sectionof 200×500um’ where a pressure driven Poiseuille flow was established. In this case a a two cavityfrequency-doubled Litron Nano S Nd:Yag laser was used to illuminate the particles. The flow wasgenerated by pushing homogeneously seeded distilled water through the channel using a neMESYSprecision syringe pump, manufactured by Cetoni GmbH at a rate of 10 ml/hr. The uPIVmeasurements at the same flow conditions were repeated using the different combinations of tracerparticle diameter and objective lens described above. The uPIV system was installed on an opticaltable to damp vibrations. All recordings and evaluations were made using the DaVis 7.4 softwarepackage from LaVision. The velocity vectors result from a correlation averaging of 1000 images ineach measurement plane, using a multi-pass algorithm. The size of the final interrogation windowwas adapted to account for different magnifications and particle sizes, ranging from 64×64 pixelsto 256 ×256 pixels. Image pre-processing was performed by subtracting a sliding minimum overtime to reduce non-uniformities and back-reflections followed by an intensity histogram filter, tohighlight in focus particles and remove highly defocused ones. 4. Results 4.1. Particle image diameter and depth of correlation In the analysis for the derivation of the DOC formula, the particle image intensity is modeled as aGaussian function (Olsen and Adrian 2000): where de is again the particle image diameter given by equation (12). If we qualitatively comparethe particle images generated using equation (16), with particle images obtained from a realexperiment, we can observe that the model works properly only for the small magnification lens (asshown in figure 4 for the case with M=20x). As magnification and NA of the lens are increased,defocused images differ significantly from the Gaussian profile, showing, for instance, the Airypatterns (as shown in figure 4 for the case with M=63x). Moreover, the particle image diameterappears to grow slower than as predicted by the model. M=20xXNA=0.4 d-2pm Figure 4. Comparison between particle images taken at different distances from the focal plane and thecorresponding synthetic image generated using equation (12) and (16). In order to quantitatively address this issue, the diameter of the particle images for differentcombinations of lenses, particle sizes and distance from the focal plane was measured andcompared with the predicted values given by equation (12). The diameter of a particle image wasderived measuring the diameter of its normalized autocorrelation function at a threshold value equalto 0.15 times the maximum (figure 5) and dividing it by a factor √2 to account for stretching in theautocorrelation space (this is strictly exact only for particle image intensity with Gaussiandistribution, but can be extended to different distributions when they deviate not significantly from: Gaussian model). To quantify the deviation from the Gaussian model, a Gaussian fit wasperformed for values above the threshold and the corresponding correlation coefficient R’wascalculated. For each combination of lenses and particle sizes under investigation, the particle imagediameter as a function of the distance z from the focal plane (z=0) was determined, and used toobtain an experimental value for the weighting function and the DOC. M=63xNA=0.75 cdp=2um S z [um] z [um] Figure 5. The particle image diameter is derived from the diameter of its autocorrelation function. Theparticle image diameter as a function of the distance z from the focal plane were determined, and used toobtain an experimental value for the weighting function and the DOC. 50 40 30 -20 10 O 40 0.9 0.8 0.7 0.6 0.5 40 z[um] z [pm] z [um] Figure 6. In the first row the theoretical (continuous line) and experimental (dots) particle image diameters asa function of the distance from the focal plane are reported. In the second row the correlation coefficient Rof the Gaussian fit is reported. The results obtained for all the combinations of lenses and particle sizes are summarized in thegraphs in figure 6. For the 20x lens, the model is able to precisely predict the particle imagediameter, and the R" of the Gaussian fit is always above 90%. For the 40x lens, the experimentalcurves start to deviate from the theory. In particular the region in which the minimum diameter islocated, is extended (i.e.the particles results “in focus”in a region of space larger than predicted bythe model) and an asymmetric behavior is observed between the region above and below the focalplane. The R"of the Gaussian fit is above 90% only in a region close to the focal plane. For the 63xlens, it can be observed that the model overestimates the defocusing of particles, and a strong asymmetric behavior is present. In particular, the diameters of particles below the focal plane growfaster than for particles above. Moreover, the image intensity distribution of particles with smallsizes strongly deviates from the Gaussian model. Finally, the comparison between theoretical and experimental DOC values are reported in table 1and in figure 7. M=20x,NA=0.5 M=40x. NA=0.6 M=63x, NA=0.75 dp [um] DOCth [um] DOCex [um] DOCth [um] DOCex[um DOCth[um] DOCex [um] 0.5 15.6 21.7 5.7 33.3 2.8 13.0 1.0 17.5 20.7 7.3 26.3 4.2 24.0 2.0 23.6 28.9 11.8 40.7 7.4 37.0 5.0 48.1 54.5 27.1 69.1 17.7 65.3 Table 1. Experimental and theoretical DOC for different combination of lenses and particle sizes. The results show that the actual DOC for lenses with large NA is considerably larger than expectedfrom the theory. In particular, if the experimental DOC is normalized with the correspondingtheoretical value, as shown in figure 7, this trend can be clearly observed. The results suggest thatbeyond NA=0.4, the actual DOC starts to significantly deviate from the expected value, and thedeviation grows linearly with the NA. The particle size plays a minor role, showing that, in general,larger particles are better described by the model in comparison with smaller particles. Figure 7 Experimental DOC normalized with the theoretica DOC for different combinations of lenses andparticle diameters. 4.2. Velocity measurement A direct consequence of the DOC in the velocity measurement is a bias error when velocitygradients are present in the z-direction (Olsen 2009). For instance if velocity measurements aretaken scanning through a microchannel in which a Poiseuille flow is established, a bias can beobserved: in the region close to the center of the channel the velocity is underestimated due tocontribution of the particles with lower velocities, in the region close to the wall the measuredvelocity is over estimated due to contribution of the particles with larger velocities. The velocitymeasured at the wall is different from 0 and its value is proportional to the width of themeasurement volume. It has to be noted that the bias error cannot be uniquely addressed to DOCbut also to the finite size of the interrogation windows, specially for large particle images (Keaneand Adrian 1990, Westerweel 2000). z/H Fignre 8. Comparison of the measured velocity profiles obtained with and without image pre-processing,the theoretical velocity estimated using equation (1). The velocities correspond to Poiseuille flow in aicrochannel and are taken using different combinations of lenses and particle sizes. Lisbon, Portugal, 05-08 July,2010 Figure 9. Velocity measured at the wall with () and without (o) image pre-processing normalized withexpected velocity from theory. Velocities are reported for different combinations of lenses and particle sizes. Figure 8 reports the velocity profiles measured in a rectangular microchannel with Poiseuille flowusing different combinations of lenses and particle sizes. The velocity profiles are taken at 0.5 timesthe width of the channel, scanning in z-direction. For each set-up the measured velocity profileswere obtained from raw and pre-processed images, and the results compared with the theoreticalprofile obtained using equation (1). It is apparent from the graphs that the bias observed is, in general, larger than expected from theory.This finding is in agreement with what observed for the DOC. Moreover in this case the biasincreases significantly also with the increase of particle sizes, specially for large magnification lens.This is evident in the graph of figure 9 in which the velocity measured at the wall is presented,normalized versus the expected velocity at the wall from theory. However it has to be noted thatresults obtained for large particles at large magnifications are also strongly affected by the finitesize of the interrogation windows which is here in the same order of magnitude of stronglydefocused particles. Concerning the effect of image pre-processing, it should reduce the bias error by removing out-of-focus particles, but in fact, the results show that it plays a significant role only for large particlesizes and large bias errors. Moreover, the image pre-processing is never able to obtain data in whichthe effect of DOC is completely neglected. This can be explained again looking at the particleimage diameters in figure 6, where it can be observed that the region where the particles are infocus (i.e. minimum particle image diameter), is more extended than what expected from theory. Inother words tracer particles at different depth positions look identical and cannot be sort out byimage pre-processing algorithms. This sets a limit to the improvement that can be reached by usingimage pre-processing to reduce the bias error due to DOC. To completely avoid the bias error due to the DOC, other measurement techniques must be used,such as 3D particle tracking techniques. Cierpka et al. (2010) recently showed a method based onastigmatic aberration that is able to measure 3D velocity fields in microflows without bias error dueto the DOC. The effectiveness of this technique has been already proven with comparison withconventional and stereoscopic uPIV on backward-facing step (Cierpka et al. 2010). 5. Conclusions The theory currently developed to estimate the DOC in a uPIV experiment starts to significantlyunder-estimate the actual DOC value when objective lenses with NA larger than 0.4 are used. Thisis due to the fact that for high NAs, the behavior of real lenses differs from the theoretical model predictions. In particular, the defocusing of particle images is different and the particle images’intensity distribution deviates from the Gaussian approximation used in the model. This findings arein agreement with uPIV measurements on Poiseuille flow in a micro-channel, where the bias errordue to DOC results to be larger than those predicted by the theory. The effectiveness of image pre-processing to reduce the error due to DOC was investigated as well.Results show that image pre-processing significantly helps to reduce the bias error in case of largeparticle images, but minimally affects the measurements for small particle images. Moreover it isnever possible to remove completely the bias error. If measurements without bias error due to DOCare needed, it is advisable to resort to different measurement techniques, such as 3D PTV methods. 6. References Adrian R, Yao C (1985) Pulsed laser technique application to liquid and gaseous flows and thescattering power of seed materials. Appl Optics 24(1):44-52 Bourdon CJ, Olsen MMG,C Gorby AD (2004) Validation of an analytical solution for depth ofcorrelation in microscopic particle image velocimetry. Meas Sci Technol 15(2):318-327 Bourdon CJ, Olsen MG, Gorby AD (2006) The depth of correlation in micro-PIV for highnumerical aperture and immersion objectives. J Fluids Eng 128(4):883-886 Cierpka C, Segura R, Hain R, Kahler CJ (2010) A simple single camera 3C3D velocitymeasurement technique without errors due to depth of correlation and spatial averaging formicrofluidics. Meas Sci Technol 21(4):045401 Cierpka C, Rossi M, Segura R, and Kahler CJ (2010) Comparative study of the uncertainty ofstereoscopic micro-PIV, wavefront-deformation micro-PTV, and standard micro-PIV. In:International Symposium on Applications of Laser Techniques to Fluid Mechanics, Lisbon,Portugal, July 5-8 Keane RD, Adrian RJ (1990) Optimization of particle image velocimeters.Part I: Double pulsedsystems. Meas Sci Technol 1(11):1202-1215 Kloostermann A, Poelma C, Westerweel J (2009) Accuracy of the Micro-PIV Method forBiological Applications. In: International Symposium on PIV, Melbourne, Australia, August?5-28 Lindken R, Rossi M, GroBe S, Westerweel J (2009) Micro-Particle Image Velocimetry (uPIV):Recent developments, applications, and guidelines. Lab Chip 9(17):2551-2567 Meinhart CD, Wereley ST (2003) The theory of diffraction-limited resolution in microparticleimage velocimetry.Meas Sci Technol 14(7):1047-1053 Meinhart CD, Wereley ST, Gray MHB (2000) Volume illumination for two-dimensional particleimage velocimetry. Meas Sci Technol 11(6):809-814 Olsen MG (2009) Directional dependence of depth of correlation due to in-plane fluid shear inmicroscopic particle image velocimetry. Meas Sci Technol 20(1):015402 (015409pp) Olsen MG, Adrian RJ (2000) Out-of-focus effects on particle image visibility and correlation inmicroscopic particle image velocimetry. Exp Fluids 29:S166-S174 Rossi M, Lindken R, Westerweel J (2010) Optimization of multiplane uPIV for wall shear stressand wall topography characterization. Exp Fluids 48(2):211-223 Santiago JG, Wereley ST, Meinhart CD, Beebe DJ, Adrian RJ (1998) A particle image velocimetrysystem for microfluidics. Exp Fluids 25(4):316-319 Sun Y, Duthaler S, Nelson BJ (2004) Autofocusing in computer microscopy: Selecting the optimalfocus algorithm. Microscopy Research and Technique 65(3):139-149 Westerweel J (2000) Theoretical analysis of the measurement precision in particle imagevelocimetry. Exp Fluids 29:S3-S12 -- --
确定
还剩10页未读,是否继续阅读?

产品配置单

北京欧兰科技发展有限公司为您提供《粒子图像强度和图像预处理中对显微PIV的影响检测方案 》,该方案主要用于其他中对显微PIV的影响检测,参考标准--,《粒子图像强度和图像预处理中对显微PIV的影响检测方案 》用到的仪器有德国LaVision PIV/PLIF粒子成像测速场仪
推荐专场


相关方案
更多
该厂商其他方案
更多