


方案详情
文
Liquid andliquid/gasflowsthroughspacerfilledchannelswerestudiedusingParticleImagingVelocime-
try (PIV)toprovideexperimentalsupportforvelocitydistributionsobtainedfromComputationalFluid
Dynamics studiesavailableintheliterature.ItisshownthatPIVisasuitabletechniqueformeasuring
velocity profilesinspacerfilledchannels,althoughcarehastobetakenwheninterpretingtheresults.
PIV measurementswerecarriedoutforanentireflowcell(5cm×15 cm),asmallerareaofroughly
7mm×8mmandforasinglespacercell(2.5mm×3 mm).Theexperimentalresultsshowthatfluidflow
is welldistributedacrosstheentireflowcellinthecaseofsingle-phaseflow.Therecordingsofthesingle
spacer cellshowedthatliquidflowismainlyparalleltothespacerfilamentsandthereforethedirec-
tion offlowchanges90◦ over theheightofthechannel.Introductionofairbubblesintroducedstrong
local velocitygradients.Theliquidvelocityintwo-phaseflowsisshowntobemoreunsteadythanin
the caseofsingle-phaseflow,whichisadvantageouswhentryingtopreventfoulingorconcentration
polarization.
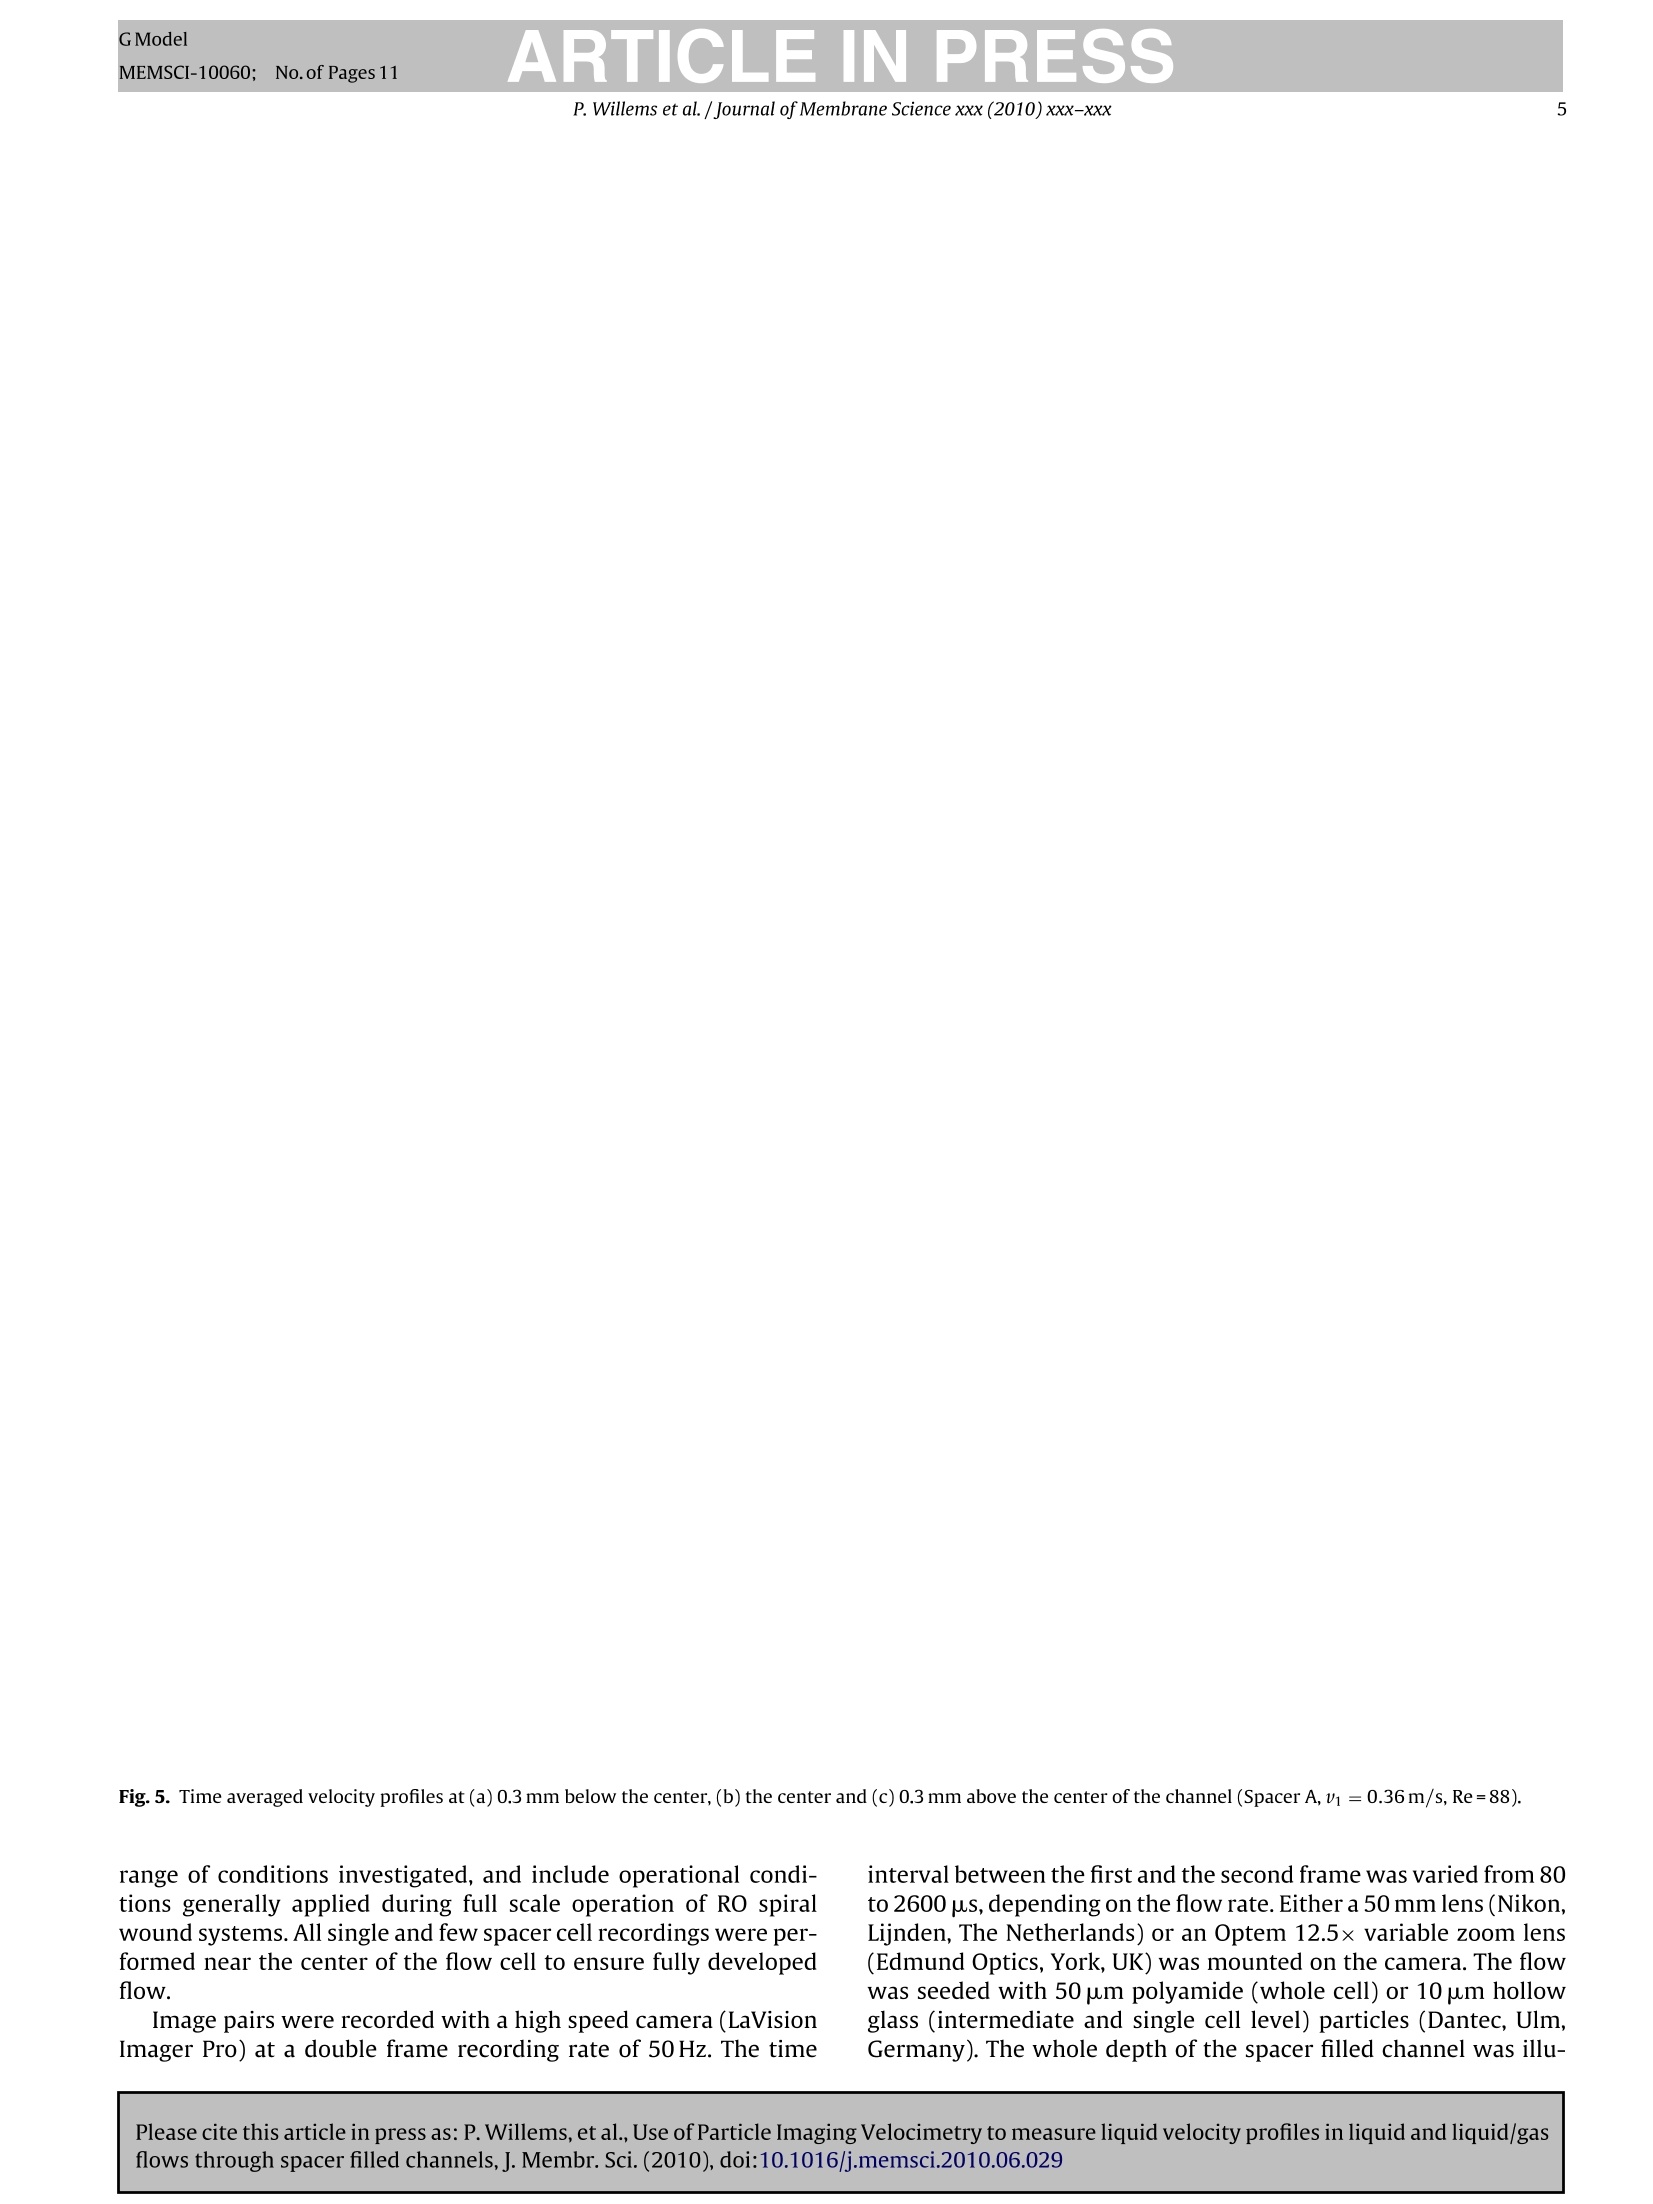
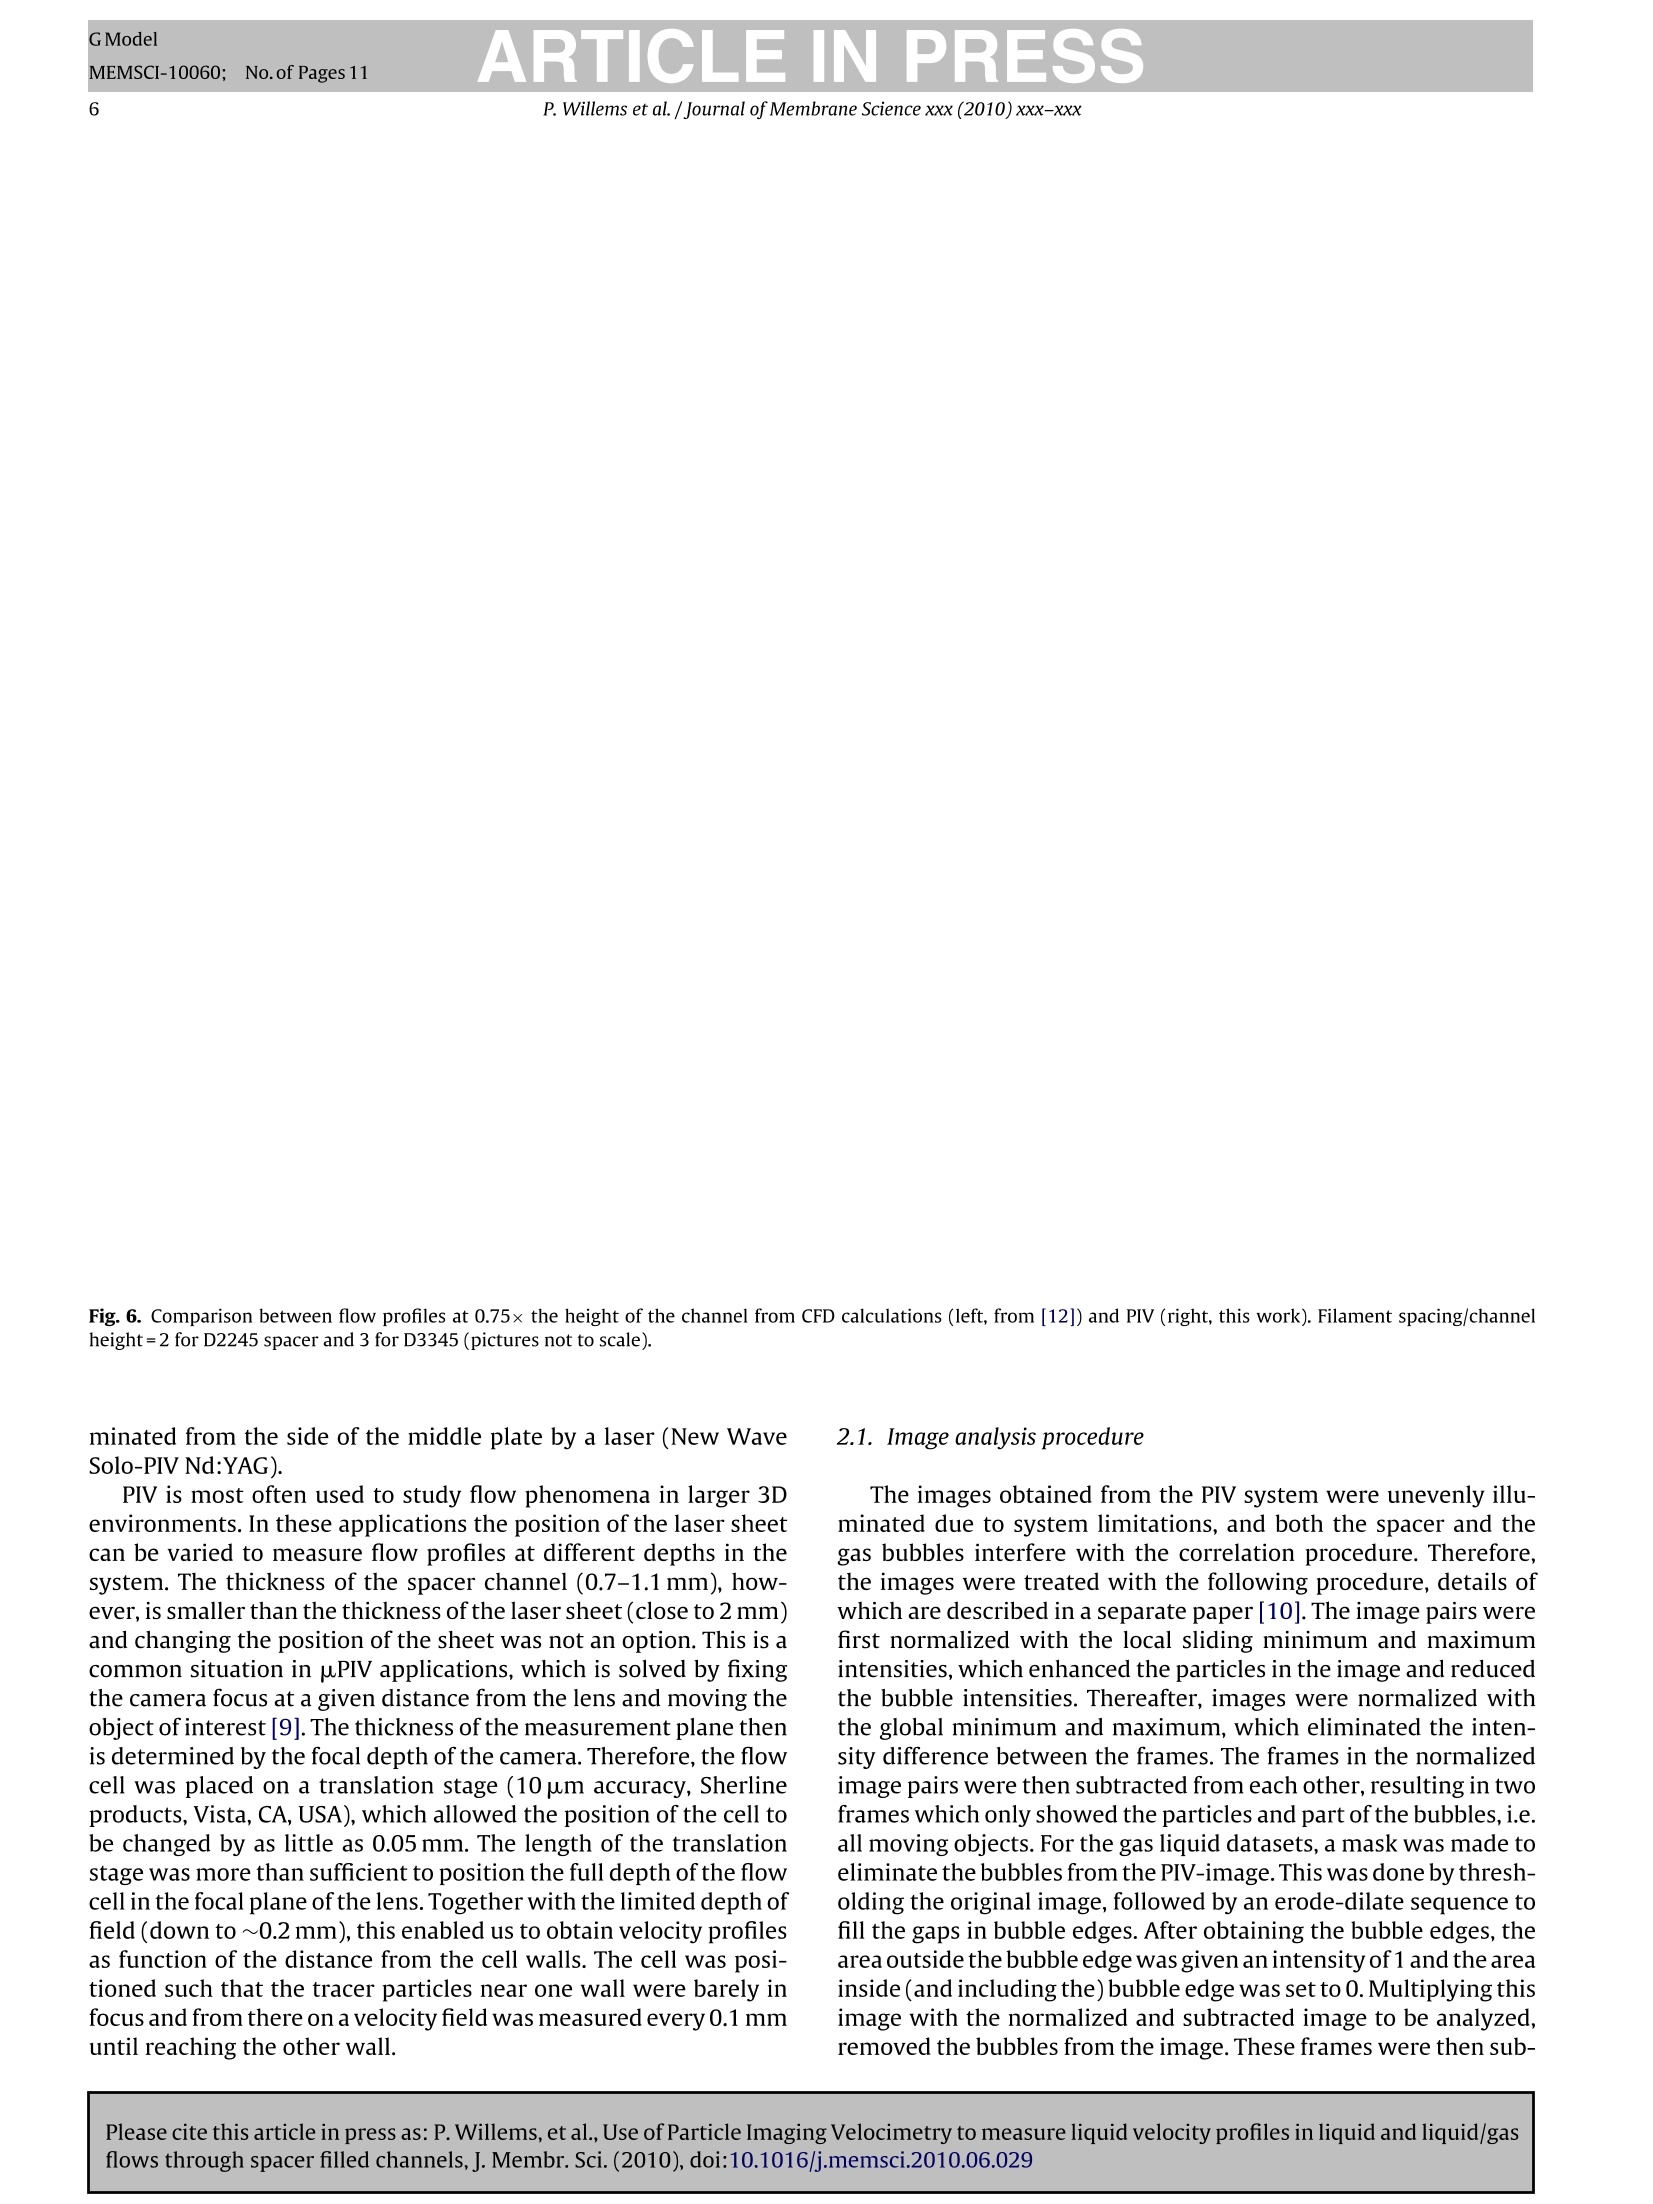
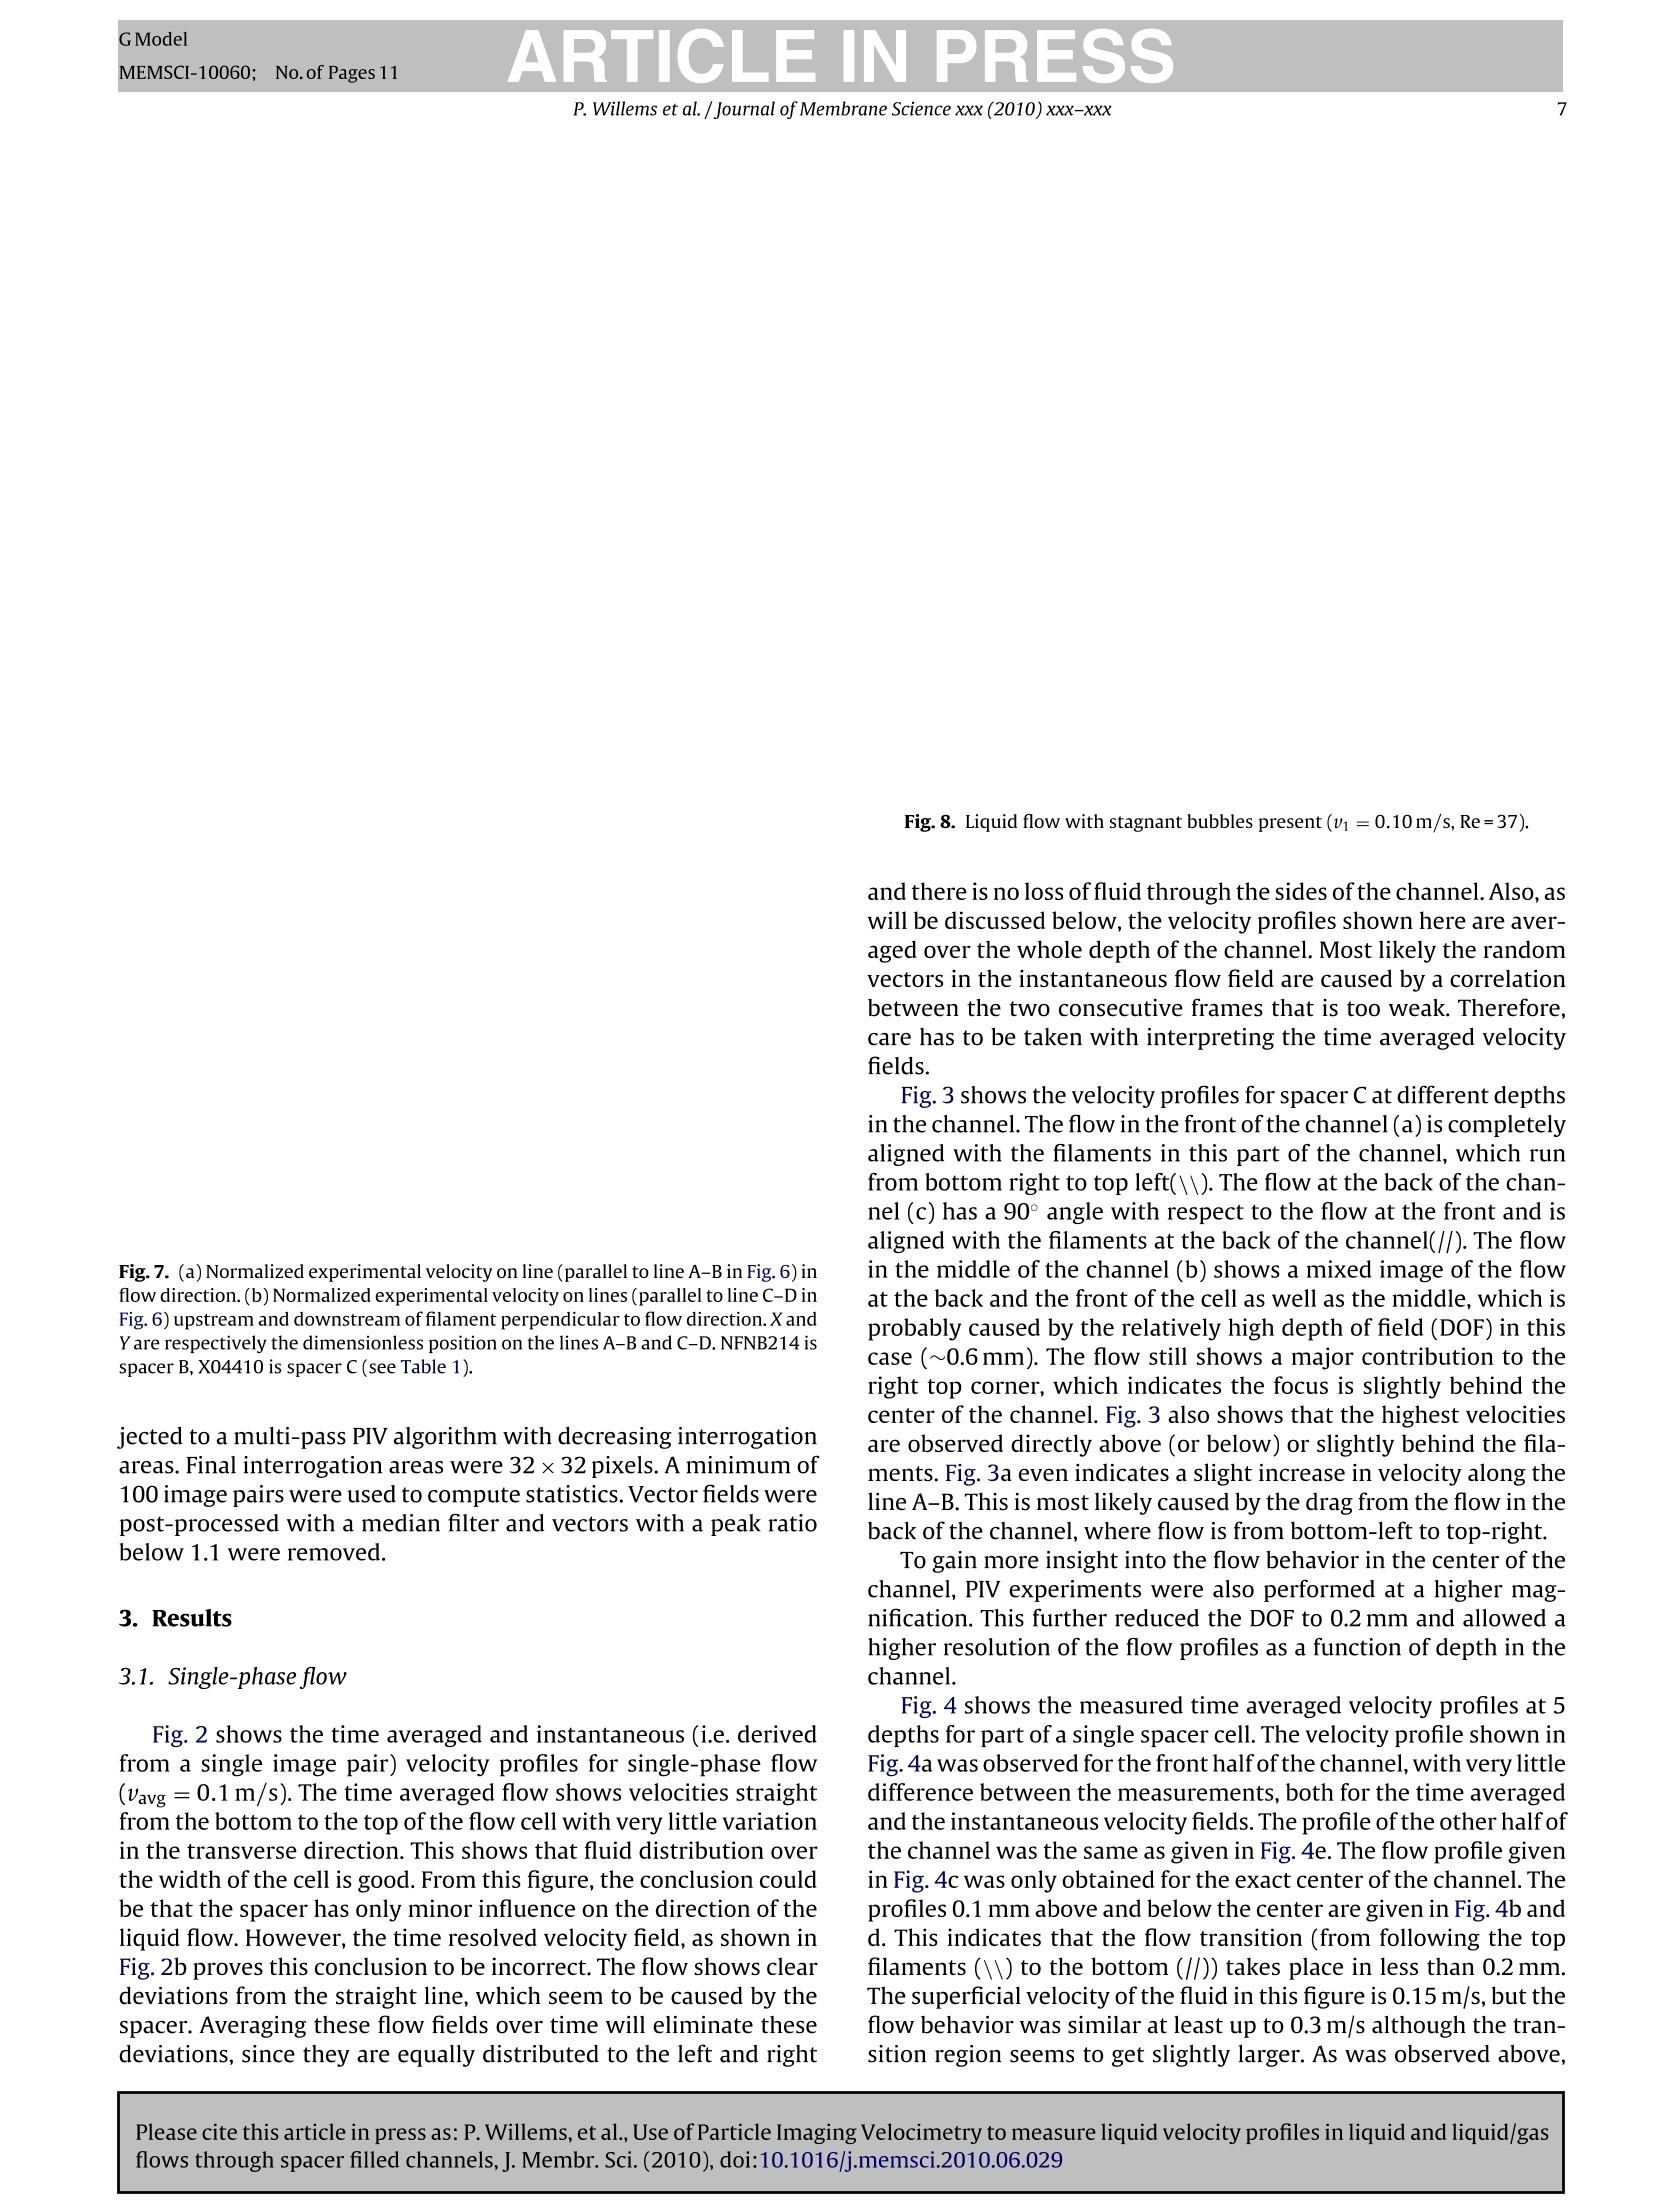
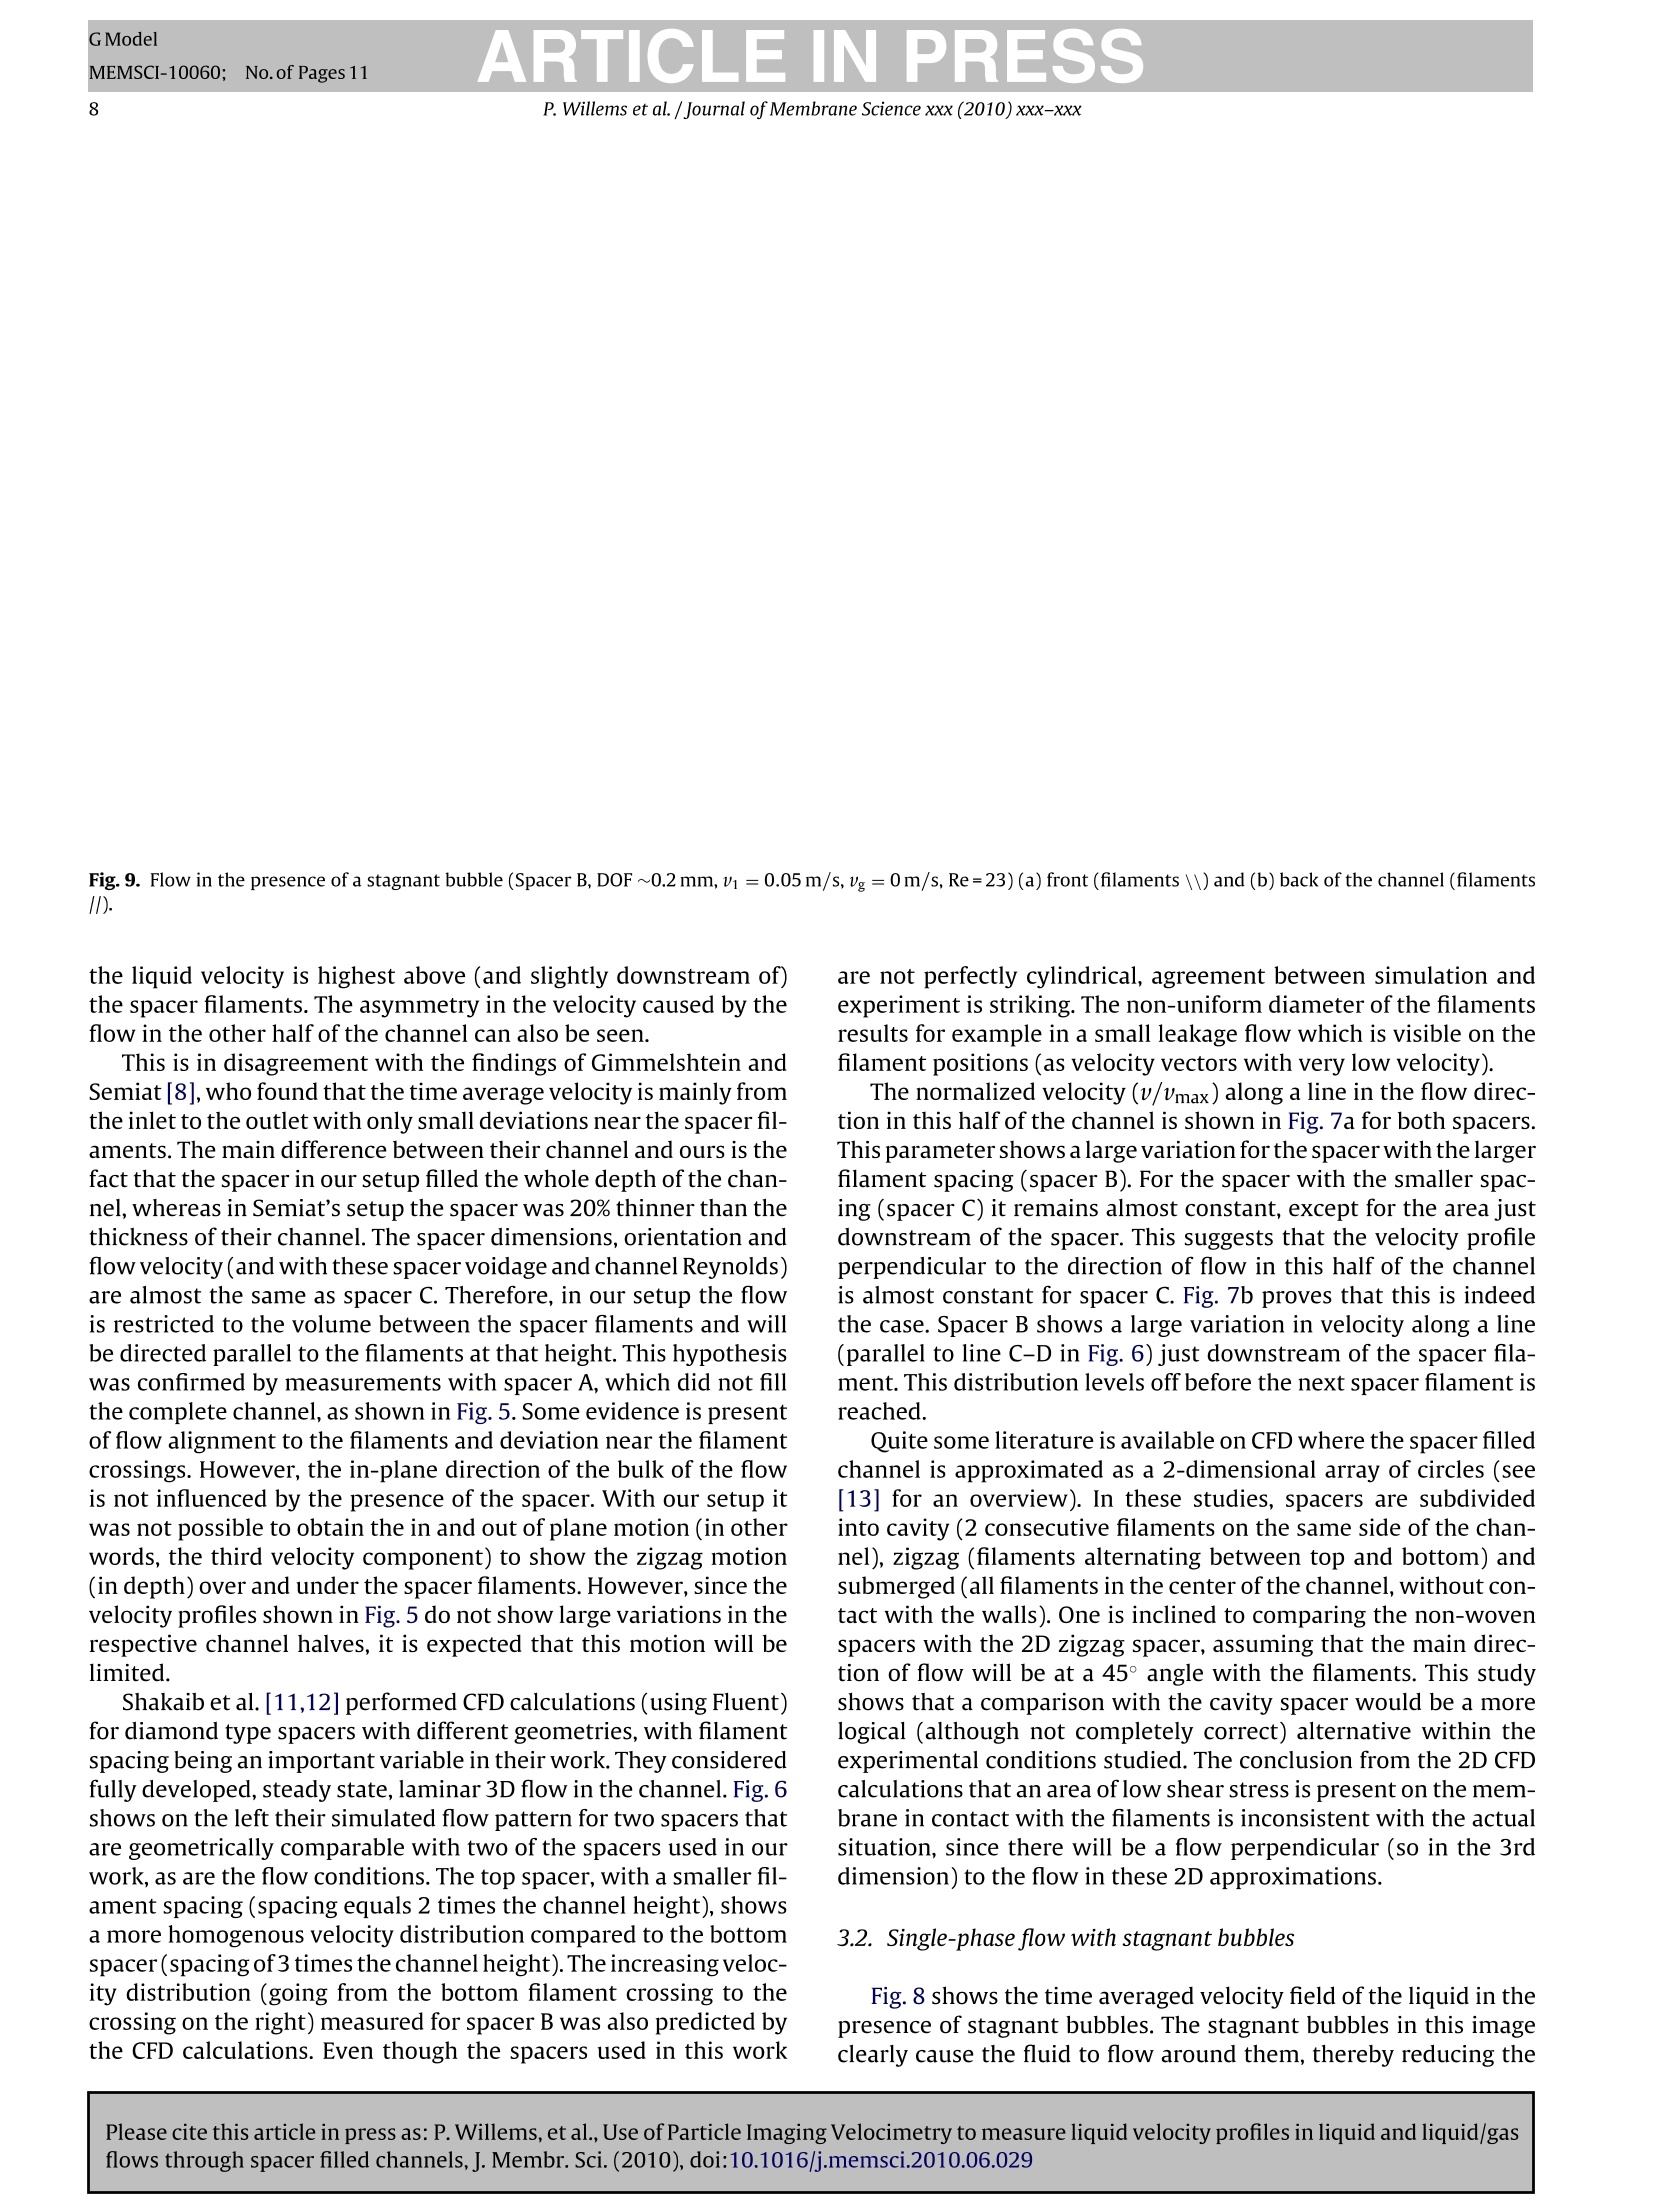
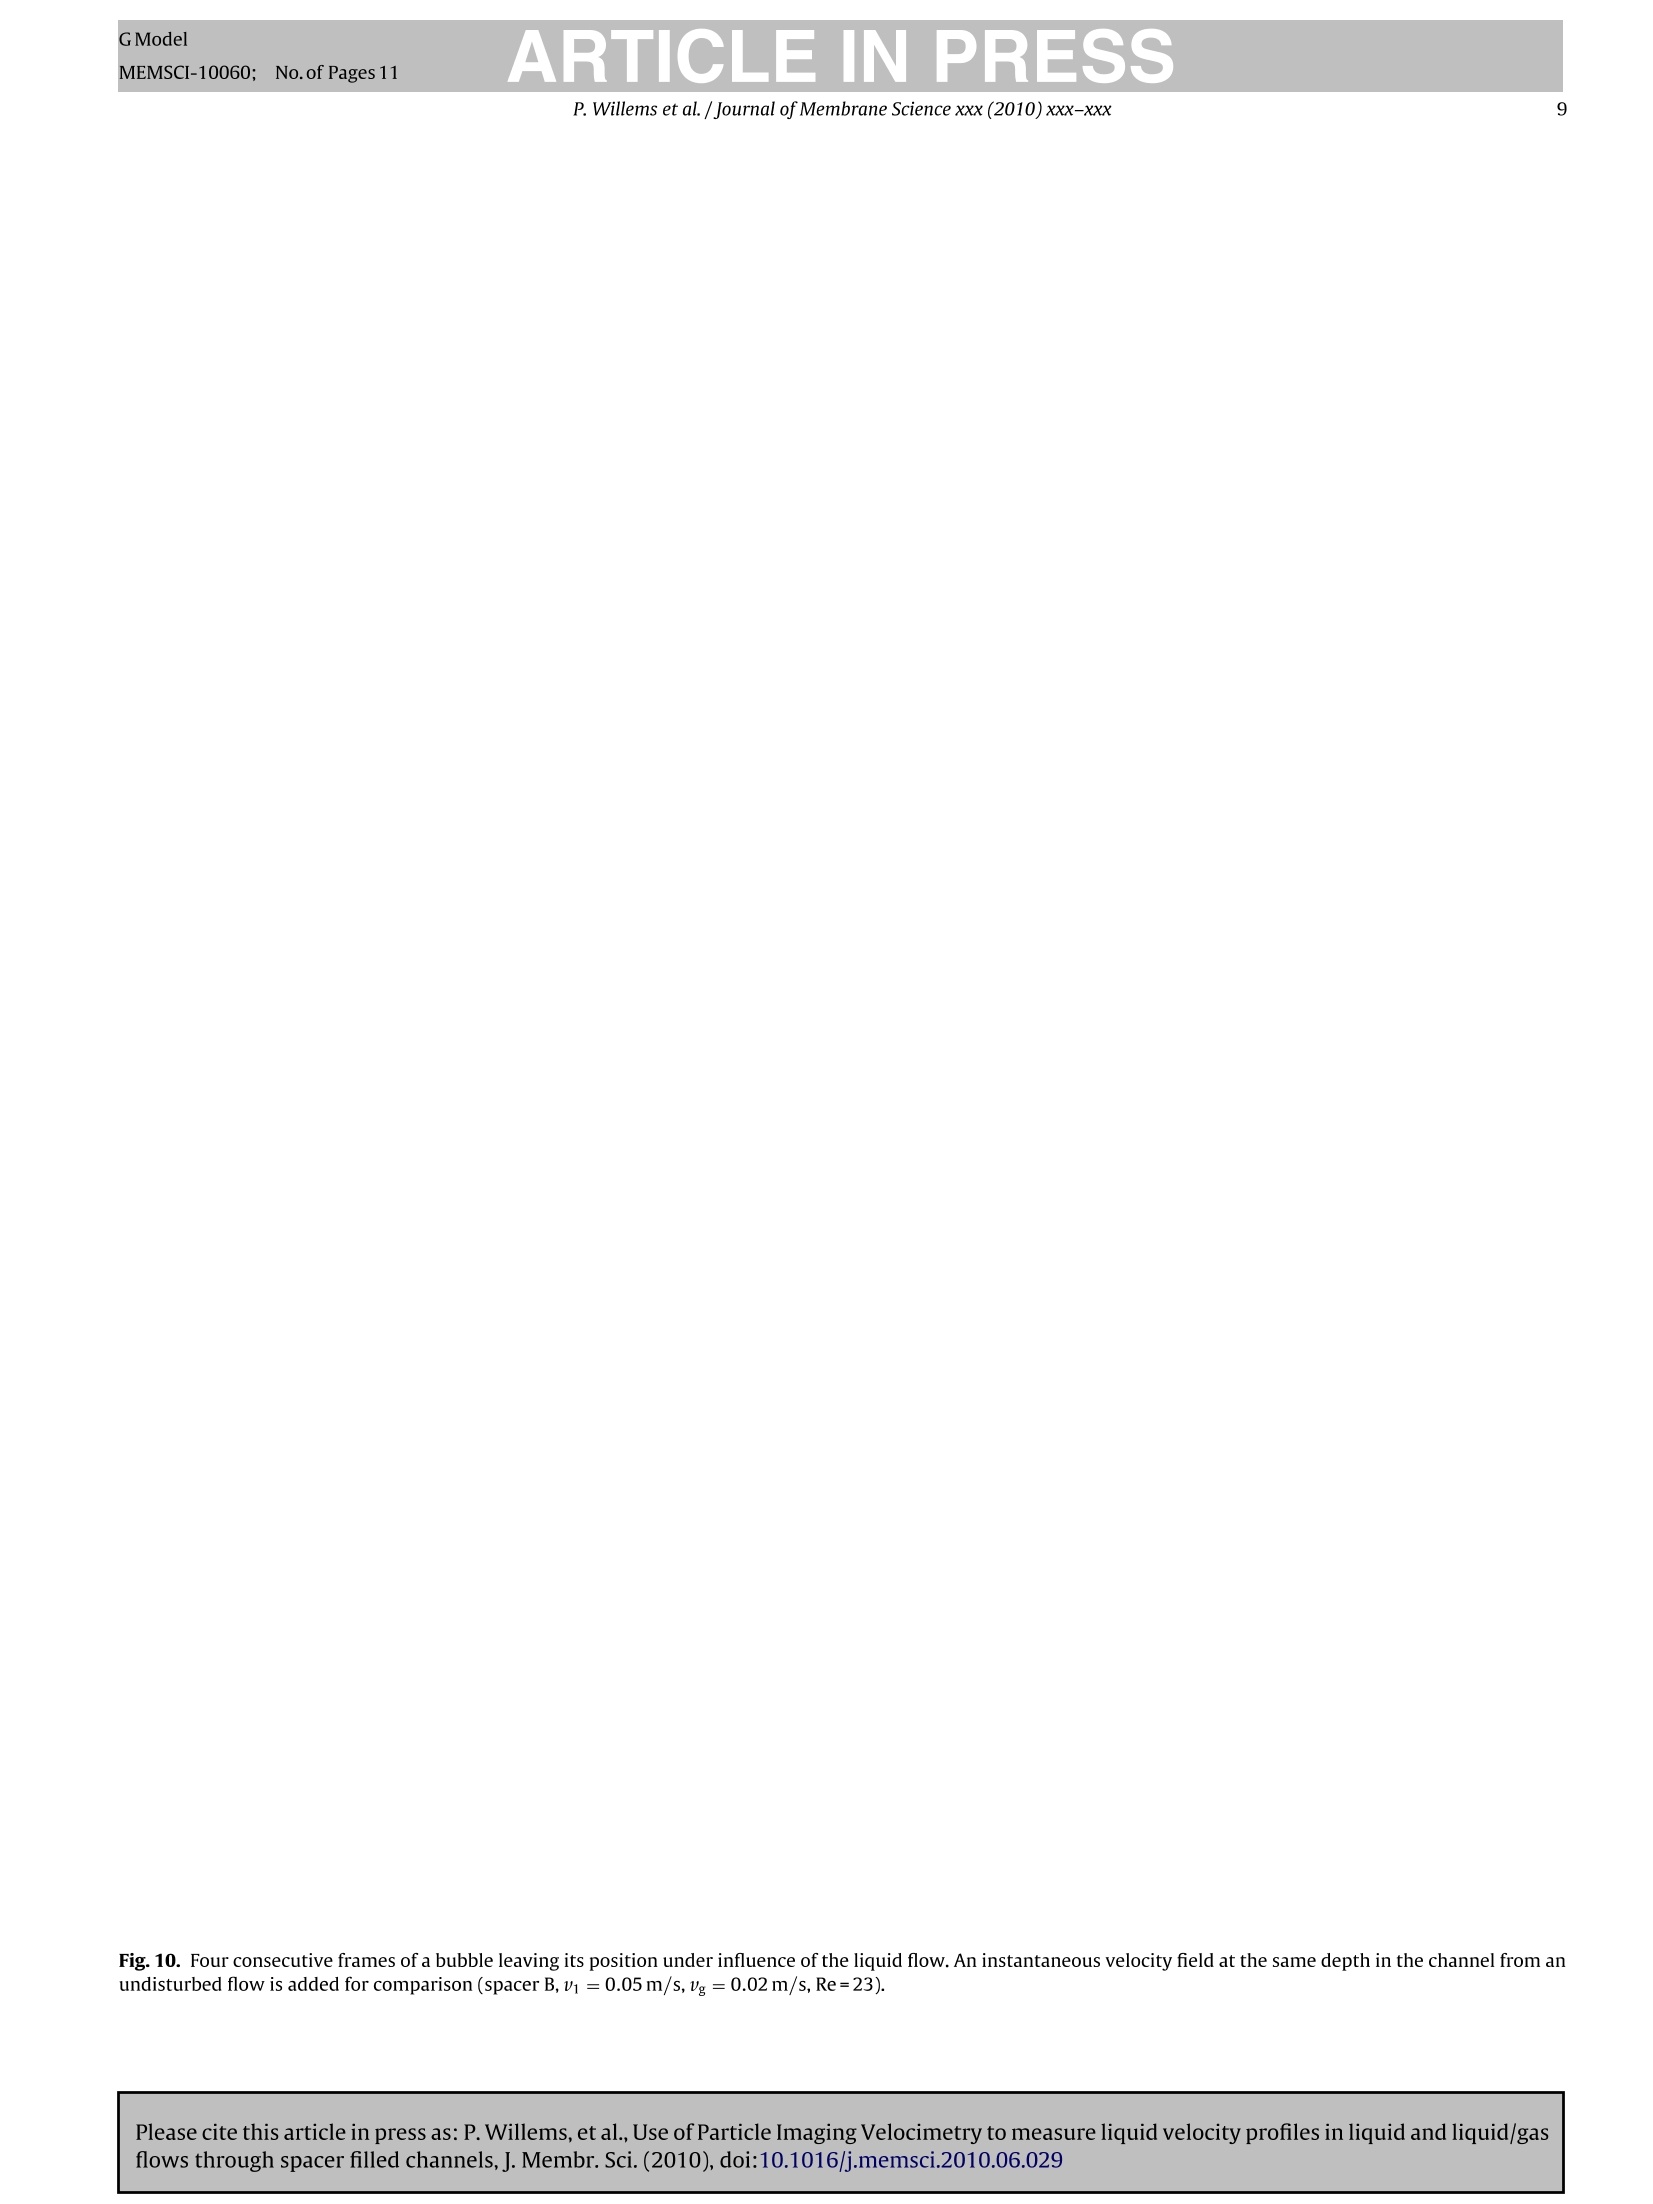
方案详情

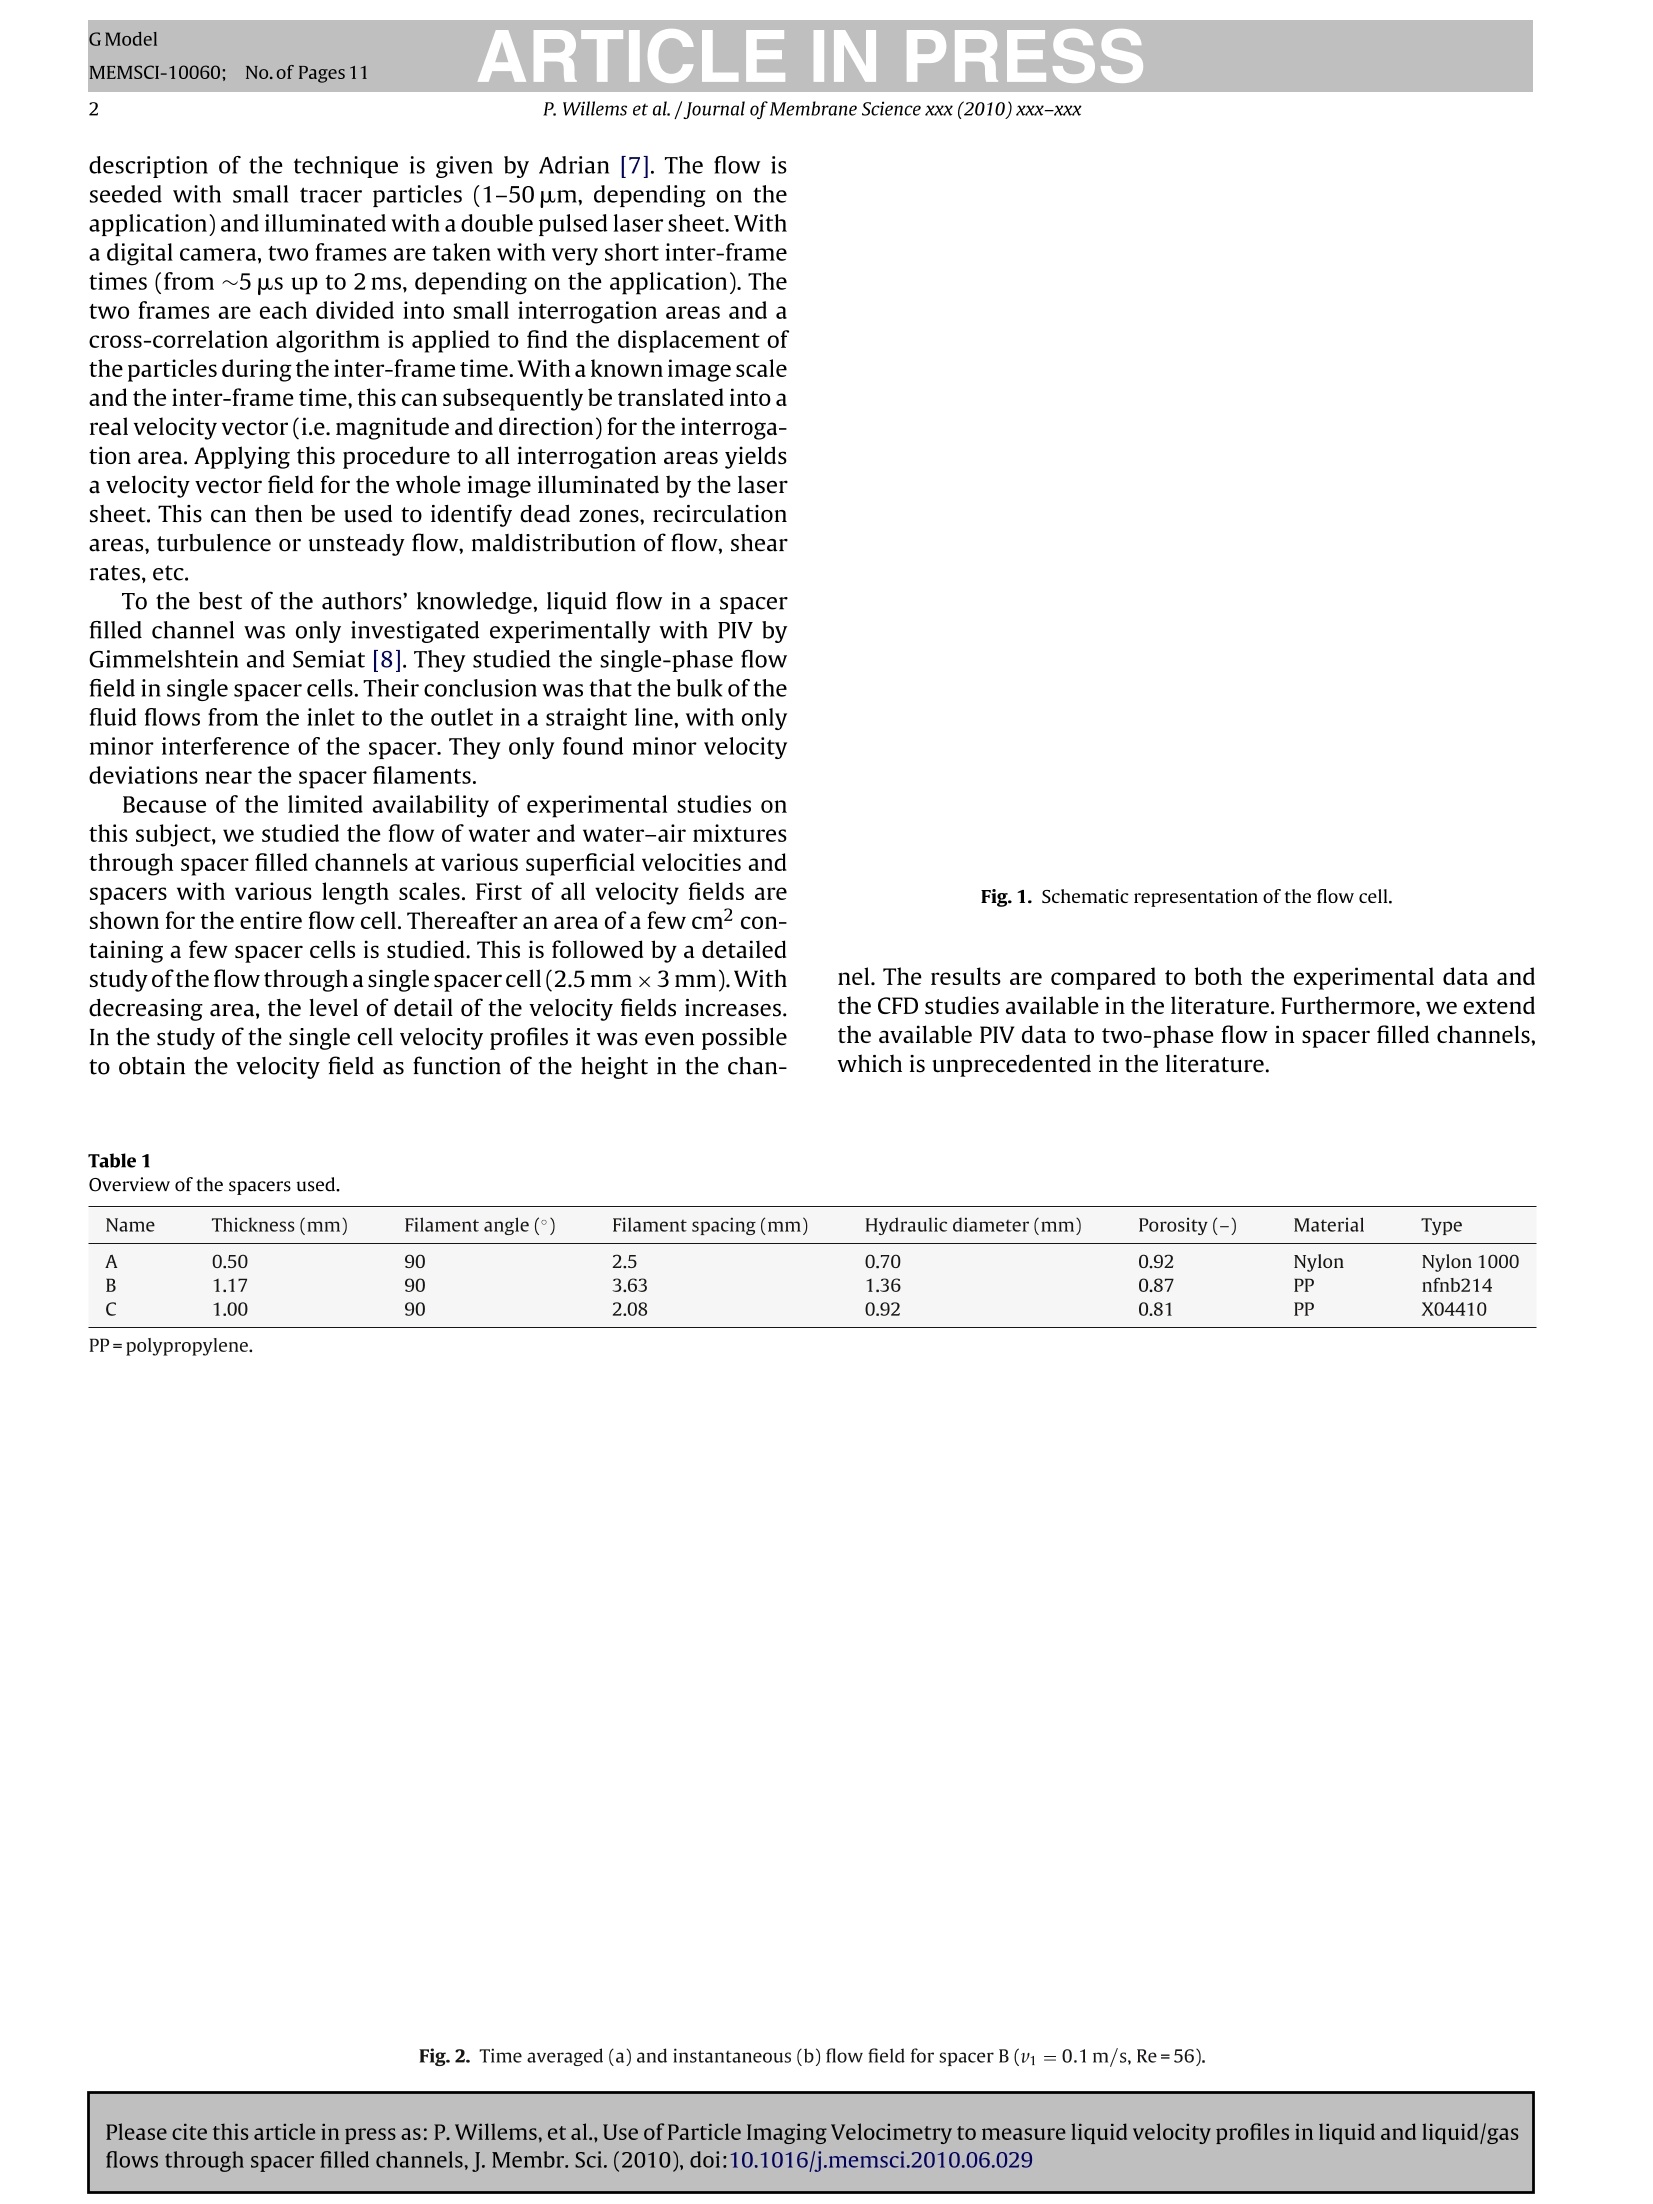
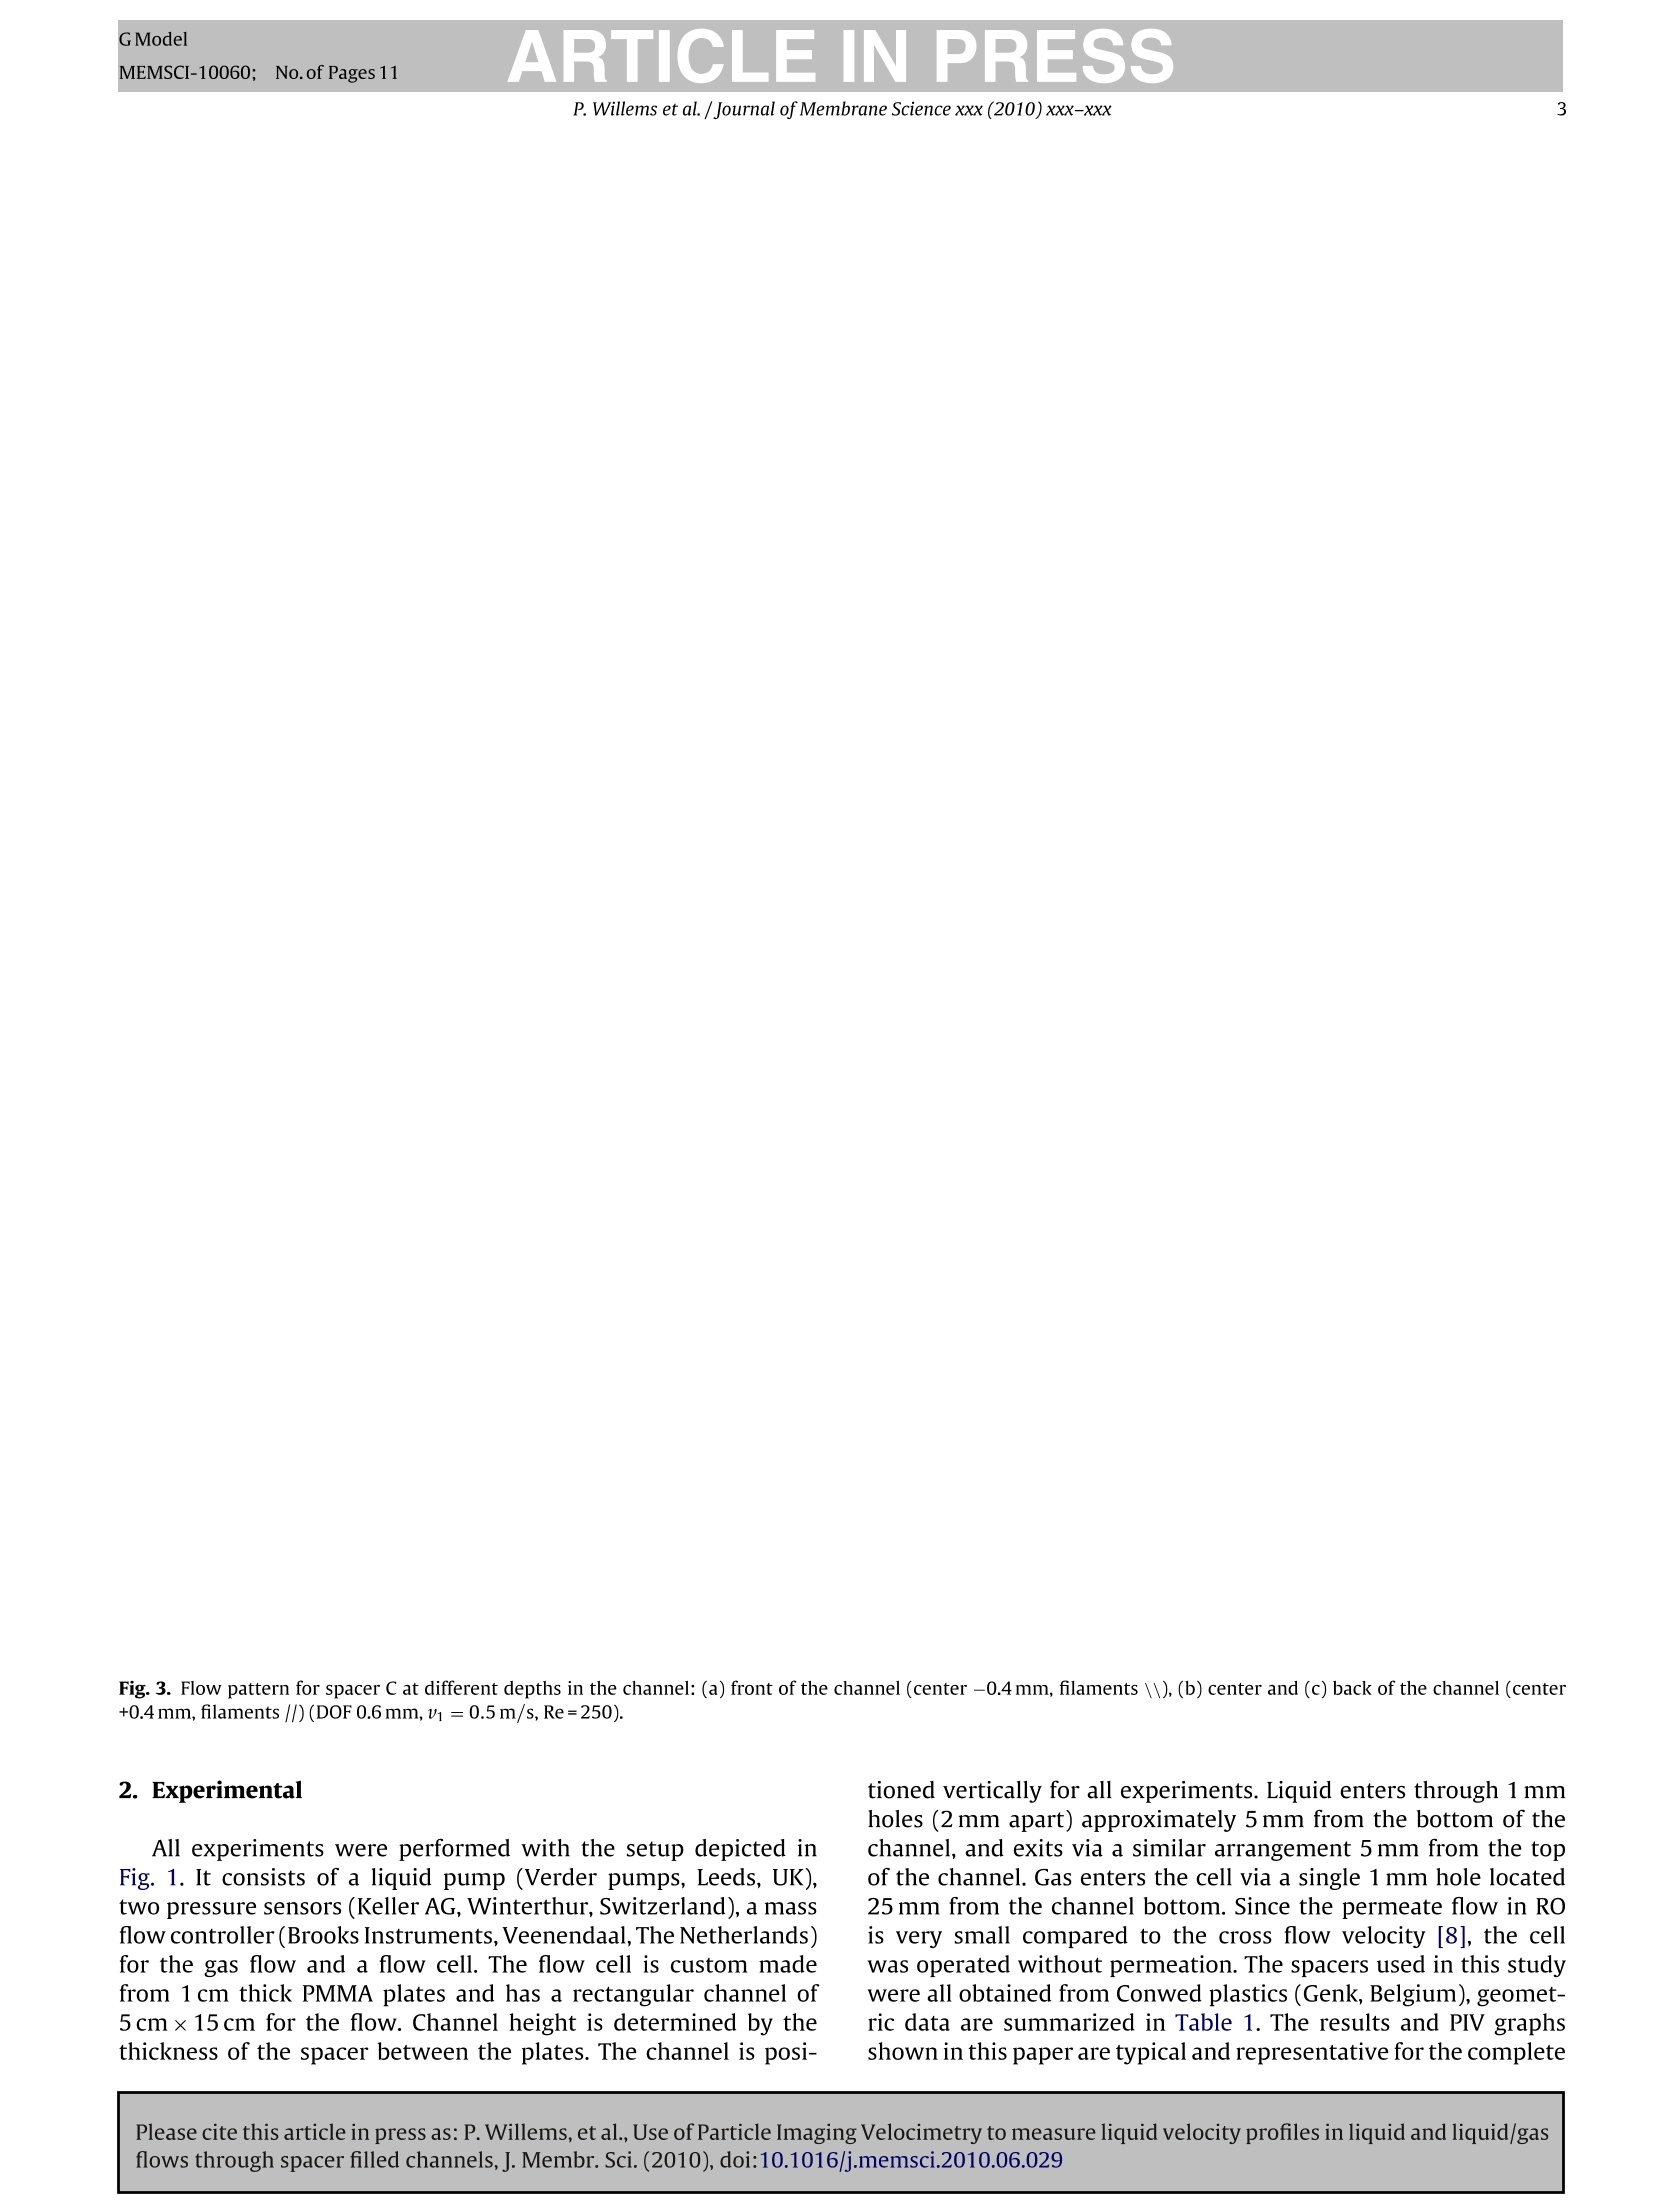
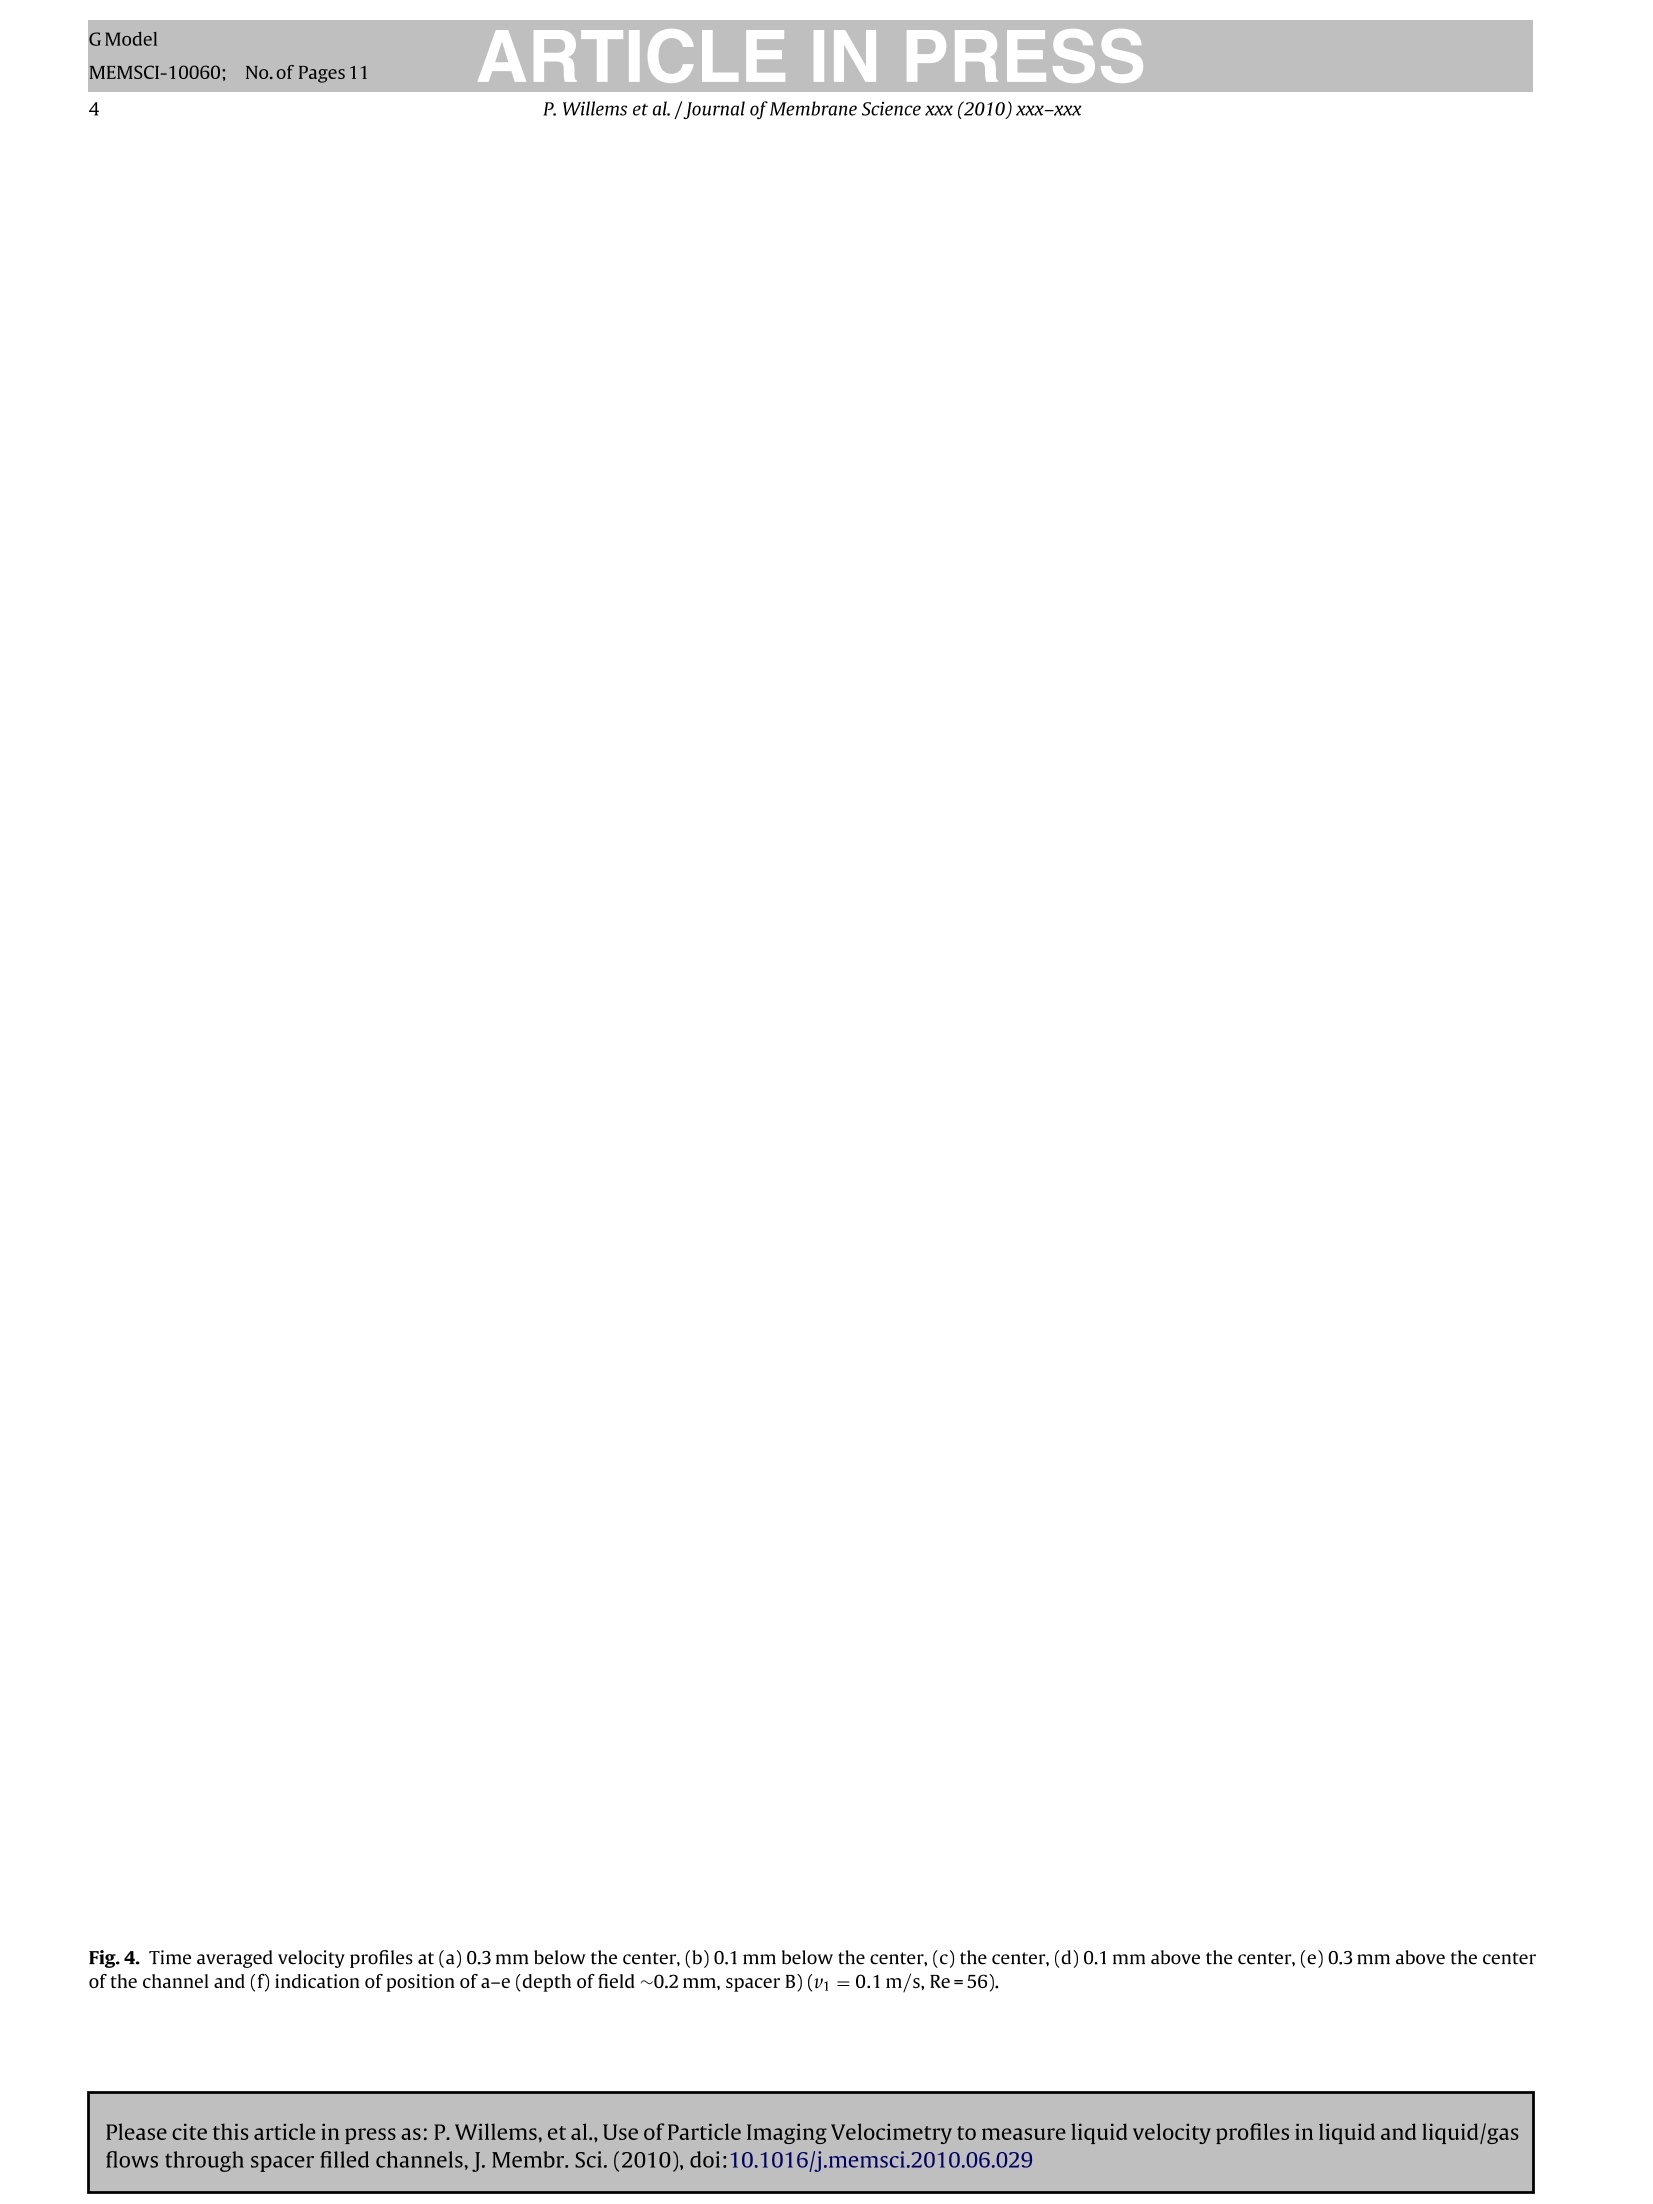
GModelMEMSCI-10060; No.of Pages 11Journal of Membrane Science xxx (2010) xxx-xxx ARTICLE IN PRESSMEMSCI-10060;;No.of Pages 11P. Willems et al. / Journal of Membrane Science xxx (2010) xxx-xxx2 Contents lists available at ScienceDirect Iournal of Membrane Science E LSEVIER journal homepage:www.elsevier.com/locate/memsci Use of Particle Imaging Velocimetry to measure liquid velocity profiles inliquid and liquid/gas flows through spacer filled channels P. Willems,N.G. Deenb, A.J.B. Kempermand*, R.G.H. Lammertink,M. Wesslinga,M. van Sint Annalandb,J.A.M. Kuipersb, W.G.J. van der Meer a Membrane Technology Group, Institute of Mechanics, Processes and Control Twente (IMPACT), University of Twente, PO Box 217, 7500 AE, Enschede, The NetherlandsFundamentals of Chemical Reaction Engineering Group, Institute of Mechanics, Processes and Control Twente (IMPACT),University ofTwente, PO Box 217, 7500 AE, Enschede,The Netherlands ARTICLE IN F O ABSTRACT Article history:Received 1 September 2009Received in revised form 16 June 2010Accepted 20 June 2010 Available online xxx Keywords: spacer Two-phase flowAir spargingShear stress PIV Liquid and liquid/gas flows through spacer filled channels were studied using Particle Imaging Velocime-try (PIV) to provide experimental support for velocity distributions obtained from Computational FluidDynamics studies available in the literature. It is shown that PIV is a suitable technique for measuringvelocity profiles in spacer filled channels, although care has to be taken when interpreting the results.PIV measurements were carried out for an entire flow cell (5cm×15cm), a smaller area of roughly7mm x8 mm and for a single spacer cell (2.5 mmx3 mm). The experimental results show that fluid flowis well distributed across the entire flow cell in the case of single-phase flow. The recordings of the singlespacer cell showed that liquid flow is mainly parallel to the spacer filaments and therefore the direc-tion of flow changes 90° over the height of the channel. Introduction of air bubbles introduced stronglocal velocity gradients. The liquid velocity in two-phase flows is shown to be more unsteady than inthe case of single-phase flow, which is advantageous when trying to prevent fouling or concentrationpolarization. O 2010 Elsevier B.V. All rights reserved. 1. Introduction Clean drinking water is becoming scarcer and sweet watersources are being depleted. More and more potable water willbe produced using saline sources. Reverse osmosis (RO) in spiralwound modules (SW modules) is widely used in drinking waterpurification and seawater desalination. Membrane fouling andconcentration polarization are two factors that reduce the per-formance of these membrane systems. The performance of themodule can only be restored after cleaning, either chemically ormechanically, which results in loss of production.Air sparging hasbeen proposed to reduce both fouling and concentration polar-ization phenomena during operation, thereby reducing downtimeand production losses. Most of the research on air sparging hasbeen focused on hollow fiber or tubular MF, UF and NF mem-branes and on membrane bioreactors[1], however very recentlyair sparging also has been shown to be very useful in enhanc-ing mass transfer in electrodialysis processes [2]. Air spargingonly is effective when concentration polarization or fouling is the ( * Corresponding author. Tel.: +31 53 4892956;fax: +31 53 4894611. ) E-mail addresses: a.j.b.kemperman@tnw.utwente.nl, a.j.b.kemperman@utwente.nl(A.J.B. Kemperman). limiting step in the process; in other cases air sparging will notincrease permeation [3,4]. Although the mechanism behind thepositive effect of air sparging is not yet completely understood,most explanations point towards velocity(-gradient) related phe-nomena like shear stress or induced turbulence[1]. The mechanismis expected to be similar for SW modules, though no evidenceis available in the literature. Therefore, both experimental andmodeling studies are required to gain fundamental insight. In aprevious study, we described an experimental method for directobservation of bubble behavior in spacer filled membrane chan-nels using a video system [5]. Computation Fluid Dynamics (CFD)studies have been widely used to model the flow pattern of single-phase flows in spacer filled channels in order to understand andoptimize the spacer performance [6]. With CFD it is possible tocalculate detailed 3D velocity and concentration profiles and touse these to calculate a resulting flux through the membrane.These calculations are then validated against experimentally deter-mined macroscopic fluxes. Direct experimental information on thedetailed velocity profiles to support these calculations, however,is very limited. Therefore, there is a need to investigate theseprofiles experimentally, preferably with a direct, non-invasivetechnique. Particle Imaging Velocimetry (PIV) is a technique that allowsusers to visualize fluid flow without disturbing the flow. A detailed GModel description of the technique is given by Adrian [7]. The flow isseeded with small tracer particles (1-50 um, depending on theapplication) and illuminated with a double pulsed laser sheet. Witha digital camera, two frames are taken with very short inter-frametimes (from ~5 us up to 2 ms, depending on the application). Thetwo frames are each divided into small interrogation areas and across-correlation algorithm is applied to find the displacement ofthe particles during the inter-frame time. With a known image scaleand the inter-frame time, this can subsequently be translated into areal velocity vector (i.e. magnitude and direction) for the interroga-tion area. Applying this procedure to all interrogation areas yieldsa velocity vector field for the whole image illuminated by the lasersheet. This can then be used to identify dead zones, recirculationareas, turbulence or unsteady flow, maldistribution of flow, shearrates, etc. To the best of the authors'knowledge, liquid flow in a spacerfilled channel was only investigated experimentally with PIV byGimmelshtein and Semiat [8]. They studied the single-phase flowfield in single spacer cells. Their conclusion was that the bulk of thefluid flows from the inlet to the outlet in a straight line, with onlyminor interference of the spacer. They only found minor velocitydeviations near the spacer filaments. Because of the limited availability of experimental studies onthis subject, we studied the flow of water and water-air mixturesthrough spacer filled channels at various superficial velocities andspacers with various length scales. First of all velocity fields areshown for the entire flow cell. Thereafter an area of a few cm² con-taining a few spacer cells is studied. This is followed by a detailedstudy of the flowthrough a single spacercell(2.5mmx3 mm). Withdecreasing area,the level of detail of the velocity fields increases.In the study of the single cell velocity profiles it was even possibleto obtain the velocity field as function of the height in the chan- Fig. 1. Schematic representation of the flow cell. nel.The results are compared to both the experimental data andthe CFD studies available in the literature. Furthermore, we extendthe available PIV data to two-phase flow in spacer filled channels,which is unprecedented in the literature. Name Thickness (mm) Filament angle (°) Filament spacing (mm) Hydraulic diameter (mm) Porosity (-) Material Type A 0.50 90 2.5 0.70 0.92 Nylon Nylon 1000 B 1.17 90 3.63 1.36 0.87 PP nfnb214 1.00 90 2.08 0.92 0.81 PP X04410 PP=polypropylene. (a) 0.25( 0.225 0.2 0.175 0.15 ·0.125 0.1 0.075 0.05 0.025 0.25 0.225 0.2 0.175 ·0.15 sw-0.122552Aoju 0.1 0.075 0.05 0.025 Fig.2. Time averaged (a) and instantaneous (b) flow field for spacer B (v1=0.1 m/s,Re=56). (a) 5.0 (b) EEooa position mm position mm (c) E>a Fig. 3. Flow pattern for spacer C at different depths in the channel: (a) front of the channel (center -0.4 mm, filaments \\), (b) center and (c) back of the channel (center+0.4mm, filaments //) (DOF 0.6mm,v1=0.5m/s,Re=250). 2. Experimental All experiments were performed with the setup depicted inFig. 1. It consists of a liquid pump (Verder pumps, Leeds, UK),two pressure sensors (Keller AG, Winterthur, Switzerland), a massflow controller (Brooks Instruments,Veenendaal,TheNetherlands)for the gas flow and a flow cell. The flow cell is custom madefrom 1 cm thick PMMA plates and has a rectangular channel of5 cm×15 cm for the flow. Channel height is determined by thethickness of the spacer between the plates. The channel is posi- tioned vertically for all experiments. Liquid enters through 1 mmholes (2mm apart) approximately 5 mm from the bottom of thechannel, and exits via a similar arrangement 5 mm from the topof the channel. Gas enters the cell via a single 1 mm hole located25 mm from the channel bottom. Since the permeate flow in ROis very small compared to the cross flow velocity [8], the cellwas operated without permeation. The spacers used in this studywere all obtained from Conwed plastics (Genk, Belgium), geomet-ric data are summarized in Table 1. The results and PIV graphsshown in this paper are typical and representative for the complete ( Please cite this article in press as : P. Willems, et al.,Use of Particle Imaging Velocimetry to measure liquid velocity profiles in liquid and liquid/gas flows through spacer filled channels, J. Membr.Sci. (2010), doi:10.1016/j.memsci.2010.06.029 ) (a) (b) EEo意o (c) (d) (e) Fig. 4. Time averaged velocity profiles at (a) 0.3 mm below the center, (b)0.1 mm below the center, (c) the center,(d) 0.1 mm above the center,(e) 0.3 mm above the centerof the channel and (f) indication of position of a-e (depth of field ~0.2mm, spacer B) (v1 =0.1 m/s,Re=56). ( Please cite this article in press as: P. Willems, et al., Use of Particle Imaging Velocimetry to measure liquid velocity profiles in liquid and liquid/gas flows through spacer filled channels,J . Membr. Sci.(2010), doi:10.1016/j.memsci.2010.06.029 ) (a) EEco -1 EEoo position mm position mm (C) 1.4 -1.3 1.2 1.1 1.0 -0.9 0.8oo uE>-0.7 0.6 -0.5 0.4 0.3 0.2 0.1 position mm Fig. 5. Time averaged velocity profiles at (a) 0.3 mm below the center, (b) the center and (c)0.3 mm above the center of the channel (Spacer A, V1=0.36m/s,Re=88). range of conditions investigated, and include operational condi-tions generally applied during full scale operation of RO spiralwound systems. All single and few spacer cell recordings were per-formed near the center of the flow cell to ensure fully developedflow. interval between the first and the second frame was varied from 80to 2600 ps, depending on the flow rate.Either a 50 mm lens (Nikon,Lijnden, The Netherlands) or an Optem 12.5× variable zoom lens(Edmund Optics, York, UK) was mounted on the camera. The flowwas seeded with 50 um polyamide (whole cell) or 10 pm hollowglass (intermediate and single cell level) particles (Dantec, Ulm,Germany). The whole depth of the spacer filled channel was illu- ( Please cite this article in press as: P. Willems, et al . , Use of Particle Imaging Velocimetry to measure liquid velocity profiles in liquid and liquid/gas flows through spacer filled channels, J. Membr. Sci. (2010), doi:10.1016/j.memsci.201 0 .06.029 ) ARTICLE IN PRESS Spacer B Fig. 6. Comparison between flow profiles at 0.75× the height of the channel from CFD calculations (left, from [12]) and PIV (right, this work). Filament spacing/channelheight=2 for D2245 spacer and 3 for D3345 (pictures not to scale). minated from the side of the middle plate by a laser (New WaveSolo-PIV Nd:YAG). PIV is most often used to study flow phenomena in larger 3Denvironments. In these applications the position of the laser sheetcan be varied to measure flow profiles at different depths in thesystem.The thickness of the spacer channel (0.7-1.1mm), how-ever, is smaller than the thickness of the laser sheet (close to 2 mm)and changing the position of the sheet was not an option. This is acommon situation in uPIV applications, which is solved by fixingthe camera focus at a given distance from the lens and moving theobject of interest [9]. The thickness of the measurement plane thenis determined by the focal depth of the camera.Therefore, the flowcell was placed on a translation stage (10 um accuracy, Sherlineproducts, Vista, CA,USA), which allowed the position of the cell tobe changed by as little as 0.05 mm. The length of the translationstage was more than sufficient to position the full depth of the flowcell in the focal plane of the lens. Together with the limited depthoffield (down to ~0.2 mm), this enabled us to obtain velocity profilesas function of the distance from the cell walls. The cell was posi-tioned such that the tracer particles near one wall were barely infocus and from there on a velocity field was measured every 0.1 mmuntil reaching the other wall. The images obtained from the PIV system were unevenly illu-minated due to system limitations, and both the spacer and thegas bubbles interfere with the correlation procedure. Therefore,the images were treated with the following procedure, details ofwhich are described in a separate paper [10]. The image pairs werefirst normalized with the local sliding minimum and maximumintensities, which enhanced the particles in the image and reducedthe bubble intensities. Thereafter, images were normalized withthe global minimum and maximum, which eliminated the inten-sity difference between the frames. The frames in the normalizedimage pairs were then subtracted from each other, resulting in twoframes which only showed the particles and part of the bubbles,i.e.all moving objects. For the gas liquid datasets, a mask was made toeliminate the bubbles from the PIV-image. This was done by thresh-olding the original image,followed by an erode-dilate sequence tofill the gaps in bubble edges.After obtaining the bubble edges, thearea outside the bubble edge was given an intensity of1 and theareainside (and including the)bubble edge was set to 0. Multiplying thisimage with the normalized and subtracted image to be analyzed,removed the bubbles from the image. These frames were then sub- ( Please cite this article in press as: P. Willems, et al., Use of Particle Imaging Velocimetry to measure liquid velocity profiles in liquid and liquid/gas flows through spacer filled channels, J . Membr.Sci. (2010), doi:10.1016/j.memsci.2010.06.029 ) Y(-) Fig.7. (a) Normalized experimental velocity on line (parallel to line A-B in Fig.6)inflow direction.(b)Normalized experimental velocity on lines (parallel to line C-D inFig.6) upstream and downstream of filament perpendicular to flow direction.XandY are respectively the dimensionless position on the lines A-B and C-D. NFNB214 isspacer B, X04410 is spacer C (see Table 1). jected to a multi-pass PIV algorithm with decreasing interrogationareas. Final interrogation areas were 32×32 pixels. A minimum of100 image pairs were used to compute statistics. Vector fields werepost-processed with a median filter and vectors with a peak ratiobelow 1.1 were removed. 3. Results 3.1. Single-phase flow Fig. 2 shows the time averaged and instantaneous (i.e. derivedfrom a single image pair) velocity profiles for single-phase flow(Vavg =0.1 m/s). The time averaged flow shows velocities straightfrom the bottom to the top of the flow cell with very little variationin the transverse direction.This shows that fluid distribution overthe width of the cell is good. From this figure, the conclusion couldbe that the spacer has only minor influence on the direction of theliquid flow. However, the time resolved velocity field, as shown inFig.2b proves this conclusion to be incorrect. The flow shows cleardeviations from the straight line, which seem to be caused by thespacer. Averaging these flow fields over time will eliminate thesedeviations, since they are equally distributed to the left and right E Fig. 8. Liquid flow with stagnant bubbles present (Vr=0.10m/s, Re=37). and there is no loss of fluid through the sides of the channel.Also, aswill be discussed below, the velocity profiles shown here are aver-aged over the whole depth of the channel. Most likely the randomvectors in the instantaneous flow field are caused by a correlationbetween the two consecutive frames that is too weak. Therefore.care has to be taken with interpreting the time averaged velocityfields. Fig.3 shows the velocity profiles for spacer C at different depthsin the channel. The flow in the front of the channel (a) is completelyaligned with the filaments in this part of the channel, which runfrom bottom right to top left(\). The flow at the back of the chan-nel (c) has a 90° angle with respect to the flow at the front and isaligned with the filaments at the back of the channel())). The flowin the middle of the channel (b) shows a mixed image of the flowat the back and the front of the cell as well as the middle, which isprobably caused by the relatively high depth of field (DOF) in thiscase (~0.6mm). The flow still shows a major contribution to theright top corner, which indicates the focus is slightly behind thecenter of the channel. Fig. 3 also shows that the highest velocitiesare observed directly above (or below) or slightly behind the fila-ments. Fig. 3a even indicates a slight increase in velocity along theline A-B. This is most likely caused by the drag from the flow in theback of the channel, where flow is from bottom-left to top-right. To gain more insight into the flow behavior in the center of thechannel, PIV experiments were also performed at a higher mag-nification. This further reduced the DOF to 0.2 mm and allowed ahigher resolution of the flow profiles as a function of depth in thechannel. Fig. 4 shows the measured time averaged velocity profiles at 5depths for part of a single spacer cell. The velocity profile shown inFig. 4a was observed for the front halfof the channel, with very littledifference between the measurements, both for the time averagedand the instantaneous velocity fields. The profile of the other halfofthe channel was the same as given in Fig. 4e. The flow profile givenin Fig. 4c was only obtained for the exact center of the channel. Theprofiles 0.1 mm above and below the center are given in Fig. 4b andd. This indicates that the flow transition (from following the topfilaments (\\) to the bottom (//)) takes place in less than 0.2 mm.The superficial velocity of the fluid in this figure is 0.15 m/s, but theflow behavior was similar at least up to 0.3 m/s although the tran-sition region seems to get slightly larger. As was observed above, ( Please cite this article in press as: P. Willems, et al . , Use of Particle Imaging Velocimetry to measure liquid velocity profiles in liquid and liquid/gas flows through spacer filled channels, J. Membr. Sci. (2010), doi:10.1016/j.memsci.201 0 .06.029 ) (a) (b) 2 3 4 5 7 6 Fig. 9. Flow in the presence of a stagnant bubble (Spacer B, DOF~0.2 mm,vi=0.05m/s,Vg=0 m/s, Re=23)(a) front (filaments \\) and (b) back of the channel (filaments//). the liquid velocity is highest above (and slightly downstream of)the spacer filaments. The asymmetry in the velocity caused by theflow in the other half of the channel can also be seen. This is in disagreement with the findings of Gimmelshtein andSemiat [8], who found that the time average velocity is mainly fromthe inlet to the outlet with only small deviations near the spacer fil-aments. The main difference between their channel and ours is thefact that the spacer in our setup filled the whole depth of the chan-nel, whereas in Semiat’s setup the spacer was 20% thinner than thethickness of their channel. The spacer dimensions,orientation andflow velocity (and with these spacer voidage and channelReynolds)are almost the same as spacer C. Therefore, in our setup the flowis restricted to the volume between the spacer filaments and willbe directed parallel to the filaments at that height. This hypothesiswas confirmed by measurements with spacer A, which did not fillthe complete channel, as shown in Fig. 5. Some evidence is presentof flow alignment to the filaments and deviation near the filamentcrossings. However, the in-plane direction of the bulk of the flowis not influenced by the presence of the spacer. With our setup itwas not possible to obtain the in and out of plane motion (in otherwords, the third velocity component) to show the zigzag motion(in depth) over and under the spacer filaments. However, since thevelocity profiles shown in Fig. 5 do not show large variations in therespective channel halves, it is expected that this motion will belimited. Shakaib et al. [11,12] performed CFD calculations (using Fluent)for diamond type spacers with different geometries, with filamentspacing being an important variable in their work. They consideredfully developed, steady state, laminar 3D flow in the channel. Fig. 6shows on the left their simulated flow pattern for two spacers thatare geometrically comparable with two of the spacers used in ourwork, as are the flow conditions. The top spacer, with a smaller fil-ament spacing (spacing equals 2 times the channel height), showsa more homogenous velocity distribution compared to the bottomspacer (spacing of 3times thechannelheight). The increasing veloc-ity distribution (going from the bottom filament crossing to thecrossing on the right) measured for spacer B was also predicted bythe CFD calculations.Even though the spacers used in this work are not perfectly cylindrical, agreement between simulation andexperiment is striking. The non-uniform diameter of the filamentsresults for example in a small leakage flow which is visible on thefilament positions (as velocity vectors with very low velocity). The normalized velocity (v/Vmax) along a line in the flow direc-tion in this half of the channel is shown in Fig. 7a for both spacers.This parameter shows a large variation for the spacer with the largerfilament spacing (spacer B). For the spacer with the smaller spac-ing (spacer C) it remains almost constant, except for the area justdownstream of the spacer. This suggests that the velocity profileperpendicular to the direction of flow in this half of the channelis almost constant for spacer C. Fig.7b proves that this is indeedthe case. Spacer B shows a large variation in velocity along a line(parallel to line C-D in Fig. 6) just downstream of the spacer fila-ment. This distribution levels off before the next spacer filament isreached. Quite some literature is available on CFD where the spacer filledchannel is approximated as a 2-dimensional array of circles (see[13] for an overview). In these studies, spacers are subdividedinto cavity (2 consecutive filaments on the same side of the chan-nel), zigzag (filaments alternating between top and bottom) andsubmerged (all filaments in the center of the channel, without con-tact with the walls). One is inclined to comparing the non-wovenspacers with the 2D zigzag spacer, assuming that the main direc-tion of flow will be at a 45° angle with the filaments. This studyshows that a comparison with the cavity spacer would be a morelogical (although not completely correct) alternative within theexperimental conditions studied. The conclusion from the 2D CFDcalculations that an area of low shear stress is present on the mem-brane in contact with the filaments is inconsistent with the actualsituation, since there will be a flow perpendicular (so in the 3rddimension) to the flow in these 2D approximations. 3.2. Single-phase flow with stagnant bubbles Fig. 8 shows the time averaged velocity field of the liquid in thepresence of stagnant bubbles. The stagnant bubbles in this imageclearly cause the fluid to flow around them, thereby reducing the ( Please cite this article in press as: P. Willems, et al., Use of Particle Imaging Velocimetry to measure liquid velocity profiles in liquid and liquid/gas flows through spacer filled channels,J . Membr.Sci. (2010),doi:10.1016/j.memsci.2010.06.029 ) position mm EEo Frame 3 Reference frame Fig. 10. Four consecutive frames of a bubble leaving its position under influence of the liquid flow. An instantaneous velocity field at the same depth in the channel from anundisturbed flow is added for comparison (spacer B,v=0.05m/s,Vg=0.02m/s,Re=23). effective membrane area. It can also be seen that stagnant zonesare present downstream of the bubbles. This is also an undesiredeffect, since this will promote (bio)fouling in these areas. However, when the flow around a stagnant bubble is studied indetail, an interesting phenomenon can be seen.The flow in the com-plete spacer cell in Fig. 9b is relatively undisturbed at this height inthe cell (compared to Fig.3). The flow direction is from cell 5 to cell3 (see figure) and no obstructions are present. The flow stronglychanges direction in cell 6. This is a clear indication that the bub-ble is a serious obstruction of the channel. Fig. 9a shows the frontof the channel, where flow is from cell 7 to cell 1. A wake withvortices is clearly visible in cell 4, which is now in a position down-stream of the stagnant bubble. So although the bubble does blockmembrane area from liquid flow, it also creates a more disturbedflow downstream, which may be beneficial to prevent (bio)foulingthere. 3.3. Two-phase flow Fig. 10 shows the instantaneous velocity fields ofthe liquid whena bubble passes through the spacer cell. An instantaneous velocityfield of single-phase flow in the same spacer cell is included forcomparison. As can be seen from these fields, the liquid flow ismuch more unstable in the case of two-phase flow. For membraneapplications this is desirable, since this will influence the concen-tration polarization layer and prevent the settling of particulatefouling. 4. Discussion The results in this work show that PIV can provide detailedvelocity profiles in both single and two-phase flow in the pres-ence of stagnant objects. The velocity profiles for single-phase flowcan be used as input for and validation of 3D CFD computations.For an excellent summary of both 2D and 3D simulations see thereview by Ghidossi et al. [13]. In addition to the example shown inthe previous paragraph, we observe a sharp change in local fluidvelocity as previously observed by Karode and Kumar [14]. Withregard to 2D CFD calculations [13], our results show that (withinthe experimental range) cavity type geometries (filaments on thesame side of the channel) are more representative of the flow thanzigzag geometries (filaments alternating between channel walls).The same acceleration of the fluid flow between a filament and thechannel wall and just downstream of this filament is also shownin the cavity simulations. The recirculation zone which is presentdownstream of the filaments on the same side of the channel inthese calculations, is not observed in our experiments. This is dueto the perpendicular liquid flow (from the other half of the chan-nel) between the filaments that is present in our experiments. Thisphenomenon is not captured by the 2D simulations. Permeation data are often linked to flow phenomena via wallshear stresses,which affects the thickness of the boundary layeron the wall. The change in flux can generally be explained bychanges in wall shear stress [15]. The shear stresses are often mea-sured with electrochemical methods, where a number ofelectrodesare embedded into the channel wall (for example in [16] for anempty channel). Often this has to be done in a channel withouta membrane to accommodate the electrodes. A recent article byWesterweel et al. [17] provides a method for determining the wallshear stress from velocity profiles at different depths in a chan-nel. Including this in future investigations provides a significantaddition to the type of data presented here. Inclusion of these wallshear estimates in a PIV measurement will provide informationwith a higher spatial resolution in a more flexible system (no elec-trodes have to be repositioned for a different spacer geometry). The increased spatial (and temporal) resolution is also a signifi-cant advantage ofPIV over traditional techniques like injected dyes(which do not allow for distinction between different depths in thechannel) and particle deposition. PIV can be used to determine velocity profiles in a variety ofmembrane geometries, but application to spacer filled channelsis limited. One of the reasons is the extended image processingrequired for proper analysis, as discussed in our previous work[10].The introduction of gas bubbles results in even more pro-cessing before analysis. It is expected that the inclusion of a real(non-transparent) membrane will further complicate the analysisof the images due to decreased contrast between particles, bubbleedges and the background. The use offluorescent particles will helpto a certain extend, but simultaneous recording of the bubbles willstill be difficult. As observed several times in this article, the resolution (in depth)of the method is directly proportional to the depth of field (DOF)of the lens used.A higher resolution will require a smaller DOF,often accompanied by a larger magnification and thus smaller fieldof view. At increased magnification it is essential to position thecamera perpendicular to the channel, with a tolerance decreas-ing at increasing magnification. This will prevent some of the flowasymmetries observed in this work. A precise positioning of thechannel (or camera) is also required to provide accurate spacing ofthe velocity profiles in the channel depth. The results we have shown in this work are limited to veloc-ity profiles of the liquid in single-phase and to a lesser extendliquid-gas flow. Especially the amount of data on two-phase flowis limited and needs to be extended in order to understand the pro-cess of air sparging better.Combining these PIV measurements withpermeation measurements will provide a direct coupling betweenlocal velocity and (average)fluxes and improve the value of thesemeasurements considerably. 5. Conclusions Two-phase flow in spacer filled channels was studied at threelevels of spatial resolution, which all provide complementary infor-mation. Studying the whole flow cell gives information on the flowdistribution and the effect of bubbles on the macroscopic flow pat-terns. However, it does not give information on the variation of thevelocity or flow direction over the height of the cell. This informa-tion is provided by measurements on the scale of a single spacercell, which show that the flow aligns with the spacer filaments.Therefore, the flow direction changes by 90°over the height ofthe channel. This was shown in multiple connecting cells withintermediate magnification measurements. Bubbles increase theunsteadiness of the liquid flow, thereby decreasing the concentra-tion polarization and fouling tendencies. It was shown that, although conditions are unfavorable, it isvery well possible to perform PIV measurements in spacer filledchannels. It can provide data to validate CFD studies as our workcorresponds well with CFD studies by others. The results givefurther insight to various velocity- or shear-related phenomena.Furthermore, it will provide information required for the optimiza-tion of air sparging conditions. References [1] Z.F. Cui, S. Chang, A.G. Fane, The use of gas bubbling to enhance membraneprocesses, Journal of Membrane Science 221 (2003) 1. [2] J. Balster, D.F. Stamatialis, M. Wessling, Towards spacer free electrodialysis,Journal of Membrane Science (2009), doi:10.1016/j.memsci.2009.05.048. [3]GDucom,C. Cabassud,Possible effects of air sparging for nanofiltration of saltedsolutions, Desalination 156 (2003)267. [4] G. Ducom, H. Matamoros, C. Cabassud, Air sparging for flux enhancement innanofiltration membranes: application to O/W stabilised and non-stabilisedemulsions, Journal of Membrane Science 204 (2002)221. ( Please cite this article in press as: P. Willems, et al., Use of Particle Imaging Velocimetry to measure liquid velocity profiles in liquid and liquid/gas flows through spacer filled channels, J .Membr.Sci.(2010), doi:10.1016/j.memsci.2010.06.029 ) ( [5] P. Willems, A.J.B. Kemperman, R.G.H. Lammertink, M. Wessling, M. van Sint Annaland, N.G. D een, J.A.M. Kuipers, W.G.J. van der Meer, Bubbles i n s pac- ers: direct observation of bubble behavior in spacer filled membrane channels, J ournal of Membrane Science 333 (2009)38. ) ( [ 6] J .Schwinge, P .R. Neal,D.E.Wiley,D.F. Fletcher,A.G. Fane, Spiral wound modules and spacers: review and analysis, Journa l of Membrane Science 242 ( 2004) 129. ) ( [7] R.J. Adrian,Twenty years of particl e image velocimetry,Experiments in Fluids 39(2005)159. ) ( [8] M. G immelshtein, R. S e miat, Investigation o f flow next to membrane walls, J ournal of Membrane Science 264 (2005)137. ) ( [9] H. Klank, G. G o ranovic, J. P . K u tter, H . Gj e lstrup, J. Michelsen, C.H. West- ergaard, PIV measurements in a microfluidic 3D-sheathing structure w i th three-dimensional flow behaviour, Journal of Micromechanics and Microengi- neering 12 (2002)862. ) [10] N.G. Deen, P. Willems, A.J.B. Kemperman, R.G.H. Lammertink, M. vanSint Annaland, M. Wessling, W.G.J. Van der Meer, J.A.M. Kuipers, Onimage pre-processing for PIV of single and two-phase flows over reflect-ing objects, Experiments in IFluids (2010), doi:10.1007/s00348-010-0827-y. [11] M. Shakaib, S.M.F. Hasani, M. Mahmood, Study on the effects of spacer geom-etry in membrane feed channels using three-dimensional computational flowmodeling,Journal of Membrane Science 297 (2007)74. [12] M. Shakaib, S.M.F. Hasani, M. Mahmood, CFD modeling for flow and masstransfer in spacer-obstructed membrane feed channels, Journal of MembraneScience 326(2009)270. [13] R. Ghidossi, D. Veyret, P. Moulin, Computational fluid dynamics applied tomembranes: state of the art and opportunities,Chemical Engineering and Pro-cessing 45 (2006)437. [14] S.K. Karode, A. Kumar, Flow visualization through spacer filled channels bycomputational fluid dynamics I. Pressure drop and shear rate calculations forflat sheet geometry,Journal of Membrane Science 193 (2001)69. ( [15] V. Chen, H. Li , A.G. Fane , Non-invasiv e observation of synthetic membrane processes-a r eview of methods, Journal of Membrane Science 241 (2004) 23. ) ( [16] C . Gaucher, P. Legentilhomme, P. Jaouen, J. Comiti, J. Pruvost, Hydrodynamics ) study in a plane ultrafiltration module using an electrochemical method andparticle image velocimetry visualization, Experiments in Fluids 32 (2002) 283. [17] M. Rossi, R. Lindken, J. Westerweel, Optimization of multiplane uPIV for wallshear stress and wall topography characterization, Experiments in Fluids 48(2010)211. Please cite this article in press as: P. Willems, etal., Use of Particle Imaging Velocimetry to measure liquid velocity profiles in liquid and liquid/gasflows through spacer filled channels, J. Membr. Sci.(, doi:j.memsci.
确定
还剩9页未读,是否继续阅读?

产品配置单

北京欧兰科技发展有限公司为您提供《液体流、气体流、两相流、气液两相流中速度场,多相流检测方案(粒子图像测速)》,该方案主要用于其他中速度场,多相流检测,参考标准--,《液体流、气体流、两相流、气液两相流中速度场,多相流检测方案(粒子图像测速)》用到的仪器有德国LaVision PIV/PLIF粒子成像测速场仪
推荐专场


相关方案
更多
该厂商其他方案
更多