


方案详情
文
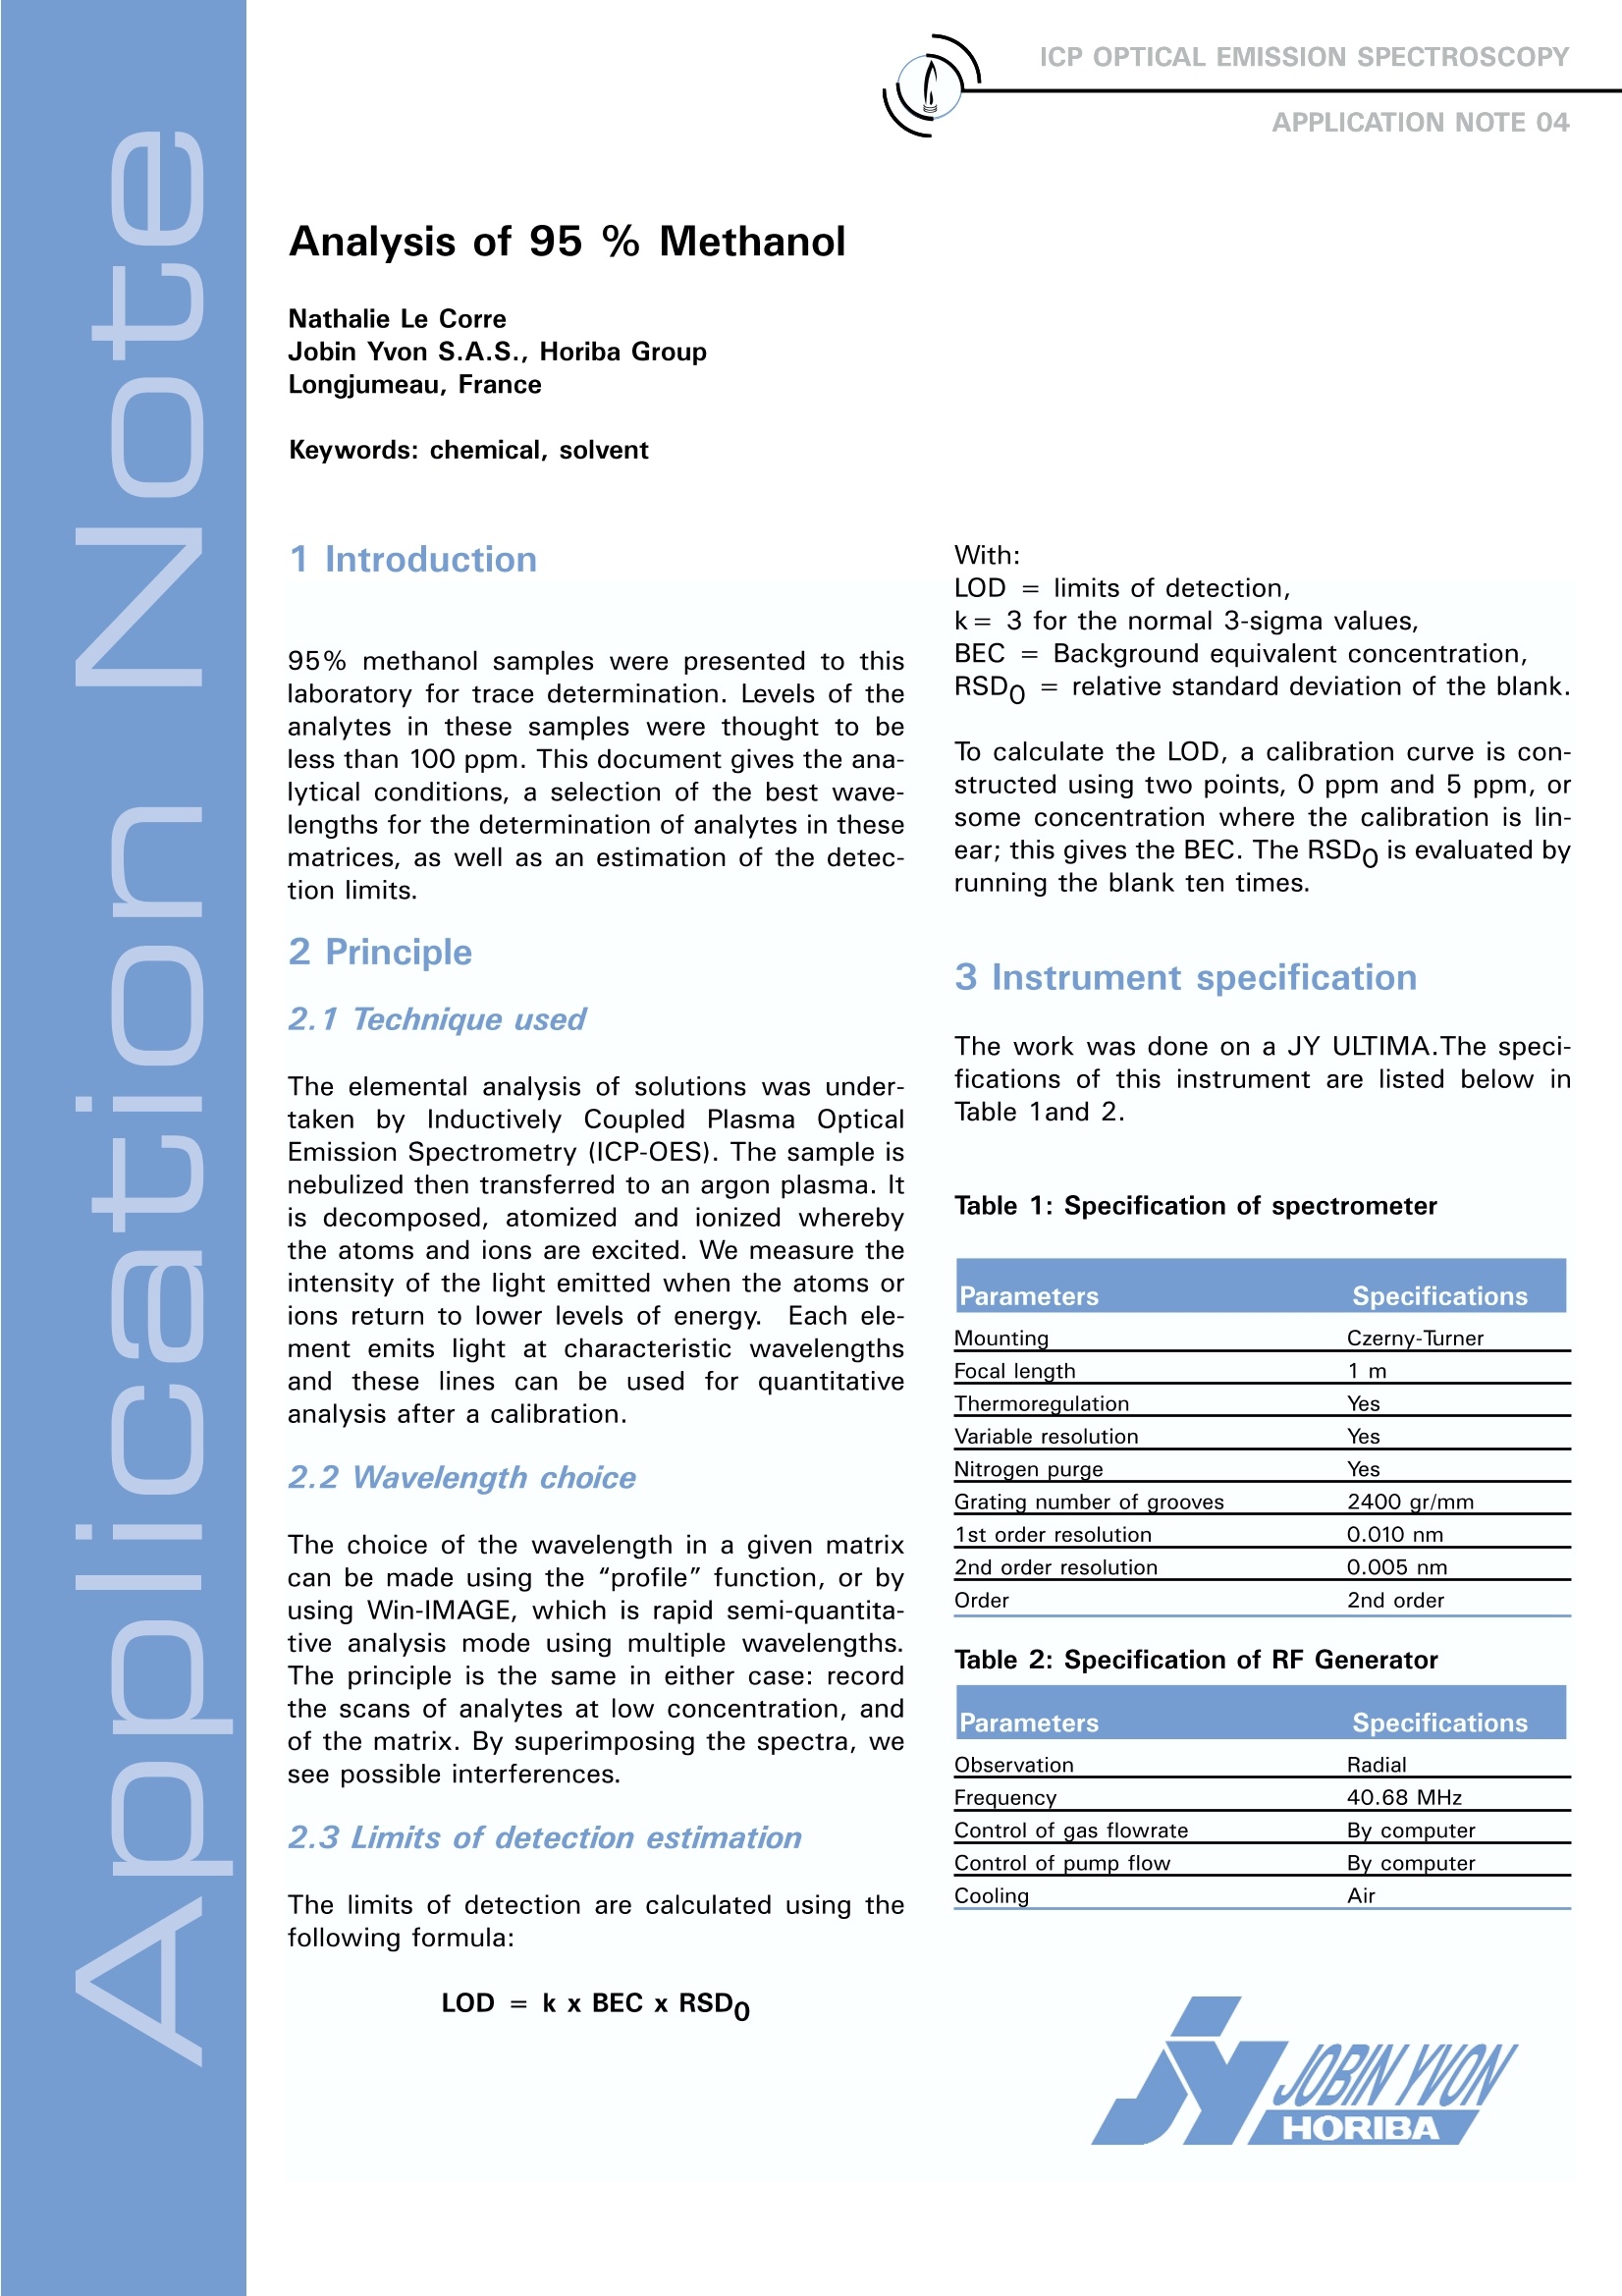
95% methanol samples were presented to this laboratory for trace determination. Levels of the analytes in these samples were thought to be less than 100 ppm. This document gives the analytical conditions, a selection of the best wavelengths for the determination of analytes in these matrices, as well as an estimation of the detection limits.
方案详情

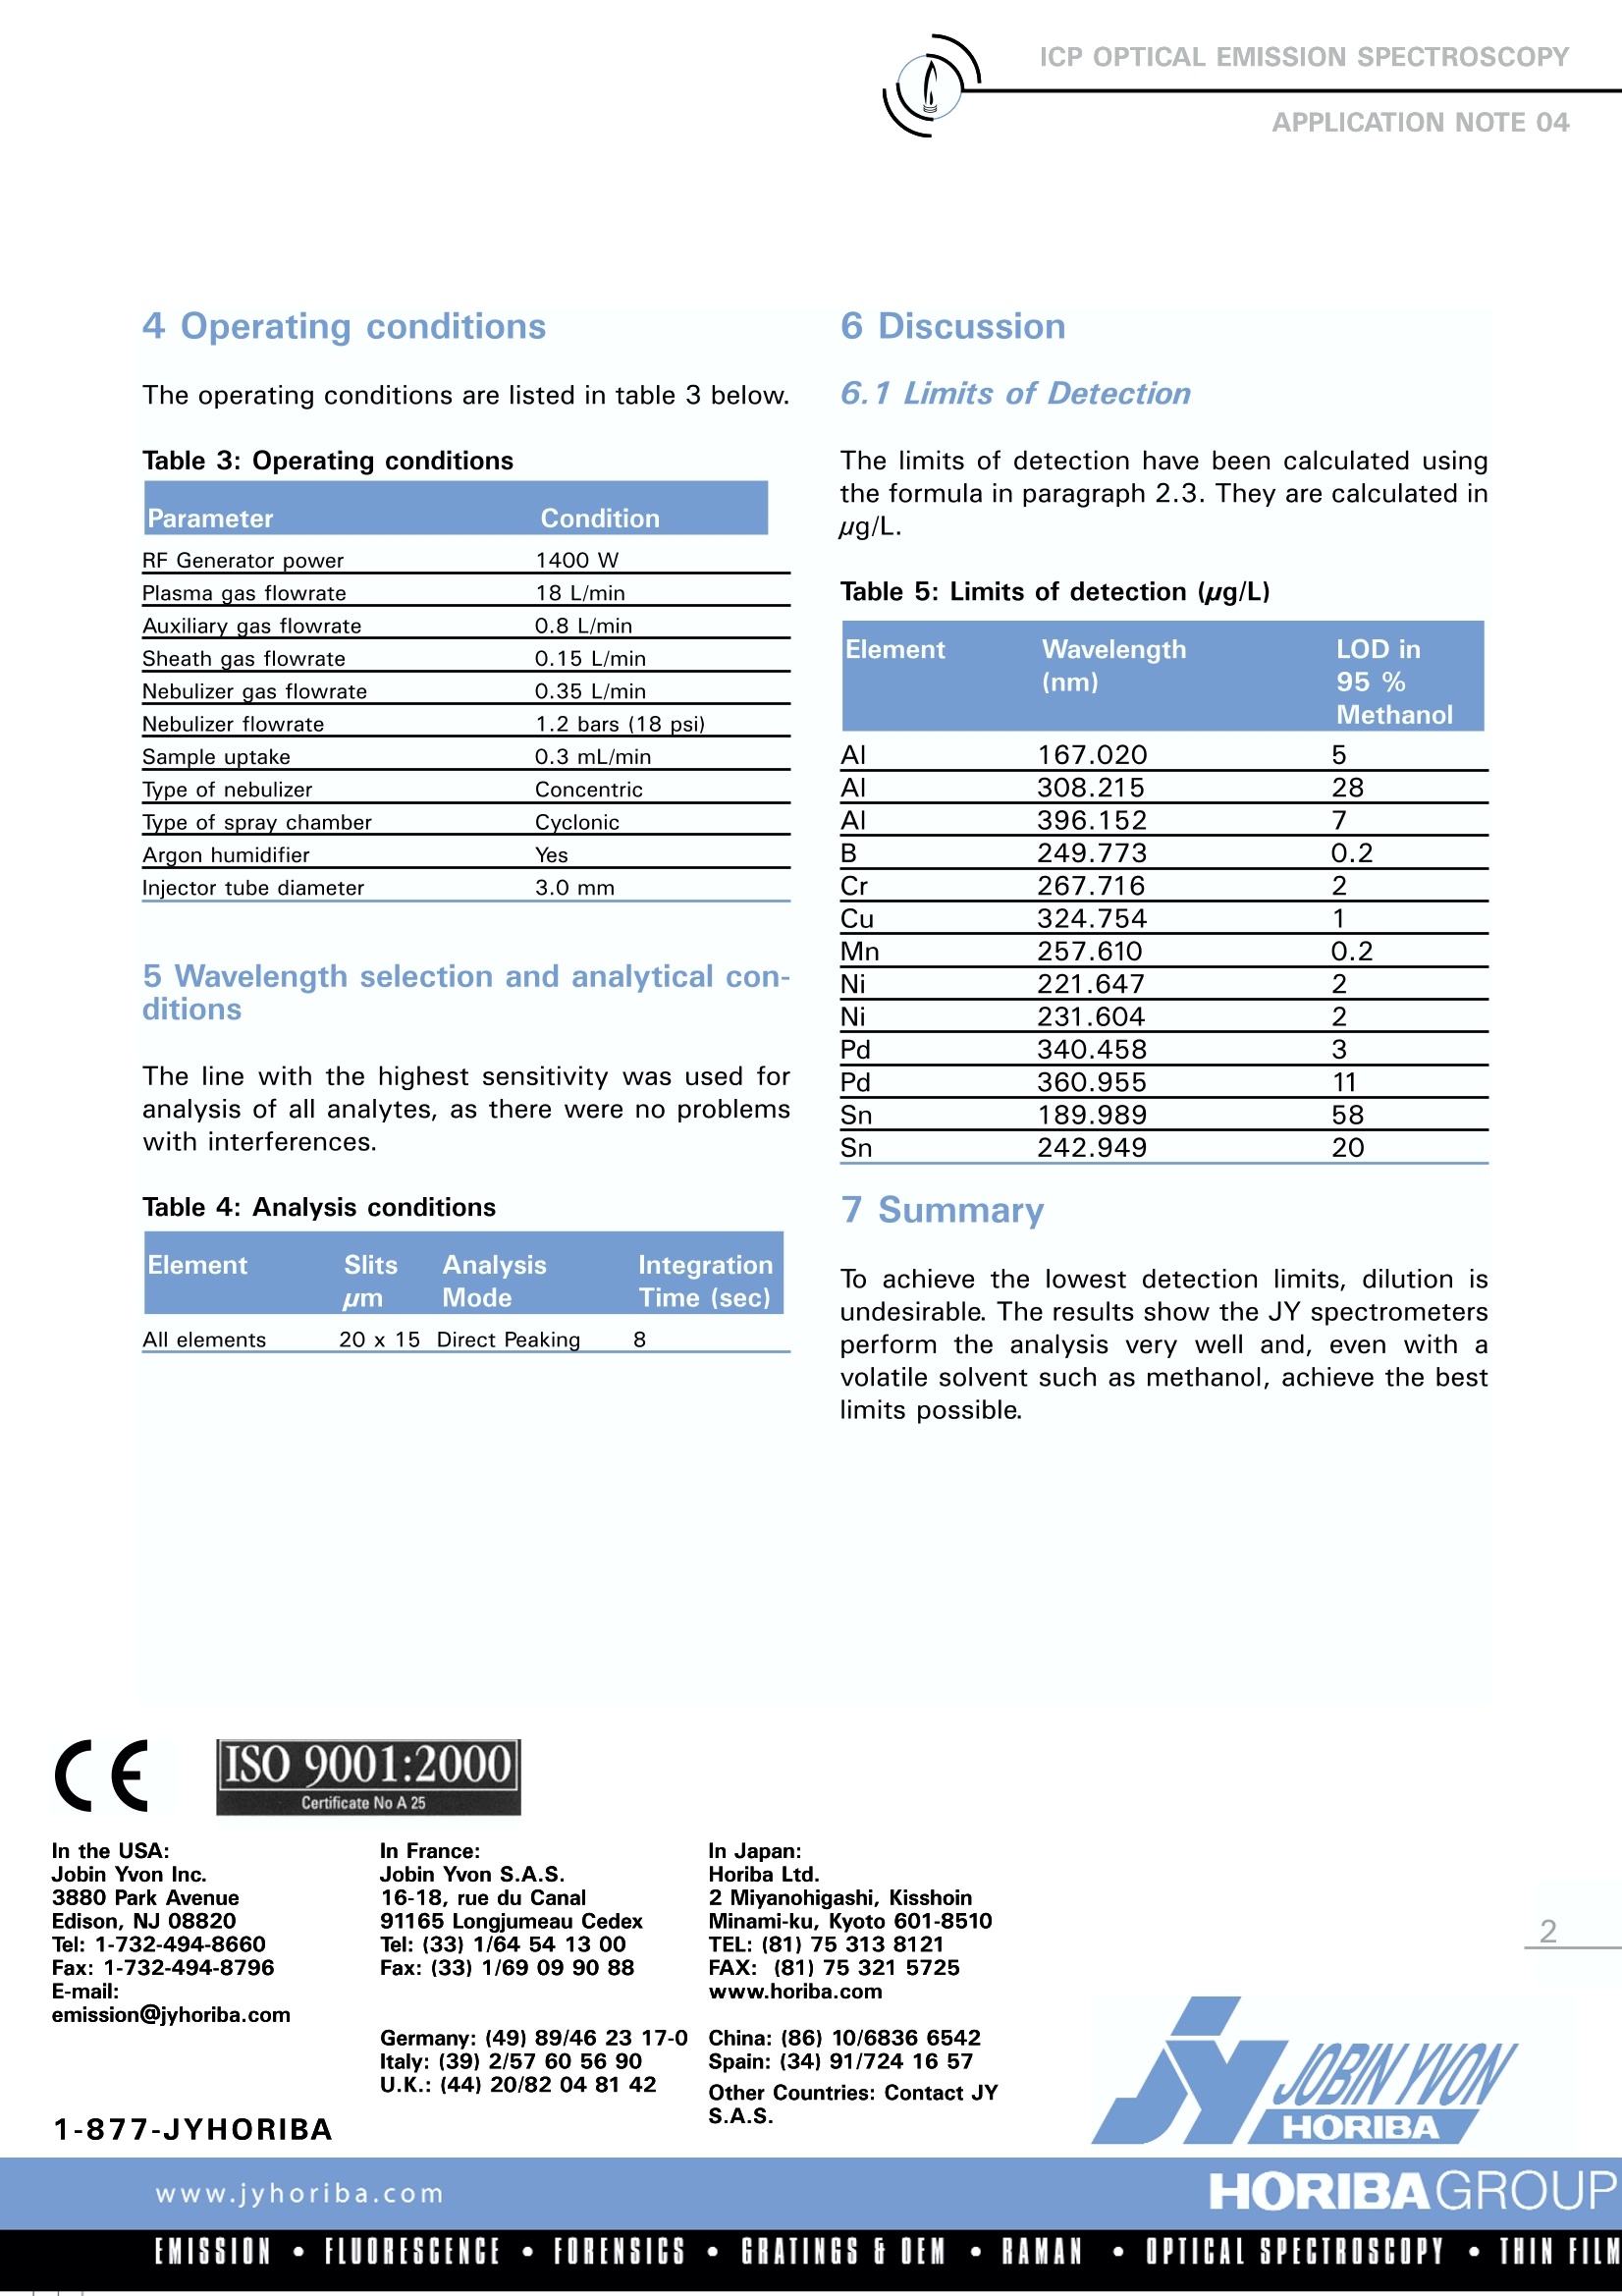
ICP OPTICAL EMISSION SPECTROSCOPYAPPLICATION NOTE 04 2EMISSION·FLUORESCENCE·FORENSICS· GRATINGSGOEM·RAMAN·OPTICAL SPECTROSCOPY·THIN FILM 95% methanol samples were presented to thislaboratory for trace determination. Levels of theanalytes in these samples were thought to beless than 100 ppm. This document gives the ana-lytical conditions, a selection of the best wave-lengths for the determination of analytes in thesematrices, as well as an estimation of the detec-tion limits. 2 Principle 2.1 Technique used The elemental analysis of solutions was under-taken by Inductively Coupled Plasma OpticalEmission Spectrometry (ICP-OES). The sample isnebulized then transferred to an argon plasma. Itis decomposed, atomized and ionized wherebythe atoms and ions are excited. We measure theintensity of the light emitted when the atoms orions return to lower levels of energy. Each ele-ment emits light at characteristic wavelengthsand these lines can be used for quantitativeanalysis after a calibration. 2.2 Wavelength choice The choice of the wavelength in a given matrixcan be made using the “profile"function, or byusing Win-IMAGE, which is rapid semi-quantita-tive analysis mode using multiple wavelengths.The principle is the same in either case: recordthe scans of analytes at low concentration, andof the matrix. By superimposing the spectra, wesee possible interferences. 2.3 Limits of detection estimation The limits of detection are calculated using thefollowing formula: LOD= k x BEC x RSD With: LOD= limits of detection, k=3 for the normal 3-sigma values, BEC = Background equivalent concentration, RSDo = relative standard deviation of the blank. To calculate the LOD, a calibration curve is con-structed using two points, 0 ppm and 5 ppm, orsome concentration where the calibration is lin-ear; this gives the BEC. The RSDo is evaluated byrunning the blank ten times. 3 Instrument specification The work was done on a JY ULTIMA.The speci-fications of this instrument are listed below inTable 1and 2. Table 1: Specification of spectrometer Parameters Specifications Mounting Czerny-Turner Focal length 1 m Thermoregulation Yes Variable resolution Yes Nitrogen purge Yes Grating number of grooves 2400 gr/mm 1st order resolution 0.010 nm 2nd order resolution 0.005 nm Order 2nd order Table 2: Specification of RF Generator Parameters Specifications Observation Radial Frequency 40.68 MHz Control of gas flowrate By computer Control of pump flow By computer Cooling Air 4 Operating conditions The operating conditions are listed in table 3 below. Table 3: Operating conditions Parameter Condition RF Generator power 1400 W Plasma gas flowrate 18 L/min Auxiliary gas flowrate 0.8 L/min Sheath gas flowrate 0.15 L/min Nebulizer gas flowrate 0.35 L/min Nebulizer flowrate 1.2 bars (18 psi) Sample uptake 0.3 mL/min Type of nebulizer Concentric Type of spray chamber Cyclonic Argon humidifier Yes Injector tube diameter 3.0 mm 5 Wavelength selection and analytical con-ditions The line with the highest sensitivity was used foranalysis of all analytes, as there were no problemswith interferences. Table 4: Analysis conditions Element Slits Analysis Integration um Mode Time (sec) All elements 20x 15 Direct Peaking 8 6.1 Limits of Detection The limits of detection have been calculated usingthe formula in paragraph 2.3. They are calculated inug/L. Table 5: Limits of detection (ug/L) Element Wavelength LOD in (nm) 95% Methanol Al 167.020 5 AI 308.215 28 AI 396.152 7 B 249.773 0.2 Cr 267.716 2 Cu 324.754 1 Mn 257.610 0.2 Ni 221.647 2 Ni 231.604 2 Pd 340.458 3 Pd 360.955 11 Sn 189.989 58 Sn 242.949 20 7 Summary To achieve the lowest detection limits, dilution isundesirable. The results show the JY spectrometersperform the analysis very well and, even with avolatile solvent such as methanol, achieve the bestlimits possible. In the USA: Jobin Yvon Inc. 3880 Park Avenue Edison, NJ 08820 Tel: 1-732-494-8660 Fax: 1-732-494-8796 E-mail: emission@jyhoriba.com
确定
还剩1页未读,是否继续阅读?

产品配置单

HORIBA(中国)为您提供《采用ICP方法分析95%甲醇》,该方案主要用于其他中--检测,参考标准--,《采用ICP方法分析95%甲醇》用到的仪器有HORIBA Ultima Expert高性能ICP光谱仪
推荐专场
相关方案
更多
该厂商其他方案
更多