


方案详情
文
Non-destructive optical monitoring of chemical composition can be
accomplished using Raman Spectroscopy. Raman spectra can be utilised
to distinguish differences in chemical bond structures. This is particularly useful in applications where reactions could progress towards either a desired product or an undesired by-product. The Raman spectrum indicates when local conditions exist which favour one reaction path over another. This qualitative measurement can be developed into a tool to monitor process conditions.
方案详情

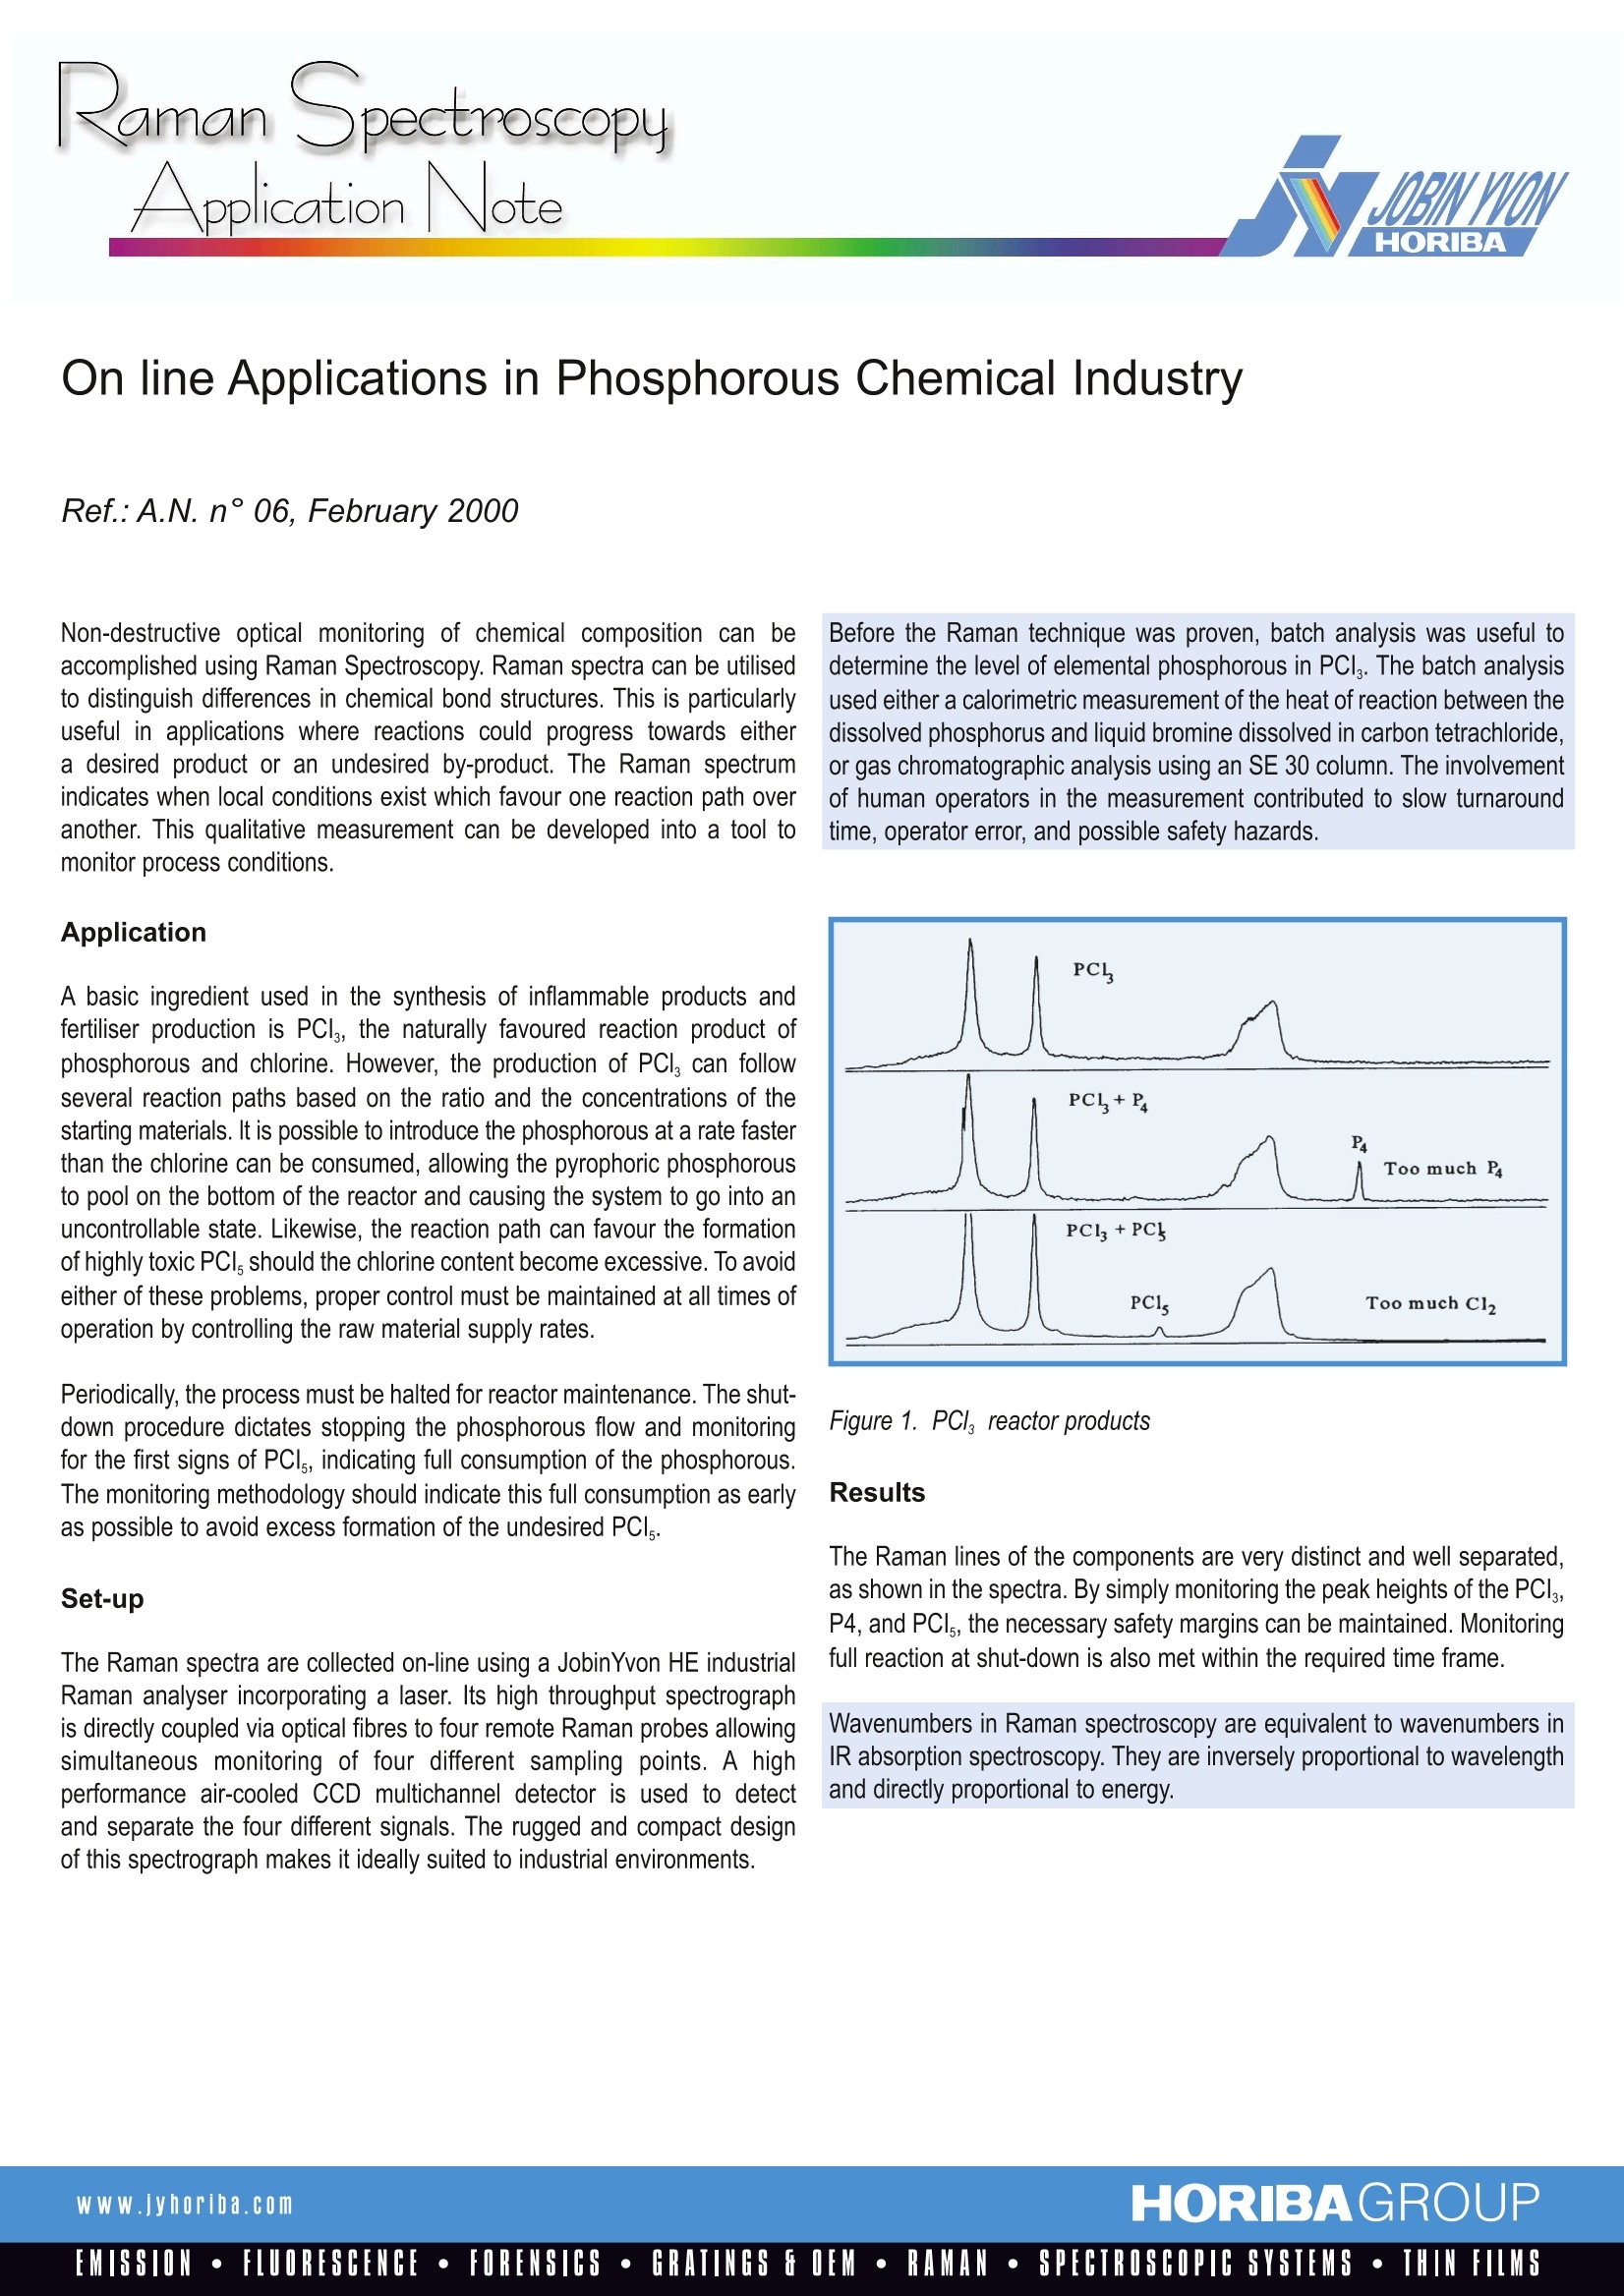
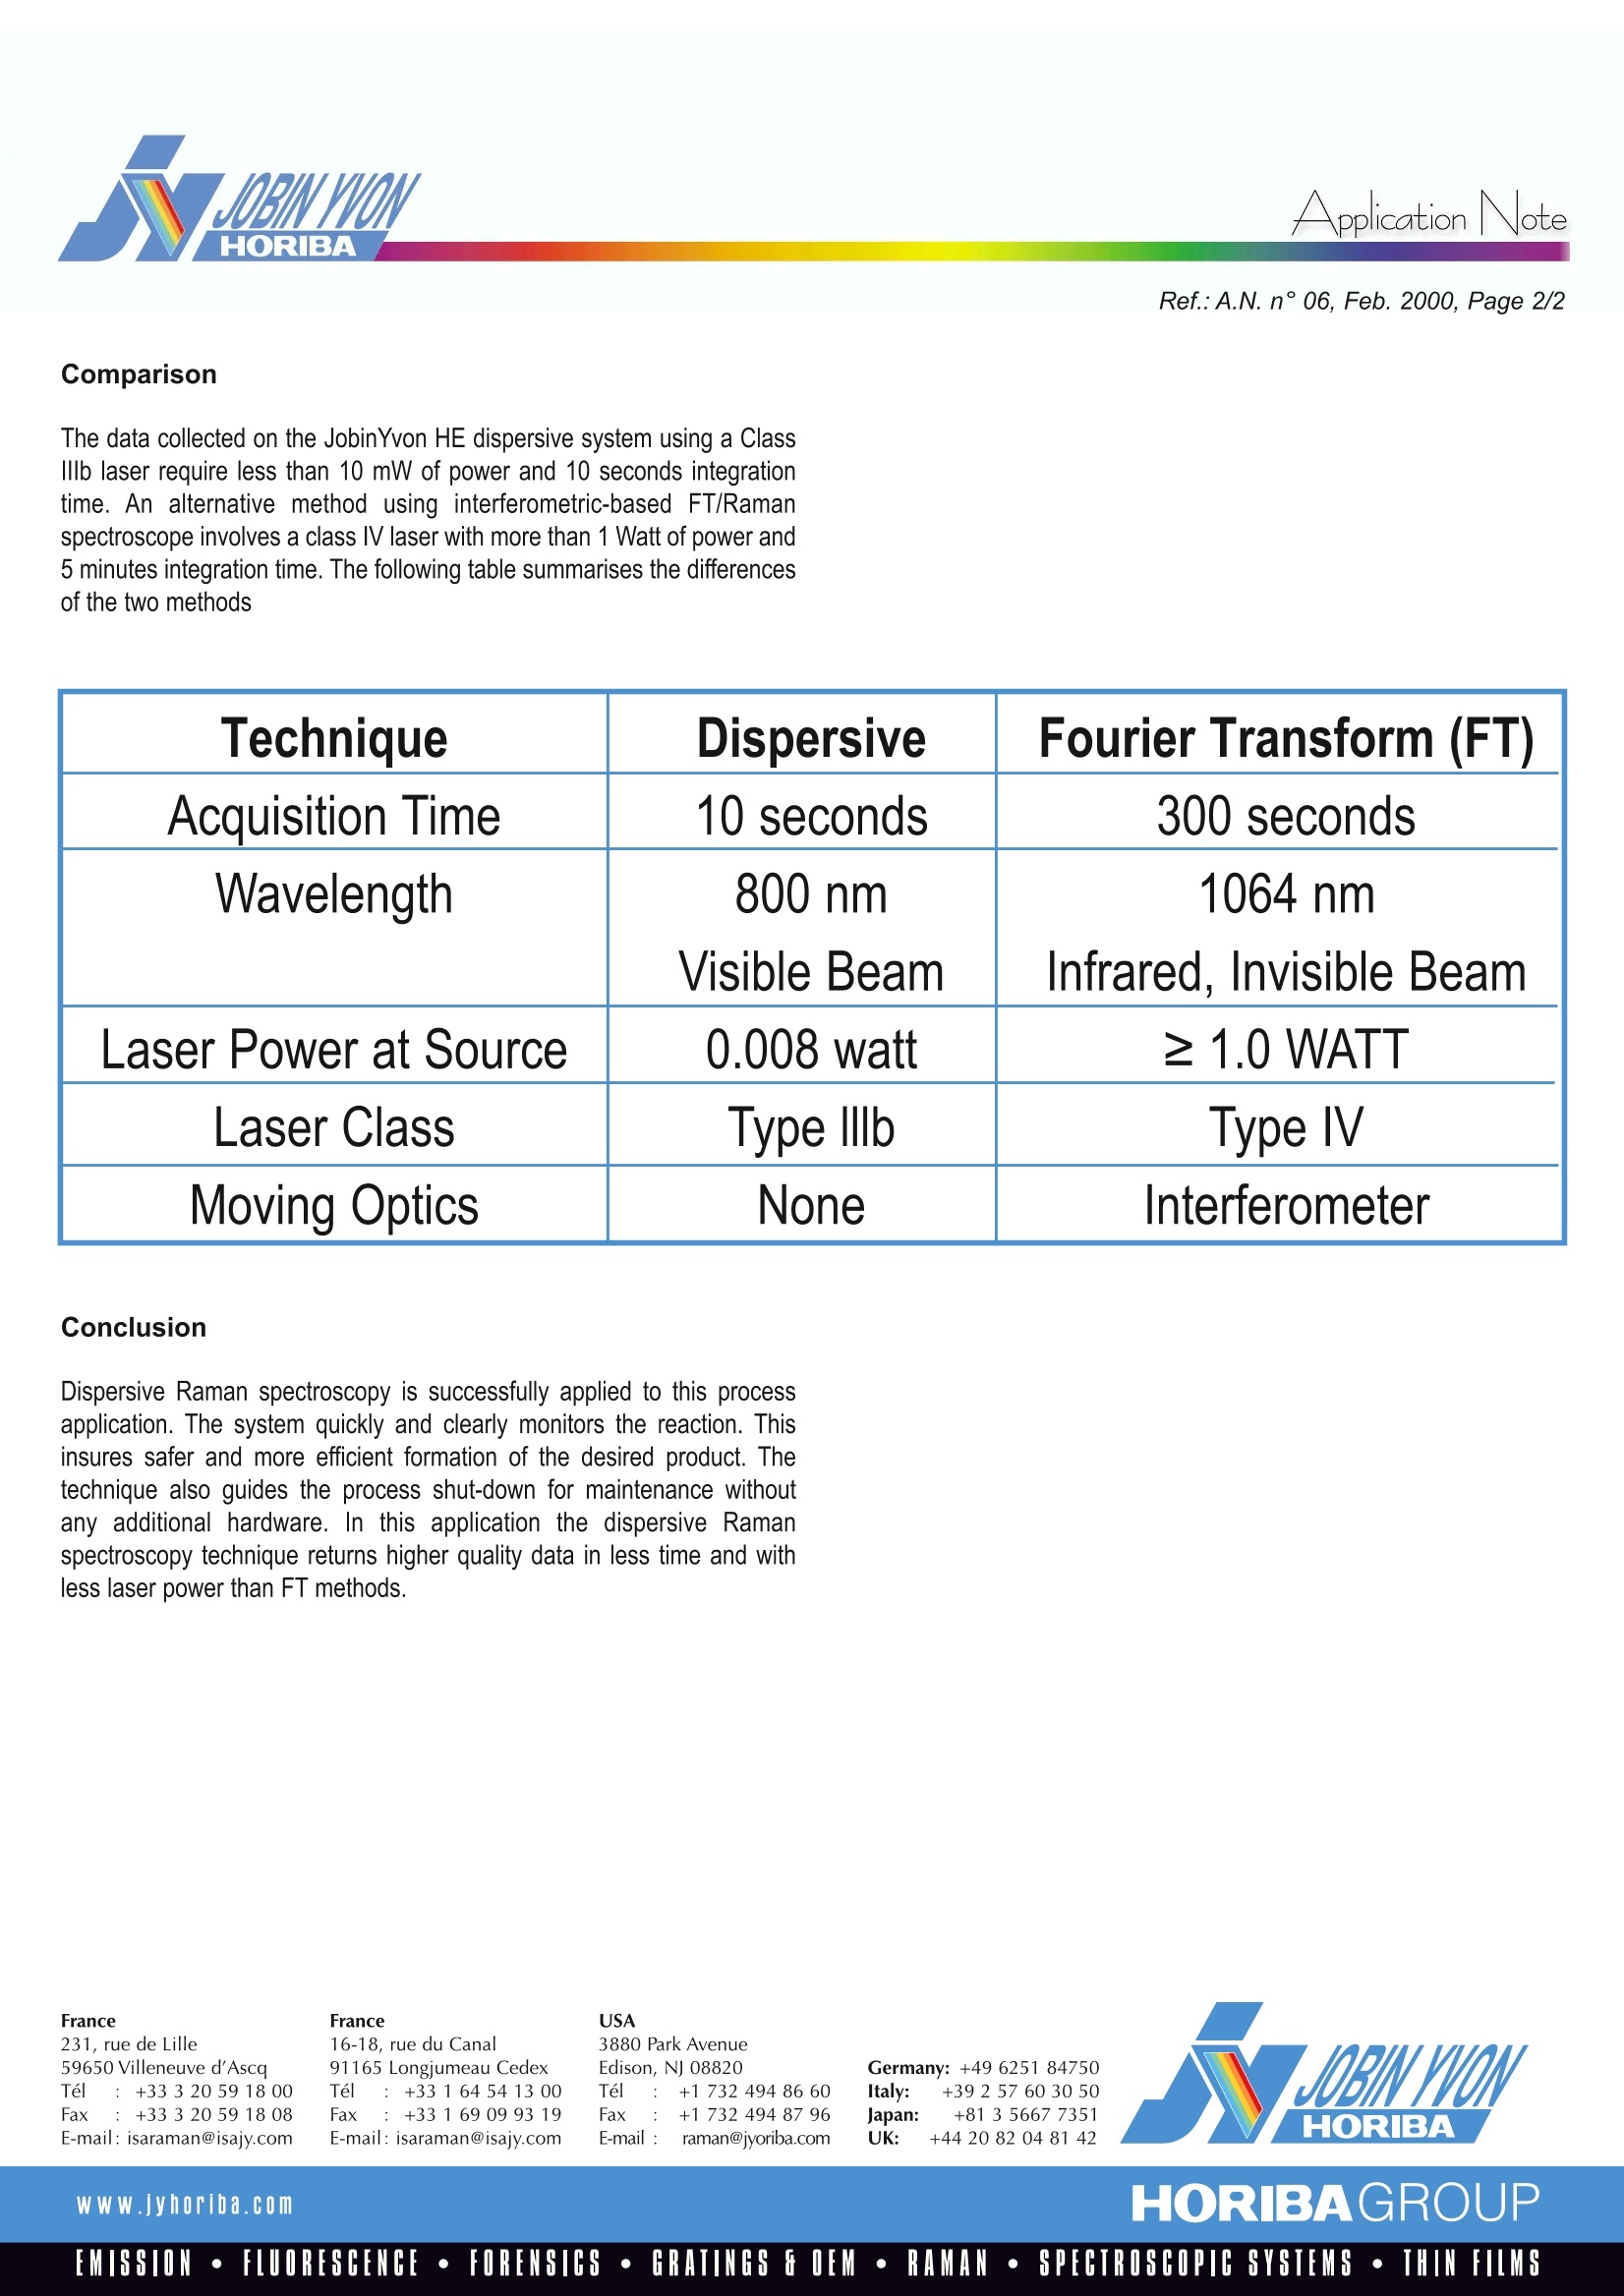
RamanlSpectroscopyApplicationNote ApplicationNote On line Applications in Phosphorous Chemical Industry Non-destructive optical monitoring of chemical composition can beaccomplished using Raman Spectroscopy. Raman spectra can be utilisedto distinguish differences in chemical bond structures. This is particularlyuseful in applications where reactions could progress towards eithera desired product or an undesired by-product. The Raman spectrumindicates when local conditions exist which favour one reaction path overanother. This qualitative measurement can be developed into a tool tomonitor process conditions. Application A basic ingredient used in the synthesis of inflammable products andfertiliser production is PCl, the naturally favoured reaction product ofphosphorous and chlorine. However, the production of PCl, can followseveral reaction paths based on the ratio and the concentrations of thestarting materials. It is possible to introduce the phosphorous at a rate fasterthan the chlorine can be consumed, allowing the pyrophoric phosphorousto pool on the bottom of the reactor and causing the system to go into anuncontrollable state. Likewise, the reaction path can favour the formationof highly toxic PCl, should the chlorine content become excessive. To avoideither of these problems, proper control must be maintained at all times ofoperation by controlling the raw material supply rates. Periodically, the process must be halted for reactor maintenance. The shut-down procedure dictates stopping the phosphorous flow and monitoringfor the first signs of PCls, indicating full consumption of the phosphorous.The monitoring methodology should indicate this full consumption as earlyas possible to avoid excess formation of the undesired PCls. Set-up The Raman spectra are collected on-line using a JobinYvon HE industrialRaman analyser incorporating a laser. Its high throughput spectrographis directly coupled via optical fibres to four remote Raman probes allowingsimultaneous monitoring of four different sampling points. A highperformance air-cooled CCD multichannel detector is used to detectand separate the four different signals. The rugged and compact designof this spectrograph makes it ideally suited to industrial environments. Before the Raman technique was proven, batch analysis was useful todetermine the level of elemental phosphorous in PCl. The batch analysisused either a calorimetric measurement of the heat of reaction between thedissolved phosphorus and liquid bromine dissolved in carbon tetrachloride,or gas chromatographic analysis using an SE 30 column. Theinvolvementof human operators in the measurement contributed to slow turnaroundtime, operator error, and possible safety hazards. Figure 1. PCl, reactor products Results The Raman lines of the components are very distinct and well separated,as shown in the spectra. By simply monitoring the peak heights of the PCl,P4, and PCl,, the necessary safety margins can be maintained. Monitoringfull reaction at shut-down is also met within the required time frame. Wavenumbers in Raman spectroscopy are equivalent to wavenumbers inIR absorption spectroscopy. They are inversely proportional to wavelengthand directly proportional to energy. Ref.:A.N. n°06, Feb. 2000, Page 2/2 Comparison The data collected on the JobinYvon HE dispersive system using a ClassIllb laser require less than 10 mW of power and 10 seconds integrationtime. An alternative method using interferometric-based FT/Ramanspectroscope involves a class l laser with more than 1 Watt of power and5 minutes integration time. The following table summarises the differencesof the two methods Technique Dispersive Fourier Transform (FT) Acquisition Time 10 seconds 300 seconds Wavelength 800 nm 1064 nm Visible Beam Infrared, Invisible Beam Laser Power at Source 0.008 watt ≥ 1.0 WATT Laser Class Type lllb Type l Moving Optics None nterferometer Conclusion Dispersive Raman spectroscopy is successfully applied to this processapplication. The system quickly and clearly monitors the reaction. Thisinsures safer and more efficient formation of the desired product. Thetechnique also guides the process shut-down for maintenance withoutany additional hardware. In this application the dispersive Ramanspectroscopy technique returns higher quality data in less time and withless laser power than FT methods. France231, rue de Lille59650 Villeneuve d'AscaTel : +333205918 00Fax :+33320591808E-mail: isaraman@isajy.com France16-18, rue du Canal91165 Longjumeau CedexTel :+33164541300Fax:+33169099319E-mail: isaraman@isajy.com USA 3880 Park AvenueEdison, NJ 08820Tel :+173249486 60Fax: +17324948796E-mail :raman@jyoriba.com Germany: +49 6251 84750Italy: +39 2 57 603050japan: +81 3 5667 7351UK: +44 20 82 04 81 42 HORIBA w ww.jyhoriba.com HORIBAGROUP HORIBAGROUPWWW.jyhoriba.comEMISSION·FLUORESCENCE·FORENSICS·GRATINGS E OEM·RAMAN·SPECTROSCOPIC SYSTEMS·THIN FILMS
确定
还剩1页未读,是否继续阅读?

产品配置单
HORIBA(中国)为您提供《Online Applications in Phosphorous Chemical Industry》,该方案主要用于其他中--检测,参考标准--,《Online Applications in Phosphorous Chemical Industry》用到的仪器有HORIBA HE科研级便携拉曼光谱仪
推荐专场


相关方案
更多
该厂商其他方案
更多