


方案详情
文
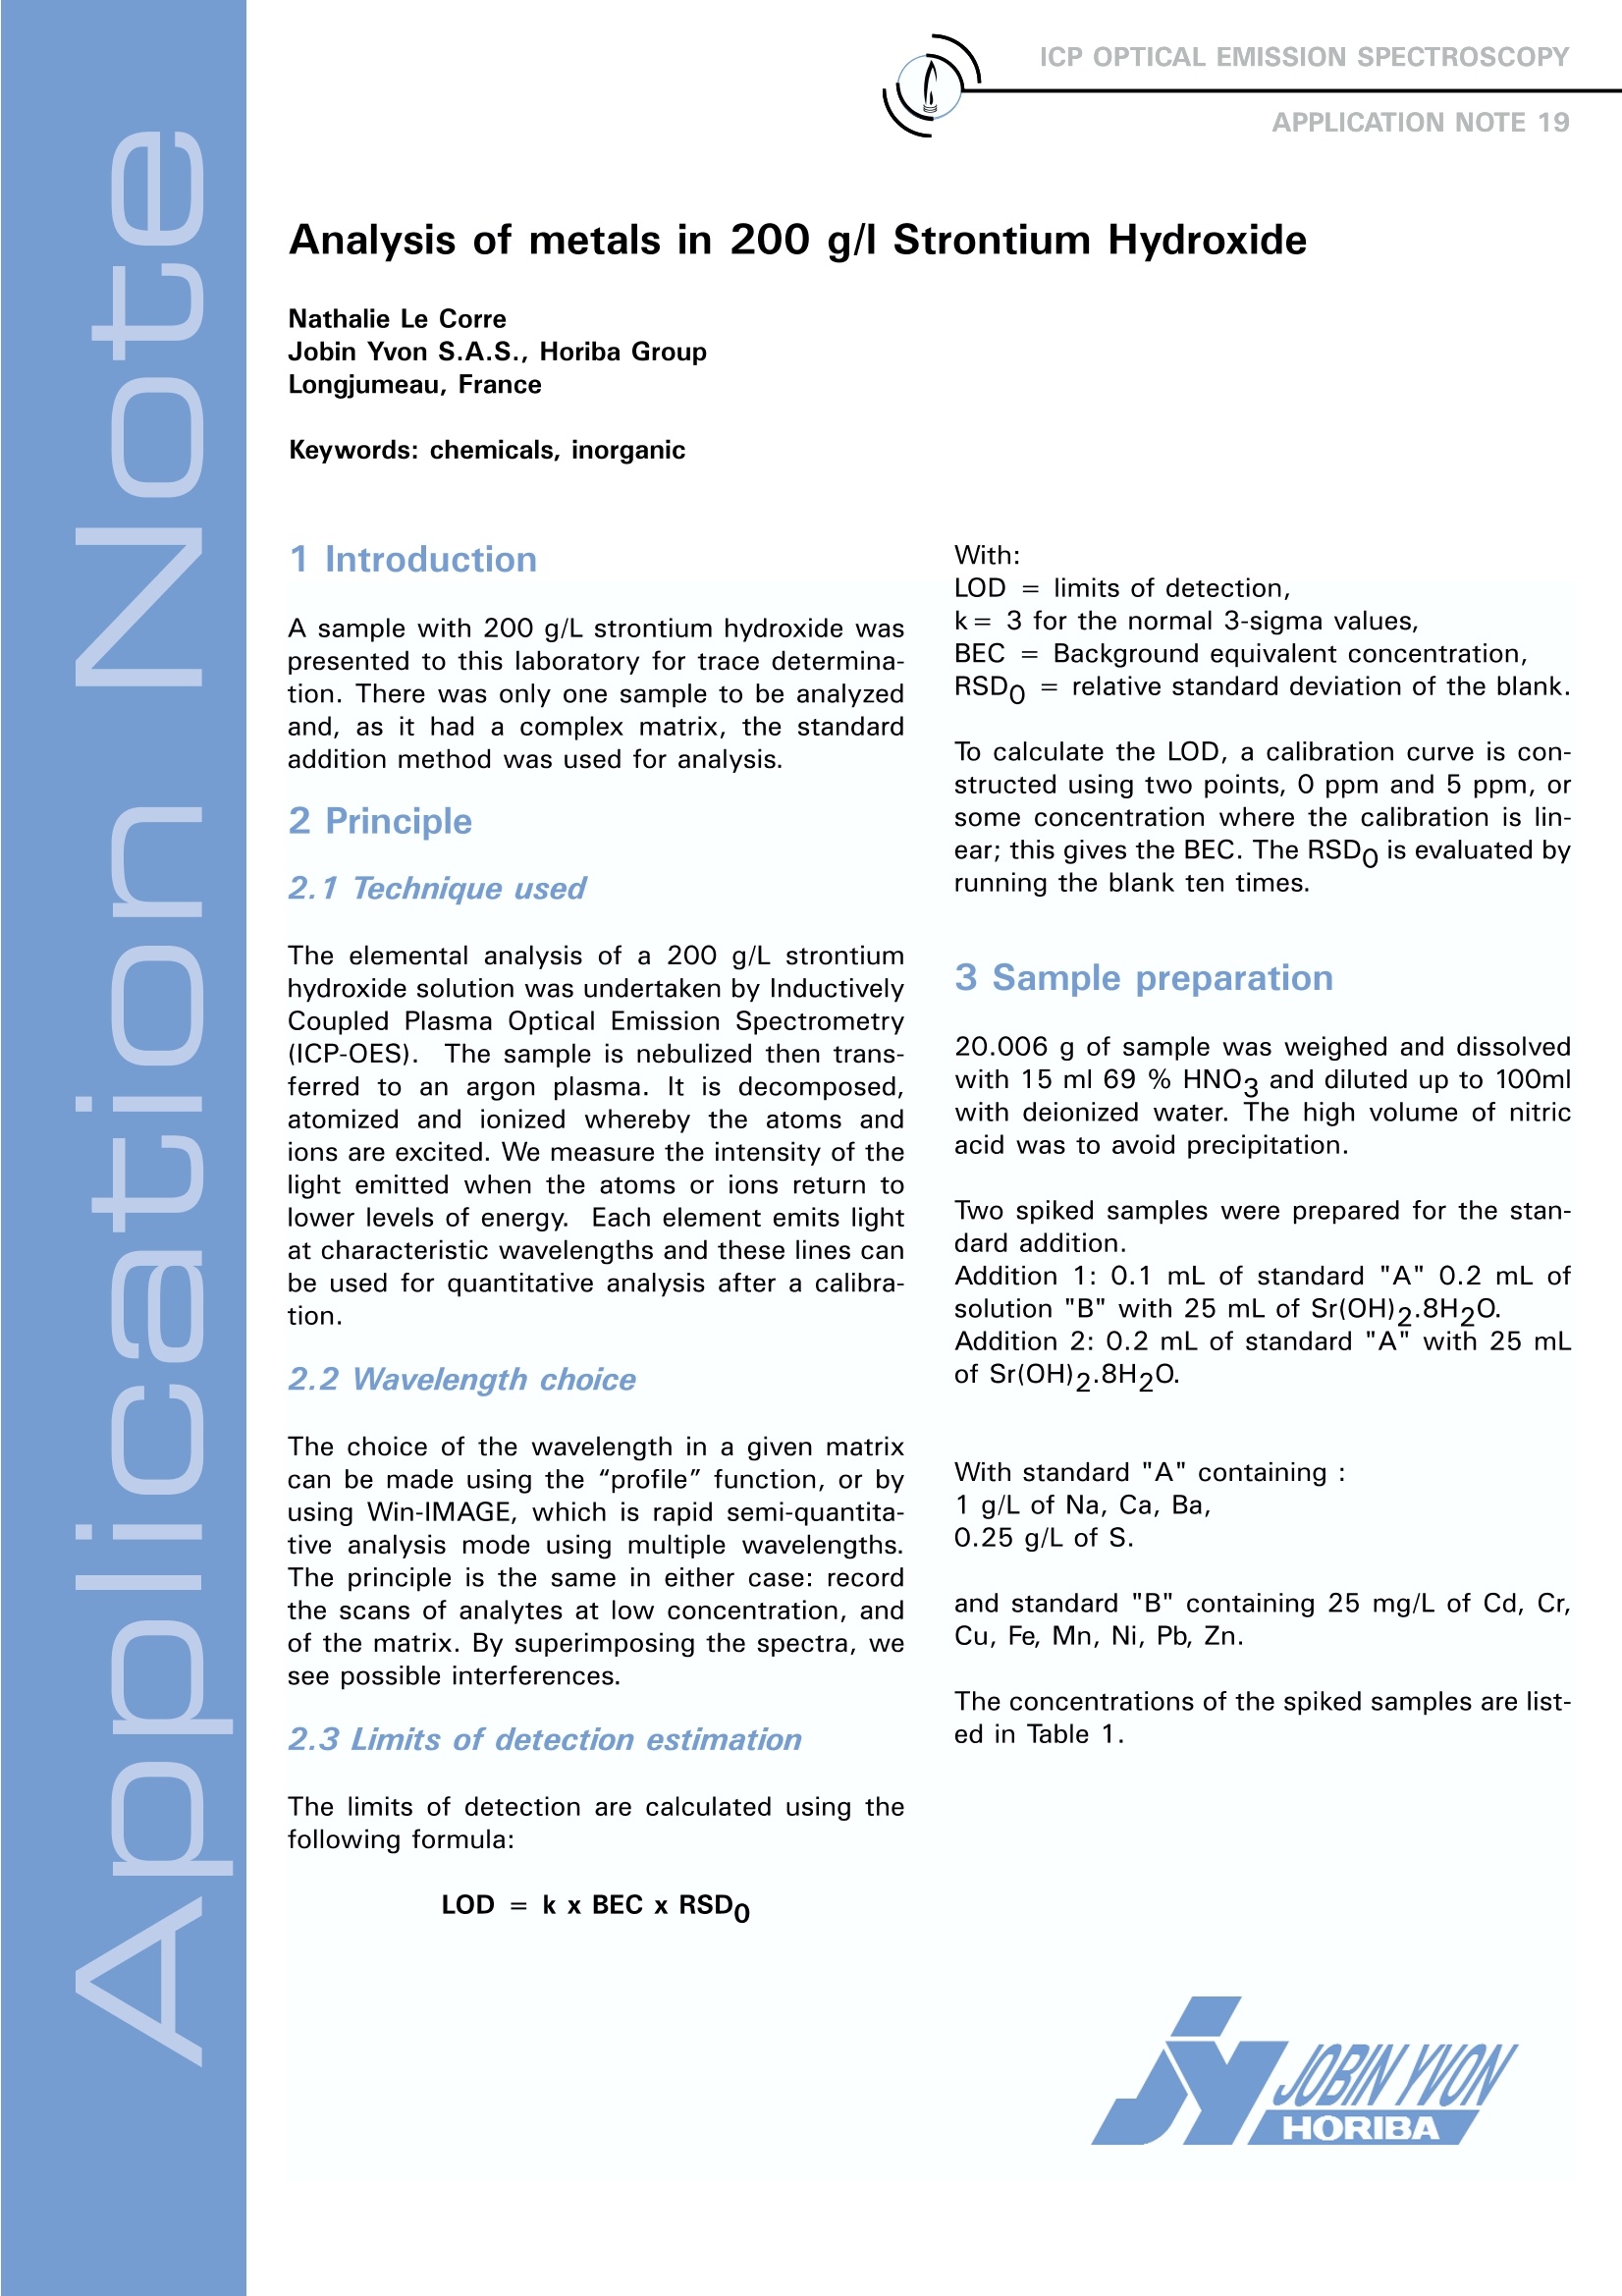
A sample with 200 g/L strontium hydroxide was presented to this laboratory for trace determination.
There was only one sample to be analyzed and, as it had a complex matrix, the standard addition method was used for analysis.
方案详情

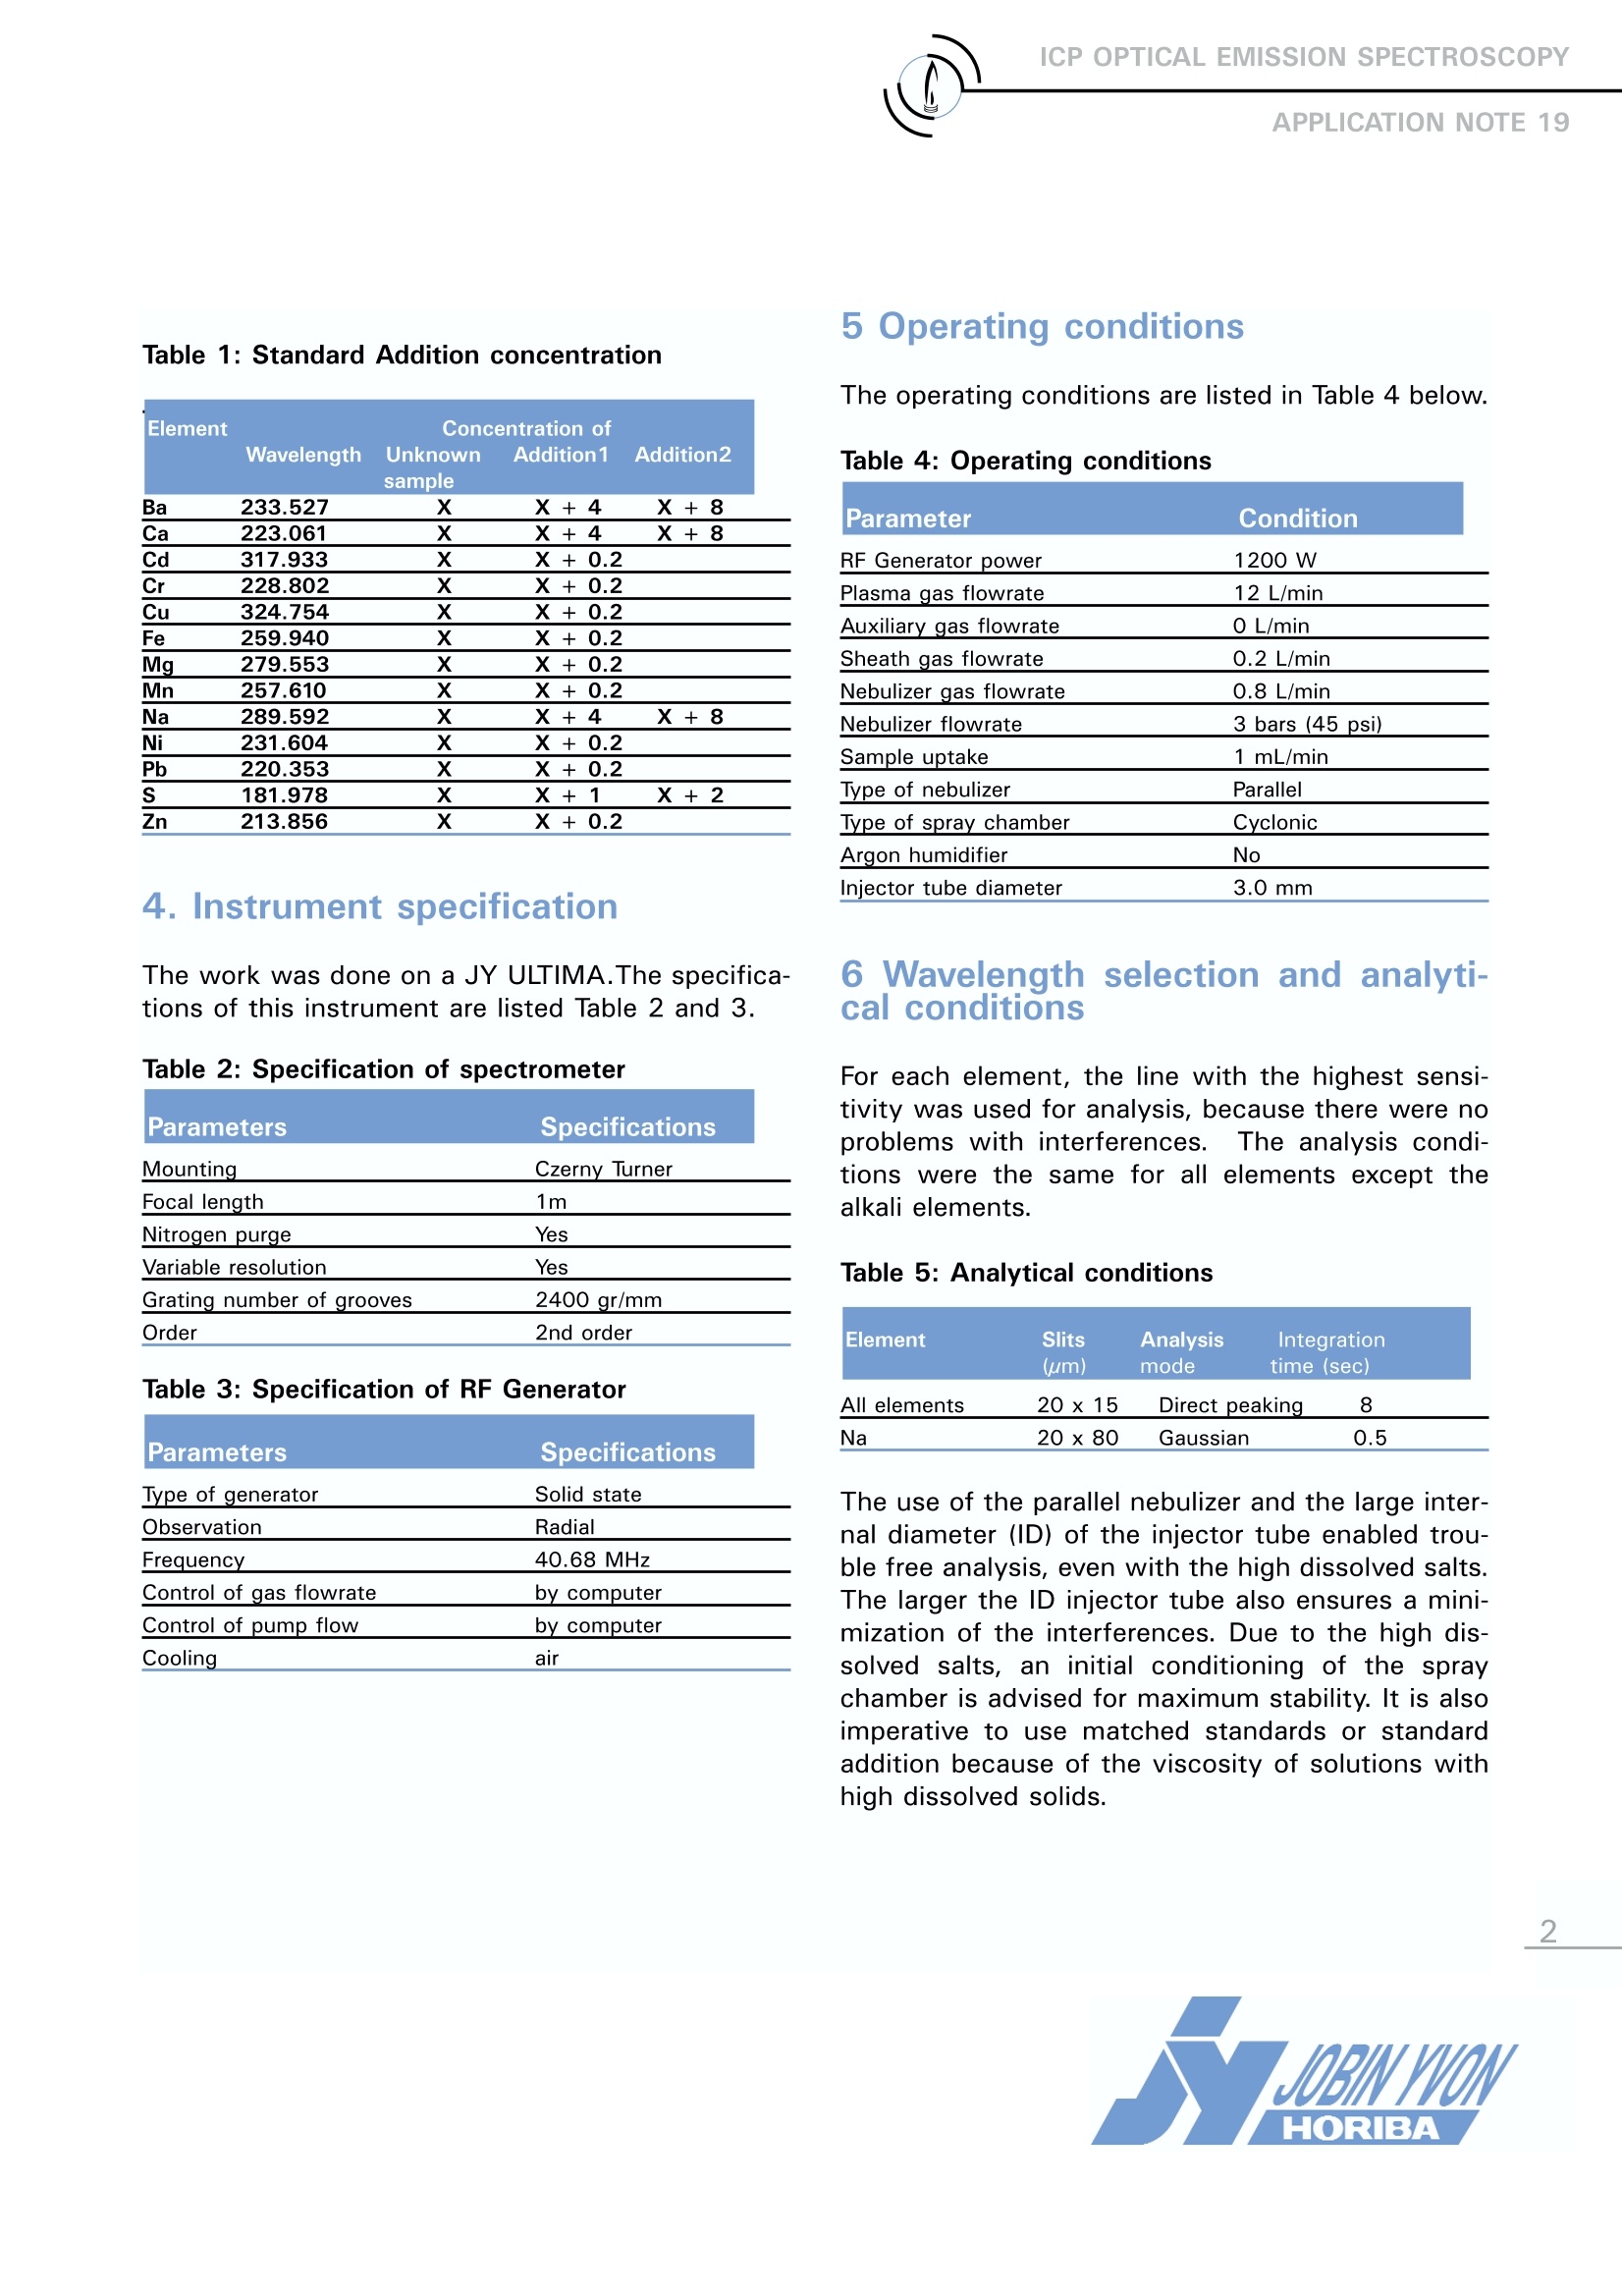
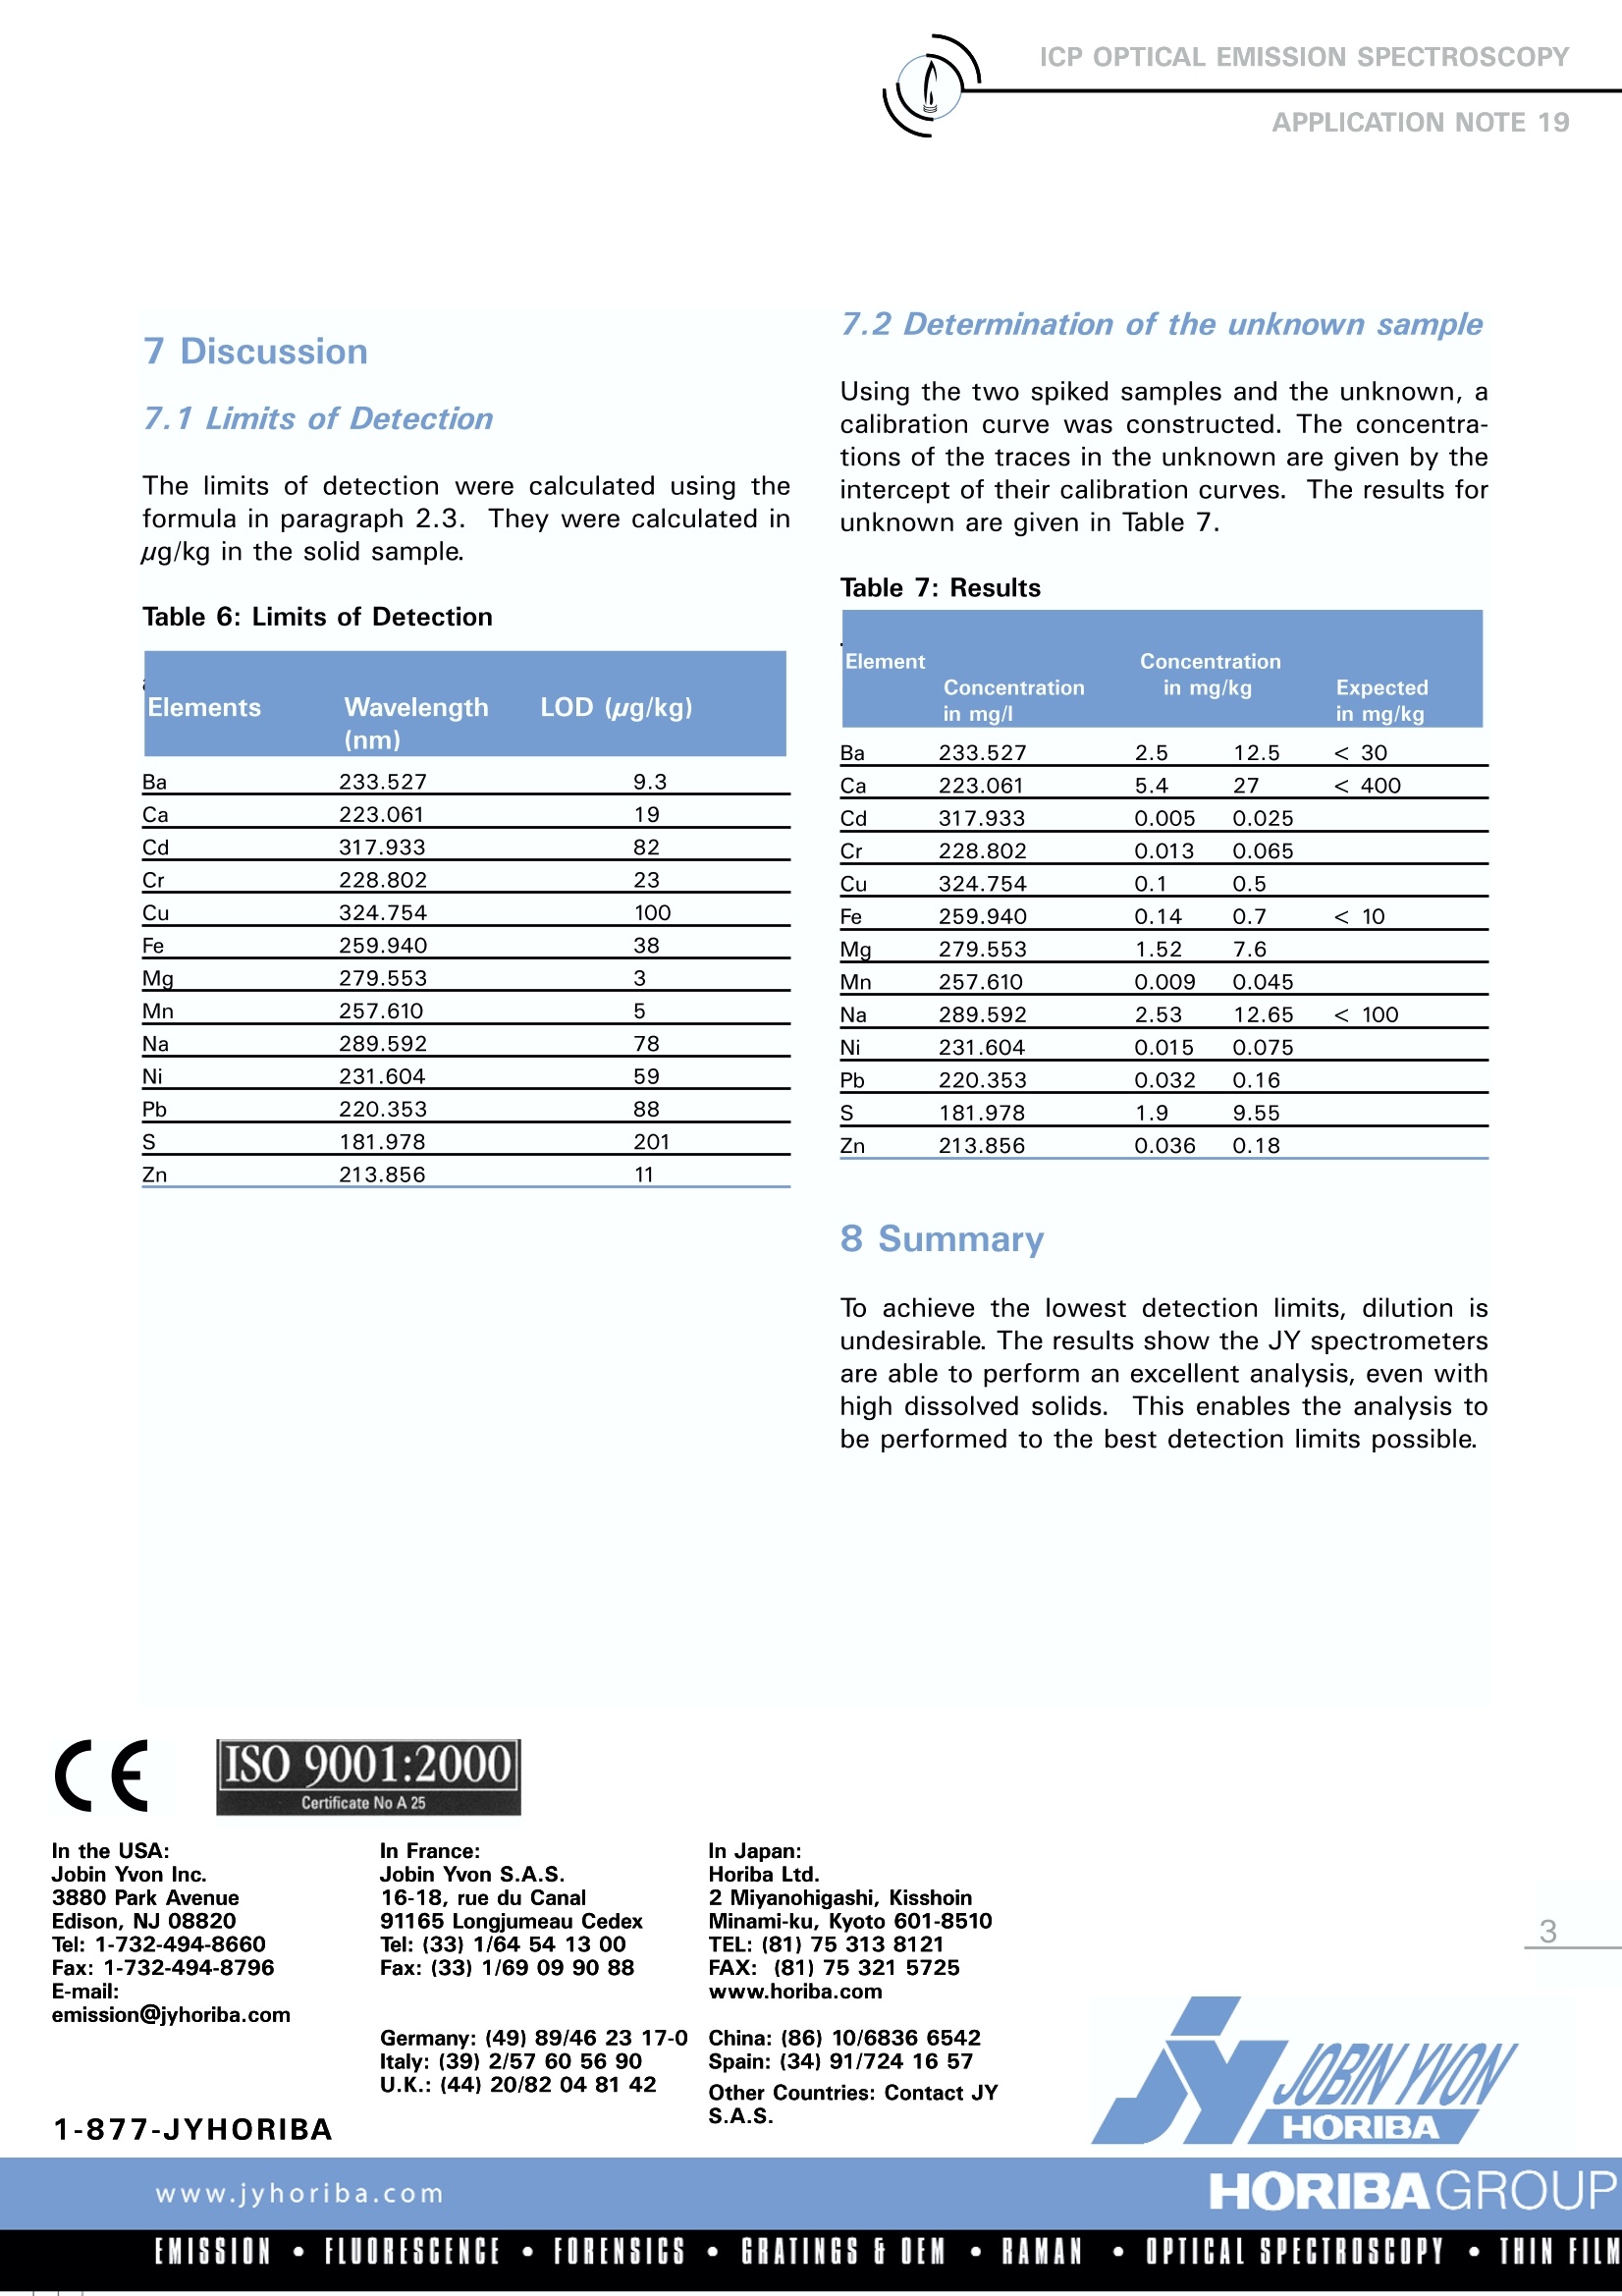
ICP OPTICAL EMISSION SPECTROSCOPYAPPLICATION NOTE 19 Analysis of metals in 200 g/l Strontium Hydroxide Nathalie Le Corre Jobin Yvon S.A.S., Horiba GroupLongjumeau, France Keywords: chemicals, inorganic A sample with 200 g/L strontium hydroxide waspresented to this laboratory for trace determina-tion. There was only one sample to be analyzedand, as it had a complex matrix, the standardaddition method was used for analysis 2 Principle 2.1 Technique used The elemental analysis of a 200 g/L strontiumhydroxide solution was undertaken by InductivelyCoupled Plasma Optical Emission Spectrometry(ICP-OES)... The sample is nebulized then trans-ferred to an argon plasma. It is decomposed,atomized and ionized whereby the atoms andions are excited. We measure the intensity of thelight emitted when the atoms or ions return tolower levels of energy. Each element emits lightat characteristic wavelengths and these lines canbe used for quantitative analysis after a calibra-tion. 2.2 Wavelength choice The choice of the wavelength in a given matrixcan be made using the “profile” function, or byusing Win-IMAGE, which is rapid semi-quantita-tive analysis mode using multiple wavelengths.The principle is the same in either case: recordthe scans of analytes at low concentration, andof the matrix. By superimposing the spectra, wesee possible interferences. 2.3 Limits of detection estimation The limits of detection are calculated using thefollowing formula: LOD= k x BEC x RSD With: LOD = limits of detection, k= 3 for the normal 3-sigma values, BEC = Background equivalent concentration, RSDo= relative standard deviation of the blank. To calculate the LOD, a calibration curve is con-structed using two points, 0 ppm and 5 ppm, orsome concentration where the calibration is lin-ear; this gives the BEC. The RSDo is evaluated byrunning the blank ten times. 3 Sample preparation 20.006 g of sample was weighed and dissolvedwith 15 ml 69 % HNO3 and diluted up to 100mlwith deionized water. The high volume of nitricacid was to avoid precipitation. Two spiked samples were prepared for the stan- dard addition.Addition 1: 0.1 mL of standard "A" 0.2 mL ofsolution "B" with 25 mL of Sr(OH)2.8H2O.Addition 2: 0.2 mL of standard "A" with 25 mLof Sr(OH)2.8H20. With standard "A" containing: 1 g/L of Na, Ca, Ba, 0.25 g/L of S. and standard "B" containing 25 mg/L of Cd, Cr,Cu, Fe, Mn, Ni, Pb, Zn. The concentrations of the spiked samples are list-ed in Table 1 Table 1: Standard Addition concentration Element Concentration of Wavelength Unknown Addition1 Addition2 sample Ba 233.527 X X+4 X+8 Ca 223.061 X X + 4 X+8 Cd 317.933 X X+0.2 Cr 228.802 X X+0.2 Cu 324.754 X X+0.2 Fe 259.940 X X+0.2 Mg 279.553 X+0.2 Mn 257.610 X X+0.2 Na 289.592 X X+4 X+8 Ni 231.604 X X+0.2 Pb 220.353 X X+0.2 S 181.978 X X+1 X+ 2 Zn 213.856 X X+0.2 4. Instrument specification The work was done on a JY ULTIMA.The specifica-tions of this instrument are listed Table 2 and 3. Table 2: Specification of spectrometer Parameters Specifications Mounting Czerny Turner Focal length 1m Nitrogen purge Yes Variable resolution Yes Gratingnumber of grooves 2400 gr/mm Table 3: Specification of RF Generator Parameters Specifications Type of generator Solid state Observation Radial Frequency 40.68 MHz Control of gas flowrate by computer Control of pump flow by computer Cooling air 5 Operating conditions The operating conditions are listed in Table 4 below. Table 4: Operating conditions Parameter Condition RF Generator power 1200 W Plasma gas flowrate 12 L/min Auxiliary gas flowrate O L/min Sheath gas flowrate 0.2 L/min Nebulizer gas flowrate 0.8 L/min Nebulizer flowrate 3 bars (45 psi) Sample uptake 1 mL/min Type of nebulizer Parallel Type of spray chamber Cyclonic Argon humidifier No Injector tube diameter 3.0 mm 61Wavelength selection and analyti-cal conditions For each element, the line with the highest sensi-tivity was used for analysis, because there were noproblems with interferences. The analysis condi-tions were the same for all elements except thealkali elements. Table 5: Analytical conditions Element Slits Analysis Integration (um) mode time (sec) All elements 20 x 15 Direct peaking 8 Na 20x80 Gaussian 0.5 The use of the parallel nebulizer and the large inter-nal diameter (ID) of the injector tube enabled trou-ble free analysis, even with the high dissolved salts.The larger the ID injector tube also ensures a mini-mization of the interferences. Due to the high dis-solved salts, an initial conditioning of the spraychamber is advised for maximum stability. It is alsoimperative to use matched standards or standardaddition because of the viscosity of solutions withhigh dissolved solids. 7.1 Limits of Detection The limits of detection were calculated using theformula in paragraph 2.3.. They were calculated inug/kg in the solid sample. Table 6: Limits of Detection Elements Wavelength LOD (ug/kg) (nm) Ba 233.527 9.3 Ca 223.061 19 Cd 317.933 82 Cr 228.802 23 Cu 324.754 100 Fe 259.940 38 Mg 279.553 3 Mn 257.610 5 Na 289.592 78 Ni 231.604 59 Pb 220.353 88 181.978 201 Zn 213.856 11 7.2 Determination of the unknown sample Using the two spiked samples and the unknown, acalibration curve was constructed. The concentra-tions of the traces in the unknown are given by theintercept of their calibration curves.The results forunknown are given in Table 7. Table 7: Results Element Concentration Concentration in mg/kg Expected in mg/l in mg/kg Ba 233.527 2.5 12.5 <30 Ca 223.061 5.4 27 <400 Cd 317.933 0.005 0.025 Cr 228.802 0.013 0.065 Cu 324.754 0.1 0.5 Fe 259.940 0.14 0.7 <10 Mg 279.553 1.52 7.6 Mn 257.610 0.009 0.045 Na 289.592 2.53 12.65 <100 Ni 231.604 0.015 0.075 Pb 220.353 0.032 0.16 S 181.978 1.9 9.55 Zn 213.856 0.036 0.18 To achieve the lowest detection limits, dilution isundesirable. The results show the JY spectrometersare able to perform an excellent analysis, even withhigh dissolved solids. This enables the analysis tobe performed to the best detection limits possible. In the USA: Jobin Yvon Inc. 3880 Park Avenue Edison, NJ 08820 Tel: 1-732-494-8660 Fax: 1-732-494-8796 E-mail: emission@jyhoriba.com MISSION·FLUORESCENCE·FORENSICS·GRATINGSGOEM·RAMAN·OPTICAL SPECTROSCOPY·THIN FILM
确定
还剩1页未读,是否继续阅读?

产品配置单

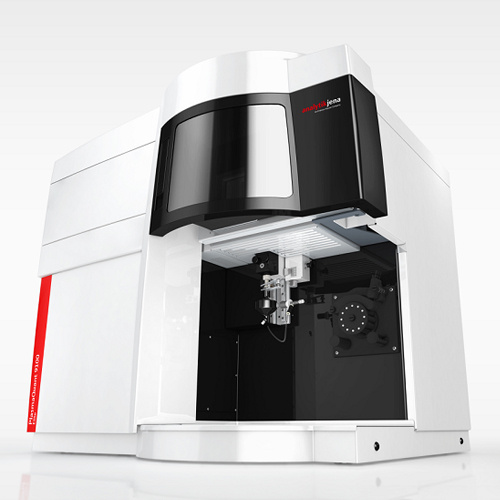
HORIBA(中国)为您提供《200g/L氢氧化锶溶液中金属元素的分析》,该方案主要用于其他中--检测,参考标准--,《200g/L氢氧化锶溶液中金属元素的分析》用到的仪器有HORIBA Ultima Expert高性能ICP光谱仪
推荐专场
相关方案
更多
该厂商其他方案
更多