


方案详情
文
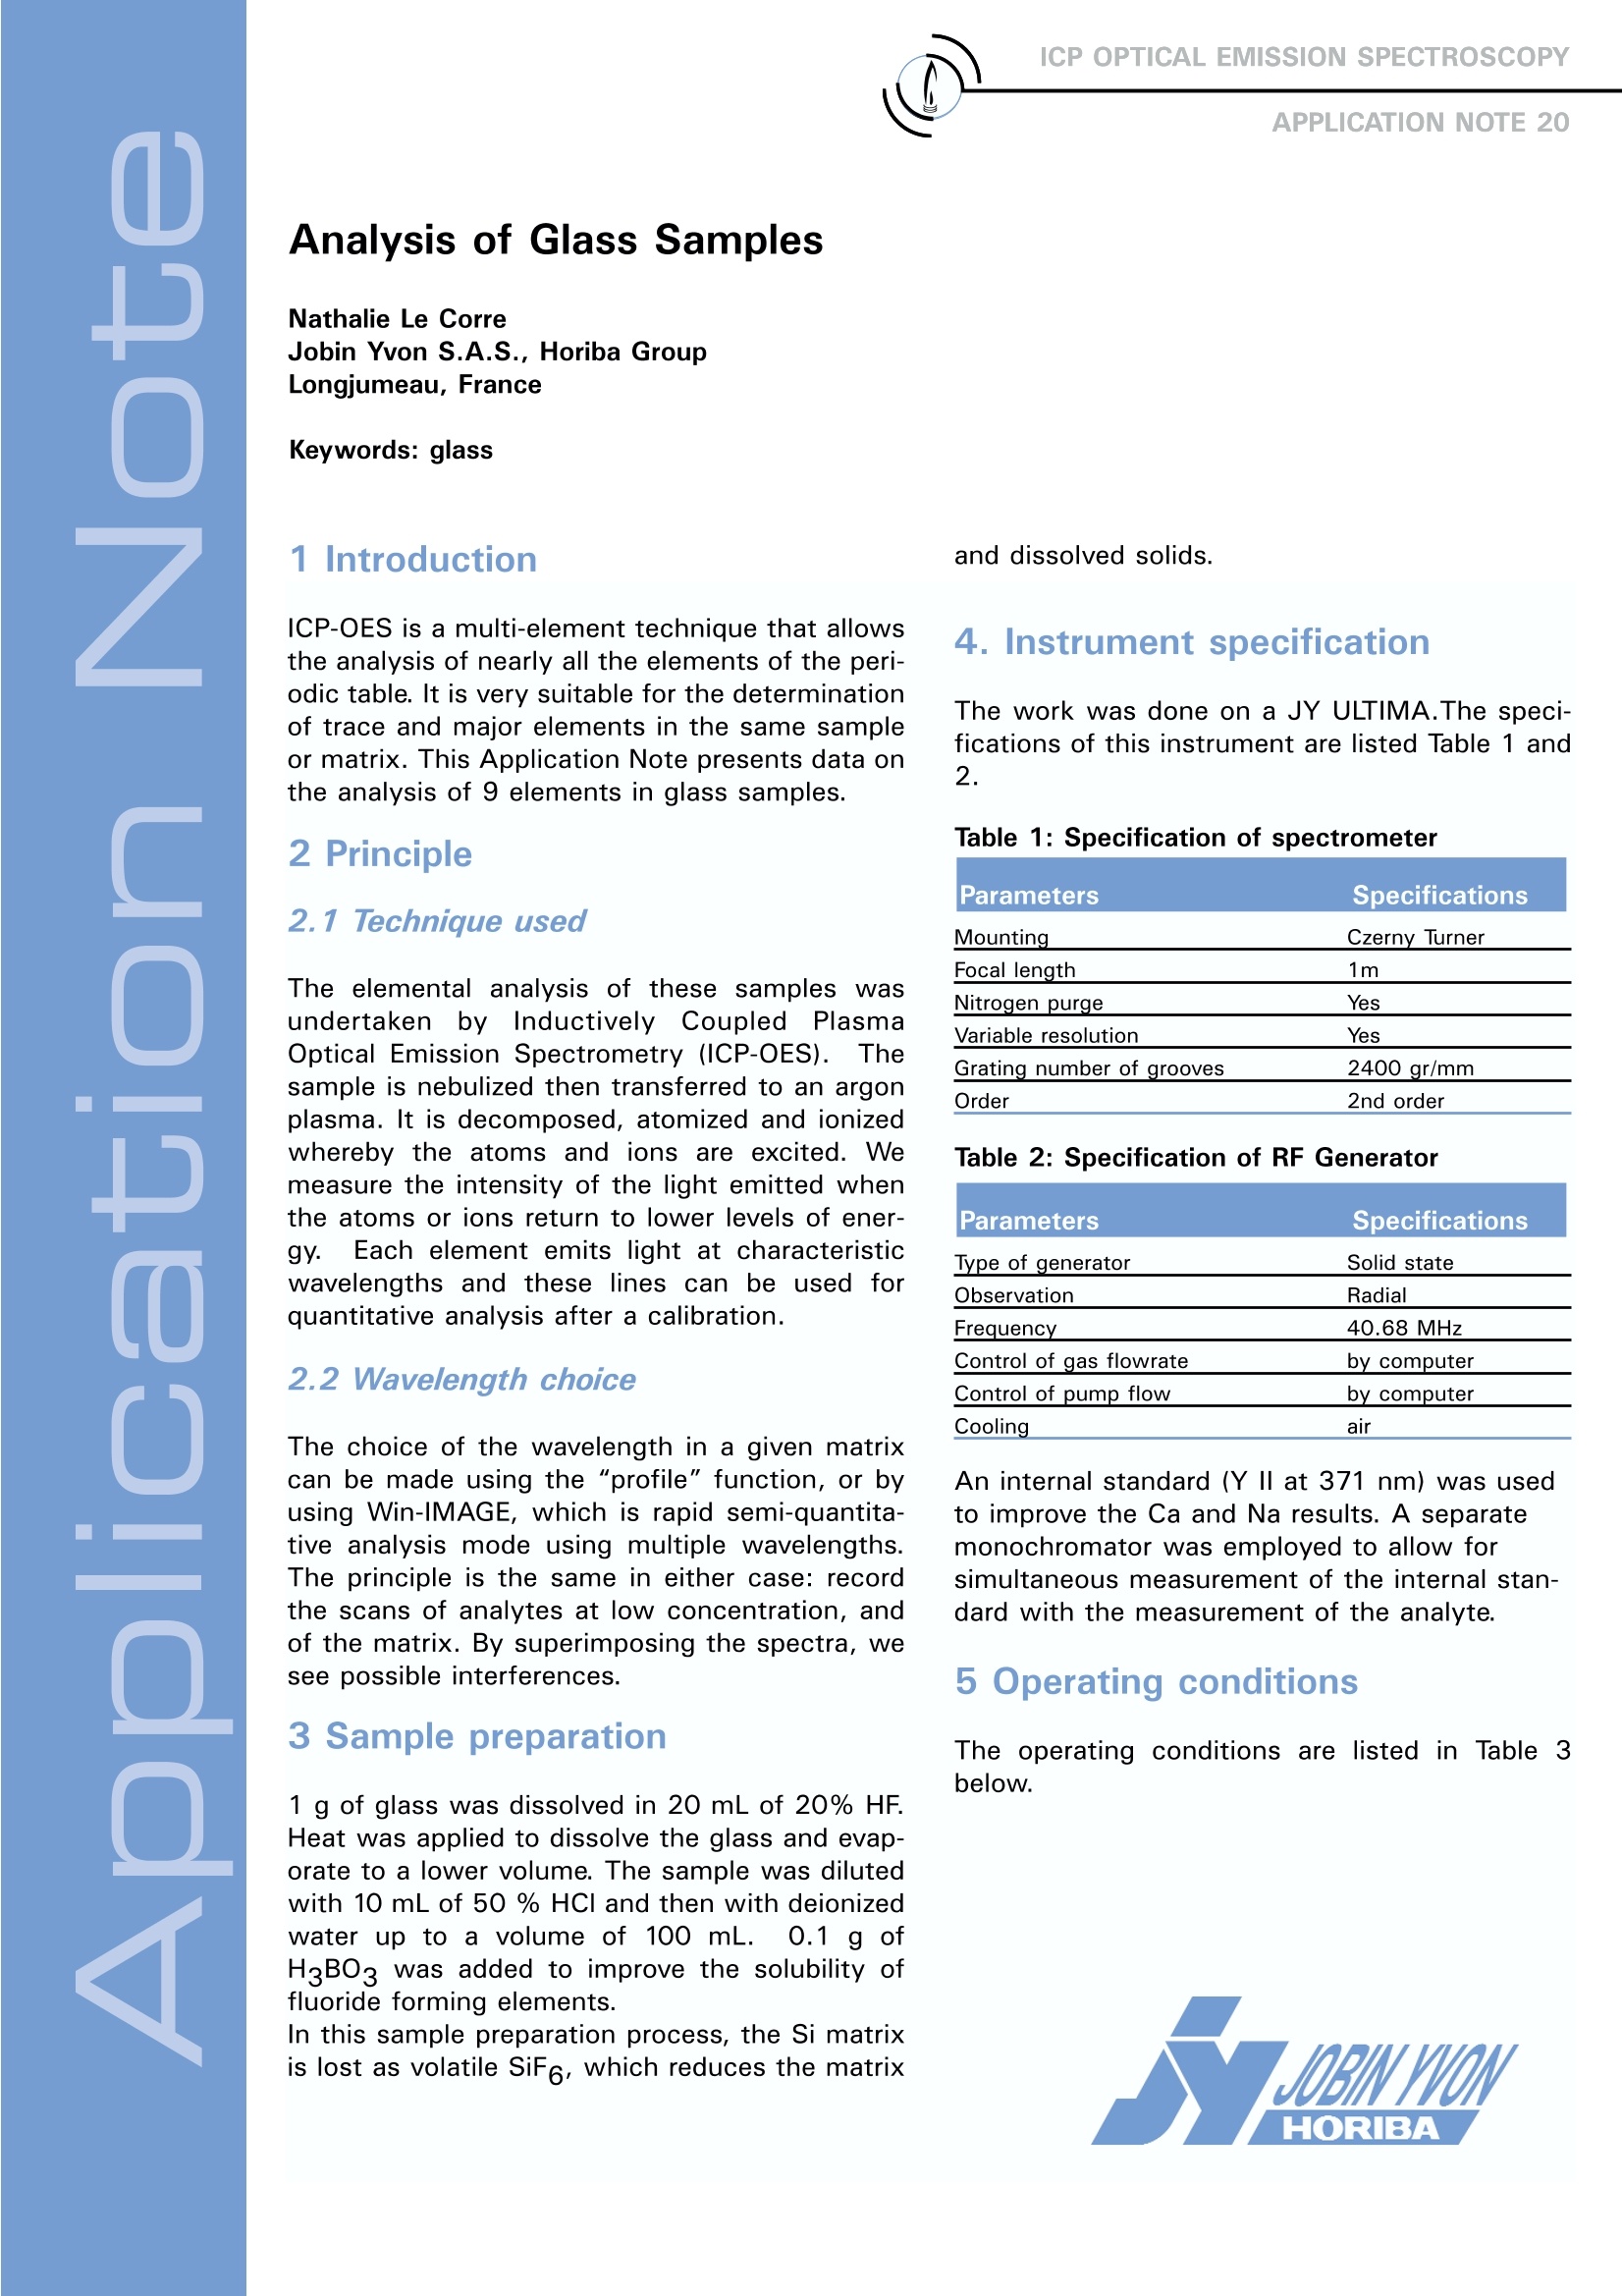
ICP-OES is a multi-element technique that allows the analysis of nearly all the elements of the periodic table. It is very suitable for the determination of trace and major elements in the same sample
or matrix. This Application Note presents data on the analysis of 9 elements in glass samples.
方案详情

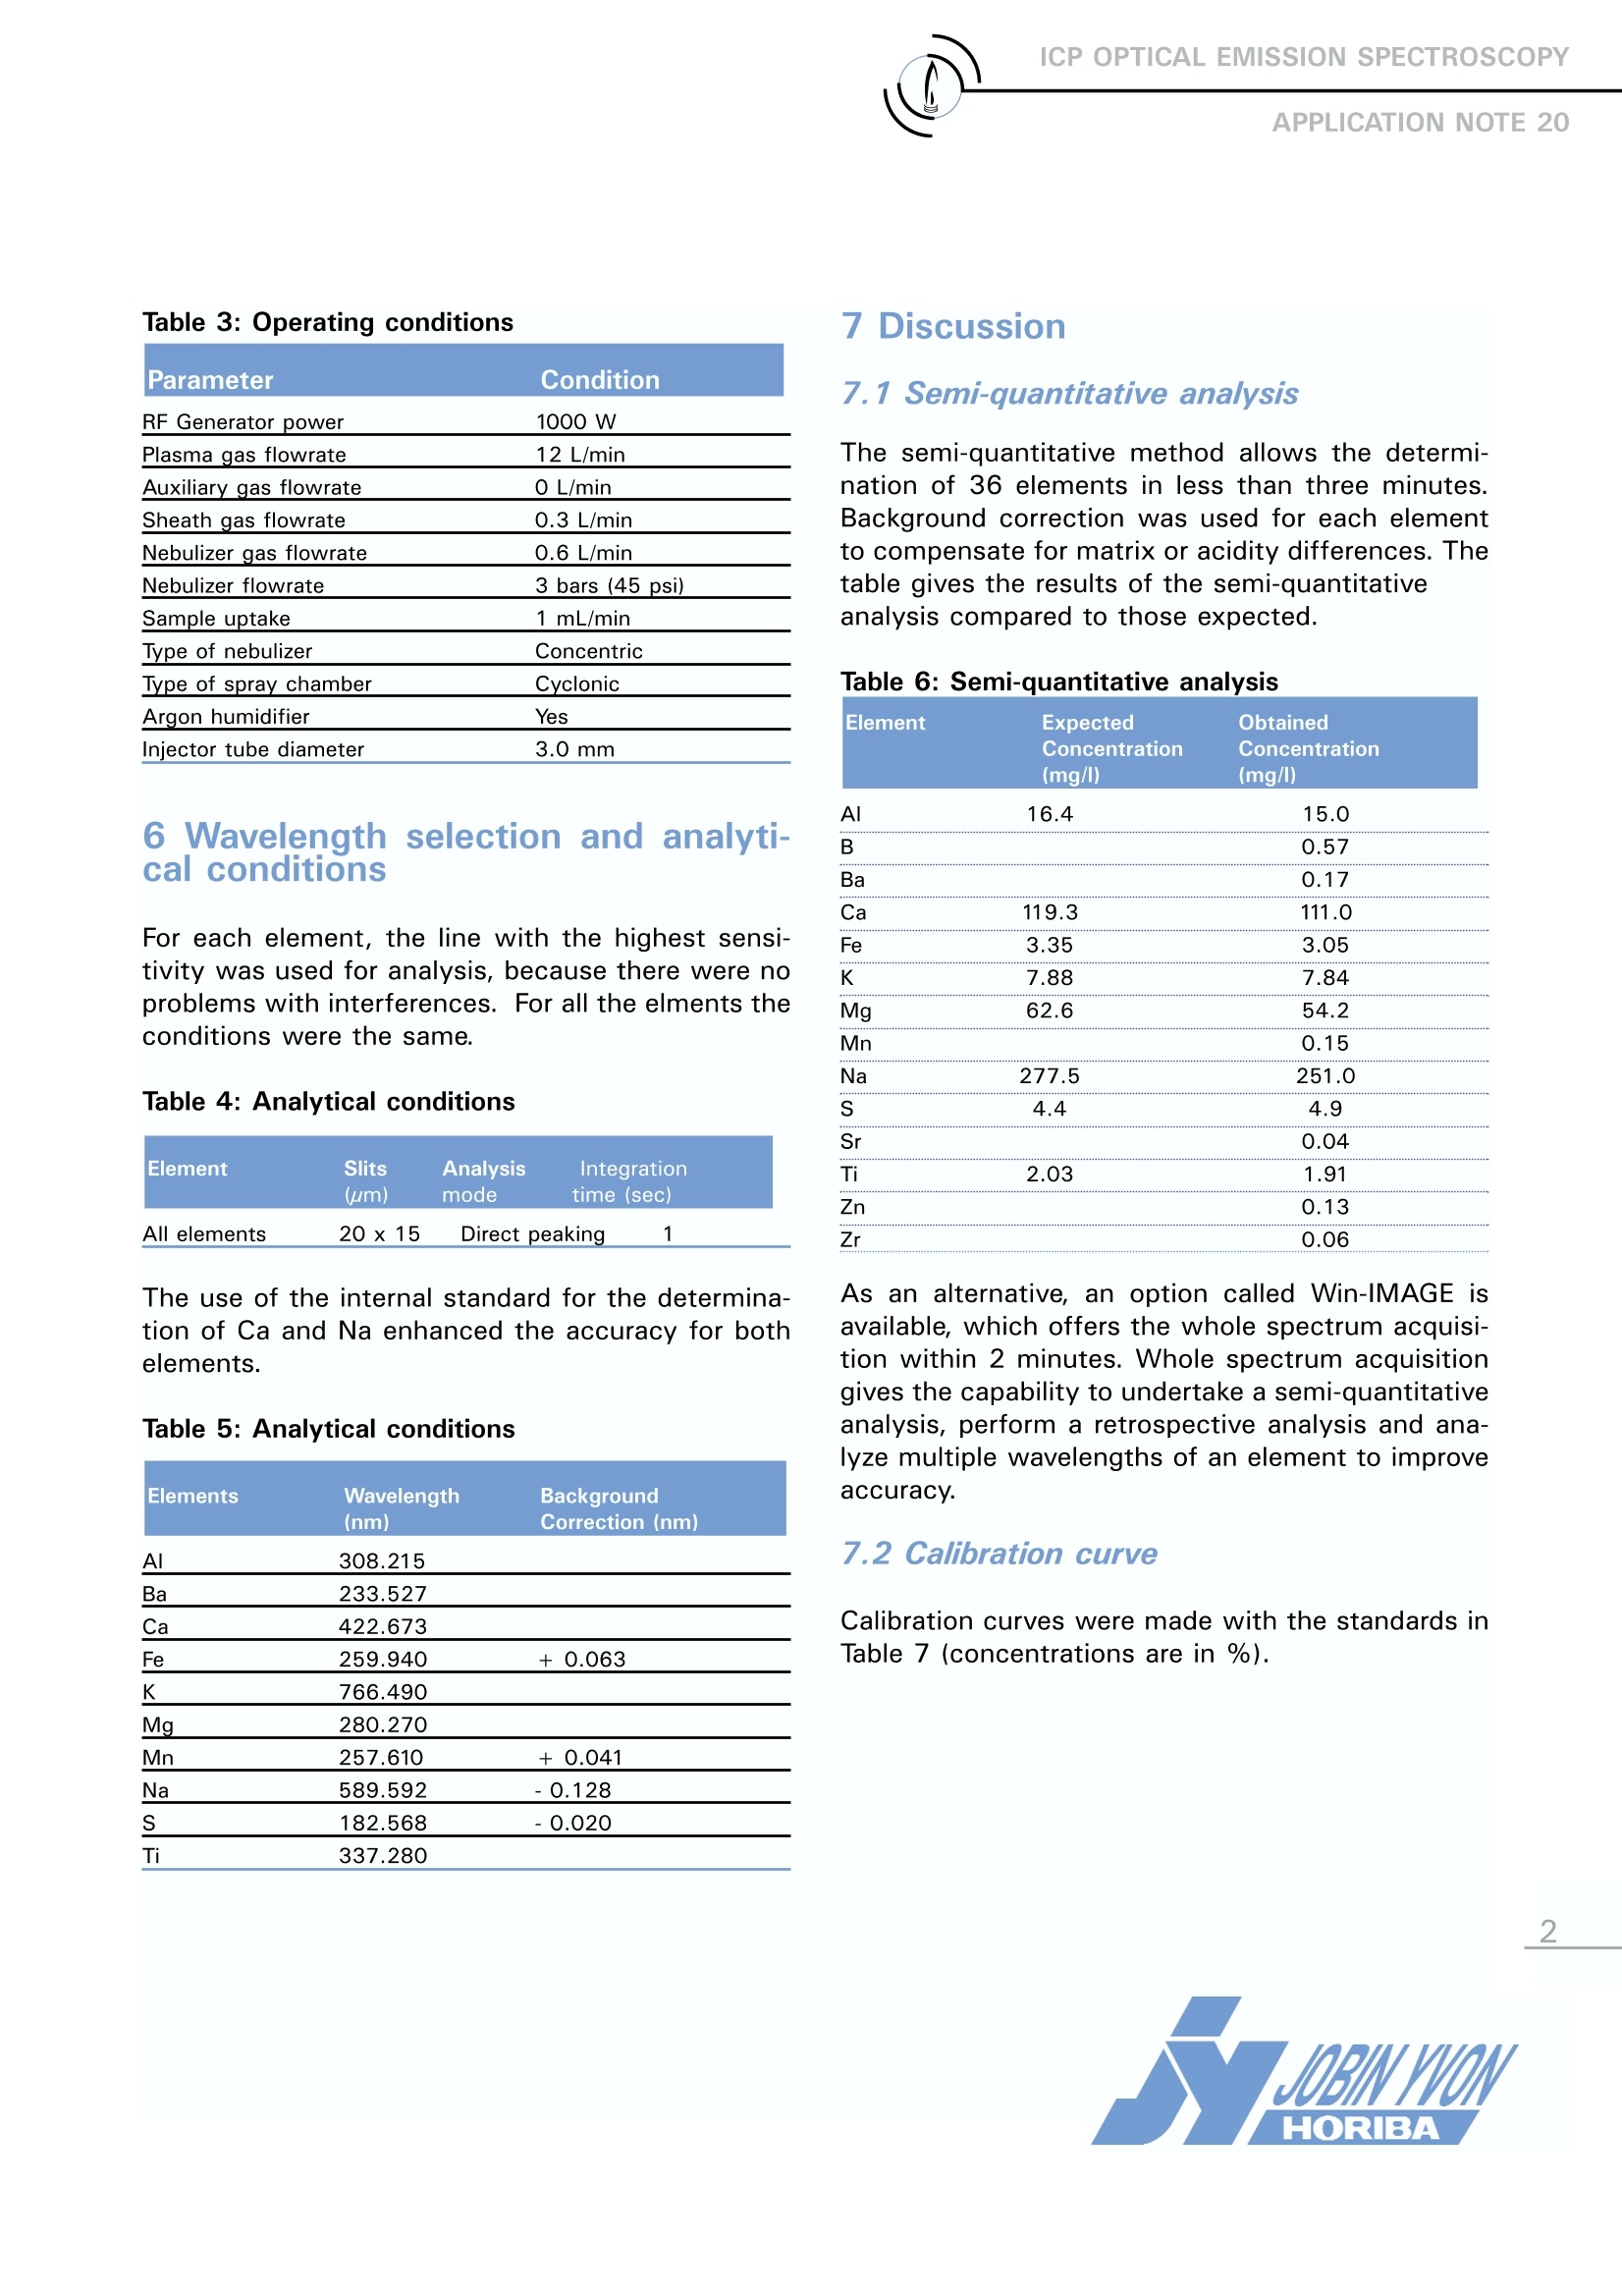
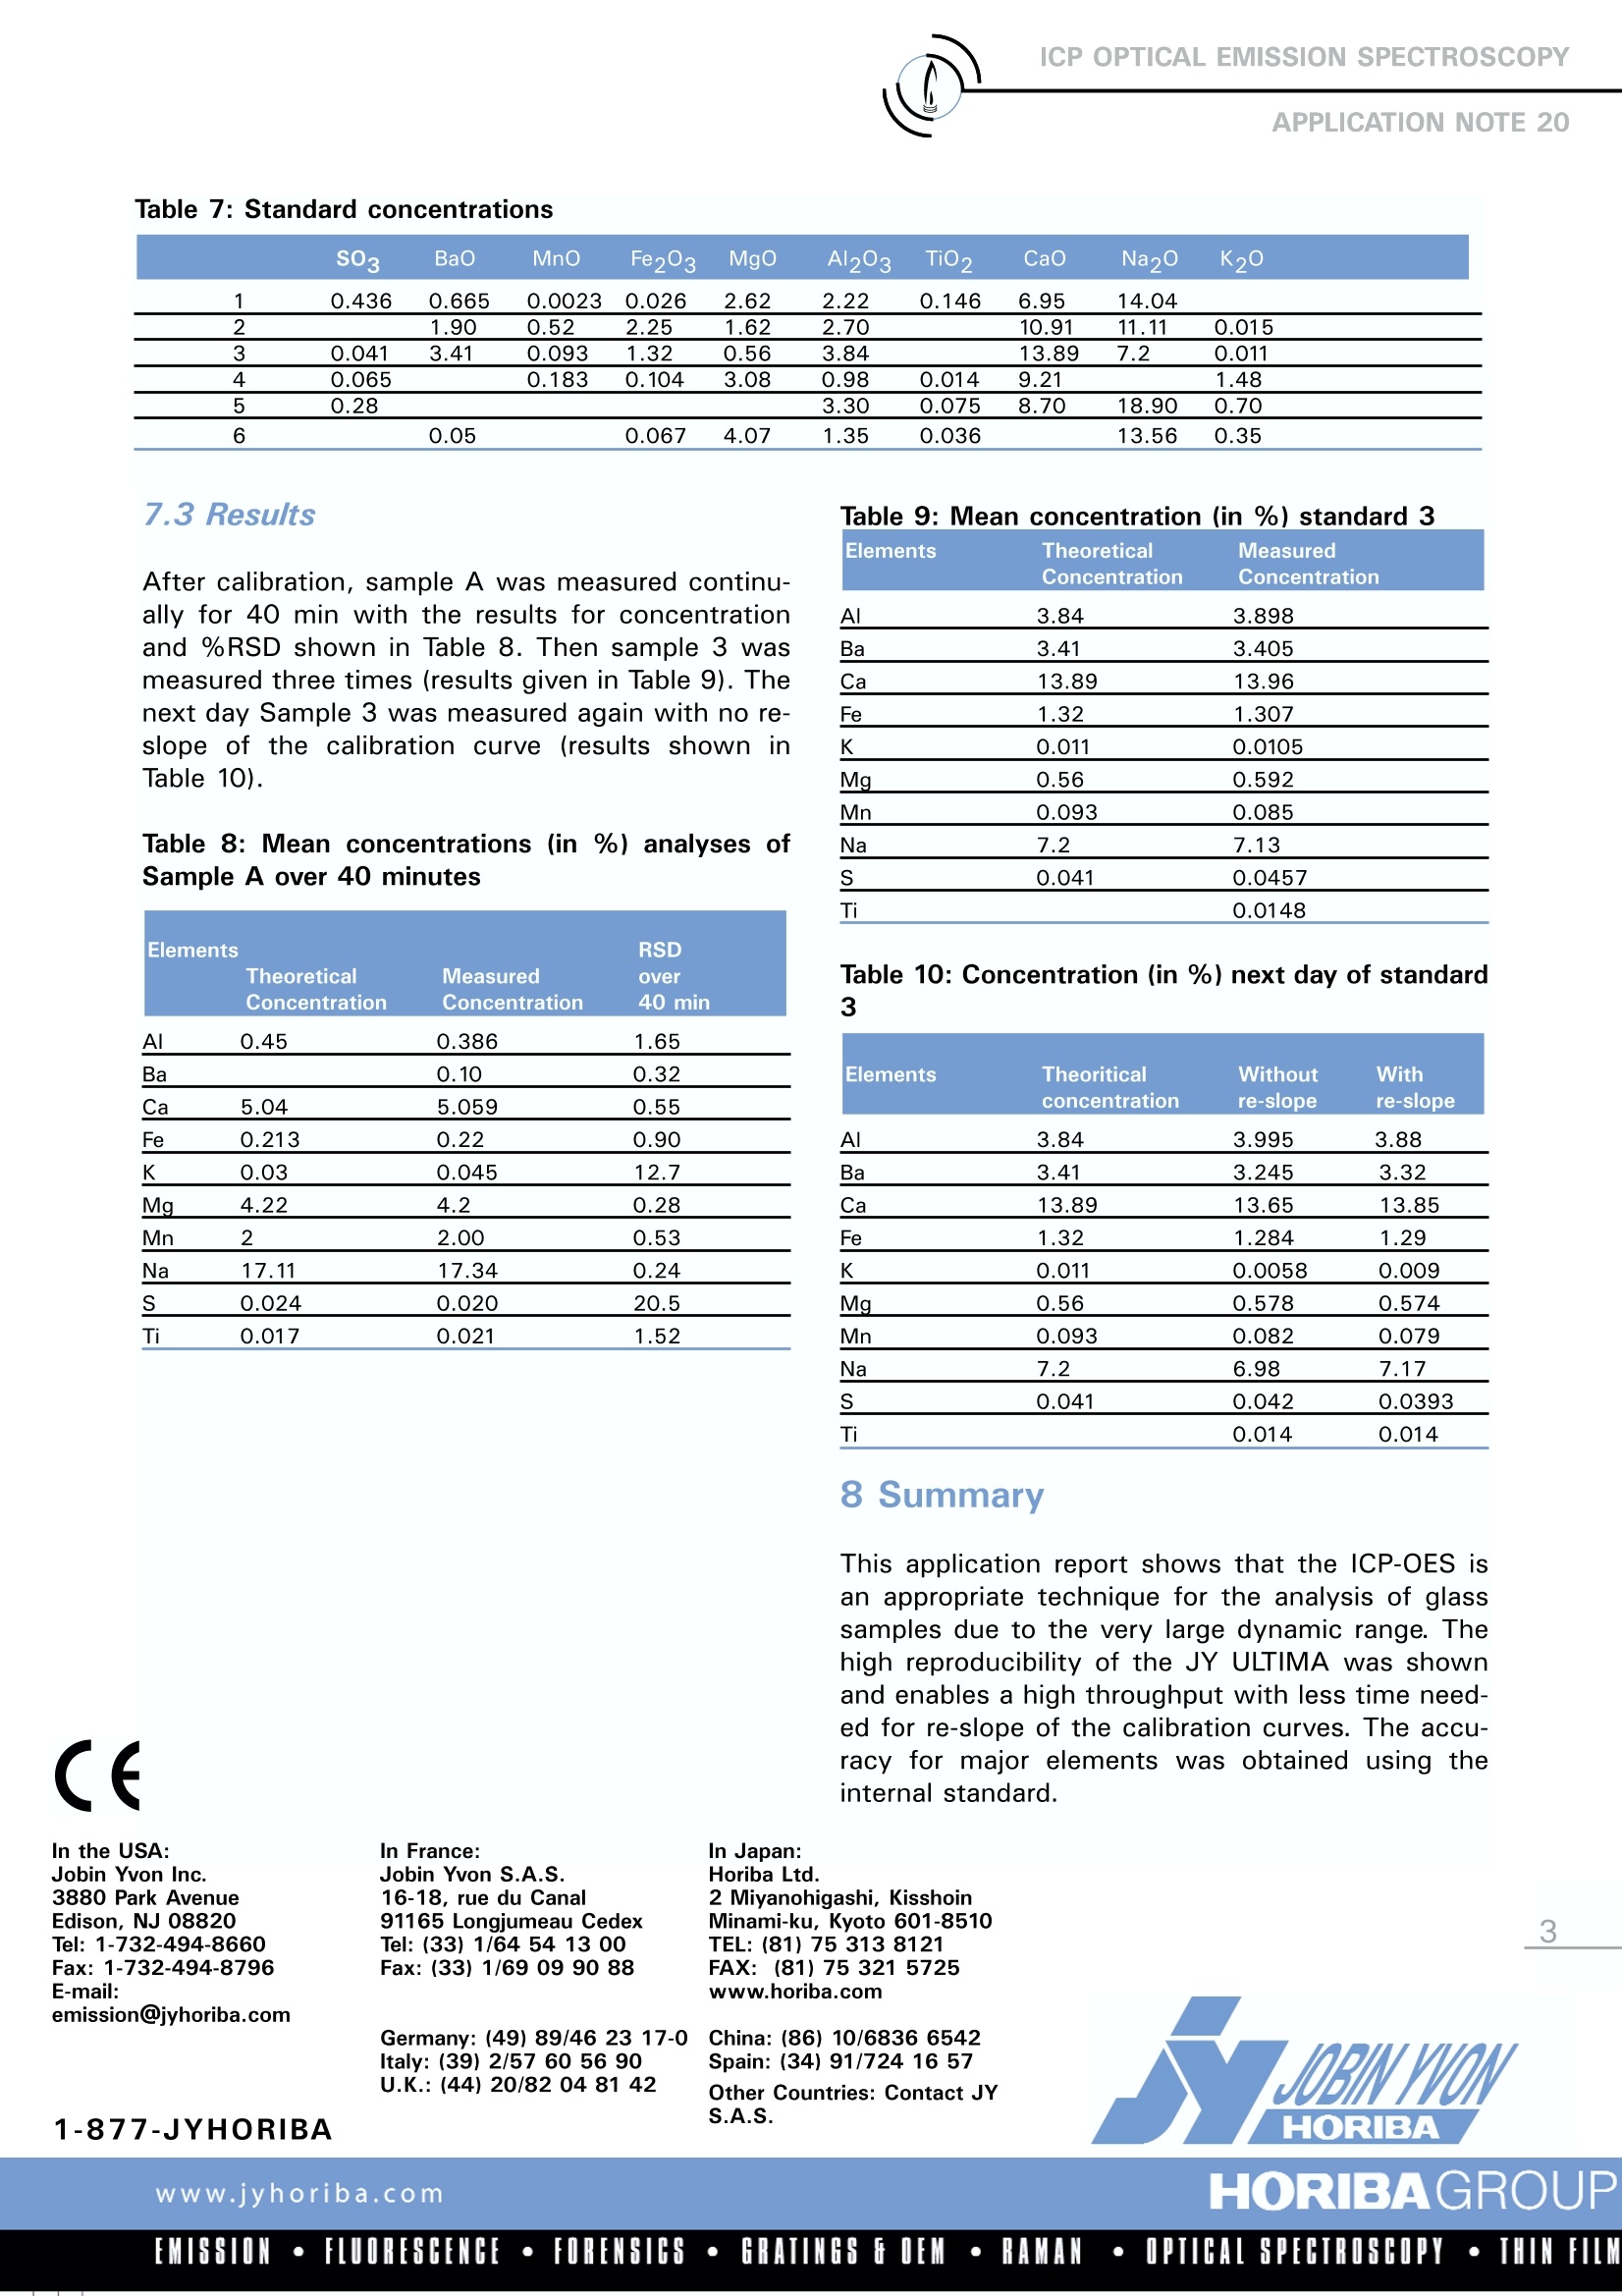
ICP OPTICAL EMISSION SPECTROSCOPYAPPLICATION NOTE 20 ICP-OES is a multi-element technique that allowsthe analysis of nearly all the elements of the peri-odic table. It is very suitable for the determinationof trace and major elements in the same sampleor matrix. This Application Note presents data onthe analysis of 9 elements in glass samples. 2 Principle .2.1 Technique used The elemental analysis of these samples wasundertaken by Inductively Coupled PlaOptical Emission Spectrometry (ICP-OES).TThesample is nebulized then transferred to an argonplasma. It is decomposed, atomized and ionizedwhereby the atoms and ions are excited. Wemeasure the intensity of the light emitted whenthe atoms or ions return to lower levels of ener-gy. Each element emits light at characteristicwavelengths and these lines can be used forquantitative analysis after a calibration. 2.2 Wavelength choice The choice of the wavelength in a given matrixcan be made using the “profile"function, or byusing Win-IMAGE, which is rapid semi-quantita-tive analysis mode using multiple wavelengths.The principle is the same in either case: recordthe scans of analytes at low concentration, andof the matrix. By superimposing the spectra, wesee possible interferences 3 Sample preparation 1 g of glass was dissolved in 20 mL of 20% HF.Heat was applied to dissolve the glass and evap-orate to a lower volume. The sample was dilutedwith 10 mL of 50 % HCl and then with deionizedwater up to a volume of 100 mL. 0.1 g ofH3BO3 was added to improve the solubility offluoride forming elements. In this sample preparation process, the Si matrixis lost as volatile SiFe, which reduces the matrix and dissolved solids. 4. Instrument specification The work was done on a JY ULTIMA.The speci-fications of this instrument are listed Table 1 and2. Table 1: Specification of spectrometer Parameters Specifications Mounting Czerny Turner Focal length 1m Nitrogen purge Yes Variable resolution Yes Grating number of grooves 2400 gr/mm Table 2: Specification of RF Generator Parameters Specifications Type of generator Solid state Observation Radial Frequency 40.68 MHz Control of gas flowrate by computer Control of pump flow by computer Cooling air An internal standard (Y ll at 371 nm) was usedto improve the Ca and Na results. A separatemonochromator was employed to allow forsimultaneous measurement of the internal stan-dard with the measurement of the analyte. 5 Operating conditions The operating conditions are listed in Table 3below. Table 3: Operating conditions Parameter Condition RF Generator power 1000 W Plasma gas flowrate 12 L/min Auxiliary gas flowrate 0 L/min Sheath gas flowrate 0.3 L/min Nebulizer gas flowrate 0.6 L/min Nebulizer flowrate 3 bars (45 psi) Sample uptake 1 mL/min Type of nebulizer Concentric Type of spray chamber Cyclonic Argon humidifier Yes Injector tube diameter 3.0 mm 6 Wavelength selection and analyti-cal conditions For each element, the line with the highest sensi-tivity was used for analysis, because there were noproblems with interferences. For all the elments theconditions were the same. Table 4: Analytical conditions Element Slits Analysis Integration (um) mode time (sec) All elements 20x15 Direct peaking 1 The use of the internal standard for the determina-tion of Ca and Na enhanced the accuracy for bothelements. Table 5: Analytical conditions Elements Wavelength Background (nm) Correction (nm) Al 308.215 Ba 233.527 Ca 422.673 Fe 259.940 +0.063 K 766.490 Mg 280.270 Mn 257.610 +0.041 Na 589.592 -0.128 182.568 -0.020 Ti 337.280 7 Discussion 7.1 Semi-quantitative analysis The semi-quantitative method allows the determi-nation of 36 elements in less than three minutes.Background correction was used for each elementto compensate for matrix or acidity differences. Thetable gives the results of the semi-quantitativeanalysis compared to those expected. Table 6: Semi-quantitative analysis Element Expected Obtained Concentration Concentration (mg/) (mg/) Al 16.4 15.0 B 0.57 Ba 0.17 Ca 119.3 111.0 Fe 3.35 3.05 K 7.88 7.84 Mg 62.6 54.2 Mn 0.15 Na 277.5 251.0 S 4.4 4.9 Sr 0.04 Ti 2.03 1.91 Zn 0.13 As an alternative, an option called Win-IMAGE isavailable, which offers the whole spectrum acquisi-tion within 2 minutes. Whole spectrum acquisitiongives the capability to undertake a semi-quantitativeanalysis, perform a retrospective analysis and ana-lyze multiple wavelengths of an element to improveaccuracy. 7.2 Calibration curve Calibration curves were made with the standards inTable 7 (concentrations are in%). SO3 BaO MnO Fe203 MgO Al203 TiO2 CaO Na20 K20 1 0.436 0.665 0.0023 0.026 2.62 2.22 0.146 6.95 14.04 2 1.90 0.52 2.25 1.62 2.70 10.91 11.11 0.015 3 0.041 3.41 0.093 1.32 0.56 3.84 13.89 7.2 0.011 4 0.065 0.183 0.104 3.08 0.98 0.014 9.21 1.48 5 0.28 3.30 0.075 8.70 18.90 0.70 6 0.05 0.067 4.07 1.35 0.036 13.56 0.35 7.3 Results After calibration, sample A was measured continu-ally for 40 min with the results for concentrationand %RSD shown in Table 8. Then sample 3 wasmeasured three times (results given in Table 9). Thenext day Sample 3 was measured again with no re-slope of the calibration curve (results shown inTable 10). Table 8: Mean concentrations (in %) analyses ofSample A over 40 minutes RSD Elements Theoretical Measured over Concentration Concentration 40 min Al 0.45 0.386 1.65 Ba 0.10 0.32 Ca 5.04 5.059 0.55 Fe 0.213 0.22 0.90 K 0.03 0.045 12.7 Mg 4.22 4.2 0.28 Mn 2 2.00 0.53 Na 17.11 17.34 0.24 S 0.024 0.020 20.5 Ti 0.017 0.021 1.52 Table 9: Mean concentration (in%) standard 3 Elements Theoretical Measured Concentration Concentration Al 3.84 3.898 Ba 3.41 3.405 Ca 13.89 13.96 Fe 1.32 1.307 K 0.011 0.0105 Mg 0.56 0.592 Mn 0.093 0.085 Na 7.2 7.13 S 0.041 0.0457 Ti 0.0148 Table 10: Concentration (in%) next day of standard3 Elements Theoritical Without With concentration re-slope re-slope Al 3.84 3.995 3.88 Ba 3.41 3.245 3.32 Ca 13.89 13.65 13.85 Fe 1.32 1.284 1.29 K 0.011 0.0058 0.009 Mg 0.56 0.578 0.574 Mn 0.093 0.082 0.079 Na 7.2 6.98 7.17 S 0.041 0.042 0.0393 Ti 0.014 0.014 8 Summarv This application report shows that the ICP-OES isan appropriate technique for the analysis of glasssamples due to the very large dynamic range. Thehigh reproducibility of the JY ULTIMA was shownand enables a high throughput with less time need-ed for re-slope of the calibration curves. The accu-racy for major elements was obtained using theinternal standard. CE In the USA: Jobin Yvon Inc. 3880 Park Avenue Edison, NJ 08820 E-mail: 1-877-JYHORIBA EMISSION·FLUORESCENCE·FORENSICS·GRATINGSGOEM·RAMAN·OPTICAL SPECTROSCOPY·THIN FILM
确定
还剩1页未读,是否继续阅读?

产品配置单

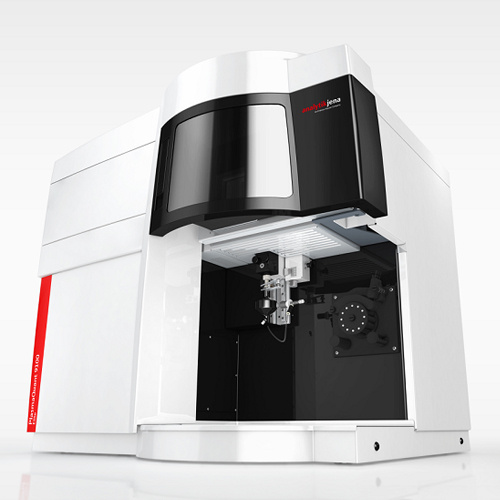
HORIBA(中国)为您提供《采用ICP方法分析玻璃样品》,该方案主要用于建筑玻璃中--检测,参考标准--,《采用ICP方法分析玻璃样品》用到的仪器有HORIBA Ultima Expert高性能ICP光谱仪
推荐专场
相关方案
更多
该厂商其他方案
更多