


方案详情
文
The relatively clean spectrum of glass constituents enables the use of the JY 2000-2 without the need of the high resolution of the ULTIMA 2. The results show excellent agreement with expected results for all element, both major constituents and traces. The use of sequential internal standard has been shown to compensate for any viscosity differences between the samples and standards. The speed of analysis of less than 2 minutes for the 10 elements determined, and the detection limits achieved, are more than adequate for laboratories doing ordinary glass analysis. Although both acid and fusion methods were tried, afusion would appear to fulfil the requirements of full analysis in one sample preparation. If lower detection limits are required for some of the trace elements, then an HF acid digestion will be required as well.
方案详情

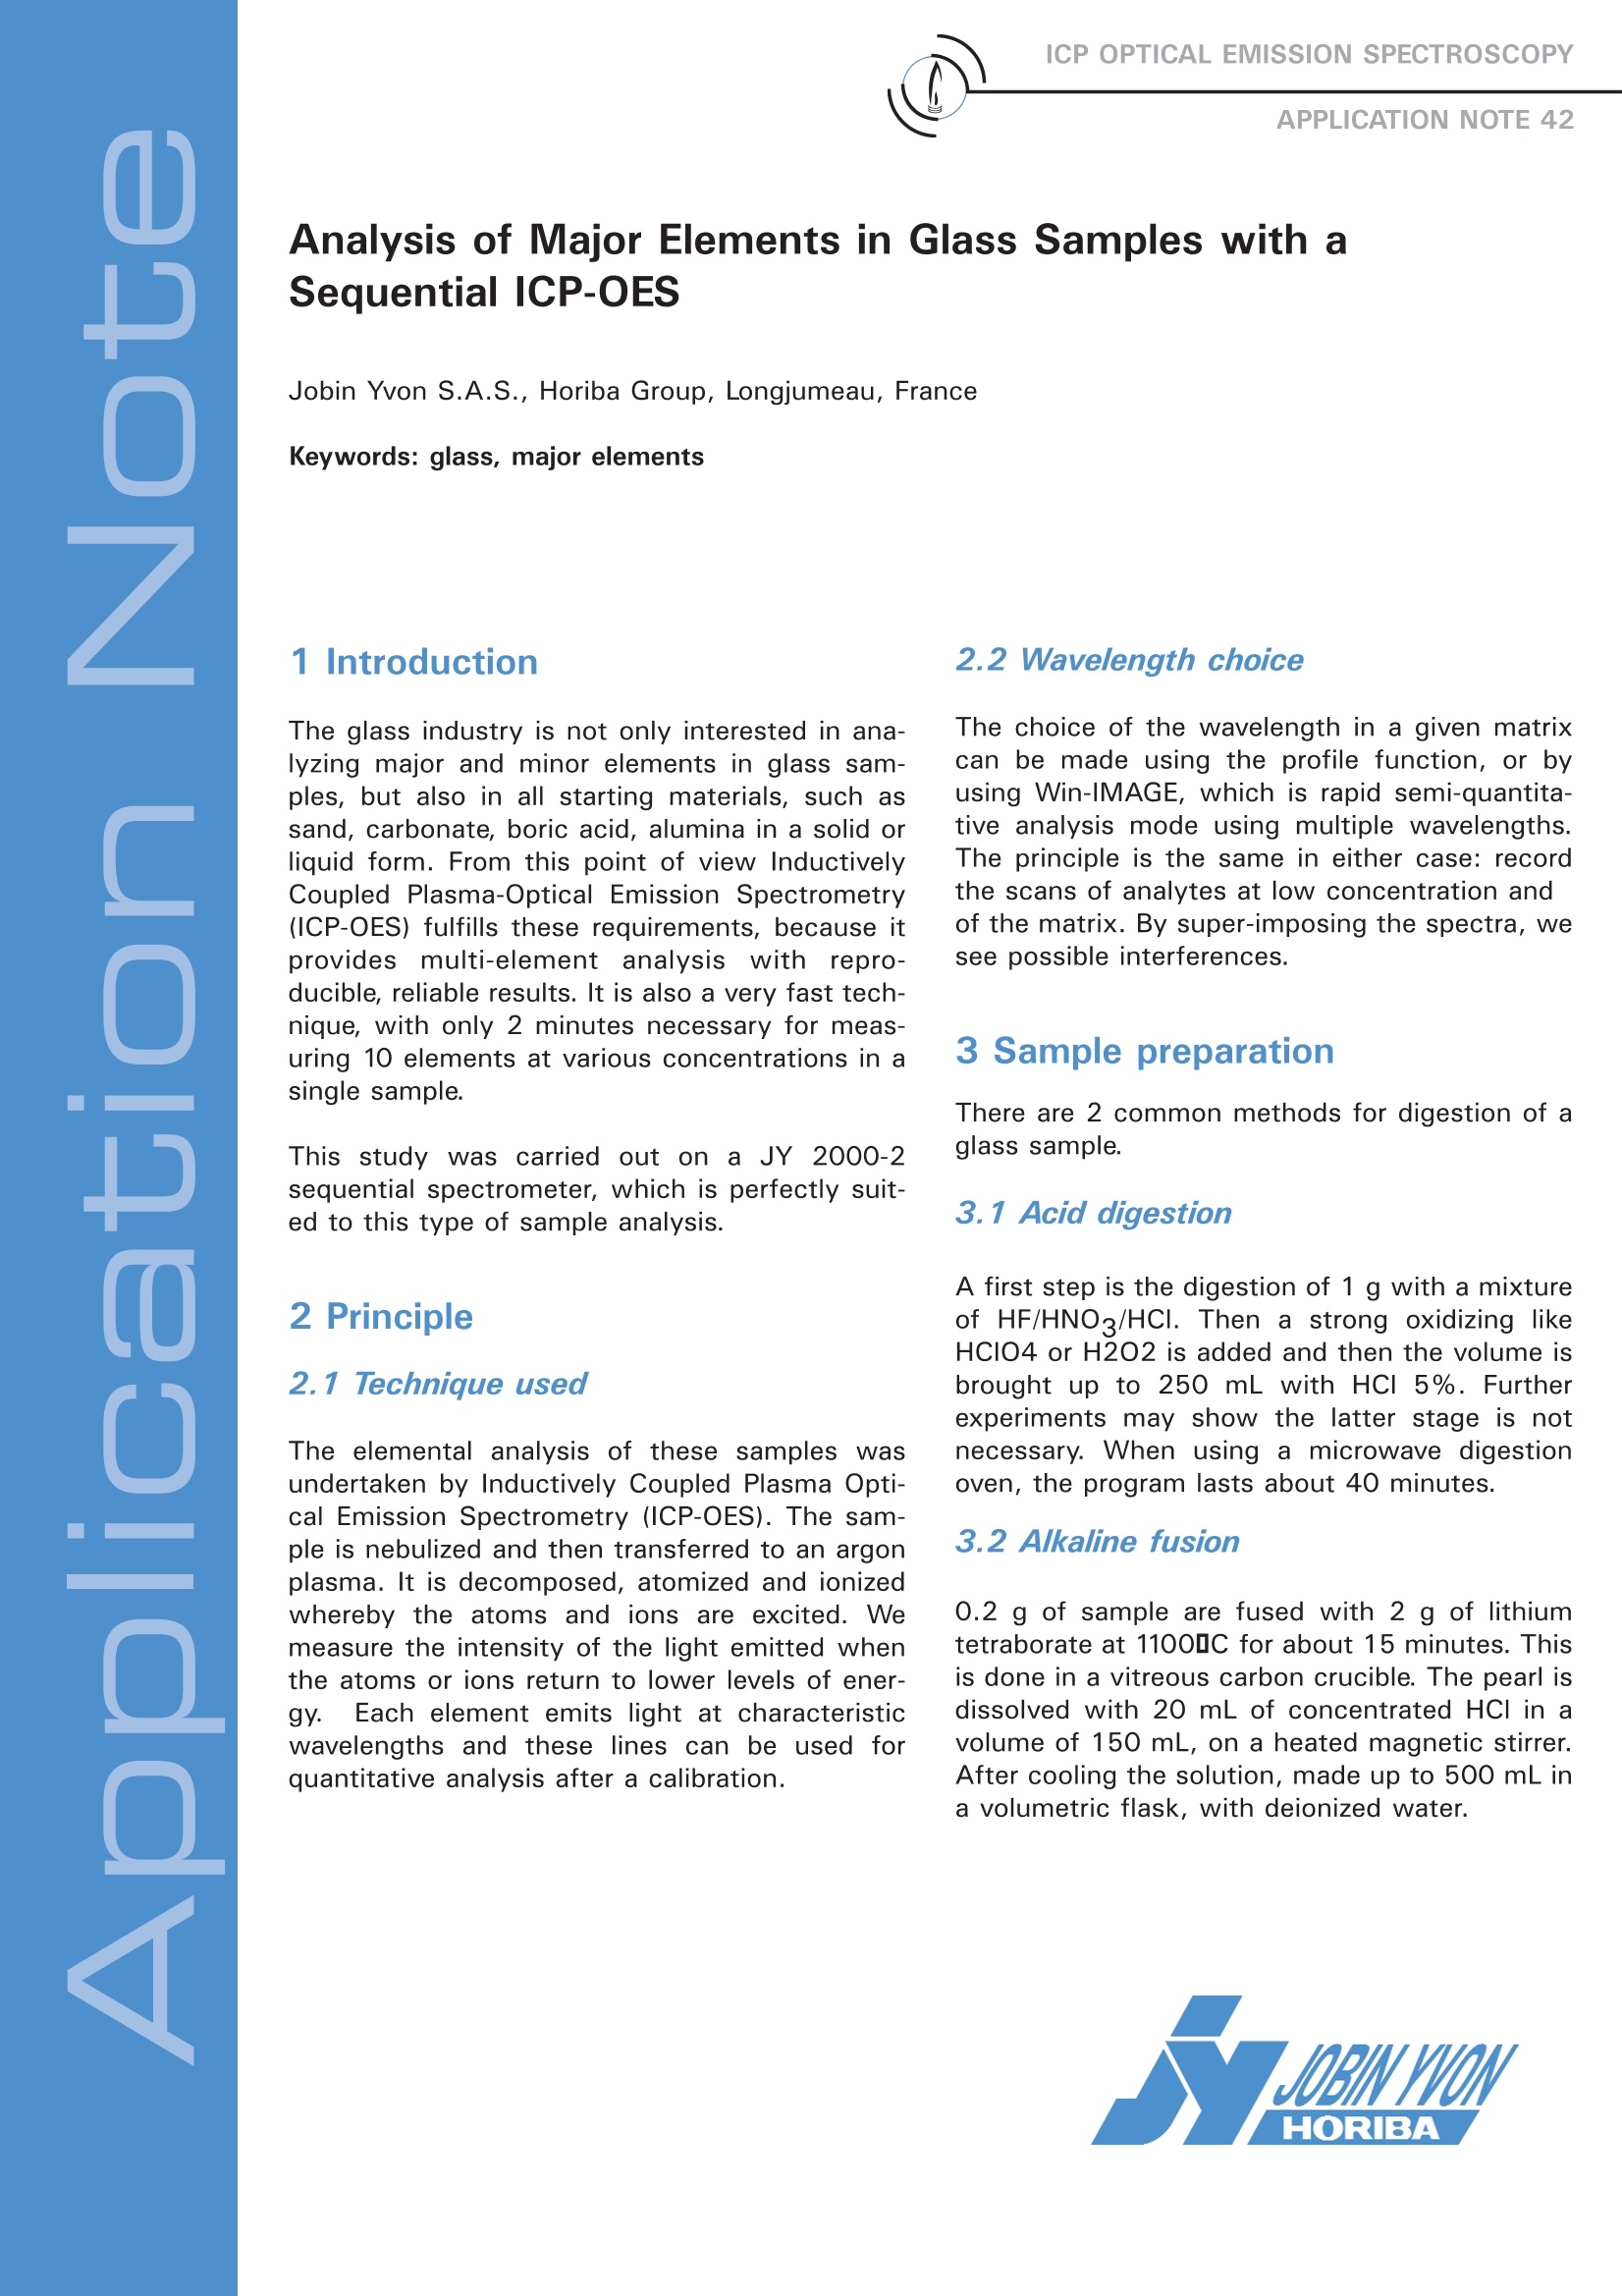
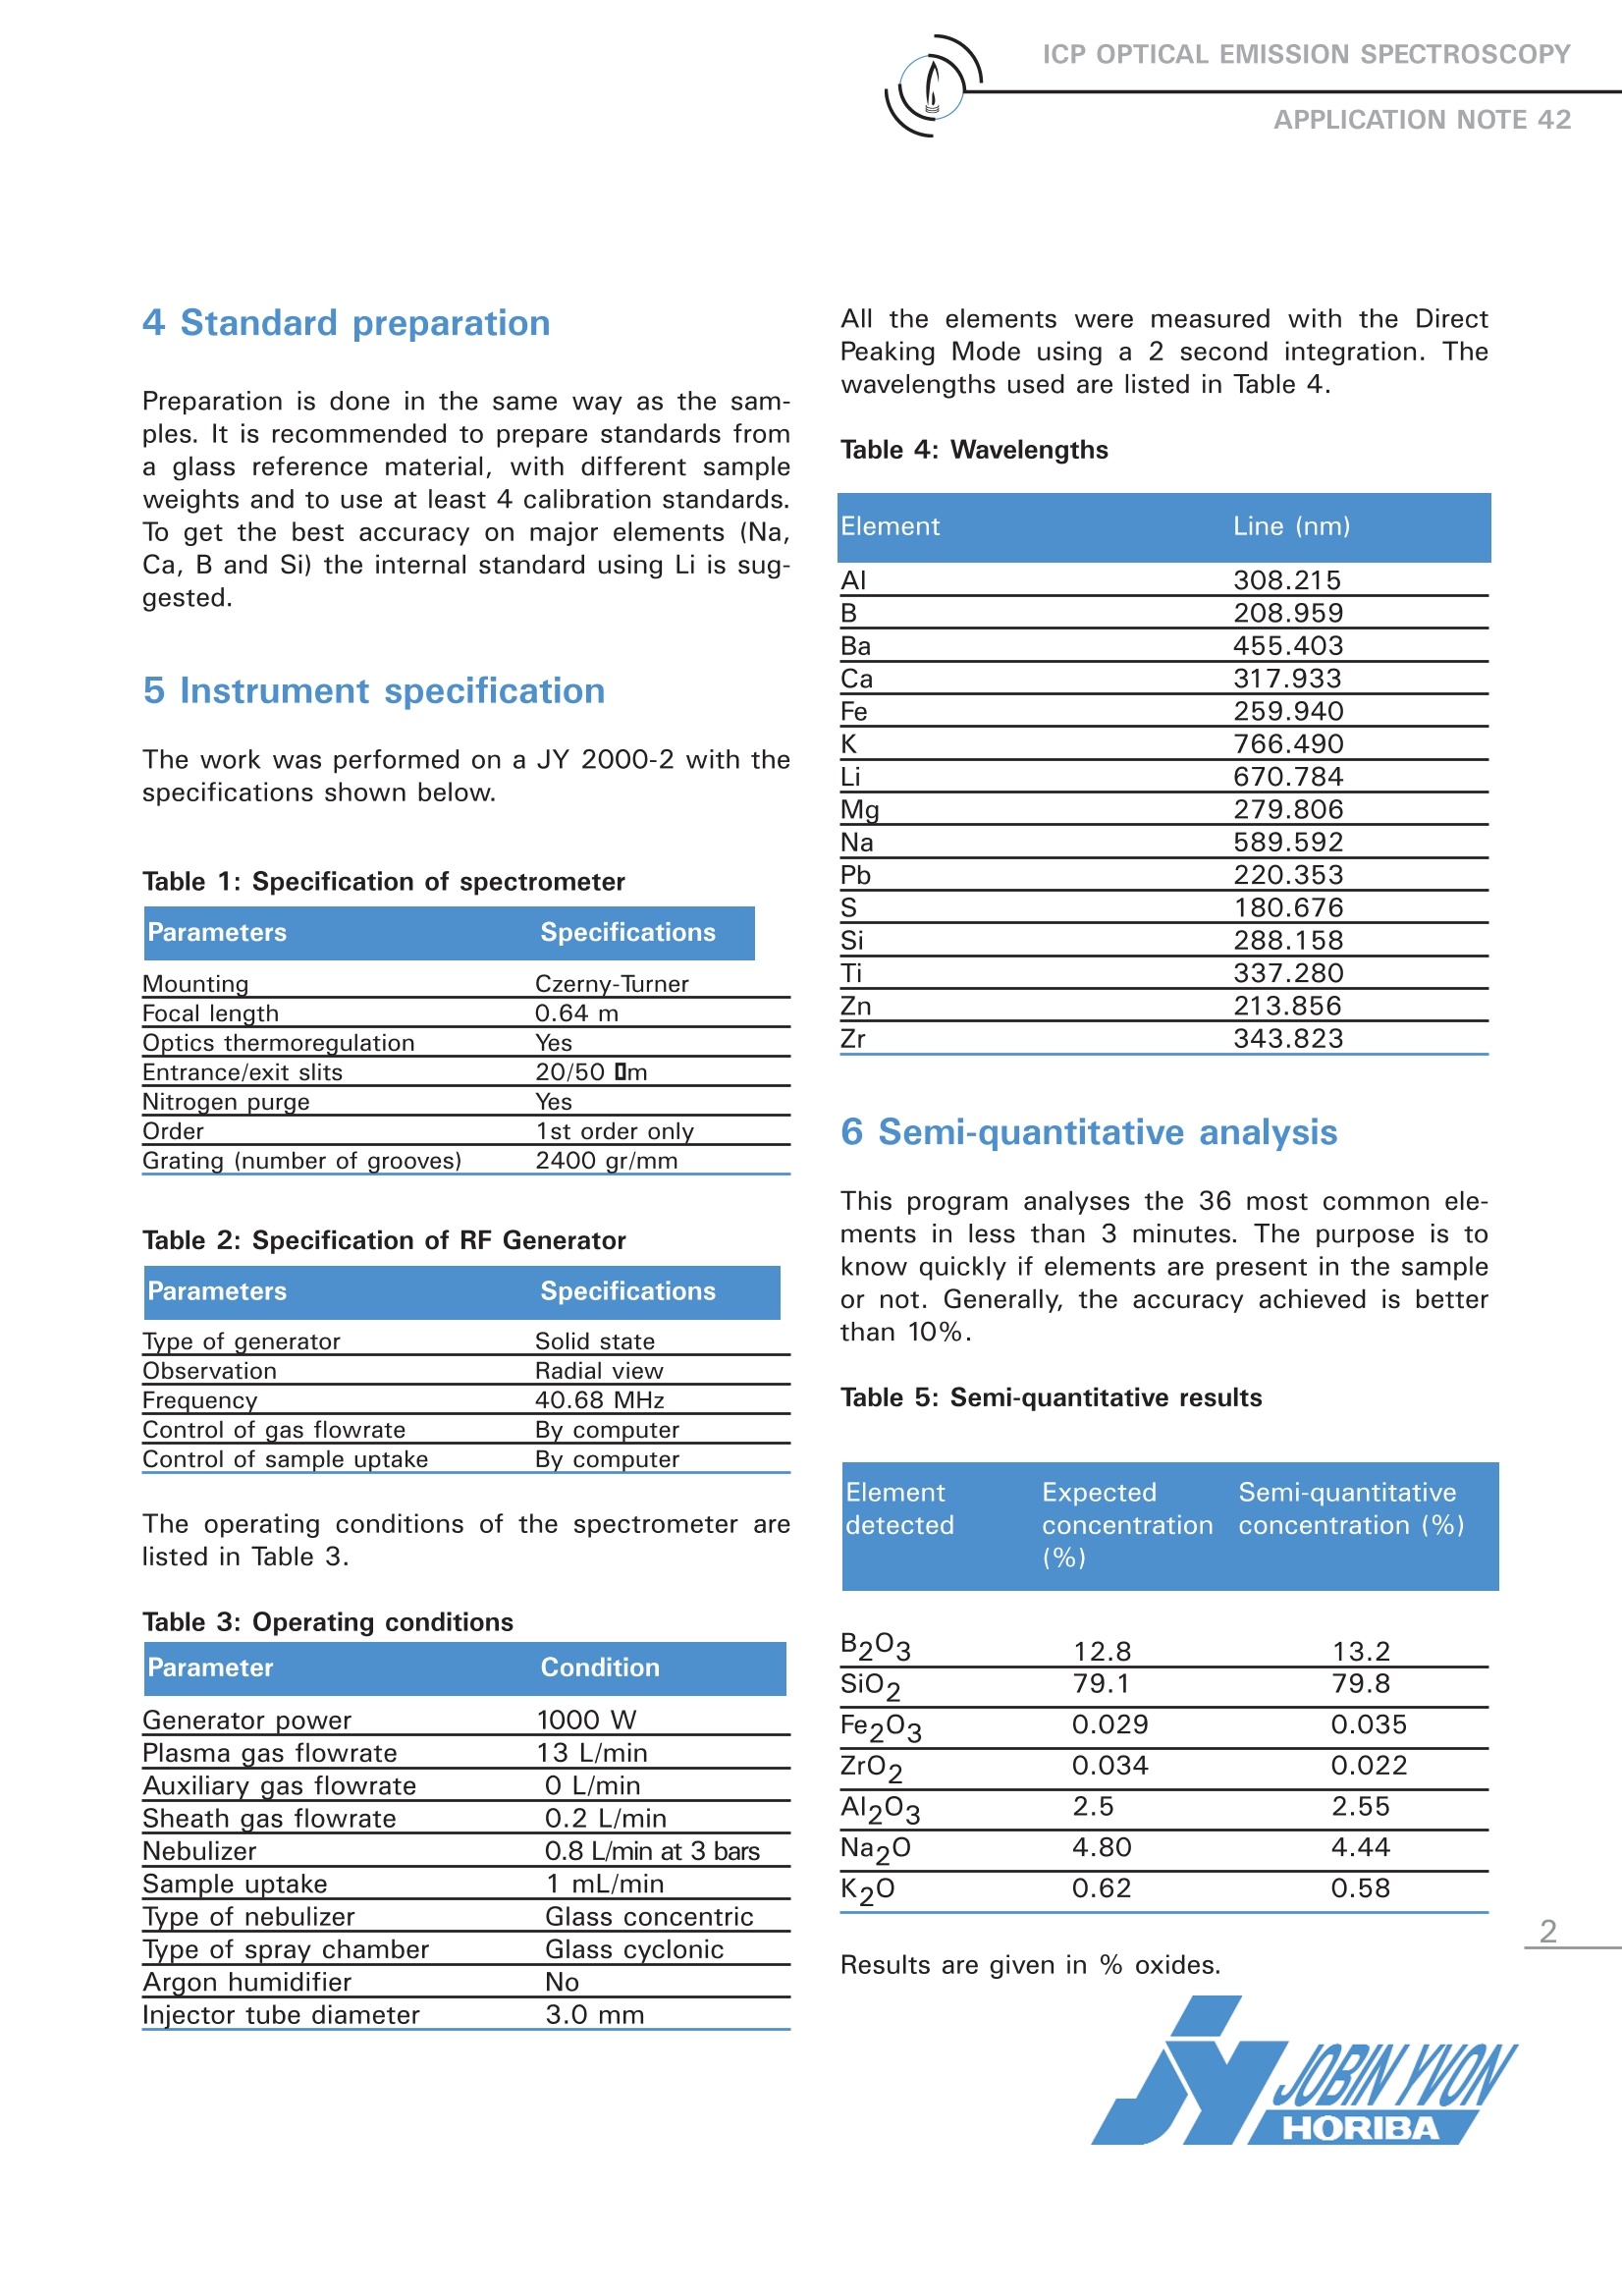
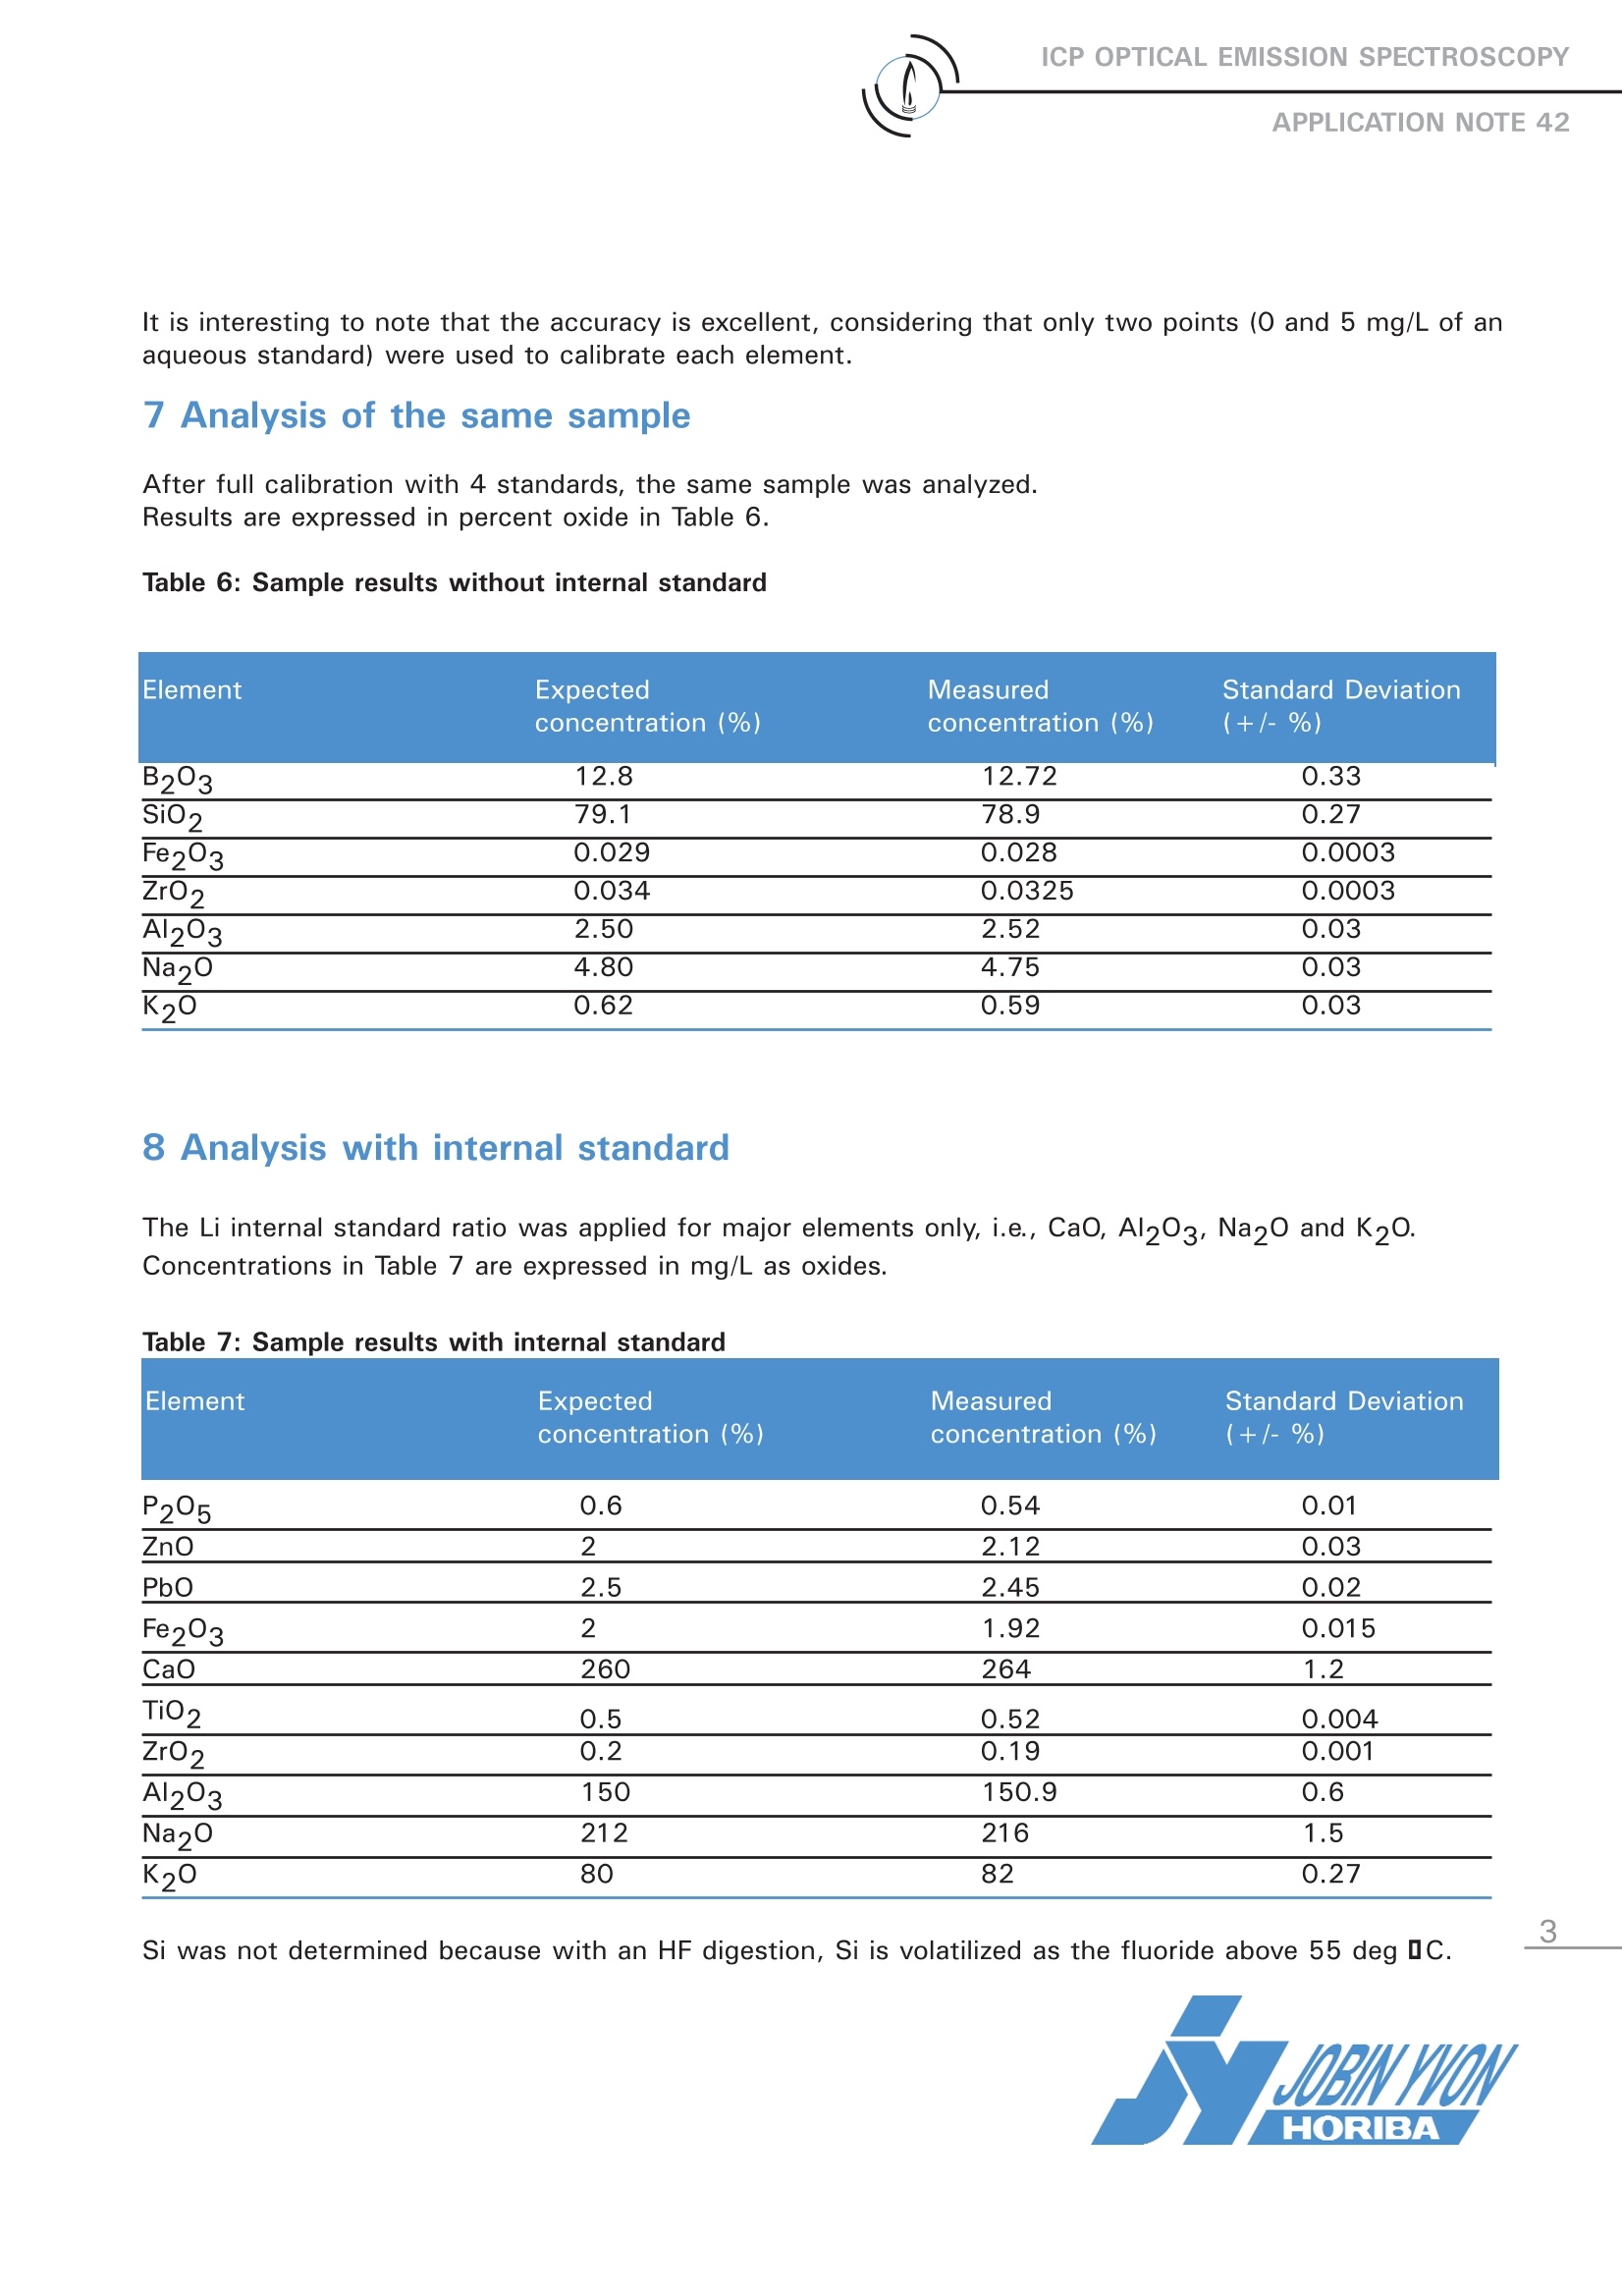
ICP OPTICAL EMISSION SPECTROSCOPYAPPLICATION NOTE 42 Analysis of Major Elements in Glass Samples with aSequential ICP-OES Jobin Yvon S.A.S., Horiba Group, Longjumeau, FranceKeywords: glass, major elements The glass industry is not only interested in ana-lyzing major and minor elements in glass sam-ples, but also in all starting materials, such assand, carbonate, boric acid, alumina in a solid orliquid form. From this point of view InductivelyCoupled Plasma-Optical Emission Spectrometry(ICP-OES) fulfills these requirements, because itprovidess multi-element analysis withrepro-ducible, reliable results. It is also a very fast tech-nique, with only 2 minutes necessary for meas-uring 10 elements at various concentrations in asingle sample. This study was carried out on a JY 2000-2sequential spectrometer, which is perfectly suit-ed to this type of sample analysis. 2 Principle 2.1 Technique used The elemental analysis of these samples wasundertaken by Inductively Coupled Plasma Opti-cal Emission Spectrometry (ICP-OES). The sam-ple is nebulized and then transferred to an argonplasma. It is decomposed, atomized and ionizedwhereby the atoms and ions are excited. Wemeasure the intensity of the light emitted whenthe atoms or ions return to lower levels of ener-gy. Each element emits light at characteristicwavelengths and these lines can be used forquantitative analysis after a calibration. 2.2 Wavelength choice The choice of the wavelength in a given matrixcan be made using the profile function, or byusing Win-IMAGE, which is rapid semi-quantita-tive analysis mode using multiple wavelengths.The principle is the same in either case: recordthe scans of analytes at low concentration andof the matrix. By super-imposing the spectra, wesee possible interferences. 3 Sample preparation There are 2 common methods for digestion of aglass sample. 3.1 Acid digestion A first step is the digestion of 1 g with a mixtureof HF/HNO3/HCI. Then a strong oxidizing likeHCIO4 or H202 is added and then the volume isbrought up to 250 mL with HCI 5%. Furtherexperiments may show the latter stage is notnecessary. When using a microwave digestionoven, the program lasts about 40 minutes. 3.2 Alkaline fusion 0.2 g of sample are fused with 2 g of lithiumtetraborate at 11001C for about 15 minutes. Thisis done in a vitreous carbon crucible. The pearl isdissolved with 20 mL of concentrated HCl in avolume of 150 mL, on a heated magnetic stirrer.After cooling the solution, made up to 500 mL ina volumetric flask, with deionized water. 4 Standard preparation Preparation is done in the same way as the sam-ples. It is recommended to prepare standards froma glass reference material, with different sampleweights and to use at least 4 calibration standards.To get the best accuracy on major elements (Na,Ca, B and Si) the internal standard using Li is sug-gested. 5 Instrument specification The work was performed on a JY 2000-2 with thespecifications shown below. Table 1: Specification of spectrometer Parameters Specifications Mounting Czerny-Turner Focal length 0.64 m Optics thermoregulation Yes Entrance/exit slits 20/50 1m Nitrogen purge Yes Order 1st order only Grating (number of grooves) 2400 gr/mm Table 2: Specification of RF Generator Parameters Specifications Type of generator Solid state Observation Radial view Frequency 40.68 MHz Control of gas flowrate By computer Control of sample uptake By computer The operating conditions of the spectrometer arelisted in Table 3. Table 3: Operating conditions Parameter Condition Generator power 1000 W Plasma gas flowrate 13 L/min Auxiliary gas flowrate 0 L/min Sheath gas flowrate 0.2 L/min Nebulizer 0.8 L/min at 3 bars Sample uptake 1 mL/min Type of nebulizer Glass concentric Type of spray chamber Glass cyclonic Argon humidifier No Injector tube diameter 3.0 mm All the elements were measured with the DirectPeaking Mode using a 2 second integration. Thewavelengths used are listed in Table 4. Table 4: Wavelengths Element Line (nm) Al 308.215 B 208.959 Ba 455.403 Ca 317.933 Fe 259.940 K 766.490 Li 670.784 Mg 279.806 Na 589.592 Pb 220.353 180.676 Si 288.158 Ti 337.280 Zn 213.856 Zr 343.823 6 Semi-quantitative analysis This program analyses the 36 most common ele-ments in less than 3 minutes. The purpose is toknow quickly if elements are present in the sampleor not. Generally, the accuracy achieved is betterthan 10%. Table 5: Semi-quantitative results Element Expected Semi-quantitative detected concentration concentration (%) (%) B203 12.8 13.2 Si02 79.1 79.8 Fe203 0.029 0.035 Zr02 0.034 0.022 Al203 2.5 2.55 Na2O 4.80 4.44 K20 0.62 0.58 Results are given in % oxides. It is interesting to note that the accuracy is excellent, considering that only two points (0 and 5 mg/L of anaqueous standard) were used to calibrate each element. 7 Analysis of the same sample After full calibration with 4 standards, the same sample was analyzed. Results are expressed in percent oxide in Table 6. Table 6: Sample results without internal standard Element Expected Measured Standard Deviation concentration(%) concentration (%) (+/-%) B203 12.8 12.72 0.33 SiO2 79.1 78.9 0.27 Fe203 0.029 0.028 0.0003 Zr02 0.034 0.0325 0.0003 Al203 2.50 2.52 0.03 Na20 4.80 4.75 0.03 K20 0.62 0.59 0.03 8 Analysis with internal standard The Li internal standard ratio was applied for major elements only, i.e., CaO, Al203, Na20 and K2O.Concentrations in Table 7 are expressed in mg/L as oxides. Table 7: Sample results with internal standard Element Expected Measured Standard Deviation concentration (%) concentration (%) (+/-%) P205 0.6 0.54 0.01 ZnO 2 2.12 0.03 PbO 2.5 2.45 0.02 Fe203 2 1.92 0.015 CaO 260 264 1.2 TiO2 0.5 0.52 0.004 ZrO2 0.2 0.19 0.001 Al203 150 150.9 0.6 Na20 212 216 1.5 K20 80 82 0.27 Si was not determined because with an HF digestion, Si is volatilized as the fluoride above 55 deg 1C. 9 Conclusion The relatively clean spectrum of glass constituents enables the use of the JY 2000-2 without the need of the high resolu-tion of the ULTIMA 2. The results show excellent agreement with expected results for all element, both major constituentsand traces. The use of sequential internal standard has been shown to compensate for any viscosity differences betweenthe samples and standards. The speed of analysis of less than 2 minutes for the 10 elements determined, and the detec-tion limits achieved, are more than adequate for laboratories doing ordinary glass analysis. Although both acid and fusionmethods were tried, a fusion would appear to fulfil the requirements of full analysis in one sample preparation. If lower detec-tion limits are required for some of the trace elements, then an HF acid digestion will be required as well. In the USA:Jobin Yvon Inc.3880 Park AvenueEdison, NJ 08820Tel:1-732-494-8660Fax: 1-732-494-8796E-mail: info@jobinyvon.com In France: In Japan: Jobin Yvon S.A.S. Horiba Ltd. 16-18, rue du Canal 2 Miyanohigashi, Kisshoin 91165 Longjumeau Cedex Tel: (33) 1/64 54 13 00 Fax: (33) 1/69 09 90 88 Minami-ku, Kyoto 601-8510TEL: (81)753138121FAX: (81)75 321 5725www.horiba.com Germany: (49)89/46 23 17-0 OChina: (86)10/6849 2216Spain: (34)91/724 16 57 1-866-JobinYvonwww.jobinyvon.com Italy:(39)2/57 60 56 90 U.K.: (44) 20/82 04 81 42 Other Countries: Contact JY S.A.S. !!!w Explore the future HORIBAGROUP The relatively clean spectrum of glass constituents enables the use of the JY 2000-2 without the need of the high resolution of the ULTIMA 2. The results show excellent agreement with expected results for all element, both major constituents and traces. The use of sequential internal standard has been shown to compensate for any viscosity differences between the samples and standards. The speed of analysis of less than 2 minutes for the 10 elements determined, and the detection limits achieved, are more than adequate for laboratories doing ordinary glass analysis. Although both acid and fusion methods were tried, afusion would appear to fulfil the requirements of full analysis in one sample preparation. If lower detection limits are required for some of the trace elements, then an HF acid digestion will be required as well.
确定

还剩2页未读,是否继续阅读?

产品配置单

HORIBA(中国)为您提供《玻璃中B元素检测方案(ICP-AES)》,该方案主要用于建筑玻璃中B元素检测,参考标准--,《玻璃中B元素检测方案(ICP-AES)》用到的仪器有HORIBA Ultima Expert高性能ICP光谱仪
推荐专场
相关方案
更多
该厂商其他方案
更多