


方案详情
文
把激光拉曼光谱仪和FT-IR红外拉曼光谱仪有机地整合
在同一系统中,这样可以获得完全的谱信息,还减小
了仪器的体积、节约经费。特别需要指出的是,由于
该系统采用了“共点”技术,它可以保证使我们在同
一样品的同一位置上获取两种谱信息(不同的光谱范
围)。这完全不会影响两种仪器(激光拉曼光谱仪和F
T-IR红外拉曼光谱仪)各自的性能和技术特点。该系
统,在众多研究领域(例如:聚合物性质、缺陷特
性、病理学、法医学、药物学、绘画颜料等)中都有
十分有意义的应用价值。
方案详情

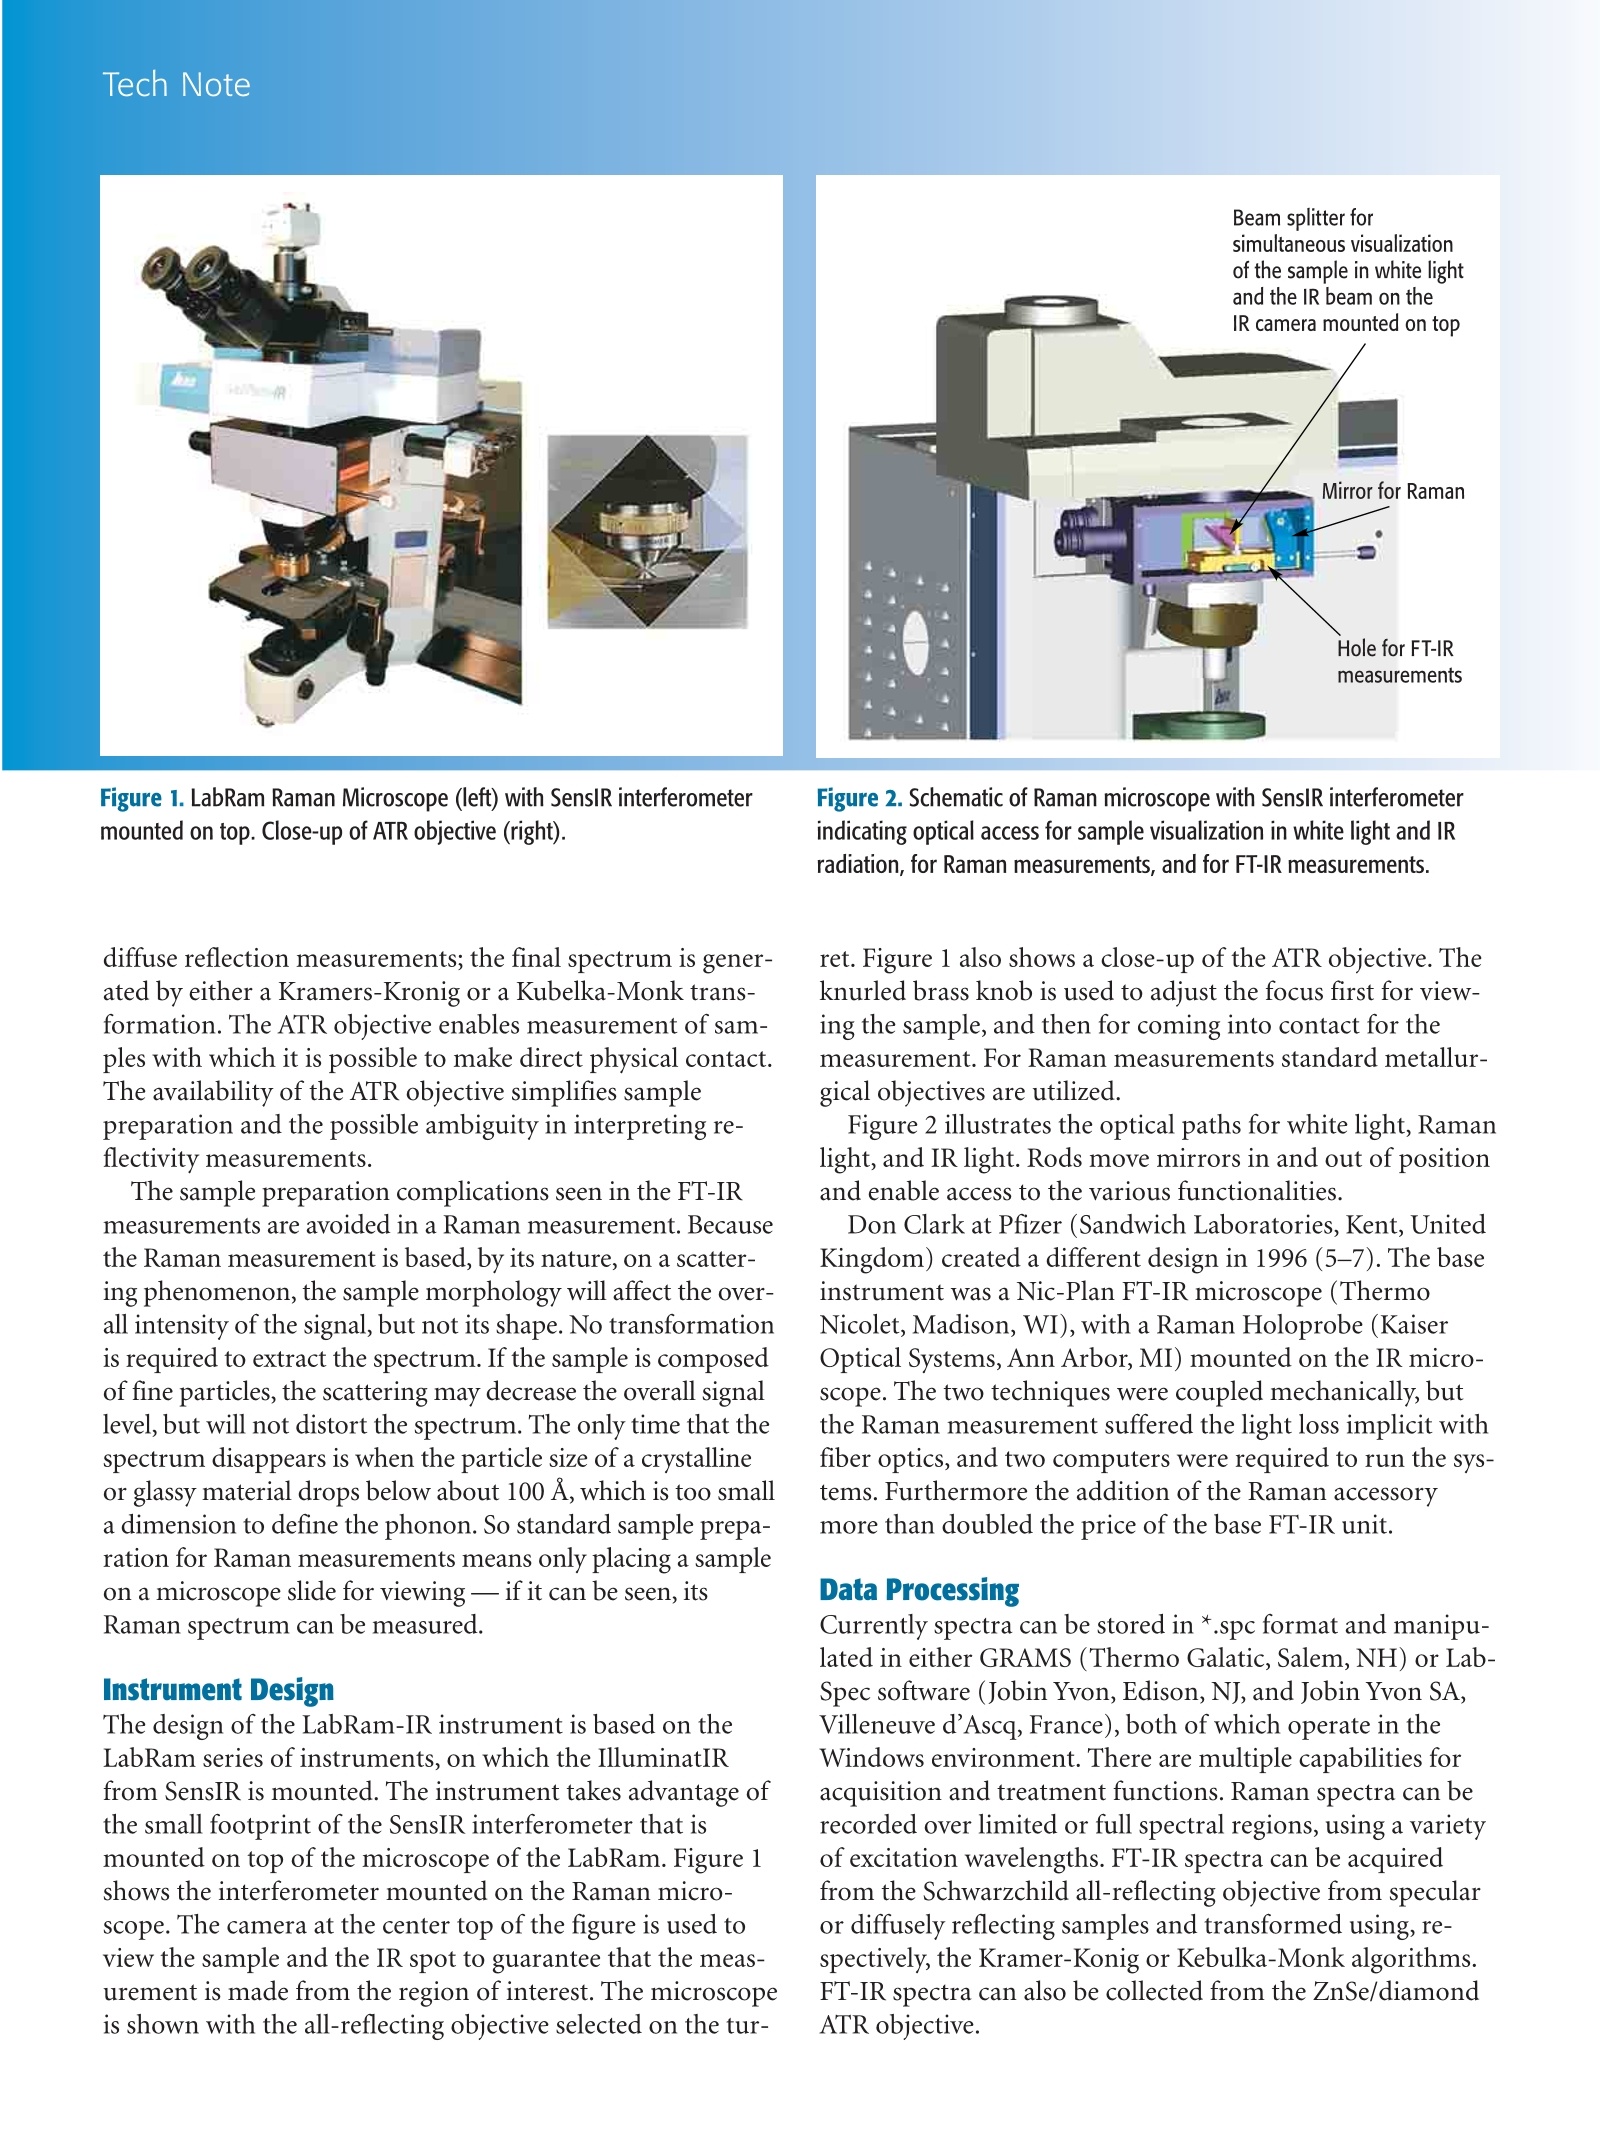
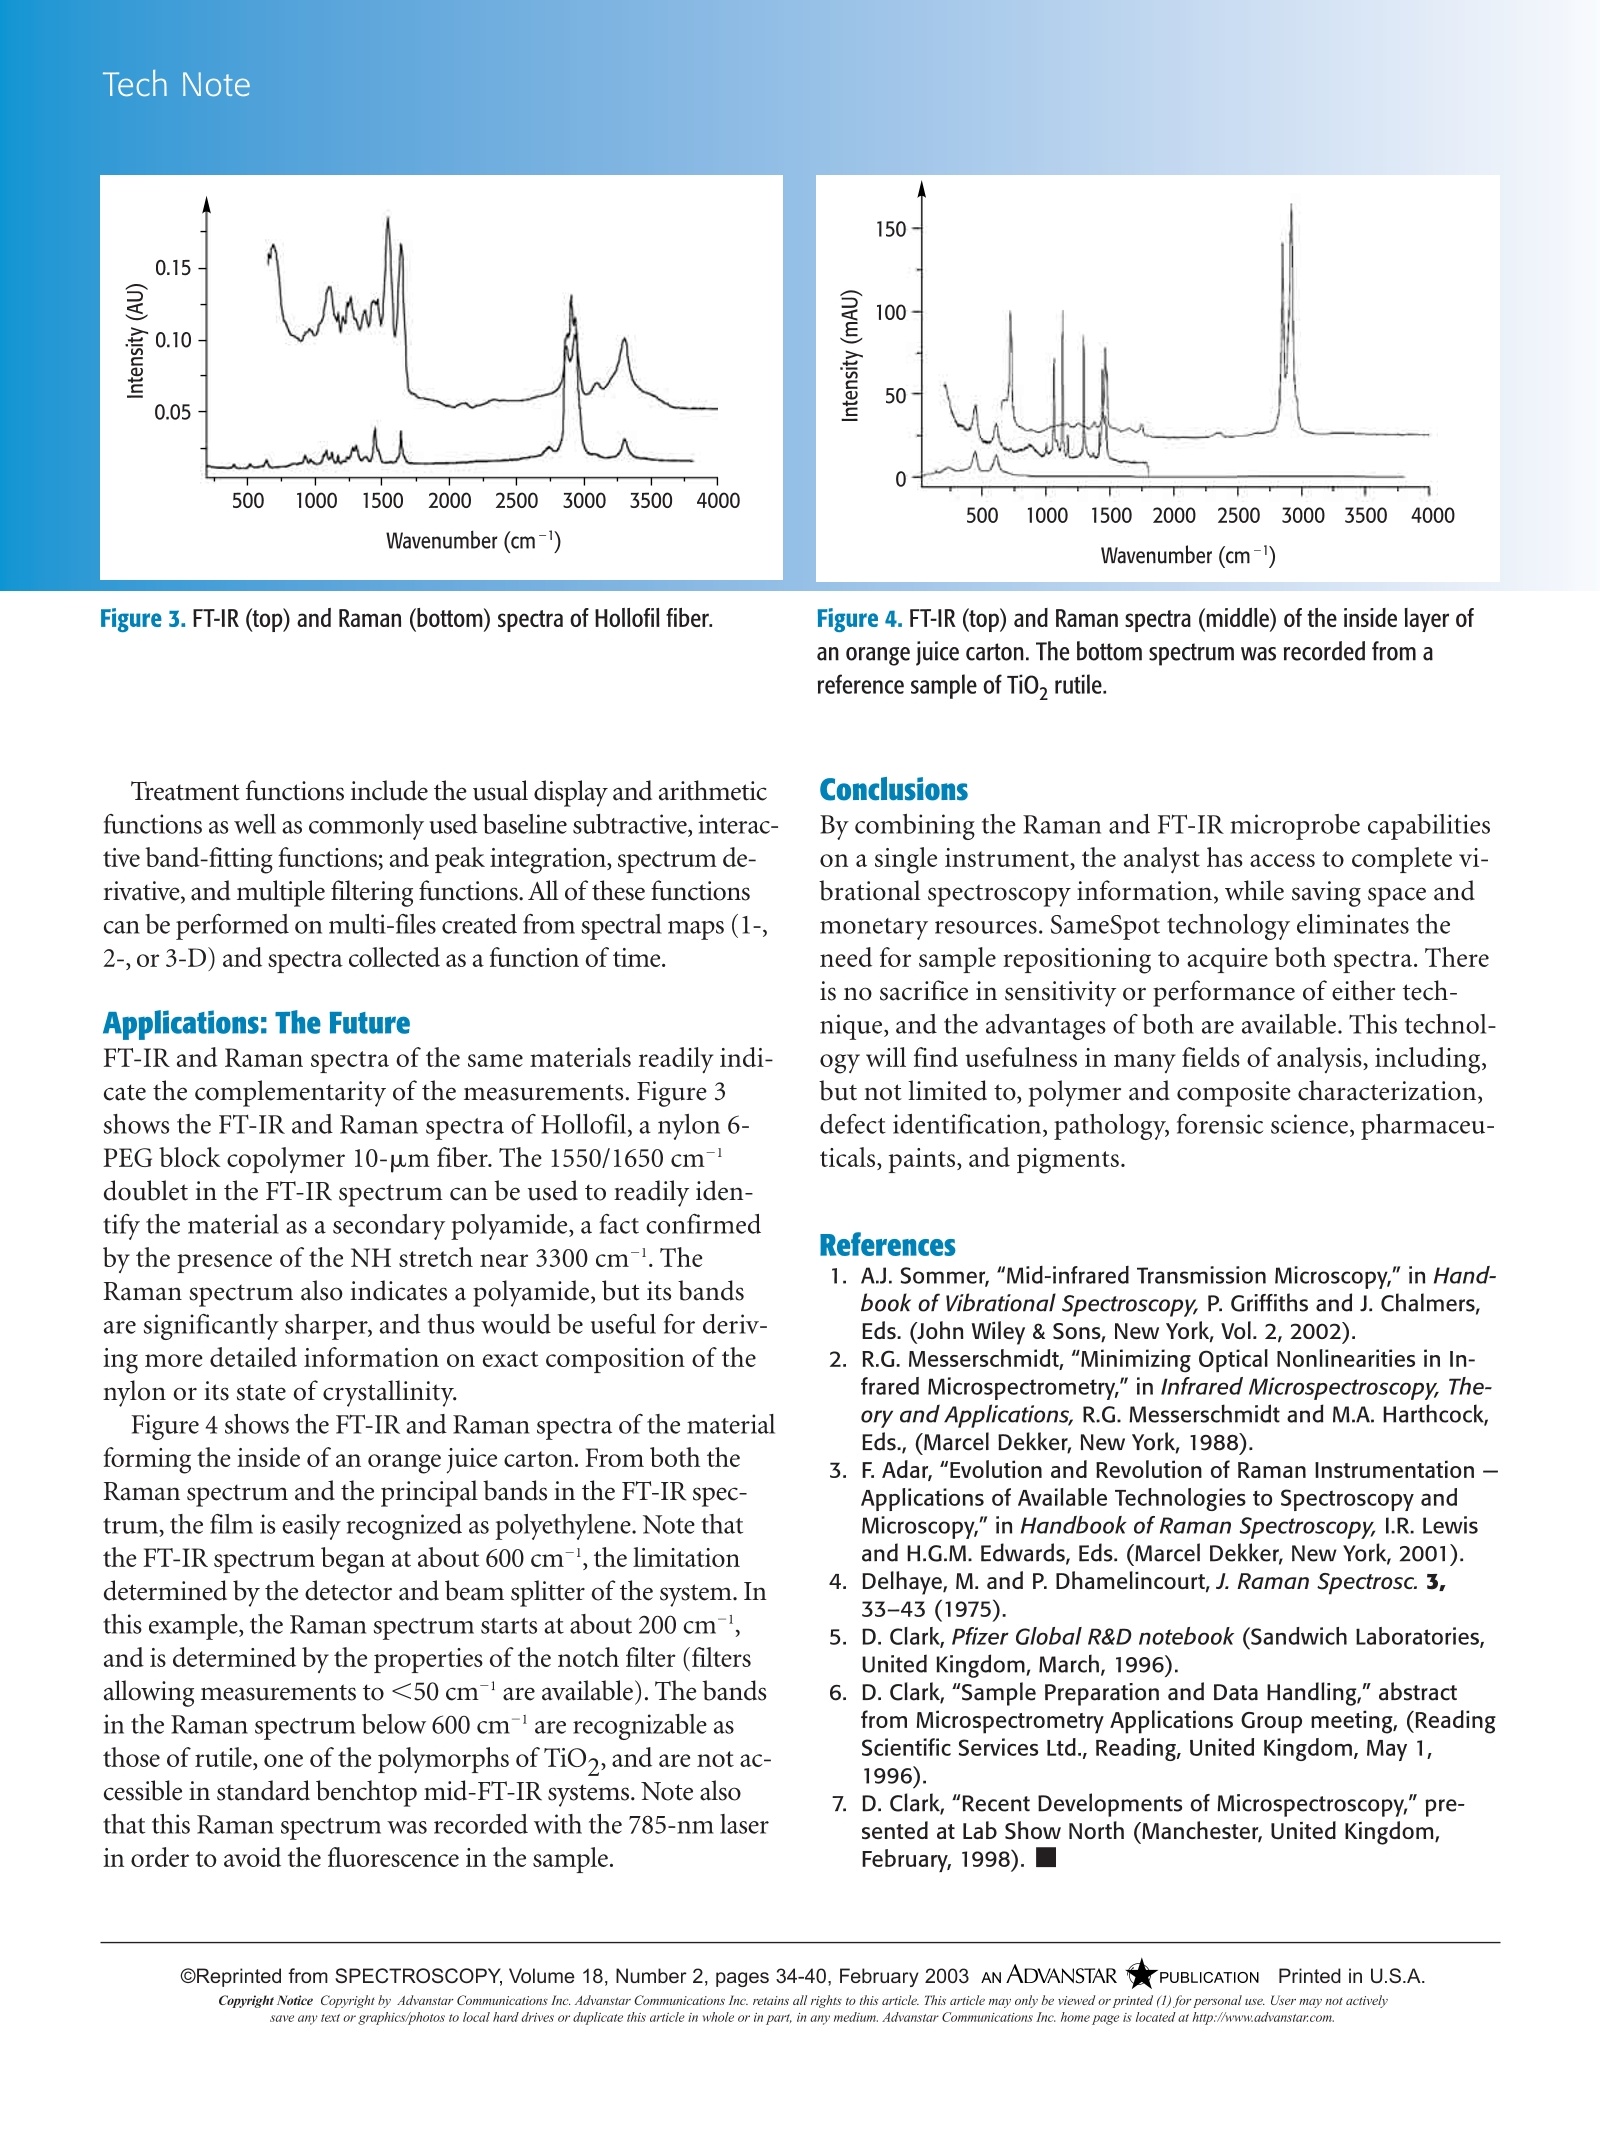
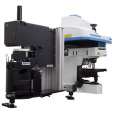
TECHNOTE Tech Note OReprinted from SPECTROSCOPY, Volume 18, Number 2, pages 34-40, February 2003 ANADVANSTAR 《OPUBLICATIONPrinted in U.S.A.Copyright Notice Copyright by Advanstar Communications Inc. Advanstar Communications Inc. retains all rights to this article. This article may only be viewed or printed (1) for personal use. User may not activelysave any text or graphics/photos to local hard drives or duplicate this article in whole or in part, in any medium. Advanstar Communications Inc. home page is located at http://www.advanstar.com. FT-IR and Raman Microscopy on aUnited Platform A Technology Whose Time Has ComeFran Adar, Gwenaelle leBourdon, John Reffner, and Andrew Whitley oth Raman and in- frared(IR) spectro-scopies measurevibrational transitionsin molecules and crystals. IRabsorption is a direct process in-volving the disappearance of aphoton whose energy (fre-quency) matches that of a vibra-tional transition.Raman is ascattering process wherein alaser photon of well-defined en-ergy is scattered off a molecule;a small amount of energy is lostto a molecular vibration so thespectrum of the scattered lightshows peaks where the energydifferences between the laserand scattered photons corre-spond to vibrational transitions. Because an IR process is aone-photon direct process, anda Raman process is a two-photon scattering process, theunderlying physics determiningthe intensities of the two tech-niques are quite different. Whatis usually said is that the selec-tion rules are different. For IR,the vibrations create a dipolemoment change that can couplestrongly to the electric field ofthe IR photons that are IR ac-tive. For example, carbonylgroups are always strongly IRactive. Vibrations that affect the elec-tronic polarizability of the mole-cule are Raman active. A laserwhose energy can couple to elec- trons is used to excite the Ramanspectrum. (The laser energy ison the order of 2 eV so only theelectrons are energetic enoughto respond to this radiation.)The molecule responds to thehigh frequency electric field ofthe photon by exhibiting a time-dependent response in the elec-tronic system that is called po-larizability. Because themolecule's configuration isslowly changing during a molec-ular vibration, the electronic po-larizability is modulated by thevibration. When it re-radiates,the photon field has some com-ponents at energies or frequen-cies shifted from the laser energyby an amount equal to a vibra-tional energy. So the spectrum ofshifted photons represents themolecular or crystalline vibra-tions. For Raman scattering, thevibrations with significant inten-sities are those vibrations thatstrongly affect the electronic po-larizability; vibrations of func-tional groups withT electrons(aromatic rings and carbon dou-ble bonds) have strong Ramanbands, for example. Raman and IR microscopes de-veloped independently over thepast 30 years. The developmentof both was motivated,obvi-ously, by the need for acquiring spectra from microspots. Thespatial resolution is determinedby physics based on the wave-length of the light used. For themid-IR, the wavelengths aretypically between 20 and 2.5um (500 and 4000 cm), whichputs the spatial resolution atbest at 5 um, but more typicallyat 10-20 um. For Raman, inwhich the wavelengths of excita-tion and detection are in the vis-ible, typically between 400 and850 nm, the spatial resolution,which is diffraction limited to ahalf of a wavelength, is observedto be better than 1 um. While IR microprobes wereprototyped during the 1950s,robust commercial systems onlybecame available during the1980s when the sensitivity of IRinstruments increased after theintegration of improved detec-tors and multiplexing Fouriertransform (FT) interferometersfor collecting the signals (1,2). The historical development ofthe Raman microprobe is de-Sscribed in reference 3. The prin-ciples of the design of a Ramanmicroscope were laid out in anearly article by Delhaye andDhamelincourt (4). Eventhough these principles wereimplemented in a commercialsystem in the mid-1970s,thetechnology only became widelyutilized after the simplificationof the instruments in the 1990s. Advantages and Disadvantages of the Two Tools Commercially available mid-IR instruments have been avail-able since the mid-1950s. Because they have been used exten-sively, especially in industrial laboratories, the equipment hasevolved to make it quite easy to use for the non-research-ori-ented analyst. The hardware and software is user-friendly.Many specialized techniques have evolved for examination ofsamples (for example, KBr pelletizers, attenuated total reflec-tion [ATR], and diffuse reflectance [DRIFT]). Literally tensof thousands of spectra have been acquired, collected, andmade available in commercial as well as government-spon-sored databases. On the other hand, Raman instruments evolved muchmore slowly. Commercial instruments were available, butthey were not as user friendly as FT-IR. The introduction ofthe laser simplified the source, but persistent problems in ac-quiring spectra from "real world"samples because of fluo-rescing impurities or laser damage inhibited the growth ofthe use of the technique. Until the 1990s the equipmenttended to be used by physicists and materials scientists, withsome applications in chemistry and biological sciences. The first innovation that began to make Raman more ana-lytically interesting was the introduction of the microprobein 1972. In addition to making it possible to acquire spectrafrom samples as small as the laser diffraction-limited spot of<1 um, it also provided spectra from many samples thatwere intractable because of impurity fluorescence. The ease of use provided by the new sampling arrange-ment was derived from the rigid, robust coupling of the laser,and from the back-scattering configuration inherent in themicroprobe. With this configuration it was no longer neces-sary to struggle to ensure that the laser focal volume was co-incident with the Raman collecting volume in a 90° scatter-ing configuration, and it was easy for users to see when thesample was in focus. The elimination of the fluorescence problems was derivedfrom three effects. First, in a heterogeneous sample it is pos-sible to hunt for a spot with low levels of fluorescing impuri-ties. Second, the high laser flux will“bleach"the fluorescencemuch more rapidly than is possible in a macro sample. Andthird, because of the finite lifetime of the fluorescence, a cer-tain probability exists that the excited state will migrate awayfrom the Raman excitation volume before emission, andconfocal apertures can effectively block this radiation. New technologies provided for simplification in Raman sys-tems and reduction of their size during the 1990s. The intro-duction of the holographic notch filter enabled routine acqui-sition of Raman spectra on small spectrographs (as opposedto large double or triple monochromators). Multichannel de-tectors decreased the acquisition times, on a given instrument,for equivalent signal-to-noise ratios, by more than an order ofmagnitude.Rugged, air-cooled lasers simplified utility require-ments and provided additional beam pointing stability overwater-cooled lasers that operate very hot. The result of these improvements is the growing use ofRaman instruments in analytical laboratories and the rapid increase in demand. However, the Raman knowledge base isnot as great as is the mid-IR knowledge base. Analytical vi-brational spectroscopists tend to be skittish about Raman.Interpretation courses do exist, and the reeducation processis continuing as Raman rapidly catches up to FT-IR in thelaboratory. Information Content A formal description of the two techniques always states thatRaman and mid-IR spectroscopy are complementary. Thisfact does not mean that if one tool is available, the other isnot required. Even though both techniques are probing vi-brational transitions in molecules and crystals, the sensitivityto specific chemical and physical properties is better in onetechnique than the other. So, as described previously, mid-IRis quite sensitive in detecting polar vibrations, whereasRaman is sensitive in detecting vibrations that modulate theelectronic polarizability. Generalized interpretation of molecular structure is verywell developed from IR spectra, whereas for many vibra-tional spectroscopists, interpretation of Raman spectra tendsto fill in the gaps of the IR. For example, IR will only detectcarbon double bonds when they are very asymmetricallysubstituted, whereas Raman always detects the presence ofdouble bonds. As Raman spectroscopy is proving itself moreuseful to the analyst, the application of the technique in rou-tine analytical situations will continue to expand. For exam-ple, when analyzing contaminants that are smaller than thediffraction limit for IR, one can no longer rely on IR to makeidentifications. Significant differences exist in sampling requirements forFT-IR versus Raman microscopies. Because FT-IR is an ab-sorption process, there is often a high probability that sam-ples will absorb some bands so intensely that light will notpenetrate the samples. Thus, samples must be carefully pre-pared for FT-IR measurements. If they are to be measured intransmission, they need to be appropriately thinned or di-luted by mixing with Nujol or KBr crystals. If they are to bemeasured in reflection, the optical properties of the surfacebecome important. For diffuse reflectance measurements theamount of specular reflected light needs to be minimized bycareful preparation of the sample; if the reflecting propertiesare intermediate, it will be nearly impossible to extract thereal spectrum. Reflectance-absorbance measurements re-quire the sample to be nonscattering and also thin. ATRtakes advantage of total internal reflection within theZnSe/diamond crystal; the signal is generated by absorptionof the evanescent wave in the sample, and so the only re-quirement is that the crystal can come into good contactwith the sample. The LabRamIR (JY Horiba, Edison,NJ,and SensIR Tech-nologies, Danbury, CT) is optimized for reflection absorp-tion, diffuse reflectance,and ATR measurements. The all-reflecting Schwarzchild objective provides for specular and diffuse reflection measurements; the final spectrum is gener-ated by either a Kramers-Kronig or a Kubelka-Monk trans-formation. The ATR objective enables measurement of sam-ples with which it is possible to make direct physical contact.The availability of the ATR objective simplifies samplepreparation and the possible ambiguity in interpreting re-flectivity measurements. The sample preparation complications seen in the FT-IRmeasurements are avoided in a Raman measurement. Becausethe Raman measurement is based, by its nature, on a scatter-ing phenomenon, the sample morphology will affect the over-all intensity of the signal, but not its shape. No transformationis required to extract the spectrum. If the sample is composedof fine particles, the scattering may decrease the overall signallevel, but will not distort the spectrum. The only time that thespectrum disappears is when the particle size of a crystallineor glassy material drops below about 100 A, which is too smalla dimension to define the phonon. So standard sample prepa-ration for Raman measurements means only placing a sampleon a microscope slide for viewing - if it can be seen, itsRaman spectrum can be measured. The design of the LabRam-IR instrument is based on theLabRam series of instruments,on which the IlluminatIRfrom SensIR is mounted. The instrument takes advantage ofthe small footprint of the SensIR interferometer that ismounted on top of the microscope of the LabRam. Figure 1shows the interferometer mounted on the Raman micro-scope. The camera at the center top of the figure is used toview the sample and the IR spot to guarantee that the meas-urement is made from the region of interest. The microscopeis shown with the all-reflecting objective selected on the tur- Figure 2. Schematic of Raman microscope with SensIR interferometerindicating optical access for sample visualization in white light and IRradiation, for Raman measurements, and for FT-IR measurements. ret. Figure 1 also shows a close-up of the ATR objective. Theknurled brass knob is used to adjust the focus first for view-ing the sample, and then for coming into contact for themeasurement. For Raman measurements standard metallur-gical objectives are utilized. Figure 2 illustrates the optical paths for white light, Ramanlight, and IR light. Rods move mirrors in and out of positionand enable access to the various functionalities. Don Clark at Pfizer (Sandwich Laboratories, Kent, UnitedKingdom) created a different design in 1996 (5-7). The baseinstrument was a Nic-Plan FT-IR microscope (ThermoNicolet, Madison, WI), with a Raman Holoprobe (KaiserOptical Systems, Ann Arbor, MI) mounted on the IR micro-scope. The two techniques were coupled mechanically, butthe Raman measurement suffered the light loss implicit withfiber optics, and two computers were required to run the sys-tems. Furthermore the addition of the Raman accessorymore than doubled the price of the base FT-IR unit. Data Processing Currently spectra can be stored in *.spc format and manipu-一lated in either GRAMS (Thermo Galatic, Salem,NH) or Lab-Spec software (Jobin Yvon, Edison, NJ, and Jobin Yvon SA,Villeneuve d’Ascq, France), both of which operate in theWindows environment. There are multiple capabilities foracquisition and treatment functions. Raman spectra can berecorded over limited or full spectral regions, using a varietyof excitation wavelengths. FT-IR spectra can be acquiredfrom the Schwarzchild all-reflecting objective from specularor diffusely reflecting samples and transformed using, re-spectively, the Kramer-Konig or Kebulka-Monk algorithms.FT-IR spectra can also be collected from the ZnSe/diamondATR objective. Figure 3. FT-IR (top) and Raman (bottom) spectra of Hollofil fiber. Treatment functions include the usual display and arithmeticfunctions as well as commonly used baseline subtractive, interac-tive band-fitting functions; and peak integration, spectrum de-rivative, and multiple filtering functions. All of these functionscan be performed on multi-files created from spectral maps (1-,2-, or 3-D) and spectra collected as a function of time. Applications: The Future FT-IR and Raman spectra of the same materials readily indi-cate the complementarity of the measurements. Figure 3shows the FT-IR and Raman spectra of Hollofil, a nylon 6-PEG block copolymer 10-um fiber. The 1550/1650 cm-'doublet in the FT-IR spectrum can be used to readily iden-tify the material as a secondary polyamide, a fact confirmedby the presence of the NH stretch near 3300 cm. TheRaman spectrum also indicates a polyamide, but its bandsare significantly sharper, and thus would be useful for deriv-ing more detailed information on exact composition of thenylon or its state of crystallinity. Figure 4 shows the FT-IR and Raman spectra of the materialforming the inside of an orange juice carton. From both theRaman spectrum and the principal bands in the FT-IR spec-trum, the film is easily recognized as polyethylene. Note thatthe FT-IR spectrum began at about 600 cm-l, the limitationdetermined by the detector and beam splitter of the system. Inthis example, the Raman spectrum starts at about 200 cm,and is determined by the properties of the notch filter (filtersallowing measurements to <50 cm-'are available). The bandsin the Raman spectrum below 600 cm' are recognizable asthose of rutile, one of the polymorphs of TiO,,and are not ac-cessible in standard benchtop mid-FT-IR systems. Note alsothat this Raman spectrum was recorded with the 785-nm laserin order to avoid the fluorescence in the sample. Figure 4. FT-IR (top) and Raman spectra (middle) of the inside layer ofan orange juice carton. The bottom spectrum was recorded from areference sample of TiO, rutile. Conclusions By combining the Raman and FT-IR microprobe capabilitieson a single instrument, the analyst has access to complete vi-brational spectroscopy information, while saving space andmonetary resources. SameSpot technology eliminates theneed for sample repositioning to acquire both spectra. Thereis no sacrifice in sensitivity or performance of either tech-nique, and the advantages of both are available. This technol-ogy will find usefulness in many fields of analysis, including,but not limited to, polymer and composite characterization,defect identification, pathology, forensic science, pharmaceu-ticals, paints, and pigments. 1. A.J. Sommer,"Mid-infrared Transmission Microscopy,"in Hand-book of Vibrational Spectroscopy, P. Griffiths and J. Chalmers,Eds. (John Wiley & Sons, New York, Vol. 2, 2002). 2. R.G. Messerschmidt,"Minimizing Optical Nonlinearities in In-frared Microspectrometry,"in Infrared Microspectroscopy, The-ory and Applications, R.G. Messerschmidt and M.A. Harthcock,Eds., (Marcel Dekker, New York, 1988). F. Adar,"Evolution and Revolution of Raman Instrumentation -Applications of Available Technologies to Spectroscopy andMicroscopy"in Handbook of Raman Spectroscopy, I.R. Lewisand H.G.M. Edwards, Eds. (Marcel Dekker, New York, 2001). 4. DIelhaye, M. and P. Dhamelincourt, J. Raman Spectrosc. 3,33-43 (1975). D. Clark, Pfizer Global R&D notebook (Sandwich Laboratories,United Kingdom, March, 1996). D. Clark, "Sample Preparation and Data Handling," abstractfrom Microspectrometry Applications Group meeting, (ReadingScientific Services Ltd., Reading, United Kingdom, May 1,1996). 7. D. Clark,"Recent Developments of Microspectroscopy,"pre-sented at Lab Show North (Manchester, United Kingdom,February, 1998). ■
确定


还剩2页未读,是否继续阅读?

产品配置单

HORIBA(中国)为您提供《材料等中红外光谱、拉曼光谱检测方案 》,该方案主要用于其他中红外光谱、拉曼光谱检测,参考标准--,《材料等中红外光谱、拉曼光谱检测方案 》用到的仪器有HORIBA XploRA Nano原子力-拉曼联用系统、HORIBA XploRA PLUS超快速拉曼成像光谱仪、HORIBA XploRA INV多功能拉曼及成像光谱仪
推荐专场


相关方案
更多
该厂商其他方案
更多