


方案详情
文
The Raman spectra of elemental carbon materials are known to be sensitive to polymorphy. For hard carbon films, the spectra of amorphous and diamond-like carbons can be band-fit to separate the contributions of the "graphitic carbon" (G band) from the "disordered carbon" (D band). The spectral behaviour of carbon films has been empirically correlated with thin film physical properties such as hardness, durability, optical transparency, electrical conductivity, thermal conductivity and corrosion resistance, and can be of
use for prediction of these properties without extensive alternative testing.
方案详情

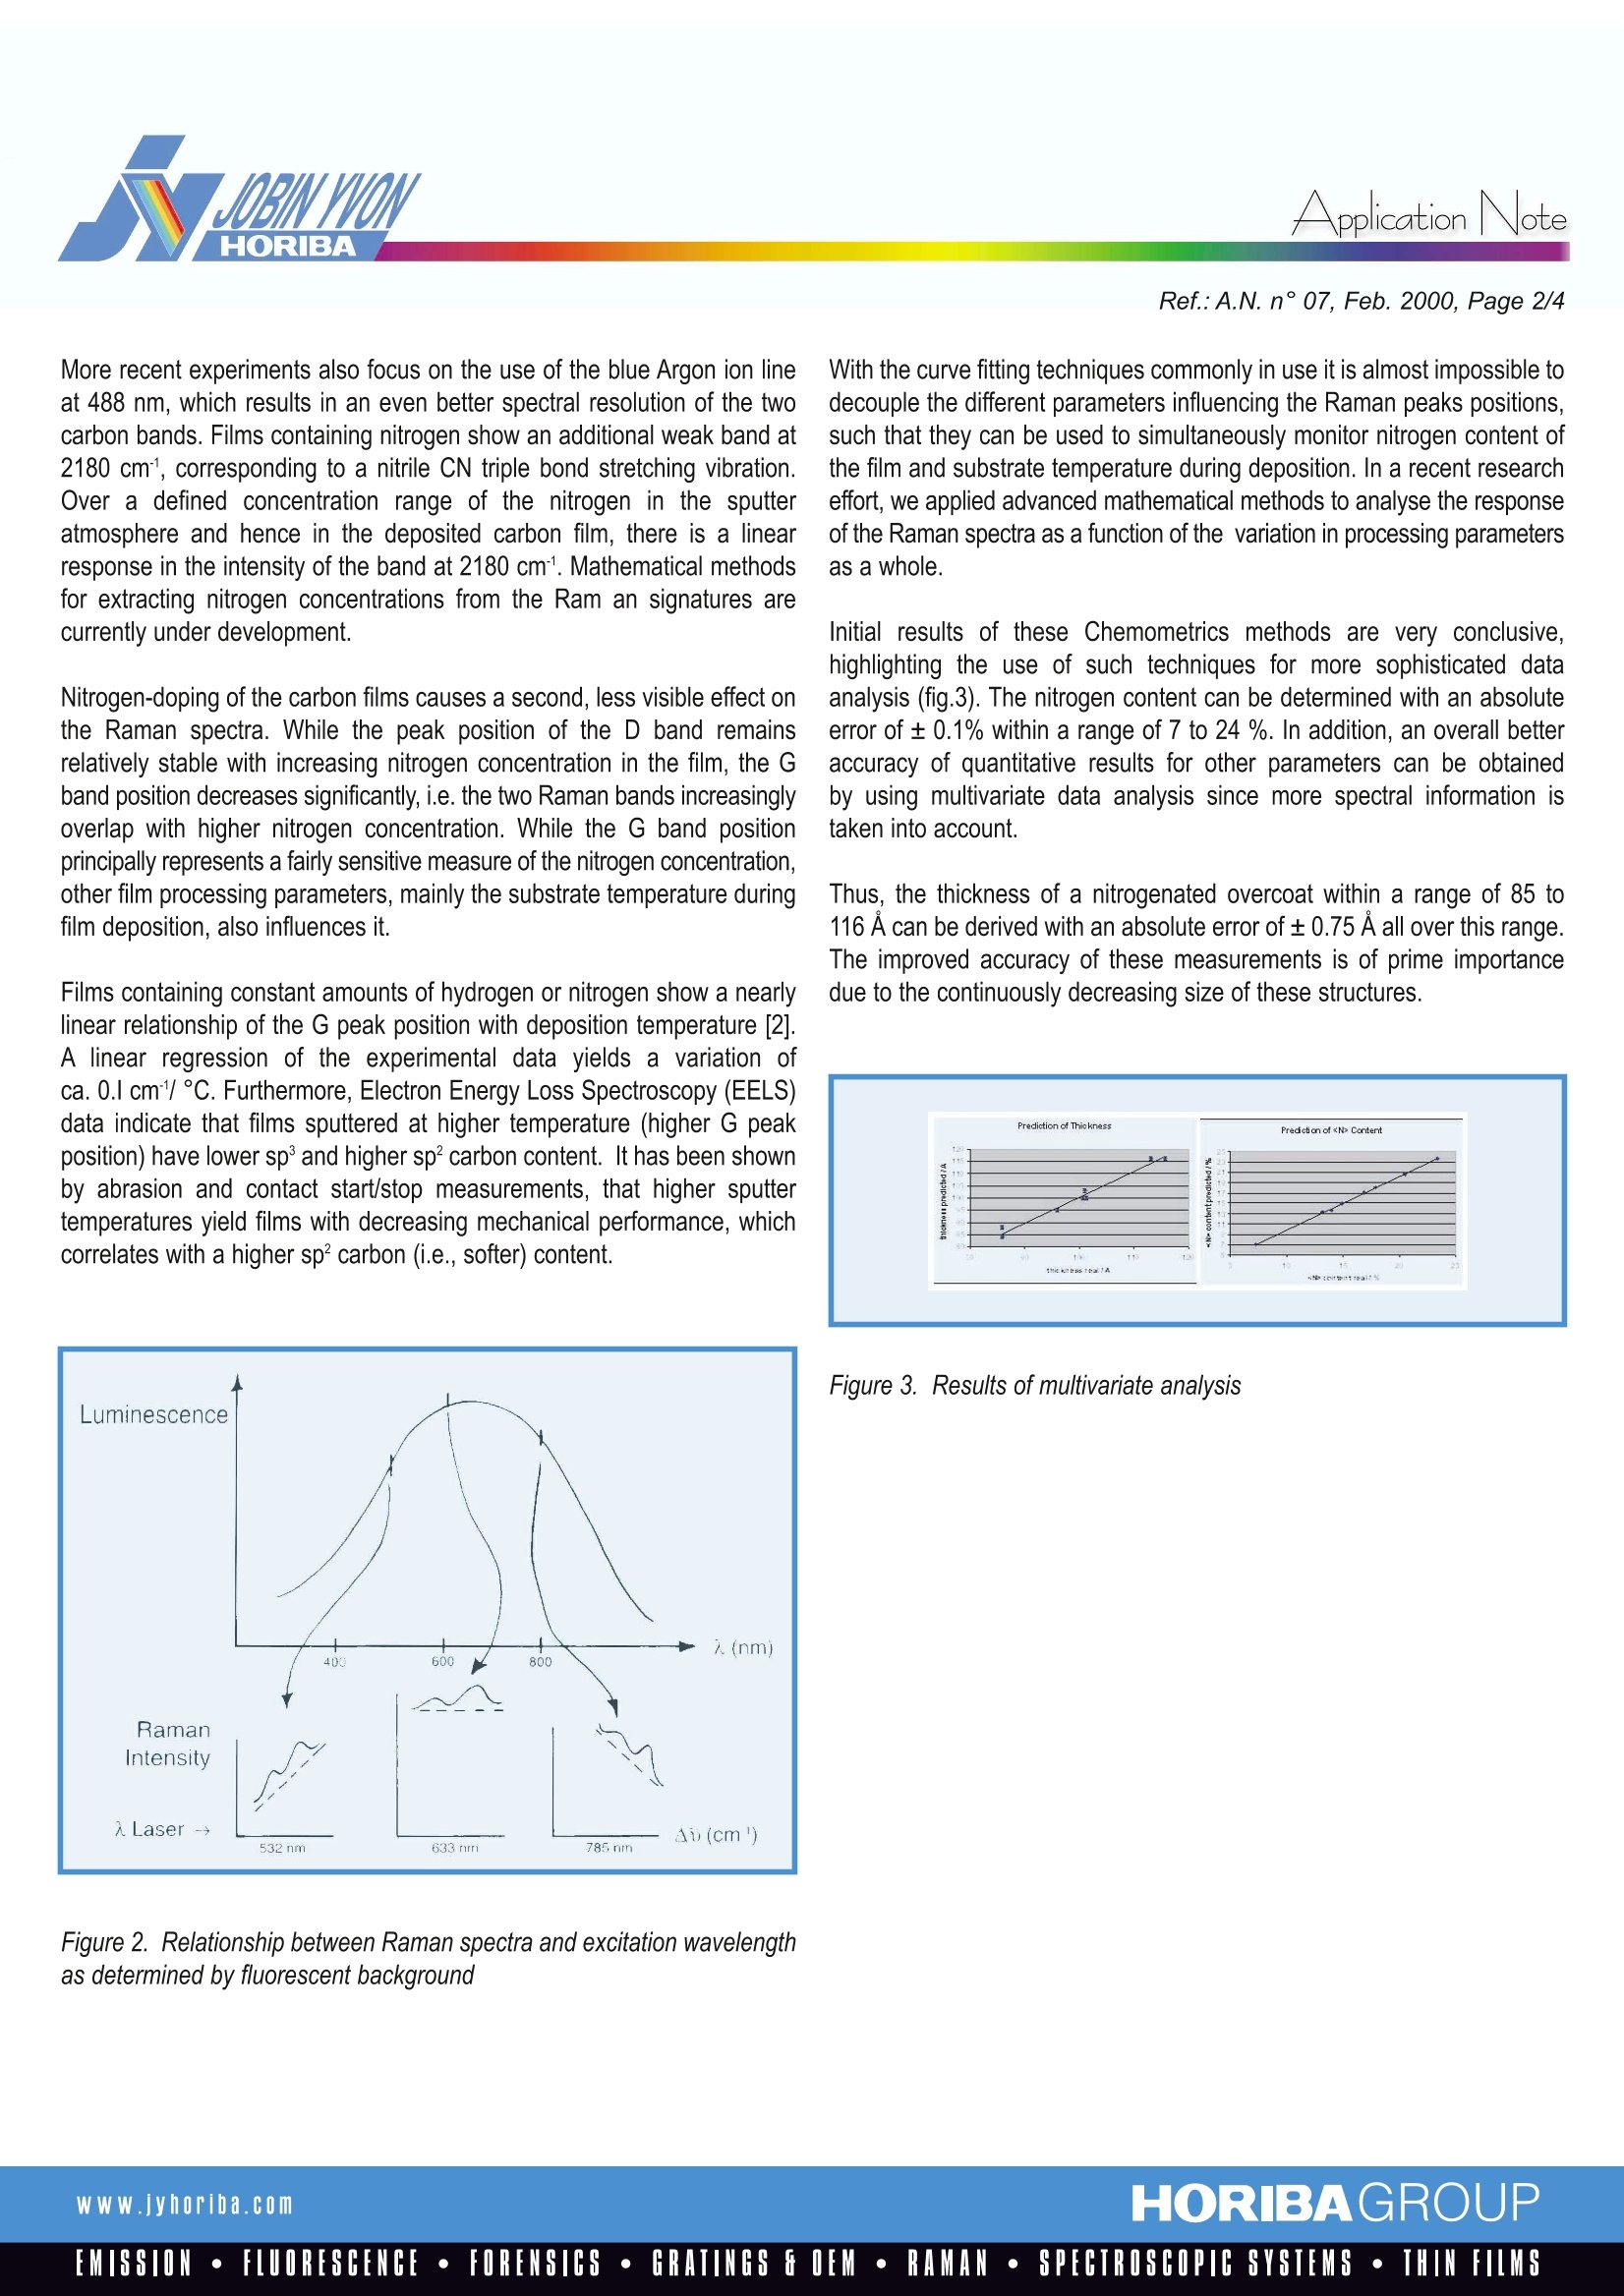
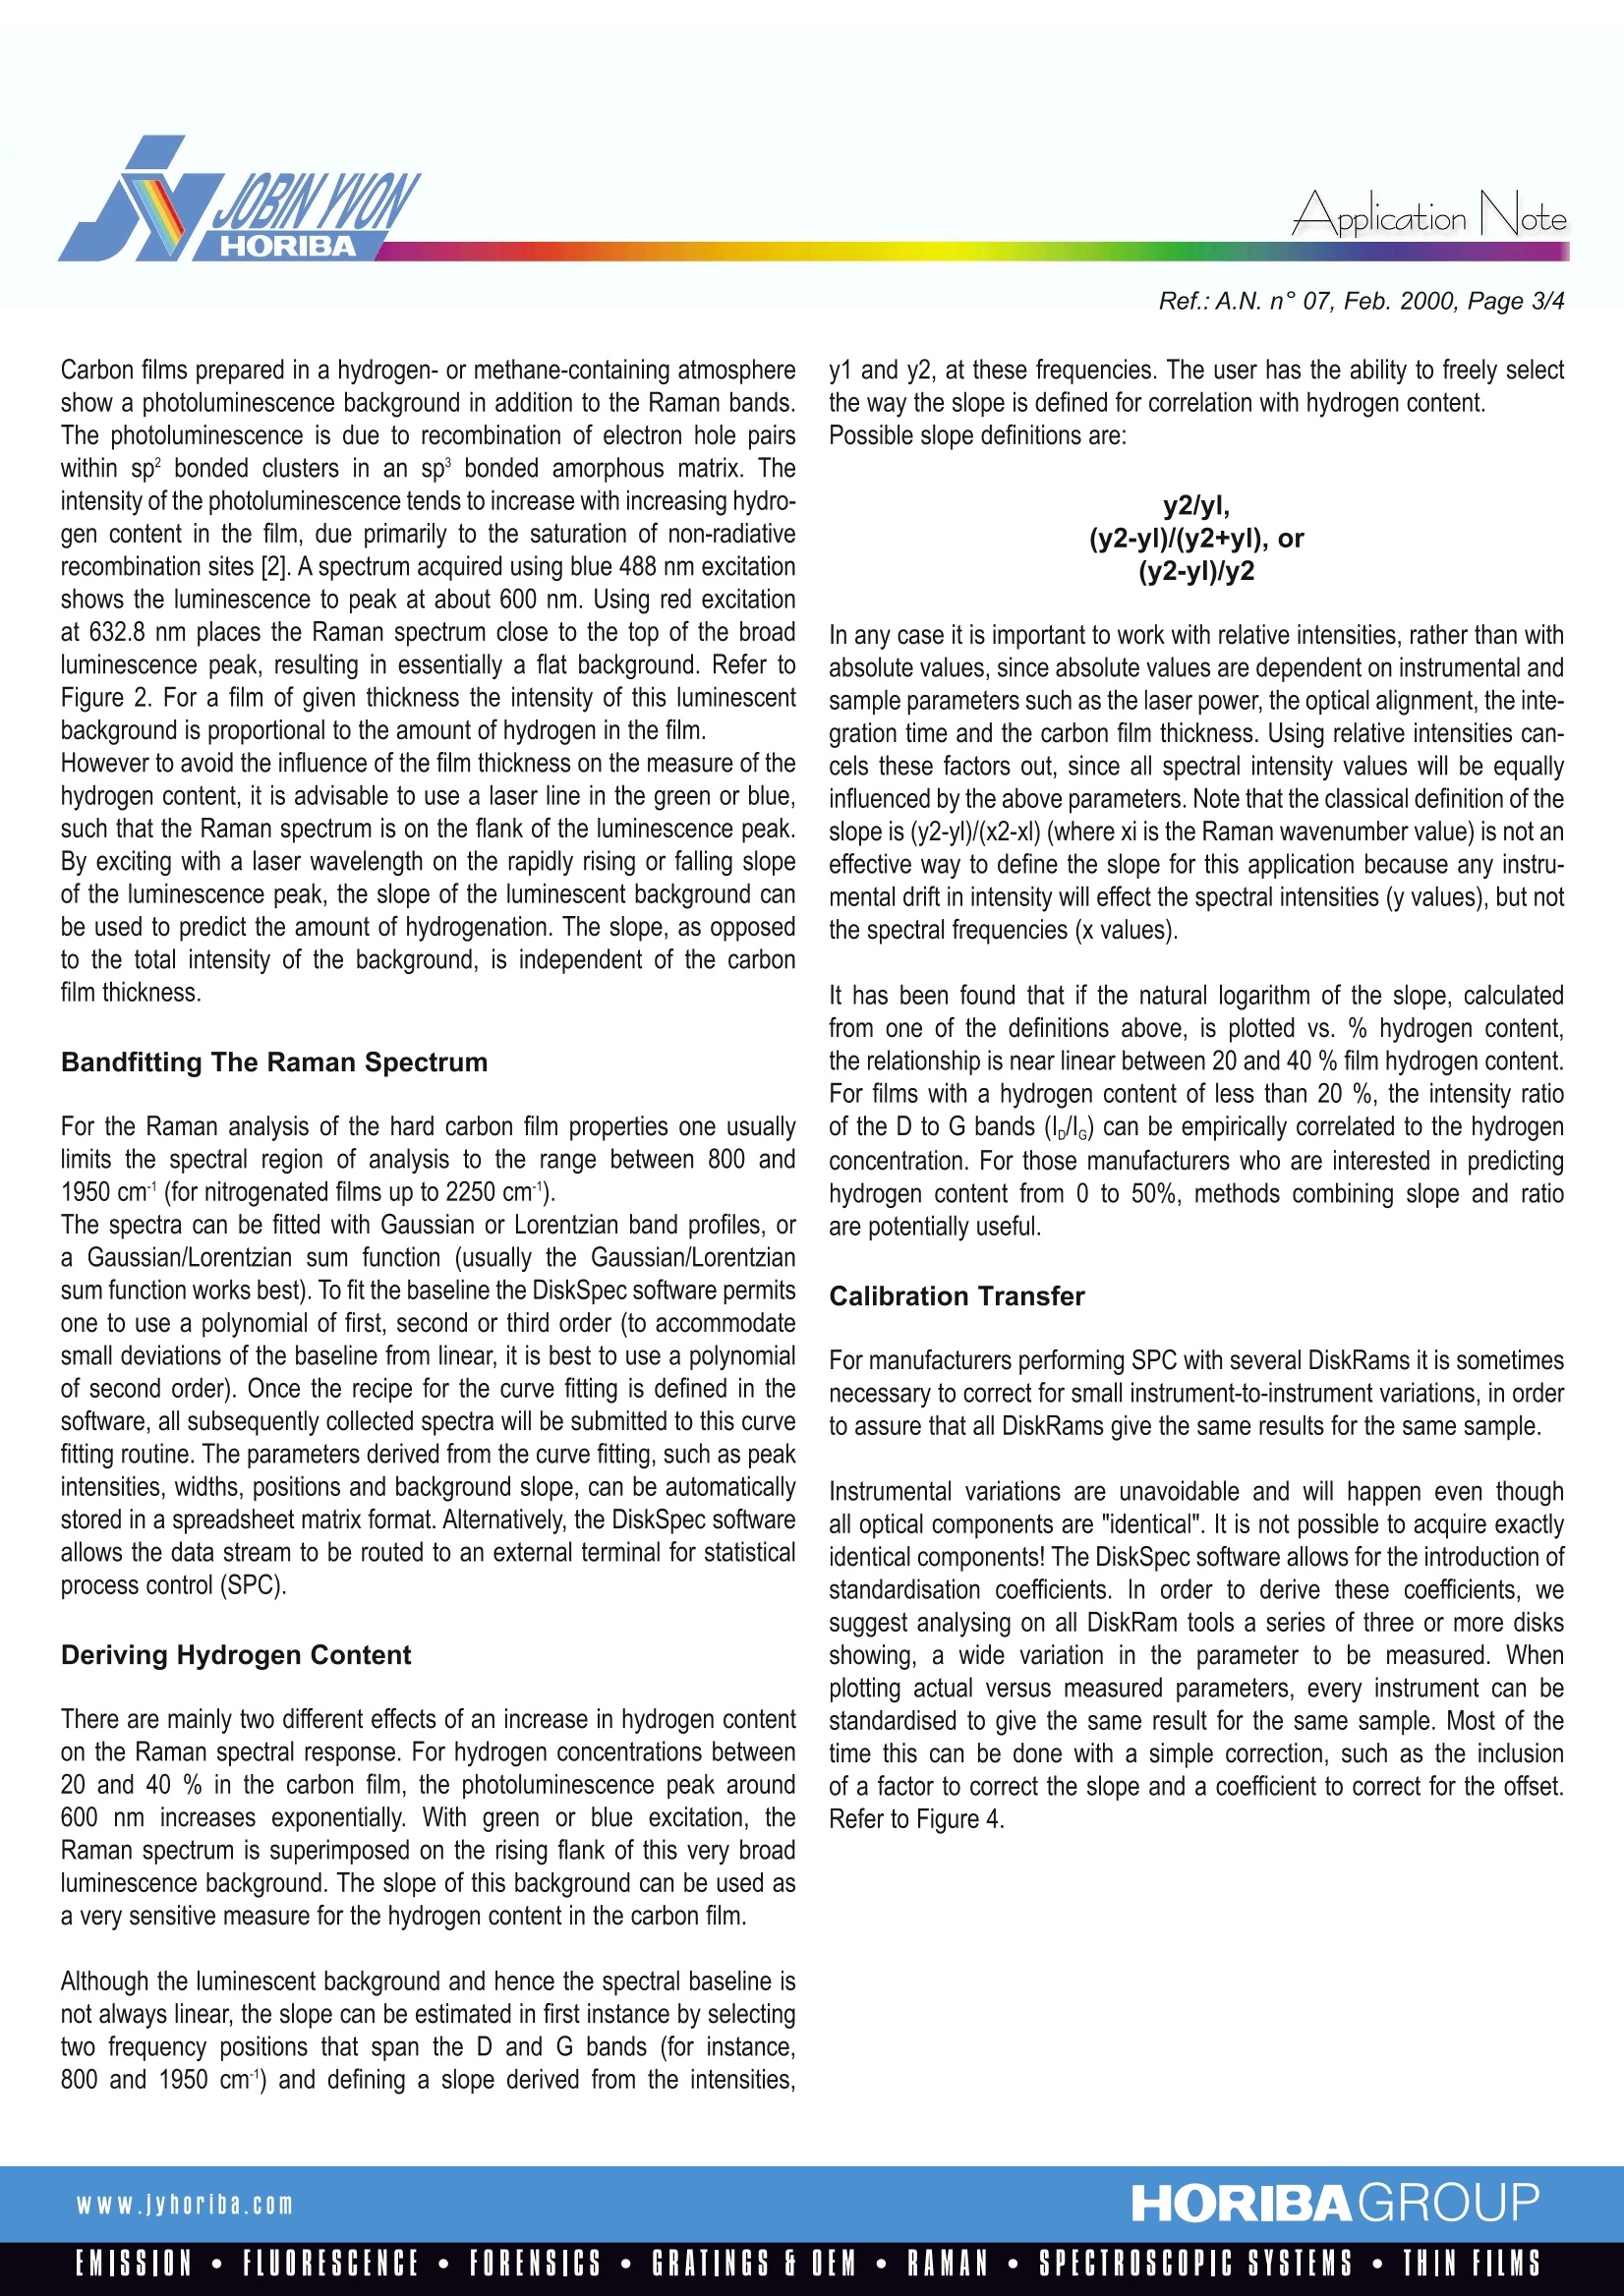
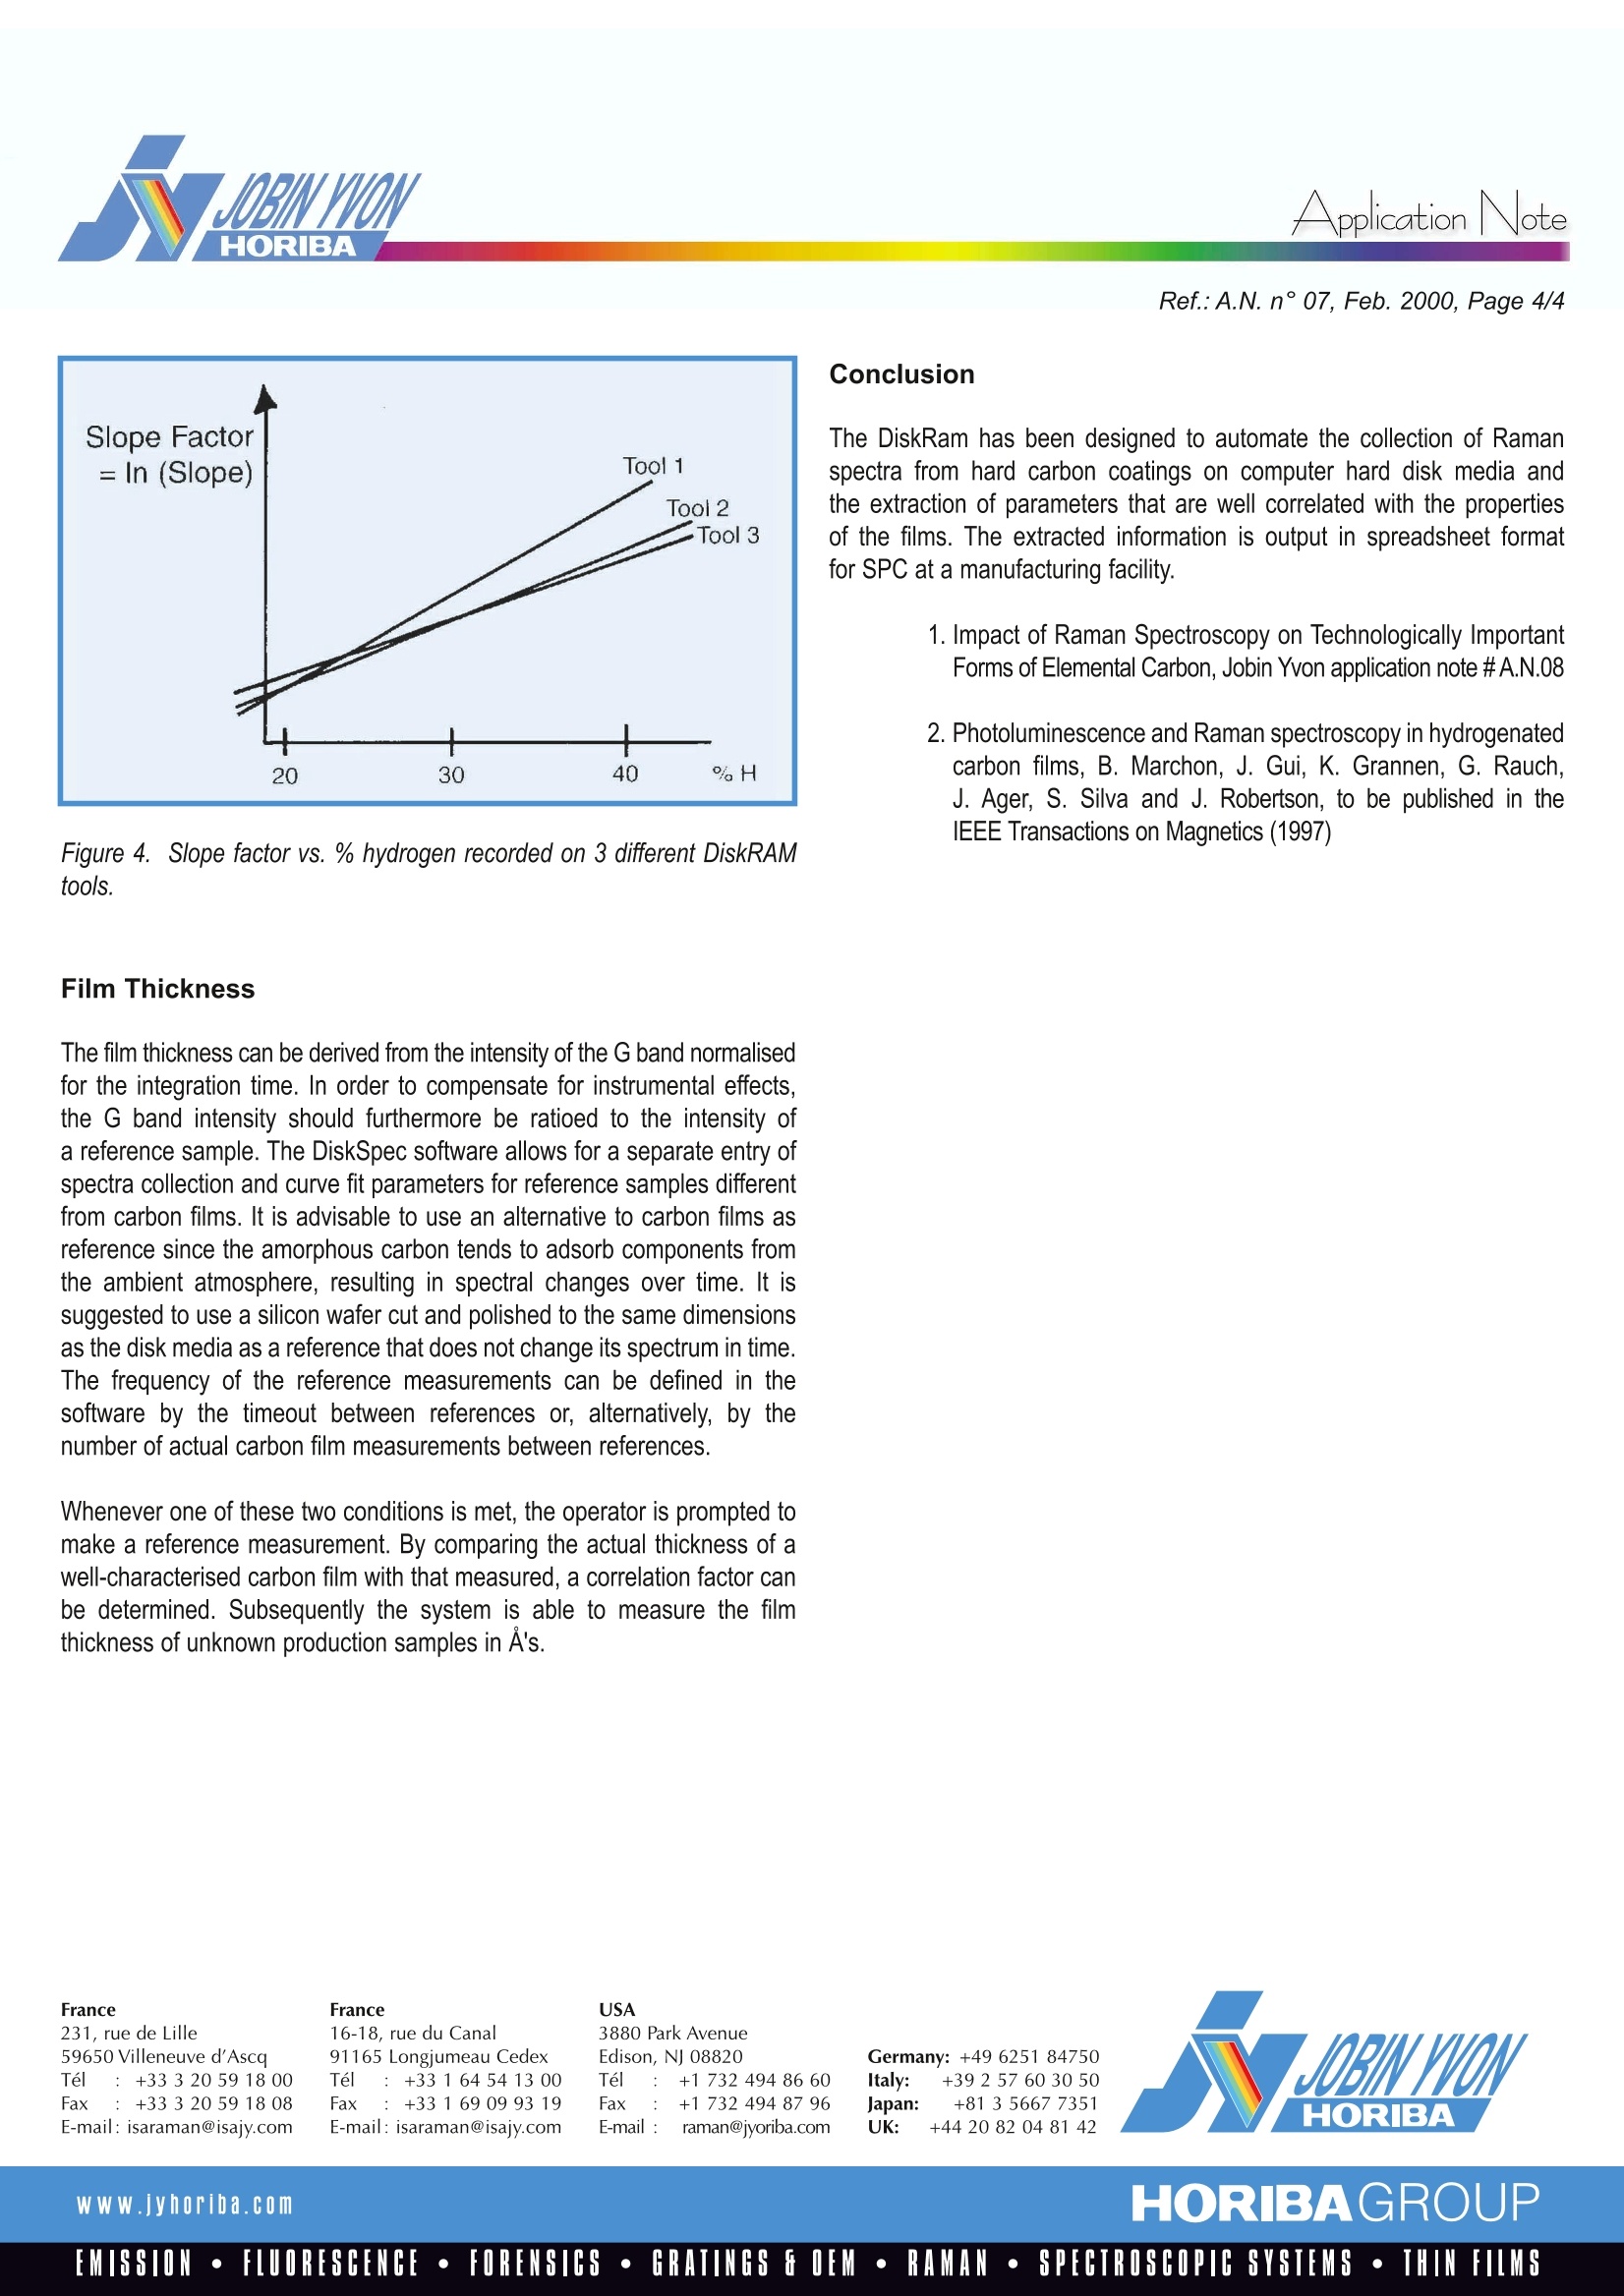
RamanlSpectroscopyApplication Note Application NoteRef.:A.N. n°07, Feb.2000, Page 2/4 Derivation of Physical Parameters from Raman Spectraof Hard Carbon Films Introduction The Raman spectra of elemental carbon materials are known to be sensitiveto polymorphy. For hard carbon films, the spectra of amorphous anddiamond-like carbons can be band-fit to separate the contributions of the"graphitic carbon" (G band) from the "disordered carbon" (D band). Figure 1shows a typical spectrum of a hard carbon film. The spectral behaviourof carbon films has been empirically correlated with thin film physicalproperties such as hardness, durability, optical transparency, electricalconductivity, thermal conductivity and corrosion resistance, and can be ofuse for prediction of these properties without extensive alternative testing. In recent years the computer hard disc manufacturing industry hasimplemented hard carbon coatings on all disc media as a means ofprotecting the magnetic media with hard, non-brittle films. The coatingsprovide wear protection against head sliders repeatedly dragging andslapping on the disk surface during the start and stop cycles of normaloperation. Usually the coatings contain some amount of hydrogen which is addedto improve the corrosion protection of the underlying magnetic layer,to increase the film hardness for improved wear resistance, and to optimiseinteraction with the lubricants in order to eliminate friction problems. Newfilms under development often contain nitrogen as well in order to reducethe surface resistivity and hence static charging without compromisingfilm hardness. Combinations of hydrogen and nitrogen in the layers canimprove the compatibility of the magnetic data storage media with differenttypes of read/write heads. The DiskRam has been engineered to facilitate and significantly acceleratethe acquisition of the Raman spectra of hard carbon overcoats on diskmedia. Subsequent data reduction automates the derivation of the physicalproperties of interest. Curve-fitting the spectrum with two carbon bands(the D and G bands), additional nitrogen bands if required, and a baselineachieves these goals. The methodology used for the spectral reductionwill be reviewed in this note. Figure 1. Raman spectrum of Carbon Film recorded and band-fit on theDiskRAM Description Of Raman Spectra The Raman spectrum of an amorphous pure, carbon film (as well as filmsdoped with hydrogen and/or nitrogen) is composed of the D and G bandssitting on top of a broad luminescent baseline. The G band usually occurs between 1480 and 1580 cm, while the D bandposition appears between 1320 and 1440 cm. The bands are usuallyoverlapping and the actual positions are to some degree dependent on thelaser excitation wavelength. Using red excitation such as 632.8 nmof the Helium Neon laser results ina smaller separation of the two spectral components and consequently inmore ambiguity of the curve fit result. To increase the spectral separationof the D and G bands, it is common to use an excitation wavelength in thegreen. For this the 532 nm line of a diode-pumped, frequency-doubled,NdYag laser or the 514.5 nm line of an Argon ion gas laser are employed.The NdYag laser is the more energy efficient of the two lasers and can berun without external cooling fans. This can be a valuable feature, whencleanroom compatibility is of importance. More recent experiments also focus on the use of the blue Argon ion lineat 488 nm, which results in an even better spectral resolution of the twocarbon bands. Films containing nitrogen show an additional weak band at2180 cm, corresponding to a nitrile CN triple bond stretching vibration.Over a defined concentration range of the nitrogen in the sputteratmosphere and hence in the deposited carbon film, there is a linearresponse in the intensity of the band at 2180 cm1. Mathematical methodsfor extracting nitrogen concentrations from the Ram an signatures arecurrently under development. Nitrogen-doping of the carbon films causes a second, less visible effect onthe Raman spectra. While the peak position of the D band remainsrelatively stable with increasing nitrogen concentration in the film, the Gband position decreases significantly, i.e. the two Raman bands increasinglyoverlap with higher nitrogen concentration. While the G band positionprincipally represents a fairly sensitive measure of the nitrogen concentration,other film processing parameters, mainly the substrate temperature duringfilm deposition, also influences it. Films containing constant amounts of hydrogen or nitrogen show a nearlylinear relationship of the G peak position with deposition temperature [2].A linear regression of the experimental data yields a variation ofca. 0.I cm/ C. Furthermore, Electron Energy Loss Spectroscopy (EELS)data indicate that films sputtered at higher temperature (higher G peakposition) have lower sp and higher sp²carbon content. It has been shownby abrasion and contact start/stop measurements, that higher sputtertemperatures yield films with decreasing mechanical performance, whichcorrelates with a higher sp carbon (i.e., softer) content. Figure 2. Relationship between Raman spectra and excitation wavelengthas determined by fluorescent background With the curve fitting techniques commonly in use it is almost impossible todecouple the different parameters influencing the Raman peaks positions,such that they can be used to simultaneously monitor nitrogen content ofthe film and substrate temperature during deposition. In a recent researcheffort, we applied advanced mathematical methods to analyse the responseof the Raman spectra as a function of the variation in processing parametersas a whole. Initial results of these Chemometrics methods are very conclusive,highlighting the use of such techniques for more sophisticated dataanalysis (fig.3). The nitrogen content can be determined with an absoluteerror of±0.1% within a range of 7 to 24 %. In addition, an overall betteraccuracy of quantitative results for other parameters can be obtainedby using multivariate data analysis since more spectral information istaken into account. Thus, the thickness of a nitrogenated overcoat within a range of 85 to116 A can be derived with an absolute error of ±0.75 A all over this range.The improved accuracy of these measurements is of prime importancedue to the continuously decreasing size of these structures. Figure 3. Results of multivariate analysis Carbon films prepared in a hydrogen- or methane-containing atmosphereshow a photoluminescence background in addition to the Raman bands.The photoluminescence is due to recombination of electron hole pairswithin sp bonded clusters in an sp bonded amorphous matrix. Theintensity of the photoluminescence tends to increase with increasing hydro-gen content in the film, due primarily to the saturation of non-radiativerecombination sites [2]. A spectrum acquired using blue 488 nm excitationshows the luminescence to peak at about 600 nm. Using red excitationat 632.8 nm places the Raman spectrum close to the top of the broadluminescence peak, resulting in essentially a flat background. Refer toFigure 2. For a film of given thickness the intensity of this luminescentbackground is proportional to the amount of hydrogen in the film. However to avoid the influence of the film thickness on the measure of thehydrogen content, it is advisable to use a laser line in the green or blue,such that the Raman spectrum is on the flank of the luminescence peak.By exciting with a laser wavelength on the rapidly rising or falling slopeof the luminescence peak, the slope of the luminescent background canbe used to predict the amount of hydrogenation. The slope, as opposedto the total intensity of the background, is independent of the carbonfilm thickness. Bandfitting The Raman Spectrum For the Raman analysis of the hard carbon film properties one usuallylimits the spectral region of analysis to the range between 800 and1950 cm (for nitrogenated films up to 2250 cm). The spectra can be fitted with Gaussian or Lorentzian band profiles, ora Gaussian/Lorentzian sum function (usually the Gaussian/Lorentziansum function works best). To fit the baseline the DiskSpec software permitsone to use a polynomial of first, second or third order (to accommodatesmall deviations of the baseline from linear, it is best to use a polynomialof second order). Once the recipe for the curve fitting is defined in thesoftware, all subsequently collected spectra will be submitted to this curvefitting routine. The parameters derived from the curve fitting, such as peakintensities, widths, positions and background slope, can be automaticallystored in a spreadsheet matrix format. Alternatively, the DiskSpec softwareallows the data stream to be routed to an external terminal for statisticalprocess control (SPC). Deriving Hydrogen Content There are mainly two different effects of an increase in hydrogen contenton the Raman spectral response. For hydrogen concentrations between20 and 40 % in the carbon film, the photoluminescence peak around600 nm increases exponentially. With green or blue excitation, theRaman spectrum is superimposed on the rising flank of this very broadluminescence background. The slope of this background can be used asa very sensitive measure for the hydrogen content in the carbon film. Although the luminescent background and hence the spectral baseline isnot always linear, the slope can be estimated in first instance by selectingtwo frequency positions that span the D and G bands (for instance,800 and 1950 cm1) and defining a slope derived from the intensities, y1 and y2, at these frequencies. The user has the ability to freely selectthe way the slope is defined for correlation with hydrogen content.Possible slope definitions are: In any case it is important to work with relative intensities, rather than withabsolute values, since absolute values are dependent on instrumental andsample parameters such as the laser power, the optical alignment, the inte-gration time and the carbon film thickness. Using relative intensities can-cels these factors out, since all spectral intensity values will be equallyinfluenced by the above parameters. Note that the classical definition of theslope is (y2-yl)/(x2-xl) (where xi is the Raman wavenumber value) is not aneffective way to define the slope for this application because any instru-mental drift in intensity will effect the spectral intensities (y values), but notthe spectral frequencies (x values). It has been found that if the natural logarithm of the slope, calculatedfrom one of the definitions above, is plotted vs. % hydrogen content,the relationship is near linear between 20 and 40 % film hydrogen content.For films with a hydrogen content of less than 20 %, the intensity ratioof the D to G bands (Ie) can be empirically correlated to the hydrogenconcentration. For those manufacturers who are interested in predictinghydrogen content from 0 to 50%, methods combining slope and ratioare potentially useful. Calibration Transfer For manufacturers performing SPC with several DiskRams it is sometimesnecessary to correct for small instrument-to-instrument variations, in orderto assure that all DiskRams give the same results for the same sample. Instrumental variations are unavoidable and will happen even thoughall optical components are "identical". It is not possible to acquire exactlyidentical components! The DiskSpec software allows for the introduction ofstandardisation coefficients. In order to derive these coefficients, wesuggest analysing on all DiskRam tools a series of three or more disksshowing, a wide variation in the parameter to be measured. Whenplotting actual versus measured parameters, every instrument can bestandardised to give the same result for the same sample. Most of thetime this can be done with a simple correction, such as the inclusionof a factor to correct the slope and a coefficient to correct for the offset.Refer to Figure 4. Conclusion The DiskRam has been designed to automate the collection of Ramanspectra from hard carbon coatings on computer hard disk media andthe extraction of parameters that are well correlated with the propertiesof the films. The extracted information is output in spreadsheet formatfor SPC at a manufacturing facility. 1. Impact of Raman Spectroscopy on Technologically ImportantForms of Elemental Carbon, Jobin Yvon application note #A.N.08 2. Photoluminescence and Raman spectroscopy in hydrogenatedcarbon films, B. Marchon, J. Gui, K. Grannen, G. Rauch,J. Ager, S. Silva and J. Robertson, to be published in theIEEE Transactions on Magnetics (1997) Figure 4. Slope factor vs. % hydrogen recorded on 3 different DiskRAMtools. Film Thickness The film thickness can be derived from the intensity of the G band normalisedfor the integration time. In order to compensate for instrumental effects,the G band intensity should furthermore be ratioed to the intensity ofa reference sample. The DiskSpec software allows for a separate entry ofspectra collection and curve fit parameters for reference samples differentfrom carbon films. It is advisable to use an alternative to carbon films asreference since the amorphous carbon tends to adsorb components fromthe ambient atmosphere, resulting in spectral changes over time. It issuggested to use a silicon wafer cut and polished to the same dimensionsas the disk media as a reference that does not change its spectrum in time.The frequency of the reference measurements can be defined in thesoftware by the timeout between references or, alternatively, by thenumber of actual carbon film measurements between references. Whenever one of these two conditions is met, the operator is prompted tomake a reference measurement. By comparing the actual thickness of awell-characterised carbon film with that measured. a correlation factor canbe determined. Subsequently the system is able to measure the filmthickness of unknown production samples in A's. France231, rue de Lille59650 Villeneuve d'AscqTel :+33320591800Fax : +333 20 59 18 08E-mail: isaraman@isajy.com France16-18, rue du Canal91165 Longjumeau CedexTel : +33 164541300Fax : +33 1 69 09 93 19E-mail: isaraman@isajy.com 3880 Park AvenueEdison, NJ 08820Tel :+1 732 4948660Fax: : +1 732 494 87 96E-mail : raman@jyoriba.com Germany: +49 625184750Italy: +39 2 57 603050Japan: +81 3 5667 7351UK: +44 20820481 42 HORIBAGROUPwWW.jyhoriba.comEMISSION·FLUORESCENCE· FORENSICS· GRATINGS E OEM·RAMAN·SPECTROSCOPIC SYSTEMS· THIN FILMS
确定
还剩2页未读,是否继续阅读?

产品配置单
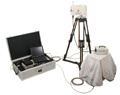
HORIBA(中国)为您提供《Derivation of Physical Parameters from Raman Spectra》,该方案主要用于其他中--检测,参考标准--,《Derivation of Physical Parameters from Raman Spectra》用到的仪器有HORIBA HE科研级便携拉曼光谱仪
推荐专场


相关方案
更多
该厂商其他方案
更多