


方案详情
文
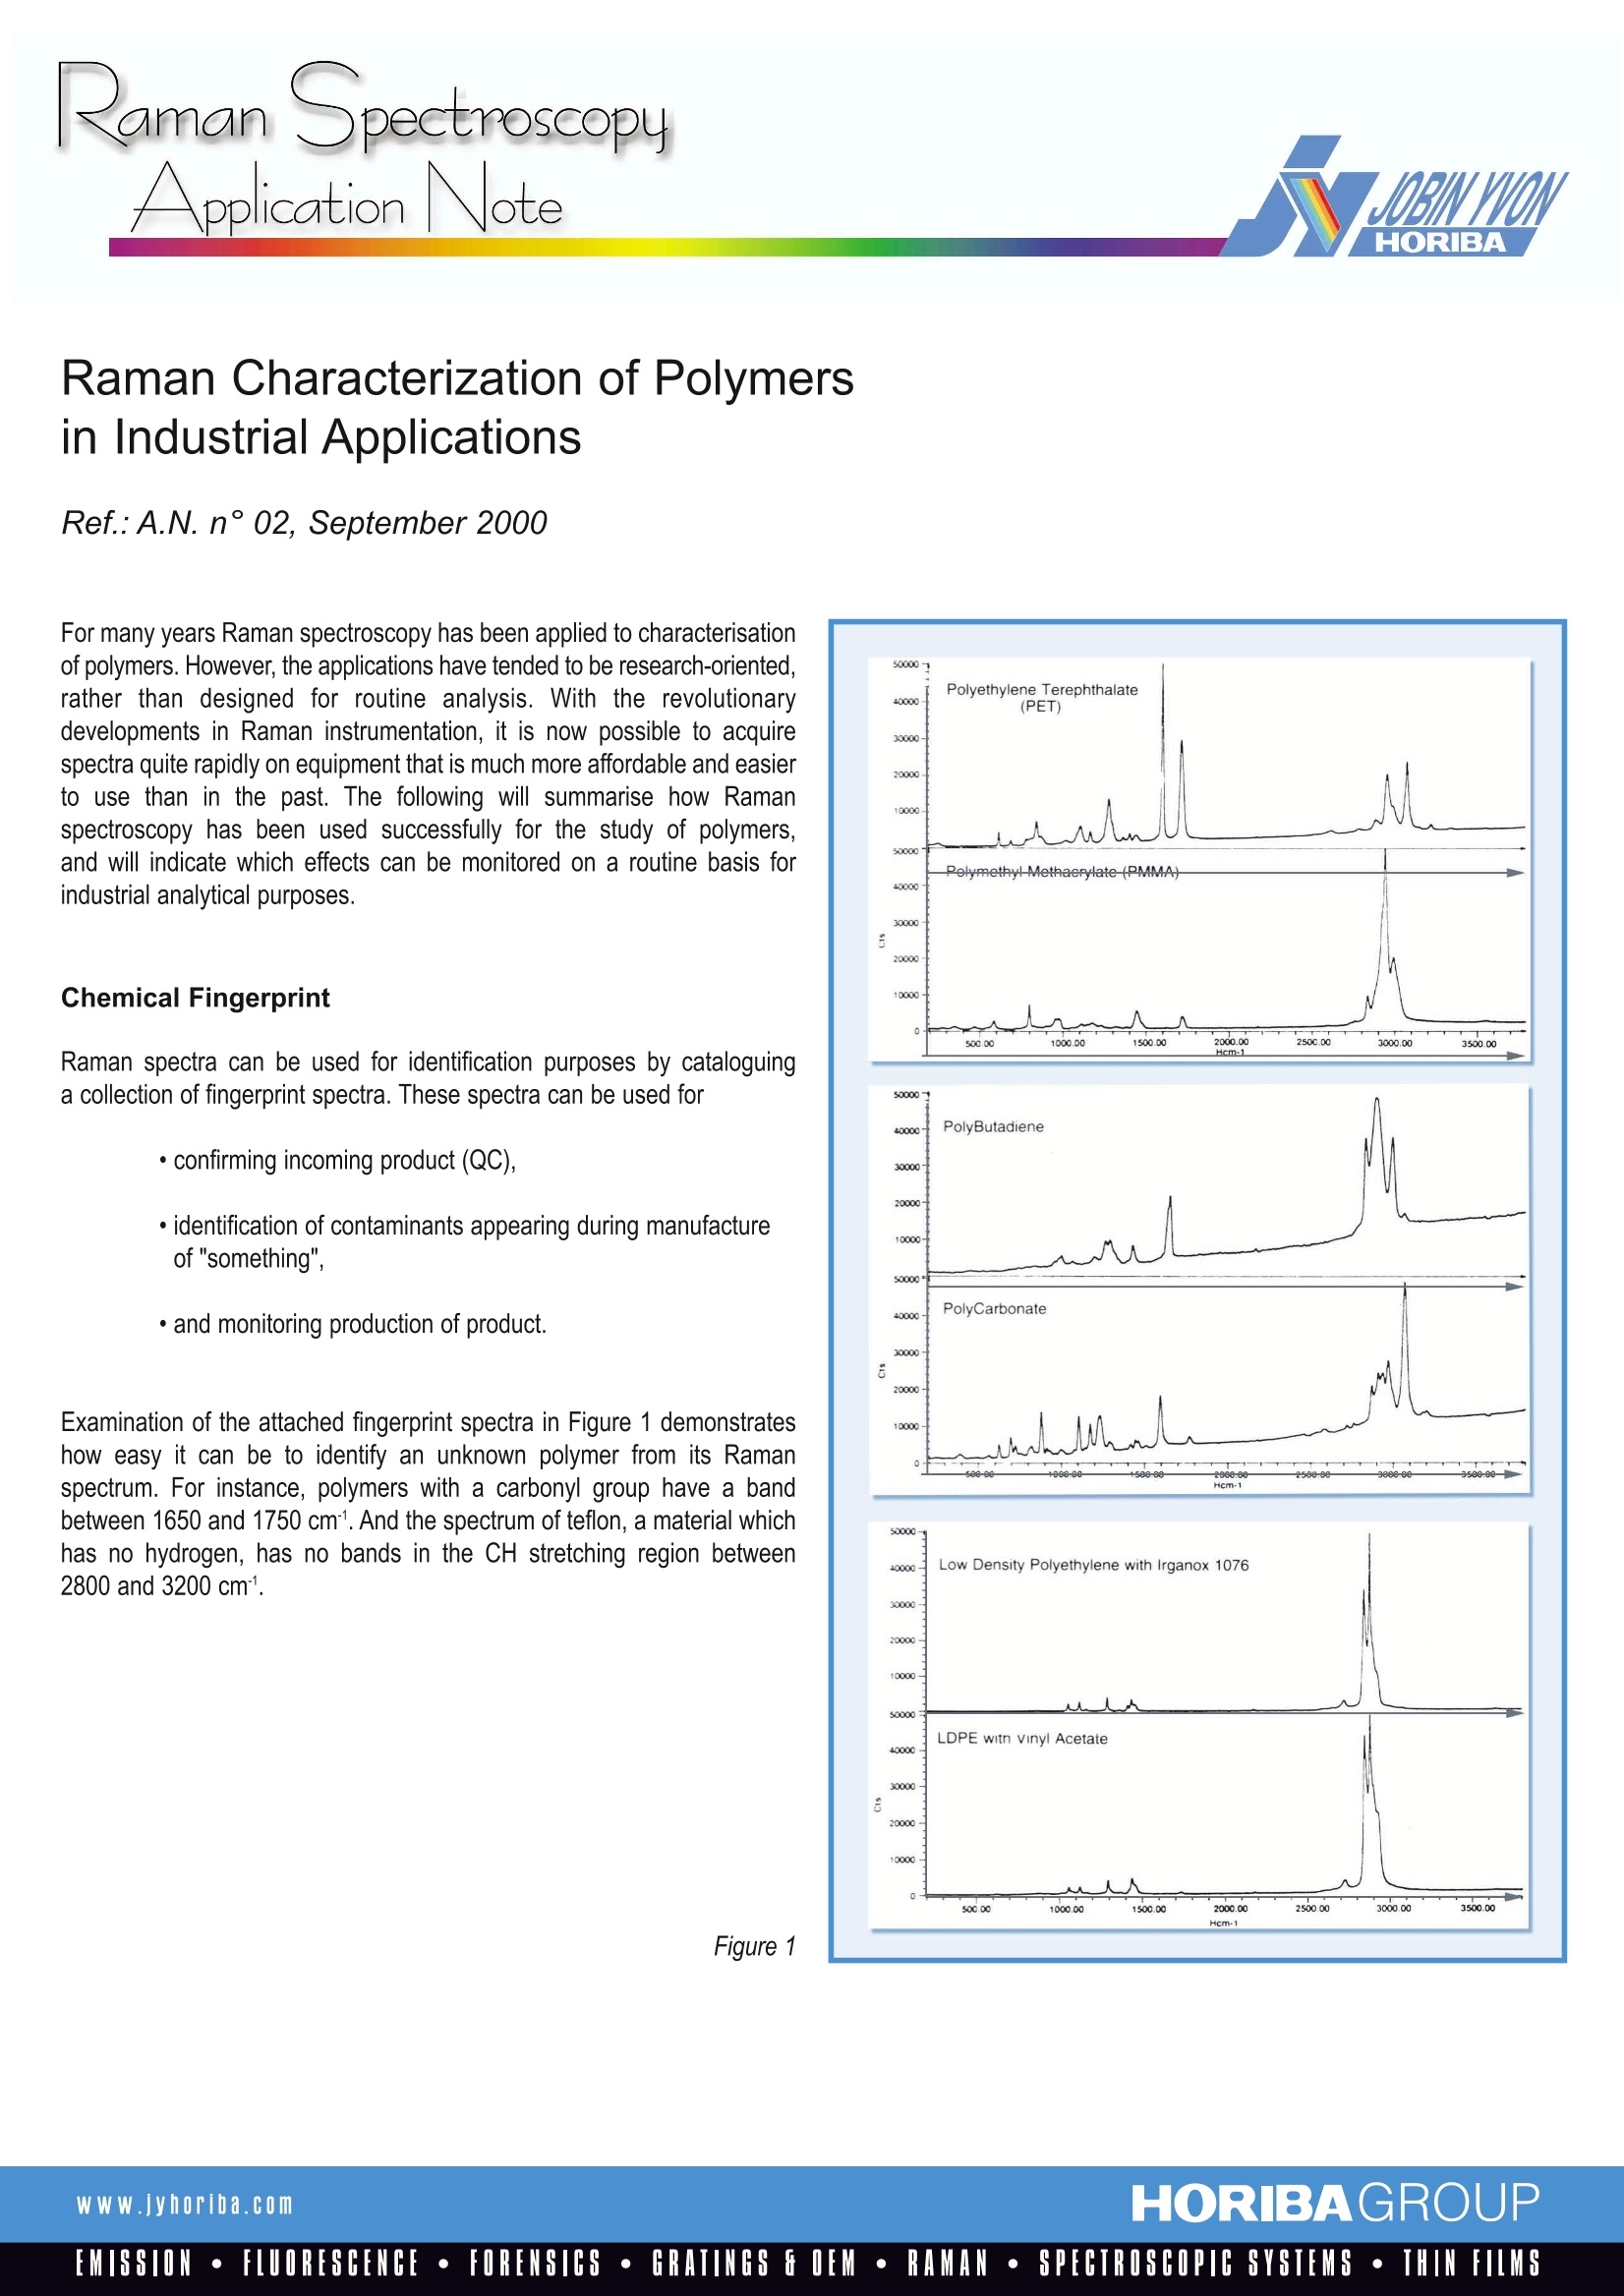
For many years Raman spectroscopy has been applied to characterisation
of polymers. However, the applications have tended to be research-oriented,
rather than designed for routine analysis. With the revolutionary
developments in Raman instrumentation, it is now possible to acquire
spectra quite rapidly on equipment that is much more affordable and easier
to use than in the past. The following will summarise how Raman
spectroscopy has been used successfully for the study of polymers,
and will indicate which effects can be monitored on a routine basis for
industrial analytical purposes.
方案详情

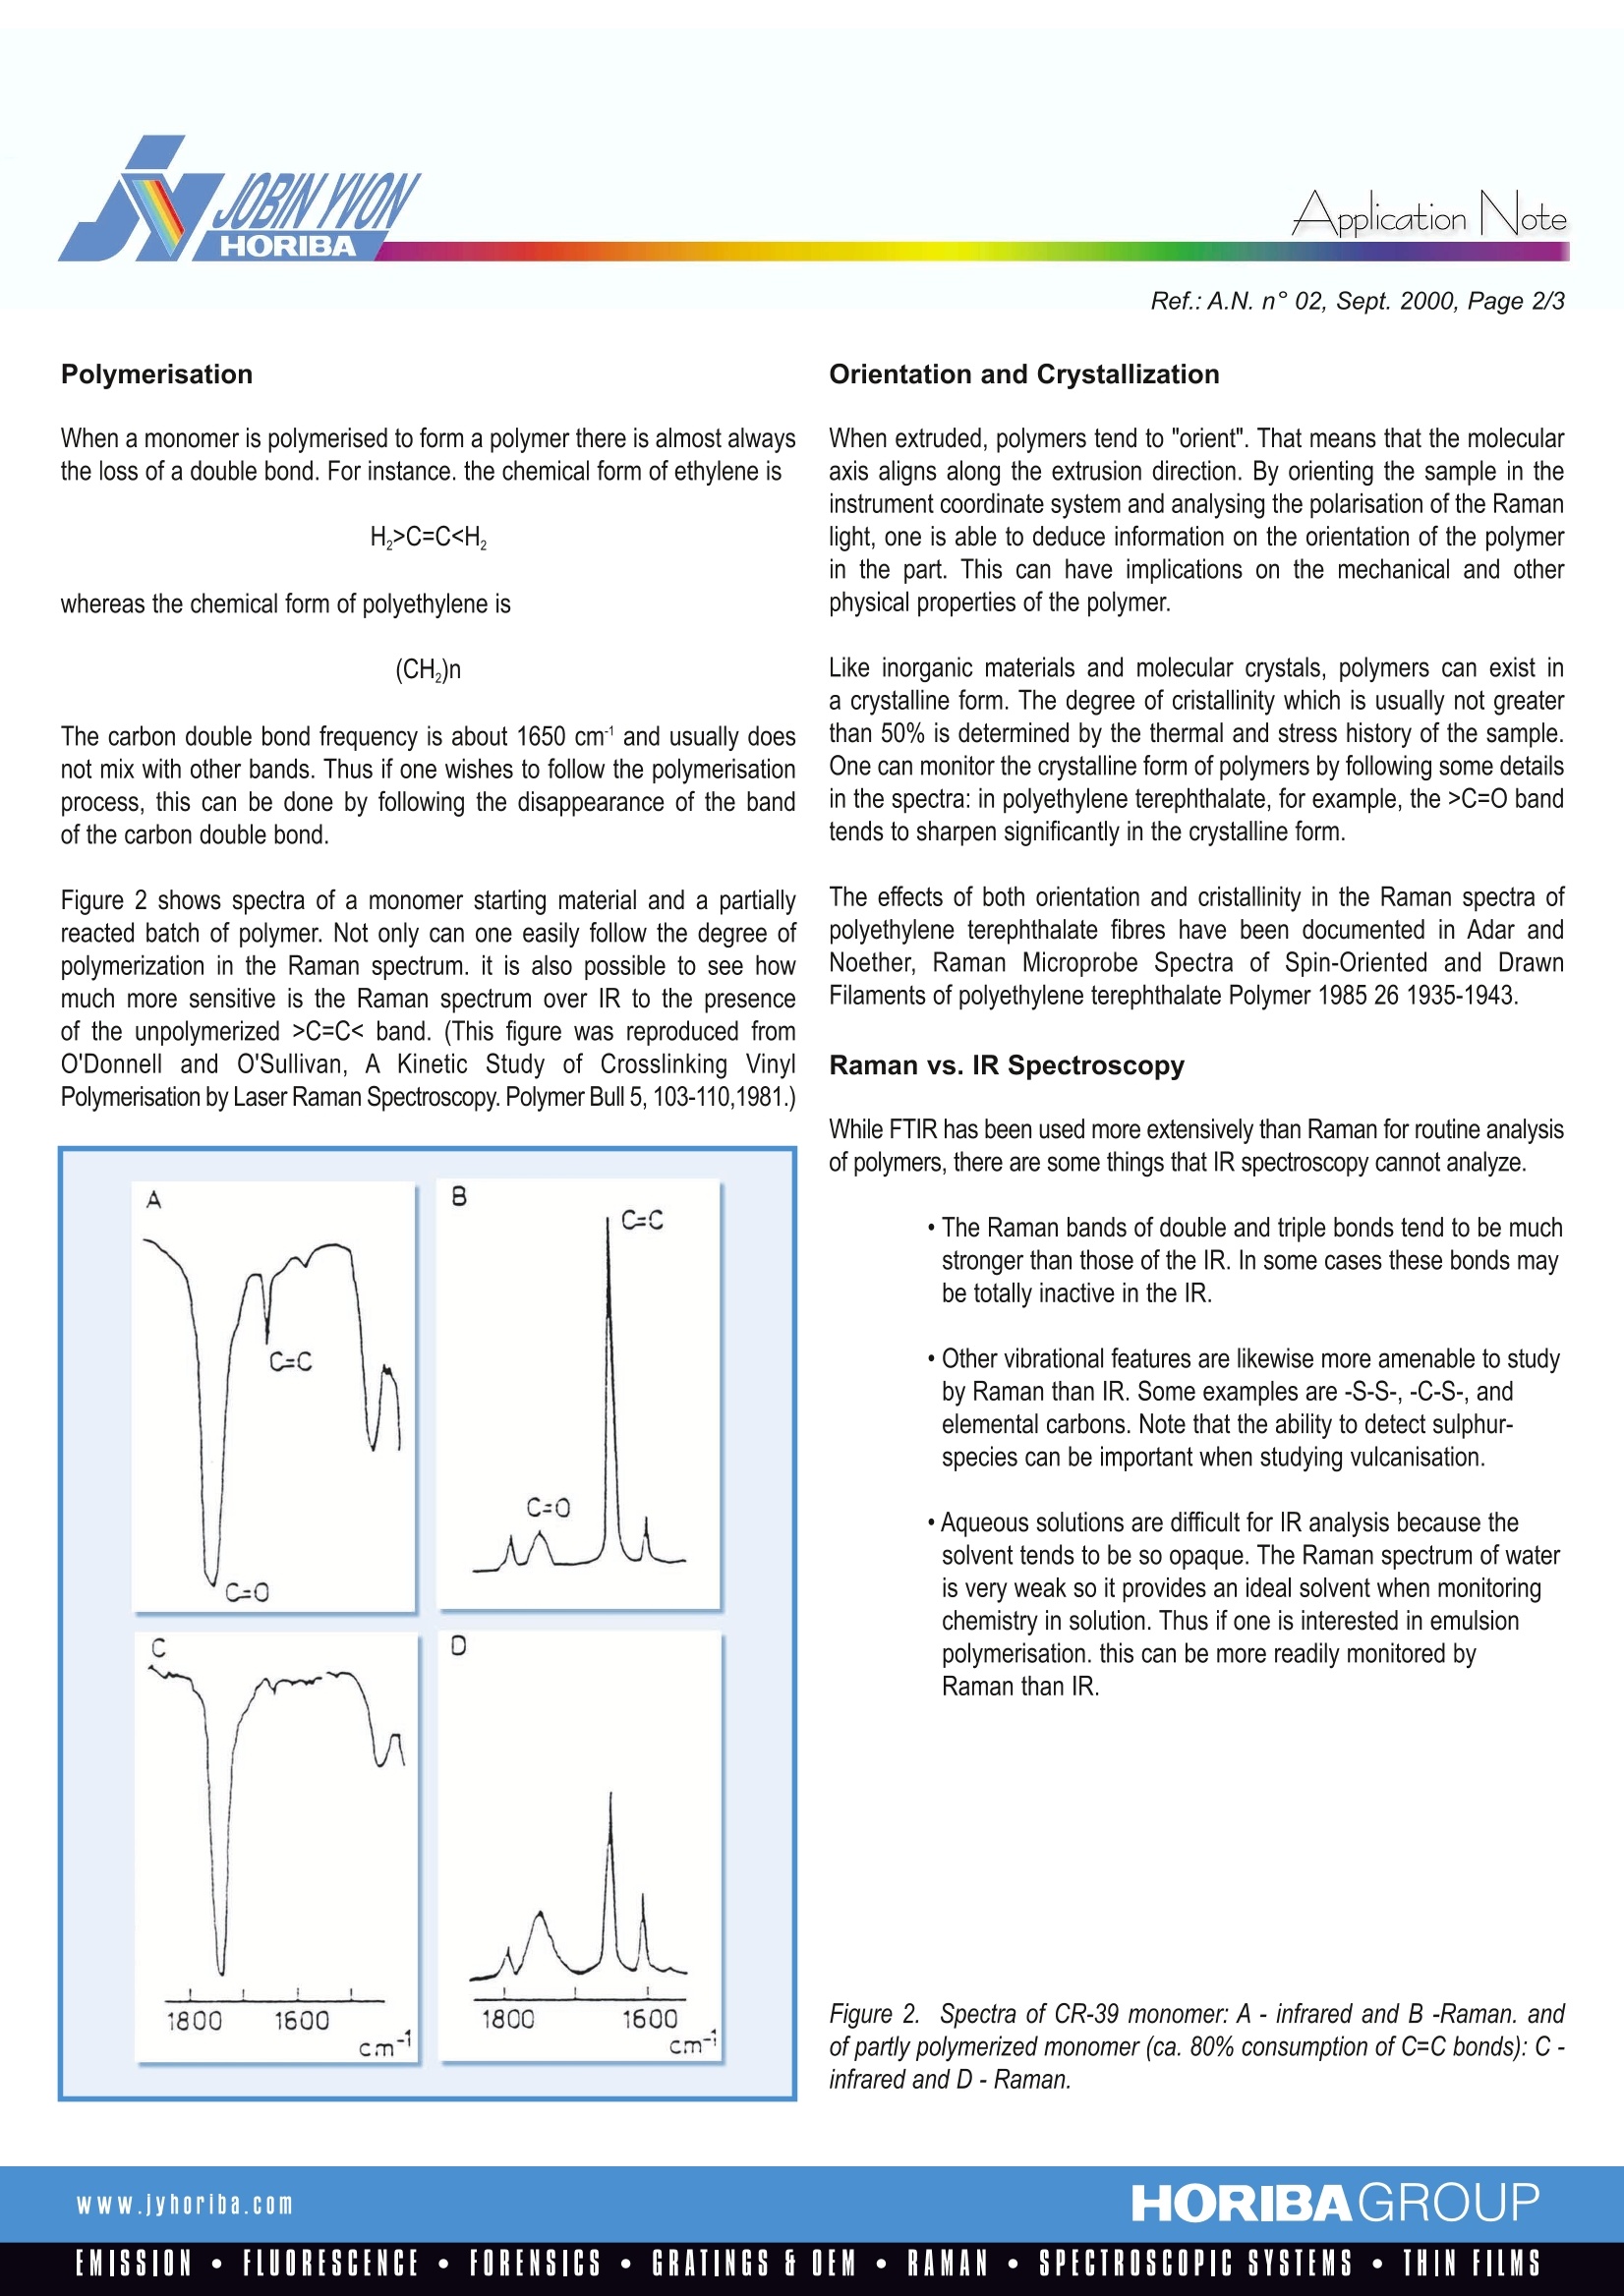
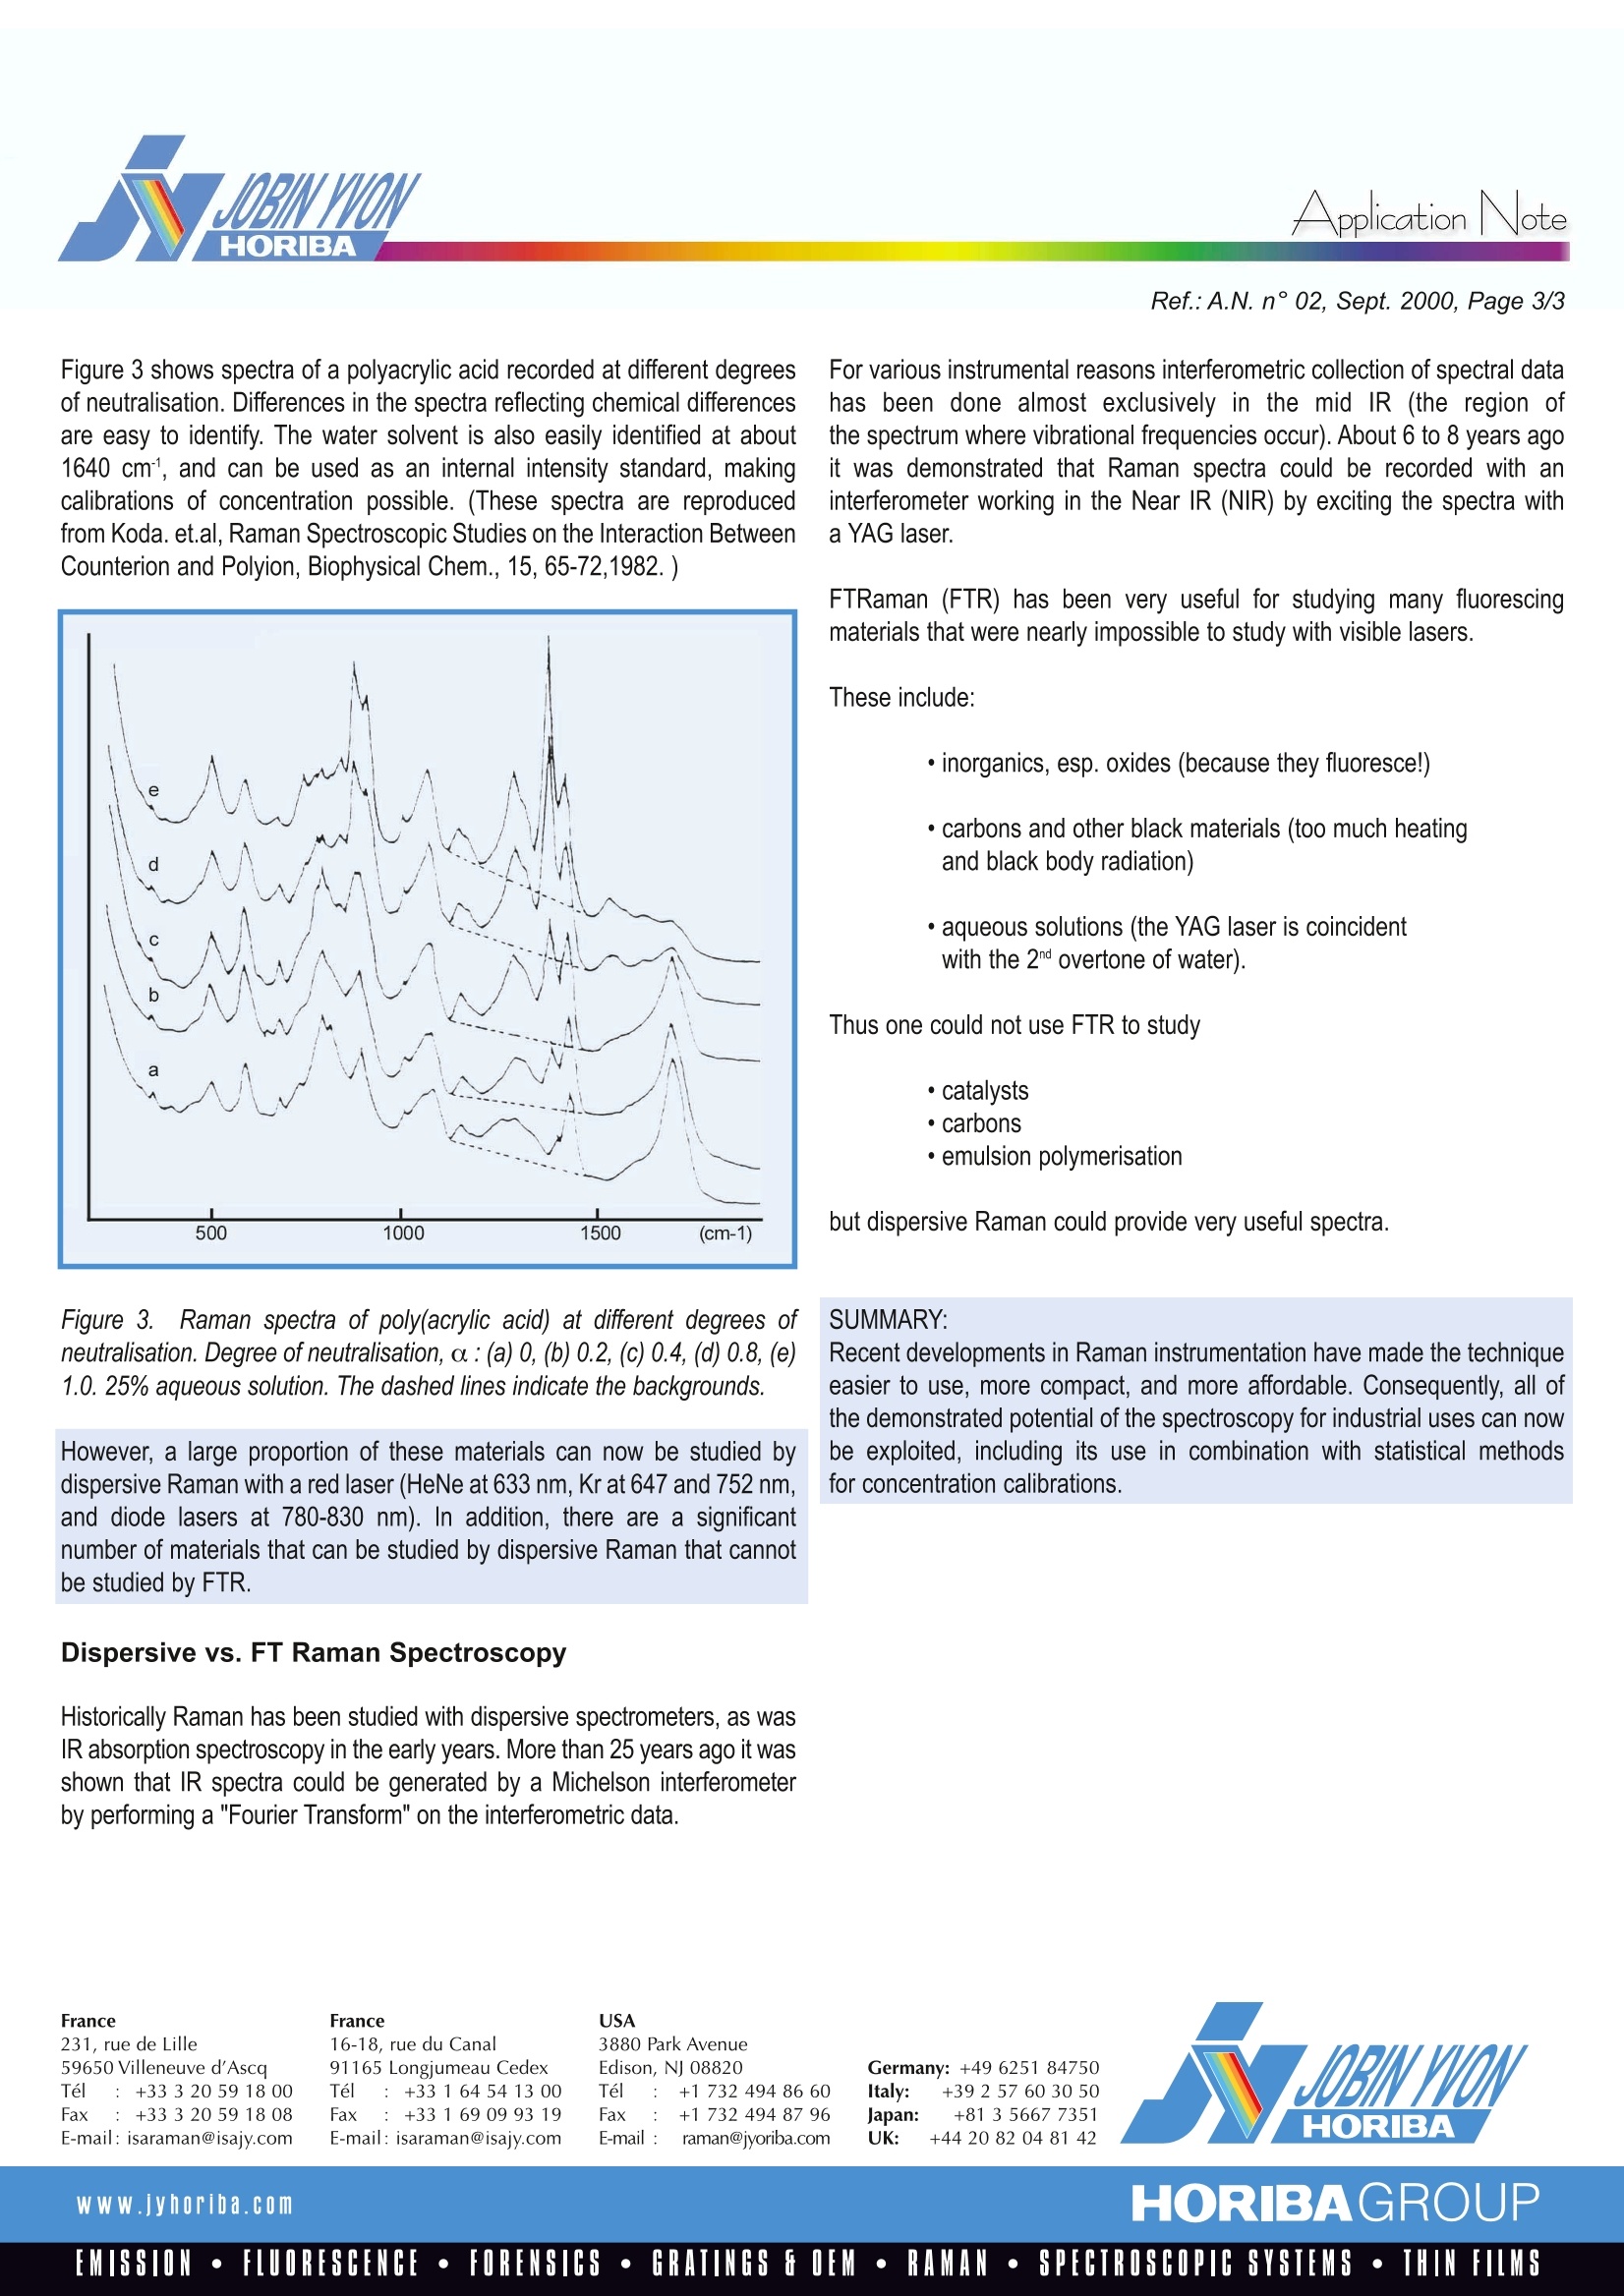
RamanlSpectroscopyApplication Note Application NoteRef.:A.N. n°02, Sept. 2000, Page 2/3 Raman Characterization of Polymersin Industrial Applications When a monomer is polymerised to form a polymer there is almost alwaysthe loss of a double bond. For instance. the chemical form of ethylene is whereas the chemical form of polyethylene is The carbon double bond frequency is about 1650 cm and usually doesnot mix with other bands. Thus if one wishes to follow the polymerisationprocess, this can be done by following the disappearance of the bandof the carbon double bond. Figure 2 shows spectra of a monomer starting material and a partiallyreacted batch of polymer. Not only can one easily follow the degree ofpolymerization in the Raman spectrum. it is also possible to see howmuch more sensitive is the Raman spectrum over IR to the presenceof the unpolymerized>C=C< band. (This figure was reproduced fromO'Donnell and O'Sullivan, A Kinetic Study of Crosslinking VinylPolymerisation by Laser Raman Spectroscopy. Polymer Bull 5, 103-110,1981.) Orientation and Crystallization When extruded, polymers tend to "orient". That means that the molecularaxis aligns along the extrusion direction. By orienting the sample in theinstrument coordinate system and analysing the polarisation of the Ramanlight, one is able to deduce information on the orientation of the polymerin the part. This can have implications on the mechanical and otherphysical properties of the polymer. Like inorganic materials and molecular crystals, polymers can exist ina crystalline form. The degree of cristallinity which is usually not greaterthan 50% is determined by the thermal and stress history of the sample.One can monitor the crystalline form of polymers by following some detailsin the spectra: in polyethylene terephthalate, for example, the>C=0 bandtends to sharpen significantly in the crystalline form. The effects of both orientation and cristallinity in the Raman spectra ofpolyethylene terephthalate fibres have been documented in Adar andNoether, Raman Microprobe Spectra of Spin-Oriented and DrawnFilaments of polyethylene terephthalate Polymer 1985 26 1935-1943. Raman vs. IR Spectroscopy While FTIR has been used more extensively than Raman for routine analysisof polymers, there are some things that IR spectroscopy cannot analyze. ·The Raman bands of double and triple bonds tend to be muchstronger than those of the IR. In some cases these bonds maybe totally inactive in the IR. ·Other vibrational features are likewise more amenable to studyby Raman than IR. Some examples are -S-S-, -C-S-, andelemental carbons. Note that the ability to detect sulphur-species can be important when studying vulcanisation. · Aqueous solutions are difficult for IR analysis because thesolvent tends to be so opaque. The Raman spectrum of wateris very weak so it provides an ideal solvent when monitoringchemistry in solution. Thus if one is interested in emulsionpolymerisation. this can be more readily monitored byRaman than IR. Figure 2. Spectra of CR-39 monomer: A -infrared and B -Raman. andof partly polymerized monomer (ca. 80% consumption of C=C bonds):C-infrared and D-Raman. Figure 3 shows spectra of a polyacrylic acid recorded at different degreesof neutralisation. Differences in the spectra reflecting chemical differencesare easy to identify. The water solvent is also easily identified at about1640 cm, and can be used as an internal intensity standard, makingcalibrations of concentration possible. (These spectra are reproducedfrom Koda. et.al, Raman Spectroscopic Studies on the Interaction BetweenCounterion and Polyion, Biophysical Chem., 15,65-72,1982.) Figure 3. Raman spectra of poly(acrylic acid) at different degrees ofneutralisation. Degree of neutralisation, a: (a)0,(b) 0.2, (c)0.4, (d) 0.8,(e)1.0. 25% aqueous solution. The dashed lines indicate the backgrounds. However, a large proportion of these materials can now be studied bydispersive Raman with a red laser (HeNe at 633 nm, Kr at 647 and 752 nm,and diode lasers at 780-830 nm). In addition, there are a significantnumber of materials that can be studied by dispersive Raman that cannotbe studied by FTR. Dispersive vs. FT Raman Spectroscopy Historically Raman has been studied with dispersive spectrometers, as wasIR absorption spectroscopy in the early years. More than 25 years ago it wasshown that IR spectra could be generated by a Michelson interferometerby performing a "Fourier Transform" on the interferometric data. For various instrumental reasons interferometric collection of spectral datahas been done almost exclusively in the mid IR (the region ofthe spectrum where vibrational frequencies occur). About 6 to 8 years agoit was demonstrated that Raman spectra could be recorded with aninterferometer working in the Near IR (NIR) by exciting the spectra withaYAG laser. FTRaman (FTR) has been very useful for studying many fluorescingmaterials that were nearly impossible to study with visible lasers. These include: ·inorganics, esp. oxides (because they fluoresce!) · carbons and other black materials (too much heatingand black body radiation) ·aqueous solutions (the YAG laser is coincidentwith the 2nd overtone of water). Thus one could not use FTR to study ·catalysts· carbons·emulsion polymerisation but dispersive Raman could provide very useful spectra. SUMMARY: Recent developments in Raman instrumentation have made the techniqueeasier to use, more compact, and more affordable. Consequently, all ofthe demonstrated potential of the spectroscopy for industrial uses can nowbe exploited, including its use in combination with statistical methodsfor concentration calibrations. www.jyhoriba.com HORIBAGROUPEMISSION·FLUORESCENCE·FORENSICS· GRATINGS E OEM· RAMAN·SPECTROSCOPIC SYSTEMS· THIN FILMS HORIBAGROUPWww.jyhoriba.comEMISSION·FLUORESCENCE·FORENSICS·GRATINGS FOEM·RAMAN·SPECTROSCOPIC SYSTEMS· THIN FILMS
确定
还剩1页未读,是否继续阅读?

产品配置单
HORIBA(中国)为您提供《Raman Characterization of Polymers》,该方案主要用于其他中--检测,参考标准--,《Raman Characterization of Polymers》用到的仪器有HORIBA HE科研级便携拉曼光谱仪
推荐专场


相关方案
更多
该厂商其他方案
更多