


方案详情
文
The ICP technique is widely accepted in agricultural institutions for the determination of major and minor elements in soils and plants, heavy metal content in soils, receiving industrial waste
and environmental monitoring of soils. It can also be used for the quality control of sites exposed to pollution and for research and development projects to improve plant growth. In this study,
we will focus on ammonium acetate extracts of soils. Depending on the elements of interest, different extracts are used to simulate the uptake by the plant. Different digestion or extraction procedures
will be reviewed.
方案详情

ICP OPTICAL EMISSION SPECTROSCOPYAPPLICATION NOTE 06 Quantitative Analysis of Soil Extracts with ICP-OES Nathalie Le Corre Jobin Yvon S.A.S., Horiba GroupLongjumeau, France Keywords: agriculture, soil The ICP technique is widely accepted in agricul-tural institutions for the determination of majorand minor elements in soils and plants, heavymetal content in soils, receiving industrial wasteand environmental monitoring of soils. It can alsobe used for the quality control of sites exposedto pollution and for research and developmentprojects to improve plant growth. In this study,we will focus on ammonium acetate extracts ofsoils. Depending on the elements of interest, dif-ferent extracts are used to simulate the uptake bythe plant. Different digestion or extraction proce-dures will be reviewed. 2 Principle 2.1 Technique used The elemental analysis of solutions was under-taken by Inductively Coupled Plasma OpticalEmission Spectrometry (ICP-OES). The sample isnebulized then transferred to an argon plasma. Itis decomposed, atomized and ionized wherebythe atoms and ions are excited. We measure theintensity of the light emitted when the atoms orions return to lower levels of energy.y.EEach ele-ment emits light at characteristic wavelengthsand these lines can be used for quantitativeanalysis after a calibration. 2.2 Wavelength choice The choice of the wavelength in a given matrixcan be made using the "profile" function, or byusing Win-IMAGE, which is rapid semi-quantita-tive analysis mode using multiple wavelengths.The principle is the same in either case: recordthe scans of analytes at low concentration, andof the matrix. By superimposing the spectra, wesee possible interferences. 3 Sample preparation Two type of extractions were used: 3.1 Acidic Ammonium Acetate EDTASoil Extracts Reagents: 50 mL of extractant solution per determination isprepared as follows: 38.5 g NH4CO2CH3, 25 mlCH3CO2H(96%) and 29.225 gEDTA were dilut-ed to 1 L. Sample preparation: 5 g of dried soil sample weighed into a 250 mLpolypropylene bottle iss mixed with 50 ml ofextractant solution. The suspension is shaken at19-21 °C in a thermostatted water bath, labora-tory shaker for one hour. The sample solution isfiltered through folded filter paper (Mg free) andstored in a polypropylene bottle for ICP analysis.For good reproducibility of the results, it is impor-tant to keepthe extractionn conditions(soil/extractant ratio, temperature and duration ofextraction) constant. 3.2 HCI and HNO, Soil Extracts Reagents: Concentrated HCI (37%) and HNO3 (65%) ana-lytical reagent grade acids. Sample preparation: 2 g of milled soil (<150 p sieve) is digested with15 mL (20 mL, if calcareous) of HCI (18.5% w/v)and 5 mL HNO3(conc.). The samples weredigested in tubes using a heated block over a 9hr period using temperatures up to 130 °C andtaken to dryness. The samples were redissolvedin HCl and made to 100 mL with deionized water.The final solution was 5%HCI (v/v). It is alsopossible to make a microwave digestion. Two distinct sets of standards were used; one forthe major elements and the other for traces. Table 1: Standards prepared in Acetic AmmoniumAcetate EDTA Concentration in g/kg Element Stdo Std1 Std2 Std3 Std4 CaO 0.56 2.80 5.60 11.20 MgO 0.066 0.166 0.664 1.33 K20 0.060 0.120 0.600 1.200 Na20 0.0135 0.027 0.054 0.108 ElementStdO Std1 Std2 Std3 Std4 Zn 5 10 50 100 150 Mn 10 50 100 200 300 Cu 5 10 50 100 150 Table 2: Standards prepared in HCL/HNO3 Element Stdo Std1 Std2 Std3 Fe 70 100 150 Mg 30 100 150 AI 200 250 300 Ca 700 500 150 Concentration in mg/L for minor elements Element Stdo Std1 Std2 Std3 Zn 0 0.5 1 2 Ni 0 0.1 0.2 0.5 Cr 0.3 0.5 1.5 Cu 0.1 0.3 1.5 For soils, the following approximate matrix is usedfor the minor standards to improve accuracy:100 ppm Fe, 300 ppm Al, 400 ppm Ca, 100 ppm Kand 50 ppm Mg 5 Instrument specification The work was done on a JY PANORAMA.The spec-ifications of this instrument are listed in table 3 and4 Table 3: Specification of spectrometer Parameters Specifications Mounting Paschen Runge Focal length 0.5 m Thermoregulation Yes Nitrogen purge Yes Grating number of grooves 2400 gr/mm 1st order resolution 0.025 nm 2nd order resolution 0.012 nm Order 2nd order Table 4: Specification of RF Generator Parameters Specifications Type of generator Solid state Observation Radial Frequency 40.68 MHz Control of gas flowrate By computer Control of pump flow By computer Cooling Air 6 Operating conditions The operating conditions are listed in table 5 below. Table 5: Operating conditions Parameter Condition RF Generator power 1400 W Plasma gas flowrate 18 L/min Auxiliary gas flowrate 0.8 L/min Sheath gas flowrate 0.15 L/min Nebulizer gas flowrate 0.35 L/min Nebulizer flowrate 1.2 bars (18 psi) Sample uptake 0.3 mL/min Type of nebulizer Concentric Type of spray chamber Cyclonic Argon humidifier Yes Injector tube diameter 3.0 mm The use of the argon humidifier, a cross flow nebu- lizer and the large internal diameter (ID) injectortube enabled trouble free analyses, even with thehigh dissolved salts. The larger ID injector tube alsoensures a minimization of interferences. Due to thehigh dissolved salts, an initial conditioning of thespray chamber is advised for maximum stability. Itis also imperative to use matched standards or stan-dard addition due to the viscosity of the solutions. 7 Discussion Background correction has been used for both themajor and minor elements for greater accuracy. Thisis because the matrix increases the backgroundcompared to water samples. An argon humidifierand a cross flow nebulizer were used to avoid clog-ging at the tip of the nebulizer, thus improving longterm stability. 7.1 Acidic Ammonium Acetate EDTA SoilExtracts Table 6 : Sample results Analyte Wavelength Background Sample (nm) correction Concentration (nm) CaO 315.887 -0.068 1.41 g/kg MgO 279.079 +0.055 0.113 g/kg K20 766.490 -0.071 0.130 g/kg Na20 589.592 +0.071 0.017 g/kg Zn 213.856 -0.030 66.88 mg/kg Mn 257.610 -0.030 41.34 mg/kg Cu 324.754 +0.041 1.74 mg/kg 7.2 HCI/HNO, Acid Soil Digestion Table 7: results for BCR Soil Sample 141 Analyte Wavelength Background Measured Accuracy (nm) Correction Value True (%) (nm) (mg/l) Value (mg/l) Fe 259.940 -0.030 126.6 131 3.3 Mg 279.079 +0.055 36.3 36 0.8 Al 396.152 -0.030 268.1 279 3.9 Ca 317.933 -0.071 620.9 642 3.3 Zn 213.856 -0.030 0.390 0.410 4.9 Ni 231.604 -0.030 0.152 0.160 5 Cr 267.716 -0.030 0.345 0.370 4.8 Cu 324.754 +0.041 0.244 0.228 7.3 8 Summary The results are in good agreement with the expect-ed values. Some care must be taken with the sam-ple preparation, especially with soil extracts. Toreduce matrix effects, radial viewing is preferred toaxial. Furthermore, the standards were preparedwith the same amount of acid or ammoniumacetate used with the real samples, to have thesame nebulization efficiency between standardsand samples. Background correction was used tonearly remove spectral matrix effects. Two differentsets of standards were used; one for major and theother for minor elements in order to be as accurateas possible. Sample throughput with simultaneousICPspectrometers, such as the Jobin YvonPANORAMA is very high, up to 60 samples in anhour. In the USA: Jobin Yvon Inc. 3880 Park Avenue Edison, NJ 08820 Tel: 1-732-494-8660 Fax:1-732-494-8796 E-mail: emission@jyhoriba.com Horiba Ltd. 16-18, rue du Canal 2Miyanohigashi, Kisshoin 91165 Longjumeau Cedex Minami-ku, Kyoto 601-8510 TEL: (81) 75 3138121 Tel:(33) 1/64 54 13 00 Fax: (33) 1/69 09 90 88 FAX: (81)753215725 www.horiba.com Germany: (49) 89/46 23 17-0China: (86) 10/6836 6542 Italy: (39) 2/57 60 56 90 Spain: (34) 91/724 16 57 MISSION·FLUORESCENCE·FORENSICS· GRAIINGSGOEM·RAMAN·OPIICAL SPECTROSCOPY·THIN FILM
确定
还剩1页未读,是否继续阅读?

产品配置单

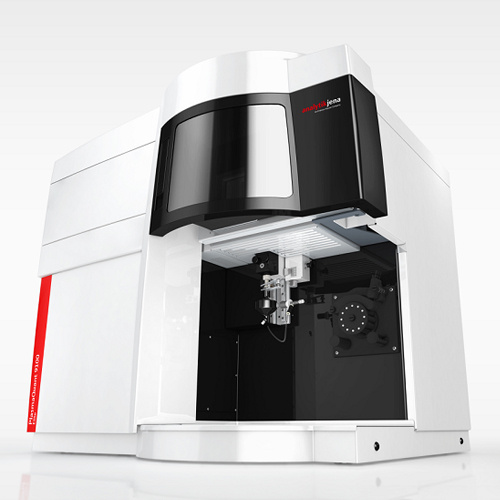
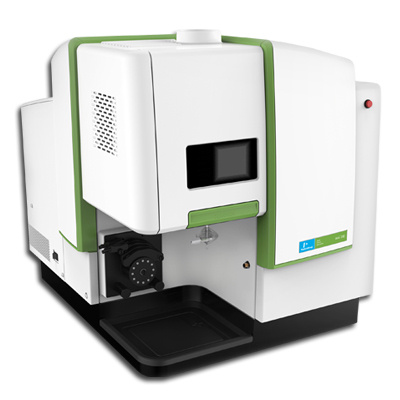
HORIBA(中国)为您提供《土壤中(类)金属及其化合物检测方案 》,该方案主要用于土壤中(类)金属及其化合物检测,参考标准--,《土壤中(类)金属及其化合物检测方案 》用到的仪器有HORIBA Ultima Expert高性能ICP光谱仪
推荐专场
相关方案
更多
该厂商其他方案
更多