


方案详情
文
依据Aqualog专利 A-TEEM技术,消除内滤效应,准确获得荧光有机物的三维指纹图谱(激发波长-发射波长-荧光强度)信息,监测水中溶解有机碳浓度和组成,消毒副产物,消毒副产物前躯体,芳香类石油碳氢化合物,藻类等的浓度和组成。结合化学计量学分析,反应出组份分布,弥补了COD和BOD测试时间长,水体中有机物种类信息缺失的问题可自动
方案详情

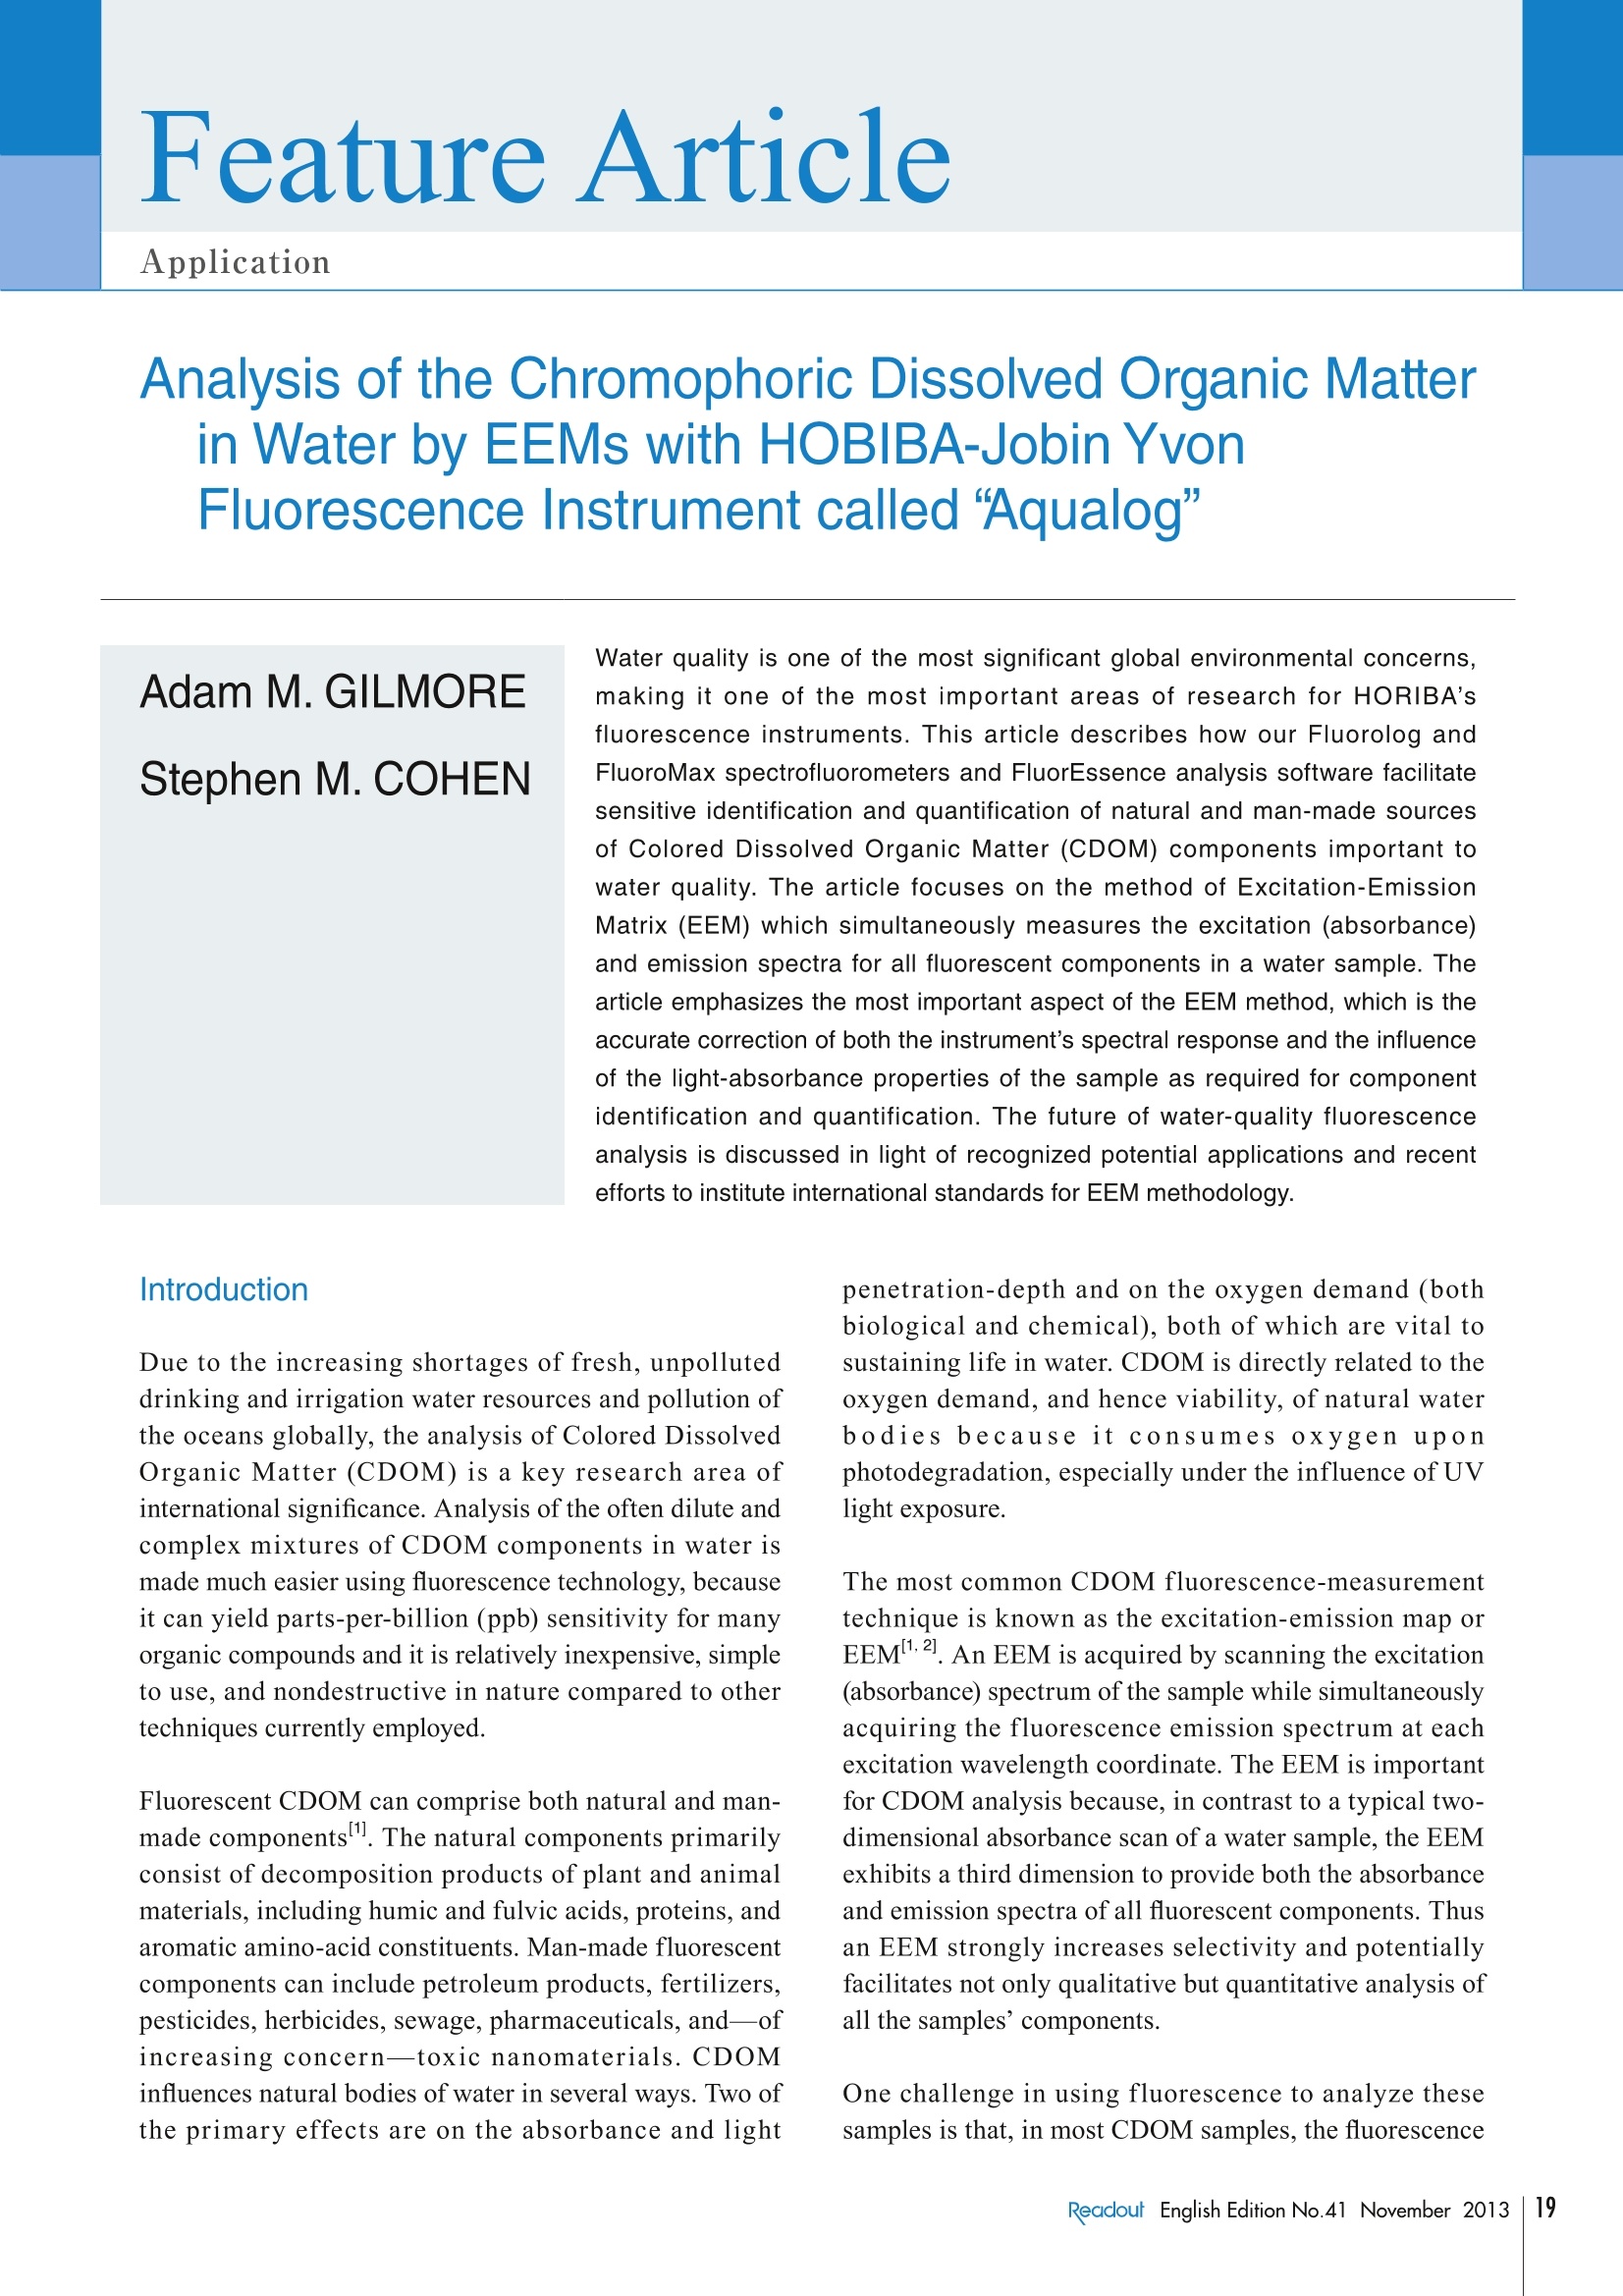
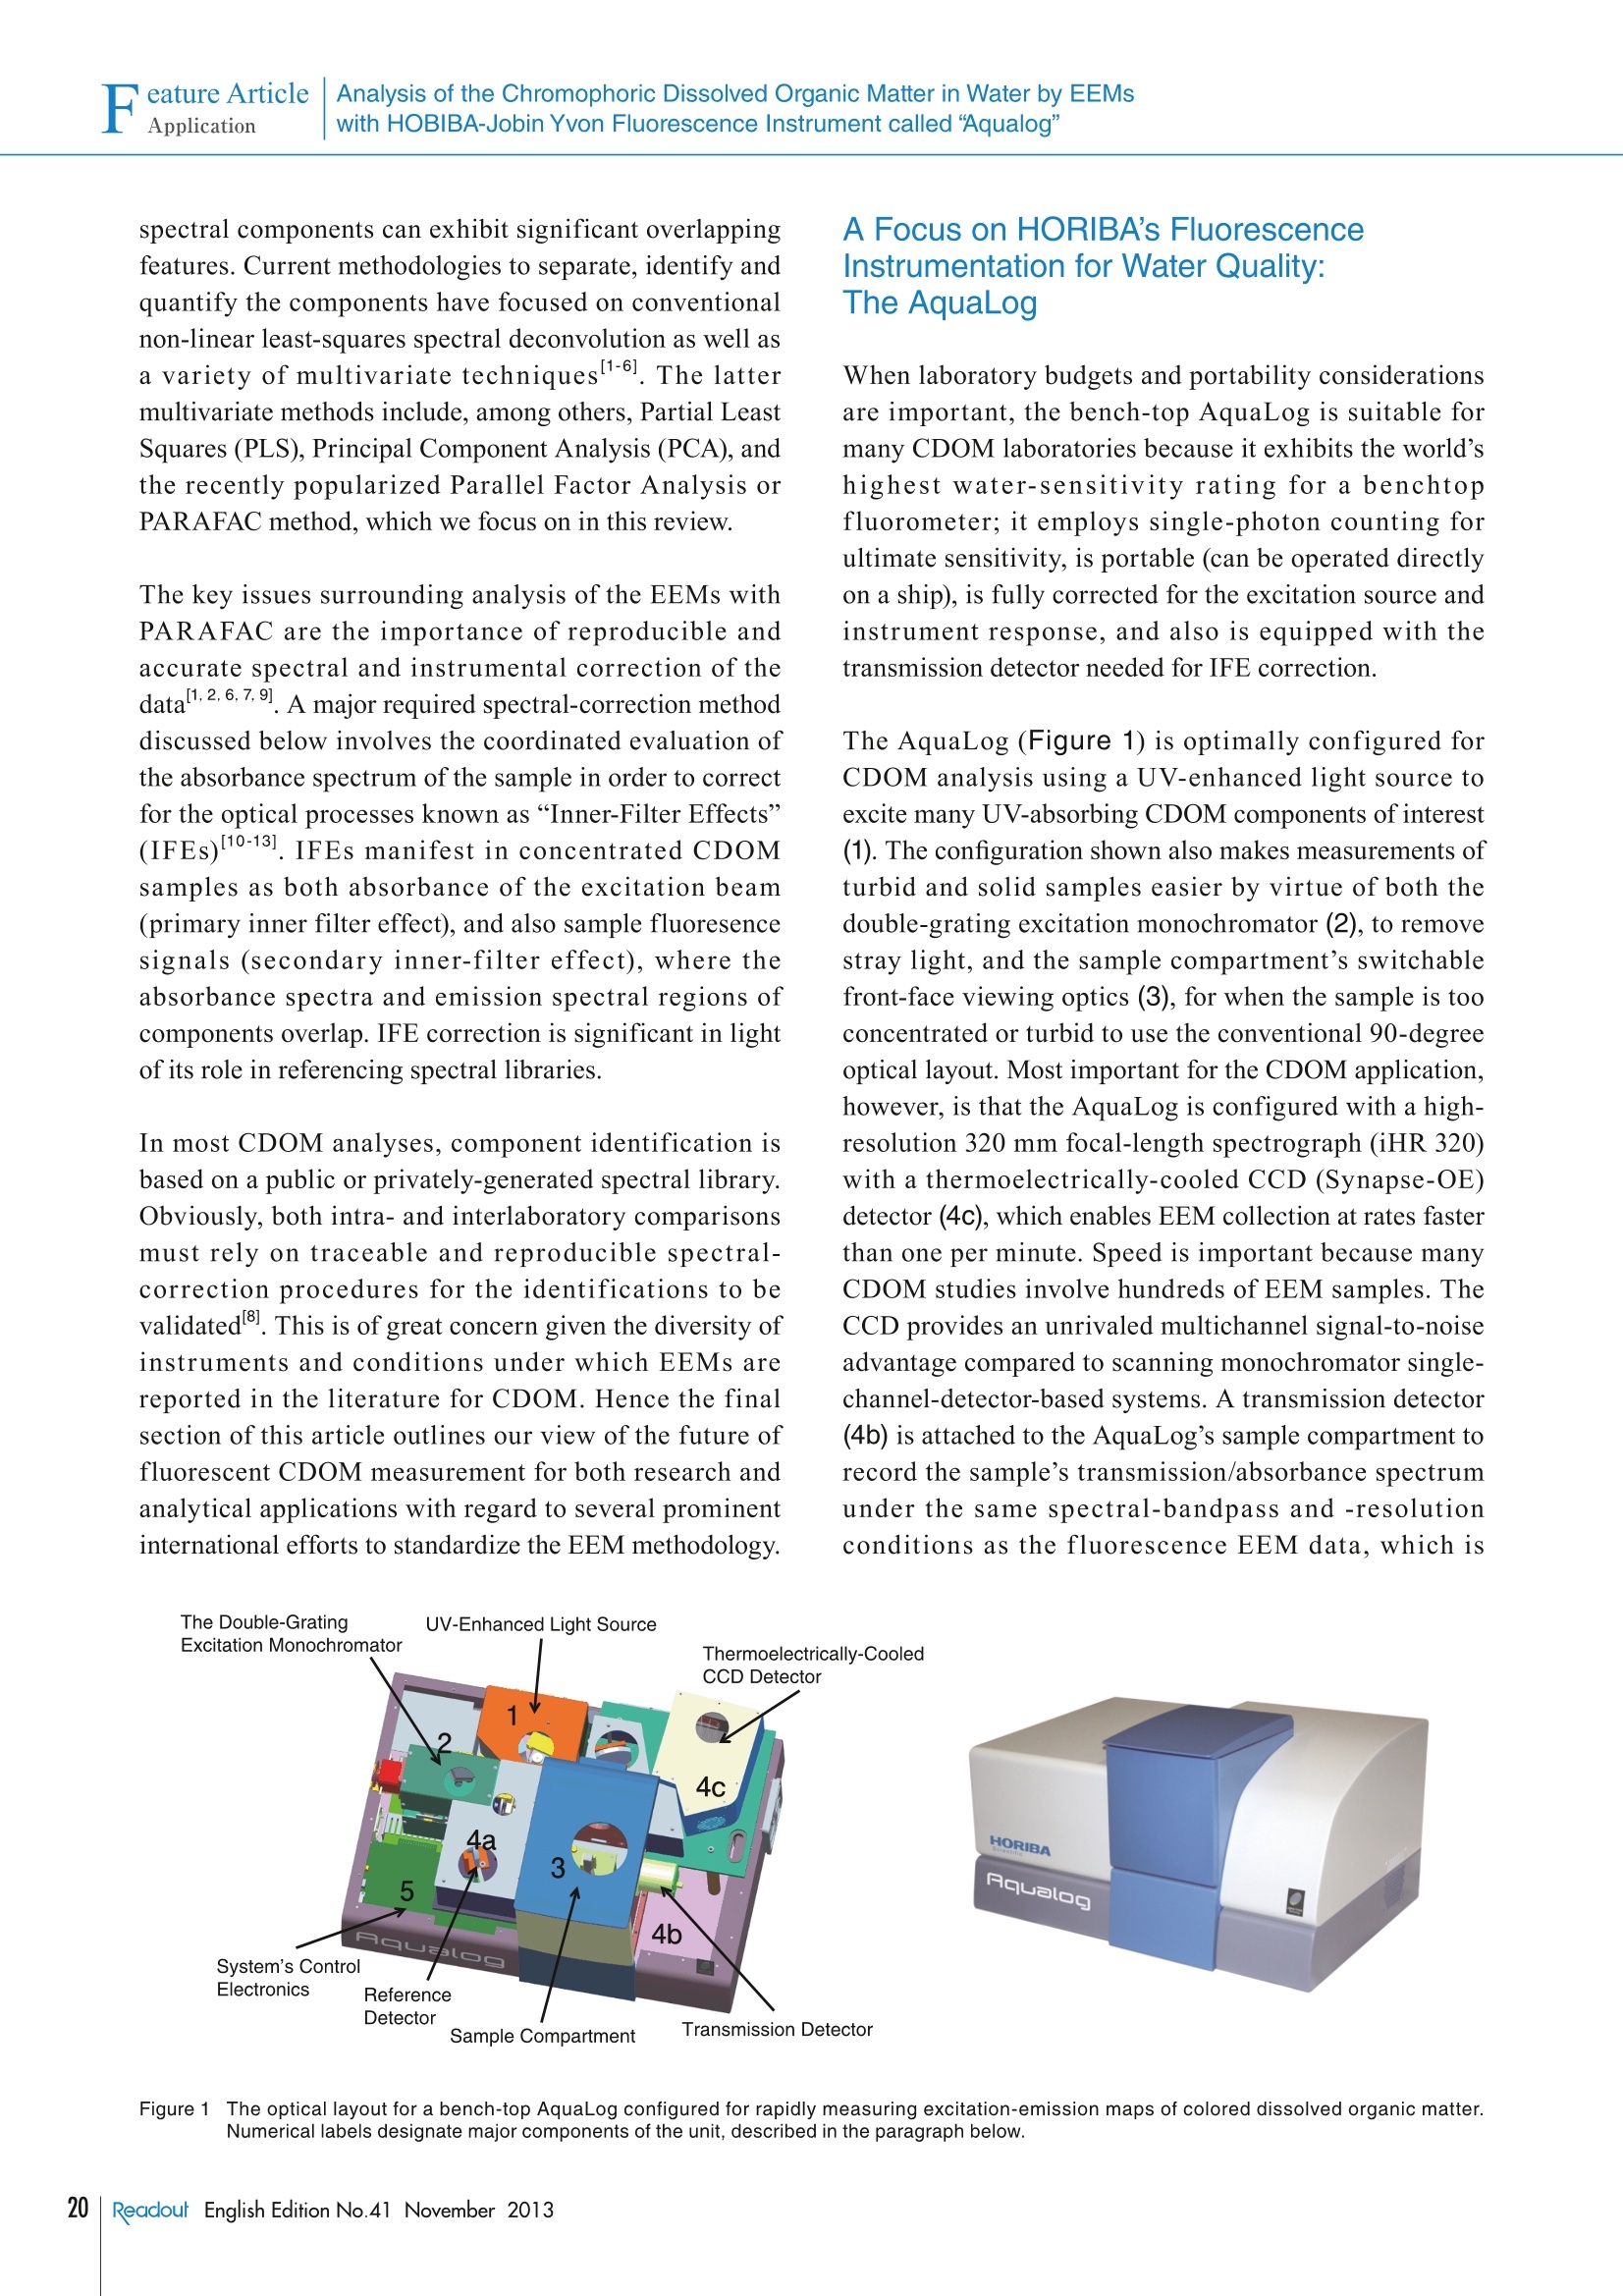
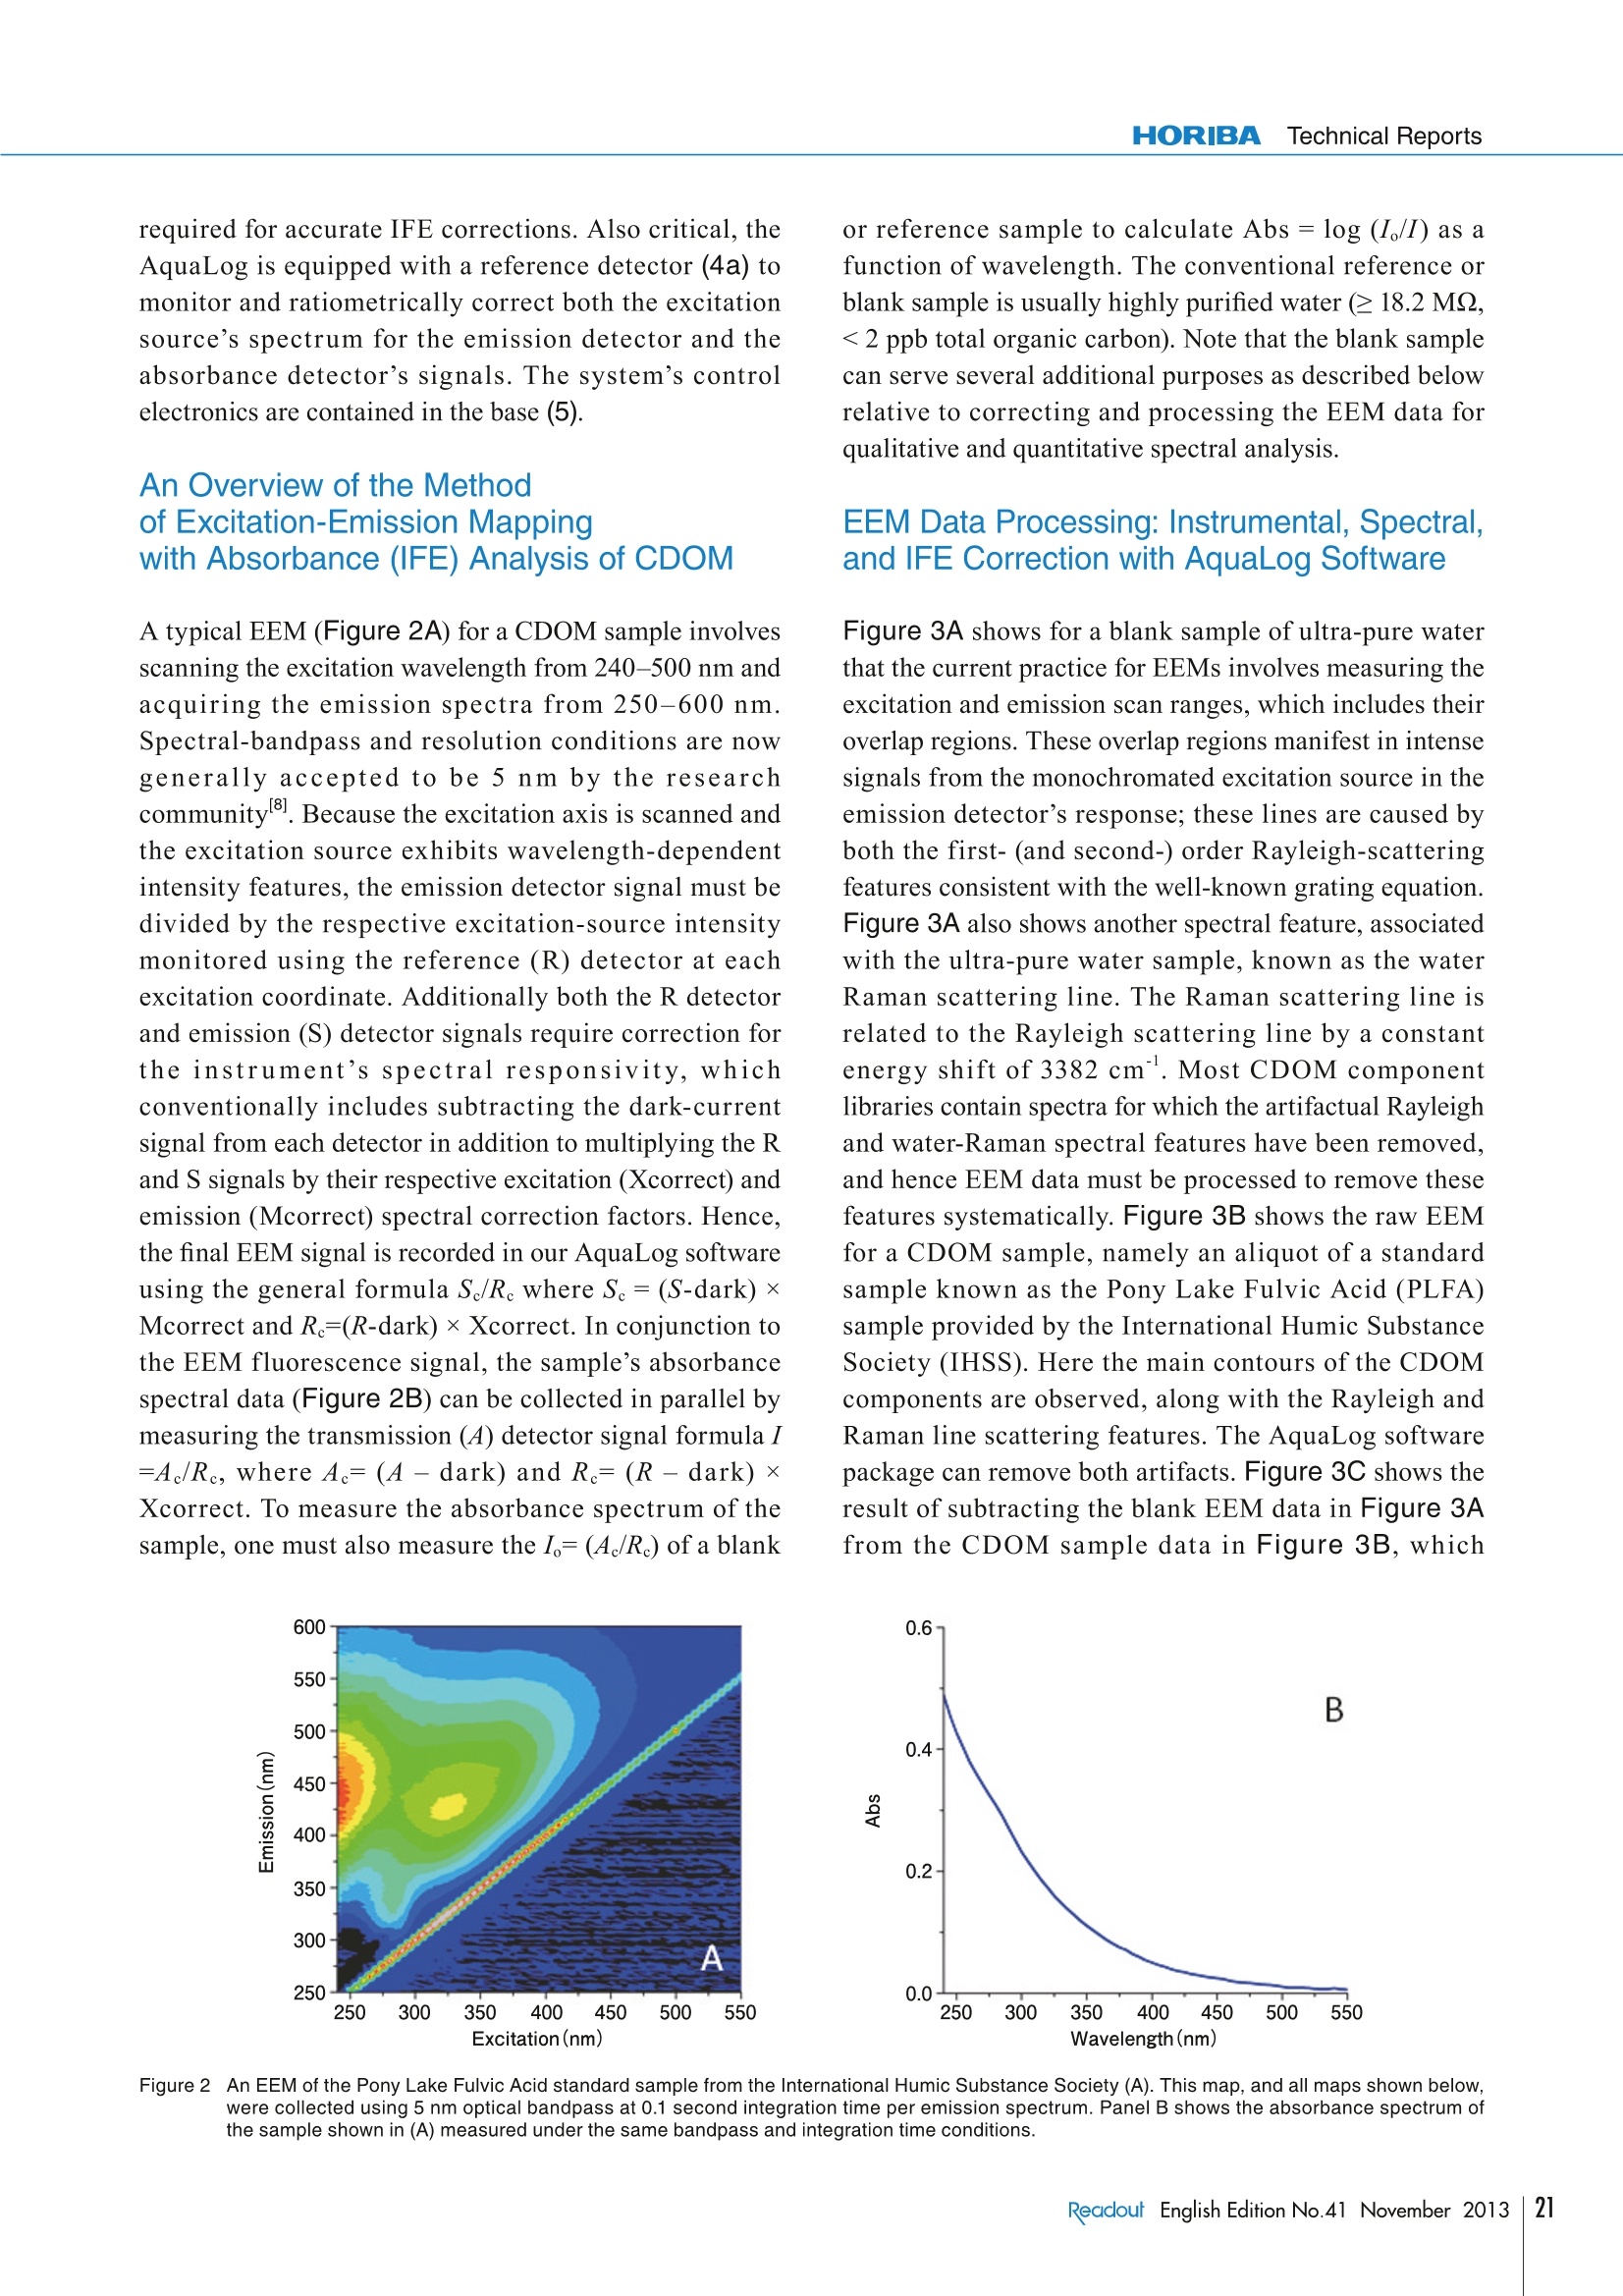
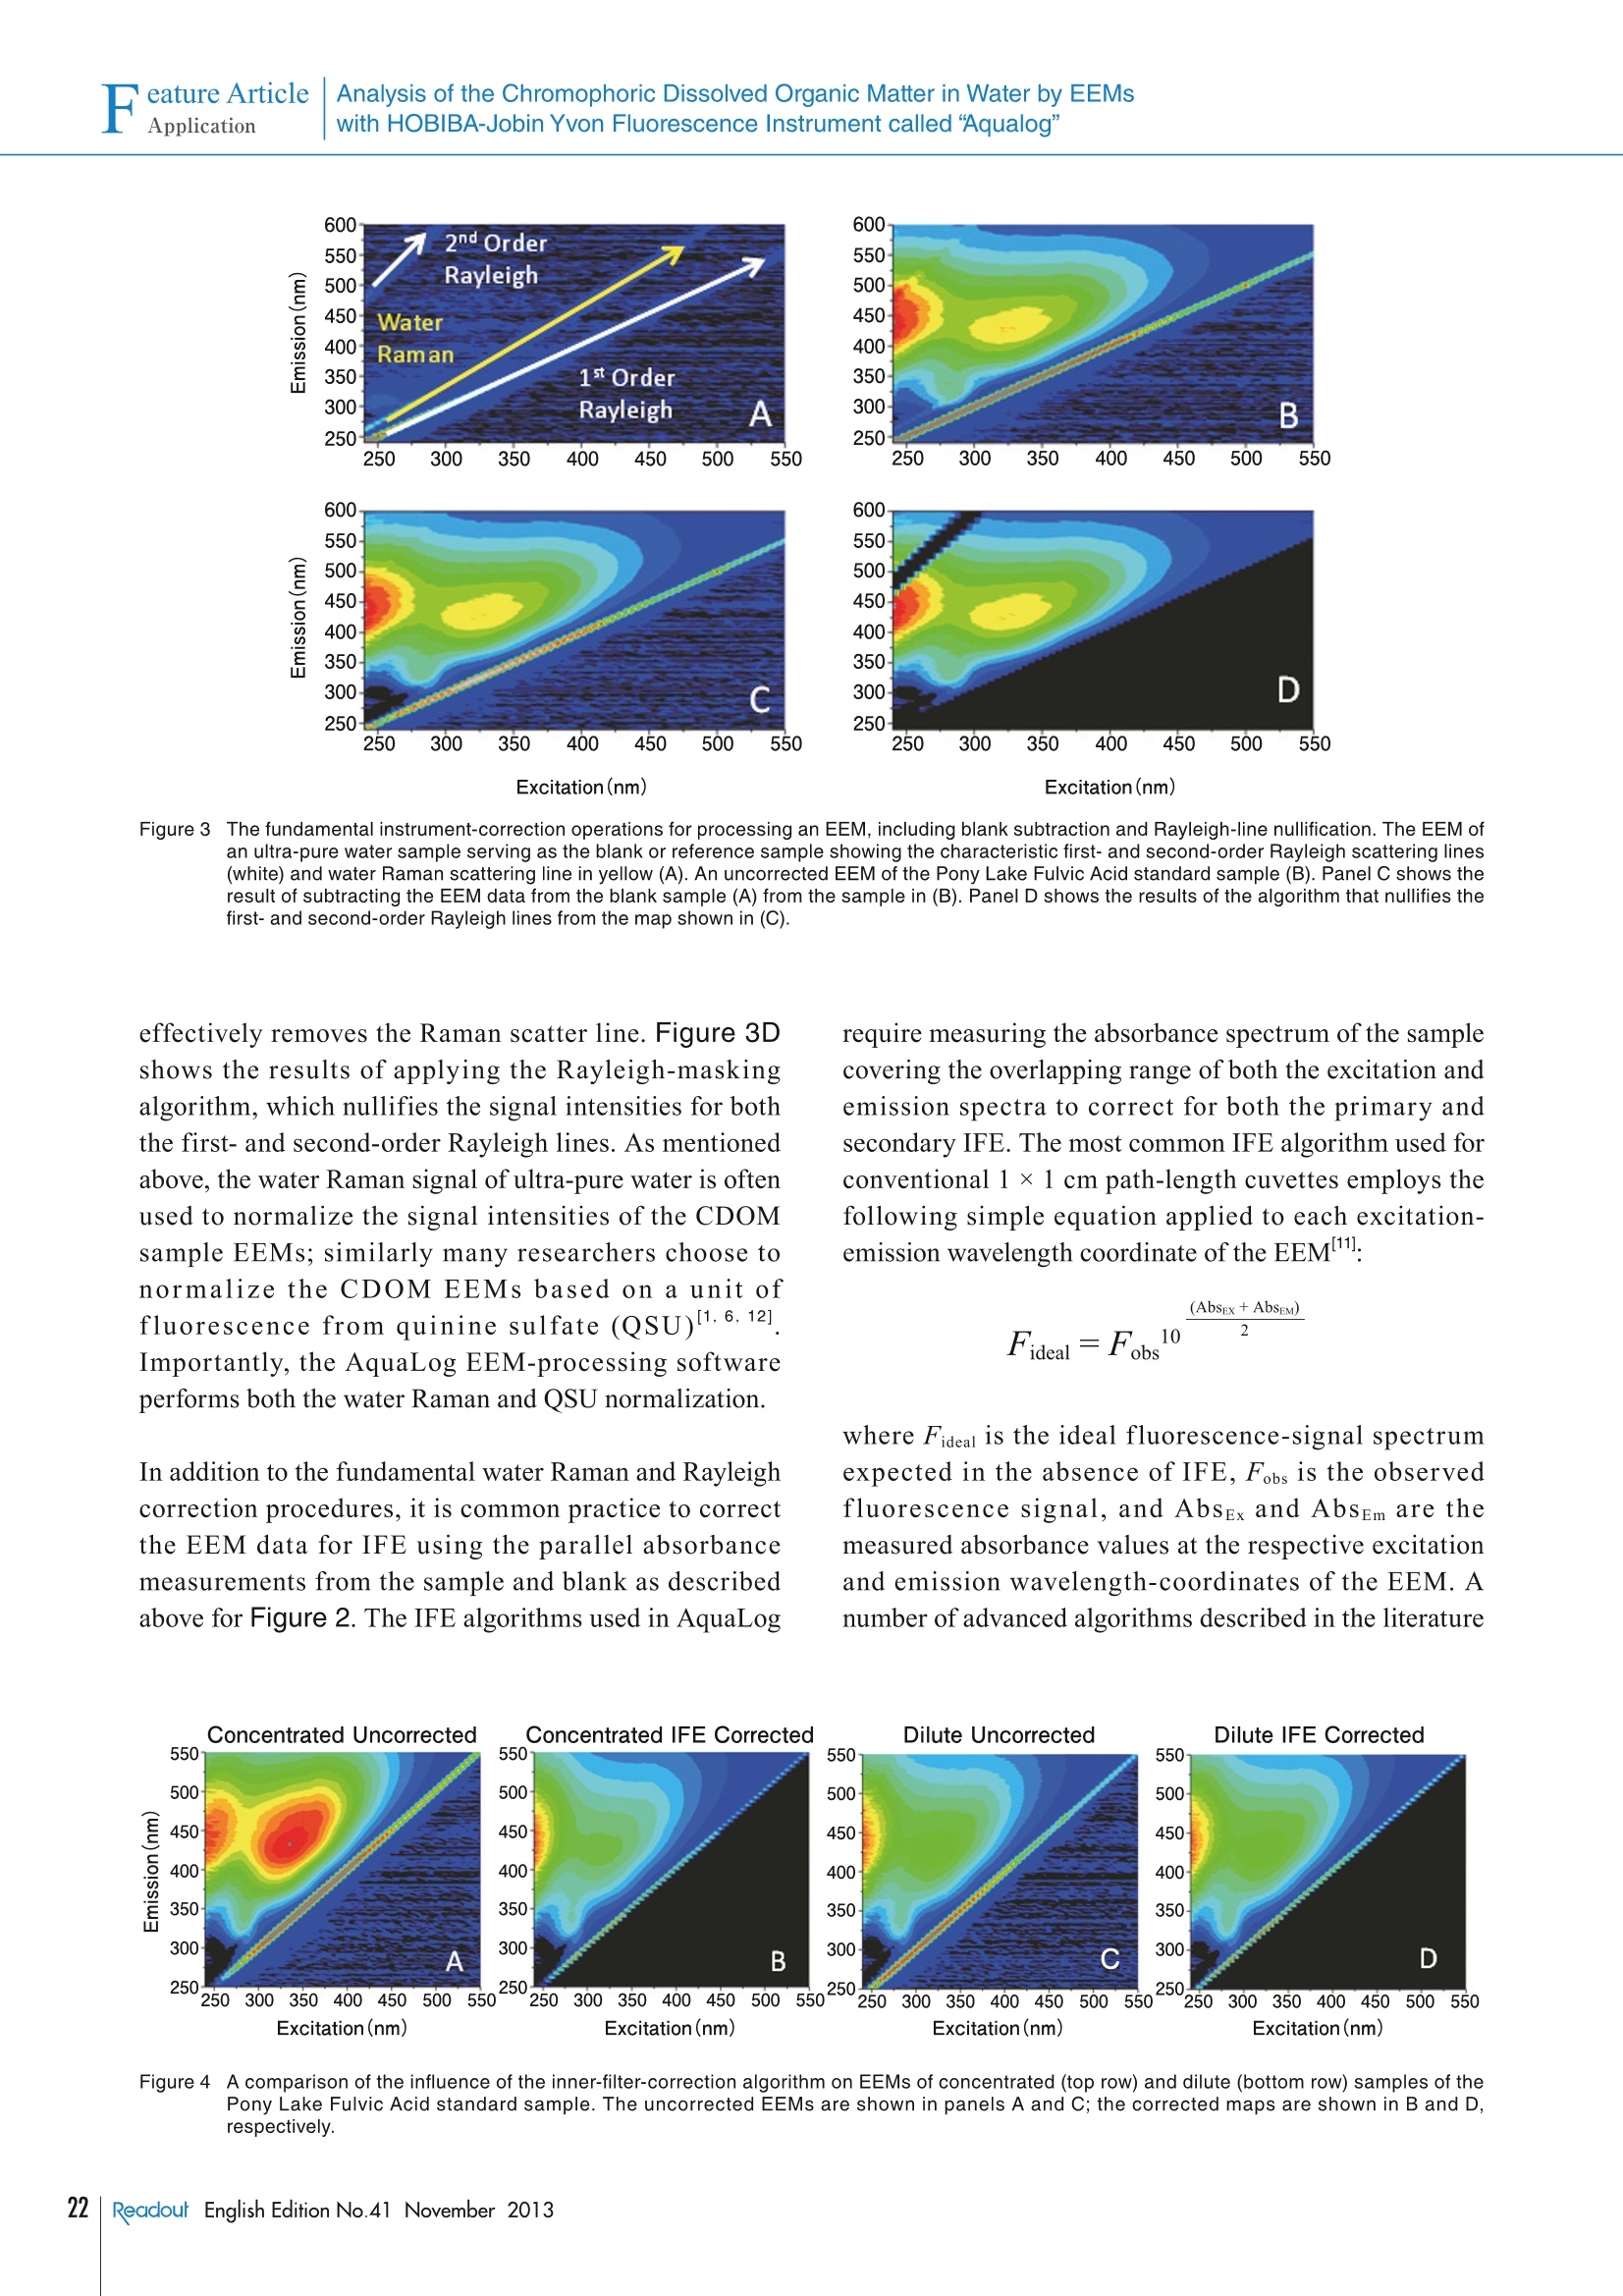
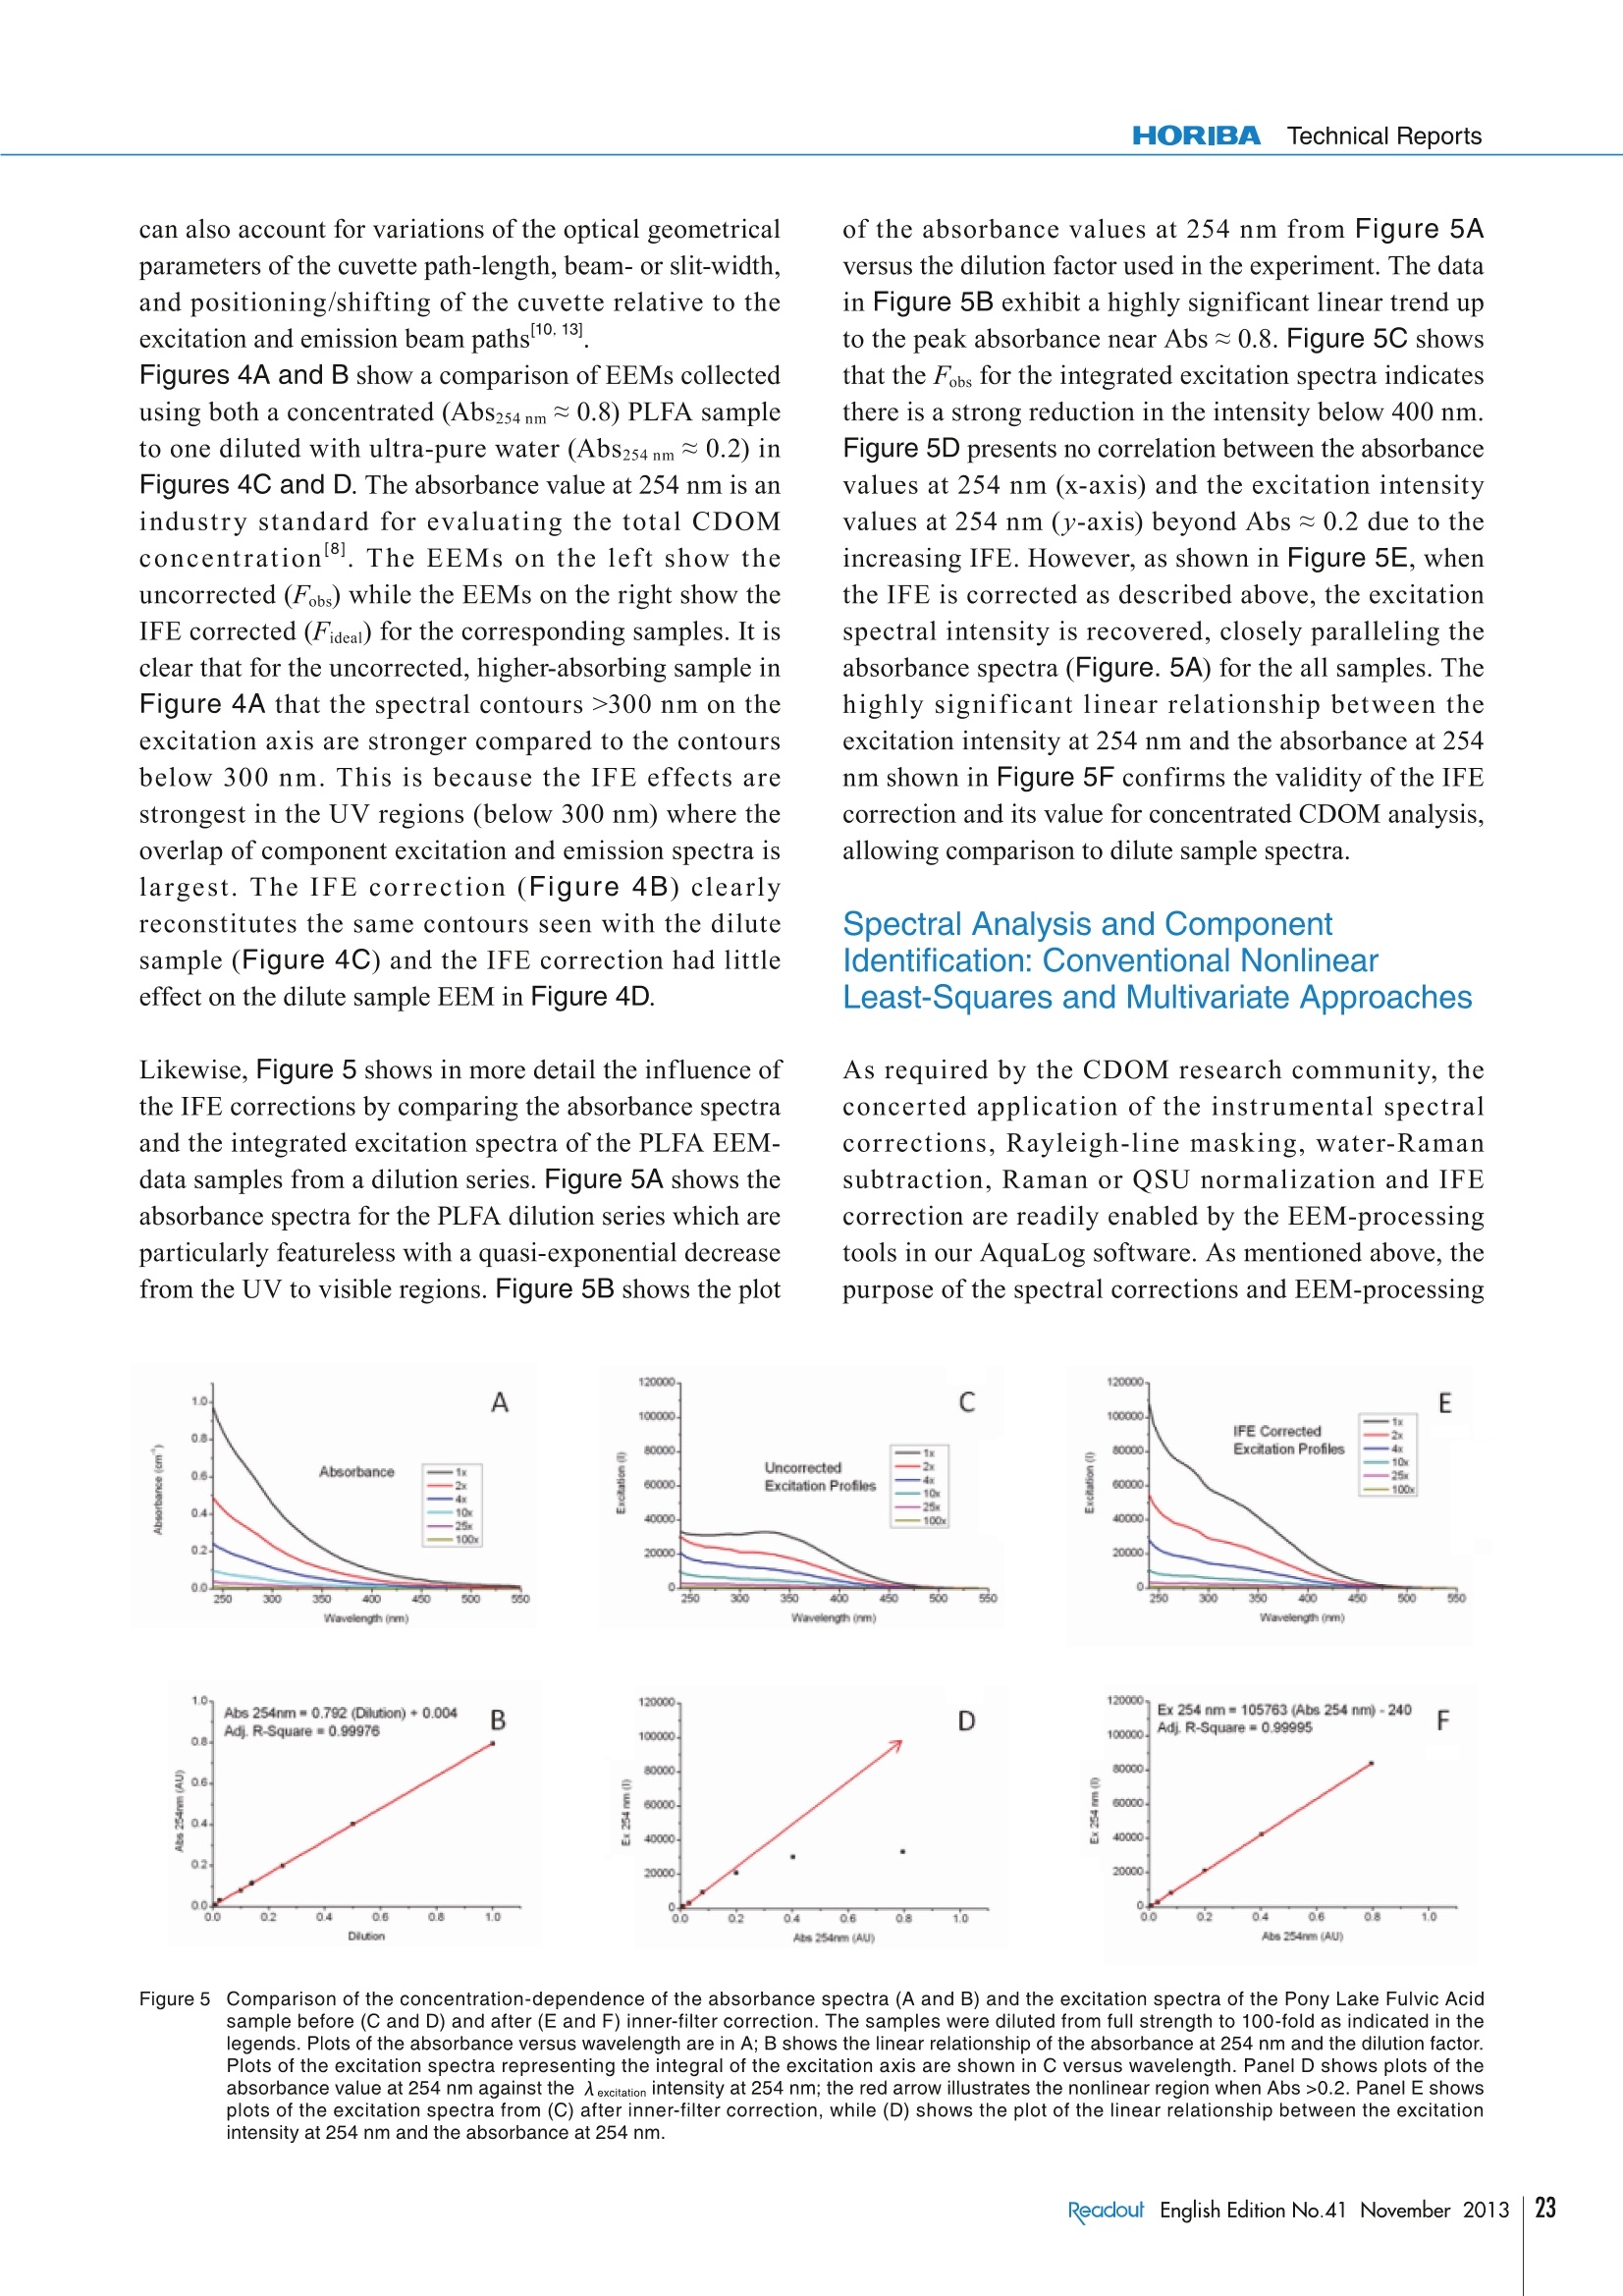
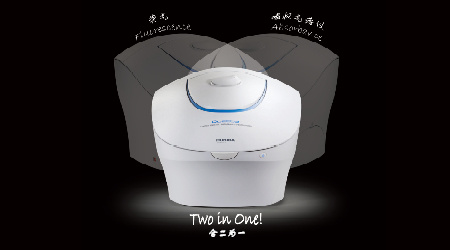
Feature ArticleApplication Analysis of the Chromophoric Dissolved Organic Matter in Water by EEMsFeature ArticleApplicationwith HOBIBA-Jobin Yvon Fluorescence Instrument called “Aqualog” Analysis of the Chromophoric Dissolved Organic Matterin Water by EEMs with HOBIBA-Jobin YvonFluorescence Instrument called "Aqualog" Adam M. GILMOREStephen M.COHEN Water quality is one of the most significant global environmental concerns,making it one of the most important areas of research for HORIBA'sfluorescence instruments. This article describes how our Fluorolog andFluoroMax spectrofluorometers and FluorEssence analysis software facilitatesensitive identification and quantification of natural and man-made sourcesof Colored Dissolved Organic Matter (CDOM) components important towater quality. The article focuses on the method of Excitation-EmissionMatrix (EEM) which simultaneously measures the excitation (absorbance)and emission spectra for all fluorescent components in a water sample. Thearticle emphasizes the most important aspect of the EEM method,which is theaccurate correction of both the instrument's spectral response and the influenceof the light-absorbance properties of the sample as required for componentidentification and quantification. The future of water-quality fluorescenceanalysis is discussed in light of recognized potential applications and recentefforts to institute international standards for EEM methodology. Introduction Due to the increasing shortages of fresh, unpolluteddrinking and irrigation water resources and pollution ofthe oceans globally, the analysis of Colored DissolvedOrganic Matter (CDOM) is a key research area ofinternational significance. Analysis of the often dilute andcomplex mixtures of CDOM components in water ismade much easier using fluorescence technology, becauseit can yield parts-per-billion (ppb) sensitivity for manyorganic compounds and it is relatively inexpensive, simpleto use, and nondestructive in nature compared to othertechniques currently employed. Fluorescent CDOM can comprise both natural and man-made components. The natural components primarilyconsist of decomposition products of plant and animalmaterials, including humic and fulvic acids, proteins, andaromatic amino-acid constituents. Man-made fluorescentcomponents can include petroleum products, fertilizers,pesticides, herbicides,sewage, pharmaceuticals, and-ofincreasing concern—toxic nanomaterials. CDOMinfluences natural bodies of water in several ways. Two ofthe primary effects are on the absorbance and light penetration-depth and on the oxygen demand (bothbiological and chemical), both of which are vital tosustaining life in water. CDOM is directly related to theoxygen demand, and hence viability, of natural waterbodies because it consumes oxygen uponphotodegradation, especially under the influence of UVlight exposure. The most common CDOM fluorescence-measurementtechnique is known as the excitation-emission map orEEM2. An EEM is acquired by scanning the excitation(absorbance) spectrum of the sample while simultaneouslyacquiring the fluorescence emission spectrum at eachexcitation wavelength coordinate. The EEM is importantfor CDOM analysis because, in contrast to a typical two-dimensional absorbance scan of a water sample, the EEMexhibits a third dimension to provide both the absorbanceand emission spectra of all fluorescent components. Thusan EEM strongly increases selectivity and potentiallyfacilitates not only qualitative but quantitative analysis ofall the samples’ components. One challenge in using fluorescence to analyze thesesamples is that, in most CDOM samples, the fluorescence spectral components can exhibit significant overlappingfeatures. Current methodologies to separate, identify andquantify the components have focused on conventionalnon-linear least-squares spectral deconvolution as well asa variety of multivariate techniques 1-6]. The lattermultivariate methods include, among others, Partial LeastSquares (PLS), Principal Component Analysis (PCA), andthe recently popularized Parallel Factor Analysis orPARAFACmethod, which we focus on in this review. The key issues surrounding analysis of the EEMs withPARAFAC are the importance of reproducible andaccurate spectral and instrumental correction of thedata 1,2,6,7,91. A major required spectral-correction methoddiscussed below involves the coordinated evaluation ofthe absorbance spectrum of the sample in order to correctfor the optical processes known as “Inner-Filter Effects”(IFEs)[10-13].IFEs manifest in concentrated CDOMsamples as both absorbance of the excitation beam(primary inner filter effect), and also sample fluoresencesignals (secondary inner-filter effect), where theabsorbance spectra and emission spectral regions ofcomponents overlap. IFE correction is significant in lightof its role in referencing spectral libraries In most CDOM analyses, component identification isbased on a public or privately-generated spectral library.Obviously,both intra- and interlaboratory comparisonsmust rely on traceable and reproducible spectral-correction procedures for the identifications to bevalidated. This is of great concern given the diversity ofinstruments and conditions under which EEMs arereported in the literature for CDOM. Hence the finalsection of this article outlines our view of the future offluorescent CDOM measurement for both research andanalytical applications with regard to several prominentinternational efforts to standardize the EEM methodology. When laboratory budgets and portability considerationsare important, the bench-top AquaLog is suitable formany CDOM laboratories because it exhibits the world’shighest water-sensitivity rating for a benchtopfluorometer; it employs single-photon counting forultimate sensitivity, is portable (can be operated directlyon a ship), is fully corrected for the excitation source andinstrument response, and also is equipped with thetransmission detector needed for IFE correction. The AquaLog (Figure 1) is optimally configured forCDOM analysis using a UV-enhanced light source toexcite many UV-absorbing CDOM components of interest(1). The configuration shown also makes measurements ofturbid and solid samples easier by virtue of both thedouble-grating excitation monochromator (2), to removestray light, and the sample compartment’s switchablefront-face viewing optics (3), for when the sample is tooconcentrated or turbid to use the conventional 90-degreeoptical layout. Most important for the CDOM application,however,is that the AquaLog is configured with a high-resolution 320 mm focal-length spectrograph (iHR 320)with a thermoelectrically-cooled CCD (Synapse-OE)detector (4c), which enables EEM collection at rates fasterthan one per minute. Speed is important because manyCDOM studies involve hundreds of EEM samples. TheCCD provides an unrivaled multichannel signal-to-noiseadvantage compared to scanning monochromator single-channel-detector-based systems. A transmission detector(4b) is attached to the AquaLog's sample compartment torecord the sample’s transmission/absorbance spectrumunder the same spectral-bandpass and -resolutionconditions as the fluorescence EEM data, which is The Double-Grating Figure 1The optical layout for a bench-top AquaLog configured for rapidly measuring excitation-emission maps of colored dissolved organic matter.Numerical labels designate major components of the unit, described in the paragraph below. required for accurate IFE corrections. Also critical, theAquaLog is equipped with a reference detector (4a) tomonitor and ratiometrically correct both the excitationsource’s spectrum for the emission detector and theabsorbance detector’s signals. The system’s controlelectronics are contained in the base (5). An Overview of the Methodof Excitation-Emission Mappingwith Absorbance (IFE) Analysis of CDOM A typical EEM (Figure 2A) for a CDOM sample involvesscanning the excitation wavelength from 240-500 nm andacquiring the emission spectra from 250-600 nm.Spectral-bandpass and resolution conditions are nowgenerally accepted to be 5 nm by the researchcommunity. Because the excitation axis is scanned andthe excitation source exhibits wavelength-dependentintensity features, the emission detector signal must bedivided by the respective excitation-source intensitymonitored using the reference (R) detector at eachexcitation coordinate. Additionally both the R detectorand emission (S) detector signals require correction forthe instrument's spectral responsivity, whichconventionally includes subtracting the dark-currentsignal from each detector in addition to multiplying the Rand S signals by their respective excitation (Xcorrect) andemission (Mcorrect) spectral correction factors. Hence,the final EEM signal is recorded in our AquaLog softwareusing the general formula S/R.where Sc=(S-dark)xMcorrect and R=(R-dark) x Xcorrect. In conjunction tothe EEM fluorescence signal, the sample’s absorbancespectral data (Figure 2B) can be collected in parallel bymeasuring the transmission (4) detector signal formula l=A/Re, where A=(A - dark) and Re= (R -dark) xXcorrect. To measure the absorbance spectrum of thesample, one must also measure the I=(A/Re) of a blank Eco or reference sample to calculate Abs =log (I/I) as afunction of wavelength. The conventional reference orblank sample is usually highly purified water (e 18.2 MQ,<2 ppb total organic carbon). Note that the blank samplecan serve several additional purposes as described belowrelative to correcting and processing the EEM data forqualitative and quantitative spectral analysis. EEM Data Processing: Instrumental, Spectral,and IFE Correction with AquaLog Software Figure 3A shows for a blank sample of ultra-pure waterthat the current practice for EEMs involves measuring theexcitation and emission scan ranges, which includes theiroverlap regions. These overlap regions manifest in intensesignals from the monochromated excitation source in theemission detector’s response; these lines are caused byboth the first- (and second-) order Rayleigh-scatteringfeatures consistent with the well-known grating equation.Figure 3A also shows another spectral feature, associatedwith the ultra-pure water sample, known as the waterRaman scattering line. The Raman scattering line isrelated to the Rayleigh scattering line by a constantenergy shift of 3382 cm . Most CDOM componentlibraries contain spectra for which the artifactual Rayleighand water-Raman spectral features have been removed,and hence EEM data must be processed to remove thesefeatures systematically. Figure 3B shows the raw EEMfor a CDOM sample, namely an aliquot of a standardsample known as the Pony Lake Fulvic Acid (PLFA)sample provided by the International Humic SubstanceSociety (IHSS). Here the main contours of the CDOMcomponents are observed, along with the Rayleigh andRaman line scattering features. The AquaLog softwarepackage can remove both artifacts. Figure 3C shows theresult of subtracting the blank EEM data in Figure 3Afrom the CDOM sample data in Figure 3B, which Figure 2 An EEM of the Pony Lake Fulvic Acid standard sample from the International Humic Substance Society (A). This map, and all maps shown below,were collected using 5 nm optical bandpass at 0.1 second integration time per emission spectrum. Panel B shows the absorbance spectrum ofthe sample shown in (A) measured under the same bandpass and integration time conditions. 550 Excitation(nm) Excitation(nm) Figure 3 The fundamental instrument-correction operations for processing an EEM, including blank subtraction and Rayleigh-line nullification. The EEM ofan ultra-pure water sample serving as the blank or reference sample showing the characteristic first- and second-order Rayleigh scattering lines(white) and water Raman scattering line in yellow (A). An uncorrected EEM of the Pony Lake Fulvic Acid standard sample (B). Panel C shows theresult of subtracting the EEM data from the blank sample (A) from the sample in (B). Panel D shows the results of the algorithm that nullifies thefirst- and second-order Rayleigh lines from the map shown in (C). effectively removes the Raman scatter line. Figure 3Dshows the results of applying the Rayleigh-maskingalgorithm, which nullifies the signal intensities for boththe first- and second-order Rayleigh lines. As mentionedabove, the water Raman signal ofultra-pure water is oftenused to normalize the signal intensities of the CDOMsample EEMs; similarly many researchers choose tonormalize the CDOM EEMs based on a unit offluorescence from quinine sulfate (QSU)I1,6,12]Importantly, the AquaLog EEM-processing softwareperforms both the water Raman and QSU normalization. In addition to the fundamental water Raman and Rayleighcorrection procedures, it is common practice to correctthe EEM data for IFE using the parallel absorbancemeasurements from the sample and blank as describedabove for Figure 2. The IFE algorithms used in AquaLog require measuring the absorbance spectrum of the samplecovering the overlapping range of both the excitation andemission spectra to correct for both the primary andsecondary IFE. The most common IFE algorithm used forconventional 1×1 cm path-length cuvettes employs thefollowing simple equation applied to each excitation-emission wavelength coordinate of the EEM": where Fideal is the ideal fluorescence-signal spectrumexpected in the absence of IFE, Fobs is the observedfluorescence signal, and AbsEx and AbsEm are themeasured absorbance values at the respective excitationand emission wavelength-coordinates of the EEM. Anumber of advanced algorithms described in the literature Eco Figure 4 A comparison of the influence of the inner-filter-correction algorithm on EEMs of concentrated (top row) and dilute (bottom row) samples of thePony Lake Fulvic Acid standard sample. The uncorrected EEMs are shown in panels A and C; the corrected maps are shown in B and D,respectively. can also account for variations of the optical geometricalparameters of the cuvette path-length, beam- or slit-width,and positioning/shifting of the cuvette relative to theexcitation and emission beam paths 10,13]. Figures 4A and B show a comparison of EEMs collectedusing both a concentrated (AbS254nm~0.8) PLFA sampleto one diluted with ultra-pure water (Abs254nm ~0.2) inFigures 4C and D. The absorbance value at 254 nm is anindustry standard for evaluating the total CDOMconcentration[8]. The EEMs on the left show theuncorrected (Fobs) while the EEMs on the right show theIFE corrected (Fideal) for the corresponding samples. It isclear that for the uncorrected, higher-absorbing sample inFigure 4A that the spectral contours >300 nm on theexcitation axis are stronger compared to the contoursbelow 300 nm. This is because the IFE effects arestrongest in the UV regions (below 300 nm) where theoverlap of component excitation and emission spectra islargest. The IFE correction (Figure 4B) clearlyreconstitutes the same contours seen with the dilutesample (Figure 4C) and the IFE correction had littleeffect on the dilute sample EEM in Figure 4D. Likewise, Figure 5 shows in more detail the influence ofthe IFE corrections by comparing the absorbance spectraand the integrated excitation spectra of the PLFA EEM-data samples from a dilution series. Figure 5A shows theabsorbance spectra for the PLFA dilution series which areparticularly featureless with a quasi-exponential decreasefrom the UV to visible regions. Figure 5B shows the plot of the absorbance values at 254 nm from Figure 5Aversus the dilution factor used in the experiment. The datain Figure 5B exhibit a highly significant linear trend upto the peak absorbance near Abs ~0.8. Figure 5C showsthat the Fobs for the integrated excitation spectra indicatesthere is a strong reduction in the intensity below 400 nm.Figure 5D presents no correlation between the absorbancevalues at 254 nm (x-axis) and the excitation intensityvalues at 254 nm (y-axis) beyond Abs ~0.2 due to theincreasing IFE. However, as shown in Figure 5E, whenthe IFE is corrected as described above, the excitationspectral intensity is recovered, closely paralleling theabsorbance spectra (Figure. 5A) for the all samples. Thehighly significant linear relationship between theexcitation intensity at 254 nm and the absorbance at 254nm shown in Figure 5F confirms the validity of the IFEcorrection and its value for concentrated CDOM analysis,allowing comparison to dilute sample spectra. Spectral Analysis and ComponentIdentification: Conventional NonlinearLeast-Squares and Multivariate Approaches As required by the CDOM research community, theconcerted application of the instrumental spectralcorrections, Rayleigh-line masking, water-Ramansubtraction, Raman or QSU normalization and IFEcorrection are readily enabled by the EEM-processingtools in our AquaLog software. As mentioned above, thepurpose of the spectral corrections and EEM-processing 12000020-Ex 254 nm= 105763 (Abs 254 nm)-240 F 100000o.lAidj. R-Square=0.99995 80000 90999 42999 20000 00 02 04 c06 08 1.0 Abs 254nm AU) Figure 5 C(omparison of the concentration-dependence of the absorbance spectra (A and B) and the excitation spectra of the Pony Lake Fulvic Acidsample before (C and D) and after (E and F) inner-filter correction. The samples were diluted from full strength to 100-fold as indicated in thelegends. Plots of the absorbance versus wavelength are in A; B shows the linear relationship of the absorbance at 254 nm and the dilution factor.Plots of the excitation spectra representing the integral of the excitation axis are shown in C versus wavelength. Panel D shows plo1t6s1 Fof theabsorbance value at 254 nm against the 入 excitation intensity at 254 nm; the red arrow illustrates the nonlinear region when Abs >0.2. Panel E showsplots of the excitation spectra from (C) after inner-filter correction, while(D) shows the plot of the linear relationship between the excitationintensity at 254 nm and the absorbance at 254 nm. Conclusion Several key publications and international standardsdocuments have recently been published regardingfluorescence-instrument calibration and correction.including EEM data, as well as those focusing oninterlaboratory comparisons of CDOM EEM applications.Three recent publications from NIST researchers haveparticular significance for EEM correction, including areference to the recently released ASTM standard guide(E2719) for fluorescence calibration and correction, areference to CDOM EEMs and all aspects of instrumentand IFE correction2. and a reference to the validation ofthe Fluorolog as the true accurate fluorometer for its usein generating and validating a series of StandardReference Materials. Furthermore, a recent paper hasbeen accepted outlining the results of a majorinternational interlaboratory comparison for CDOM IHSSstandard samples; this study was headed by researchersand the United States Geological Survey (USGS),and was the focused outcome of a recent 2008 Chapmanconference sponsored by the American GeophysicalUnion. In terms of potential applications of CDOManalysis two reviews of the literature exist of note,including one paper explaining the potential of CDOM formonitoring all stages of water-recycling,and anotherfocusing on analysis of natural and wastewater sources. is to makethe identification and quantification easier ofthe CDOM components that are usually based on areference component library. Here we focus attention on apopular and promising library-based multivariatetechnique for CDOM analysis, namely, PARAFAC, whichhas been documented extensively by researchers includingmany using HORIBA’s fluorescence instruments,.Importantly the AquaLog software offers direct access toa MatLabconsole for purposes of processing data using It is clear that fluorescence analysis of CDOM and the usethe PARAFAC tools in N-way Toolbox, a public-domain of EEMs will play a central role in water-quality analysispackage especially developed for CDOM analysis. The in academic and government research, as well as formodeling advantages of PARAFAC center on its ability to various municipal and industrial monitoring applications.simultaneously evaluate the EEM data as a matrix and to HORIBA presently enjoys the recognition of the industryenvelop multiple (often hundreds) of EEMs simultaneously as the leader in both hardware and software for thisfor increased statistical significance.PARAFAC has application. It is our goal to continue to designbeen successful at identifying a wide range of CDOM instrumentation and software and to promotecomponents including humic and fulvic acids, tryptophan- standardization and regulations that will increase theand tyrosine-like substances, quinones, several polycyclic potential for fluorescence as a water-quality analysis tool,aromatic hydrocarbons, and distinguishing microbial, and thus help researchers trying to understand, prevent,marine and terrestrial CDOM sources. More importantly, and treat the consequences of CDOM contamination ofPARAFAC has been used to diagnose trends in CDOM our water—one of our most critical resources.components as a function of several key chemical andphysical parameters, including water-recycling-planttreatment stages, sewage dispersion, stream flow, andocean and estuarial currents, among many othersIndeed, as discussed below, the application of PARAFAChas been proposed as a standard modeling technique for avariety of water-quality applications ,14. References ( [1] AHudson, et a l ., River. R es. Applic., 23,631 (2007) ) ( [2] Holbrook, e t al., Appl. Spectroscopy, 6 0, 7 , 791 (2006) ) ( [3] S tedmon, C. A . , S. M arkager and R . Bro., M ar. C hem., 82, 239 (2003) ) ( [4] S tedmon, C. A . , S. M arkager and R. B r o., Limnol. O c eanogr.:Methods, 6, 572 (2008) ) ( C ory, R. M., a nd D. M . McKnight,Sci.Technol., 39 , 8142 (2005) ) ( C ory, et a l., Limnol.Oceanogr.: Methods, 8, 67 (2010) ) ( [7] DeRose,et al., Rev. Sci. Instr.,78,033107(2007) ) 日Murphy, et al., Environ. Sci. Technol., (in press), (2010)呵 ( P aul C . DeRose and Ute Resch-Genger,, Anal. C h em.,82,212 9 (2010) ) ( Qun G u and J o nathan E . Kenny, Anal.Chem.,81, 420 (2009) ) ( L a kowicz, J. R., Principles of Fluorescence Spectroscopy,3e d . S pringer Science and Business Media, L L C: New Yor k , (2006) ) ( [12] Tobias L arsson, Margareta Wedborg, and David Turner, Anal. C h im.Acta, 583, 357(2007) ) ( [13] B. C. MacDonald, S. J. Lvin, and H. Patterson,Anal. Chim. Acta,338, 1 55 (1997) ) ( [14] Henderson, et al., A review . Water Research, 43, 863 (2010) ) Adam M. GILMORE Flourescence Product Div.HORIBA Jobin Yvon Inc.Ph.D. Stephen M. Cohen HORIBA Jobin Yvon IncSenior Technical WriterPh.D. eadout English Edition No.November 方案优势:专利A-TEEM技术,同步吸收-三维荧光光谱,快速三维荧光测试,一键校正内滤效应,水拉曼/硫酸奎宁定量,结合化学计量学分析,实现不同组分定性定量分析。方案介绍:依据Aqualog专利 A-TEEM技术,消除内滤效应,准确获得荧光有机物的三维指纹图谱(激发波长-发射波长-荧光强度)信息,监测水中溶解有机碳浓度和组成,消毒副产物,消毒副产物前躯体,芳香类石油碳氢化合物,藻类等的浓度和组成。结合化学计量学分析,反应出组份分布,弥补了COD和BOD测试时间长,水体中有机物种类信息缺失的问题可自动
确定
还剩4页未读,是否继续阅读?

产品配置单
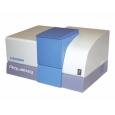
HORIBA(中国)为您提供《地表水中腐殖质、富里酸、类蛋白、有色溶解有机质检测方案(分子荧光光谱)》,该方案主要用于环境水(除海水)中有机物综合指标检测,参考标准--,《地表水中腐殖质、富里酸、类蛋白、有色溶解有机质检测方案(分子荧光光谱)》用到的仪器有HORIBA Aqualog®同步吸收-三维荧光光谱仪
推荐专场
相关方案
更多
该厂商其他方案
更多