


方案详情
文
方波阳极溶出伏安法(SWASV)在准确检测土壤中Cd2+和Pb2+存在一些严重问题,因为多种重金属离子之间的相互作用会严重干扰SWASV信号。为了SWASV高精度地检测土壤中Cd2+和Pb2+,本文利用溶出电流峰面积并结合化学计量学和机器学习来抑制离子间相互干扰。首先,使用原位镀铋膜修饰的玻碳电极,采集多种重金属SWASV信号。然后,通过PLSR和SVR两种机器学习算法建立Cd2+和Pb2+的检测模型。此外,本研究设计了一种算法,自动获取Zn2+、Cd2+、Pb2+、Bi3+和Cu2+的峰高和峰面积,作为机器学习模型的输入。最后,由验证集R2和RMSE值,评估PLSR和SVR模型在多种重金属交互干扰下检测Cd2+和Pb2+的性能。结果表明,Zn2+和Cu2+存在的情况下,通过算法获得峰面积建立的SVR检测模型对于检测Cd2+和Pb2+浓度都具有最好的稳定性和准确性。利用电化学工作站控制软件获取的重金属离子峰高建立的SVR模型(Imanu-SVR)的R2和RMSE值分别为0.7650、5.3916 μg/L(Cd2+), 和0.8791、20.0015 μg/L(Pb2+);利用设计的算法自动获取的峰面积建立的SVR模型(Aalgo-SVR),R2和RMSE分别为0.9204和2.9906 μg/L(Cd2+),和0.9756和13.1574 ug/L(Pb2+)。更重要的是,在实际土壤提取物中检测Cd2+和Pb2+浓度,该方法与ICP-MS接近,验证了该方法的实用性。本研究为多种重金属共存条件下SWASV法精确检测目标重金属提供了新的解决方案。
方案详情

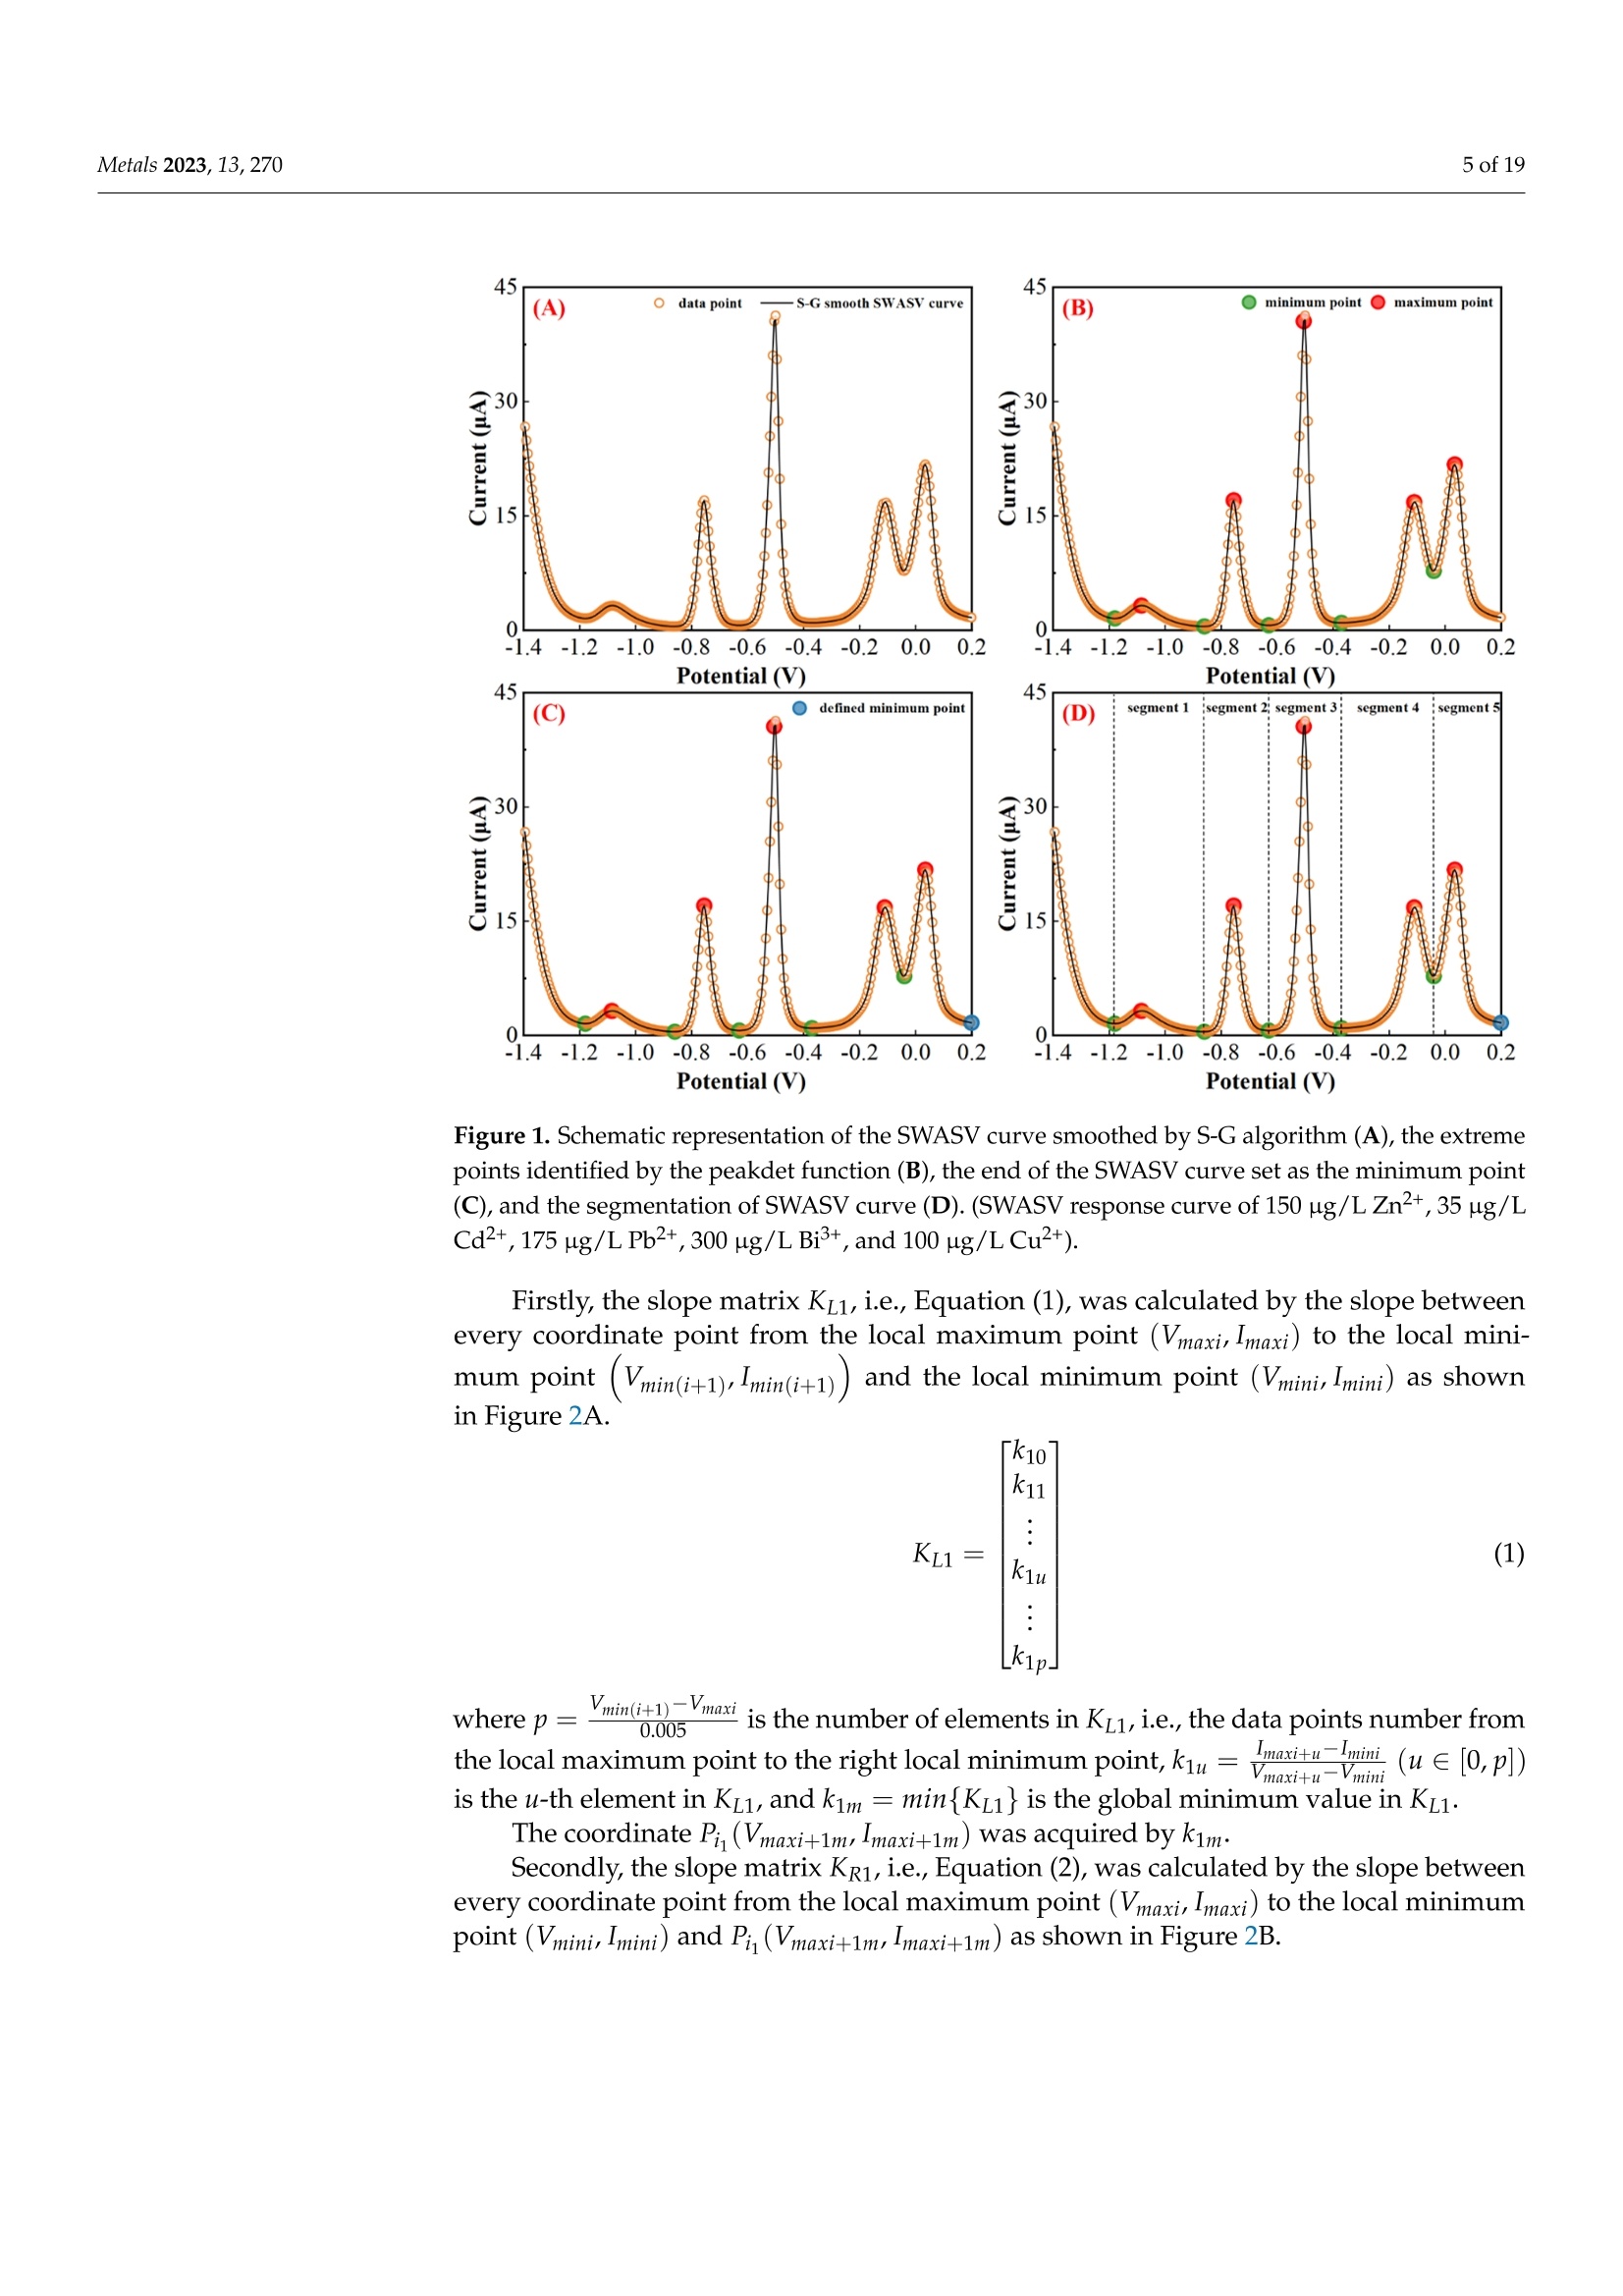
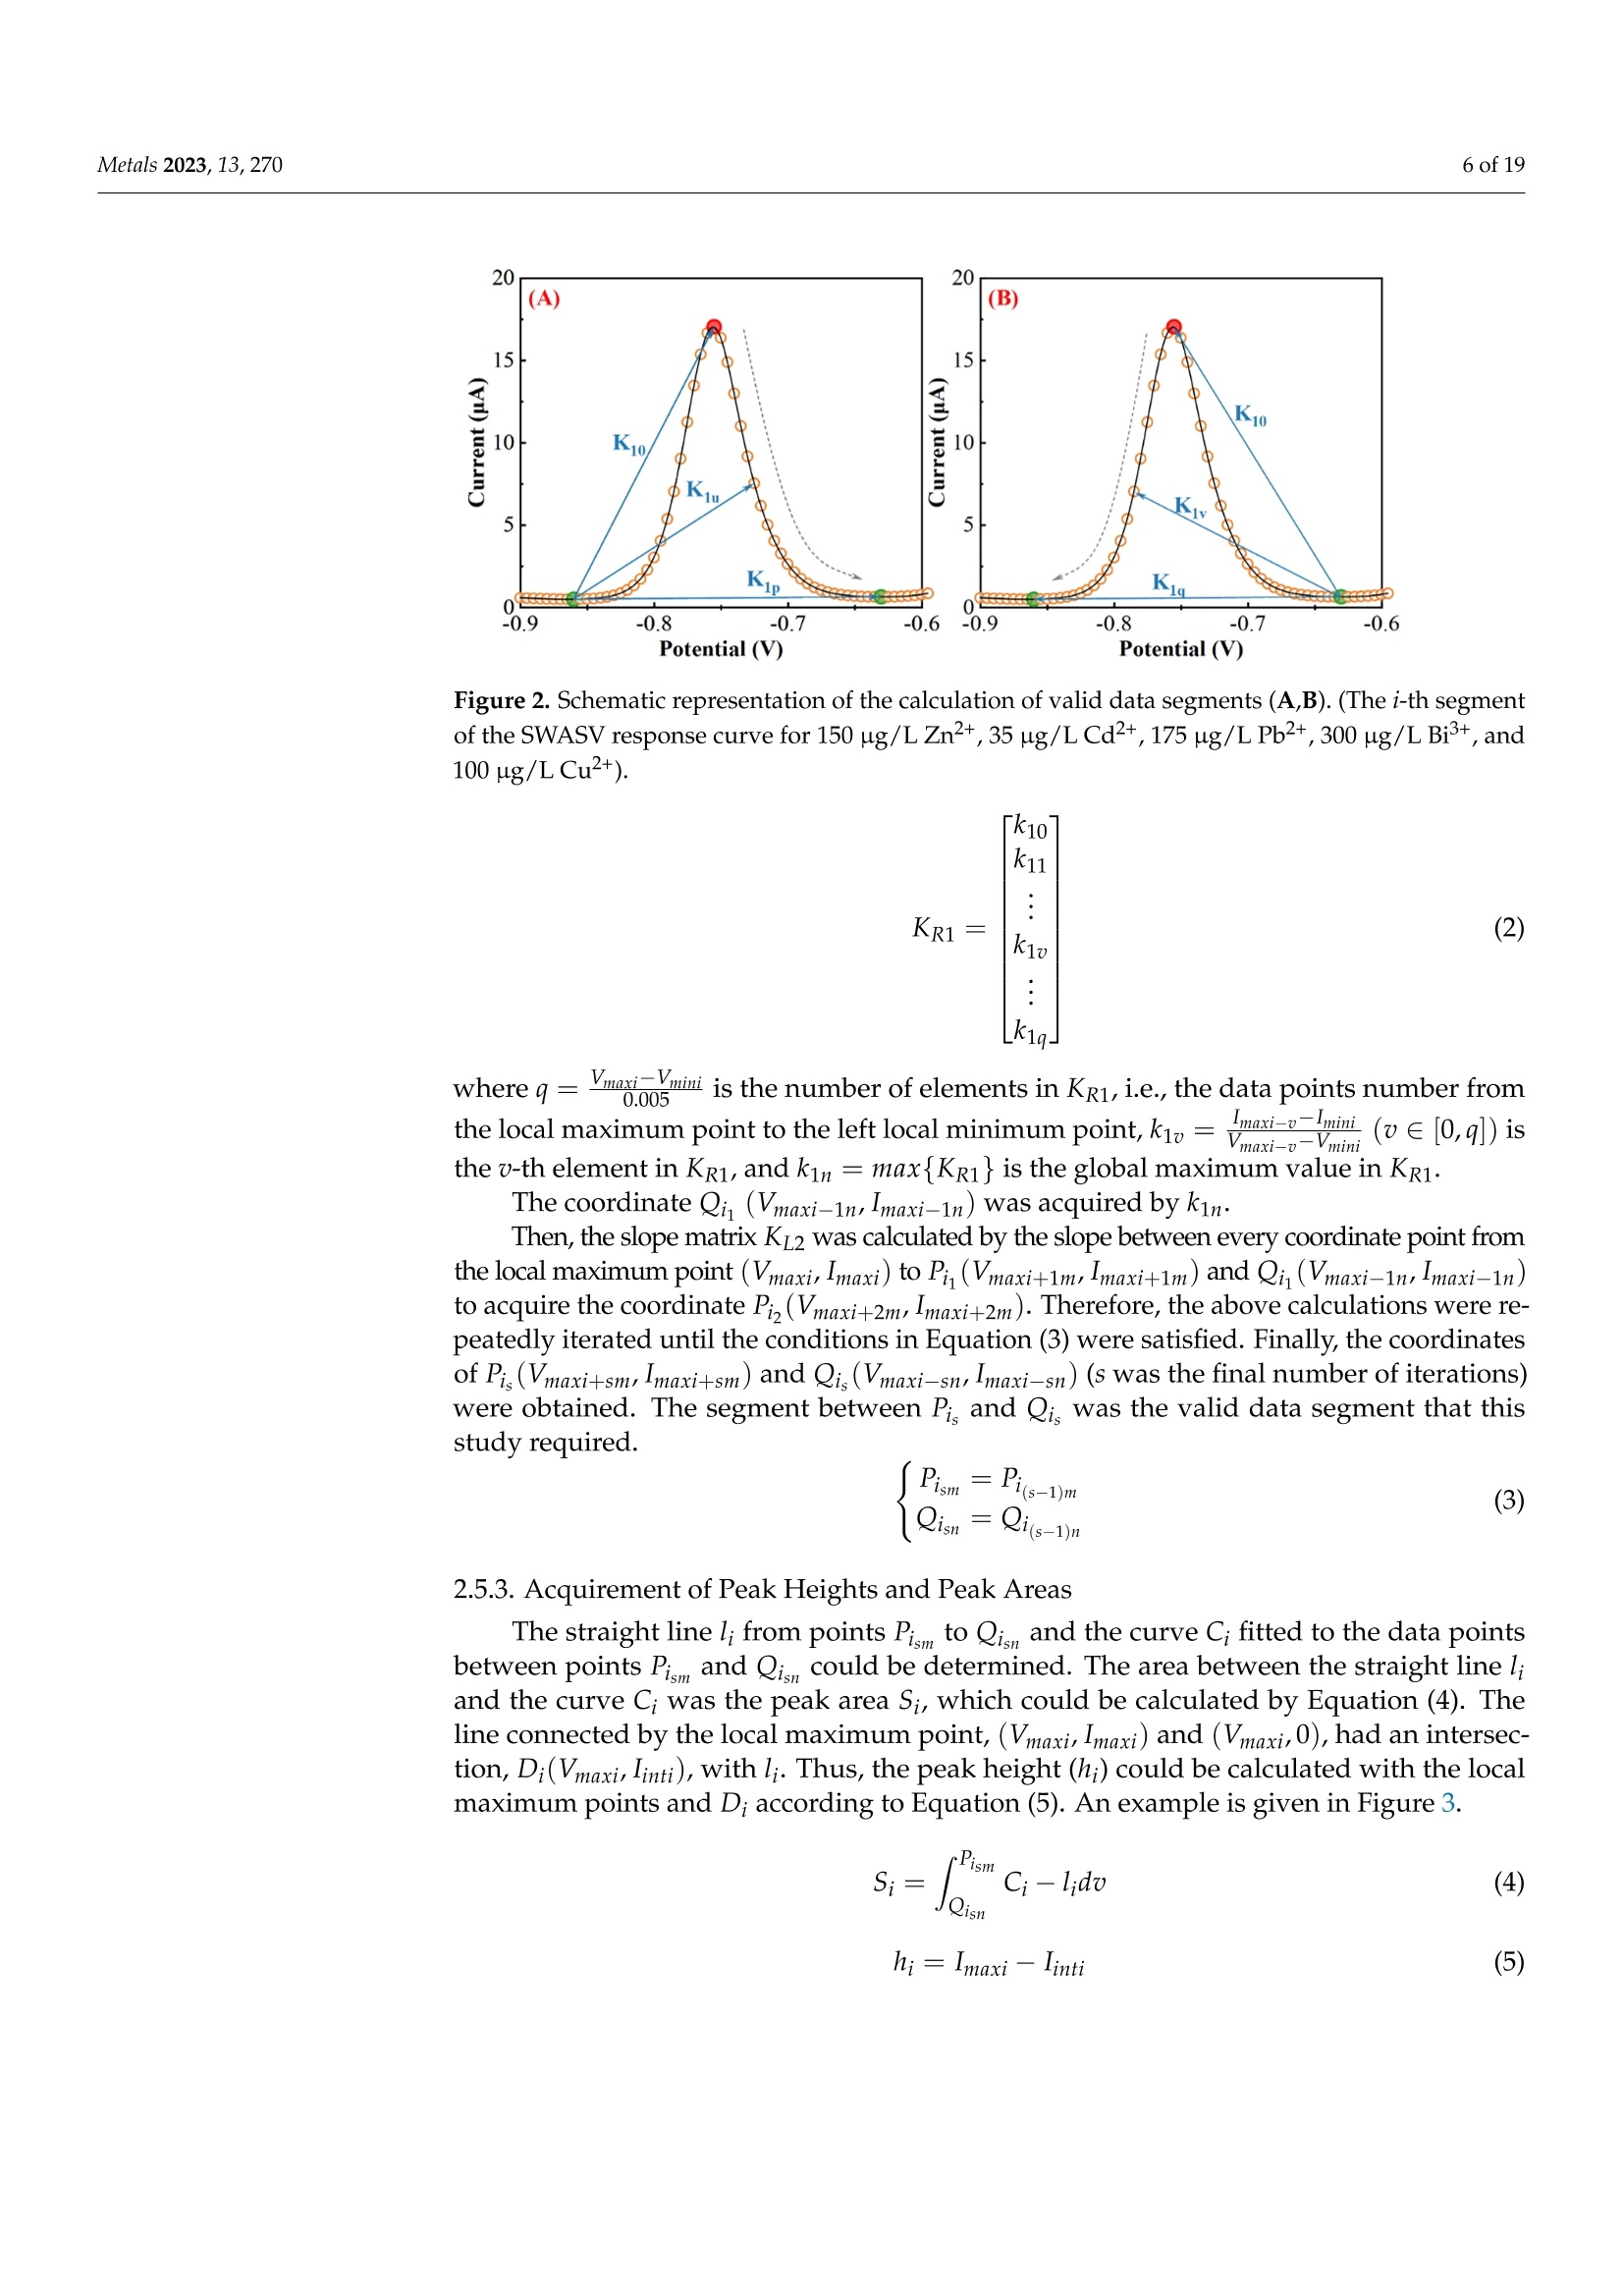
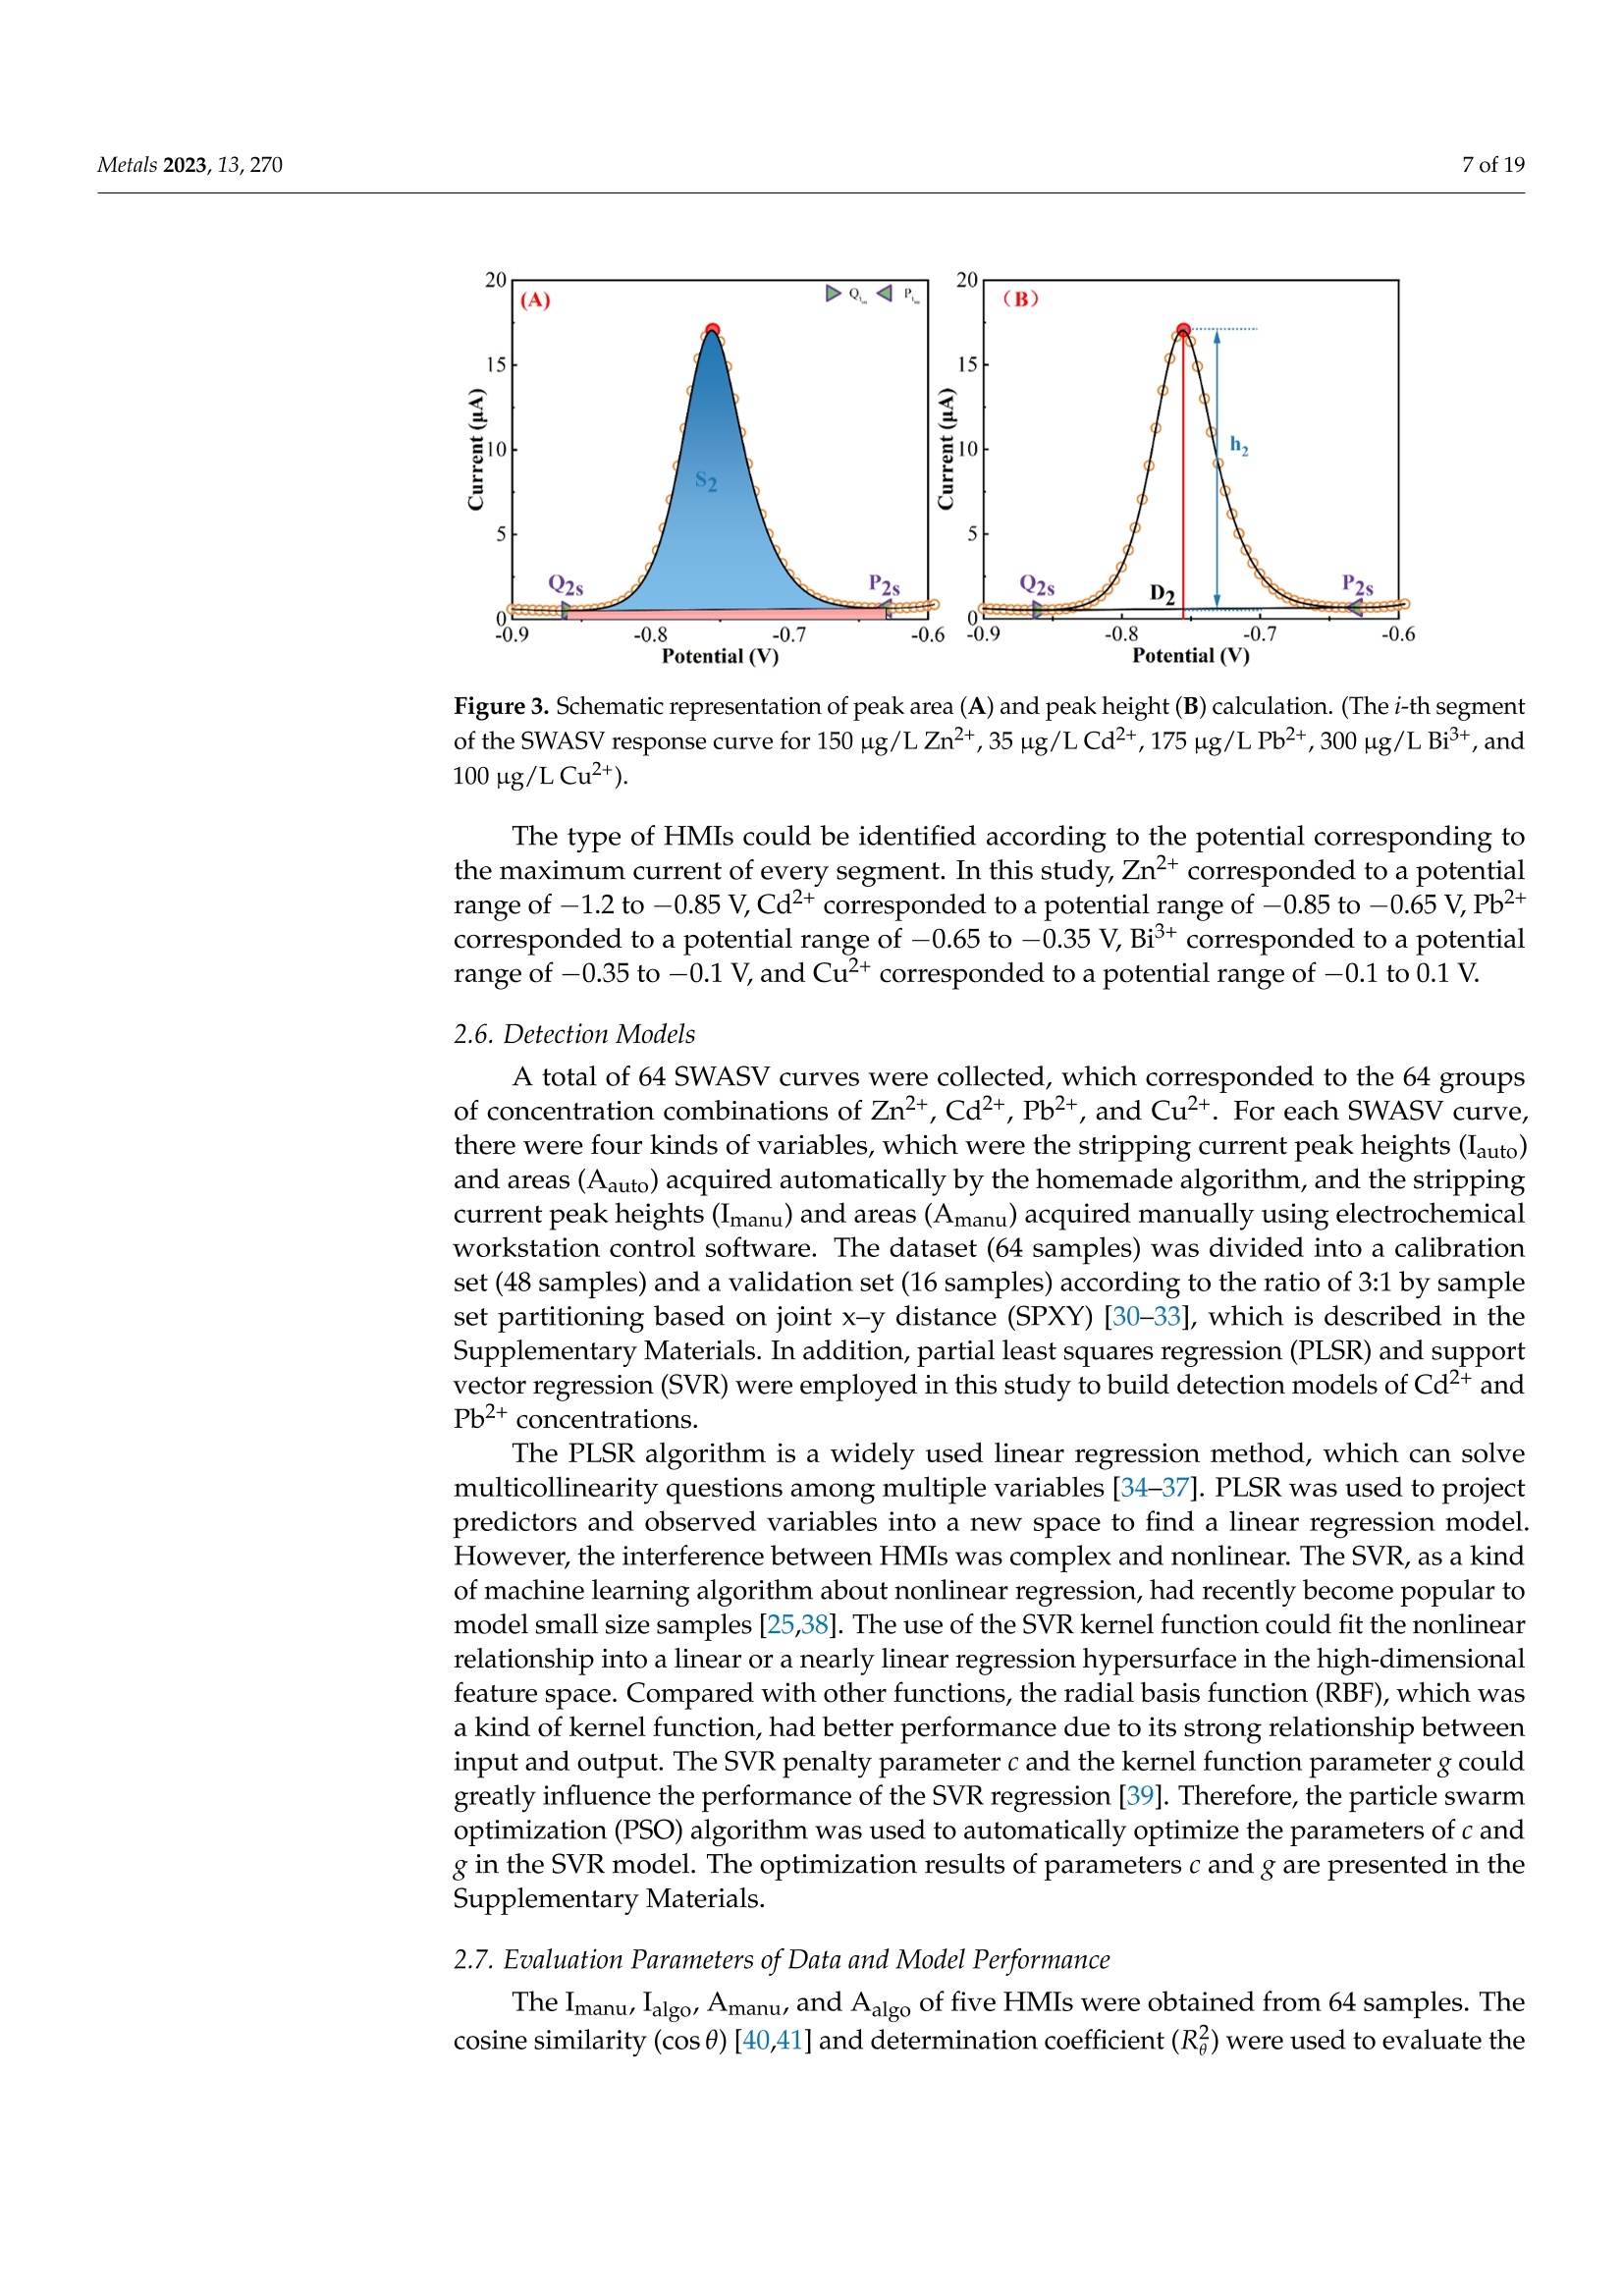
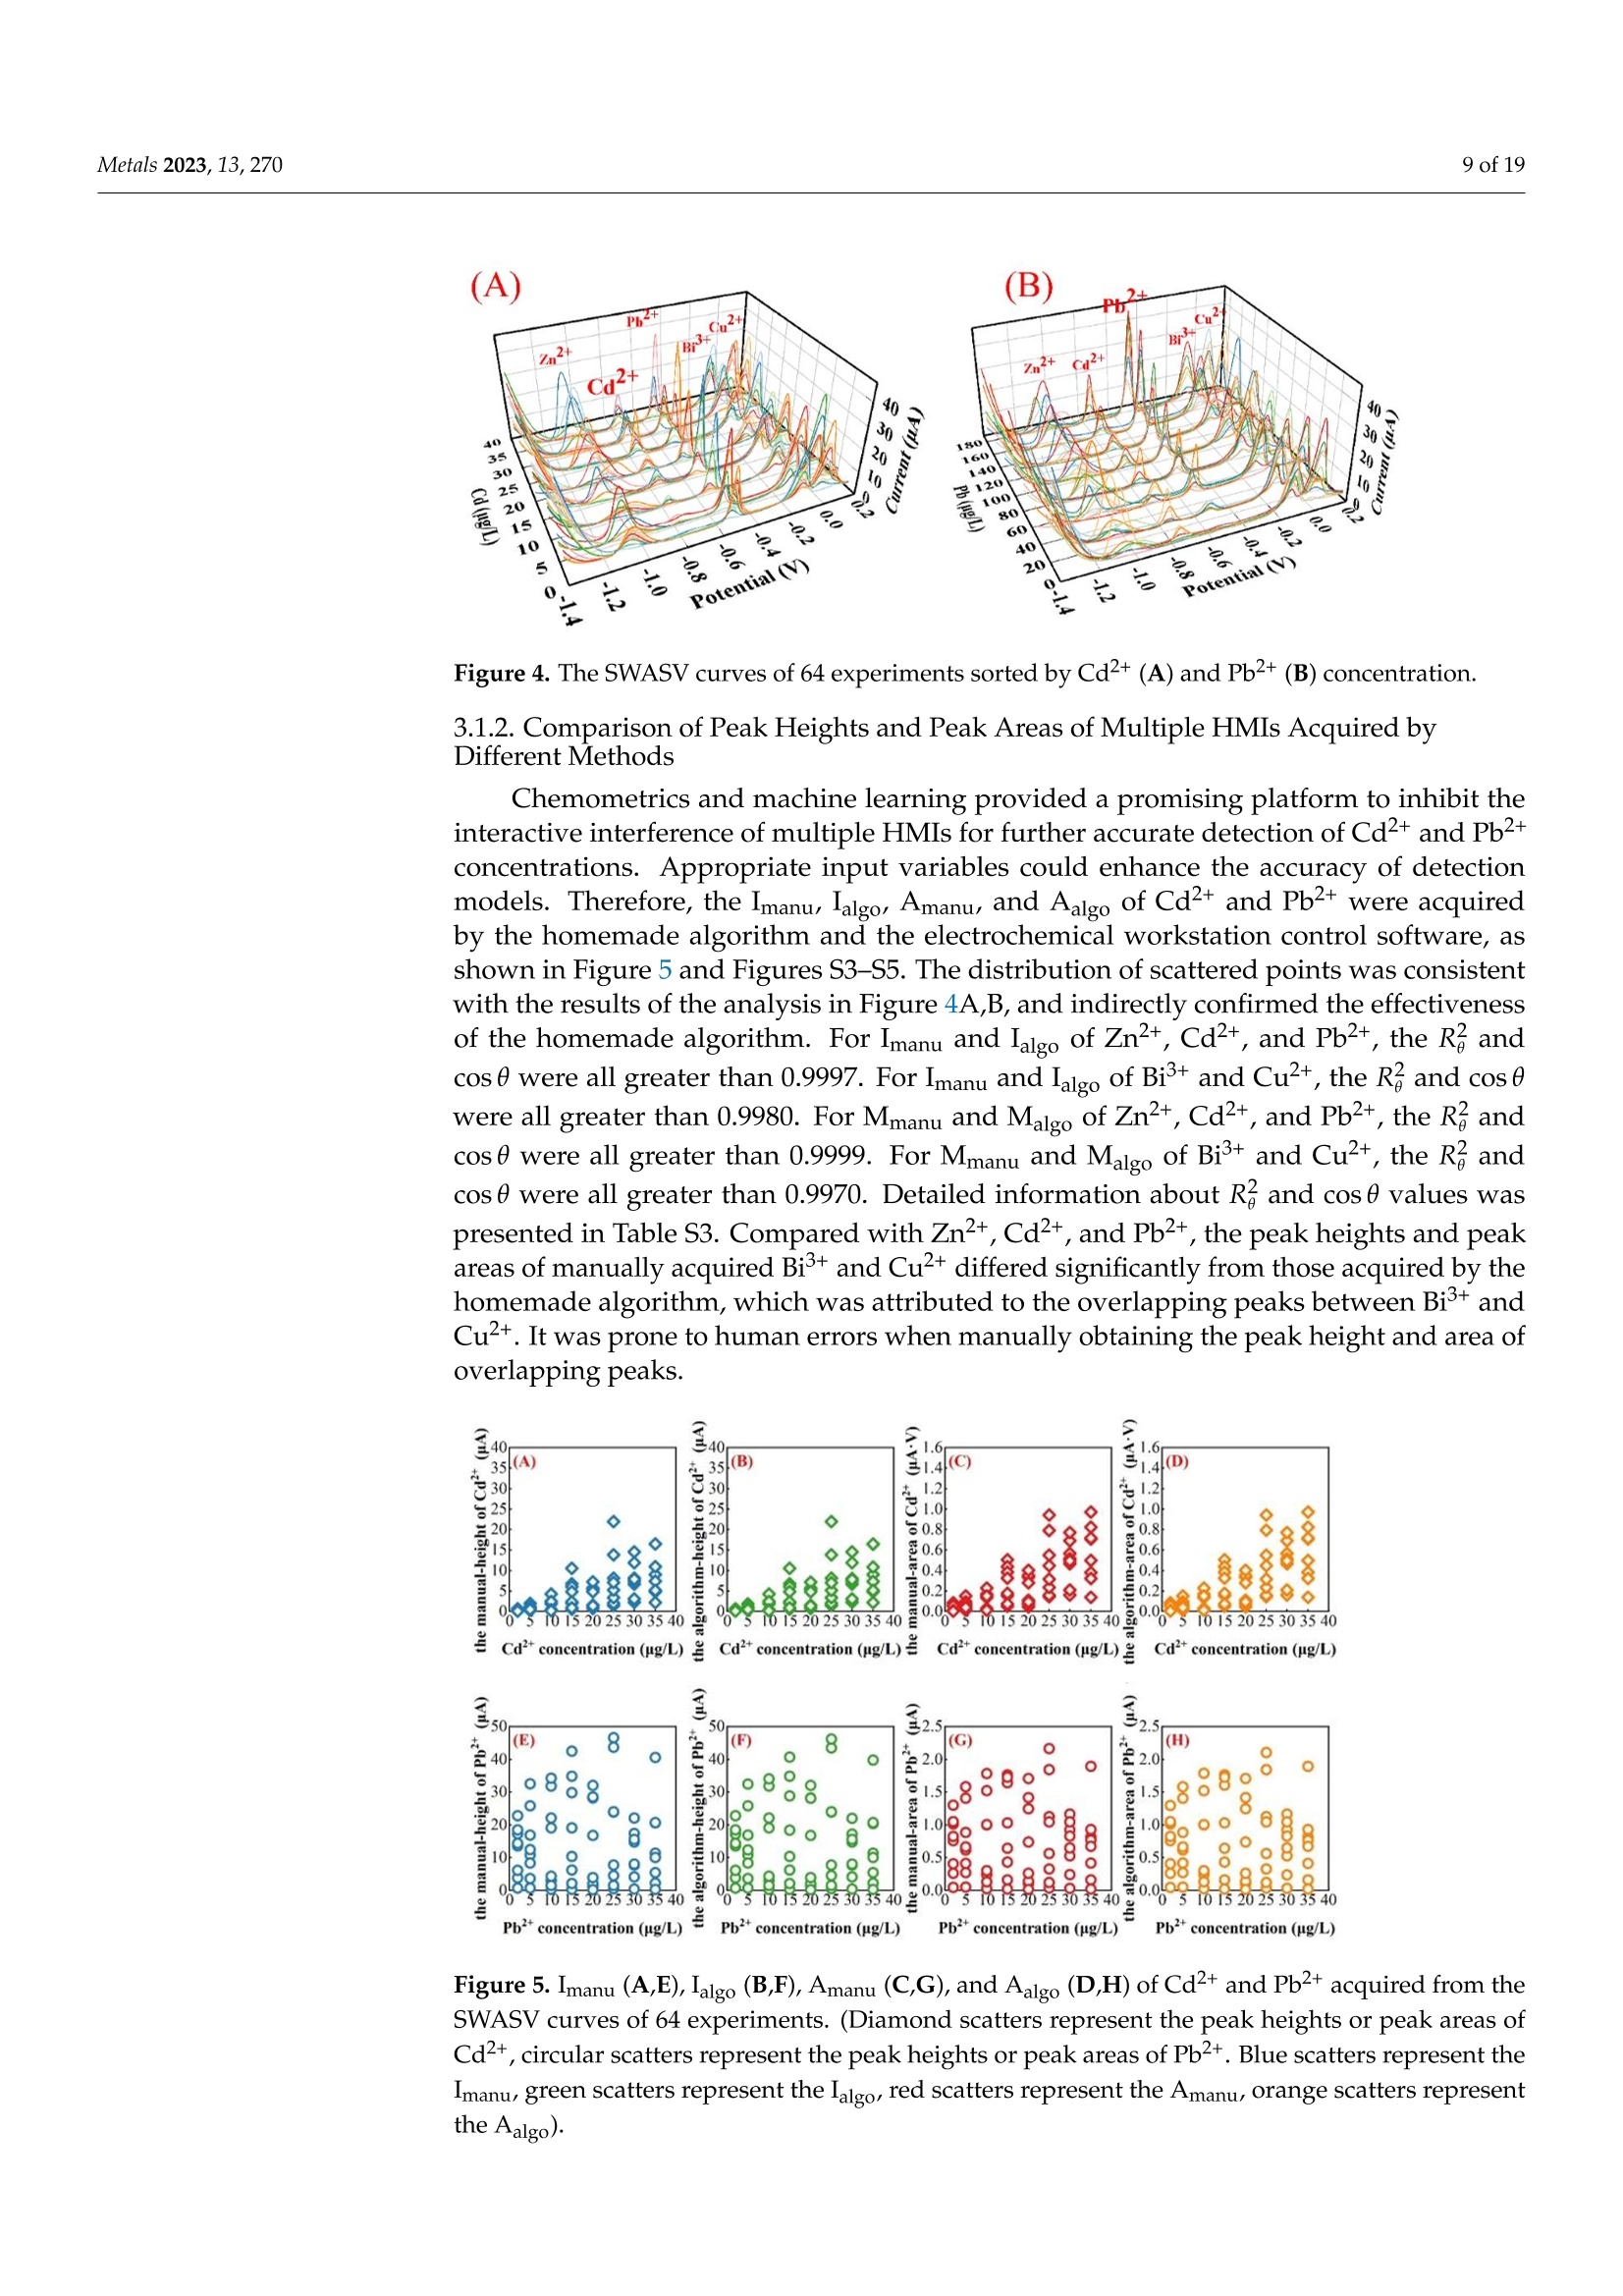
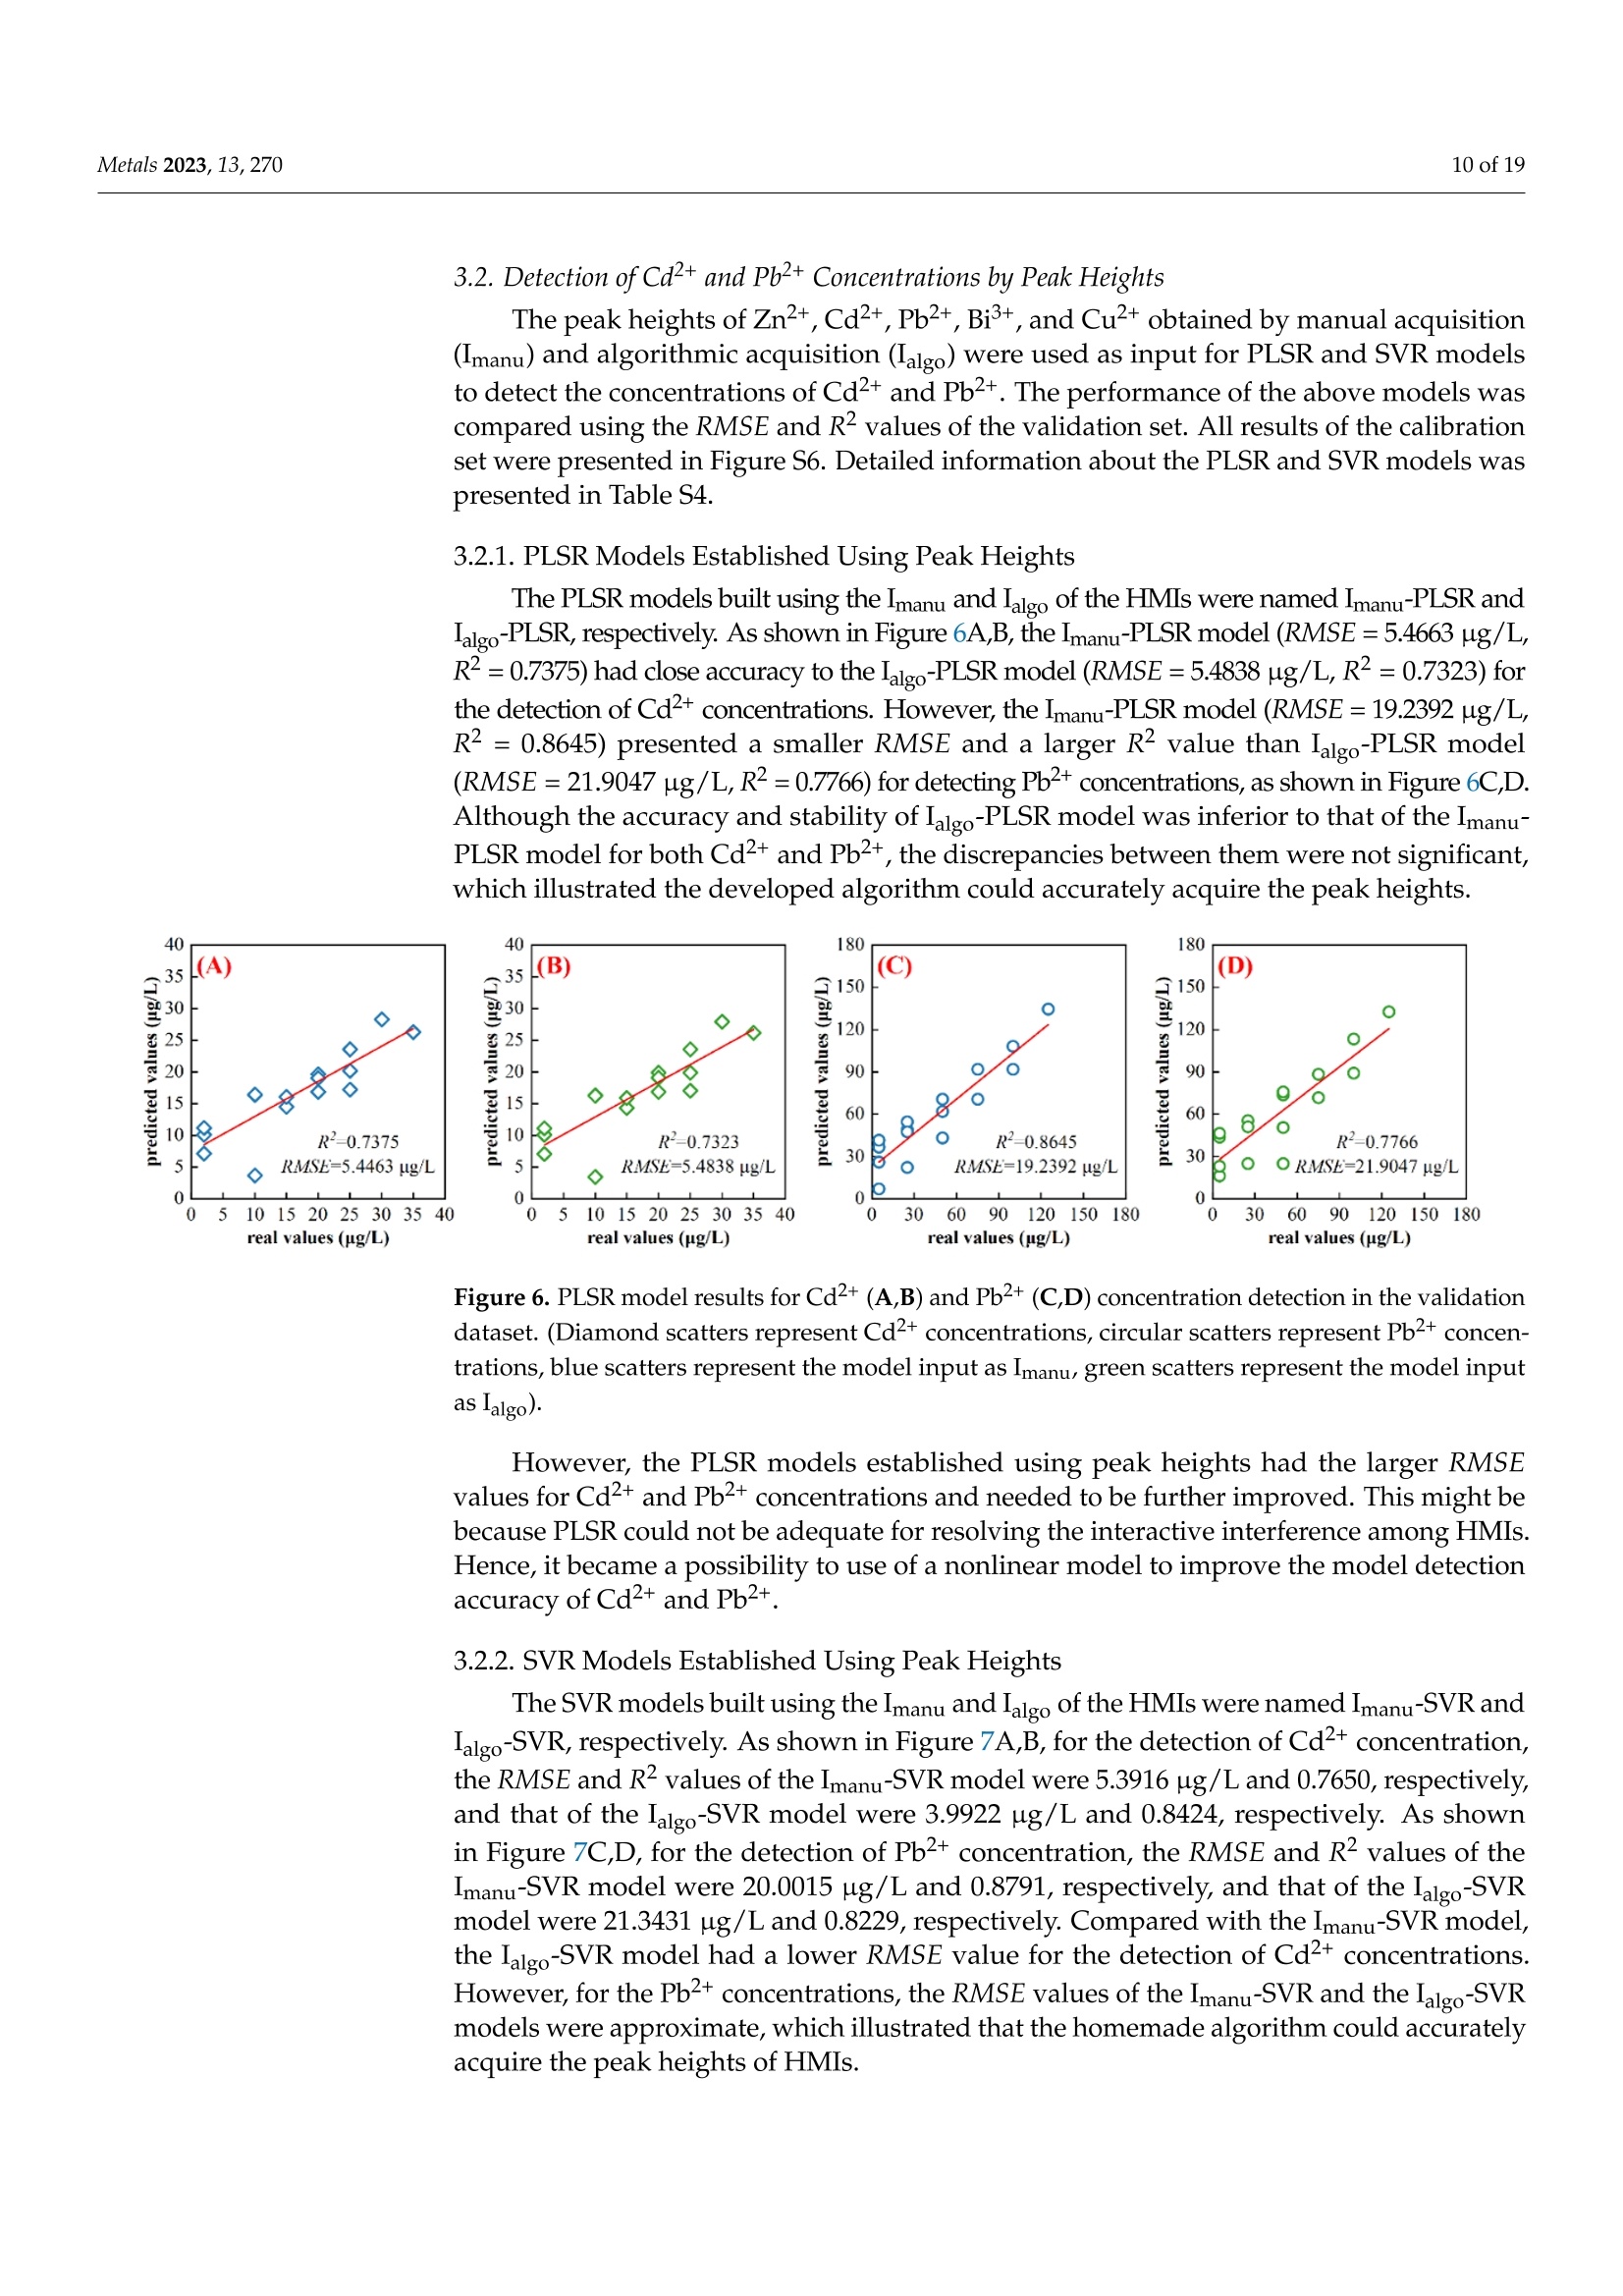
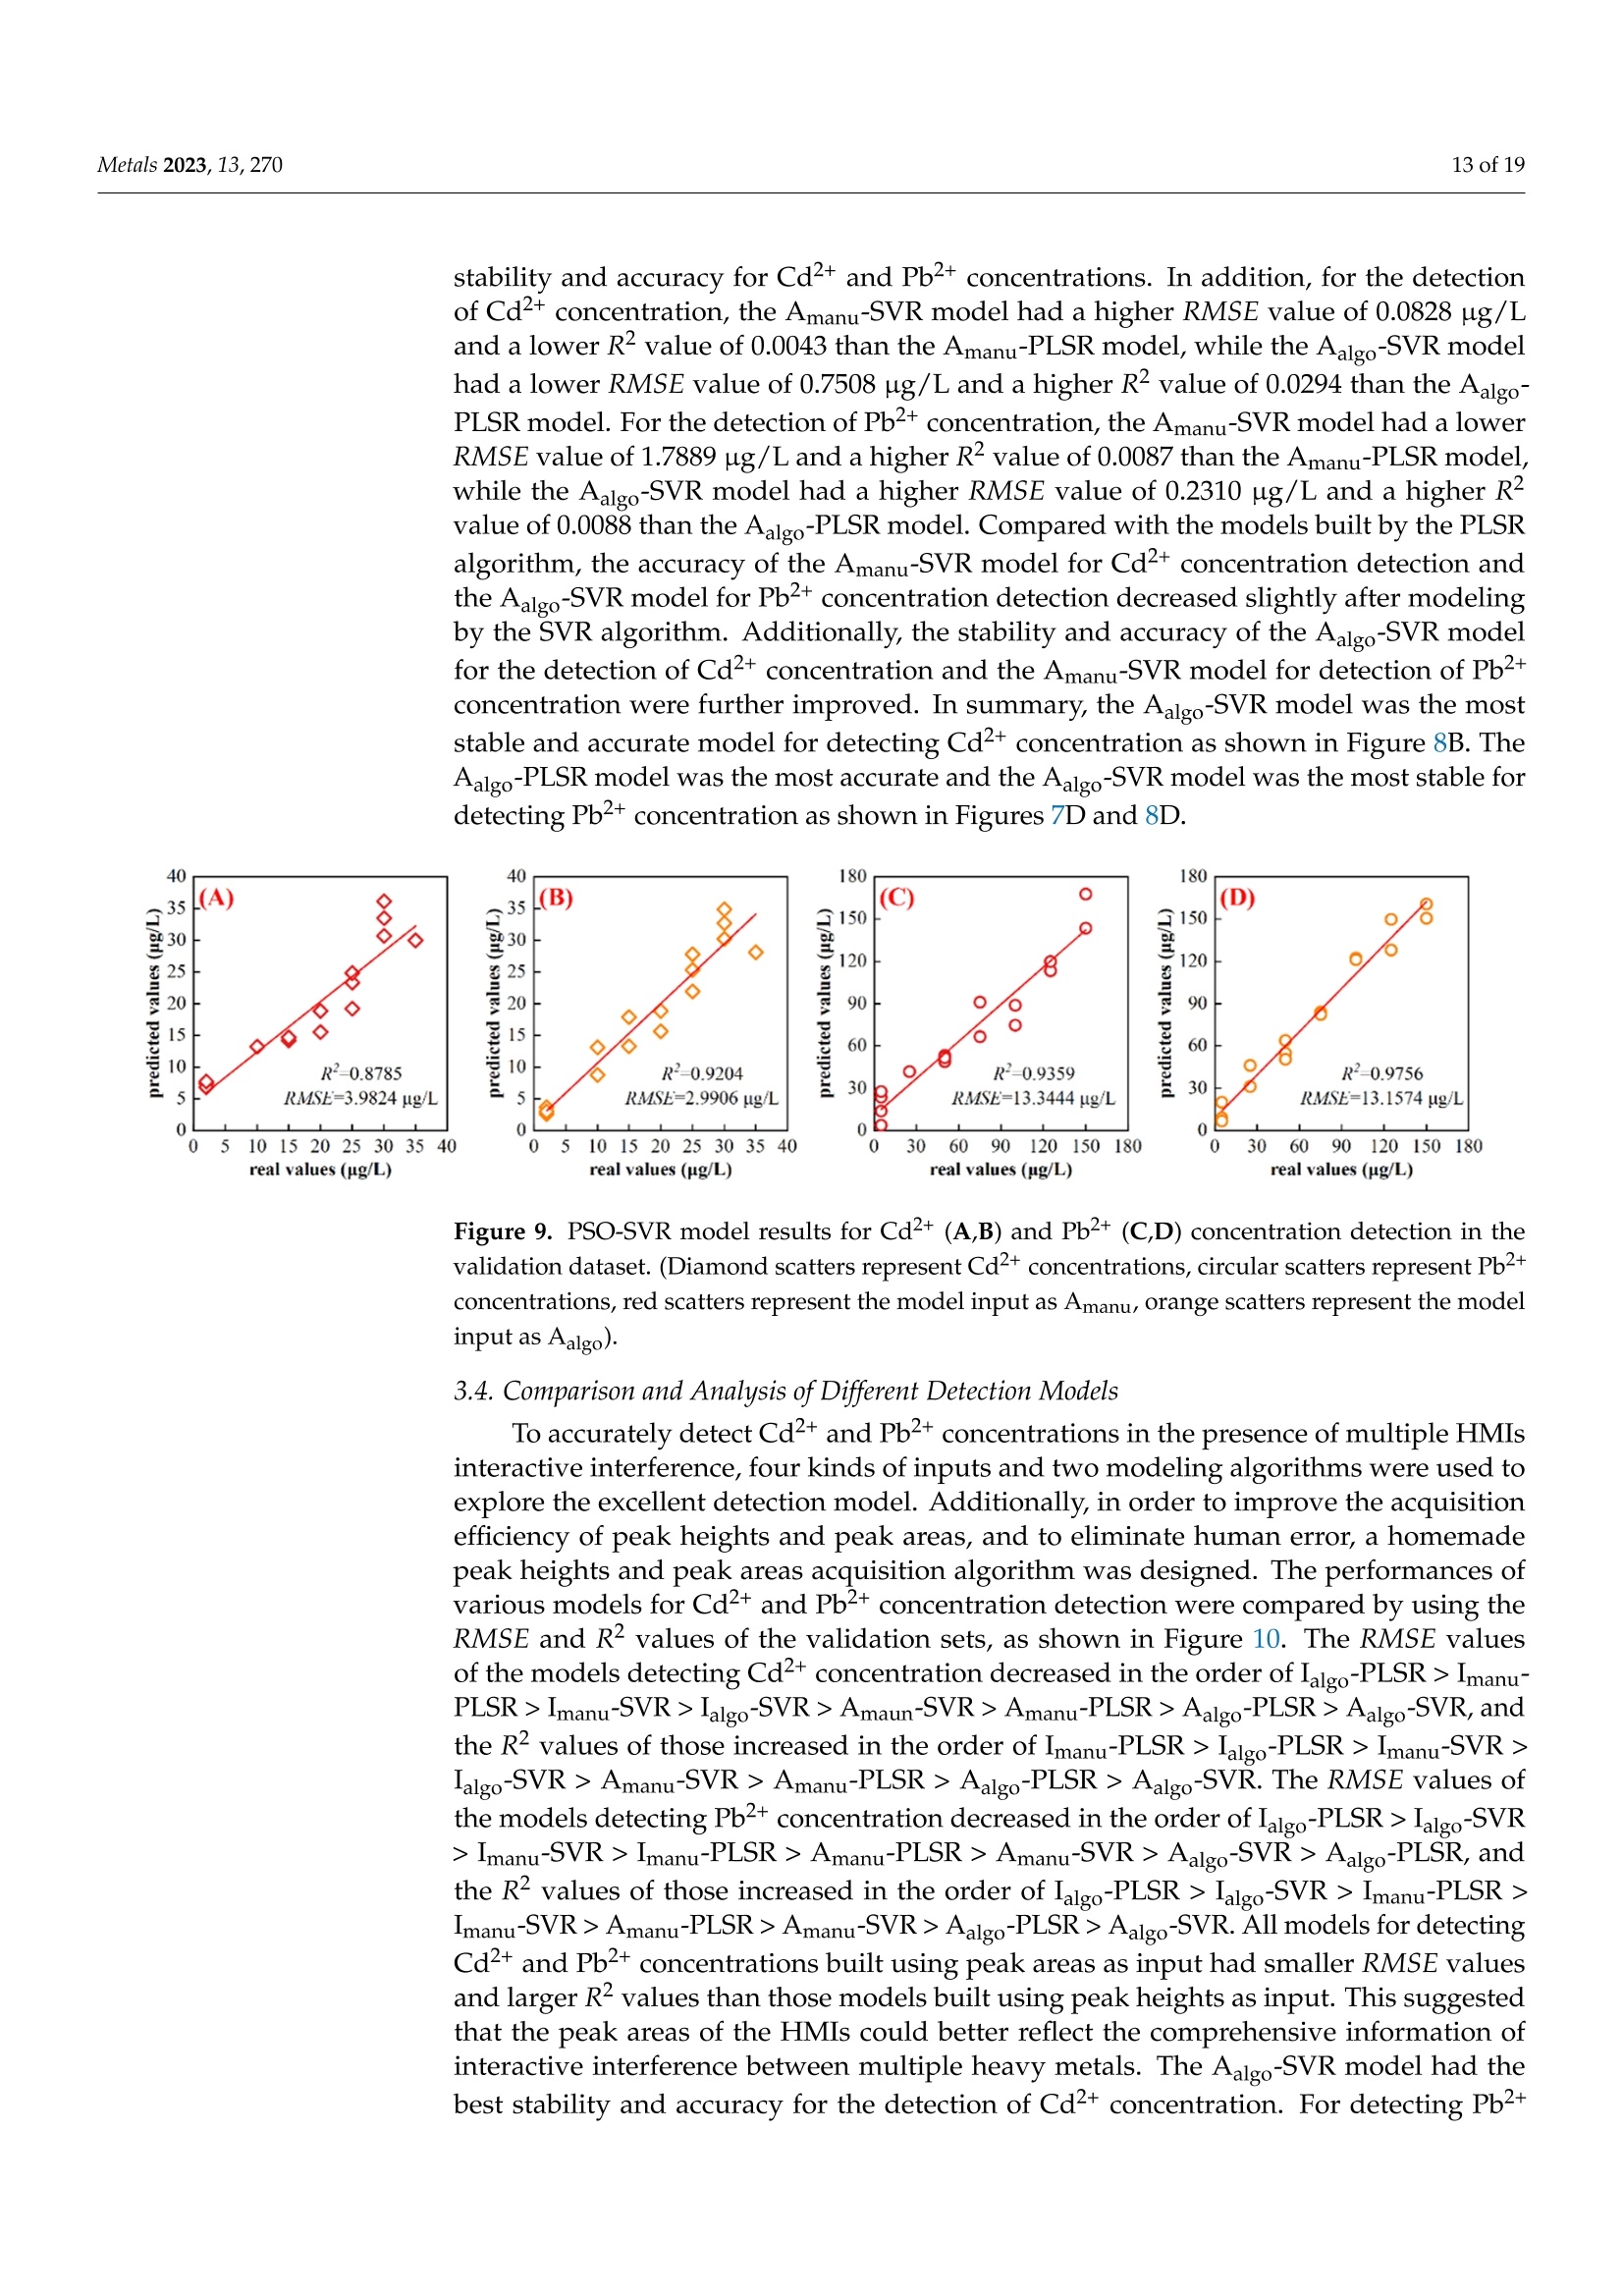
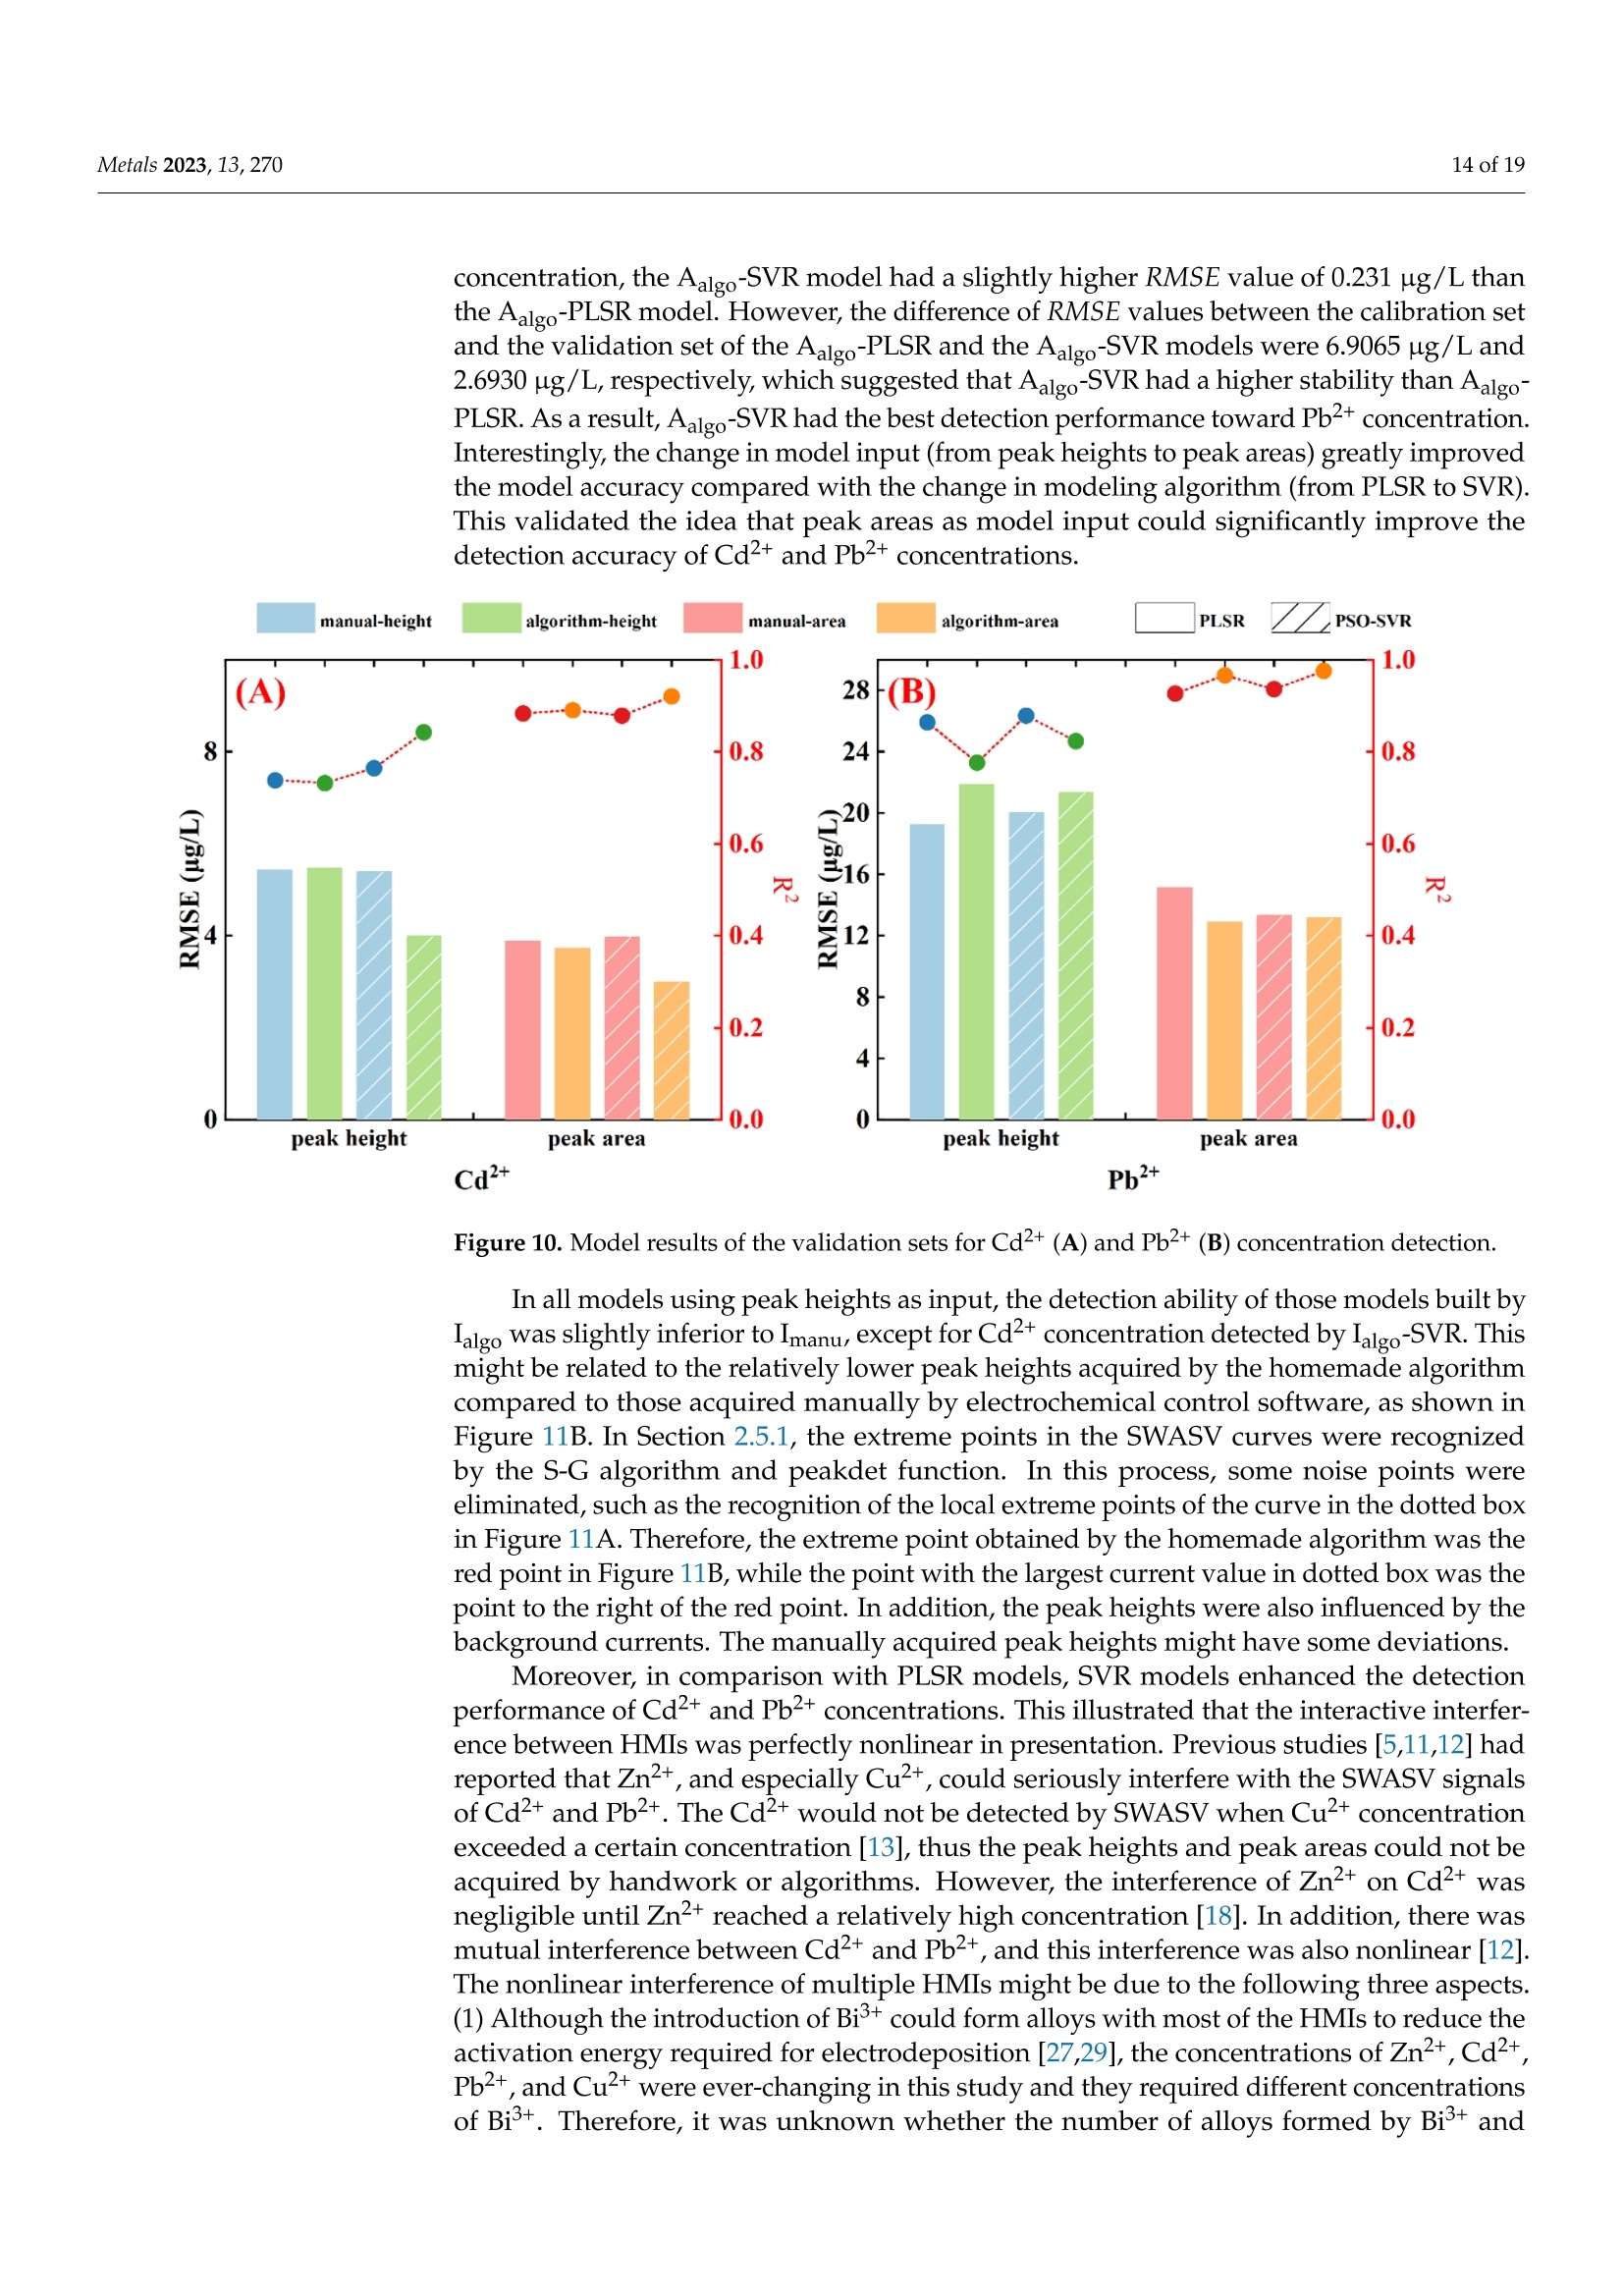
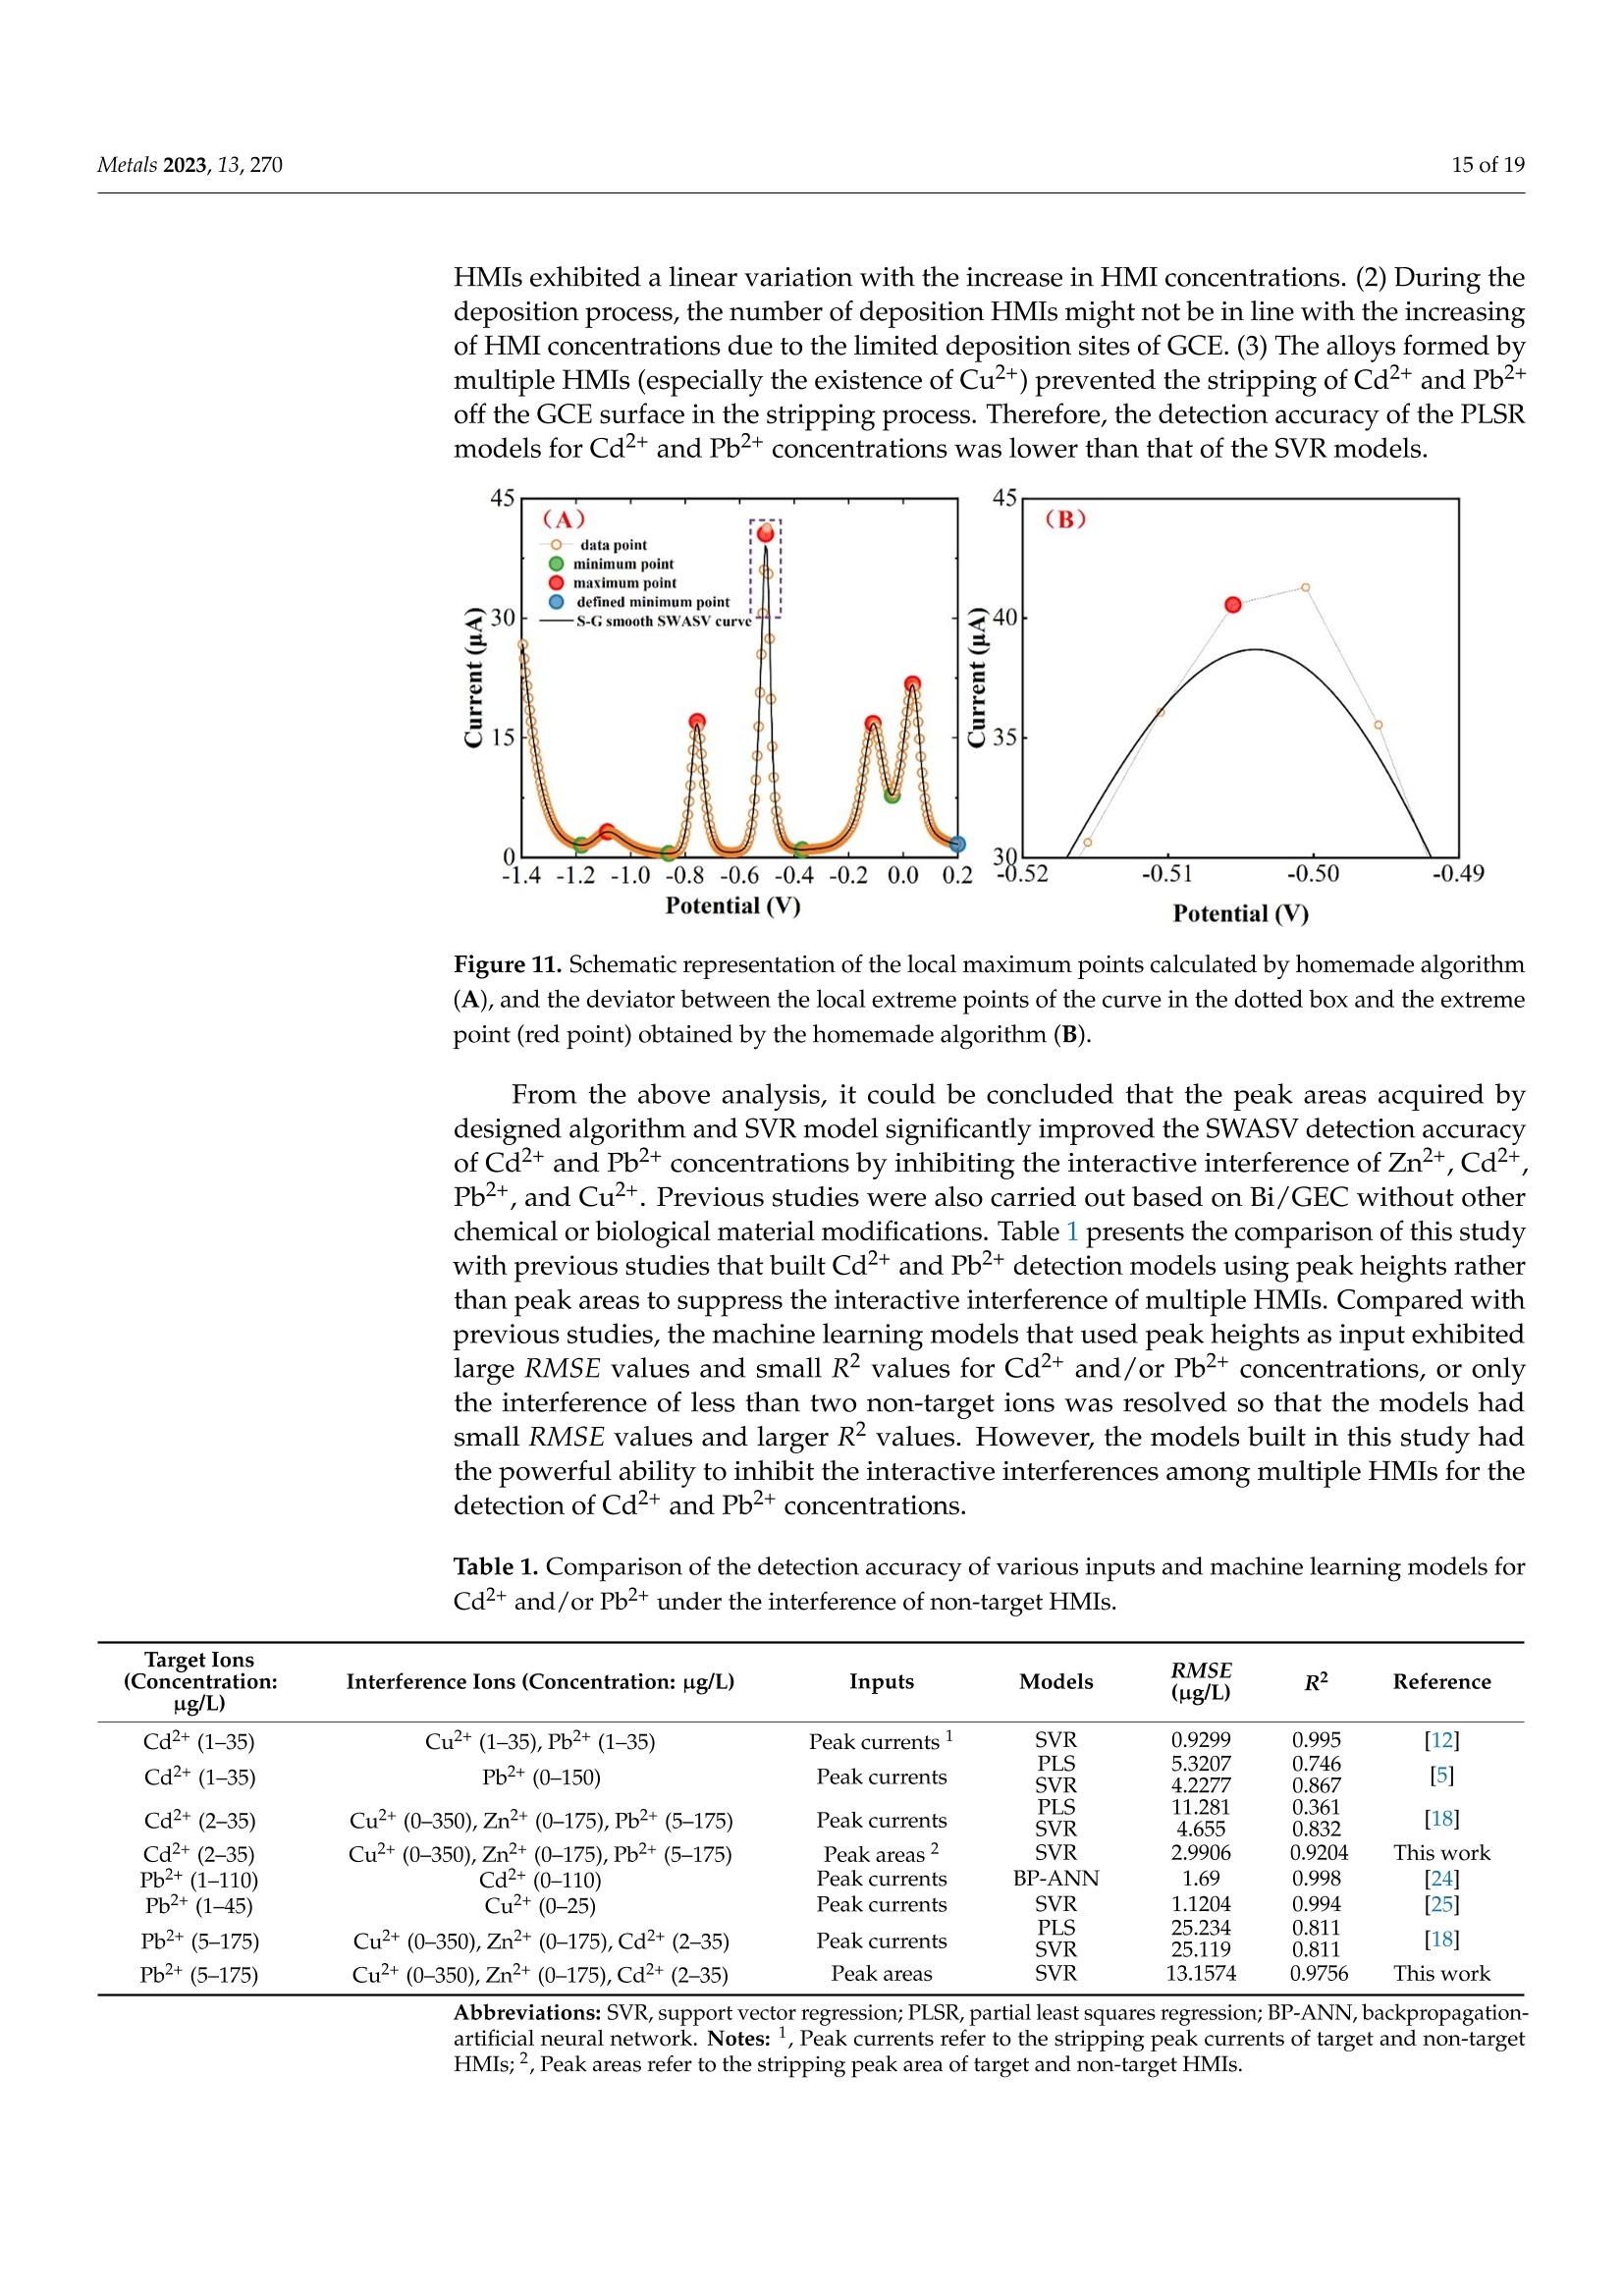
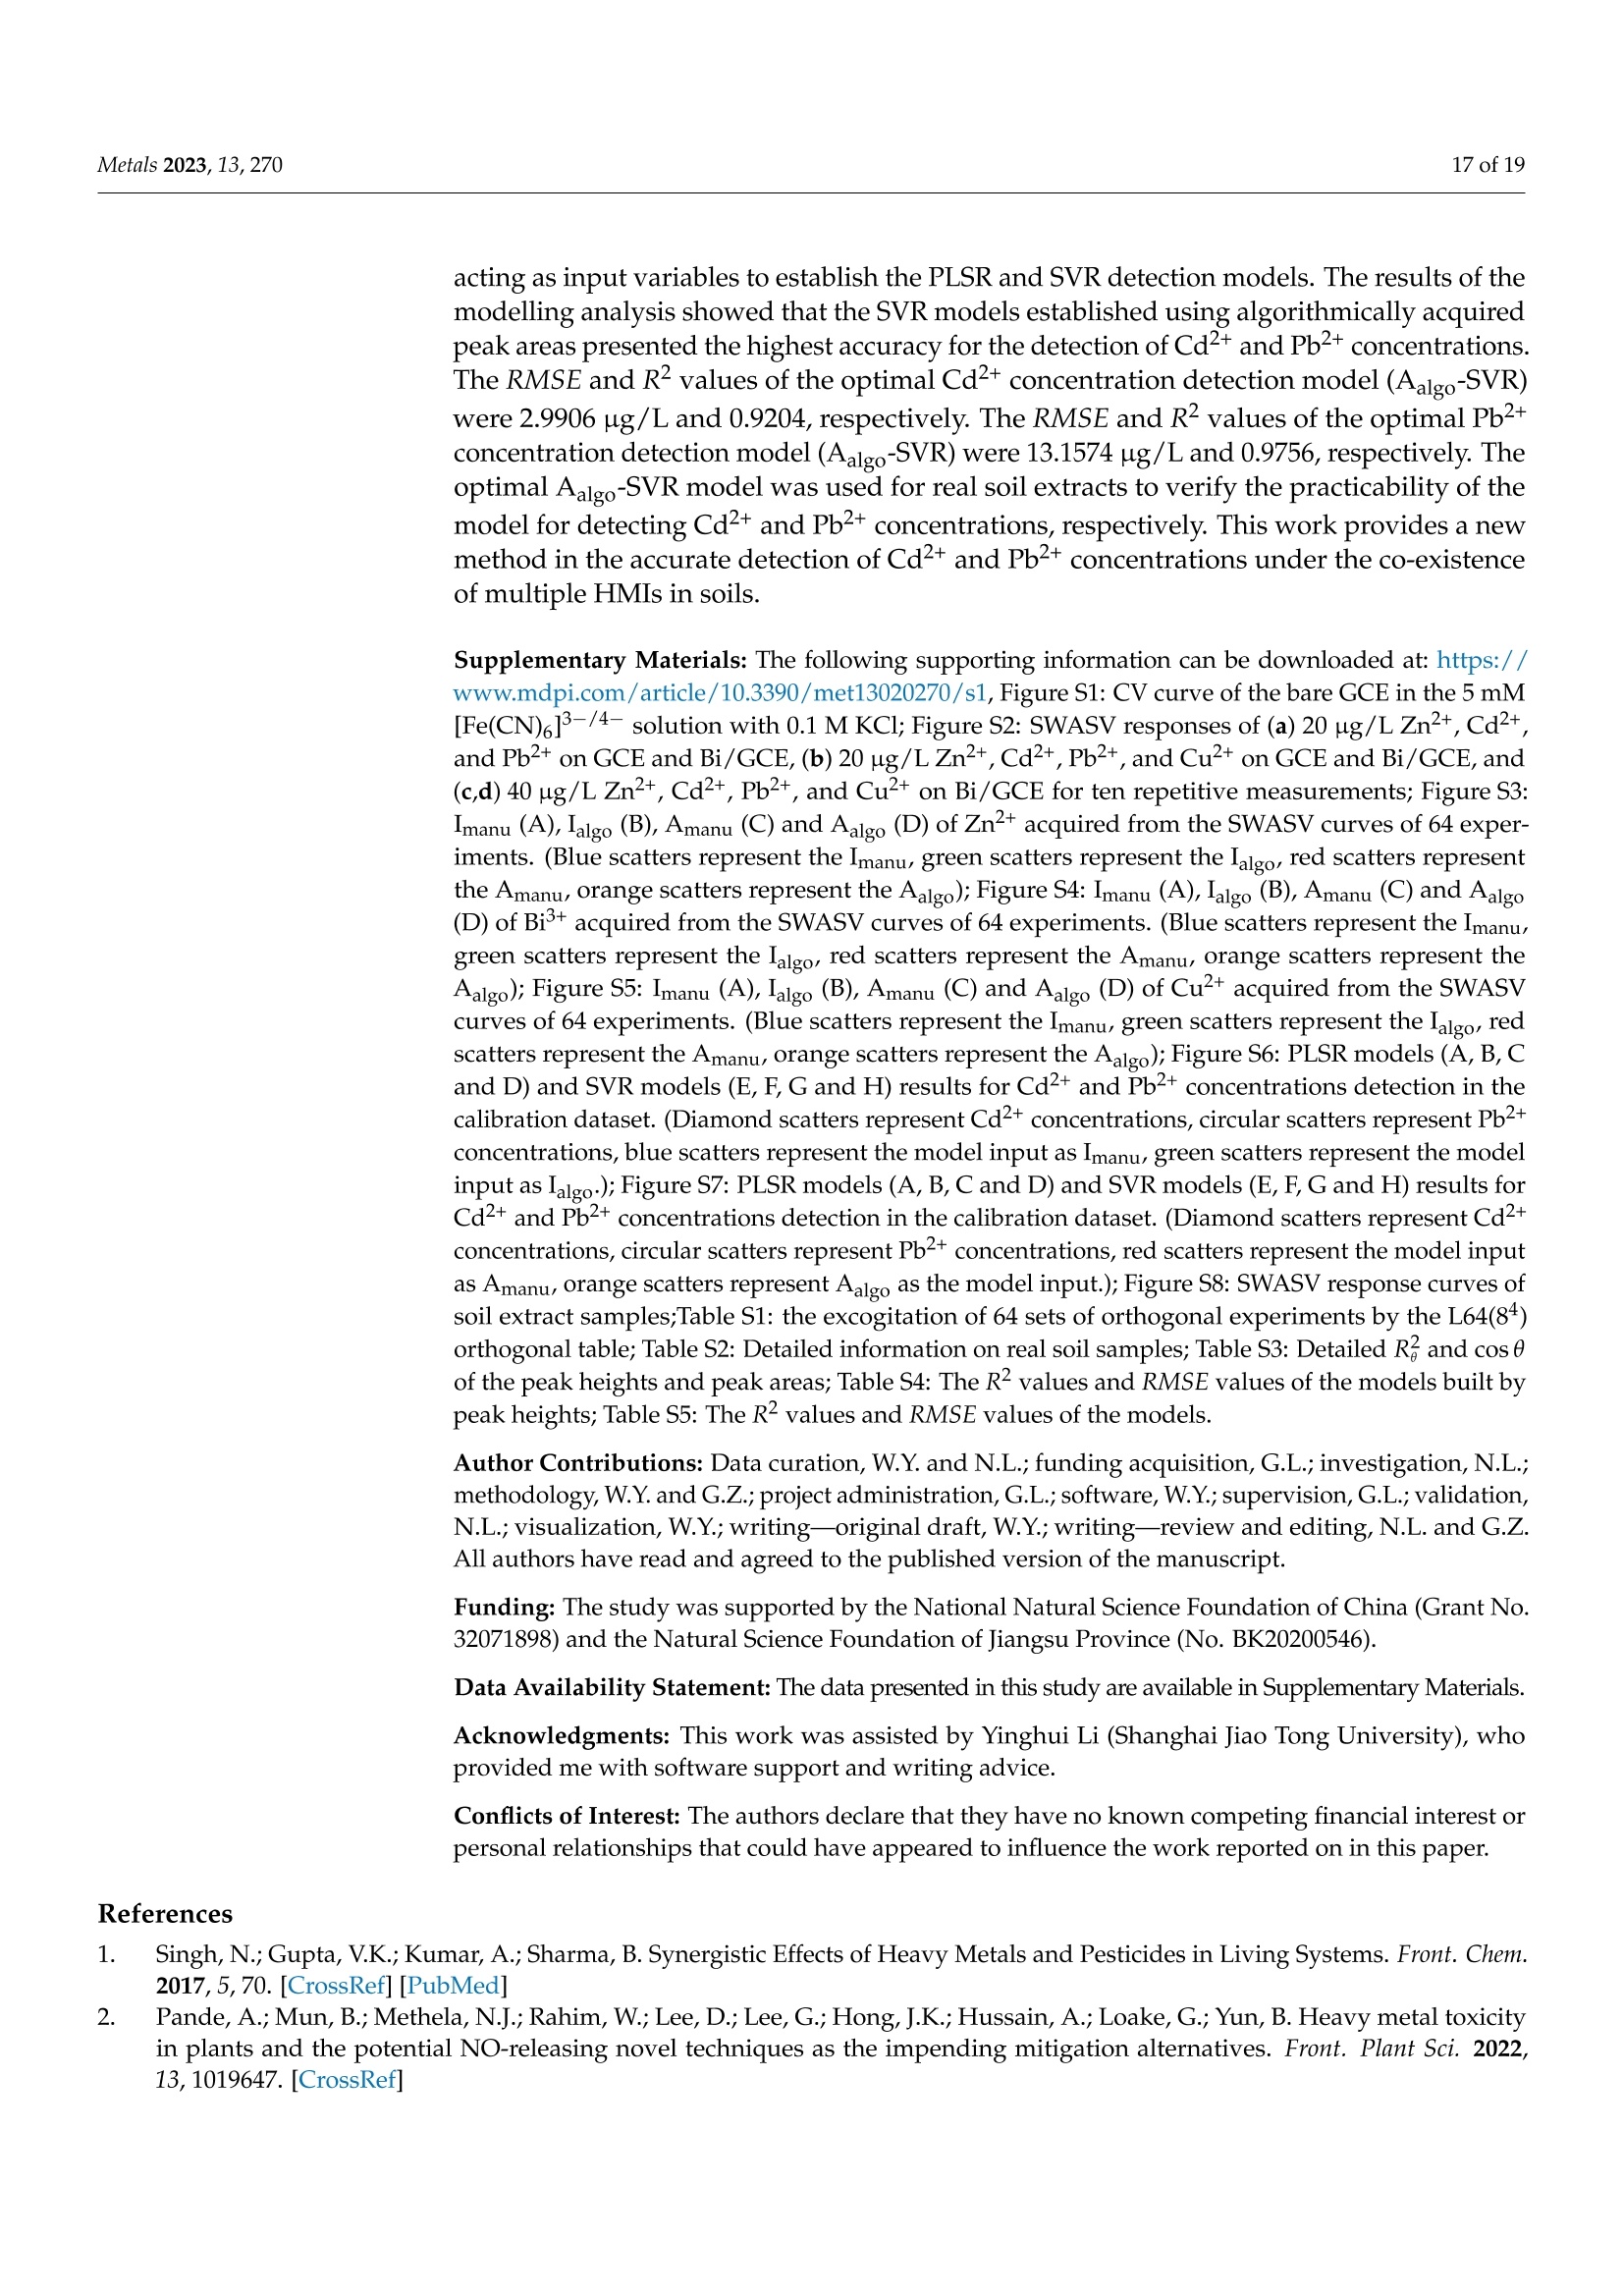
方波阳极溶出伏安法(SWASV)在准确检测土壤中Cd2+和Pb2+存在一些严重问题,因为多种重金属离子之间的相互作用会严重干扰SWASV信号。为了SWASV高精度地检测土壤中Cd2+和Pb2+,本文利用溶出电流峰面积并结合化学计量学和机器学习来抑制离子间相互干扰。首先,使用原位镀铋膜修饰的玻碳电极,采集多种重金属SWASV信号。然后,通过PLSR和SVR两种机器学习算法建立Cd2+和Pb2+的检测模型。此外,本研究设计了一种算法,自动获取Zn2+、Cd2+、Pb2+、Bi3+和Cu2+的峰高和峰面积,作为机器学习模型的输入。最后,由验证集R2和RMSE值,评估PLSR和SVR模型在多种重金属交互干扰下检测Cd2+和Pb2+的性能。结果表明,Zn2+和Cu2+存在的情况下,通过算法获得峰面积建立的SVR检测模型对于检测Cd2+和Pb2+浓度都具有最好的稳定性和准确性。利用电化学工作站控制软件获取的重金属离子峰高建立的SVR模型(Imanu-SVR)的R2和RMSE值分别为0.7650、5.3916 μg/L(Cd2+), 和0.8791、20.0015 μg/L(Pb2+);利用设计的算法自动获取的峰面积建立的SVR模型(Aalgo-SVR),R2和RMSE分别为0.9204和2.9906 μg/L(Cd2+),和0.9756和13.1574 ug/L(Pb2+)。更重要的是,在实际土壤提取物中检测Cd2+和Pb2+浓度,该方法与ICP-MS接近,验证了该方法的实用性。本研究为多种重金属共存条件下SWASV法精确检测目标重金属提供了新的解决方案。原文链接:https://doi.org/10.3390/met13020270本文中进行电化学测试的仪器为荷兰PalmSens,型号:EmStat3便携式电化学分析仪,由雷迪美特中国有限公司提供。metals Metals 2023, 13,2702 of 19 check for updates Citation: Ye, W.; L i u, N.;Zhao, G.;Liu, G. Accurate Detection of Cd+and Pb2+ Concentrations in Soils bv Stripping Voltammetry Peak Areas unde r the Mutua l Interference of Multiple Heavy Metals. Metal s 2023,13,270. https://doi .org/10.3390/met13020270 Academic Editor: Antonije Onjia Received: 14 December 2022 Revised: 20 January 2023 Accepted: 25 January 2023 Published: 29 January 2023 Copyright: @ 2023 by the authors.L i censee MDPI, Basel, Switzerland.This article is an open access article distr i buted under the terms and conditions of the Creative Commons At t ribution (CC BY ) license (https://creativecommons.org/licenses/by/4.0/) Accurate Detection of Cd2+ and Pb2+ Concentrations in Soils by Stripping Voltammetry Peak Areas under the Mutual Interference of Multiple Heavy Metals Wenshuai Ye 1,t, Ning Liu 2t D, Guo Zhao and Gang Liu 1.2* Key Laboratory of Smart Agricul t ure Systems, Ministry of Education, China Agricultura l University,Beijing 100083, China 2 Key Laboratory of Agricultural Information Acquisition Technology, Ministry of Agriculture and Rural Affairs of China, China Agricultura l University, Beijing 100083, China 3 College of Artificial Intelligence, Nanjing Agricultural University, Nanjing 210031, China Correspondence: pac@cau.edu.cn 十 These authors contributed equally to this work. Abstract: The accurate detection of Cd²+ and Pb2+ i n soils by square-wave anodic stripping voltam-metry (SWASV) faces great chal l enges because the interaction between multiple heavy metal ions (HMIs) i nterferes seriously with t heir SWASV signals. T o detect Cd+ and Pb2+ by SWASV with high accuracy, an overlooked but i nformative signal, i.e., stripping current peak area, was employed and combined with chemometric methods to suppress t he above mutual i nterference. An easy-to-prepare electrode, i .e., in-site elec t roplating bismuth f ilm modified glassy carbon elec t rode, was used to sense the multiple HMIs. Two machine learning algorithms, inc l uding SVR and PLSR, were used to estab-lish t he detection models of Cd+ and Pb2+. In addition, this study developed a homemade a l gorithm to automatically acquire the stripping peak heights and stripping peak areas of Zn2+,Cd²+,Pb2+,Bi+,and Cu2+, which acted as the inputs of machine learning models. Then, the detection performance of various SVR and PLSR models were compared based on the R2 and RMSE values of the validation dataset . Results showed that the SVR detection models established by the algorithmically acquired peak areas presented the best stability and accuracy for detecting both Cd²+and Pb2+ concentrations under the existence of Zn+ and Cu+. The R?and RMSE values of the SVR models built using the peak heights of HMIs acquired by electrochemical workstation control software (Imanu-SVR) were 0.7650 and 5.3916 ug/L for Cd+, and 0.8791 and 20.0015 ug/L for Pb2+, respectively; the R²and RMSE values of the SVR models buil t using the peak area automatically acquired by the developed algorithm (Aalgo-SVR) were 0.9204 and 2.9906 ug/L for Cd?+, and 0.9756 and 13.1574 ug/L for Pb2+,respectively. More i mportant l y, the detec t ion results of t he proposed method i n real soil extracts for Cd²+ and Pb2+ concentrations were close to t hose of ICP-MS, verifying its practicability. This study provides a new solution for the accurate detection of targeted heavy metals under t he co-existence of multiple HMIs by the SWASV method. Keywords: SWASV; chemometr i cs; machine l earning; electrochemistry; soil extracts; i nterference factors 1. Introduction Pb2+ and Cd+ in soils can accumulate in t he human body through t he food chain,eventually posing a serious threat to human health [1-3], which has become the focus of attention. Therefore, the accurate detection of the concentrations of Pb+ and Cd2+ in soil is of great necessity for evaluating the levels of heavy metal pollution. Compared with conventional spectroscopic t echniques for the detection of Cd2+ and Pb2+, the square-wave anodic stripping voltammetry (SWASV) technique as an electrochemical analysis technique has been considered a promising method due to its advantages of high sensitivity, easy operation, rapid response, and cost-effectiveness, as wel l as the simultaneous detection of multiple heavy metals [4-8]. However, the accurate detection of Cd+ and Pb2+ in soil using SWASV sti l l has problems to be solved such as the interactive interference between multiple heavy metal ions (HMIs). To overcome the interactive interference between HMIs, some studies [19-23] prepared complex biochemical materials to modify the working elec t rode. However, the electrode modified using specific recognition materials required expensive costs, complicated steps,and harsh storage conditions. In comparison, other studies [5,24,25] established machine learning models, which took the manually acquired stripping peak currents of each heavy metal as the i nput and t he Cd+ and Pb2+ concentrations as the output. Model inputs, after all, needed to be acquired manually, which was time-consuming, had large human error,and could not satisfy automated detection. Therefore, characteristic stripping currents (i.e., multiple stripping currents selected by machine learning algorithms) were proposed to act as input variables, which offered more comprehensive information about the i nterac-tions among Zn²+,Cd2+,Pb2+, and Cu²+[18]. However, the stripping potential of SWASV would drift due to the difference in detection environments or the reference electrodes.leading to the disability of the characteristic stripping currents [5]. The peak area of the stripping currents is defined as the integral value of the stripping current on the scale of stripping potential time, which physically represents the amount of charges. Theoretically,the peak area of the stripping current directly reflects the number of stripping HMIs under a fixed electrode surface area. Therefore, building a machine learning model using the peak area i nstead of peak current as the input may be a good approach to improve the SWASV detection accuracy of Cd2+and Pb2+ under interactive interference between multiple HMIs. The accurate acquisition of SWASV signals, i ncluding the stripping peak currents and the stripping current peak areas of HMIs, is crucial for the detection of heavy metal concentrations. The peak current signals of Cd+ and Pb+ were acquired, under the premise t hat t he background currents of Cd+and Pb2+ are the same, by development algorithms [26]. These algori t hms cannot automatically acquire the SWASV signals of multiple HMIs and are helpless for overlapping peak signals. Therefore, developing an algorithm that can accurately acquire the stripping current peak areas of Zn2+,Cd2+,Pb2+,Bi+, and Cu+ is of great significance for the automatic and accurate detection of Cd+ and Pb2+ concentrations by SWASV. In addition, the stripping current peak heights of HMIs are also acquired to highlight the advantages of stripping current peak areas in modeling In this paper, a combination of chemometrics, machine learning, and homemade algorithms was used to improve the detection accuracy of Cd2+ and Pb2+ concentrations under the interaction i nterference of Zn+ and Cu2+. On the one hand, t his study attempted to build machine l earning models for accurately detecting the concentrations of Cd+and Pb2+ by using a simple bismuth-film modified electrode, which not only saves financial,material , and human resources [8,19,20,23], but also avoids secondary pollution caused by modified materials to the environment. On the other hand, this study investigated the difference between the HMIs peak area and t he traditionally used peak height as the model inputs for the accurate detec t ion of Cd²+ and Pb2+. Importantly, the practicality of the selected optimal detection models was tested using real soil samples. 2. Materials and Methods 2.1. Reagents and Apparatus Al l chemical reagents were of an analytical grade. The working solutions of Zn+,Cd2+, Pb2+, Bi+, and Cu+ were prepared f rom 1 mg/mL of standard stock solutions of Zn(NO3)2, Cd(NO3)2, Pb(NO3)2, Bi(NO3)3,and Cu(NO3)2, respectively. Acetic acid acted as the electrolyte buffer for the electrochemical measurement of HMIs. Millipore-Q water (18.2 MQ.cm) was used for diluting reagents and the cleaning of containers for all experiments. A three-electrode system including an Ag/AgCl reference electrode, a platinum wire counter electrode, and a Bi/GCE working electrode was used to collect the stripping currents of Zn²+, Cd+,Pb+, Bit,and Cu+. SWASV measurements were performed using the EmStat3 electrochemical workstation from PalmSens (PSTrace 5.9, EmStat3, Houten,The Netherlands). 2.2. Preparation of the Bi/GCE The Bi(NO3)3 was used to prepare the in-site electroplating bismuth film-modified glassy carbon electrode (Bi/GCE) as a working electrode because bismuth possessed excellent electrocatalysis ability towards Cd+and Pb2+ [27-29]. The specific preparation of the Bi/GCE electrode is presented i n the Supplementary Materials. 2.3. SWASV Measurement The optimal experimental conditions for the detection of Cd+ and Pb+ concentra-tions using Bi/GCE by SWASV had been explored in our previous study [24]; the optimal concentration of Bi+ was 300 ug/L, the optimal pH value was 5.0, the optimal deposition potentia l was -1.3 V, and the optima l deposition time was 180 s. In addition, the repeatabil-ity, stabi l ity and electroanalytical performance of Bi/GCE had been validated, as presented in the Supplementary Materials, which demonstrated that the obtained SWASV dataset was reliable to build machine learning detection models. Before performing SWASV measurements, dissolved oxygen was removed from the test solution by blowing N2 gas for 2 min. The main steps of SWASV were as follows.The HMIs were electro-deposited into the GCE surface for 180 s at the potential of -1.3 V,accompanied by stirring at a speed of 300 r/min. After an equilibration period for 10 s,the deposited HMIs were stripped off from the GCE surface by applying a square-wave excitation potential in the range of -1.4 to 0.2 V to obtain stripping currents. The square-wave frequency, potential amplitude, and potential increment of the excitation potential were 25 Hz, 25 mV, and 5 mV, respectively. A total of 320 data points were collected in the stripping potential range of -1.4 to 0.2 V for one SWASV data curve due to the potential increment of 5mV. The detailed steps of t he SWASV measurements are described in the Supplementary Materials. 2.4. Establishment of Experimental Datasets To explore the i nteractive influence of multiple HMIs on the SWASV signals of Cd+and Pb2+,eight concentration gradients of four kinds of HMIs were set. The Zn+and Cu²+acted as t he interference ions, their concentration gradients started from 0 ug/L. Specifically,2+the Zn²+ concentrations included 0, 50,100,150,200,250, 300, and 350 ug/L, while the Cu²+concentrations included 0, 25,50, 75,100, 125,150, and 175 ug/L, the Pb2+ concentrations included 5, 25, 50, 75,100,125,150, and 175 ug/L, and the Cd²+ concentrations included 2,5,10,15,20,25,30, and 35 ug/L. The orthogonal experimenta l method was adopted to conduct the experiment’s design on the SPSS software (SPSS 26, IBM SPSS, Chicago, IL,USA). A total of 64 experiments were designed according to the L64(84) orthogonal table under four factors and eight levels. The 64 sets of orthogonal experiments were l isted in Table S1. Namely, 64 sets of SWASV data were collected to develop the algorithm for the automatic acquisi t ion of peak heights and peak areas of multiple HMIs and to establish the models for the accurate detection of Cd2+ and Pb2+ concentrations under the existence of multiple HMIs. The SWASV measurement of each sample was repeated three times to guarantee the reliability of the dataset. 2.5. Development of Peak Height and Peak Area Acquisition Algorithms Firs t , each SWASV curve was pre-processed and divided into several segments accord-ing to the extremum points. Then, the homemade algorithm was used to obtain the peak high and peak area of each segment. Finally, the type of each HMI was identified according to the posi t ion of the stripping potential corresponding to the peak current. 2.5.1. Segmentation of SWASV Curves The Savitzky-Golay (S-G) algorithm was used to smooth the SWASV curve as shown in Figure 1A. The extreme points in the SWASV curve after S-G smoothing were accurately identi f ied by the peakdet f unction. The strategy of the peakdet function was to look for the highes t point, around which there were lower points on both sides. It was defined as the extreme point in the SWASV curve by f inding the closest point in the data points to the voltage value of the extreme point in the SWASV curve after S-G smoothing, as shown in Figure 1B. It is worth noting that the number of local minimum points should be one more than the number of local maximum points to ensure the existence of local minimum points on the left and right of each local maximum. However, one point located at the end or front of the SWASV curve could not be detected as the local minimum point using the peakdet function. Thus, i t was set as the minimum point to ensure that every segment of the SWASV curve contained one local maximum and two local minimum points, as shown in Figure 1C. Assuming that the coordinates of 320 data points were (V,Ii),(V2,Iz) ... (V320,I320), among them, the coordinates of t he local maximum points were (Vmaxy , Imaxy), and the coordinates of the l ocal minimum points were (VminzsIminz ).The y and z were the number of local maximum and minimum points, respectively. Then,each SWASV curve was divided into several segments according to the minimum points,as shown in Figure 1D. 2.5.2. Calculation of Valid Data Segments Figure 1. Schematic representation of t he SWASV curve smoothed by S-G algorithm (A), the extreme points identified by the peakdet function (B), the end of the SWASV curve set as the minimum point (C), and the segmentation of SWASV curve (D). (SWASV response curve of 150 ug/L Zn+, 35 ug/L Cd2+, 175 ug/L Pb2+,300 ug/L Bi+,and 100 ug/L Cu²+). F i rstly, the slope matrix KL 1,i.e., Equation (1), was calculated by the slope between every coordinate point from the local maximum point (Vmaxir Imaxi) to the local mini-mum point ((Vmin(i+1)rmin(i+1))and the local minimum point (Vminir Imini ) as shown in Figure 2A. where p =-min(itoos maxi i s the number of elements i n Ku1, i.e., the data points number from the l ocal maximum point to the right local minimum point, kiu =maxi+umini ((uE0,p])is the u-th element i n Ku1, and kim = min{Kzi } is the global minimum value i n KL1 Secondly, the slope matrix KR1, i.e.,Equation (2), was calculated by the slope between every coordinate point f rom the local maximum point (Vma x ir Imaxi ) to the local minimum point (Vminir Imini ) and P. (Vmaxi+1m;Imaxi+1m) as shown in Figure 2B. Figure 2. Schematic representation of the calculation of valid data segments (A,B). (The i-th segment of the SWASV r esponse curve for 150 ug/L Zn2+, 35 ug/L Cd²+, 175 ug/L Pb2+, 300 ug/L Bi+,and 100 ug/L Cu+). where q=mo 0x .00m 5im is t he number of elements in KR1, i .e ., the data points number from the local maximum point to the left local minimum point, k1v=maxi-二 (VE[0,q])is the u-th element i n KR1, and kin= max{KR1} is the global maximum value in KR1. Then, the slope matrix KL2 was calculated by the slope between every coordinate point from the l ocal maximum point (Vmaxir Imaxi) to Pi(Vmaxi +1mrImaxi+1m) and Qi (Vmaxi-1nr I maxi-1n)to acquire t he coordinate Pi,(Vmaxi +2mrImaxi +2m). Therefore, the above calculations were re-peatedly iterated until the conditions in Equation (3) were satisfied. Finally, the coordinates of P,(Vmaxi+s mr Imaxi +s m) and Qi, (Vmaxi -s n r Imaxi -s n ) (s was the f inal number of i terations)were obtained. The segment between Pi, and Qi, was the valid data segment that this study required. 2.5.3. Acquirement of Peak Heights and Peak Areas The straight line l ; from points Pism to Qis n and the curve C; fitted to the data points between points Pi s m and Qisn could be determined. The area between the straight line li and the curve Ci was the peak area Si, which could be calculated by Equation (4). The line connected by the local maximum point, (Vmaxir Imaxi) and (Vmaxi, 0), had an intersec-tion, Di(Vmaxir linti ), with lj. Thus, the peak height (h;) could be calculated with the local maximum points and D; according to Equation (5). An example is given in Figure 3. Figure 3. Schematic representation of peak area (A) and peak height (B) calculation. (The i-t h segment of t he SWASV response curve for 150 ug/L Zn2+, 35 ug/L Cd2+, 175 ug/L Pb2+,300 ug/L Bi,and 100 ug/L Cu²+). The type of HMIs could be identified according to the potential corresponding to the maximum current of every segment. In this study, Zn²+ corresponded to a potential range of -1.2 to -0.85 V, Cd2+ corresponded to a potential range of -0.85 to -0.65 V, Pb2+corresponded to a potential range of -0.65 t o -0.35 V, Bi’+ corresponded to a potential range of -0.35 to -0.1 V, and Cu²+ corresponded to a potential range of -0.1 to 0.1 V. 2.6. Detection Models A total of 64 SWASV curves were collected, which corresponded to the 64 groups of concentration combinations of Zn+, Cd2+,Pb+,and Cu+. For each SWASV curve,there were four kinds of variables, which were the stripping current peak heights (Iauto)and areas (Aauto) acquired automatically by the homemade algorithm, and the stripping current peak heights (Imanu) and areas (Amanu) acquired manually using electrochemical workstation control software. The dataset (64 samples) was divided into a calibration set (48 samples) and a validation set (16 samples) according to the ratio of 3:1 by sample set partitioning based on joint x-y distance (SPXY) [30-33], which i s described in the Supplementary Materials. In addition, partial least squares regression (PLSR) and support vector regression (SVR) were employed in this study to build detection models of Cd+ and Pb2+ concentrations. The PLSR algorithm is a widely used l inear regression method, which can solve multicollinearity questions among multiple variables [34-37]. PLSR was used to project predictors and observed variables into a new space to f ind a linear regression model.However, the interference between HMIs was complex and nonlinear. The SVR, as a kind of machine learning algorithm about nonlinear regression, had recently become popular to model small size samples [25,38]. The use of the SVR kernel function could fit the nonlinear relationship into a l inear or a nearly linear regression hypersurface in the high-dimensional feature space. Compared with other functions, the radial basis function (RBF), which was a kind of kernel function, had better performance due to its strong relationship between input and output. The SVR penalty parameter c and the kernel function parameter g could greatly influence the performance of the SVR regression [39]. Therefore, the particle swarm optimization (PSO) algorithm was used to automatically optimize the parameters of c and g in the SVR model. The optimization results of parameters c and g are presented in the Supplementary Materials. 2.7. Evaluation Parameters of Data and Model Performance The Imanus lalgo , Amanu, and Aalgo of five HMIs were obtained from 64 samples. The cosine similarity (cos 0) [40,41] and determination coefficient (R) were used to evaluate the differences between the peak heights and peak areas obtained by the homemade algorithm and those acquired manually by the electrochemical workstation control software. where aj and pi refer to the f ive manually acquired HMI signals (Imanu or Amanu) and algorithmically acquired HMI signals (lalgo or Aalgo) for sample i , respectively, and & is the average value of the five manually acquired HMI signals (Imanu or Amanu) for n samples.The n is 64 in this study. The closer the values of cos0 and R are to 1, t he difference between the algorithm and the manually acquired values is smaller. The calibration set (48 samples) was used to build the detection model, and the validation set (16 samples) was used to validate the model performances. The stabi l ity and accuracy of the detection model were evaluated separately using the determination coefficient (R2) and the root-mean-square error (RMSE) of the validation set. where y; and y, refer to the actual and detected concentrations of HMIs (Cd2+or Pb2+) for the i-th sample, respectively, and y is the average value of actual concentrations of HMIs (Cd2+or Pb2+) for the j-th validation set sample. A value of R2 close to 1 i ndicated the high stability of the model, and the small value of RMSE i ndicated the high detection accuracy of the model. 2.8. Preparation of Real Soil Extracts Soil samples (National sharing platform of reference materials, China) were collected from two different provinces in China. Detailed information about the soil samples was presented in Table S2. Bioavailable HMIs were extracted during sample preparation procedures, which include ion-exchange, carbonate-bound, and soluble humus-bound frac t ions. The detailed preparation procedures of the two soil extracts is described in the Supplementary Materials. 3. Results and Discussion 3.1. Analysis of SWASV Signals and Input Variables 3.1.1. Analysis of Interactive Interference of Multiple HMIs by SWASV Signals The 64 SWASV curves were plotted by t he concentration of Cd2+ and Pb2+, as shown in Figure 4. In Figure 4A, the stripping voltammetry signals of Cd²+ showed different shapes at the same concentration, which suggested that Cd+ could be interfered with by different types and concentrations of HMIs. In addition, although i t was interfered with by different concentrations of non-target ions, the stripping voltammetry signals of Cd+ also gradually increased with the increase in Cd+ concentration. In Figure 4B, it could be observed that Pb2+ possessed the same situation a POSS s Cd2+, which i ndicated that the SWASV signals of both Cd2+and Pb2+ could be interfered with by other HMIs. That was also consistent with our previous research [24]. Therefore, the SWASV signals of Cd+and Pb2+ were severely interfered with by the interaction of Zn2+, Cd2+,Pb2+, and Cu2+. I t was necessary to inhibi t the interactive interferences between multiple HMIs for the accurate detection of Cd2+ and Pb2+ concentrations. Figure 4. The SWASV curves of 64 experiments sorted by Cd+(A) and Pb+(B) concentration. 3.1.2. Comparison of Peak Heights and Peak Areas of Multiple HMIs Acquired by Different Methods Chemometrics and machine learning provided a promising platform to inhibit the interac t ive interference of multiple HMIs for further accurate detection of Cd²+ and Pb2+concentrations. Appropriate i nput variables could enhance the accuracy of detection models. Therefore, the Imanus algo, Amanu, and Aalgo of Cd²+ and Pb2+ were acquired by the homemade algori t hm and the electrochemical workstation control software, as shown in Figure 5 and Figures S3-S5. The distribution of scattered points was consistent with the results of the analysis i n Figure 4A,B, and indirectly confirmed the effectiveness of the homemade algorithm. For Imanu and Ialgo of Zn²+, Cd’+, and Pb2+, the R? and cos 0 were all greater than 0.9997. For Imanu and Ialgo of Bi’+ and Cut, the R, and cos 0were al l greater than 0.9980. For Mmanu and Malgo of Zn²+, Cd?+, and Pb2+, the R?and cosO were all greater than 0.9999. For Mmanu and Malgo of Bi+ and Cu+, the R? and cos 0 were all greater than 0.9970. Detailed information about R? and cos 0 values was presented in Table S3. Compared with Zn2+, Cd2+, and Pb2+, the peak heights and peak areas of manually acquired Bi+ and Cu+ differed significantly from those acquired by the homemade algorithm, which was attributed to the overlapping peaks between Bi+and Cu+. It was prone to human errors when manually obtaining the peak height and area of overlapping peaks. 35(A) 8 88888 ¥152025 3035 40 1(0B) ◇ ◇ 9888888 00010 15 20 25 30 35 40 (E) 8 30 20 日 8 88 6 8 (F) 888 日D88om d=2.01J1..o5Ba1..00e-je目E0.5n (G)8:9◎088 8 8:88 2.01.51.00.5 neld jo eae-uypun 一 (H)Q888 Figure 5. Imanu (A,E), Ialgo (B,F), Amanu (C,G), and Aalgo (D,H) of Cd²t and Pb2+ acquired from the SWASV curves of 64 experiments. (Diamond scatters represent the peak heights or peak areas of Cd+, circular scatters represent t he peak heights or peak areas of Pb2+. Blue scatters represent the I manu green scatters represent the I algo, red scatters represent the Amanu , orange scatters represent the Aal go ). 3.2. Detection ofCd2+and Pb+ Concentrations by Peak Heights The peak heights of Zn2+, Cd2+, Pb2+, Bi+, and Cut obtained by manual acquisition (Imanu) and algorithmic acquisition (lalgo) were used as input for PLSR and SVR models 24halgo2to detect the concentrations of Cd2+ and Pb2+. The performance of the above models was compared using the RMSE and R2 values of the validation set. All results of the calibration set were presented in Figure S6. Detailed information about the PLSR and SVR models was presented in Table S4. 3.2.1. PLSR Models Establ i shed Using Peak Heights The PLSR models buil t using the Imanu and Ialgo of the HMIs were named Imanu-PLSRand Lalgo-PLSR, respectively. As shown in Figure 6A,B, the Imanu-PLSR model (RMSE=5.4663 ug/L,R2=0.7375) had close accuracy to the Ialgo-PLSR model (RMSE =5.4838 ug/L, R²=0.7323) for the detection of Cd²+ concentrations. However, the Imanu-PLSR model (RMSE=19.2392 ug/L,R2= 0.8645) presented a smaller RMSE and a larger R2 value t han I algo-PLSR model (RMSE= 21.9047 ug/L, R2= 0.7766) for detecting Pb+ concentrations, as shown in Figure 6C,D.Although the accuracy and stability of Ialgo-PLSR model was inferior to that of the Imanu-PLSR model for both Cd+ and Pb2+, the discrepancies between them were not significant,which illustrated the developed algorithm could accurately acquire the peak heights. (B) 0 5 R ²-0.7766 120 150 180 Figure 6. PLSR model results for Cd+(A,B) and Pb²+(C,D) concentration detection in the validation dataset. (Diamond scatters represent Cd-+ concentrations, circular scatters represent Pb+ concen-trations, blue scatters represent the model i nput as I manu green scatters represent the model input as lalg o ). However, the PLSR models established using peak heights had the larger RMSE values for Cd²+and Pb2+ concentrations and needed to be further improved. This might be because PLSR could not be adequate for resolving t he interactive interference among HMIs.Hence, it became a possibility to use of a nonlinear model to i mprove the model detec t ion accuracy of Cd+ and Pb2+. 3.2.2. SVR Models Established Using Peak Heights The SVR models built using the Imanu and Ialgo of the HMIs were named Imanu-SVR and Ialgo-SVR, respectively. As shown in Figure 7A,B, for the detection of Cd+ concentration,the RMSE and R2 values of the I manu-SVR model were 5.3916 ug/L and 0.7650, respectively,and that of t he Ialg o -SVR model were 3.9922 ug/L and 0.8424, respectively. As shown in Figure 7C,D, for the detection of Pb2+ concentration, t he RMSE and R2 values of the Imanu-SVR model were 20.0015 ug/L and 0.8791, respectively, and that of t he Ialgo-SVR model were 21.3431 ug/L and 0.8229, respectively. Compared with the Imanu-SVR model,the Ialgo-SVR model had a l ower RMSE value for the detection of Cdconcentrations.However, for the Pb2+concentrations, the RMSE values of the Imanu-SVR and the Ialgo-SVR models were approximate, which illustrated that the homemade algorithm could accurately acquire the peak heights of HMIs. Figure 7. SVR model results for Cd+(A,B) and Pb+(C,D) concentration detection in the validation dataset. (Diamond scatters represent Cd+ concentrations, circular scatters represent Pb+ concen-trations, blue scatters represent the model input as Imanu green scatters represent the model input as lalgo). In addition, for Cd2+ concentration, the Imanu-SVR model had a lower RMSE value of 0.0547 ug/L than t he Imanu-PLSR model and a higher R2 value of 0.0275, while the Ialgo-SVR model had a lower RMSE value of 1.4916 ug/L and a higher R2 value of 0.1101 than the Ialg o -PLSR model. The SVR model built using algorithm-acquiring peak heights (lalgo) as its input significantly i mproved the detection accuracy of Cd+ concentration. This was because the signal of Cd"+ was much weaker than Pb+ due to the low concentration of Cd2+, which caused the large relative errors of Cd+ peak heights acquired manually by the electrochemical control software, while the homemade algorithm in this study could exactly capture the weak Cd+ peak heights. For Pb2+ concentration, the Imanu-SVR model had a higher RMSE value of 0.7623 ug/L and a higher R2 value of 0.0146 than the Imanu-PLSR model , while the I algo-SVR model had a lower RMSE value of 0.5616 ug/L and a higher R2 value of 0.0463 than the Ialgo-PLSR model.However, the increase i n detection accuracy of Pb2+concentrations was either neg l igible or failed by the SVR and algorithm-acquired peak heights (lago). A more important reason for the above results was that the peak heights contained too little information to reflect the serious interaction between multiple HMIs. Therefore, the stripping current peak areas were employed as the inputs of SVR and PLSR models in the next section in expectation of improving the detection accuracy of Cd+ and especially Pb2+ concentrations. 3.3. Detection ofCd+and Pb2+ Concentrations by Peak Areas Same as Section 3.2, the peak areas of Zn+,Cd2+,Pb2+, Bi+, and Cu+ obtained by manual acquisition (Amanu) and algorithmic acquisition (Aalgo) were used as input for the PLSR and SVR models to detect the concentrations of Cd+ and Pb+. The performance of the above models was compared the RMSE and R2 values of the validation set. All of the results of the calibration set were presented in Figure S7. Detailed information about the PLSR and SVR models was presented in Table S5. 3.3.1. PLSR Models Established Using Peak Areas The PLSR models built using the Amanu and Aalgo of HMIs were named Amanu-PLSR and Aalgo-PLSR, respectively. As shown in Figure 8A,B, the Amanu-PLSR model (RMSE=3.8996 ug/L,R2= 0.8828) had close accuracy to the Aalgo-PLSR model(RMSE=3.7414ug/L, R2=0.8910)for the detection of Cd2+ concentration. As shown in Figure 8C,D, the Amanu-PLSR model (RMSE = 15.1333 ug/L,R2=0.9272) presented a larger RMSE value and a smaller R2value than the Aalgo-PLSR model (RMSE= 12.9264 ug/L , R2=0.9668) for the detection of Pb2+concentration. For both Cd+ and Pb2+ concentration detection, the Aalgo-PLSR model was more stable and accurate than the Amanu-PLSR model. The use of Aalgo as a model input contributed to the i mprovement of the detection accuracy and stability of the models, which implied that the homemade algorithm could accurately acquire the peak areas of HMIs Figure 8. PLSR model results for Cd²+(A,B) and Pb2+(C,D) concentration detection in the vali-dation datase t . (Diamond scatters represent Cd2+ concentrations, circular scatters represent Pb2+concentrations, r ed scatters represent the model i nput as Amanu, orange scat t ers represent Aalgo as the model input). In addition, for Cd2+ concentration, Amanu-PLSR model had a lower RMSE value of 1.5467 ug/L and a higher R2 value of 0.1453 than the I manu-PLSR model, while t he Aalgo-PLSR model had a lower RMSE value of 1.7424 ug/L and a higher R2 value of 0.1587than the Ialgo-PLSR model . For Pb+ concentration, the Amanu-PLSR model had a lower RMSE value of 4.1059 ug/L and a higher R2 value of 0.0627 than Imanu-PLSR model , while the Aalgo-PLSR model had a lower RMSE value of 8.9785 ug/L and a higher R2 value of 0.1902 t han the Ialgo-PLSR model. In the case of modeling with the PLSR algorithm, using peak areas instead of peak heights as the model input greatly improved the stability and accuracy of the Cd+ and Pb+ concentration detection models. In addition, for both the RMSE and R2 values, the improvement of the Imanu-SVR models and the I a lgo-SVRs models over the I manu-PLSR models and t he I algo-PLSR models, respectively, was significantly less than t he improvement of the Amanu-PLSR models and t he Aalgo-PLSR models over the I manu-PLSR models and the Ialgo-PLSR models, respectively. This might be r elated to the fact that the peak areas contained more comprehensive SWASV information of HMIs than the peak heights. The peak area of HMIs was defined as the integral value of the stripping current on the scale of the stripping potential time, which physically represented the amount of ions. The above analysis provided a new direction for the accurate detection of Cd+ and Pb2+ under the interactive interference of multiple HMIs, i .e., using peak areas as a model input and building models with the SVR algorithm. 3.3.2. SVR Models Established Using Peak Areas The SVR models built using the Amanu and the Aalgo of HMIs were named Amanu-SVR and Aalgo-SVR, respectively. As shown in Figure 9A,B, for the detection of Cd+ concen-tration, the RMSE and R2 values of the Amanu-SVR model were 3.9824 ug/L and 0.8785,respectively, and that of the Aalgo-SVR model were 2.9906 ug/L and 0.9204, respectively. As shown in Figure 9C,D, for the detec t ion of Pb2+ concentration, the RMSE and R2 values of the Amanu-SVR model were 13.3444 ug/L and 0.9359, respectively, and that of the Aalgo-SVR model were 13.1574 ug/L and 0.9756, respective l y. For both Cd+and Pb2+ concentration detection, Aalgo-SVR was more stable and accurate than Amanu-SVR, which again implied that the homemade algorithm could accurately acquire the peak areas of the HMIs. For the detection of Cd2+ concentrations, the Amanu-SVR model had a lower RMSE value of 1.4092 ug/L and a higher R2 value of 0.1135 than Imanu-SVR model , while the Aalgo-SVR model had a lower RMSE value of 1.0016 ug/L and a higher R2 value of 0.078than the Ialgo-SVR model . For the detection of Pb2+ concentration, t he Amanu-SVR model had a lower RMSE value of 6.6571 ug/L and a higher R2 value of 0.0568 than the I manu-SVR model, while the Aalgo-SVR model had a lower RMSE value of 8.1857 ug/L and a higher R2 value of 0.1527 than the lalgo-SVR model. I n the case of modeling with SVR algorithm,using peak areas instead of peak heights as model input greatly improved the detection stability and accuracy for Cd+ and Pb2+ concentrations. In addition, for the detection of Cd2+ concentration, t he Amanu-SVR model had a higher RMSE value of 0.0828 ug/L and a lower R2value of 0.0043 than the Amanu-PLSR model, while the Aalgo-SVR model had a lower RMSE value of 0.7508 ug/L and a higher R2 value of 0.0294 than the Aalgo"PLSR model. For the detection of Pb2+ concentration, the Amanu-SVR model had a lower RMSE value of 1.7889 ug/L and a higher R2 value of 0.0087 than the Amanu-PLSR model,while the Aago-SVR model had a higher RMSE value of 0.2310 ug/L and a higher R value of 0.0088 than the Aalgo-PLSR model. Compared with the models built by the PLSR algorithm, the accuracy of t he Amanu-SVR model for Cd"+ concentration detection and the Aalgo-SVR model for Pb2+ concentration detection decreased slightly after modeling by the SVR algorithm. Additionally, the stability and accuracy of the Aalgo-SVR model for the detection of Cd+ concentration and the Amanu-SVR model for detection of Pb2+concentration were further i mproved. In summary, t he Aalgo-SVR model was t he most stable and accurate model for detecting Cd+ concentration as shown in Figure 8B. The Aalgo-PLSR model was the most accurate and the Aalgo-SVR model was the most stable for detecting Pb2+ concentration as shown in Figures 7D and 8D. Figure 9. PSO-SVR model results for Cd²+(A,B) and Pb²+ (C,D) concentration detection i n the validation dataset. (Diamond scatters represent Cd+concentrations, circular scatters represent Pb2+concentrations, red scatters represent the model input as Amanu, orange scatters represent the model input as Aalgo). 3.4. Comparison and Analysis of Different Detection Models To accurately detect Cd²+ and Pb2+ concentrations in t he presence of multiple HMIs interactive interference, four kinds of inputs and two modeling algorithms were used to explore the excellent detection model. Addi t ionally, in order to improve the acquisi t ion efficiency of peak heights and peak areas, and to eliminate human error, a homemade peak heights and peak areas acquisition algorithm was designed. The performances of various models for Cd²+ and Pb2+ concentration detection were compared by using the RMSE and R2 values of the validation sets, as shown in Figure 10. The RMSE values of the models detecting Cdt concentration decreased in the order of I algo-PLSR>I manu"PLSR>Imanu-SVR>Ialgo-SVR>Amaun-SVR>Amanu-PLSR>Aalgo-PLSR>Aalgo-SVR, and the R2 values of those increased in the order of Imanu-PLSR> Ialgo-PLSR> Imanu-SVR>Ialgo-SVR> Amanu-SVR> Amanu-PLSR> Aalgo-PLSR>Aalgo-SVR. The RMSE values of the models detecting Pb²+ concentration decreased in the order of Ial g o-PLSR>Ialgo-SVR > Imanu-SVR>I manu-PLSR> Amanu-PLSR>Amanu-SVR>Aalgo-SVR>Aalgo-PLSR, and the R2 values of those increased in the order of Ia l go-PLSR>Ialgo-SVR> Imanu-PLSR>Imanu-SVR> Amanu-PLSR>Amanu-SVR>Aalgo-PLSR>Aalgo-SVR. All models for detecting Cd2+ and Pb2+ concentrations built using peak areas as input had smaller RMSE values and larger R2 values than those models built using peak heights as i nput . This suggested that the peak areas of the HMIs could better reflect the comprehensive information of interactive interference between multiple heavy metals. The Aalgo-SVR model had the best stability and accuracy for the detection of Cd+ concentration. For detecting Pb2+ concentration, the Aalgo-SVR model had a slightly higher RMSE value of 0.231 ug/L than the Aalgo-PLSR model . However, the difference of RMSE values between the calibration set and the validation set of the Aalgo-PLSR and the Aalgo-SVR models were 6.9065 ug/L and 2.6930 ug/L, respectively, which suggested that Aalgo-SVR had a higher stability than Aalgo"PLSR. As a result, Aalgo-SVR had the best detection performance toward Pb2+ concentration.Interestingly, the change in model input (from peak heights to peak areas) greatly improved the model accuracy compared with the change in modeling algorithm (from PLSR to SVR).This validated the idea that peak areas as model input could significantly i mprove the detection accuracy of Cd2+and Pb2+ concentrations. Cd2+ Pb2+ Figure 10. Model results of the validation sets for Cd+ (A) and Pb2+ (B) concentration detection. In all models using peak heights as input, the detection ability of those models built by algo was slightly inferior to Imanu, except for Cd2+ concentration detected by Ialgo-SVR. This might be related to t he relatively lower peak heights acquired by the homemade algorithm compared to those acquired manually by electrochemical control software, as shown in Figure 11B. In Section 2.5.1, the extreme points in the SWASV curves were recognized by the S-G algorithm and peakdet function. In this process, some noise points were eliminated, such as t he recognition of the local extreme points of the curve in the dotted box in Figure 11A. Therefore, the extreme point obtained by the homemade algorithm was the red point in Figure 11B, while the point with the largest current value in dotted box was the point to the right of the red point. In addition, the peak heights were also influenced by the background currents. The manually acquired peak heights might have some deviations. Moreover, in comparison with PLSR models, SVR models enhanced the detection performance of Cd2+ and Pb2+ concentrations. This il lustrated that the interactive interfer-ence between HMIs was perfectly nonlinear in presentation. Previous studies [5,11,12] had reported that Zn2+, and especially Cu2+, could seriously i nterfere with the SWASV signals of Cd2+ and Pb+. The Cd2+ would not be detected by SWASV when Cu2+ concentration exceeded a certain concentration [13], thus the peak heights and peak areas could not be acquired by handwork or algorithms. However, the i nterference of Zn?+ on Cd+ was negligible until Zn²+reached a relatively high concentration [18]. In addition, there was mutual interference between Cd+and Pb+,and this interference was also nonlinear [12].The nonlinear interference of multiple HMIs might be due to the following three aspects.(1) Although the introduction of Bi’+could form alloys with most of the HMIs to reduce the activation energy required for electrodeposit i on [27,29], the concentrations of Zn2+, Cd+,Pb2+, and Cut were ever-changing in this study and they required different concentrations of Bi+. Therefore, i t was unknown whether the number of alloys formed by Bi+ and HMIs exhibited a linear variation with the increase in HMI concentrations. (2) During the deposition process, the number of deposition HMIs might not be i n l ine with the i ncreasing of HMI concentrations due to the limited deposition si t es of GCE. (3) The alloys formed by multiple HMIs (especially the existence of Cu+) prevented t he stripping of Cd+and Pb2+off the GCE surface in the stripping process. Therefore, the detection accuracy of the PLSR models for Cd2+ and Pb2+ concentrations was lower than that of the SVR models. Figure 11. Schematic representation of the local maximum points calculated by homemade algorithm (A), and the deviator between the loca l extreme points of the curve in the dotted box and the extreme point (red point) obtained by the homemade algorithm (B). From the above analysis, it could be concluded that the peak areas acquired by designed algorithm and SVR model significantly improved the SWASV detection accuracy of Cd+ and Pb2+ concentrations by inhibiting the i nteractive i nterference of Zn2+, Cd2+,Pb+,and Cu+. Previous studies were also carried out based on Bi/GEC without other chemical or biological material modifications. Table 1 presents the comparison of this study with previous studies t hat built Cd+ and Pb+ detection models using peak heights rather than peak areas to suppress the interactive i nterference of mul t iple HMIs. Compared with previous studies, the machine learning models that used peak heights as i nput exhibited large RMSE values and small R² values for Cd+ and/or Pb2+ concentrations, or only the interference of less than two non-target ions was resolved so that the models had small RMSE values and l arger R2values. However, the models built in this study had the powerful ability to inhibit the interactive interferences among multiple HMIs for the detection of Cd2+ and Pb2+ concentrations. T able 1. Comparison of the detection accuracy of various inputs and machine learning models for Cd²+and/or Pb+under the interference of non-target HMIs. Target Ions(Concentration: Interference Ions (Concentration: ug/L) Inputs Models RMSE (ug/L) R2 Reference ug/L) Cd²+(1-35) Cu²+(1-35), Pb2+(1-35) Peak currents SVR 0.9299 0.995 [12] PLS 5.3207 0.746 Cd2+(1-35) Pb2+(0-150) Peak currents SVR 4.2277 0.867 [5] Cd2+(2-35) Cu²+(0-350), Zn²+(0-175), Pb2+ (5-175) Peak currents PLS SVR 11.281 4.655 0.361 0.832 [18] Cd²+(2-35) Cu²+(0-350), Zn?+(0-175), Pb2+(5-175) Peak areas- SVR 2.9906 0.9204 This work Pb²+ (1-110) Cd²+(0-110) Peak currents BP-ANN 1.69 0.998 [24 Pb2+(1-45) Cu²+(0-25) Peak currents SVR 1.1204 0.994 25 PLS 25.234 0.811 Pb2+(5-175) Cu²+(0-350), Zn²+(0-175),Cd2+(2-35) Peak currents SVR 25.119 0.811 [18] Pb2+ (5-175) Cu²+(0-350),Zn2+(0-175),Cd2+(2-35) Peak areas SVR 13.1574 0.9756 This work Abbreviations: SVR, support vector regression; PLSR, part i al least squares regression;BP-ANN , backpropagation-artificial neural network. Notes: 1, Peak currents refer to the stripping peak currents of target and non-target HMIs;2, Peak areas refer to t he st r ipping peak area of target and non-target HMIs. 3.5. Application of Aalgo-SVR for Detecting Cd+ and Pb+ Concentrations in Soil Extract Solution To examine the applicability of the developed Cd²+and Pb2+ detection models, two soil extract solution samples were prepared according to Section 2.8. As shown in Figure S8, the SWASV measurement results indicated that both soil extract solution samples contained Zn²+and Cu+.The peak areas of five HMIs were acquired by the homemade algorithm (Section 2.5) and, then, substituted into the Aalgo-SVR model t o detect Cdand Pb2+ concentrations, respectively. As shown in Table 2, t he detection results of t he two soil extract solution samples showed t hat the model Aalgo-SVR was 0.094 ug/L and 0.0313 ug/L lower than ICP-MS in the detection of Cd2+ concentration, respectively, and Aalgo-SVR was 0.1845 ug/L and 0.4731 ug/L lower than ICP-MS i n the detection of Pb2+ concentration,respectively. The detection error for Pb2+ was slightly larger compared to Cd+, which was due to the fact that there was more Pb2+ in the soi l than Cd2+. However, the relative standard deviations for Cd+ and Pb2+ were 5.69% and 1.83%, respectively, verifying the good practicality of the method proposed in t his study. Table 2. Detection results of Cd2+ and Pb2+ concentrations in soi l extract solutions. Soil Extracts Cd2+ Detection (ug/L) Pb+ Detection (ug/L) Aalgo-SVR ICP-MS Aalgo-SVR ICP-MS Sample No. 1 1.0067 1.1007 18.5140 18.6985 Sample No. 2 1.0698 1.1011 17.2347 17.7078 In summary, in situ bismuth modi f ied GCE combined with the homemade peak area extraction algorithm, chemometrics, electrochemistry and machine learning can replace ICP-MS to detect Cd+ and Pb2+ in soil. This method saves detection time, compresses costs and is more suitable for rapid on-site detection requirements. 3.6. Limitations and Prospects Soil is a complex environment containing multiple substances. There are many inter-fering factors that will decrease the detection accuracy of Cd²+ and Pb2+ i n soil extracts,such as the mutual interactions of multiple HMIs and the soluble humus [6,7,42]. This study combined simple Bi-f ilm modified electrode and machine learning models to accurately de-tect Cd²+ and Pb+, which alleviated to some extent the i nteractive interference of multiple HMIs. However, the concentrations of Zn2+,Cd+, Pb2+ and Cu²+ in soil may be more or less than the concentration ranges of the established dataset; Hg2+ and As+ in soils also interfere with the detection of Cd+and Pb2+. Therefore, the generality and universality of the bui l t detection models need further validation [42]. In this regard, i t is necessary to build a dataset with a wider range of HMI concentrations and more heavy metals types for the accurate detection of Cd²+ and Pb2+ in real soil extracts, and it is hopeful to further enhance the model detection ability by using deep learning algorithms. On the other hand,soluble humus (such as humic acid and fulvic acid) in soil extracts will complex with heavy metal ions and interfere with t he stripping voltammetry signals of Cd2+ and Pb2+ [6,7];thus, it is necessary to suppress the humus substance interference in further studies for accurately determining Cd2+ and Pb2+ in real soil extrac t s by the SWASV method. 4. Conclusions The purpose of this study is to investigate the low accuracy of Cdand Pb2+ con-centration detection when using peak current and SWASV to detect heavy metals in soil.A novel algorithm based on extreme points and slopes for the automatic and accurate acquisition of peak heights and peak areas was designed first in t his study. Then, Cd+and Pb+ detection models were built by combining chemometrics and machine learning algo-rithms. The peak heights and peak areas of the Zn2+,Cd2+,Pb2+, Bi+, and Cu+acquired by both the homemade algorithm and the electrochemical workstation software were used acting as input variables to establish the PLSR and SVR detection models. The results of the modelling analysis showed that the SVR models established using algorithmically acquired peak areas presented the highest accuracy for the detection of Cd+and Pb+ concentrations.The RMSE and R2 values of the optimal Cd²+ concentration detection model (Aalgo-SVR)were 2.9906 ug/L and 0.9204, respectively. The RMSE and R2 values of the optimal Pb2+concentration detection model (Aalgo-SVR) were 13.1574 ug/L and 0.9756, respectively. The optimal Aalgo-SVR model was used for real soil extracts to verify the practicability of the model for detec t ing Cd+ and Pb+ concentrations, respectively. This work provides a new method in the accurate detection of Cd²+and Pb2+ concentrations under the co-existence of multiple HMIs in soils. Supplementary Materials: The following supporting i nformation can be downloaded at: https://www.mdpi.com/article/10.3390/met13020270/s1, Figure S1: CV curve of the bare GCE in the 5 mM [Fe(CN)6]3-/4- solution with 0.1 M KCl; Figure S2: SWASV responses of (a) 20 ug/L Zn2+, Cd²+,and Pb2+ on GCE and Bi/GCE, (b) 20 ug/L Zn2+,Cd2+,Pb2+,and Cu²t on GCE and Bi/GCE,and (c,d) 40 ug/L Zn2+, Cd2+, Pb2+, and Cu²+ on Bi/GCE f or ten repetitive measurements; Figure S3:Imanu (A), Ialgo (B), Amanu (C) and Aalgo (D) of Zn?+ acquired from the SWASV curves of 64 exper-iments. (Blue scatters represent the Imanus green scatters represent the Ialeo, red scatters represent the Amanu, orange scatters represent the Aalgo); Figure S4: Imanu (A), Ialgo (B), Amanu (C ) and Aalgo (D) of Bi’+ acquired from the SWASV curves of 64 experiments. (Blue scatters represent the Imanus green scatters represent the Ialgo, red scatters represent t he Amanu, orange scatters represent the Aalgo); Figure S5: I manu (A), Ialgo (B), Amanu (C) and Aalgo (D) of Cut acquired from the SWASV curves of 64 experiments. (Blue scatters represent the Imanu green scatters represent the lalgo, red scatters represent the Amanu, orange scatters represent the Aalgo); Figure S6: PLSR models (A, B, C and D) and SVR models (E, F, G and H) results for Cd+ and Pb+ concentrations detection in the calibration dataset. (Diamond scatters represent Cd+ concentrations, circular scatters represent Pb2+concentrations, blue scatters represent the model i nput as Imanu green scatters represent the model input as Ialeo.); Figure S7: PLSR models (A, B, C and D) and SVR models (E, F, G and H) results for Cd2+ and Pb2+ concentrations detection in the calibration dataset. (Diamond scatters represent Cd2+concentrations, circular scatters represent Pb+ concentrations, red scatters represent the model input as Amanu, orange scatters represent Aalgo as t he model i nput.); Figure S8: SWASV response curves of soil extract samples;Table S1: the excogitation of 64 sets of orthogonal experiments by the L64(84)orthogonal table; Table S2: Detailed i nformation on real soil samples; Table S3: Detailed R. and cos 0of the peak heights and peak areas; Table S4: The R2 values and RMSE values of t he models built by peak heights; Table S5: The R2 values and RMSE values of the models. Author Contributions: Data curation, W.Y. and N.L.; funding acquisition, G.L.; investigation, N.L.;methodology , W.Y . and G.Z.; project administration, G.L.; software, W.Y.; supervision, G.L.; validation,N.L .; visualiza t ion, W.Y.; wri t ing-original draft, W.Y.; writ i ng-review and editing, N.L . and G.Z.Al l authors have read and agreed to the published version of t he manuscript. Funding: The study was supported by the National Natural Science Foundation of China (Grant No 32071898) and the Natural Science Foundation of Jiangsu Province (No. BK20200546). Data Availabi l ity Statement: The data presented in this study are available in Supplementary Materials. Acknowledgments: This work was assisted by Yinghui Li (Shanghai Jiao Tong University), who provided me with software support and writing advice. Conflicts of Interest: The authors declare that they have no known competing financial interest or persona l relationships that could have appeared to i nfluence the work reported on i n this paper. References 3. Wang, L.; Zeraatpisheh, M.; Wei, Z.; Xu, M. Heavy metal pollution and risk assessment of farmland soil around abandoned domestic waste dump in Kaifeng City. Front. Environ. Sci. 2022,10,1440. [CrossRef ] 4 Liao,J .; Song, Y.; Wang, R.; Zeng, Y.; Si , H.; Ge, C.; Lin, S. A synergistic promotion strategy for selective trapping and sensing of lead(II) by oxygen-vacancy and surface modulation of MnO2 nanoflowers. Sens. Actuators B Chem. 2021, 345, 130384. [C r ossRef ]5. Liu, N.; Zhao, G.; Liu, G. Accurate SWASV detection of Cd(II) under the interference of Pb(II) by coupling support vector regression and feature stripping currents. J . Electroanal. Chem. 2021,889,115227.[CrossRef ] 6. Liu, N.; Zhao, G.; Ye, W.; Wang, J; Liu,G. VUV-H2O2 photolysis as a pretreatment method for improving the SWASV detec t ion accuracies of Cd+and Pb2+ in soil extracts. J. Environ. Chem. Eng. 2022,10,107813.[CrossRef ] 7. Liu, N.; Ye, W.; Zhao, G.; Liu, G. Release of free-state ions from fulvic acid-heavy metal complexes via VUV/H2O2 photolysis:Photodegradation of fulvic acids and recovery of Cd2+and Pb2+ stripping voltammetry currents. Environ. Pollut . 2022, 315, 120420.I CrossRe f 8. Wang, Y.; Wu, X.;Sun, J; Wang, C.; Zhu, G.; Bai, L.; Jiang, Z.; Zhang, W. Stripping voltammetric determination of cadmium and lead ions based on a bismuth oxide surface-decorated nanoporous bismuth electrode. Electrochem. Commun. 2022, 136,107233.I CrossRe f 9. Meng, Z.H.; Zheng, Y.F.;Xiao, H.F. Distribution and Ecological Risk Assessment of Heavy Metal Elements in Soil. Adv. Mater. Res.2011,183-185,82-87. [CrossRef ] 10. Liu , R.; Xu, Y.; Zhang, J.; Wang, W.;Elwardany, R.M. Effects of heavy meta l pollution on farmland soils and crops: A case study of the Xiaoqinling Gold Bel t , China. China Geol. 2020,3,402-410.[CrossRef ] 11. Zhang, Q.; Wen, H;Peng, D.;Fu, Q.; Huang, X. Interesting interference evidences of electrochemical detection of Zn(II), Cd(II)and Pb(II ) on three different morphologies of MnO2 nanocrystals. J. Electroanal . Chem. 2015,739,89-96.[CrossRef ] 12. Zhao, G.; Liu, G. I nterference Effects of Cu(II) and Pb(II) on t he Stripping Voltammetric Detection of Cd(II): Improvement in t he Detection Precision and Interference Correction. J. Electrochem. Soc. 2018,165,H488-H495. [CrossRef ] 13. Jiang, T.; Guo, Z.;Ma, M.;Fang, L.; Yang, M.; Li , S.; Liu, J ; Zhao, N.;Huang, X.; Liu, W. Electrochemical laser induced breakdown spectroscopy for enhanced detection of Cd(II) without interference in rice on layer-by-layer assembly of graphene oxides.Electrochim. Acta 2016,216,188-195. [CrossRef ] 14. Tibbetts, D.F;Davis,J .; Compton, R.G. Sonoelectroanalytical detection of l ead at a bare copper electrode. Fresenius ’J. Anal . Chem.2000,368. [CrossRef ] [PubMed ] 15. Jiang, M.; Ma, M.; Lin, C.; Yang, M.; Fang, L .; Liu, J.; Zhao, N.; Huang, X. Uniform manganese-loaded t i tanium dioxide nanotube arrays for accurate detection of t race Cd²+ in water, soil and tea: Enhanced stabi l ity and sensitivity. Chem. Eng. J . 2020, 400, 125972.I CrossRe f 16. Xiao, L.; Wang, B.; Ji, L.; Wang, F.; Yuan, Q.; Hu, G.; Dong, A.; Gan, W. An efficient electrochemical sensor based on three-dimensionally interconnected mesoporous graphene framework for simultaneous determination of Cd(II) and Pb(II). Electrochim.Acta 2016, 222, 1371-1377.[CrossRef ] 17. Hwang, G.; Han, W.;Park, J.;Kang, S. Determination of trace metals by anodic stripping voltammetry using a bismuth-modified carbon nanotube electrode. Talanta 2008, 76,301-308.[CrossRef ] 18. Liu, N.; Ye, W.; Liu, G.; Zhao, G. Improving the accuracy of stripping voltammetry detection of Cd+and Pb2+ in the presence of Cu²+ and Zn?+ by machine learning: Understanding and inhibiting the interactive i nterference among multiple heavy metals.Anal. Chim. Acta 2022, 1213,339956. [CrossRef ] 19. Liu, N. Sensi t ive Stripping Voltammetric Determination of Pb(II) in Soil Using a Bi/single-walled Carbon Nanotubes-Nafion/ionic Liquid Nanocomposite Modified Screen-Printed Electrode. Int. J. Electrochem. Sci . 2020,15,7868-7882. [CrossRef 20. Malakootian, M.; Hamzeh, S.; Mahmoudi-Moghaddam, H. A new electrochemical sensor for simultaneous determination of Cd(II) and Pb(II) using FeNig/CuS/BiOCl: RSM optimization. Microchem. J. 2020,158,105194. [CrossRef ] 21. Sawan, S.; Maalouf, R.; Errachid, A.; Jaffrezic-Renault, N. Metal and metal oxide nanoparticles in the voltammetric detection of heavy metals: A review. TrAC Trends Anal. Chem. 2020, 131,116014. [CrossRef ] 22. Lin, W.; Zhai, W.; Yan, Y.; Liu, Y. Highly sensitive Pb2+ sensor based on rod-like poly-tyrosine/Bi modified glassy carbon electrode combined with electrodeposition to eliminate Cu+ i nterference. Microchem. J . 2021,160,105664.[CrossRef ] 23. Zhou,J;Pan, K.; Qu, G; Ji, W.;Ning, P.; Tang, H.; Xie, R. rGO/MWCNTs-COOH 3D hybrid network as a high-performance electrochemical sensing platform of screen-printed carbon electrodes with an ultra-wide detection range of Cd(I I) and Pb(II).Chem. Eng. J. 2022, 449,137853. [CrossRef ] 24. Zhao, G.; Wang, H.; Liu, G.; Wang,Z. Optimization of Stripping Voltammetric Sensor by a Back Propagation Artificial Neural Network for the Accurate Determination of Pb(II) in the Presence of Cd(II). Sensors 2016, 16, 1540.[CrossRef ] 25. Liu, N.; Zhao, G.; Liu, G. Coupling Square Wave Anodic Stripping Voltammetry with Support Vector Regression to Detect the Concentration of Lead in Soil under the Interference of Copper Accurately. Sensors 2020, 20, 6792. [CrossRef ][PubMed ] 26. Zhao, G.; Liu, G. A Portable Electrochemical System for the On-Site Detection of Heavy Metals in Farmland Soi l Based on Electrochemical Sensors. IEEE Sens. J. 2018,18,5645-5655.[CrossRef ] 27. Gich, M.; Fernandez-Sanchez, C .; Cotet , L.C .; Niu, P.;Roig, A. Facile synthesis of porous bismuth-carbon nanocomposites for the sensitive detection of heavy metals. J . Mater. Chem. A 2013, 1, 11410.[CrossRef ] 28. Xu, C.; Liu, J .; Bi , Y.; Ma, C.; Bai,J.;Hu, Z.; Zhou, M. Biomass derived worm-like nitrogen-doped-carbon framework for trace determination of toxic heavy metal lead(II). Anal. Chim. Acta 2020,1116,16-26. [CrossRef] [PubMed ] 29. Liuzhu, Z.; Sekar, S.; Chen, J .; Lee, S.; Kim, D.Y.; Manikandan, R. A polyrutin/AgNPs coated GCE for simultaneous anodic stripping voltammetric determination of Pb(II) and Cd(II ) ions in environmental samples. Colloids Surf. A Physicochem. Eng. Asp.2022,648,129082.[CrossRef ] 30. Li , X.; Fan, P.; Li, Z .; Chen, G.; Qiu, H.; Hou, G. Soil Classification Based on Deep Learning Algorithm and Visible Near-Infrared Spectroscopy. J. Spectrosc. 2021, 2021,1508267.[CrossRef ] 31. Ferreira, R.D.A.; Teixeira, G.; Peterne l l i , L.A. Kennard-stone method outperforms the random sampling in the selection of calibration samples in snps and nir data. Ciencia Rural 2022,52. [CrossRef ] 33. Wang, S.F; Han, P; Cui, G.L.; Wang, D.; Liu, S.S.; Zhao, Y. The nir detection research of soluble solid content in watermelon based on spxy algorithm. Spectrosc. Spect. Anal. 2019,39,738-742.[CrossRef ] Geladi , P.; Kowalski, B.R. Partial least-squares regression: A tutorial . Anal. Chim. Acta 1986,185,1-17.[CrossRef ]35.Herrero, A.; Ortiz, M.C. Modelling the background current with part i al least squares regression and transference of t he calibration models in the simultaneous determination of Tl and Pb by stripping voltammetry. Talanta 1998, 46,129-138.[CrossRef ] 36. Huang, Q.T; Zhou,L.Q.; Shi , Z.; Li, Z.Y.; Gu, Q. Analysis of Lead in Soil with Par t ial Least Square Regression (PLS) Method and Field Portable X-ray Fluorescence (FPXRF) Analyzer. Spectrosc . Spect . Anal. 2009, 29, 1434-1438. [CrossRef ] 38. Yazir, S.M.; Dhas, J.E.R.; Darwins, A.K.; Lewise, K.A.S.; Gupta, M.S. Modelling of weld residua l stress parameters by SVR approach. Mater. Today Proc. 2022, 64,338-344.[CrossRef ] 39. Liang, H.; Zou, J; Li, Z.; Khan, M.J.; Lu, Y. Dynamic evaluation of drilling leakage risk based on fuzzy theory and PSO-SVR algorithm. Future Gener. Comput. Syst. 2019, 95, 454-466. [CrossRef ] 40. F Han,J .; Kamber, M.; Pei, J. 2-Getting to Know Your Data. In Data Mining, 3rd ed.; Han, J., Kamber, M., Pei, J ., Eds.; Morgan Kaufmann: Boston, MA, USA, 2012; pp. 39-82. 41. Metcalf, L.; Casey, W. Chapter 2-Metrics, Similarity, and Sets. In Cybersecurity and Applied Mathematics; Metcalf, L., Casey, W.,Eds.; Syngress: Boston, MA, USA, 2016;pp. 3-22. 42. Ning, L.; Guo, Z.; Gang, L. Research advances of influencing f actors and weakening methods to determine Pb2+ and Cd2+ in soils by anodic stripping voltammetry. Trans. Chin. Soc. Agric. Eng. 2021,37,232-243. [CrossRe f ] Disclaimer/Publisher's Note: The statements, opinions and data contained in all publications are solely those of the individual author(s) and contributor(s) and not of MDPI and/or the editor(s). MDPI and/or the editor(s) disclaim responsibility for any injury to people or property resulting from any ideas, methods, instructions or products referred to in the content.
确定


还剩17页未读,是否继续阅读?

产品配置单

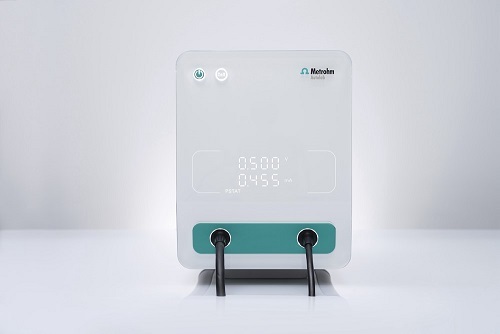
雷迪美特中国有限公司为您提供《【EmStat3电化学应用】多种重金属相互干扰下,方波阳极溶出伏安法精确检测土壤中Cd2+和Pb2+》,该方案主要用于土壤中(类)金属及其化合物检测,参考标准--,《【EmStat3电化学应用】多种重金属相互干扰下,方波阳极溶出伏安法精确检测土壤中Cd2+和Pb2+》用到的仪器有EmStat4R迷你电化学分析仪(内置蓝牙无线和EIS测试)
推荐专场


相关方案
更多
该厂商其他方案
更多