


作为环境中普遍存在的有机物质,富里酸也称黄腐酸(Fulvic acid,FA)可以竞争性吸附/络合重金属离子(Heavy metal ions, HMIs)形成具有优异溶解度的FA-HMIs络合物,从而提高Cd2+和Pb2+的迁移率和生物可获取性。但是,由于FA-HMIs不具有电化学活性,方波阳极剥离伏安法(SWASV)作为一种电化学分析技术不能准确检测土壤和沉积物中生物可利用的Cd2+和Pb2+含量。
针对上述问题,中国农业大学信息与电气工程学院--刘刚教授--土壤重金属检测团队研究应用真空紫外-过氧化氢(VUV/H2O2)高级氧化技术分解FA-HMIs络合物,以有效恢复FA-HMIs中Cd2+和Pb2+的SWASV信号。此外,本研究还利用多种表征技术探讨了FA的光降解行为和光解副产物及其对FA-HMIs络合物转化为自由态Cd2+和Pb2+的影响,并揭示了FA与Cd2+和Pb2+的络合机制。结果表明,羧基和羟基等反应基团赋予FA络合Cd2+和Pb2+的能力。在H2O2浓度为125 mg/L的条件下进行VUV/H2O2光解9 min后,FA被分解成小分子有机物且其活性官能团被移除,FA-HMIs络合物被破坏并释放出游离态Cd2+和Pb2+,最终恢复了FA-HMIs络合物的SWSAV信号。此外,本研究应用实际样品测试了VUV/H2O2光解策略的实用性,结果显示VUV/H2O2显著提高了SWASV对土壤和湖泊沉积物的浸提液中Cd2+和Pb2+的检测精度,验证了其实用性。
方案详情

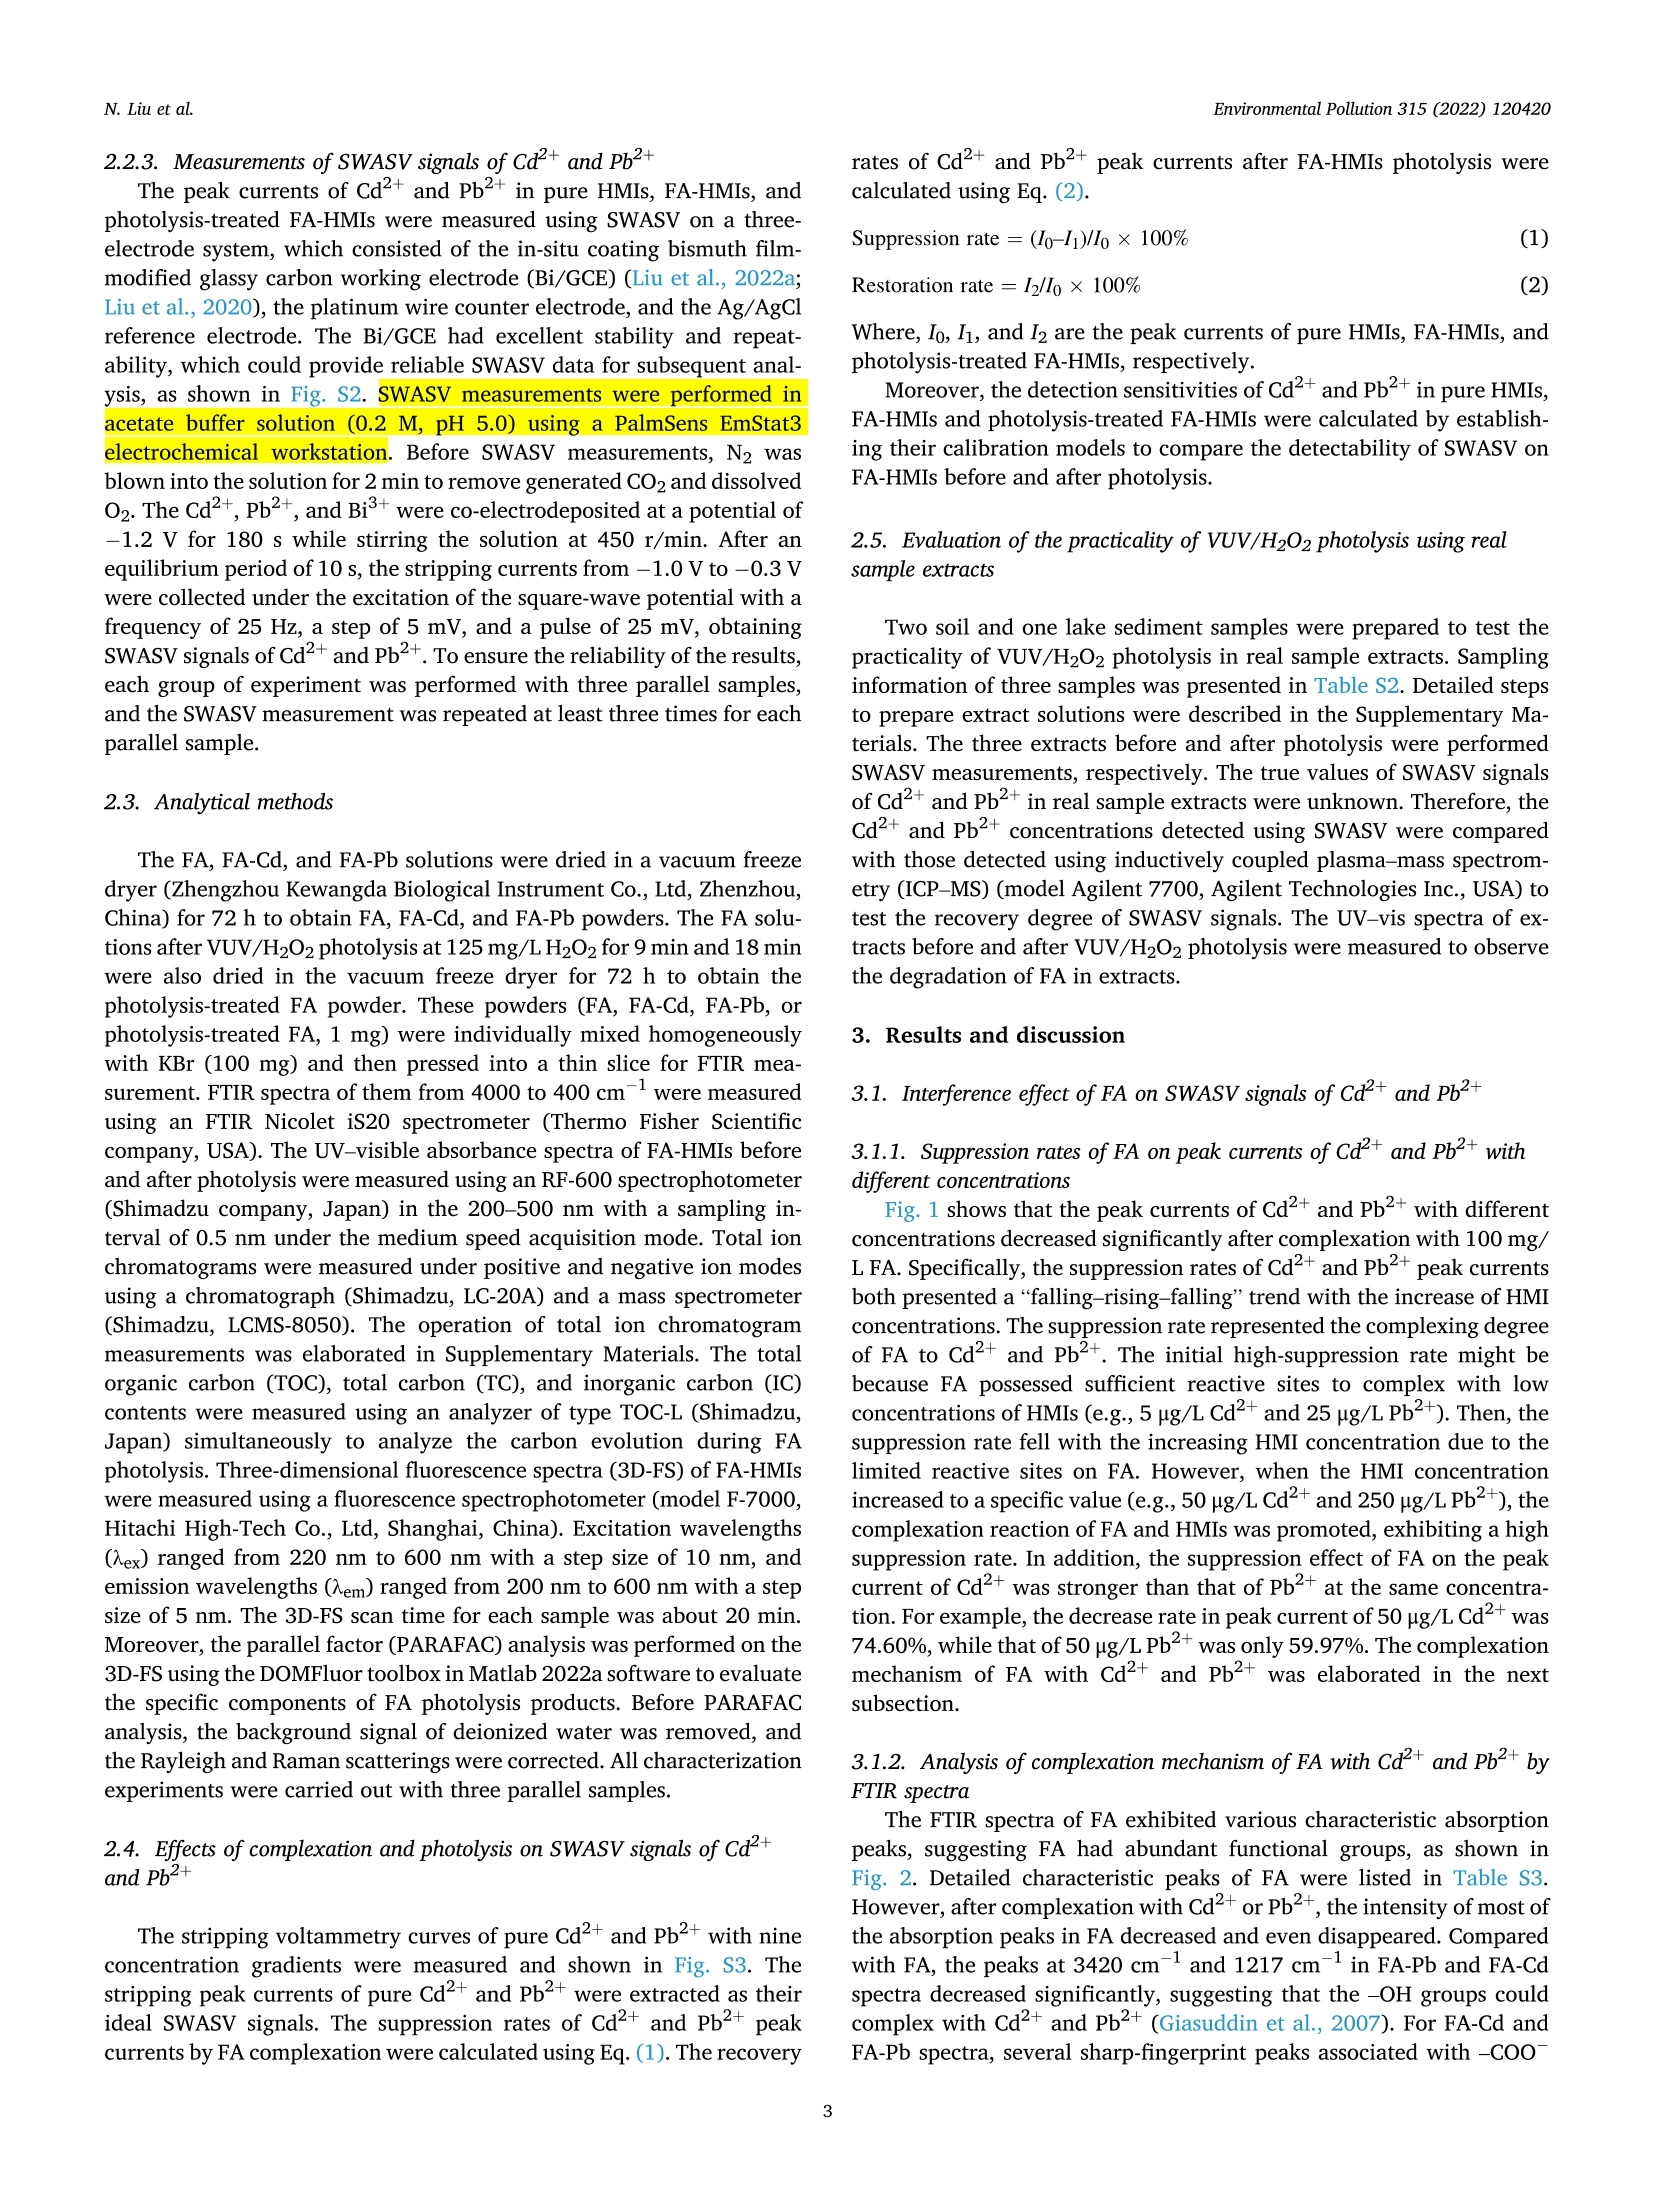
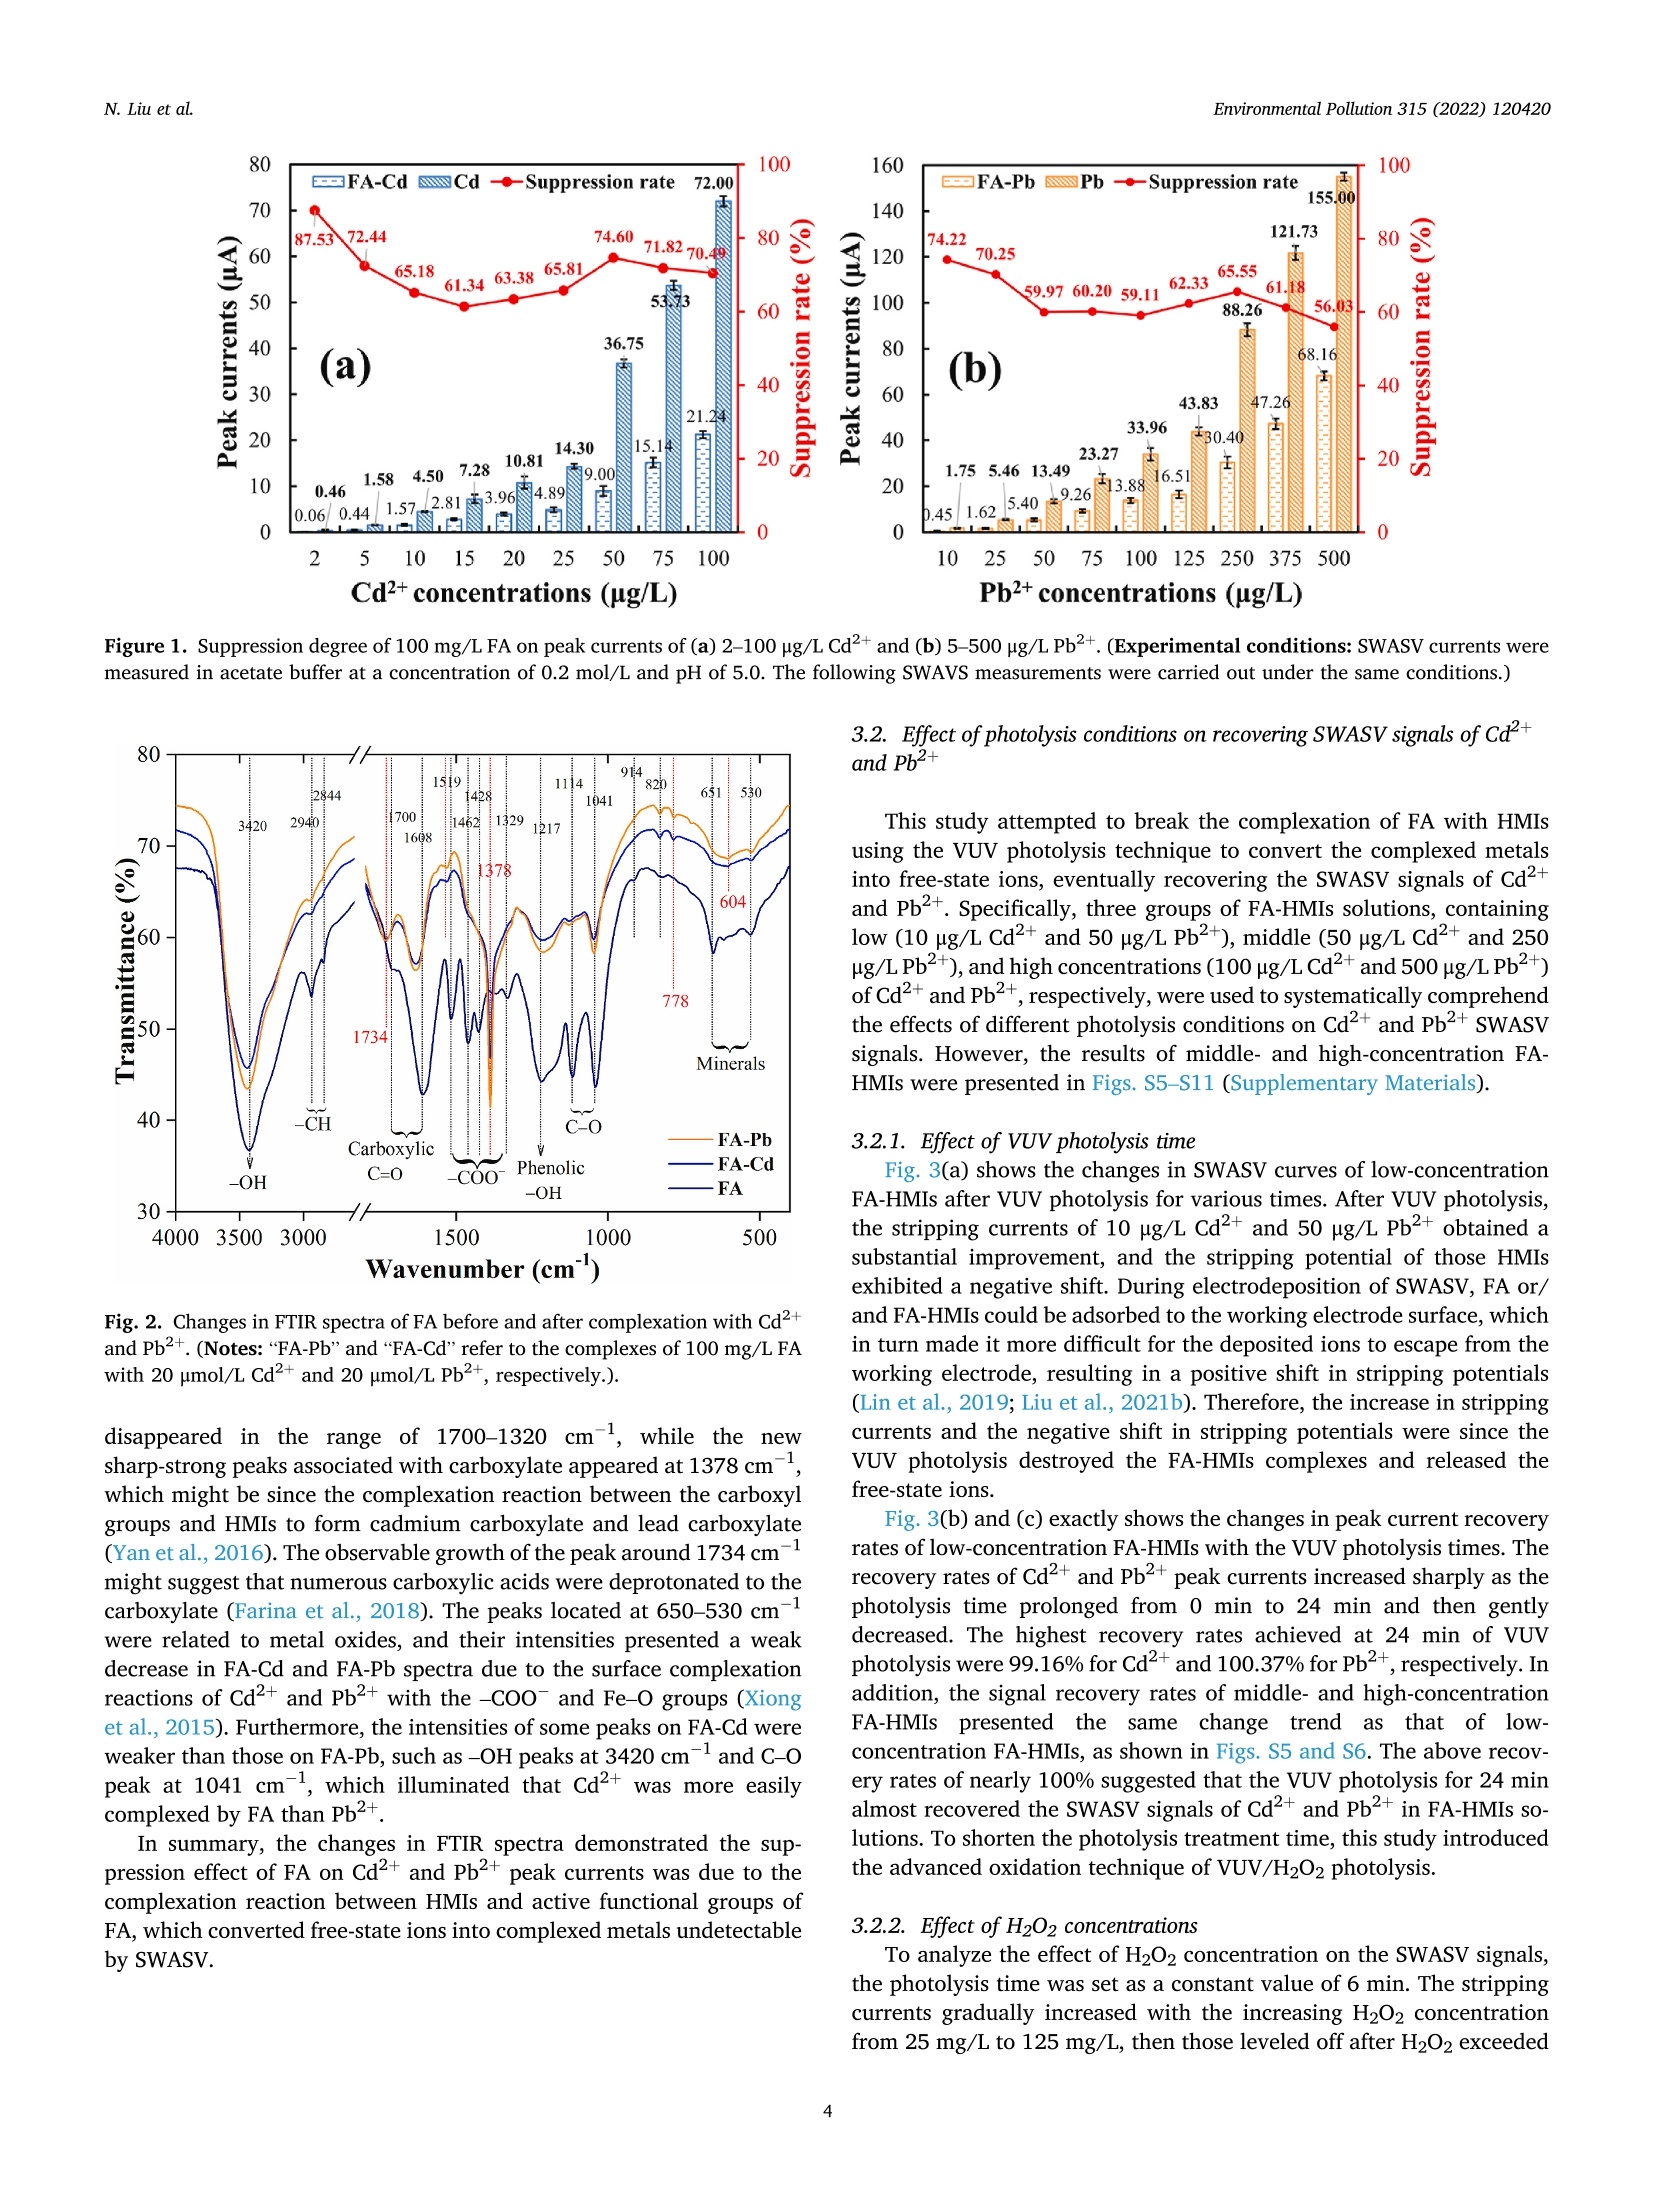
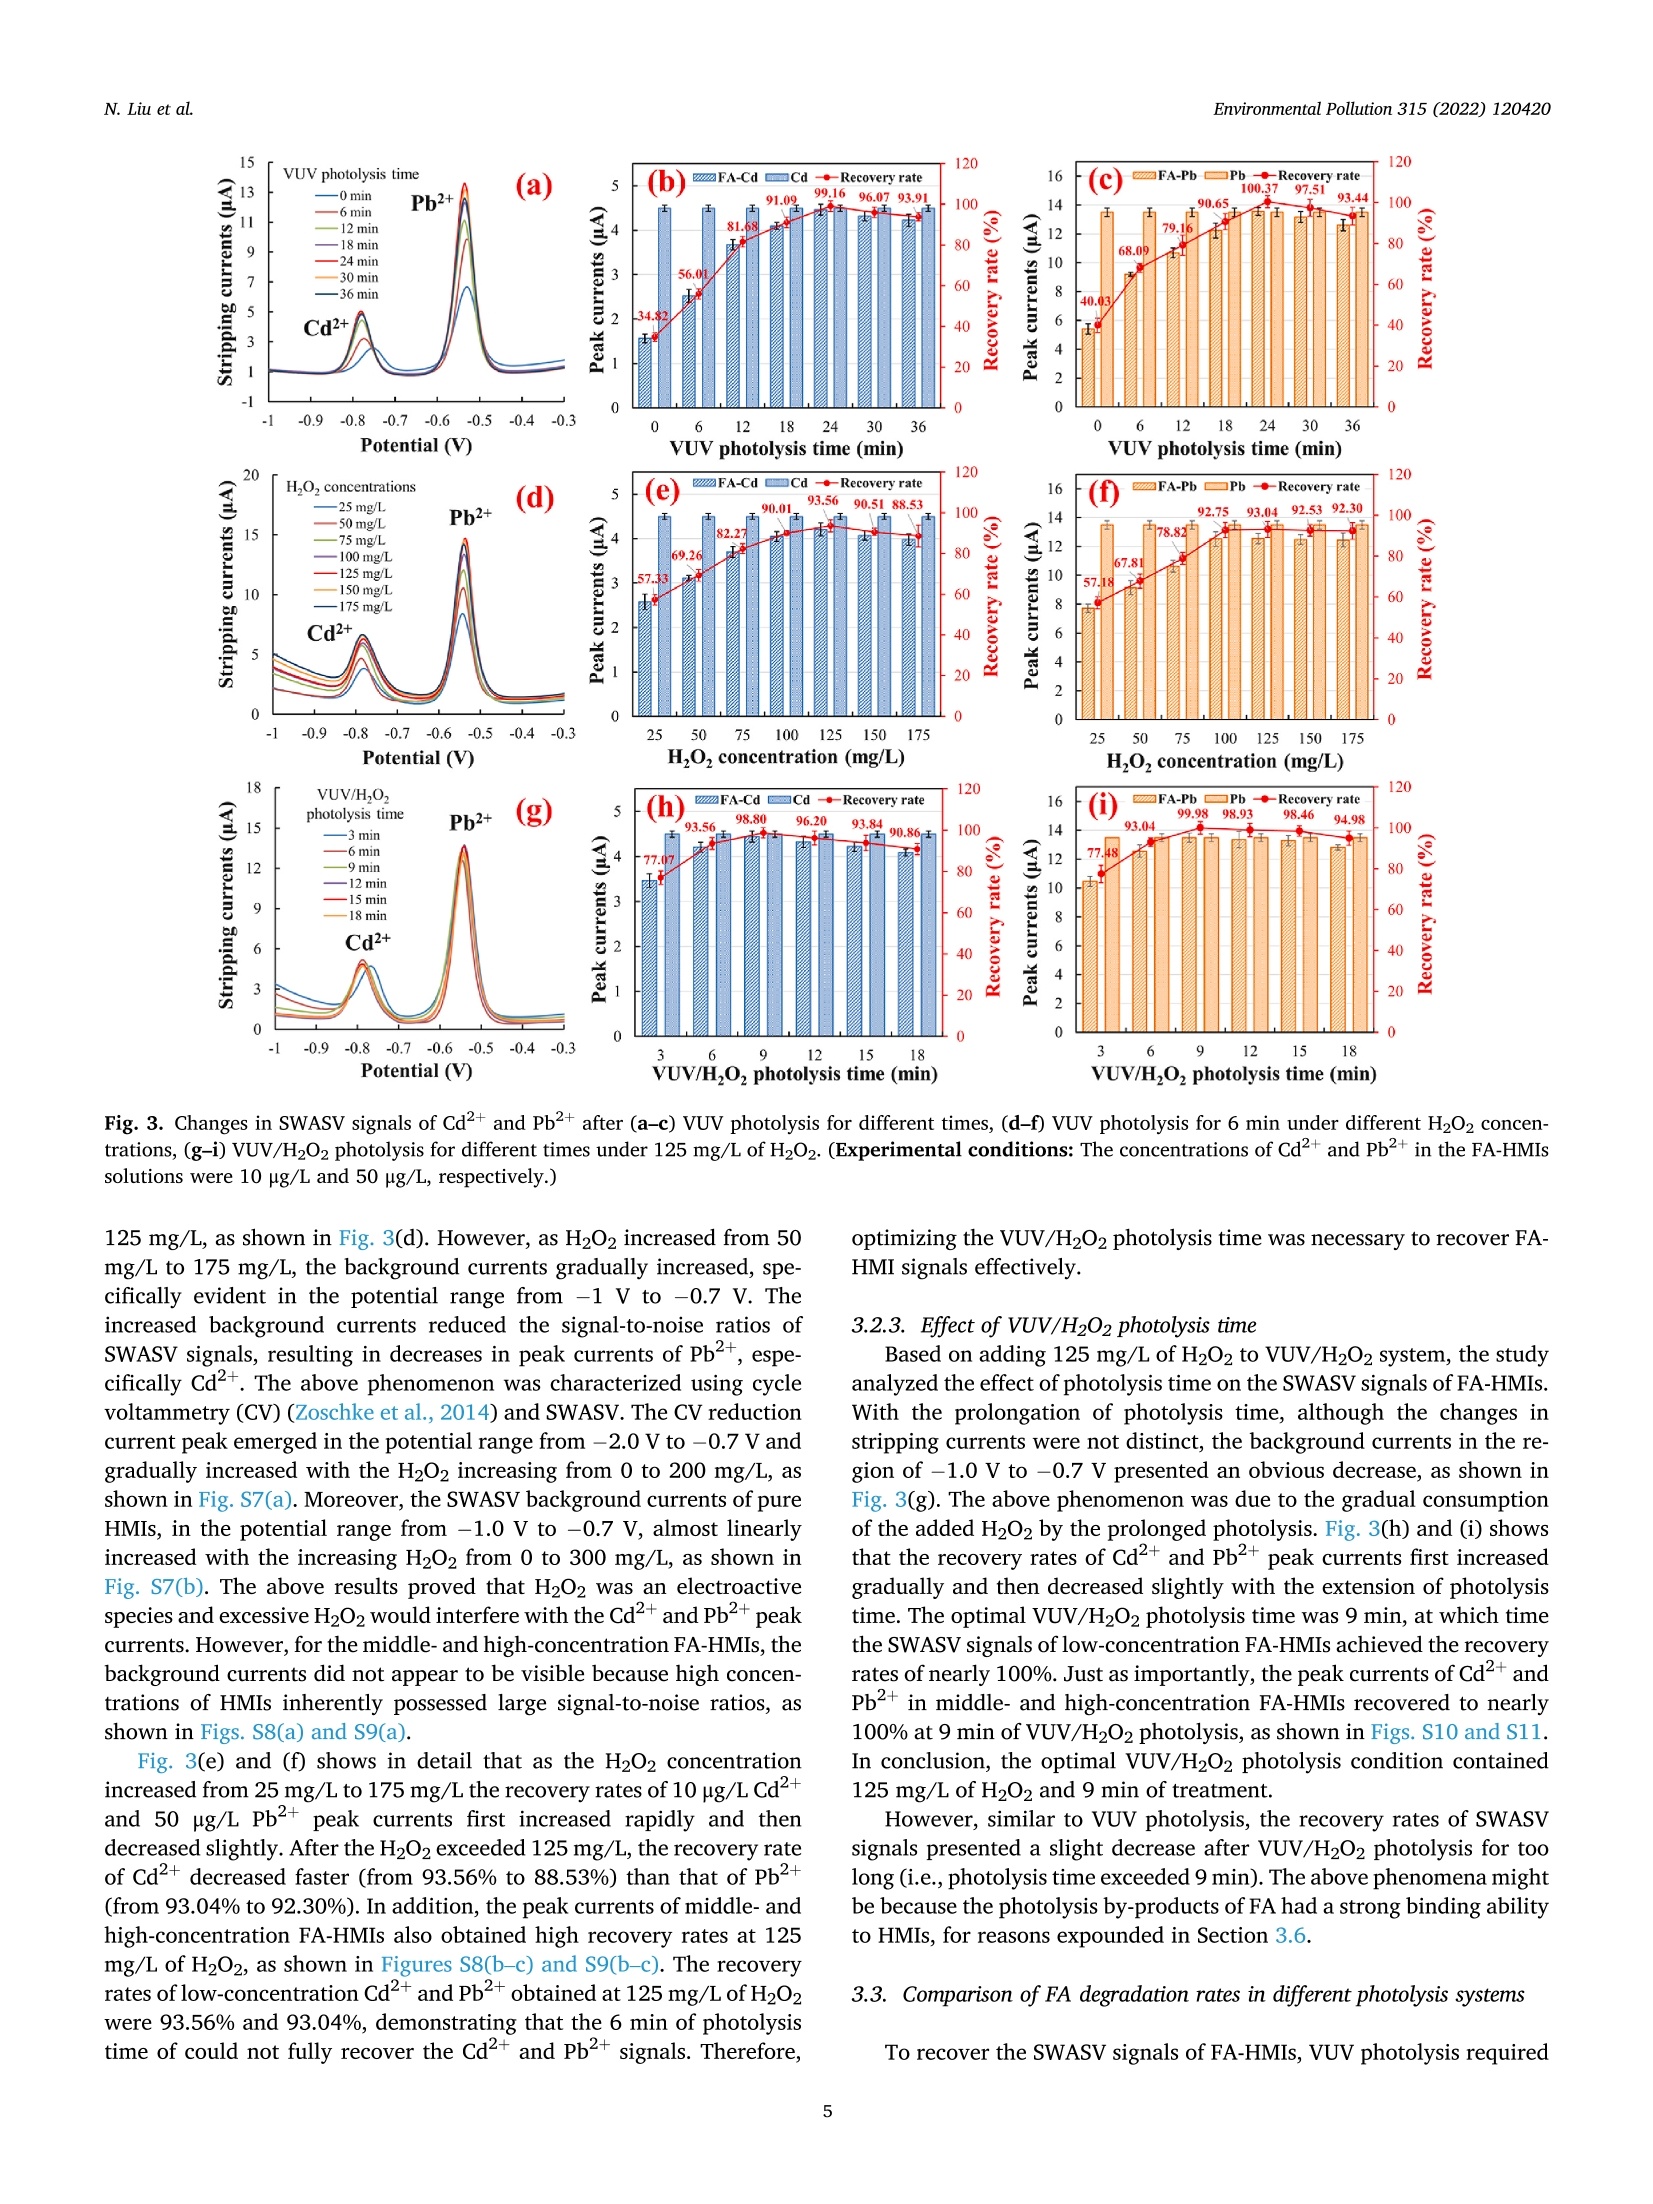
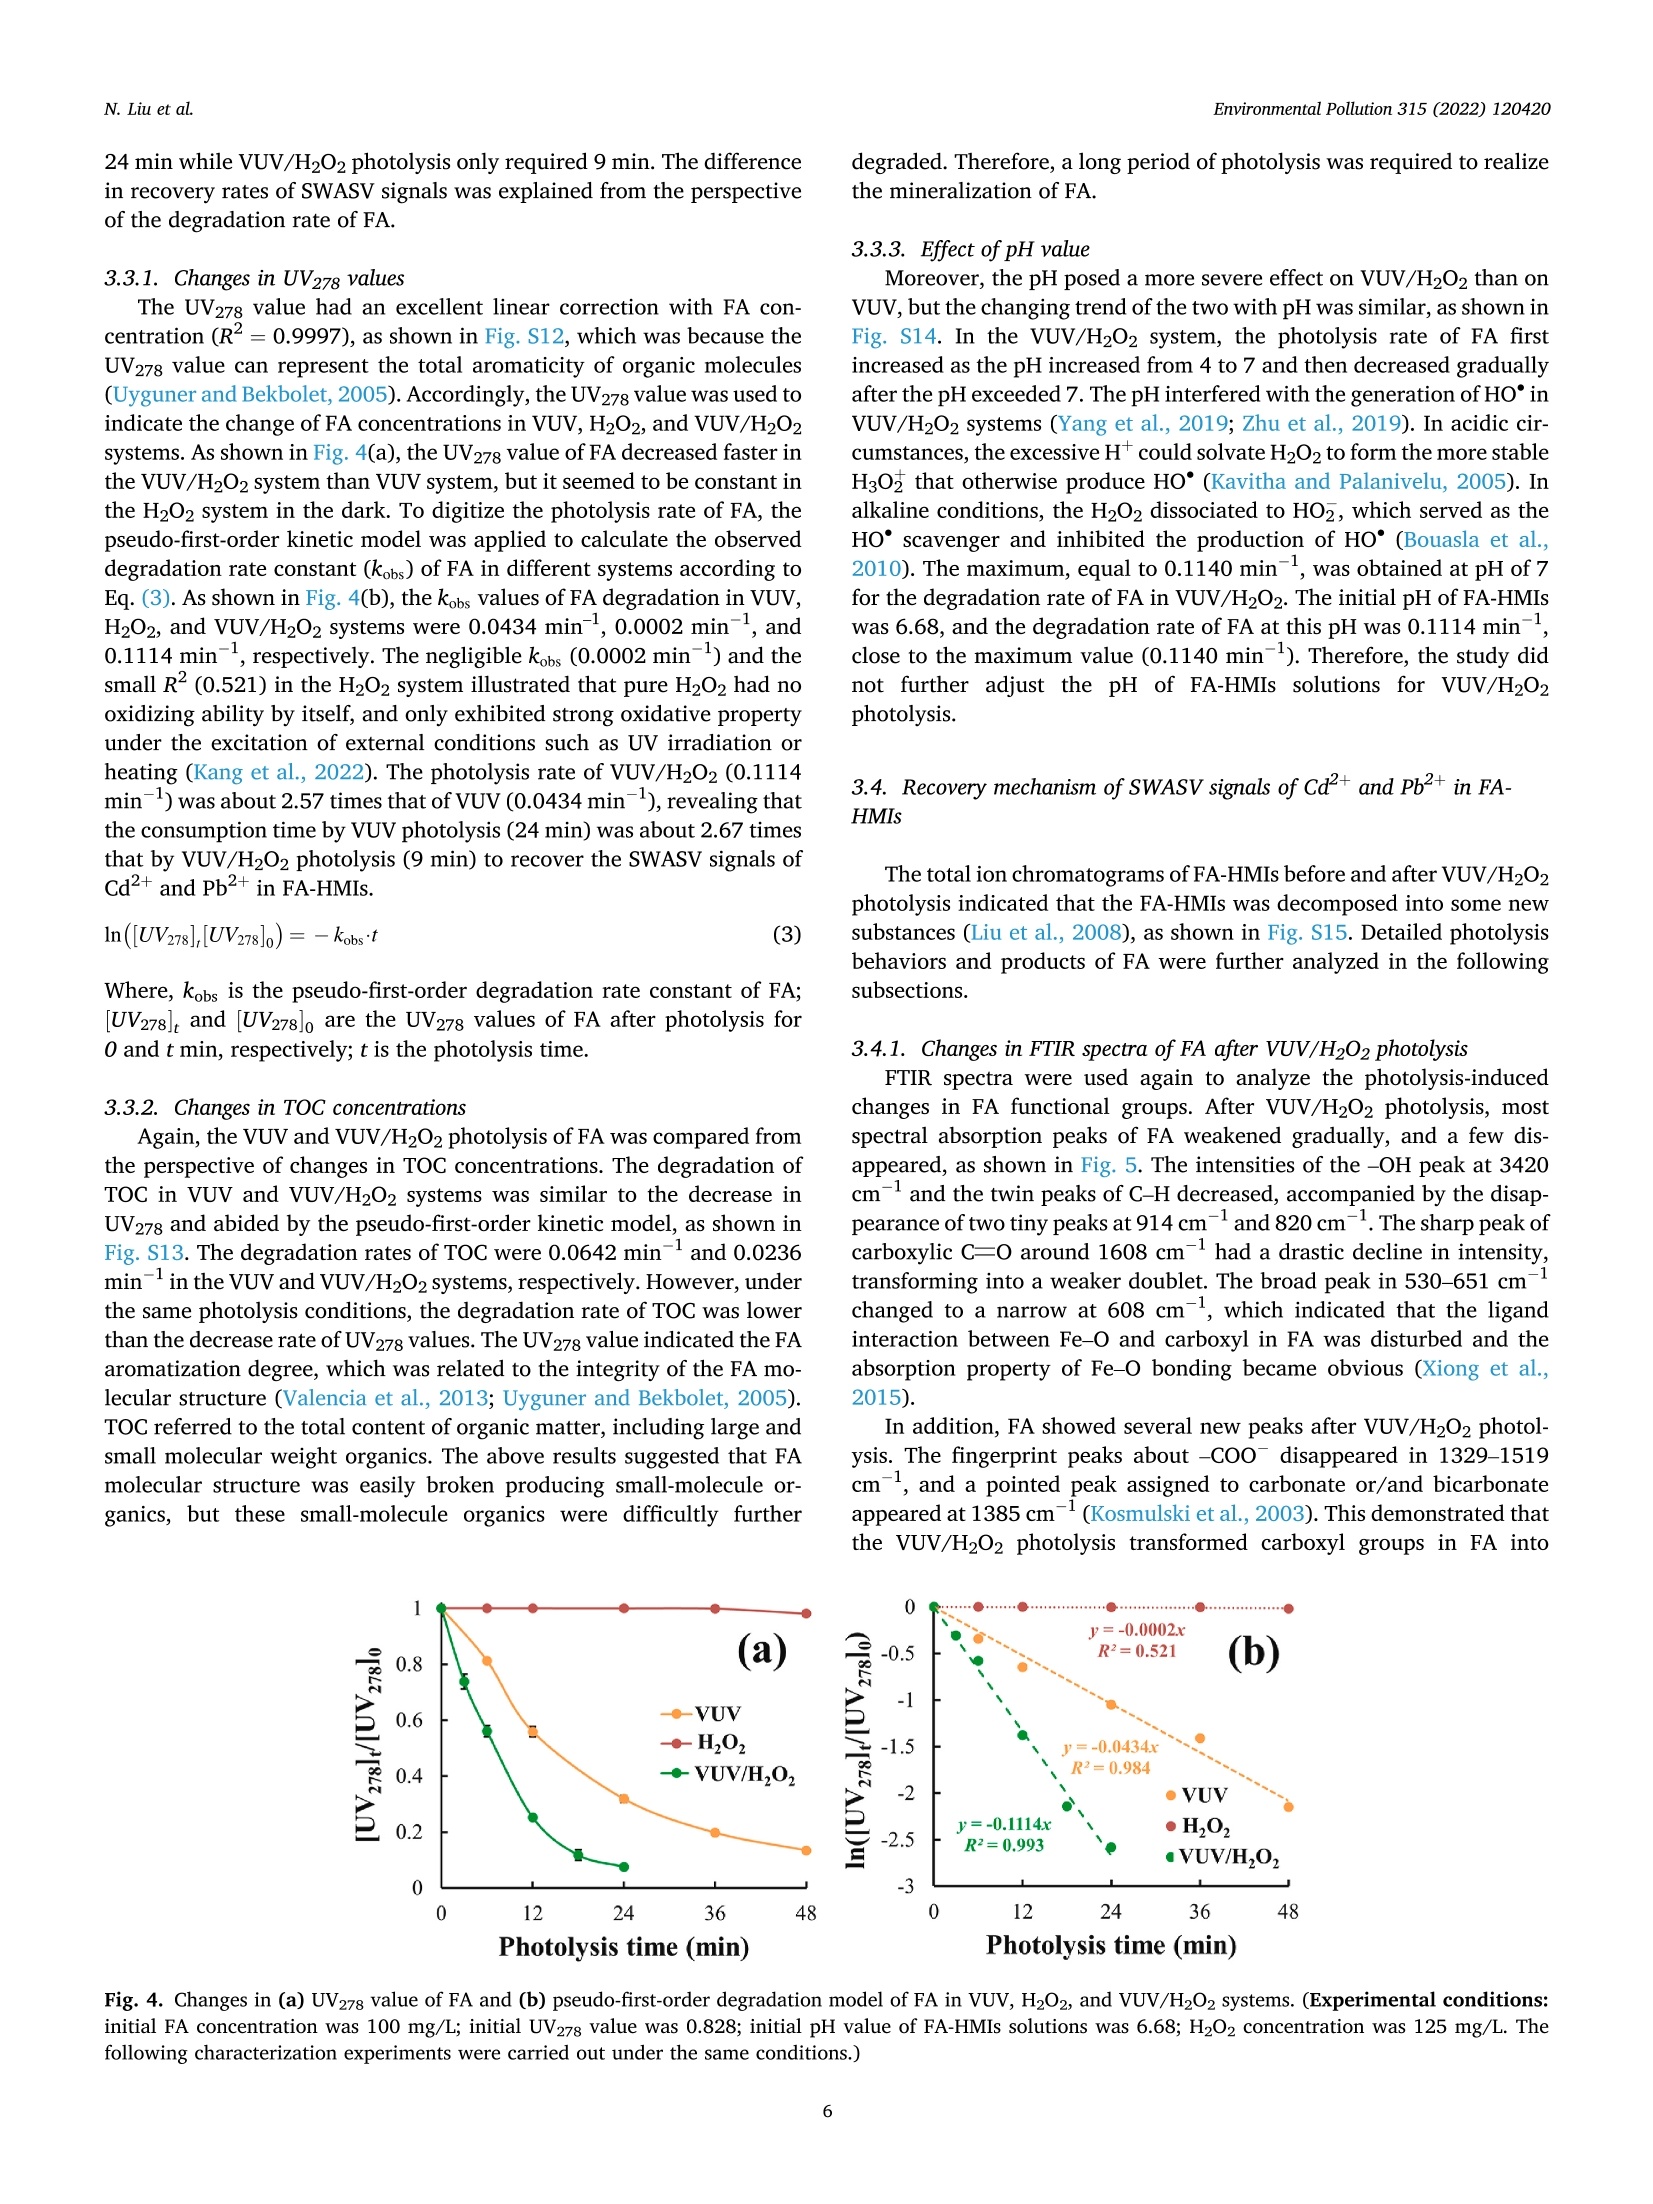
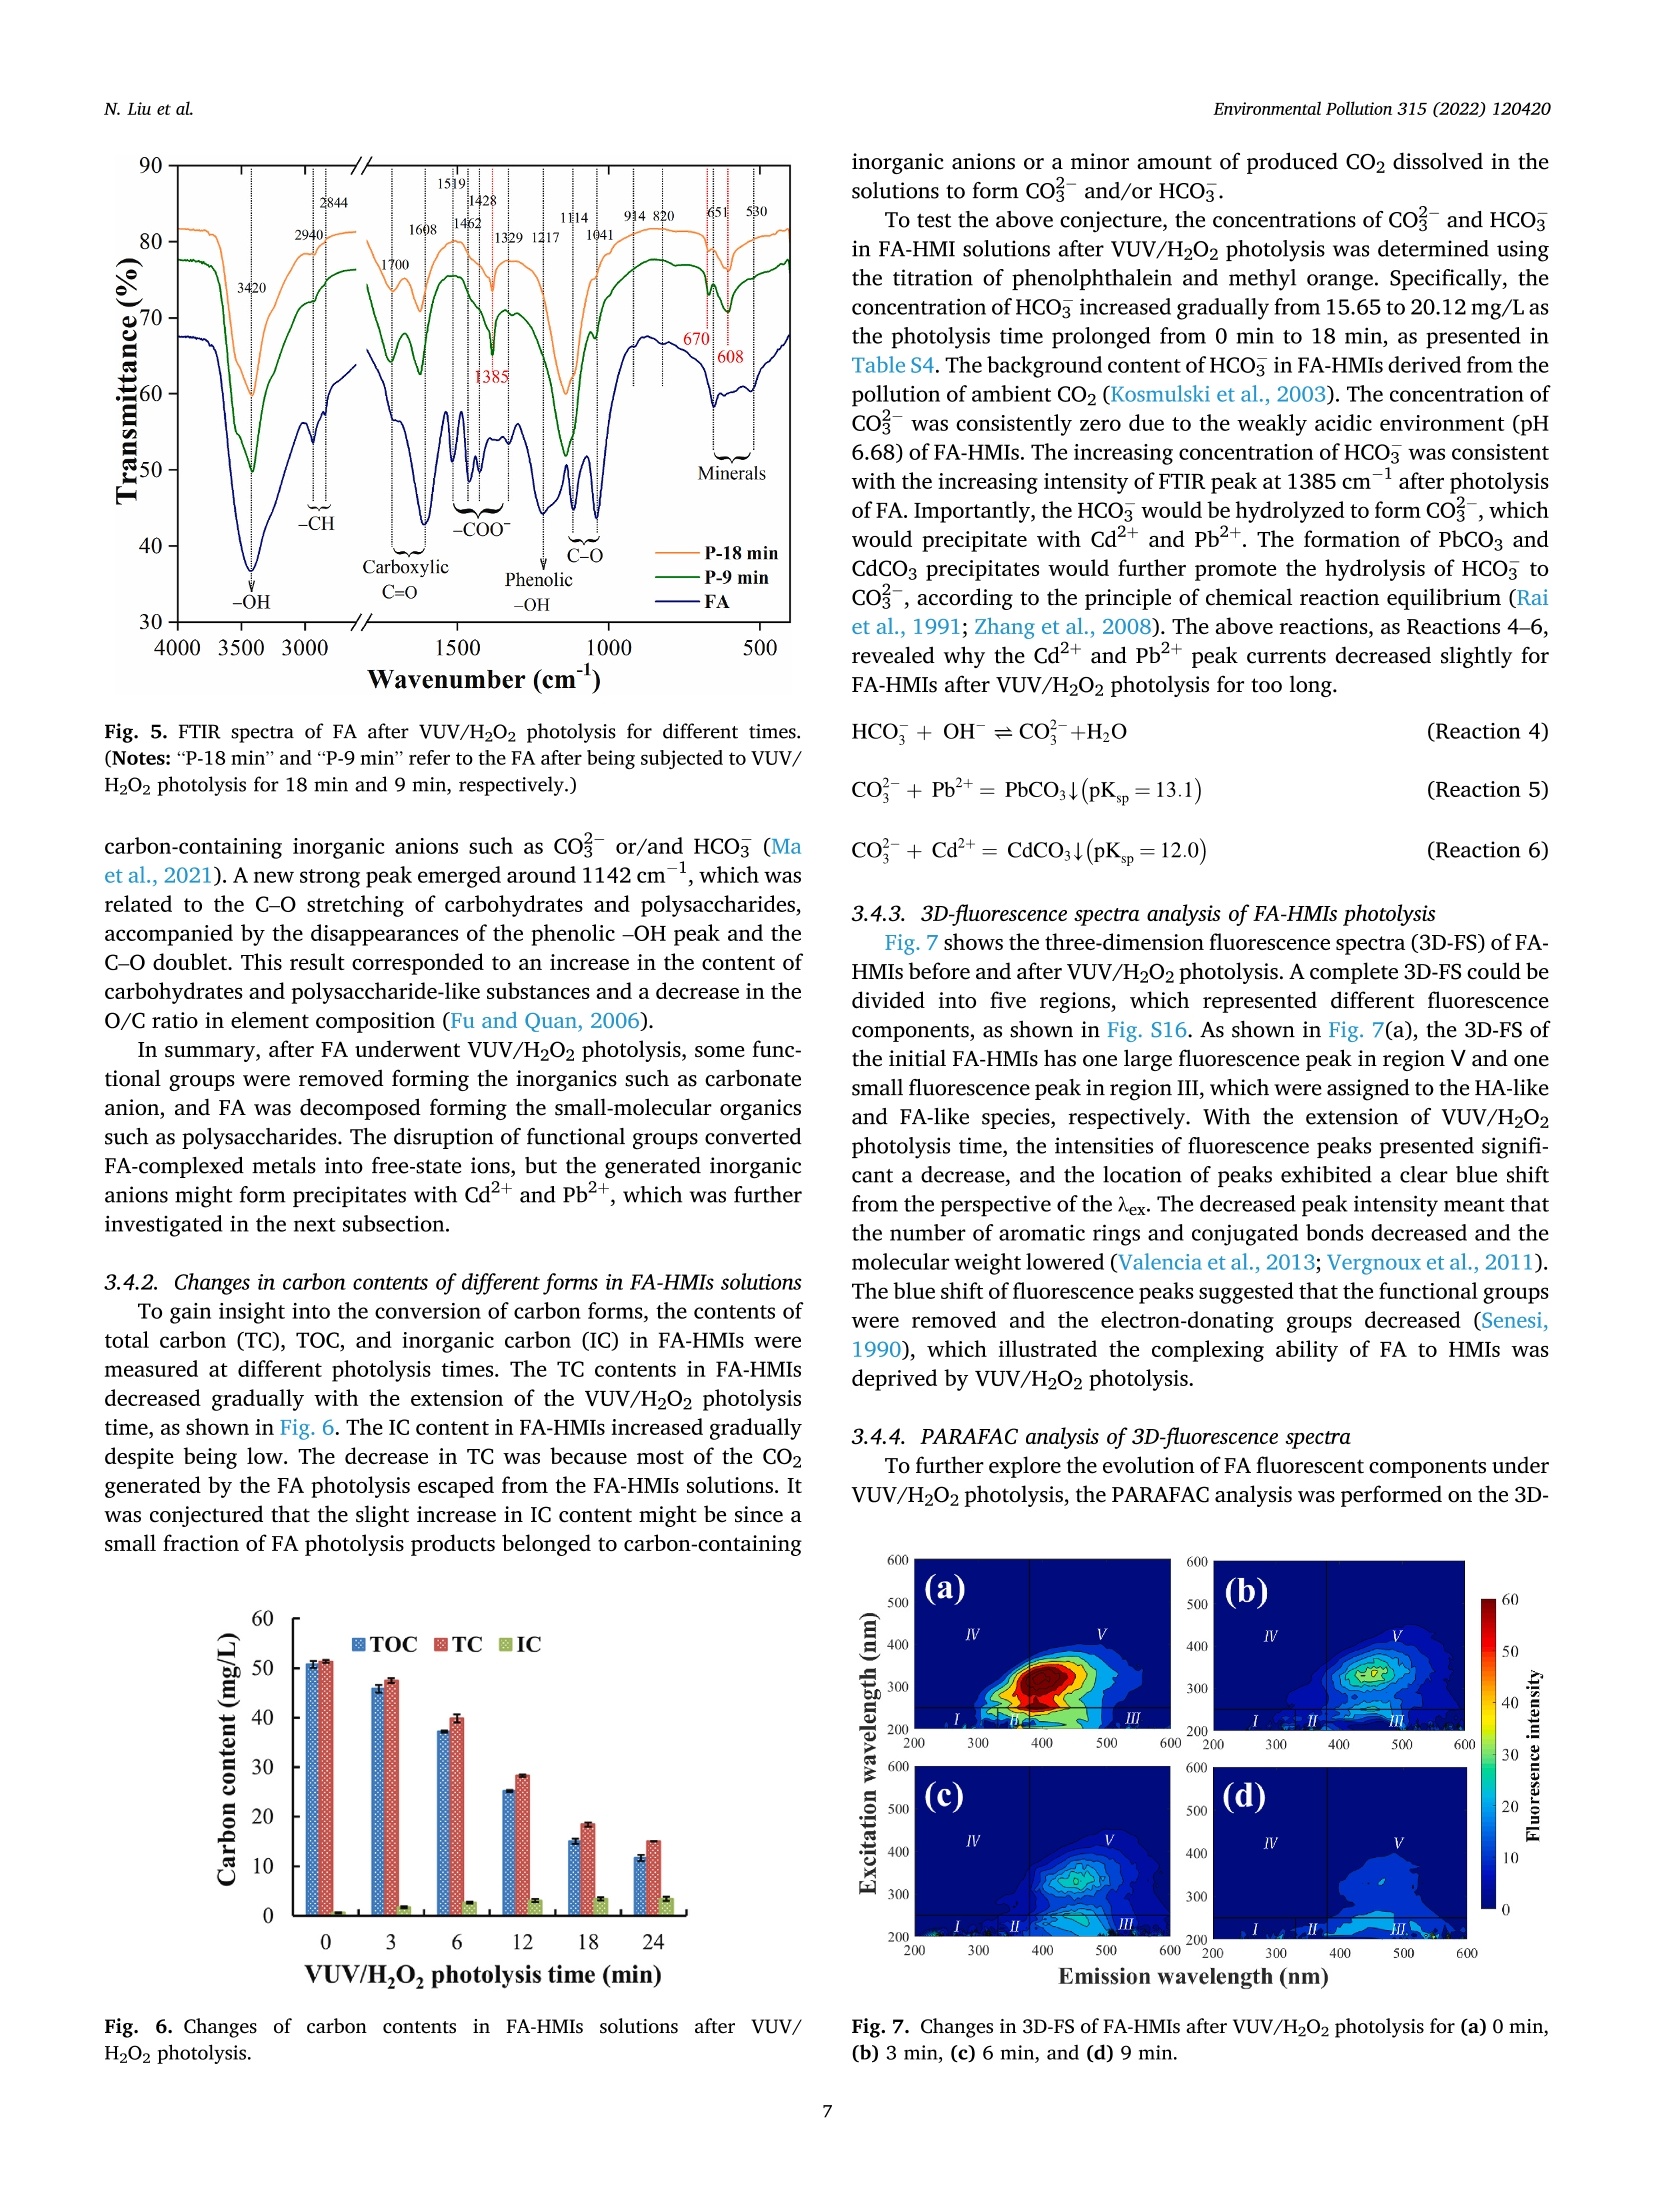
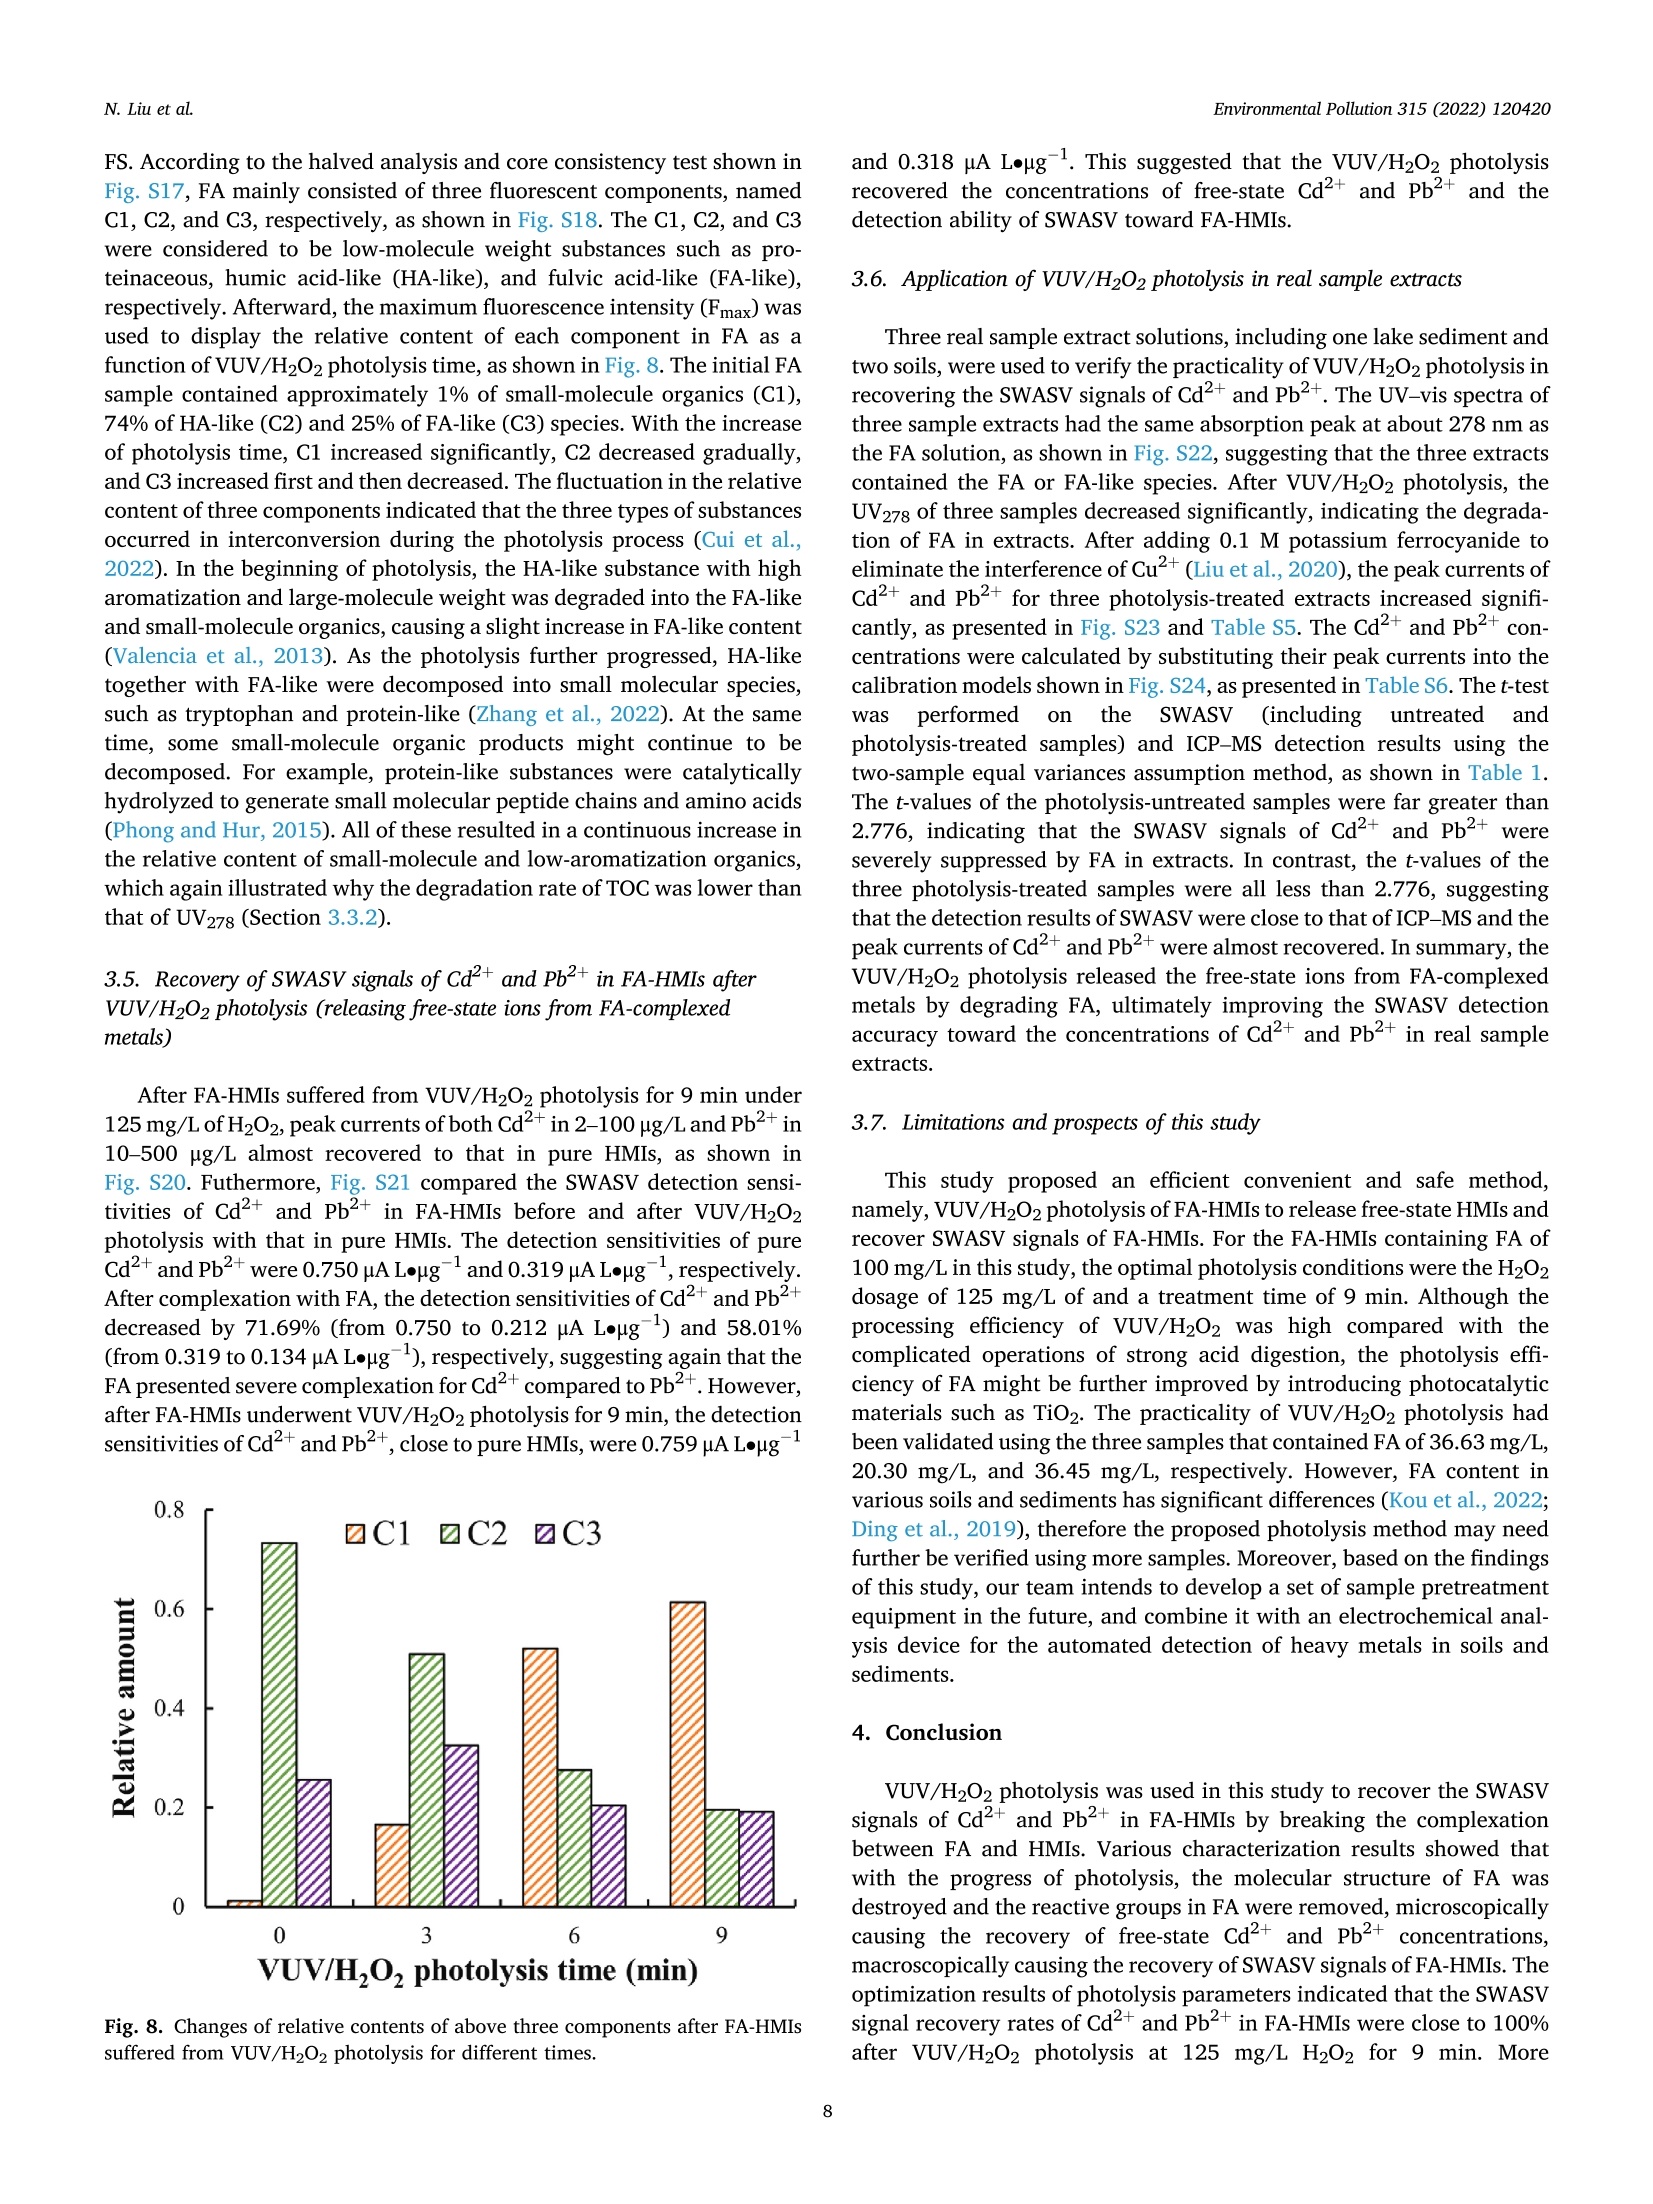
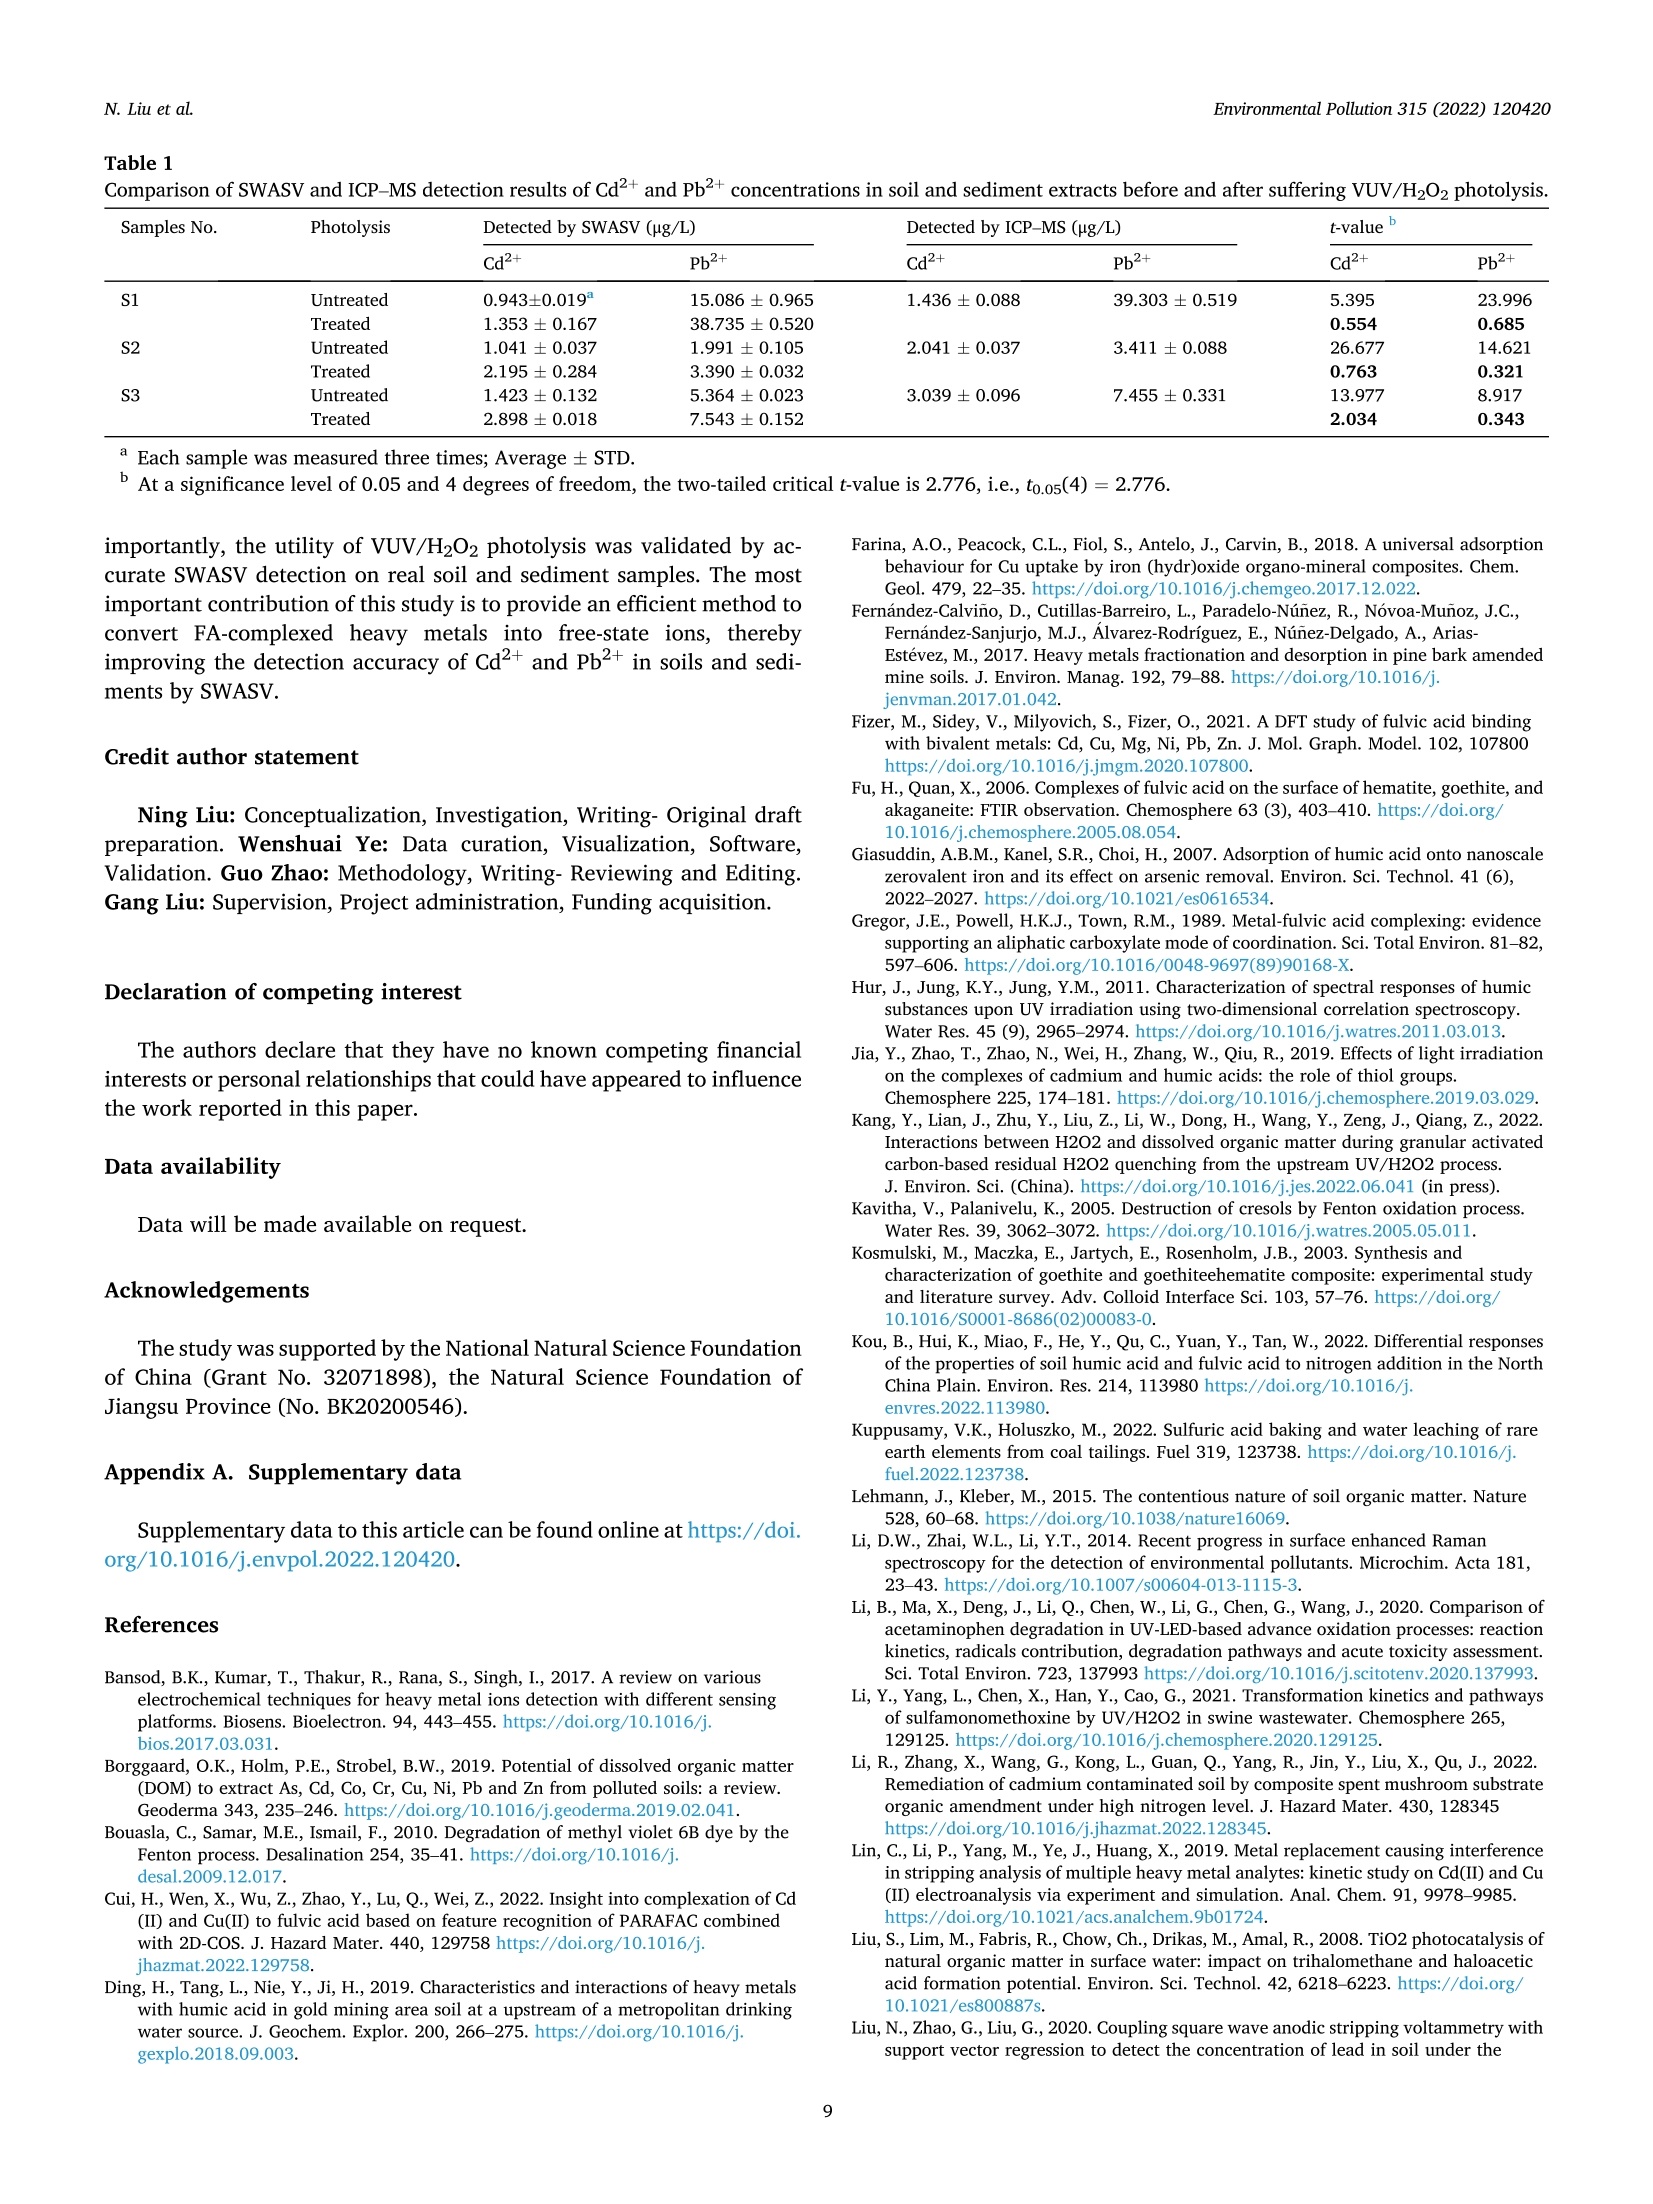
作为环境中普遍存在的有机物质,富里酸也称黄腐酸(Fulvic acid,FA)可以竞争性吸附/络合重金属离子(Heavy metal ions, HMIs)形成具有优异溶解度的FA-HMIs络合物,从而提高Cd2+和Pb2+的迁移率和生物可获取性。但是,由于FA-HMIs不具有电化学活性,方波阳极剥离伏安法(SWASV)作为一种电化学分析技术不能准确检测土壤和沉积物中生物可利用的Cd2+和Pb2+含量。针对上述问题,中国农业大学信息与电气工程学院--刘刚教授--土壤重金属检测团队研究应用真空紫外-过氧化氢(VUV/H2O2)高级氧化技术分解FA-HMIs络合物,以有效恢复FA-HMIs中Cd2+和Pb2+的SWASV信号。此外,本研究还利用多种表征技术探讨了FA的光降解行为和光解副产物及其对FA-HMIs络合物转化为自由态Cd2+和Pb2+的影响,并揭示了FA与Cd2+和Pb2+的络合机制。结果表明,羧基和羟基等反应基团赋予FA络合Cd2+和Pb2+的能力。在H2O2浓度为125 mg/L的条件下进行VUV/H2O2光解9 min后,FA被分解成小分子有机物且其活性官能团被移除,FA-HMIs络合物被破坏并释放出游离态Cd2+和Pb2+,最终恢复了FA-HMIs络合物的SWSAV信号。此外,本研究应用实际样品测试了VUV/H2O2光解策略的实用性,结果显示VUV/H2O2显著提高了SWASV对土壤和湖泊沉积物的浸提液中Cd2+和Pb2+的检测精度,验证了其实用性。原文链接:https://doi.org/10.1016/j.envpol.2022.120420 本文中进行电化学测试的仪器为荷兰PalmSens,型号:EmStat3电化学分析仪,由雷迪美特中国有限公司提供。需要了解更多电化学方面的知识,请关注我们或进入PalmSens中文网站:“http://www.palmsens.cn/”。Environmental Pollution 315 (2022) 120420Contents lists available at ScienceDirectEnvironmental Pollutionjournal homepage: www.elsevier.com/locate/envpol N. Liu et al.Environmental Pollution 315 (2022) 120420 Release of free-state ions from fulvic acid-heavy metal complexes via VUV/H2O2 photolysis: Photodegradation of fulvic acids and recovery of Cd"andPb2+ stripping voltammetry currents Ning Liu, Wenshuai Ye , Guo Zhao, Gang Liu a,b,* AKey Lab of Smart Agriculture Systems, Ministry of Education, China Agricultural University, Beijing, 100083, PR China D Key Laboratory of Agricultural Information Acquisition Technology, Ministry of Agriculture and Rural Affairs of China, China Agricultural University, Beijing, 100083, PR China College of Artificial Intelligence, Nanjing Agricultural University, Nanjing, 210031, PR China ARTICLEINFO ABSTRACT Keywords:FA-complexed metalsFree-state HMIsPhotodegradation behaviorPhotolysis productsHeavy metal detection Fulvic acid (FA), a ubiquitous organic matter in the environment, can enhance the mobility and bioavailability ofCd+ and Pb+ through competitive complexation to form FA-heavy metal ions (FA-HMIs) complexes withexcellent solubility. Because FA-HMIs are electrochemically inactive, square wave anodic stripping voltammetry(SWASV) cannot accurately detect the content of bioavailable Cd+ and Pb2+ in soils and sediments. This studyostensibly aimed to efficiently recover SWASV signals of Cd+ and Pb2+ in FA-HMIs by disrupting FA-HMIscomplexes using the combined vacuum ultraviolet and H202 (VUV/H2O2) process. Essentially, this studyexplored the photodegradation behavior and photolysis by-products of FA and their effects on the conversion ofFA-HMIs complexes to free-state Cdand Pb+ using multiple characterization techniques, as well as revealedthe complexation mechanism of FA with Cd+ and Pb2+. Results showed that reactive groups such as carboxyland hydroxyl endowed FA with the ability to complex Cd+ and Pb2+. After FA-HMIs underwent VUV/H202photolysis for 9 min at 125 mg/L of H202, FA was decomposed into small molecular organics while removing itsfunctional groups, which released the free-state Cd+and Pb2+ and recovered their SWSAV signals. However,prolonged photolytic mineralization of FA to inorganic anions formed precipitates with Cdand Pb+, therebydecreasing their SWSAV signals. Moreover, the VUV/H202 photolysis significantly improved the SWASVdetection accuracy toward the Cd+ and Pb2+ in real soil and sediment samples, verifying its practicality. 1. Introduction With anthropogenic progress, Cdand Pb+ as two toxic heavymetal ions (HMIs) accumulate in large amounts in soils and sediments,posing a serious threat to environmental security (William and C Peter,1991; Li et al., 2022) and potential harm to human health (Yu et al.,2022a). Heavy metals in soils and sediments exist in different fractions,including water-soluble, acid-exchangeable, oxidizable, reducible, andresidual forms (Ure, 1996). The water-soluble and acid-exchangeableforms of HMIs are considered to be the bioavailable fraction andexhibit extremely harmful to organisms according to the EuropeanCommunity Bureau of Reference (BCR) (Fernandez-Calvino et al.,2017). Therefore, accurate determination of Cd+ and Pb2+ inwater-soluble and acid-exchangeable forms is of great significance for assessing the risk of heavy metal pollution in soil and sedimentenvironments. Various spectroscopy-based (Li et al., 2014) andelectrochemistry-based (Bansod et al., 2017) methods have been used todetermine Cd+and Pb. Among them, square-wave anodic strippingvoltammetry (SWASV), as an electrochemical analysis method, has beenwidely used to determine Cd+and Pb2+ in the environment because ofits advantages of low background signal, high sensitivity, easy opera-tion, and low cost (Liu et al., 2022a; Lin et al.,2019). The SWASV peakcurrent is proportional to the concentration of free-state HMIs linearly(Liu et al.,2020). Therefore, SWASV requires the sample pre-processingto convert the target heavy metals into free-state ions. According to the reports by Tessier (Tessier et al., 1979) and BCR(Fernandez-Calvino et al., 2017), the heavy metals in water-soluble and Abbreviations: FA, Fulvic acid; HMIs, Heavy metal ions; FA-HMIs, Fulvic acid-heavy metal ion complexes; VUV, Vacuum ultraviolet. ( * Corresponding author. Key Lab of Smart Agriculture Systems, Ministry of Education, China Agricultural University, Beijing, 100083, PR China. ) ( E-mail address: pa c @c a u . e d u.cn (G. Liu). ) ( https: // doi . org/10.1016 / j .envpol.2022.120420 ) ( Received 5 September 2022; Received in revised form 26 September 2022; Accepted 9 October 2022 ) acid-exchangeable forms can be extracted and converted into free-stateions using weak acids such as acetate acids, obtaining soil and sedimentextracts for SWASV detection. However, natural organic matter domi-nated by humus are widespread in soils and sediments (Lehmann andKleber, 2015). Based on differences in solubility, the humus can bedivided into humin, humic acid (HA) and fulvic acid (FA) (Liu et al.,2021a). FA presents the strongest solubility, mobility, and chemicalactivity although it occupies a small proportion of sediment and soilhumus (Zavarzina et al., 2021). FA possesses many reactive functionalgroups such as hydroxyl and carboxyl (Wang et al., 2021; Xu et al.,2020), which endows FA with a super-strong ability to complex withHMIs (Senesi, 1990). In sediment and soil environments, FA can convertfree-state even residual-state heavy metals into soluble fulvic acid-heavymetalions (FA-HMIs) complexes through competitive complex-ation/adsorption with minerals or other organics (Borggaard et al.,2019; Gregor et al., 1989), thereby increasing the mobility andbiohazard of heavy metals (Cui et al., 2022; Fizer et al., 2021). FA-HMIswith excellent solubility and bioavailability will remain in weak-acidextracts of soils and sediments but have no electrochemical activityrelated to the SWASV signal (Sterritt and Lester, 1984; Ma et al., 2021).As a result, SWASV cannot accurately detect the content of bioavailableCd+ and Pb2+ in extracts, leading to inaccurate assessment of heavymetal pollution levels in soils and sediments. To accurately determine Cd+and Pb+ in weak-acid extracts bySWASV, the decomposition of FA-HMIs converting into free-state ions isnecessary. FA consisting of aromatic benzene rings and common func-tional groups (Xu et al., 2020) can be degraded and even mineralized bychemical oxidation or photooxidation (Rajca and Bodzek, 2013; Huret al., 2011; Valencia et al., 2013). Previous studies used strong acids torelease free ions by digesting organic matter, but this required a series ofcomplex post-treatments on digestion solutions such as acid removal byheating and pH adjustment for SWASV measurements (Kuppusamy andHoluszko, 2022; Mohamed et al., 2013). The combined process of ul-traviolet irradiation and hydrogen peroxide (UV/H202),as an advancedoxidation process, has attracted extensive attention in the degradationof organic substances (Yang et al., 2019; Zhan et al., 2021) due to itsenormous advantages of simple operation, no pollution, no catalyst re-covery, and the effective production of hydroxyl radicals (HO°) (Kanget al., 2022; Liu et al., 2022b). HO° as a non-selective and highly reactiveoxidizer presents a super strong oxidation ability (oxidation potential of2.80 V) (Sharma et al., 2012). Numerous studies have reported that theradiation at 245 nm light can convert H202 into HO°efficiently inneutral and weakly acidic environments (Liu et al., 2022b; Li et al.,2021), as shown in Reactions 1. Optical radiation at 185 nm couldconvert oxygen to ozone, which further promotes the production of HO°(Zoschke et al., 2014; Zhu et al., 2019), according to Reactions 2-3.Compared to low-pressure mercury lamps, ultraviolet-light emittingdiodes (UV-LEDs) possess the characteristics of small size, cheap price,and optional wavelength (Li et al., 2020). Therefore, the vacuumultraviolet-LEDs (VUV-LEDs) that can emit light at 185 nm and 254 nmsimultaneously are used in this study to constitute the VUV/H202photolysis system. VUV/H2O2 photolysis was expected to recover the SWASV signals ofCd+ and Pb+ by breaking the structure of FA. Theoretically, FA ismineralized to CO2 and H20 under photolysis (Valencia et al., 2013).During that process, FA photolysis results in the formation of someby-products, such as thiol groups (Jia et al., 2019) and carbonate anions(Ma et al., 2021), which will undergo complexation and/or precipitationreactions with Cd+ and Pb2+, thereby again decreasing their SWASVsignals. In VUV/H2O2 system, the dosage of H202 influences the production efficiency of HO° (Yang et al., 2019), which further de-termines the photolysis rate of FA. Moreover,H2O2 with electrochemicalactivity may interfere with the SWASV currents of Cd+and Pb2+(Yuet al., 2022b; Zakaria and Leszczynska, 2019). However, previousstudies failed to explore the changes in photolysis products withphotolysis time and H202 dosage and their effects on SWASV signals ofCd+and Pb+ deeply. This study aimed to develop an efficient convenient and safe method,namely, VUV/H2O2 photolysis to recover the detection accuracy of Cd2+and Pb+ in FA-HMIs (extracts of soils and sediments) by SWASV.Photolysis parameters (i.e., H202 dose and photolysis time) were opti-mized to efficiently recover the SWASV signals of FA-HMIs. A variety ofcharacterization methods, including the FTIR, UV-Visible spectra, TOC,inorganic carbon content, total ions chromatograph, and 3D-fluores-cence spectra, were used to infer the photolysis pathways of FA in FA-HMIs, and combined with SWASV signals to speculate the complexingability of FA photolysis products to HMIs. In addition, this study vali-dated the utility of VUV/H202 photolysis using real soil and sedimentextracts. 2. Materials and methods 2.1. Chemical reagents All reagents were of analytical grade unless otherwise specified. Theworking solutions of Cd+,Pb+, and Bi’ were prepared by diluting 1mg/mL stock solutions of Cd(NO3)2,Pb(NO3)2, and Bi(NO3)3. The ace-tate acid (pH 5.0, 0.2 M) acted as the buffer solution. Fulvic acid (FA)powder was used to prepare FA solutions. Hydrogen peroxide (H202,30%) acted as the provider of hydroxyl radicals. K4Fe(CN)6 acted as themasking agent of Cu in sample extracts. The 0.1 M NaOH and 0.1 MHNO3 were used to adjust the solution pH. Methyl orange, phenol-phthalein, and HCl reagents were used to titrate carbonate and bicar-bonate concentrations. Deionized water (18.2 MQ cm) acted as thesolvent, diluent, and cleaning agent. The acquisition details of theabovementioned reagents were presented in Table S1. 2.2. Experimental procedures 2.2.1. Complexation of FA and HMIs The purchased FA powder was first purified and then formulated intothe 100 mg/L of FA solution for subsequent experiments. To research thecomplexation degree of FA to Cd+ and Pb2+, the FA-HMIs complexsolutions were prepared by adding various doses of Cd+and Pb+ to FAsolutions and then shaken in an end-over-end shaker at room tempera-ture for 24 h to reach the complexation equilibrium. There were ninegroups of HMIs concentration gradients. The Cd+concentrations were2, 5,10,15,20,25,50, 75, and 100 ug/L, and the corresponding Pb2+concentrations were 5, 25, 50,75,100,125,250,375, and 500 ug/L,respectively. The initial pH value of FA-HMIs solutions was about 6.68. 2.2.2. VUV/H202 photolysis A series of experiments were carried out to explore the de-complexation effect of VUV/H2O2 photolysis on the FA-HMIs. Photol-ysis experiments were performed in an underwater treatment system, i.e., the six VUV-LEDs were immersed in 20 mL of FA-HMIs solutions, asshown in Fig. S1. The VUV-LEDs (Lampda Co., Ltd, Shenzhen, China)were driven with a supple power of 2.4 W, emitting light at 185 nm and254 nm. The temperature of FA-HMIs solutions was kept at about 25 ±0.3 °C using the water-bath method during photolysis. To analyze theeffect of pH on photolysis efficiency, the pH values of FA-HMIs wereadjusted to 4.0, 6.0,5.0,7.0,8.0 and 9.0, respectively. The pH value wasmeasured using a pH meter (model PHSJ-4F, Leici, Shanghai, China).The photolysis parameters, including photolysis time and H202 dosage,were optimized to recover the Cd+ and Pb2+ peak currents efficiently. The peak currents of Cd+ and Pb2+ in pure HMIs, FA-HMIs, andphotolysis-treated FA-HMIs were measured using SWASV on a three-electrode system, which consisted of the in-situ coating bismuth film-modified glassy carbon working electrode (Bi/GCE) (Liu et al., 2022a;Liu et al., 2020), the platinum wire counter electrode, and the Ag/AgClreference electrode. The Bi/GCE had excellent stability and repeat-ability, which could provide reliable SWASV data for subsequent anal-ysis, as shown in Fig. S2. SWASV measurements were performed inacetate buffer solution (0.2 M, pH 5.0) using a PalmSens EmStat3electrochemical workstation. Before SWASV measurements, N2 wasblown into the solution for 2 min to remove generated CO2 and dissolvedO2. The Cd+, Pb2+,and Biwere co-electrodeposited at a potential of-1.2 V for 180 s while stirring the solution at 450 r/min. After anequilibrium period of 10 s, the stripping currents from -1.0Vto -0.3Vwere collected under the excitation of the square-wave potential with afrequency of 25 Hz, a step of 5 mV, and a pulse of 25 mV, obtainingSWASV signals of Cd²+ and Pb2+. To ensure the reliability of the results,each group of experiment was performed with three parallel samples,and the SWASV measurement was repeated at least three times for eachparallel sample. 2.3. Analytical methods The FA, FA-Cd, and FA-Pb solutions were dried in a vacuum freezedryer (Zhengzhou Kewangda Biological Instrument Co., Ltd, Zhenzhou,China) for 72 h to obtain FA, FA-Cd, and FA-Pb powders. The FA solu-tions after VUV/H202 photolysis at 125 mg/L H202 for 9 min and 18 minwere also dried in the vacuum freeze dryer for 72 h to obtain thephotolysis-treated FA powder. These powders (FA, FA-Cd, FA-Pb, orphotolysis-treated FA, 1 mg) were individually mixed homogeneouslywith KBr (100 mg) and then pressed into a thin slice for FTIR mea-surement. FTIR spectra of them from 4000 to 400 cmwere measuredusing an FTIR Nicolet is20 spectrometer (Thermo Fisher Scientificcompany, USA). The UV-visible absorbance spectra of FA-HMIs beforeand after photolysis were measured using an RF-600 spectrophotometer(Shimadzu company, Japan) in the 200-500 nm with a sampling in-terval of 0.5 nm under the medium speed acquisition mode. Total ionchromatograms were measured under positive and negative ion modesusing a chromatograph (Shimadzu, LC-20A) and a mass spectrometer(Shimadzu, LCMS-8050). The operation of total ion chromatogrammeasurements was elaborated in Supplementary Materials. The totalorganic carbon (TOC), total carbon (TC), and inorganic carbon (IC)contents were measured using an analyzer of type TOC-L (Shimadzu,Japan) simultaneously to analyze the carbon evolution during FAphotolysis. Three-dimensional fluorescence spectra (3D-FS) of FA-HMIswere measured using a fluorescence spectrophotometer (model F-7000,Hitachi High-Tech Co., Ltd, Shanghai, China). Excitation wavelengths(Aex) ranged from 220 nm to 600 nm with a step size of 10 nm, andemission wavelengths (Nem) ranged from 200 nm to 600 nm with a stepsize of 5 nm. The 3D-FS scan time for each sample was about 20 min.Moreover, the parallel factor (PARAFAC) analysis was performed on the3D-FS using the DOMFluor toolbox in Matlab 2022a software to evaluatethe specific components of FA photolysis products. Before PARAFACanalysis, the background signal of deionized water was removed, andthe Rayleigh and Raman scatterings were corrected. All characterizationexperiments were carried out with three parallel samples. 2.4. Effects of complexation and photolysis on SWASV signals ofCd²+and Pb2+ The stripping voltammetry curves of pure Cd+and Pb2+ with nineconcentration gradients were measured and shown in Fig. S3. Thestripping peak currents of pure Cd+and Pb+ were extracted as theirideal SWASV signals. The suppression rates of Cd+ and Pb2+ peakcurrents by FA complexation were calculated using Eq.(1). The recovery rates of Cd+and Pb2+ peak currents after FA-HMIs photolysis werecalculated using Eq. (2). Where, Io, Ii, and I2 are the peak currents of pure HMIs, FA-HMIs, andphotolysis-treated FA-HMIs, respectively. Moreover, the detection sensitivities of Cd+ and Pb+in pure HMIs,FA-HMIs and photolysis-treated FA-HMIs were calculated by establish-ing their calibration models to compare the detectability of SWASV onFA-HMIs before and after photolysis. 2.5. Evaluation of the practicality of VUV/H202 photolysis using realsample extracts Two soil and one lake sediment samples were prepared to test thepracticality of VUV/H2O2 photolysis in real sample extracts. Samplinginformation of three samples was presented in Table S2. Detailed stepsto prepare extract solutions were described in the Supplementary Ma-terials. The three extracts before and after photolysis were performedSWASV measurements, respectively. The true values of SWASV signalsof Cd+and Pb2+ in real sample extracts were unknown. Therefore, theCd+ and Pb+ concentrations detected using SWASV were comparedwith those detected using inductively coupled plasma-mass spectrom-etry (ICP-MS) (model Agilent 7700, Agilent Technologies Inc., USA) totest the recovery degree of SWASV signals. The UV-vis spectra of ex-tracts before and after VUV/H202 photolysis were measured to observethe degradation of FA in extracts. 3. Results and discussion 3.1. Interference effect of FA on SWASV signals of Cd+and Pb2+ 3.1.1. Suppression rates of FA on peak currents of Cd²+and Pb+ withdifferent concentrations Fig. 1 shows that the peak currents of Cd+and Pb2+ with differentconcentrations decreased significantly after complexation with 100 mg/L FA. Specifically, the suppression rates of Cd+and Pb2+ peak currentsboth presented a “falling-rising-falling”trend with the increase of HMIconcentrations. The suppression rate represented the complexing degreeof FA to Cd and Pb+. The initial high-suppression rate might bebecause FA possessed sufficient reactive sites to complex with lowconcentrations of HMIs (e.g., 5 pg/L Cd and 25 pg/L Pb). Then, thesuppression rate fell with the increasing HMI concentration due to thelimited reactive sites on FA. However, when the HMI concentrationincreased to a specific value (e.g.,50 pg/L Cd+and 250 pg/L Pb+), thecomplexation reaction of FA and HMIs was promoted, exhibiting a highsuppression rate. In addition, the suppression effect of FA on the peakcurrent of Cd+ was stronger than that of Pb2+ at the same concentra-tion. For example, the decrease rate in peak current of 50 ug/L Cd+was74.60%, while that of 50 ug/L Pb+ was only 59.97%. The complexationmechanism of FA with Cd2+ and Pb2+ was elaborated in the nextsubsection. 3.1.2. Analysis of complexation mechanism of FA with Cd+and Pb2+byFTIR spectra The FTIR spectra of FA exhibited various characteristic absorptionpeaks, suggesting FA had abundant functional groups, as shown inFig. 2. Detailed characteristic peaks of FA were listed in Table S3.However, after complexation with Cd+ or Pb+, the intensity of most ofthe absorption peaks in FA decreased and even disappeared. Comparedwith FA, the peaks at 3420 cm- and 1217 cm-in FA-Pb and FA-Cdspectra decreased significantly, suggesting that the -OH groups couldcomplex with Cd+and Pb2+ (Giasuddin et al., 2007). For FA-Cd andFA-Pb spectra, several sharp-fingerprint peaks associated with -COO 100 Figure 1. Suppression degree of 100 mg/L FA on peak currents of (a) 2-100 pg/L Cd’+and (b)5-500 pg/L Pb2+. (Experimental conditions: SWASV currents weremeasured in acetate buffer at a concentration of 0.2 mol/L and pH of 5.0. The following SWAVS measurements were carried out under the same conditions.) Fig. 2. Changes in FTIR spectra of FA before and after complexation with Cd2+and Pb2+. (Notes:“FA-Pb”and “FA-Cd"refer to the complexes of 100 mg/L FAwith 20 umol/L Cd2+ and 20 umol/L Pb2+, respectively.). disappeared in the range of 1700-1320 cm-,while the newsharp-strong peaks associated with carboxylate appeared at 1378 cmwhich might be since the complexation reaction between the carboxylgroups and HMIs to form cadmium carboxylate and lead carboxylate(Yan et al., 2016). The observable growth of the peak around 1734cmmight suggest that numerous carboxylic acids were deprotonated to thecarboxylate (Farina et al., 2018). The peaks located at 650-530 cmwere related to metal oxides, and their intensities presented a weakdecrease in FA-Cd and FA-Pb spectra due to the surface complexationreactions of Cd+ and Pb+ with the -COo and Fe-O groups (Xionget al., 2015). Furthermore, the intensities of some peaks on FA-Cd wereweaker than those on FA-Pb, such as -OH peaks at 3420 cm-and C-0peak at 1041 cm-, which illuminated that Cd2+was more easilycomplexed by FA than Pb2+. In summary, the changes in FTIR spectra demonstrated the sup-pression effect of FA on Cd+and Pb+ peak currents was due to thecomplexation reaction between HMIs and active functional groups ofFA, which converted free-state ions into complexed metals undetectableby SWASV. 3.2. Effect of photolysis conditions on recovering SWASV signals of Cd+and Pb2+ This study attempted to break the complexation of FA with HMIsusing the VUV photolysis technique to convert the complexed metalsinto free-state ions, eventually recovering the SWASV signals of Cd2+and Pb+. Specifically, three groups of FA-HMIs solutions, containinglow (10 pg/L Cd²+and 50 pg/L Pb+), middle (50 pg/L Cd²+ and 250ug/L Pb+), and high concentrations (100 pg/L Cd-and 500pg/L Pb+)of Cd+ and Pb+, respectively, were used to systematically comprehendthe effects of different photolysis conditions on Cd+and Pb+ SWASVsignals. However, the results of middle- and high-concentration FA-HMIs were presented in Figs. S5-S11 (Supplementary Materials). 3.2.1. Effect of VUV photolysis time Fig. 3(a) shows the changes in SWASV curves of low-concentrationFA-HMIs after VUV photolysis for various times. After VUV photolysis,the stripping currents of 10 ug/L Cd+ and 50 ug/L Pb2+ obtained asubstantial improvement, and the stripping potential of those HMIsexhibited a negative shift. During electrodeposition of SWASV, FA or/and FA-HMIs could be adsorbed to the working electrode surface, whichin turn made it more difficult for the deposited ions to escape from theworking electrode, resulting in a positive shift in stripping potentials(Lin et al., 2019; Liu et al., 2021b). Therefore, the increase in strippingcurrents and the negative shift in stripping potentials were since theVUV photolysis destroyed the FA-HMIs complexes and released thefree-state ions. 3.2.2. Effect of H202 concentrations To analyze the effect of H202 concentration on the SWASV signals,the photolysis time was set as a constant value of 6 min. The strippingcurrents gradually increased with the increasing H202 concentrationfrom 25 mg/L to 125 mg/L, then those leveled off after H2O2 exceeded Fig. 3. Changes in SWASV signals of Cd+and Pb+ after (a-c) VUV photolysis for different times, (d-f) VUV photolysis for 6 min under different H202 concen-trations, (g-i) VUV/H202 photolysis for different times under 125 mg/L of H202. (Experimental conditions: The concentrations of Cd+and Pb+ in the FA-HMIssolutions were 10 pg/L and 50 pg/L, respectively.) 125 mg/L, as shown in Fig. 3(d). However, as H202 increased from 50mg/L to 175 mg/L, the background currents gradually increased, spe-cifically evident in the potential range from -1 V to -0.7 V. Theincreased background currents reduced the signal-to-noise ratios ofSWASV signals, resulting in decreases in peak currents of Pb+, espe-cifically Cd+. The above phenomenon was characterized using cyclevoltammetry (CV) (Zoschke et al., 2014) and SWASV. The CV reductioncurrent peak emerged in the potential range from -2.0 V to -0.7 V andgradually increased with the H202 increasing from 0 to 200 mg/L, asshown in Fig. S7(a). Moreover, the SWASV background currents of pureHMIs, in the potential range from -1.0 V to -0.7 V, almost linearlyincreased with the increasing H202 from 0 to 300 mg/L, as shown inFig. S7(b). The above results proved that H202 was an electroactivespecies and excessive H202 would interfere with the Cdand Pb+peakcurrents. However, for the middle- and high-concentration FA-HMIs,thebackground currents did not appear to be visible because high concen-trations of HMIs inherently possessed large signal-to-noise ratios, asshown in Figs. S8(a) and S9(a). Fig. 3(e) and (f) shows in detail that as the H2O2 concentrationincreased from 25 mg/L to 175 mg/L the recovery rates of 10 pg/L Cd2+and 50 ug/L Pb+ peak currents first increased rapidly and thendecreased slightly. After the H202 exceeded 125 mg/L, the recovery rateof Cd+decreased faster (from 93.56% to 88.53%) than that of Pb2+(from 93.04% to 92.30%). In addition, the peak currents of middle-andhigh-concentration FA-HMIs also obtained high recovery rates at 125mg/L of H202, as shown in Figures S8(b-c) and S9(b-c). The recoveryrates of low-concentration Cd+and Pb2+ obtained at 125 mg/L of H202were 93.56% and 93.04%, demonstrating that the 6 min of photolysistime of could not fully recover the Cd+and Pb2+ signals. Therefore, optimizing the VUV/H202 photolysis time was necessary to recover FA-HMI signals effectively. 3.2.3. Effect of VUV/H202 photolysis time Based on adding 125 mg/L of H202 to VUV/H202 system, the studyanalyzed the effect of photolysis time on the SWASV signals of FA-HMIs.With the prolongation of photolysis time, although the changes instripping currents were not distinct, the background currents in the re-gion of -1.0 V to -0.7 V presented an obvious decrease, as shown inFig. 3(g). The above phenomenon was due to the gradual consumptionof the added H202 by the prolonged photolysis. Fig. 3(h) and (i) showsthat the recovery rates of Cd+and Pb2+ peak currents first increasedgradually and then decreased slightly with the extension of photolysistime. The optimal VUV/H2O2 photolysis time was 9 min, at which timethe SWASV signals of low-concentration FA-HMIs achieved the recoveryrates of nearly 100%. Just as importantly, the peak currents of Cd+andPb2+ in middle- and high-concentration FA-HMIs recovered to nearly100% at 9 min of VUV/H202 photolysis, as shown in Figs. S10 and S11.In conclusion, the optimal VUV/H2O2 photolysis condition contained125 mg/L of H202 and 9 min of treatment. However, similar to VUV photolysis, the recovery rates of SWASVsignals presented a slight decrease after VUV/H202 photolysis for toolong (i.e., photolysis time exceeded 9 min). The above phenomena mightbe because the photolysis by-products of FA had a strong binding abilityto HMIs, for reasons expounded in Section 3.6. 3.3. Comparison of FA degradation rates in different photolysis systems 24 min while VUV/H2O2 photolysis only required 9 min. The differencein recovery rates of SWASV signals was explained from the perspectiveof the degradation rate of FA. 3.3.1. Changes in UV278 values The UV278 value had an excellent linear correction with FA con-centration (R²= 0.9997), as shown in Fig. S12, which was because theUV278 value can represent the total aromaticity of organic molecules(Uyguner and Bekbolet,2005). Accordingly, the UV278 value was used toindicate the change of FA concentrations in VUV, H2O2, and VUV/H2O2systems. As shown in Fig. 4(a), the UV278 value of FA decreased faster inthe VUV/H2O2 system than VUV system, but it seemed to be constant inthe H2O2 system in the dark. To digitize the photolysis rate of FA, thepseudo-first-order kinetic model was applied to calculate the observeddegradation rate constant (kobs) of FA in different systems according toEq. (3). As shown in Fig. 4(b), the kobs values of FA degradation in VUV,H202, and VUV/H202 systems were 0.0434 min-, 0.0002 min-, and0.1114 min-l, respectively. The negligible kobs (0.0002 min-) and thesmall R²(0.521) in the H202 system illustrated that pure H202 had nooxidizing ability by itself, and only exhibited strong oxidative propertyunder the excitation of external conditions such as UV irradiation orheating (Kang et al., 2022). The photolysis rate of VUV/H202(0.1114min-1) was about 2.57 times that of VUV (0.0434 min-), revealing thatthe consumption time by VUV photolysis (24 min) was about 2.67 timesthat by VUV/H202 photolysis (9 min) to recover the SWASV signals ofCd2+ and Pb2+ in FA-HMIs. Where, kobs is the pseudo-first-order degradation rate constant of FA;[UV278]t and [UV278]o are the UV278 values of FA after photolysis for0 and t min, respectively; t is the photolysis time. 3.3.2. Changes in TOC concentrations Again, the VUV and VUV/H202 photolysis of FA was compared fromthe perspective of changes in TOC concentrations. The degradation ofTOC in VUV and VUV/H202 systems was similar to the decrease inUV278 and abided by the pseudo-first-order kinetic model, as shown inFig. S13. The degradation rates of TOC were 0.0642 min-1 and 0.0236min- in the VUV and VUV/H2O2 systems, respectively. However, underthe same photolysis conditions, the degradation rate of TOC was lowerthan the decrease rate of UV278 values. The UV278 value indicated the FAaromatization degree, which was related to the integrity of the FA mo-lecular structure (Valencia et al., 2013; Uyguner and Bekbolet, 2005).TOC referred to the total content of organic matter, including large andsmall molecular weight organics. The above results suggested that FAmolecular structure was easily broken producing small-molecule or-ganics, but these small-molecule organics were difficultly further degraded. Therefore, a long period of photolysis was required to realizethe mineralization of FA. 3.3.3. Effect of pH value Moreover, the pH posed a more severe effect on VUV/H202 than onVUV, but the changing trend of the two with pH was similar, as shown inFig. S14. In the VUV/H202 system, the photolysis rate of FA firstincreased as the pH increased from 4 to 7 and then decreased graduallyafter the pH exceeded 7. The pH interfered with the generation of Ho°inVUV/H2O2 systems (Yang et al., 2019; Zhu et al., 2019). In acidic cir-cumstances, the excessive H could solvate H202 to form the more stableH302 that otherwise produce HO°(Kavitha and Palanivelu, 2005). Inalkaline conditions, the H202 dissociated to HOz, which served as theHO°scavenger and inhibited the production of HO° (Bouasla et al.,2010). The maximum, equal to 0.1140 min-, was obtained at pH of 7for the degradation rate of FA in VUV/H2O2. The initial pH of FA-HMIswas 6.68, and the degradation rate of FA at this pH was 0.1114 min,close to the maximum value (0.1140 min-). Therefore, the study didnot further adjust the pH of FA-HMIs solutions for VUV/H202photolysis. 3.4. Recovery mechanism of SWASV signals of Cdand Pb+in FA-HMIs The total ion chromatograms of FA-HMIs before and after VUV/H202photolysis indicated that the FA-HMIs was decomposed into some newsubstances (Liu et al., 2008), as shown in Fig. S15. Detailed photolysisbehaviors and products of FA were further analyzed in the followingsubsections. 3.4.1. Changes in FTIR spectra of FA after VUV/H202 photolysis FTIR spectra were used again to analyze the photolysis-inducedchanges in FA functional groups. After VUV/H2O2 photolysis, mostspectral absorption peaks of FA weakened gradually, and a few dis-appeared, as shown in Fig. 5. The intensities of the -OH peak at 3420cm- and the twin peaks of C-H decreased, accompanied by the disap-pearance of two tiny peaks at 914 cm-and 820 cm-. The sharp peak ofcarboxylic C=0 around 1608 cm-had a drastic decline in intensity,transforming into a weaker doublet. The broad peak in 530-651 cm²changed to a narrow at 608 cm-, which indicated that the ligandinteraction between Fe-O and carboxyl in FA was disturbed and theabsorption property of Fe-0 bonding became obvious (Xiong et al.,2015). In addition, FA showed several new peaks after VUV/H2O2 photol-ysis. The fingerprint peaks about -COOdisappeared in 1329-1519cm-, and a pointed peak assigned to carbonate or/and bicarbonateappeared at 1385 cm-(Kosmulski et al., 2003). This demonstrated thatthe VUV/H202 photolysis transformed carboxyl groups in FA into Fig. 4. Changes in (a) UV278 value of FA and (b) pseudo-first-order degradation model of FA in VUV, H202, and VUV/H2O2 systems. (Experimental conditions:initial FA concentration was 100 mg/L; initial UV278 value was 0.828; initial pH value of FA-HMIs solutions was 6.68; H202 concentration was 125 mg/L. Thefollowing characterization experiments were carried out under the same conditions.) Fig. 5. FTIR spectra of FA after VUV/H202 photolysis for different times.(Notes:“P-18 min”and“P-9 min” refer to the FA after being subjected to VUV/H202 photolysis for 18 min and 9 min, respectively.) carbon-containing inorganic anions such as CO or/and HCO3 (Maet al.,2021). A new strong peak emerged around 1142 cm, which wasrelated to the C-O stretching of carbohydrates and polysaccharides,accompanied by the disappearances of the phenolic -OH peak and theC-O doublet. This result corresponded to an increase in the content ofcarbohydrates and polysaccharide-like substances and a decrease in theO/C ratio in element composition (Fu and Quan, 2006). In summary, after FA underwent VUV/H202 photolysis, some func-tional groups were removed forming the inorganics such as carbonateanion, and FA was decomposed forming the small-molecular organicssuch as polysaccharides. The disruption of functional groups convertedFA-complexed metals into free-state ions, but the generated inorganicanions might form precipitates with Cd+and Pb+, which was furtherinvestigated in the next subsection. 3.4.2. Changes in carbon contents of different forms in FA-HMIs solutions To gain insight into the conversion of carbon forms, the contents oftotal carbon (TC), TOC, and inorganic carbon (IC) in FA-HMIs weremeasured at different photolysis times. The TC contents in FA-HMIsdecreased gradually with the extension of the VUV/H202 photolysistime, as shown in Fig. 6. The IC content in FA-HMIs increased graduallydespite being low. The decrease in TC was because most of the CO2generated by the FA photolysis escaped from the FA-HMIs solutions. Itwas conjectured that the slight increase in IC content might be since asmall fraction of FA photolysis products belonged to carbon-containing Fig. 6. Changes of carbon contents in FA-HMIs solutions after VUV/H2O2 photolysis. inorganic anions or a minor amount of produced CO2 dissolved in thesolutions to form CO and/or HCO3. To test the above conjecture, the concentrations of COS and HCO3in FA-HMI solutions after VUV/H2O2 photolysis was determined usingthe titration of phenolphthalein and methyl orange. Specifically, theconcentration of HCOs increased gradually from 15.65 to 20.12 mg/L asthe photolysis time prolonged from 0 min to 18 min, as presented inTable S4. The background content of HCO3 in FA-HMIs derived from thepollution of ambient CO2 (Kosmulski et al., 2003). The concentration ofCO was consistently zero due to the weakly acidic environment (pH6.68) of FA-HMIs. The increasing concentration of HCO3 was consistentwith the increasing intensity of FTIR peak at 1385 cmafter photolysisof FA. Importantly, the HCOs would be hydrolyzed to form CO3,whichwould precipitate with Cd+ and Pb2+. The formation of PbCOs andCdCO3 precipitates would further promote the hydrolysis of HCO3 toCOf, according to the principle of chemical reaction equilibrium (Raiet al., 1991; Zhang et al.,2008). The above reactions, as Reactions 4-6,revealed why the Cdand Pb+ peak currents decreased slightly forFA-HMIs after VUV/H202 photolysis for too long. Co,+ Cd+=CdCoJ(pK=12.0) (Reaction 6) 3.4.3. 3D-fluorescence spectra analysis of FA-HMIs photolysis Fig. 7 shows the three-dimension fluorescence spectra (3D-FS) of FA-HMIs before and after VUV/H2O2 photolysis. A complete 3D-FS could bedivided into five regions, which represented different fluorescencecomponents, as shown in Fig. S16. As shown in Fig. 7(a), the 3D-FS ofthe initial FA-HMIs has one large fluorescence peak in region V and onesmall fluorescence peak in region III, which were assigned to the HA-likeand FA-like species, respectively. With the extension of VUV/H202photolysis time, the intensities of fluorescence peaks presented signifi-cant a decrease, and the location of peaks exhibited a clear blue shiftfrom the perspective of the Nex. The decreased peak intensity meant thatthe number of aromatic rings and conjugated bonds decreased and themolecular weight lowered (Valencia et al., 2013; Vergnoux et al., 2011).The blue shift of fluorescence peaks suggested that the functional groupswere removed and the electron-donating groups decreased (Senesi,1990), which illustrated the complexing ability of FA to HMIs wasdeprived by VUV/H2O2 photolysis. 3.4.4. PARAFAC analysis of 3D-fluorescence spectra To further explore the evolution of FA fluorescent components underVUV/H2O2 photolysis, the PARAFAC analysis was performed on the 3D- Fig. 7. Changes in 3D-FS of FA-HMIs after VUV/H2O2 photolysis for (a) 0 min,(b) 3 min, (c) 6 min, and (d) 9 min. FS. According to the halved analysis and core consistency test shown inFig. S17, FA mainly consisted of three fluorescent components, namedC1, C2, and C3, respectively, as shown in Fig. S18. The C1, C2, and C3were considered to be low-molecule weight substances such as pro-teinaceous, humic acid-like (HA-like), and fulvic acid-like (FA-like),respectively. Afterward, the maximum fluorescence intensity (Fmax) wasused to display the relative content of each component in FA as afunction of VUV/H202 photolysis time, as shown in Fig. 8. The initial FAsample contained approximately 1% of small-molecule organics (C1),74% of HA-like (C2) and 25% of FA-like (C3) species. With the increaseof photolysis time, C1 increased significantly, C2 decreased gradually,and C3 increased first and then decreased. The fluctuation in the relativecontent of three components indicated that the three types of substancesoccurred in interconversion during the photolysis process (Cui et al.,2022). In the beginning of photolysis, the HA-like substance with higharomatization and large-molecule weight was degraded into the FA-likeand small-molecule organics, causing a slight increase in FA-like content(Valencia et al., 2013). As the photolysis further progressed, HA-liketogether with FA-like were decomposed into small molecular species,such as tryptophan and protein-like (Zhang et al., 2022). At the sametime, some small-molecule organic products might continue to bedecomposed. For example, protein-like substances were catalyticallyhydrolyzed to generate small molecular peptide chains and amino acids(Phong and Hur, 2015). All of these resulted in a continuous increase inthe relative content of small-molecule and low-aromatization organics,which again illustrated why the degradation rate of TOC was lower thanthat of UV278 (Section 3.3.2). 3.5. Recovery of SWASV signals of Cd+and Pb2+ in FA-HMIs afterVUV/H2O2 photolysis (releasing free-state ions from FA-complexedmetals) After FA-HMIs suffered from VUV/H202 photolysis for 9 min under125 mg/L of H202, peak currents of both Cd+in 2-100ug/L and Pb+in10-500 pg/L almost recovered to that in pure HMIs, as shown inFig. S20. Futhermore, Fig. S21 compared the SWASV detection sensi-tivities of Cd2+ and Pb+ in FA-HMIs before and after VUV/H202photolysis with that in pure HMIs. The detection sensitivities of pureCd²+ and Pb2+ were 0.750pALug-and 0.319 uA Lepg-,respectively.After complexation with FA, the detection sensitivities of Cd2+and Pb2+decreased by 71.69% (from 0.750 to 0.212 uA Loug ) and 58.01%(from 0.319 to 0.134 uA Lepg), respectively, suggesting again that theFA presented severe complexation for Cd2+ compared to Pb2+. However,after FA-HMIs underwent VUV/H2O2 photolysis for 9 min, the detectionsensitivities of Cd+ and Pb+, close to pure HMIs, were 0.759 uA Loug Fig. 8. Changes of relative contents of above three components after FA-HMIssuffered from VUV/H202 photolysis for different times. and 0.318 uA Lopg. This suggested that the VUV/H202 photolysisrecovered the concentrations of free-state Cd2+ and Pb2+ and thedetection ability of SWASV toward FA-HMIs. 3.6. Application of VUV/H202 photolysis in real sample extracts Three real sample extract solutions, including one lake sediment andtwo soils, were used to verify the practicality of VUV/H202 photolysis inrecovering the SWASV signals of Cd+and Pb2+. The UV-vis spectra ofthree sample extracts had the same absorption peak at about 278 nm asthe FA solution, as shown in Fig. S22, suggesting that the three extractscontained the FA or FA-like species. After VUV/H202 photolysis, theUV278 of three samples decreased significantly, indicating the degrada-tion of FA in extracts. After adding 0.1 M potassium ferrocyanide toeliminate the interference of Cu+(Liu et al., 2020), the peak currents ofCd and Pb+ for three photolysis-treated extracts increased signifi-cantly, as presented in Fig. S23 and Table S5. The Cd+and Pb2+ con-centrations were calculated by substituting their peak currents into thecalibration models shown in Fig. S24, as presented in Table S6. The t-testWas performed on the SWASV (includinguntreated andphotolysis-treated samples) and ICP-MS detection results using thetwo-sample equal variances assumption method, as shown in Table 1.The t-values of the photolysis-untreated samples were far greater than2.776, indicating that the SWASV signals of Cd+and Pb2+ wereseverely suppressed by FA in extracts. In contrast, the t-values of thethree photolysis-treated samples were all less than 2.776, suggestingthat the detection results of SWASV were close to that of ICP-MS and thepeak currents of Cd+and Pb+ were almost recovered. In summary, theVUV/H2O2 photolysis released the free-state ions from FA-complexedmetals by degrading FA, ultimately improving the SWASV detectionaccuracy toward the concentrations of Cd+ and Pb+ in real sampleextracts. 3.7. Limitations and prospects of this study This study proposed an efficient convenient and safe method,namely,VUV/H2O2 photolysis of FA-HMIs to release free-state HMIs andrecover SWASV signals of FA-HMIs. For the FA-HMIs containing FA of100 mg/L in this study, the optimal photolysis conditions were the H202dosage of 125 mg/L of and a treatment time of 9 min. Although theprocessing efficiency of VUV/H202 was high compared with thecomplicated operations of strong acid digestion, the photolysis effi-ciency of FA might be further improved by introducing photocatalyticmaterials such as TiO2. The practicality of VUV/H2O2 photolysis hadbeen validated using the three samples that contained FA of 36.63 mg/L,20.30 mg/L, and 36.45 mg/L, respectively. However, FA content invarious soils and sediments has significant differences (Kou et al., 2022;Ding et al., 2019), therefore the proposed photolysis method may needfurther be verified using more samples. Moreover, based on the findingsof this study, our team intends to develop a set of sample pretreatmentequipment in the future, and combine it with an electrochemical anal-ysis device for the automated detection of heavy metals in soils andsediments. 4. Conclusion VUV/H2O2 photolysis was used in this study to recover the SWASVsignals of Cd+and Pb+ in FA-HMIs by breaking the complexationbetween FA and HMIs. Various characterization results showed thatwith the progress of photolysis, the molecular structure of FA wasdestroyed and the reactive groups in FA were removed, microscopicallycausing the recovery of free-state Cd+ and Pb+ concentrations,macroscopically causing the recovery of SWASV signals of FA-HMIs. Theoptimization results of photolysis parameters indicated that the SWASVsignal recovery rates of Cd+and Pb+ in FA-HMIs were close to 100%after VUV/H202 photolysis at 125 mg/L H202 for 9 min. More Samples No. Photolysis Detected by SWASV (ug/L) Detected by ICP-MS (rg/L) t-value” Cd2+ Pb2+ Cd2+ Pb2+ Cd2+ Pb2+ S1 Untreated 0.943±0.019 15.086±0.965 1.436±0.088 39.303±0.519 5.395 23.996 Treated 1.353±0.167 38.735±0.520 0.554 0.685 S2 Untreated 1.041±0.037 1.991±0.105 2.041±0.037 3.411±0.088 26.677 14.621 Treated 2.195±0.284 3.390±0.032 0.763 0.321 S3 Untreated 1.423±0.132 5.364±0.023 3.039±0.096 7.455±0.331 13.977 8.917 Treated 2.898±0.018 7.543±0.152 2.034 0.343 Each sample was measured three times; Average ± STD. DAt a significance level of 0.05 and 4 degrees of freedom, the two-tailed critical t-value is 2.776, i.e., to.os(4)=2.776. importantly, the utility of VUV/H2O2 photolysis was validated by ac-curate SWASV detection on real soil and sediment samples. The mostimportant contribution of this study is to provide an efficient method toconvert FA-complexed heavy metals into free-state ions, therebyimproving the detection accuracy of Cd2+ and Pb2+ in soils and sedi-ments by SWASV. Credit author statement Ning Liu: Conceptualization, Investigation, Writing- Original draftpreparation. Wenshuai Ye: Data curation, Visualization, Software,Validation. Guo Zhao: Methodology, Writing- Reviewing and Editing.Gang Liu: Supervision, Project administration, Funding acquisition. Declaration of competing interest The authors declare that they have no known competing financialinterests or personal relationships that could have appeared to influencethe work reported in this paper. Data availability Data will be made available on request. Acknowledgements The study was supported by the National Natural Science Foundationof China (Grant No. 32071898), the Natural Science Foundation ofJiangsu Province (No. BK20200546). Appendix A. Supplementary data Supplementary data to this article can be found online at https://doi.org/10.1016/j.envpol.2022.120420. References ( Bansod, B.K., Kumar, T . , Thakur, R., Rana, S., Singh, I., 2017. A review on variouselectrochemical techniques for heavy metal ions detection with different sensingplatforms. Biosens. Bioelectron. 94, 443-455. h t t p s :/ / d o i . org / 10. 1 016 /j. ) bios.2017.03.031. ( Borggaard, O.K. , Holm, P.E., Strobel, B.W., 2019. Potential of dissolved organic matter(DOM) to extract As, Cd, Co, Cr, Cu, Ni , Pb and Zn from polluted soils: a review. Geoderma 343, 235 - 246. http s :// do i . o rg / 10. 1 016 / j. geod e rma.201 9 .02 . 04 1 . ) ( 1 6/J Bouasla, C., Samar, M.E., Ismail , F., 2010. Degradation of methyl violet 6B dye by theFenton process. Desalination 254, 35-41. https: // do i . or g/1 0.1016 / j . de sa l.200 9 . 1 2 . 0 1 7 . ) ( Cui , H., Wen, X. , Wu, Z. , Zhao, Y., Lu, Q., Wei , Z., 2022. Insight into complexation of Cd(II) and Cu( I I) to fulvic acid based on feature recognition of PARAFAC combined with 2D-COS. J. Hazard Mater. 440, 129758 https :// doi . o rg /1 0.1 0 1 6 /j . j h a z mat . 2 0 22. 1 2 9 758 . ) ( Ding, H., Tang, L., Nie, Y., Ji, H., 2019. Characteristics and interactions of heavy metalswith humic acid in gold mining area soil at a upstream of a metropolitan drinkingwater source. J. Geochem. Explor. 200, 266-275. http s :// d o i . or g/1 0.1016 /j . g e x pl o .2018.09.003 . ) ( Farina, A.O., Peacock, C.L., Fiol , S., Antelo, J., Carvin, B., 2018. A universal adsorptionbehaviour for Cu uptake by iron (hydr)oxide organo-mineral composites. Chem. Geol. 479, 22 - 35. https : // doi . o rg/ 10.1 0 16 / j . c h emg eo . 2 0 1 7. 1 2.022 . ) ( Fernandez-Calvino, D., Cuti l las-Barreiro, L., Paradelo-Nunez, R., Novoa-Munoz, J.C.,Fernandez-Sanjurjo, M.J., Alvarez-Rodriguez, E. , Nunez-Delgado, A., Arias-Estevez, M., 2017. Heavy metals fractionation and desorption in pine bark amendedmine soils. J. Environ. Manag. 192, 79-88. https : // do i . org / 1 0.10 1 6 / j . i envman.2017.01 . 042 . ) ( Fizer, M., Sidey, V., Milyovich, S. , Fizer, O., 2021. A DFT study of fulvic acid bindingwith bivalent metals: Cd, Cu, Mg, Ni, Pb, Zn. J. Mol. Graph. Model. 102, 107800 http s : / / doi . or g / 10.1016 / j.jmgm .2020.10 7 800 . ) ( Fu, H., Quan, X., 2006. Complexes of fulvic acid on the surface of hematite, goethite, andakaganeite: FTIR observation. Chemosphere 63 (3), 403-410. htt p s :// doi . o rg / 1 0.1016 / j .che m osphere . 200 5 .08.054 . ) ( Giasuddin, A.B.M., Kanel, S.R., Choi, H., 2007. Adsorption of humic acid onto nanoscale zerovalent iron and its effect on arsenic removal. Environ. Sci. Technol. 41 (6), 2022-2027. htt p s : / / d oi . o r g/ 10.1021 / es 0 61653 4 . ) ( Gregor, J.E., Powell, H.K.J., Town, R.M., 1989. Metal-fulvic acid complexing: evidencesupporting an aliphatic carboxylate mode of coordination. Sci. Total Environ. 81-82, 597-606. https :// doi . o rg /1 0 . 10 1 6 / 0048 - 96 9 7(89)90168-X . ) Hur, J., Jung, K.Y., Jung, Y.M., 2011. Characterization of spectral responses of humicsubstances upon UV irradiation using two-dimensional correlation spectroscopy.Water Res. 45 (9), 2965-2974. https://doi.org/10.1016/j.watres.2011.03.013. ( Jia, Y. , Zhao, T., Zhao, N., Wei, H., Zhang, W., Qiu, R. , 2019. Effects of light irradiationon the complexes of cadmium and humic acids: the role of thiol groups. Chemosphere 225, 174-181 . h t tp s :// doi . org / 1 0 .1016 / j . c h emosphere.2019.03.029 . ) ( Kang, Y., Lian, J ., Zhu, Y., Liu, Z., Li, W., Dong, H., Wang, Y., Zeng, J . , Qiang, Z., 2022.Interactions between H202 and dissolved organic matter during granular activatedcarbon-based residual H2O2 quenching from the upstream UV/H2O2 process. ) J. Environ. Sci. (China). https://doi.org/10.1016/j.jes.2022.06.041 (in press). Kavitha, V., Palanivelu, K., 2005. Destruction of cresols by Fenton oxidation process.Water Res. 39, 3062-3072. https://doi.org/10.1016/j.watres.2005.05.011. Kosmulski, M., Maczka, E., Jartych, E., Rosenholm, J.B., 2003. Synthesis andcharacterization of goethite and goethiteehematite composite: experimental studyand literature survey. Adv. Colloid Interface Sci. 103, 57-76. https://doi.org/10.1016/S0001-8686(02)00083-0. Kou, B., Hui, K., Miao, F., He, Y., Qu, C., Yuan, Y., Tan, W., 2022. Differential responsesof the properties of soil humic acid and fulvic acid to nitrogen addition in the NorthChina Plain. Environ. Res. 214, 113980 https://doi.org/10.1016/j.envres.2022.113980. ( Kuppusamy, V.K., Holuszko, M., 2022. Sulfuric acid baking and water leaching of rareearth elements from coal tailings. Fuel 319, 123738. h ttps :/ / doi . org / 1 0.1016/ j . f u el . 2 022. 1 23 7 38 . ) ( Lehmann, J., Kleber , M., 2015. The contentious nature of soi l organic matter. Nature 528, 60-68. https : // do i . or g/ 1 0 . 1 038 / nat u re160 6 9. ) ( Li, D.W., Zhai, W.L., Li, Y.T., 2014. Recent progress in surface enhanced Ramanspectroscopy for the detection of environmental pollutants. Microchim. Acta 181 , 23-43. https :// doi . or g/ 10. 1 007 / s006 0 4-01 3 -1 1 1 5 -3 . ) ( Li, B., Ma, X., Deng, J. , Li, Q . , Chen, W., Li, G., Chen, G., Wang, J. , 2020. Comparison ofacetaminophen degradation i n UV-LED-based advance oxidation processes: reactionkinetics, radicals contribution, degradation pathways and acute toxicity assessment. Sci. Total Environ. 723, 137993 https: // d o i . org / 10. 1 016 / j . s c itotenv . 2020.137 9 93 . ) ( Li, Y., Yang, L., Chen, X . , Han, Y., Cao, G., 2021 . Transformation kinetics and pathwaysof sulfamonomethoxine by UV/H2O2 in swine wastewater. Chemosphere 265, 129125. https :// doi . or g/ 1 0.1016/ j .c h emo sp here . 2020.12 9 125 . ) ( Li, R. , Zhang, X., Wang, G., Kong, L., Guan, Q., Yang, R., J i n, Y., Liu, X., Qu, J., 2022.Remediation of cadmium contaminated soil by composite spent mushroom substrateorganic amendment under high nitrogen level. J. Hazard Mater. 430, 128345 https :// do i . o rg / 10.1016 /j .jh azmat . 2022.128345 . ) ( Lin, C., L i , P., Yang, M., Ye, J . , Huang, X., 2019. Metal replacement causing interferencein stripping analysis of multiple heavy metal analytes: kinetic study on Cd(II) and Cu(II ) electroanalysis via experiment and simulation. Anal. Chem. 91,9978 - 9985. h tt p s:// d o i . org / 10.1021 / a c s . a nal c hem.9b01724 . ) ( Liu, S., Lim, M., Fabris, R., Chow, Ch., Drikas, M., Amal, R., 2008. TiO2 photocatalysis ofnatural organic matter in surface water: impact on trihalomethane and haloaceticacid formation potential. Environ. Sci. Technol. 42, 6218-6223. h ttps : / / d o i . org / 1 0.1021 / e s 80088 7 s . ) ( Liu, N., Zhao, G., Liu, G., 2020. Coupling square wave anodic stripping voltammetry withsupport vector regression to detect the concentration of lead in soil under the ) ( interference of copper accurately. Sensors 23, 6792. h t t ps : // d o i . or g/1 0 .3390 / s 20 2 36792 . ) ( Liu, H., Guo, H., Guo, X., Wu, S. , 2021a. Probing changes in humus chemicalcharacteristics in response to biochar add 一 ition and varying bulking agents duringcomposting: a holistic multi-evidence-based approach. J . Environ. Manag. 300, 113736 https : // doi . o r g/ 1 0.10 1 6 /j . jenvman . 2021 . 1137 3 6 . ) Liu, N., Zhao, G., Liu, G., 2021b. Accurate SWAS專 detection of Cd(II) under theinterference of Pb(II) by coupling support vector regression and feature strippingcurrents. J. Electroanal. Chem. 889, 115227 https://doi.org/10.1016/j.ielechem.2021.115227. Liu, N., Ye, W., Liu, G., Zhao, G., 2022a. Improving the accuracy of strippingvoltammetry detection of Cd2+ and Pb2+ in the presence of Cu2+ and Zn2+ bymachine learning: understanding and inhibiting the interactive interference amongmultiple heavy metals. Anal. Chim. Acta 1213, 339956. https://doi.org/10.1016/j.aca.2022.339956. Liu, N., Zhao, G., Ye, W., Wang, J., Liu, G., 2022b. VUV-H2O2 photolysis as apretreatment method for improving the SWASV detection accuracies of Cd2+ andPb2+ in soil extracts. J. Environ. Chem. Eng. 10 (3), 10781 https://doi.org/10.1016/j.jece.2022.107813. Ma, S., Zhao, G., Elsayed, M., Sedki, M., Chen, X., Wu, D., He, X., Mulchandani, A.,Jassby, D., 2021. Toward rapid detection of trace lead and cadmium by anodicstripping voltammetry in complex wastewater streams. ACS EST Eng 1, 1509-1516.https://pubs.acs.org/doi/10.1021/acsestengg.1c00161. ( Mohamed, M.A. , Efligenir, A., Husson, J . , Persello, J., Fievet, P. , Fat i n-Rouge, N., 2013.Extraction of heavy metals from a contaminated soil by reusing chelating agentsolutions. J . Environ. Chem. Eng. 1 (3) , 363 - 368. https :// do i . o rg / 10.1016 / j . ) iece.2013.05.015. ( Phong, D.D., Hur, J. , 2015. Insight into photocatalytic degradation of dissolved organicmatter in UVA/TiO2 systems revealed by fluorescence EEM-PARAFAC. Water Res. 87 , 119-126. h tt ps : // d o i .o r g/ 1 0.10 1 6/ j. w a tre s.2 01 5 .09.0 1 9 . ) ( Rai, D., Felmy, A.R., Moore, D.A., 1991. Thermodynamic model for aqueous Cd2 + -CO32- ionic interactions in high-ionic-strength carbonate solutions, and thesolubility product of crystal l ine CdCO3. J. Solut. Chem. 20, 1169 - 1187. ht t ps :// d o i . org / 10.1007 / BF01075 1 3 4 . ) ( Rajca, M., Bodzek, M., 2013. Kinetics of fulvic and humic acids photodegradation inwater solutions. Separ. Purif. Technol. 120, 35 - 42. https :/ / d o i. org /1 0.1016 /j . seppur . 201 3 .09 . 0 1 9 . ) ( Senesi, N., 1990. Molecular and quantitative aspects of the chemistry of f ulvic acid andits interactions with metal ions and organic chemicals: Part I I. The fluorescencespectroscopy approach. Anal. Chim. Acta 232, 77-106. htt ps :// d o i . org /1 0.1 01 6 / S0003 - 2670 ( 00 ) 81226-X . ) ( Sharma, V.K., Triantis, T.M., Antoniou, M.G., He, X., Pelaez, M., Han, C., Song, W.,O'Shea, K.E., Cruz, A.A., Kaloudis, T. , Hiskia, A., Dionysiou, D.D., 2012. Destructionof microcystins by conventional and advanced oxidation processes: a review. Separ.Purif. Technol . 91, 3 - 17 . https :// d o i . o r g / 10.1016 / j.s eppu r.20 1 2 . 0 2 .0 1 8 . ) ( Sterritt, R.M., Lester, J.N., 1984. Comparison of methods for the determination of he( conditional stability constants of heavy metal-fulvic acid complexes. Water Res. 18 (9), 1149 - 1153. h t tps :// doi.or g/ 1 0. 1 016 / 004 3- 1 3 54 ( 84 ) 90231 - 8 . ) ( Tessier, A., Campbell, P.G . C., Bisson, M., 1979. Sequential extraction procedure for thespeciation of particulate trace metals. Anal. Chem. 51, 844-851. https :// p ubs . ac s . org /do i / 1 0 . 102 1 /ac 5 0 043 a 0 1 7 . ) ( Ure, A.M., 1996. Single extraction schemes for soil analysis and related applications. Sci. Total Environ. 178(1-3),3-10. https :// doi . org / 1 0.1 01 6 /0 048 - 9697(95)047 9 1 -3 . ) ( Uyguner, C.S ., Bekbolet, M., 2005. Evaluation of humic acid photocatalytic degradationby UV-vis and f l uorescence spectroscopy. Catal . Today 101 (3 - 4), 267 - 274. https : // doi . or g / 1 0. 1 016 /j .catt o d .2 005 . 03.011 . ) ( Valencia, S., Marin, J.M., Restrepo, G., Frimmel, F.H., 2013. Application ofexcitation-emission fluorescence matrices and UV/Vis absorption to monitoring the ) photocatalytic degradation of commercial humic acid. Sci. Total Environ. 442, ( 207-214. h ttps : / / d o i . o rg / 1 0.10 1 6 / j.s c i t o t e nv . 20 1 2. 10.058 . ) ( Vergnoux, A. , Rocco,R.D. , Domeizel, M., Guiliano, M., Doumenq , P., Theraulaz,F., 2011. Effects of forest fires on water extractable organic matter and humic substances from Mediterranean soils: UV-vis and f luorescence spectroscopy approaches. Geoderma 160 (3-4), 434-443. h ttps : / / doi . org / 10.1016 /j . ge o derma.2010. 1 0.014 . ) ( Wang, P., Ding, F., Huang, Z., Fu, Z., Zhao, P. , Men, S., 2021. Adsorption behavior andmechanism of Cd (II) by modi f ied coa l -based humin. Environ. Technol . Innovat. 23, 101699 h ttps :// doi . o rg/ 10.10 1 6/ j . et i . 2021 .1 01 6 99 . ) William, O.N., C Peter, G.C., 1991. The effects of acidification on the geochemistry of Al,Cd, Pb and Hg in freshwater environments: a literature review. Environ. Pollut. 71,91-130. https://doi.org/10.1016/0269-7491(91)90030-Z. Xiong, J., Koopal, L.K., Weng, L., Wang, M., Tan, W., 2015. Effect of soil fulvic and humicacid on binding of Pb to goethite-water interface: linear additivity and volumefractions of HS in the Stern layer. J. Colloid Interface Sci. 457,121-130. https://doi.org/10.1016/j.jcis.2015.07.001. Xu, Y., Bai, Y., Hiemstra, T., Tan, W., Weng, L., 2020. Resolving humic and fulvic acids inbinary systems influenced by adsorptive fractionation to Fe-(hydr)oxide with focuson UV-Vis analysis. Chem. Eng. J. 389, 124380 https://doi.org/10.1016/j.cej.2020.124380. Yan, J., Jiang, T., Yao, Y., Lu, S., Wang, Q., Wei, S., 2016. Preliminary investigation ofphosphorus adsorption onto two types of iron oxide-organic matter complexes.J. Environ. Sci. (China) 42, 152-162. https://doi.org/10.1016/j.jes.2015.08.008. Yang, L., Liang, X., Han, Y., Cai, Y., Zhao, H., Sheng, M., Cao, G., 2019. The coupling useof advanced oxidation processes and sequencing batch reactor to reduce nitrificationinhibition of industry wastewater: characterization and optimization. Chem. Eng. J.360, 1577-1586. https://doi.org/10.1016/j.cej.2018.10.232. Yu, H., Chen, F., Ma, J., Khan, Z.I., Hussain, M.I., Javaid, I., Ahmad, K., Nazar, S.,Akhtar, S., Ejaz, A., Sohail, M., Nadeem, M., Hamid, Y., Rahman, M.H., 2022a.Comparative evaluation of groundwater, wastewater and canal water for irrigationon toxic metal accumulation in soil and vegetable: pollution load and health riskassessment. Agric. Water Manag. 264, 107515 https://doi.org/10.1016/j.agwat.2022.107515. ( Yu, Y ., Pan, M. , Peng, J., Hu, D., Hao, Y., Qian, Z., 2022b. A review on recent advances inhydrogen peroxide electrochemical sensors for applications in cell detection. Chin. Chem. Lett . 33 (9), 4133 - 4145. h t t ps :// d o i .o r g/ 1 0 . 1 0 16 / j.c clet . 2 0 2 2 . 02 . 045 . ) ( Zakaria, A.B.M. , Leszczynska, D. , 2019. Electrochemically prepared unzipped singlewalled carbon nanotubes-MnO2 nanostructure composites for hydrogen peroxideand glucose sensing. Chemosensors 7, 1 . h t t p s : // d o i . org / 1 0 . 3390 / chemose n sors7010001 . ) ( Zavarzina, A.G., Danchenko, N.N., Demin, V.V., Artemyeva, Z.S., Kogut, B.M., 2021.Humic substances: hypotheses and reality (a review). Eurasian Soil Sci. 54, 1826-1854 . htt p s :/ / d o i . o r g/ 1 0 .1 1 3 4 / S1 0 642 2 9321120 1 64 . ) Zhan, L., Li, W., Liu, L., Han, T., Li, M., Qiang, Z., 2021. Degradation of micropolluants inflow-through VUV/UV/H2O2 reactors: effects of H202 dosage and reactor internaldiameter. J. Environ. Sci. (China) 110, 28-37. https://doi.org/10.1016/j.ies.2021.03.012. Zhang, Y., Jiang, J., Chen, M., 2008. MINTEQ modeling for evaluating the leachingbehavior of heavy metals in MSWI fly ash. J. Environ. Sci. (China) 20, 1398-1402.https://doi.org/10.1016/S1001-0742(08)62239-1. Zhang, H., Zheng, Y., Wang, X.C., Wang, Y., Dzakpasu, M., 2022. Solar irradiation-induced photochemical processing of dissolved organic matter in reclaimed water.J. Water Proc. Eng. 46, 102544 https://doi.org/10.1016/j.jwpe.2021.102544. Zhu, S., Dong, B., Wu, Y., Bu, L., Zhou, S., 2019. Degradation of carbamazepine byvacuum-UV oxidation process: kinetics modeling and energy efficiency. J. HazardMater. 368, 178-185. https://doi.org/10.1016/j.jhazmat.2019.01.043. Zoschke, K., Bornick, H., Worch, E., 2014. Vacuum-UV radiation at 185 nm in water ( treatment-A review. Water Res. 52, 131-145. h t t p s : // d o i . org / 1 0 . 1 0 1 6/j . watres.201 3 .12.03 4 . )
确定
还剩8页未读,是否继续阅读?

产品配置单

雷迪美特中国有限公司为您提供《【EmStat3电化学应用】通过VUV/H2O2光解从富里酸-重金属配合物(FA-HMIs)中释放自由态离子:Cd2+和Pb2+》,该方案主要用于土壤中(类)金属及其化合物检测,参考标准--,《【EmStat3电化学应用】通过VUV/H2O2光解从富里酸-重金属配合物(FA-HMIs)中释放自由态离子:Cd2+和Pb2+》用到的仪器有EmStat4S迷你型电化学分析仪(EIS:10 µHz to 200 kHz)
推荐专场


相关方案
更多
该厂商其他方案
更多