


方案详情
文
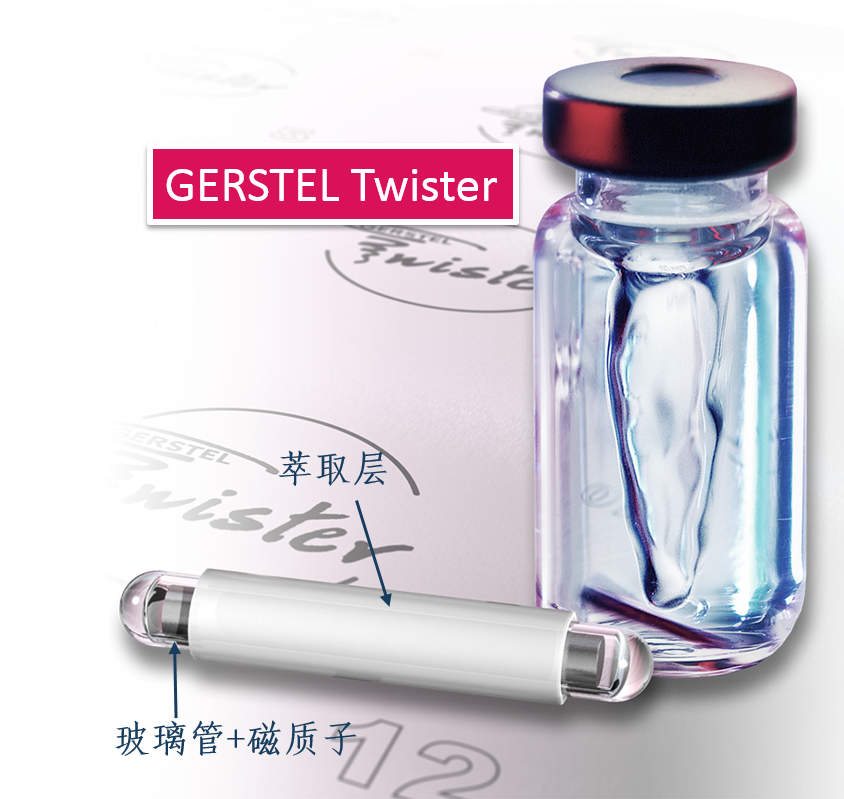
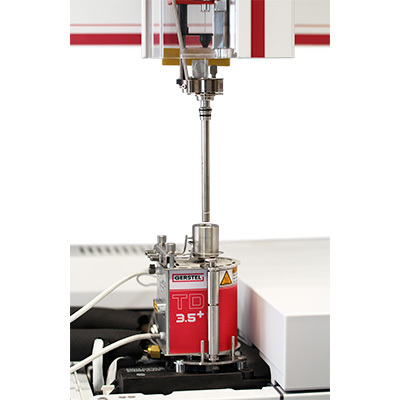
对环境水和土壤中的多环芳烃使用SBSE-TD-GC/MS搅拌棒吸附萃取联合热脱附和质谱联用分析,可以得到极低的检测下限,非常高的可重复性,并且无需溶剂,所需样品体积小,即环保又经济!
方案详情

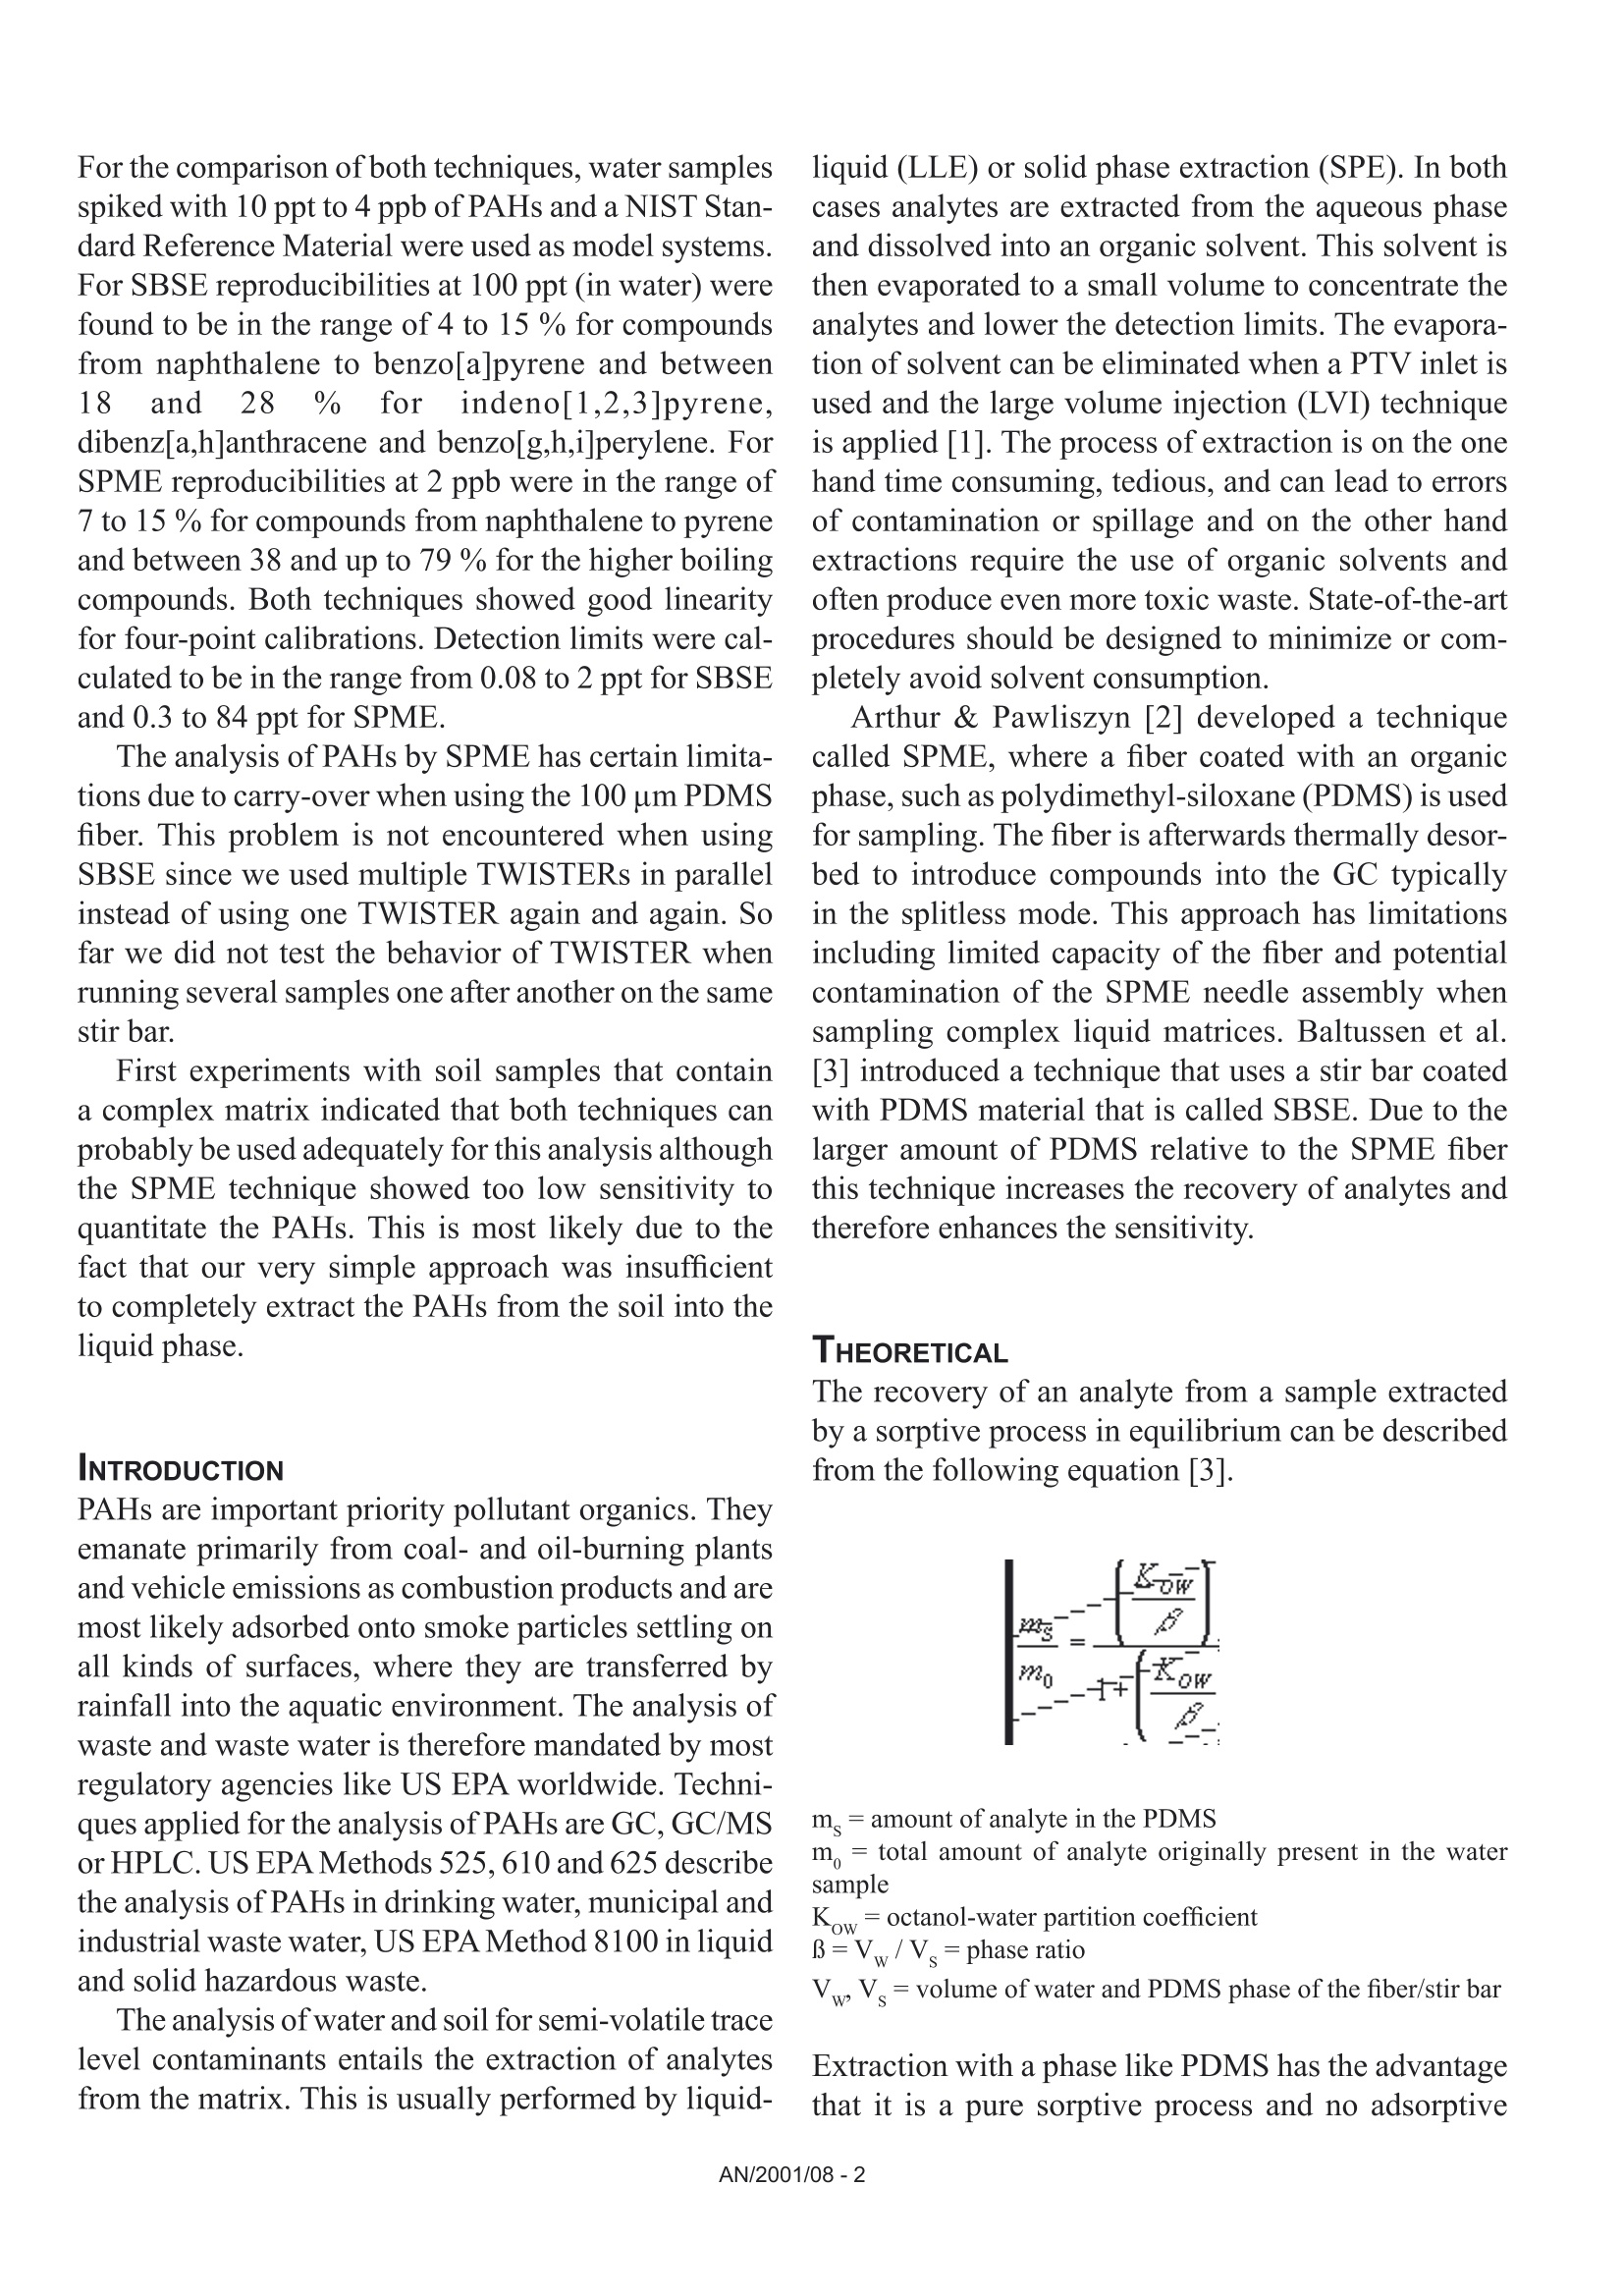
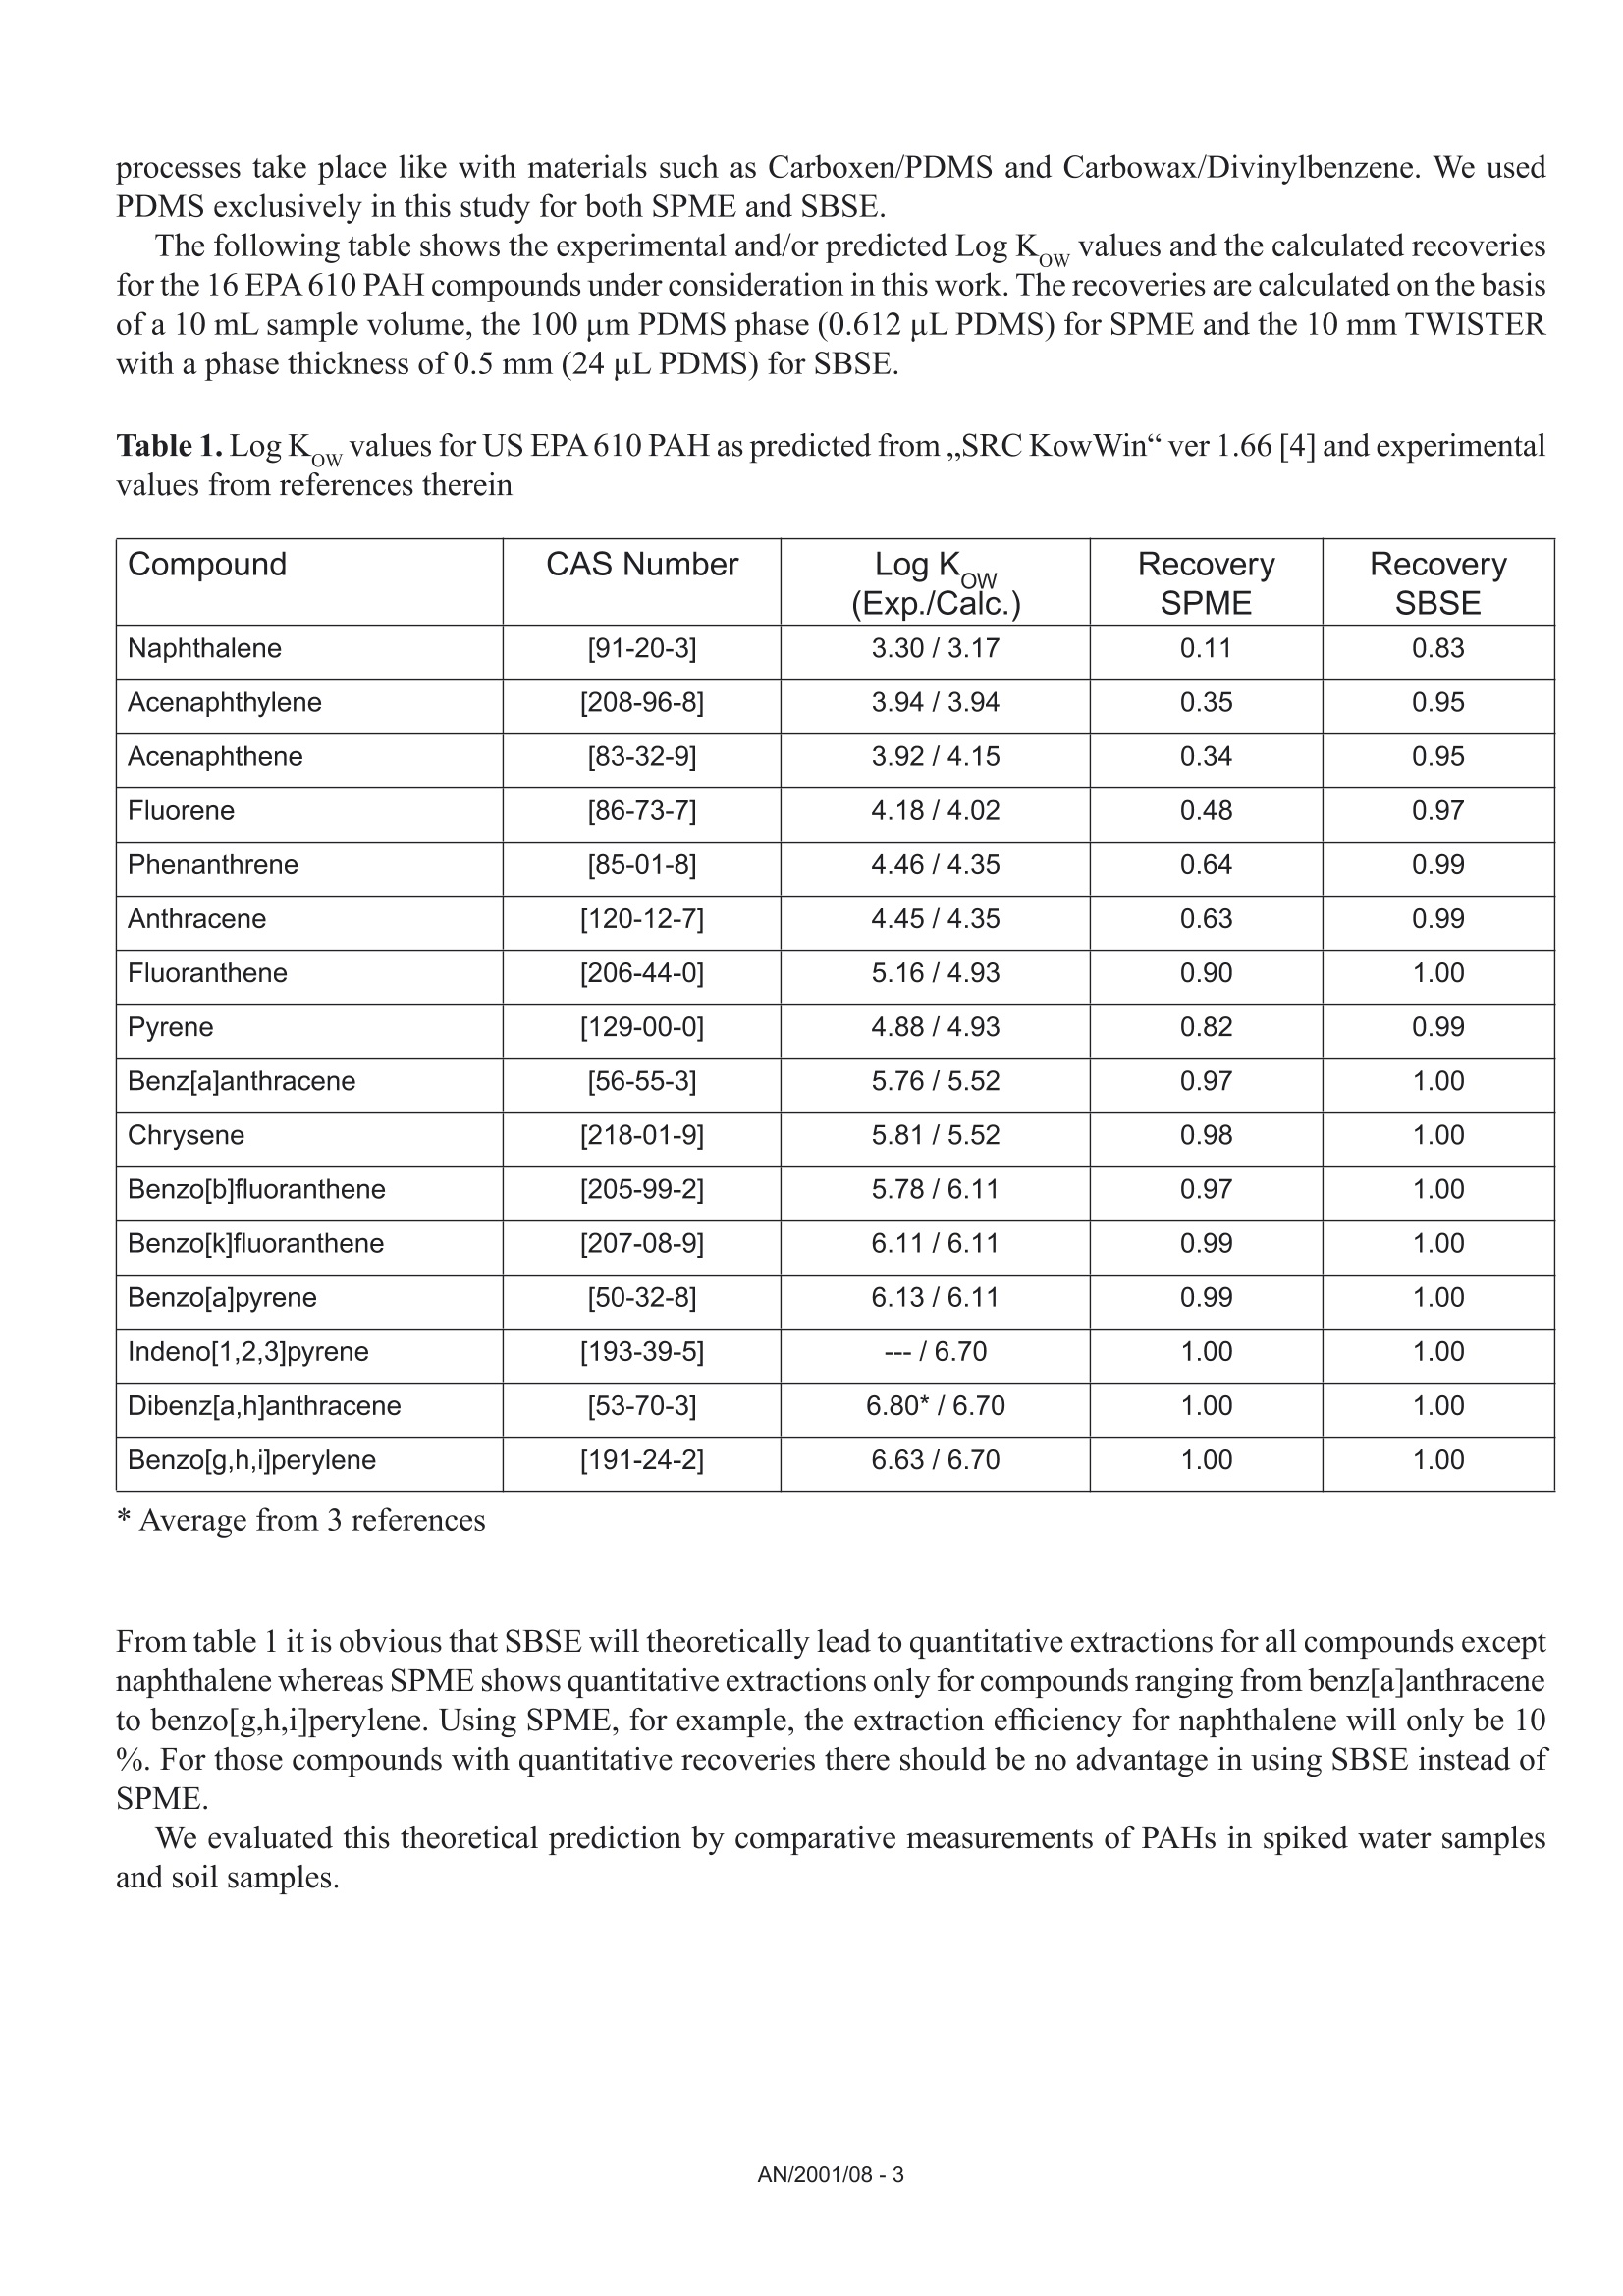
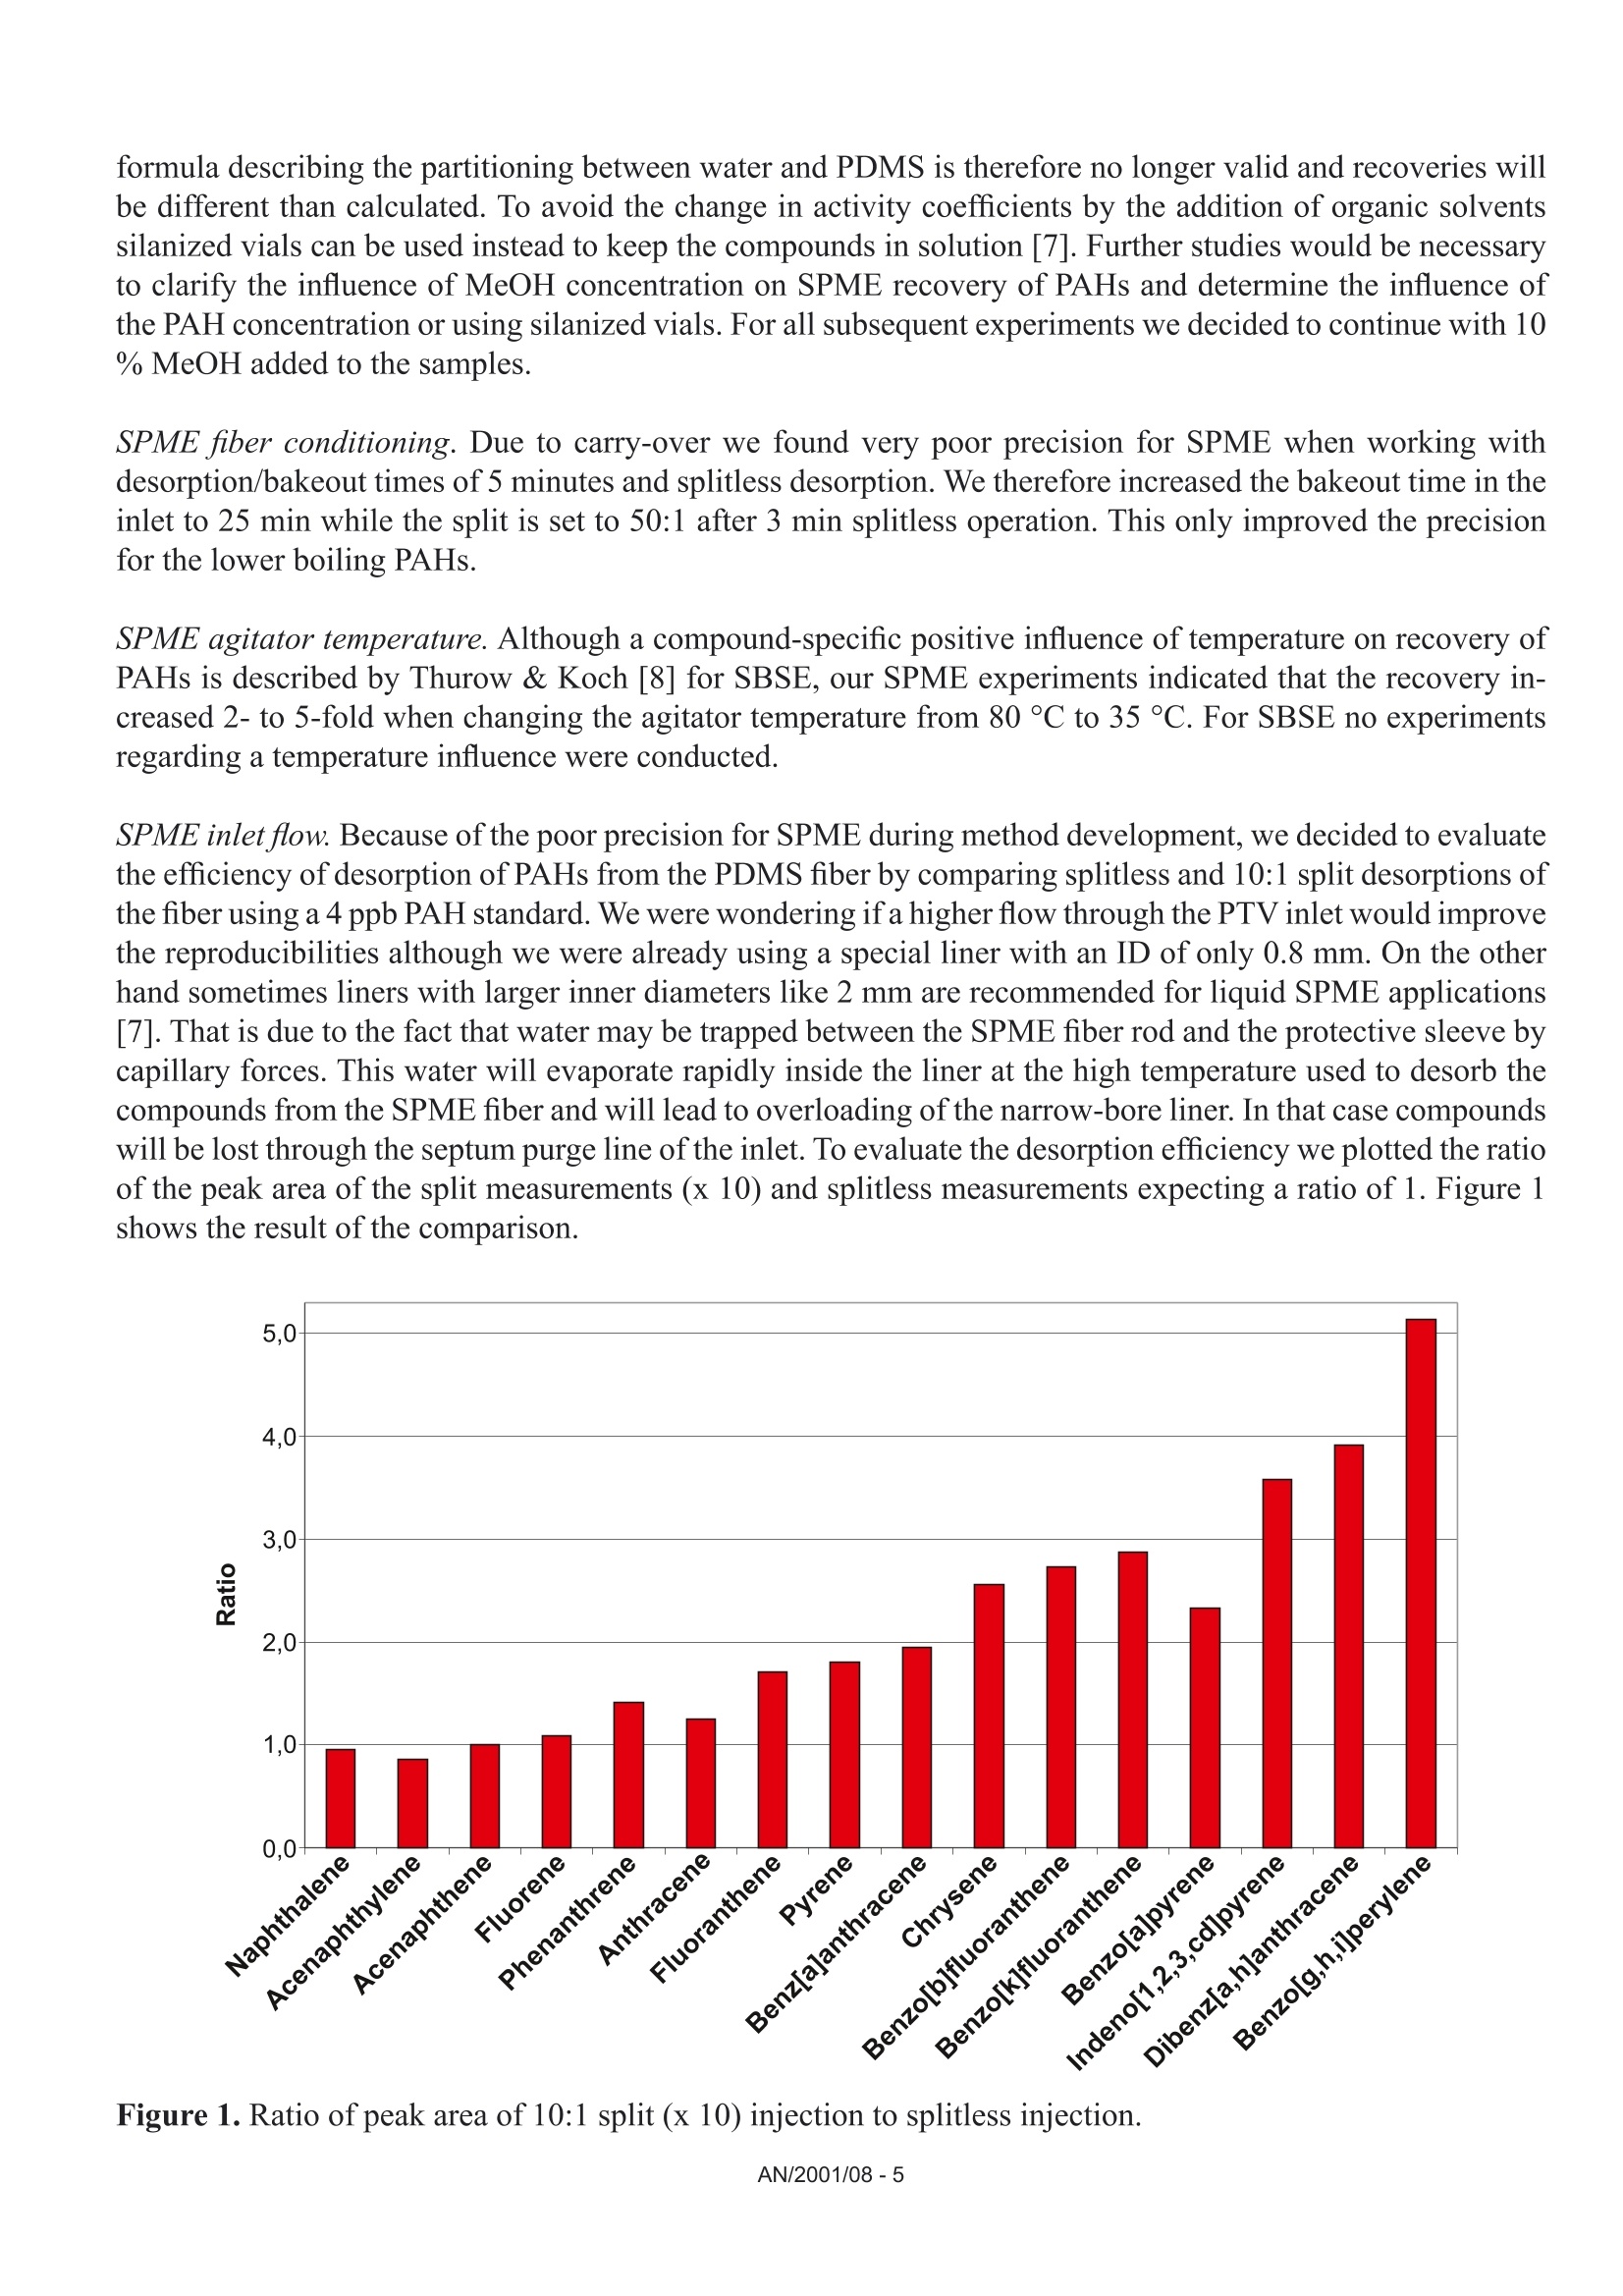
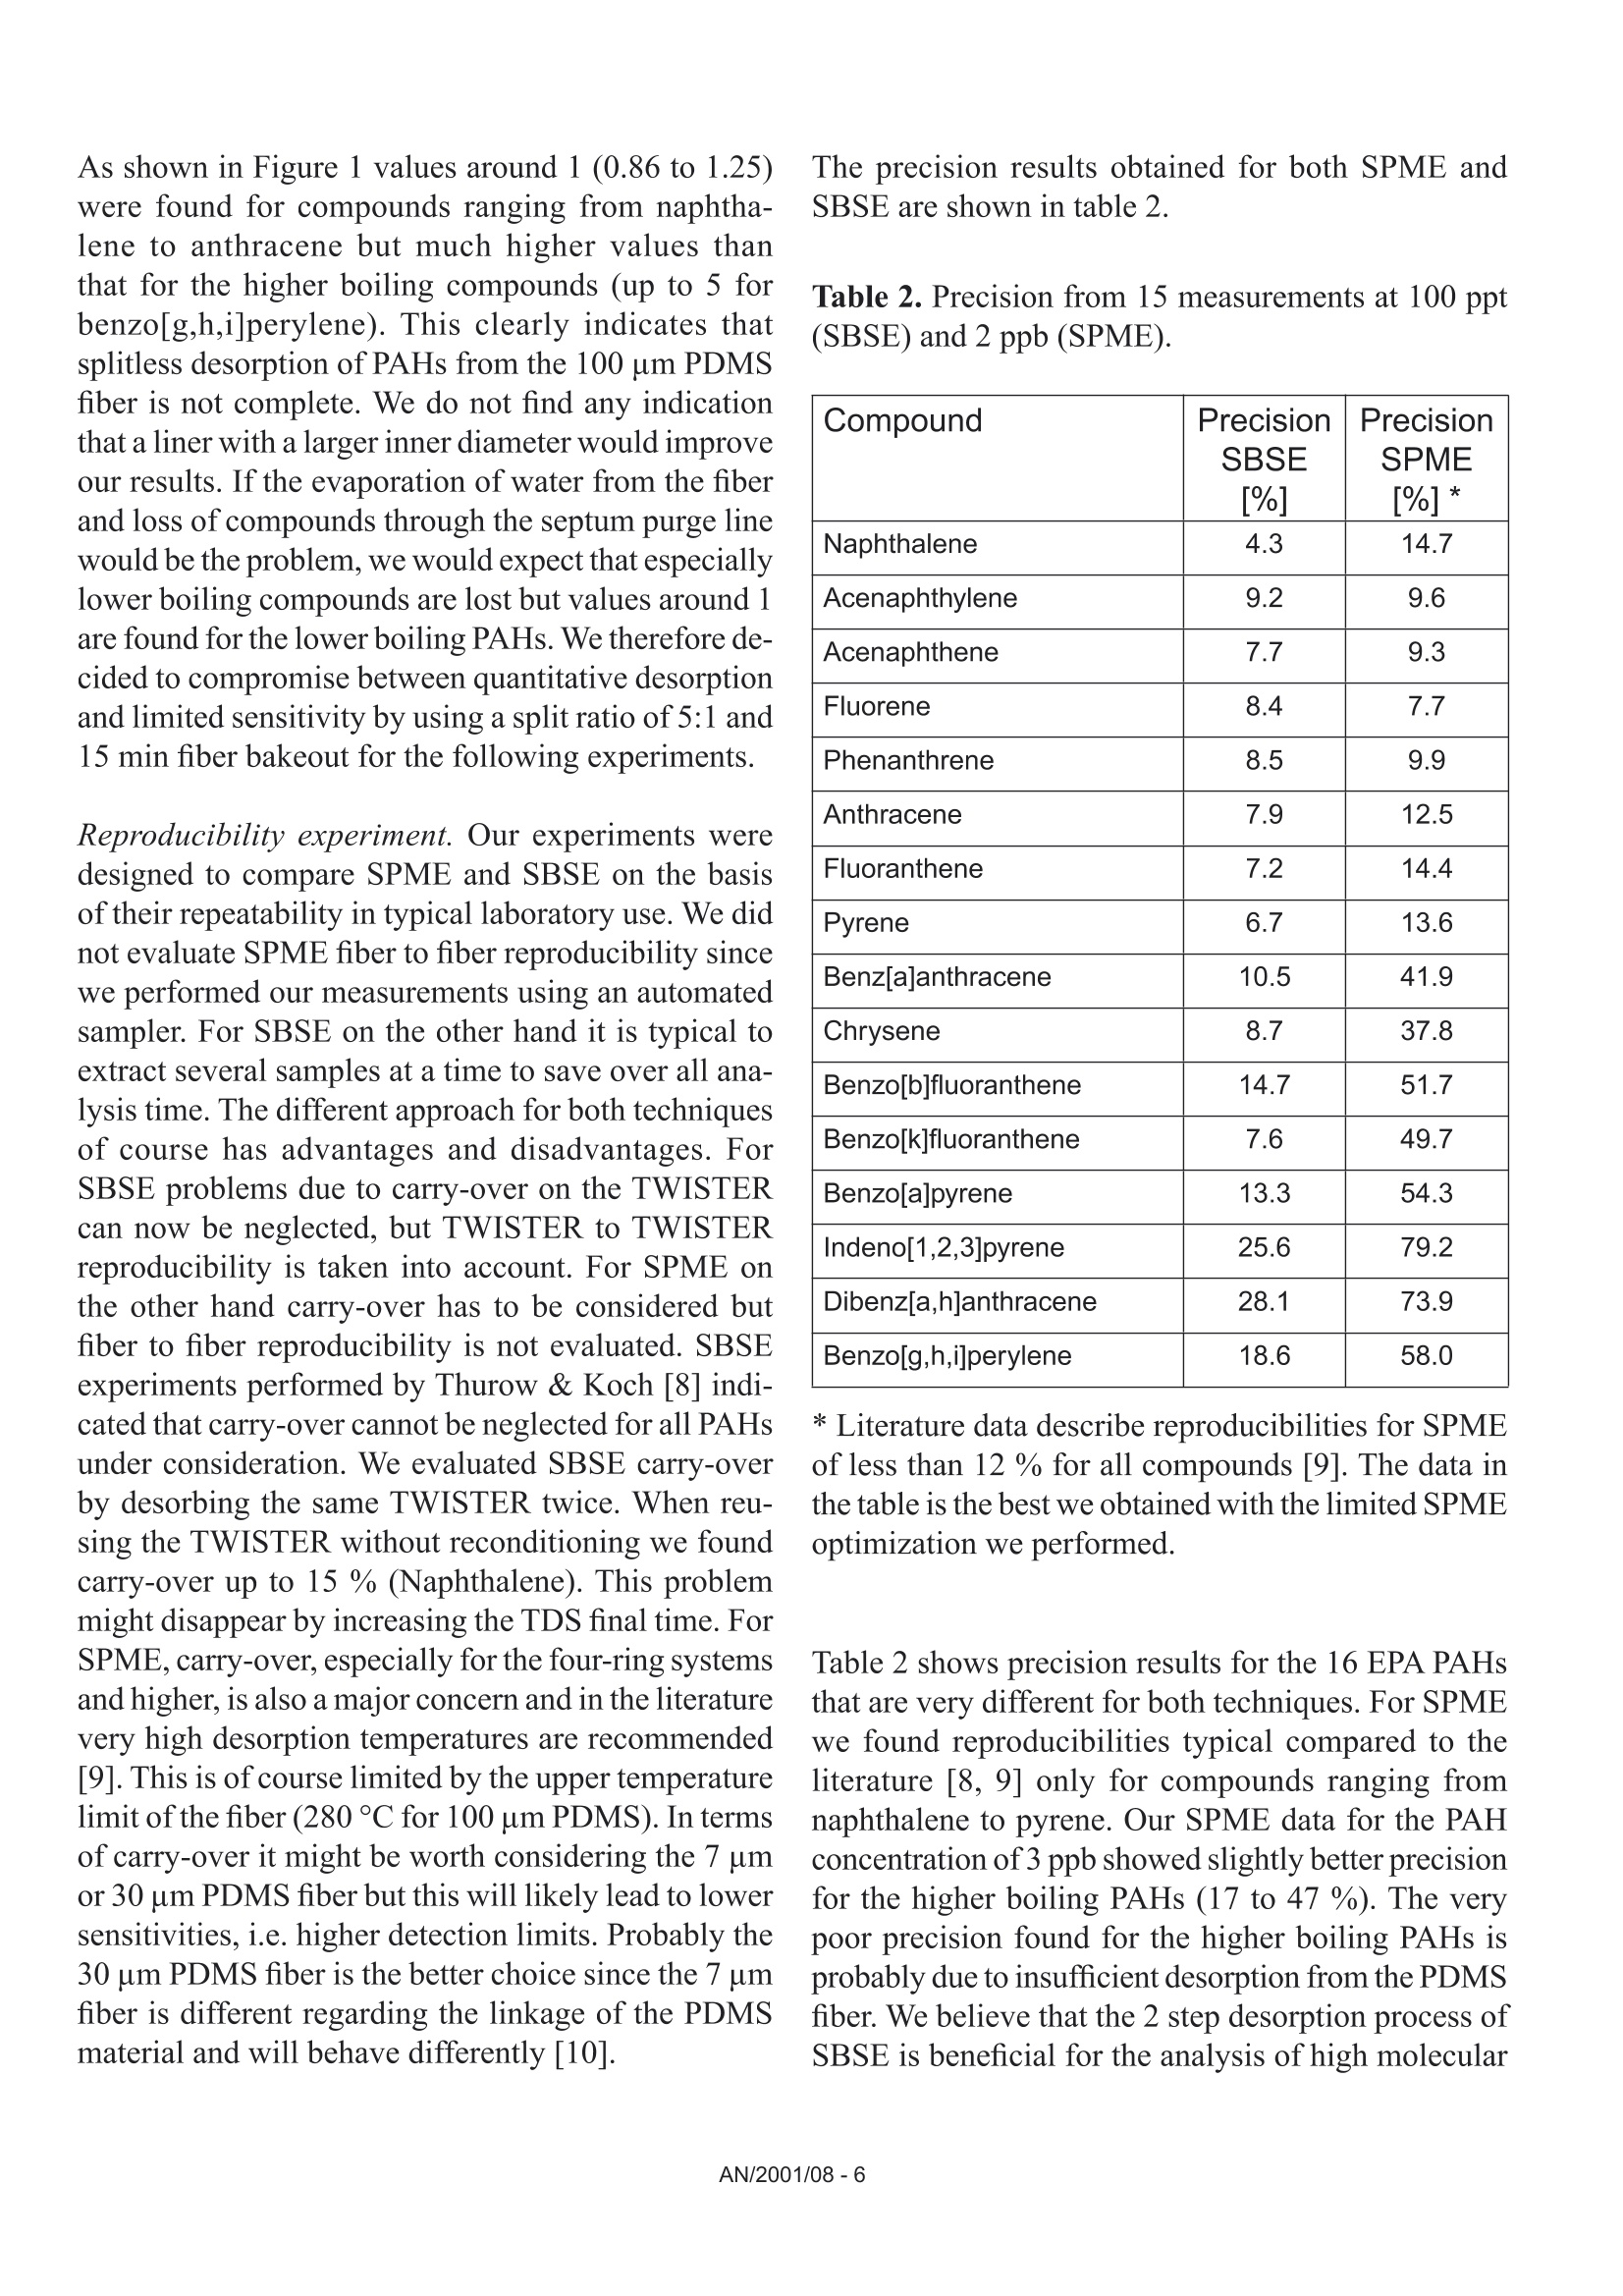
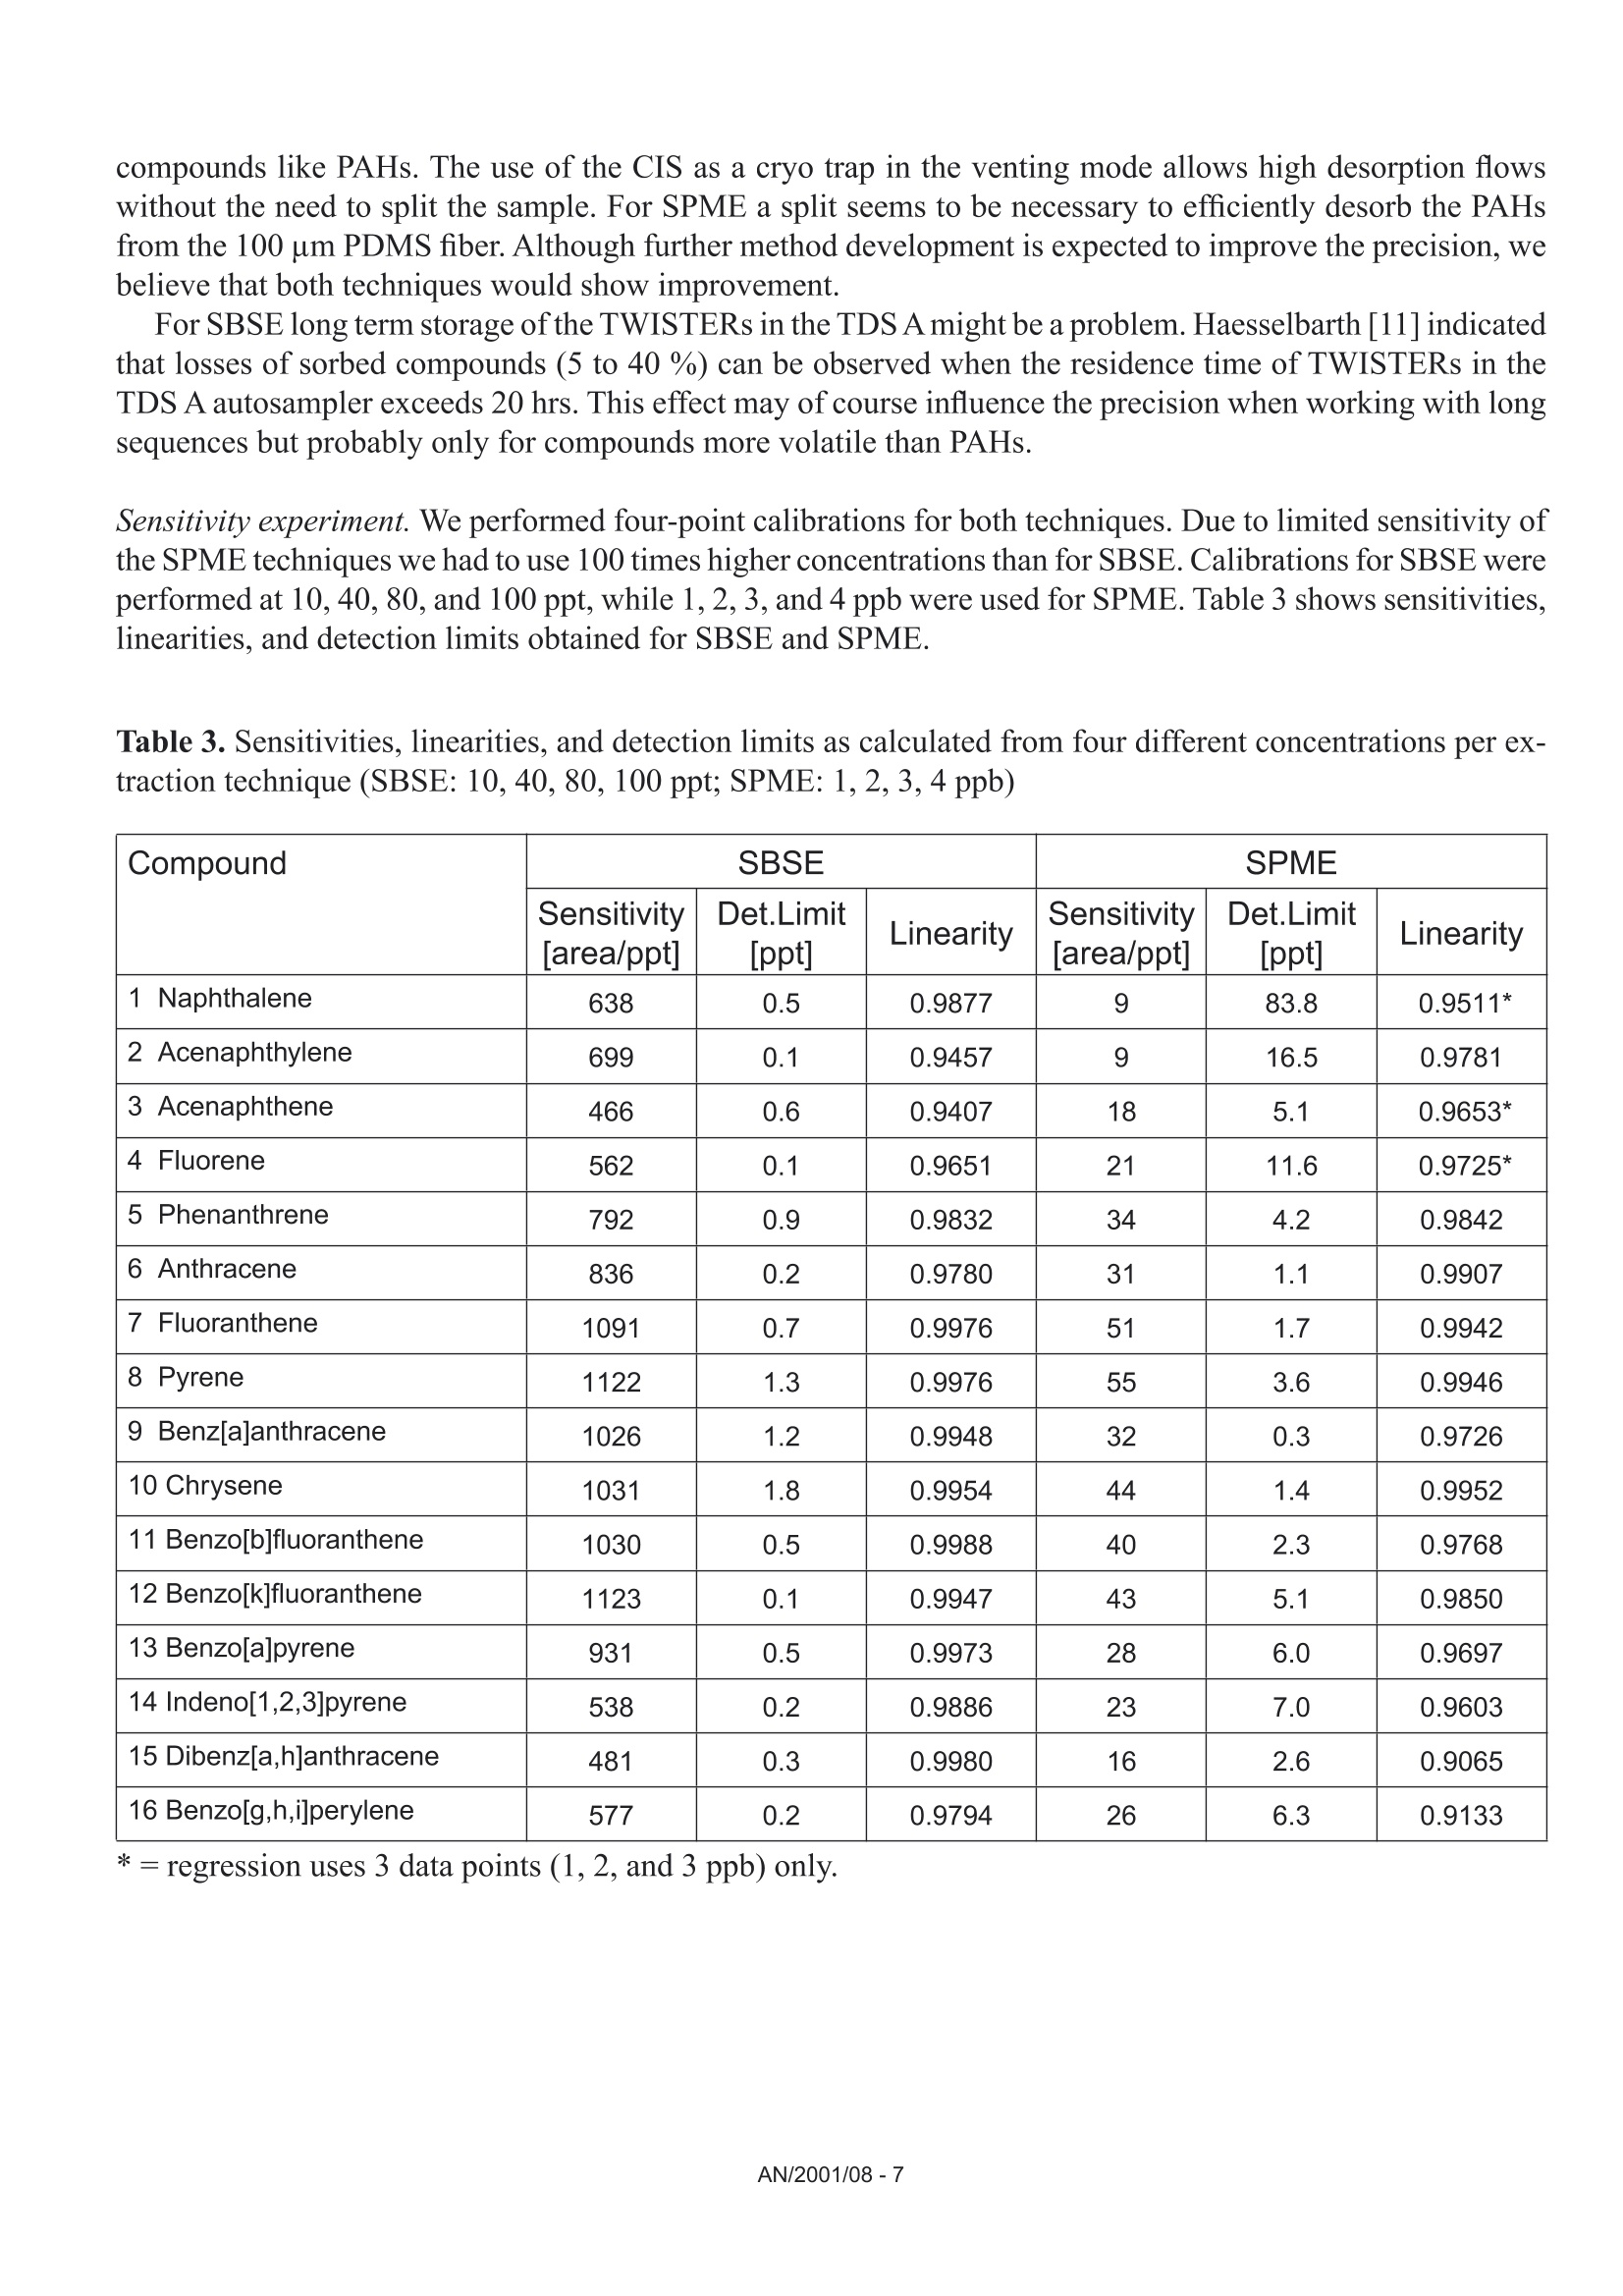
Comparison of the Sensitivity of SolidPhase MicroExtraction (SPME) and StirBar Sorptive Extraction (SBSE) for theDetermination of Polycyclic AromaticHydrocarbons (PAHs) in Water and SoilSamples Arnd C. Heiden, Andreas Hoffmann, Bita KolahgarGerstel GmbH & Co. KG, Eberhard-Gerstel-Platz 1,D-45473 Miilheim an der Ruhr, Germany KEYWORDS PAH, SPME, SBSE, GERSTEL Twister, Thermaldesorption, GC-MS,PCB ABSTRACT Two extraction techniques that avoid solvent consumptionand cut down the sample preparation to a minimum -So-lid Phase MicroExtraction (SPME) and Stir Bar SorptiveExtraction (SBSE) -were compared on the basis of theirreproducibility and sensitivity for 16 US EPA PAH com-pounds. Theoretical calculations indicated nearly quantitative re-covery of all compounds under consideration except naph-thalene for SBSE (10 mm GERSTEL TWISTER, d.=0.5mm) whereas for SPME (100 um PDMS) only higher boi-ling compounds benz[a]anthracene to benzo[g,h,i]perylenewill show quantitative recovery and naphthalene for examplewill show only 10 % recovery. For the comparison of both techniques, water samplesspiked with 10 ppt to 4 ppb of PAHs and a NIST Stan-dard Reference Material were used as model systems.For SBSE reproducibilities at 100 ppt (in water) werefound to be in the range of 4 to 15 % for compoundsfrom naphthalene to benzo[a]pyrene and between18 and 28forindeno[1,2,3]pyrene,dibenz[a,h]anthracene and benzo[g,h,i]perylene. ForSPME reproducibilities at 2 ppb were in the range of7 to 15 % for compounds from naphthalene to pyreneand between 38 and up to 79 % for the higher boilingcompounds. Both techniques showed good linearityfor four-point calibrations. Detection limits were cal-culated to be in the range from 0.08 to 2 ppt for SBSEand 0.3 to 84 ppt for SPME. The analysis of PAHs by SPME has certain limita-tions due to carry-over when using the 100 um PDMSfiber. This problem is not encountered when usingSBSE since we used multiple TWISTERs in parallelinstead of using one TWISTER again and again. Sofar we did not test the behavior of TWISTER whenrunning several samples one after another on the samestir bar. First experiments with soil samples that containa complex matrix indicated that both techniques canprobably be used adequately for this analysis althoughthe SPME technique showed too low sensitivity toquantitate the PAHs. This is most likely due to thefact that our very simple approach was insufficientto completely extract the PAHs from the soil into theliquid phase. INTRODUCTION PAHs are important priority pollutant organics. Theyemanate primarily from coal- and oil-burning plantsand vehicle emissions as combustion products and aremost likely adsorbed onto smoke particles settling onall kinds of surfaces, where they are transferred byrainfall into the aquatic environment. The analysis ofwaste and waste water is therefore mandated by mostregulatory agencies like US EPA worldwide. Techni-ques applied for the analysis of PAHs are GC,GC/MSor HPLC. US EPA Methods 525, 610 and 625 describethe analysis of PAHs in drinking water, municipal andindustrial waste water, US EPA Method 8100 in liquidand solid hazardous waste. The analysis of water and soil for semi-volatile tracelevel contaminants entails the extraction of analytesfrom the matrix. This is usually performed by liquid- liquid (LLE) or solid phase extraction (SPE). In bothcases analytes are extracted from the aqueous phaseand dissolved into an organic solvent. This solvent isthen evaporated to a small volume to concentrate theanalytes and lower the detection limits. The evapora-tion of solvent can be eliminated when a PTV inlet isused and the large volume injection (LVI) techniqueis applied [1]. The process of extraction is on the onehand time consuming, tedious, and can lead to errorsof contamination or spillage and on the other handextractions require the use of organic solvents andoften produce even more toxic waste. State-of-the-artprocedures should be designed to minimize or com-pletely avoid solvent consumption. Arthur & Pawliszyn [2] developed a techniquecalled SPME, where a fiber coated with an organicphase, such as polydimethyl-siloxane (PDMS) is usedfor sampling. The fiber is afterwards thermally desor-bed to introduce compounds into the GC typicallyin the splitless mode. This approach has limitationsincluding limited capacity of the fiber and potentialcontamination of the SPME needle assembly whensampling complex liquid matrices. Baltussen et al.[3] introduced a technique that uses a stir bar coatedwith PDMS material that is called SBSE. Due to thelarger amount of PDMS relative to the SPME fiberthis technique increases the recovery of analytes andtherefore enhances the sensitivity. THEORETICAL The recovery of an analyte from a sample extractedby a sorptive process in equilibrium can be describedfrom the following equation [3]. m=amount of analyte in the PDMS m, = total amount of analyte originally present in the watersample Kow=octanol-water partition coefficient VwV=volume of water and PDMS phase of the fiber/stir bar Extraction with a phase like PDMS has the advantagethat it is a pure sorptive process and no adsorptive processes take place like with materials such as Carboxen/PDMS and Carbowax/Divinylbenzene. We usedPDMS exclusively in this study for both SPME and SBSE. The following table shows the experimental and/or predicted Log Kow values and the calculated recoveriesfor the 16 EPA 610 PAH compounds under consideration in this work. The recoveries are calculated on the basisof a 10 mL sample volume, the 100 um PDMS phase (0.612 uLPDMS) for SPME and the 10 mm TWISTERwith a phase thickness of 0.5 mm (24 uL PDMS) for SBSE. Table 1. Log Kw values for US EPA 610 PAH as predicted from,,SRC KowWin" ver 1.66 [4] and experimentalvalues from references therein Compound CAS Number Log KDWExp./Calc.) Recovery SPME Recovery SBSE Naphthalene [91-20-31 3.30/3.17 0.11 0.83 Acenaphthylene [208-96-8] 3.94/3.94 0.35 0.95 Acenaphthene [83-32-9] 3.92/4.15 0.34 0.95 Fluorene [86-73-71 4.18/4.02 0.48 0.97 Phenanthrene [85-01-81 4.46/4.35 0.64 0.99 Anthracene [120-12-71 4.45/4.35 0.63 0.99 Fluoranthene [206-44-01 5.16/4.93 0.90 1.00 Pyrene 「129-00-01 4.88/4.93 0.82 0.99 Benz[a]anthracene [56-55-31 5.76/5.52 0.97 1.00 Chrysene [218-01-91 5.81/5.52 0.98 1.00 Benzo[b]fluoranthene [205-99-21 5.78/6.11 0.97 1.00 Benzo[k]fluoranthene [207-08-91 6.11/6.11 0.99 1.00 Benzo[a]pyrene [50-32-81 6.13/6.11 0.99 1.00 Indeno[1,2,3]pyrene [193-39-51 ---/6.70 1.00 1.00 Dibenz[a,h]anthracene [53-70-31 6.80*/6.70 1.00 1.00 Benzo[g,h,i]perylene [191-24-21 6.63/6.70 1.00 1.00 *Average from 3 references From table 1 it is obvious that SBSE will theoretically lead to quantitative extractions for all compounds exceptnaphthalene whereas SPME shows quantitative extractions only for compounds ranging from benz[a]anthraceneto benzo[g,h,i]perylene. Using SPME, for example, the extraction efficiency for naphthalene will only be 10%. For those compounds with quantitative recoveries there should be no advantage in using SBSE instead ofSPME. We evaluated this theoretical prediction by comparative measurements of PAHs in spiked water samplesand soil samples. Instrumentation. All experiments were performed ona GC (6890, Agilent) with a mass selective detector(5973N, Agilent), a PTV inlet (CIS 4, Gerstel), anautomated thermal desorption system (TDS 2/TDSA, Gerstel) and a MultiPurpose Sampler with SPMEcapability (MPS 2, Gerstel). All data were analyzedby using target ions in the extracted ion mode. Astarget ions we used the molecular ions for the PAHcompounds under consideration. SBSE was performed by GERSTEL TWISTER(10 mm; d=0.5 mm) and for SPME we used 100 umPDMS fiber assemblies. Standards. For comparison of SPME and SBSE weeither used MeOH/H2O spiked with a diluted 10 ppmEPA 610 standard in cyclohexane or MeOH/H20extracts of a soil sample and a NIST SRM 1939 soilsample (PAH containing PCB reference material). Analysis Conditions. SBSE sampling. Sample volume: 10 mLExtraction: ambient (60 min, 500 rpm) SPME sampling. Sample volume::10 mL Incubation: 35℃ (10 min, 500 rpm) Liq. extraction:35°C (60 min, 250rpm) EXPERIMENTS Dependence on MeOH concentration. For SPME andTWISTER we examined the influence of MeOH con-centration on recovery of PAHs in aqueous solution.We compared results for 0 %, 10 % and 20%MeOH concentration. SPME fiber conditioning. Due to carry-over problemswe evaluated the influence of a 5 min, 15 min and 25min bakeout time in the inlet. SPME agitator temperature. PAH samples were ana-lyzed at 80 °C and 35 ℃ agitator temperature. SPME inlet flow. To evaluate the desorption efficiencyof PAHs from the PDMS fiber we compared splitlessand 10:1 split desorptions. The precision and sensitivityexperiments were performed using a 5:1 split for thedesorption. Reproducibility experiment. 15 replicates of a 100 ppt(SBSE) or 2 ppb standard (SPME) were analyzed. Sensitivity experiment. In addition to the 15 replicateswe analyzed 5 samples of 3 different concentrations;SPME: 1,3 and 4 ppb; SBSE: 10, 40 and 80 ppt. Soil experiments. 1g of NIST SRM 1939 was slurriedin 20 mL H2O (10%MeOH) and placed in an ultra-sonic bath for 10 min. 1 mL of this extract was dilutedto 11 mL H20 with 10% MeOH after settling of thesediment. 10 replicates were extracted and analyzedby TWISTER and SPME. RESULTS AND DiscussioN Dependence on MeOH concentration. Several authorsindicate that PAH compounds are lost to glass walls, ifwater is the only solvent used. MeOH or Hyamine, anionic tenside, are added to the samples to keep PAHs insolution [5, 6]. We performed a rough experiment withwater spiked with 10 ppb EPA 610 PAHs (TWISTER)and 4 ppb (SPME). Experiments for SBSE indicatedthat the addition of MeOH increases the recovery ofPAHs in water but concentration (10%or 20%MeOH)made no significant difference. Our first experimentsduring SPME method development led to very poorprecision. To exclude that the 10% MeOH led tocompetition with PAHs on the fiber we performed oneseries with water as the only solvent. This series sho-wed even worse precision probably due to the loss ofPAHs on glass walls. The addition of organic solventsto the water will change the activity coefficients of theanalytes in water, and thus could affect the partitioningof the compounds into the PDMS phase. The simple formula describing the partitioning between water and PDMS is therefore no longer valid and recoveries willbe different than calculated. To avoid the change in activity coefficients by the addition of organic solventssilanized vials can be used instead to keep the compounds in solution [7]. Further studies would be necessaryto clarify the influence of MeOH concentration on SPME recovery of PAHs and determine the influence ofthe PAH concentration or using silanized vials. For all subsequent experiments we decided to continue with 10% MeOH added to the samples. SPME fiber conditioning. Due to carry-over we found very poor precision for SPME when working withdesorption/bakeout times of 5 minutes and splitless desorption. We therefore increased the bakeout time in theinlet to 25 min while the split is set to 50:1 after 3 min splitless operation. This only improved the precisionfor the lower boiling PAHs. SPME agitator temperature. Although a compound-specific positive influence of temperature on recovery ofPAHs is described by Thurow & Koch [8] for SBSE, our SPME experiments indicated that the recovery in-creased 2- to 5-fold when changing the agitator temperature from 80°℃ to 35C. For SBSE no experimentsregarding a temperature influence were conducted. SPME inlet flow. Because of the poor precision for SPME during method development, we decided to evaluatethe efficiency of desorption of PAHs from the PDMS fiber by comparing splitless and 10:1 split desorptions ofthe fiber using a 4 ppb PAH standard. We were wondering if a higher flow through the PTV inlet would improvethe reproducibilities although we were already using a special liner with an ID of only 0.8 mm. On the otherhand sometimes liners with larger inner diameters like 2 mm are recommended for liquid SPME applications[7]. That is due to the fact that water may be trapped between the SPME fiber rod and the protective sleeve bycapillary forces. This water will evaporate rapidly inside the liner at the high temperature used to desorb thecompounds from the SPME fiber and will lead to overloading of the narrow-bore liner. In that case compoundswWi1l1l be lost through the septum purge line of the inlet. To evaluate the desorption efficiency we plotted the ratioof the peak area of the split measurements (x 10) and splitless measurements expecting a ratio of 1. Figure 1shows the result of the comparison. Figure 1. Ratio of peak area of 10:1 split (x 10) injection to splitless injection. AN/2001/08-5 As shown in Figure 1 values around 1 (0.86 to 1.25)were found for compounds ranging from naphtha-lene to anthracene but much higher values thanthat for the higher boiling compounds (up to 5 forbenzo[g,h,i]perylene). This clearly indicates thatsplitless desorption of PAHs from the 100 um PDMSfiber is not complete. We do not find any indicationthat a liner with a larger inner diameter would improveour results. If the evaporation of water from the fiberand loss of compounds through the septum purge linewould be the problem, we would expect that especiallylower boiling compounds are lost but values around 1are found for the lower boiling PAHs. We therefore de-cided to compromise between quantitative desorptionand limited sensitivity by using a split ratio of 5:1 and15 min fiber bakeout for the following experiments. Reproducibility experiment. Our experiments weredesigned to compare SPME and SBSE on the basisof their repeatability in typical laboratory use. We didnot evaluate SPME fiber to fiber reproducibility sincewe performed our measurements using an automatedsampler. For SBSE on the other hand it is typical toextract several samples at a time to save over all ana-lysis time. The different approach for both techniquesof course has advantages and disadvantages. ForSBSE problems due to carry-over on the TWISTERcan now be neglected, but TWISTER to TWISTERreproducibility is taken into account. For SPME onthe other hand carry-over has to be considered butfiber to fiber reproducibility is not evaluated. SBSEexperiments performed by Thurow & Koch [8] indi-cated that carry-over cannot be neglected for all PAHsunder consideration. We evaluated SBSE carry-overby desorbing the same TWISTER twice. When reu-sing the TWISTER without reconditioning we foundcarry-over up to 15 % (Naphthalene).This problemmight disappear by increasing the TDS final time. ForSPME, carry-over, especially for the four-ring systemsand higher, is also a major concern and in the literaturevery high desorption temperatures are recommended[9]. This is ofcourse limited by the upper temperaturelimit ofthe fiber (280°℃ for 100 um PDMS). In termsof carry-over it might be worth considering the 7 umor 30 um PDMS fiber but this will likely lead to lowersensitivities, i.e. higher detection limits. Probably the30 um PDMS fiber is the better choice since the 7 umfiber is different regarding the linkage of the PDMSmaterial and will behave differently [10]. The precision results obtained for both SPME andSBSE are shown in table 2. Table 2. Precision from 15 measurements at 100 ppt(SBSE) and 2 ppb (SPME). Compound PrecisionSBSE[%] PrecisionSPME[%]* Naphthalene 4.3 14.7 Acenaphthylene 9.2 9.6 Acenaphthene 7.7 9.3 Fluorene 8.4 7.7 Phenanthrene 8.5 9.9 Anthracene 7.9 12.5 Fluoranthene 7.2 14.4 Pyrene 6.7 13.6 Benz[a]anthracene 10.5 41.9 Chrysene 8.7 37.8 Benzo[b]fluoranthene 14.7 51.7 Benzo[k]fluoranthene 7.6 49.7 Benzo[a]pyrene 13.3 54.3 Indeno[1,2,3]pyrene 25.6 79.2 Dibenz[a,h]anthracene 28.1 73.9 Benzo[g,h,i]perylene 18.6 58.0 * Literature data describe reproducibilities for SPMEof less than 12 % for all compounds [9]. The data inthe table is the best we obtained with the limited SPMEoptimization we performed. Table 2 shows precision results for the 16 EPA PAHsthat are very different for both techniques. For SPMEwe found reproducibilities typical compared to theliterature [8, 9] only for compounds ranging fromnaphthalene to pyrene. Our SPME data for the PAHconcentration of 3 ppb showed slightly better precisionfor the higher boiling PAHs (17 to 47%). The verypoor precision found for the higher boiling PAHs isprobably due to insufficient desorption from the PDMSfiber. We believe that the 2 step desorption process ofSBSE is beneficial for the analysis of high molecular compounds like PAHs. The use of the CIS as a cryo trap in the venting mode allows high desorption flowswithout the need to split the sample. For SPME a split seems to be necessary to efficiently desorb the PAHsfrom the 100 um PDMS fiber. Although further method development is expected to improve the precision, webelieve that both techniques would show improvement. For SBSE long term storage of the TWISTERs in the TDS A might be a problem. Haesselbarth [11] indicatedthat losses of sorbed compounds (5 to 40 %) can be observed when the residence time of TWISTERs in theTDS A autosampler exceeds 20 hrs. This effect may of course influence the precision when working with longsequences but probably only for compounds more volatile than PAHs. Sensitivity experiment. We performed four-point calibrations for both techniques. Due to limited sensitivity ofthe SPME techniques we had to use 100 times higher concentrations than for SBSE. Calibrations for SBSE wereperformed at 10, 40, 80, and 100 ppt, while 1, 2, 3, and 4 ppb were used for SPME. Table 3 shows sensitivities,linearities, and detection limits obtained for SBSE and SPME. Table 3. Sensitivities, linearities, and detection limits as calculated from four different concentrations per ex-traction technique (SBSE: 10, 40, 80, 100 ppt; SPME: 1, 2, 3,4 ppb) Compound SBSE SPME Sensitivity[area/ppt] Det.Limit[ppt] Linearity Sensitivity[area/ppt] Det.Limit[ppt] Linearity 1 Naphthalene 638 0.5 0.9877 9 83.8 0.9511* 2 Acenaphthylene 699 0.1 0.9457 9 16.5 0.9781 3 Acenaphthene 466 0.6 0.9407 18 5.1 0.9653* 4 Fluorene 562 0.1 0.9651 21 11.6 0.9725* 5 Phenanthrene 792 0.9 0.9832 34 4.2 0.9842 6 Anthracene 836 0.2 0.9780 31 1.1 0.9907 7 Fluoranthene 1091 0.7 0.9976 51 1.7 0.9942 8 Pyrene 1122 1.3 0.9976 55 3.6 0.9946 9 Benz[a]anthracene 1026 1.2 0.9948 32 0.3 0.9726 10 Chrysene 1031 1.8 0.9954 44 1.4 0.9952 11 Benzo[b]fluoranthene 1030 0.5 0.9988 40 2.3 0.9768 12 Benzo[k]fluoranthene 1123 0.1 0.9947 43 5.1 0.9850 13 Benzo[a]pyrene 931 0.5 0.9973 28 6.0 0.9697 14 Indeno[1,2,3]pyrene 538 0.2 0.9886 23 7.0 0.9603 15 Dibenz[a,h]anthracene 481 0.3 0.9980 16 2.6 0.9065 16 Benzo[g,h,i]perylene 577 0.2 0.9794 26 6.3 0.9133 * = regression uses 3 data points (1, 2, and 3 ppb) only. The sensitivities in table 3 show 20 to 80 times higher sensitivities for SBSE than for SPME. The regressioncoefficients (r²) show good linearities for both SPME and SBSE in the concentration ranges under considerati-on. For naphthalene, acenaphthene and fluorene the calibration curves indicated that the 4 ppb sample is abovethe linear range of the SPME method. We therefore neglected these data points for the linearities of these threecompounds. Further studies would be necessary to determine the linear range of the method. Figures 2A to 2Dshow four diagrams of area counts versus concentration and the regression lines. Figures 2A to D. Plots of area counts versus concentration and parameters of the linear regression forbenzo[b]fluoranthene and dibenzo[a,h]anthracene for SBSE and fluoranthene and chrysene for SPME. The detection limits in table 3 are theoretical statistical values based on the fluctuations of the baseline andthe sensitivity of the method (slope of the calibration curve). The calculated detection limits for SPME arecomparable to data cited in the literature. Pawliszyn [9] and references therein state detection limits for PAHsby SPME in the range from 0.001 to 0.42 ppb. Theoretically SBSE is in most cases more sensitive (up to 200times) than SPME. When looking at the measurements it becomes obvious that SBSE is indeed far more sensitive than SPME(Fig.3). Time--> 10.00 15.00 20.00 25.00 Figure 3. Overlay of extracted ion chromatograms (m/z:128,152,153,166,178,202,228,252,276,278) forSBSE (10 ppt, upper trace) and SPME (1 ppb, lower trace), peak identities see table 3. Note that similar peak heights are obtained for several compounds although the PAH concentration used forSBSE is 100 times lower than that used for SPME. The background signal is ofcourse also increased for SBSEcompared to SPME. From peak areas obtained for SPME at 1 ppb the effective limit for peak detection can beestimated to be at 300 to 600 ppt depending on the compound. For SBSE on the other hand the effective limitsfor peak detection can be estimated to be in the range of less than 1 to 4 ppt. For practical purposes the limitfor peak detection found for SBSE is about a factor of 100 lower than that found for SPME. This is not consis-tent with the about 40 times higher phase volume for SBSE. From the theoretical prediction ofrecoveries oneshould expect that there is no difference in sensitivities and detection limits for all compounds with predictedrecoveries of 1. The inconsistency from the theoretical prediction may have several reasons: 1) The formula for the theoretical prediction is no longer valid since we added 10 % of an organic solvent tothe standards which changes the activity coefficients for the partitioning of compounds into the PDMS. 2)) The effective volume of the PDMS material which is linked to the SPME fiber may be different than fromtheoretical calculations. 3)) There may be displacement effects happening especially on the SPME fiber since there is less PDMSmaterial available. 4))The SPME extraction of compounds from the aqueous phase may be not quantitative due to the slowagitation instead of fast stirring which is recommended in the literature despite the 60 minute extractiontime. 5)) Since we found that carry-over plays a role for SPME we might not have transferred the extractedcompounds quantitatively onto the GC column. From our data we cannot decide what the reason for the inconsistency from the theoretical predictions is andit may well be a combination of several reasons although some points from the list clearly have a tendency tohave a higher effect than others. Irregardless of the mechanism, recovery with the SPME technique seems tobe not behaving as predicted for the recoveries. That points out that it may well be worth trying SBSE insteadof SPME even though no improvement is predicted from theoretical considerations. Soil experiment. To study the effect of a complex solid matrix on reproducibility of PAHs we used a NISTSRM 1939 soil sample. After liquid extraction in an ultrasonic bath we took 10 aliquots each of the liquid andextracted this by SBSE and SPME after dilution. The SRM 1939 material is known to contain phenanthrene(130 ppb), fluoranthene (190 ppb), pyrene (170 ppb), benz[a]antharacene (46 ppb) and chrysene (51 ppb).Given a theoretical quantitative extraction of the soil sample by our simple sample preparation approach, wediluted the PAHs to concentrations between 209 and 864 ppt. When analyzing by SBSE we found reprodu-cibilities ranging from 12 to 20 % for the 10 replicates. Unfortunately the sensitivity of SPME was not highenough to analyze the samples. This was expected since the concentrations after dilution are in the ppt rangeand in addition our extraction approach cannot be expected to be quantitative. Given a theoretical quantitativeextraction of PAHs by the TWISTER we can estimate the extraction efficiency of our simple approach to be inthe range of only 2 to 5 %. Figure 4 shows an overlay of the extracted ion chromatograms for the soil samplefor SBSE and SPME. Figure 4. Overlay of extracted ion chromatograms (m/z=178, 202,228) of the NIST SRM 1939 soil samplefor SBSE (A) and SPME(B) showing PAHs. Extractions of soil are mainly done using organic solvents like methylene chloride since water extracts cannotbe used with the subsequent GC analysis. Using the SBSE technology extractions using water are possible sincethe TWISTER can recover the dissolved compounds from such an extract and subsequent thermal desorptionof the TWISTER allows sample introduction without water into the GC system. First experiments using Acce-lerated Solvent Extraction (ASE) of soil samples with water and a small percentage ofa polar organic solventlike 10 % of methanol, acetonitrile or propanol and subsequent extractions by TWISTER led to promisingresults [121. Besides the PAH compounds the SRM material has certified contents of several PCBs. These and other PCBscan be found in the chromatogram of the SRM extract (Fig. 5) but were not evaluated in this study. Figure 5. Overlay of extracted ion chromatograms (m/z=256, 292,326) of the NIST SRM 1939 soil samplefor SBSE (A) and SPME (B) showing PCBs (Trichlorobiphenyls: c=2.2-6.9 ug/g; Tetrachlorobiphenyls: c=0.9-4.5 pg/g; Pentachlorobiphenyls: c=0.5-0.8 pg/g). Figure 5 shows that SBSE is again leading to a much higher response compared to SPME chromatogram forthe same sample. CONCLUSIONS Method optimization for both techniques -SPME and SBSE - is challenging since several parameters play arole in the analysis of PAHs. We found that the concentration of MeOH, the temperature of the agitator duringsampling and the desorption flow are critical to the measurements. For SBSE the problem of desorption does not play as important a role as for SPME since the desorption isperformed in two steps using the PTV in the cool venting mode. The PAHs can be desorbed from the PDMSusing a high flow while the compounds are refocussed on the CIS liner. Although more optimization of the analytical methods (salt saturation, fast stirred samples, a neutral pH[9]and different liner diameter or silanized vials [7]) are necessary, we do believe that this difference in sensitivitywill remain, since the difference is largely due to the difference in PDMS phase volume between SBSE andSPME. The problems with precision found for SPME analysis indicate that desorption of PAHs from the 100 umPDMS fiber is a problem. Precision may improve when using a 30 um or even 7 um PDMS fiber. Our data indicate that SBSE is about a factor of 20 to 80 more sensitive for the analysis ofPAHs from aqueoussamples than SPME. The theoretical detection limits calculated for SBSE are in most cases lower (up to 200times) than for SPME. As far as we can tell the SPME technique seems to be not behaving as predicted for therecoveries, because otherwise no improvement in sensitivities and detection limits for the higher boiling PAHswould be possible.Further decrease of detection limits may be considered to be possible by using either theTWISTER with 1 mm film thickness or the 20 mm TWISTER instead of the standard 10 mm bar. Even a strong matrix like a PAH containing sediment allows the analysis of PAHs after effective extractionfrom the soil. REFERENCES [1] MORABITO,P.L.; MCCABE,T.; HILLER,J.F.; ZAKETT,D.:》Determination of PolynuclearHydrocarbons in Water Samples Using Large Volume On-Column-Injection Capillary GasChromatography《, Journal of High Resolution Chromatography, 16 (2), 1993,90. 门ARTHUR, C. L.; PAWLISZYN,J.: Anal.Chem. 62,1990,2145.门门 BALTUSSEN,E.; SANDRA, P.; DAVID,F.; CRAMERS, C.: J. Microcol. Sep., 1999, 11, 737.. SRC KOWWIN SOFTWARE, for the Calculation of Octanol/Water Distribution Coefficients,Availablefrom GERSTEL. 51]EHEBERER,T.: >Identifizierung und Quantifizierung von Pestizidruickstanden und Umweltkontaminantenin Grund- und Oberflachenwassern mittels Kapillargaschromatographie-Massenspektrometrie《,Berlin:Wiss.-und Technik-Verlag Gross, 1995. ISBN 3-928943-30-8. ( [6] K KICINSKI, H.G.:.:>PAH-Festphasenextraktion aus Wasserproben durch Hyaminezusatz《, Git Fachzeitschrift Labor, 1 993, 11, 999. ) GORECKI, T.; Private Communication,University of Waterloo, Canada. THUROW,K.; KOCH, A.:》Evaluation des Einsatzes der Stir Bar Sorptive Extraction fir die MeBtechnische Bestimmung Umwelrelevanter Stoffe: Polychlorierte Biphenyle, Polyaromatische Kohlenwasser-stoffe, Phenole《, Application Note of Analytical Instrument GmbH, Rostock, 2001. ( [9]1 P BAWLISZYN, J.: Applications of Solid Phase MicroExtraction, The Royal Society of Chemistry, 1999,Chapter 17. ) ( [10] MANI, V.,》Properties of Commercial SPME Coatings《, i n : PAWLISZYN,J. (Ed.),Applications of SolidPhase Microextraction, RSC Chromatography Monographs, C ambridge, 1999. ) [11] HASSELBARTH,A.:》GERSTEL-TWISTER: Discussion of Applicability and First ExperimentalExperiences《,Application Note of Kraft Foods R&D Inc.,Munchen, 2001. ( [12] PFANNKOCH, E. A.; Private co m munication, Gerstel, Inc., Baltimore, M D,USA. ) GERSTEL GmbH & Co. KG Eberhard-Gerstel-Platz 1 45473 Mulheim an der RuhrGermany+49 (0)208-765 03-0+49 (0) 208-765 03 33 gerstel@gerstel.com www.gerstel.com GERSTEL Worldwide GERSTEL LLP GERSTEL, Inc. GERSTELAG GERSTEL K.K. 701 Digital Drive, Suite J Wassergrabe 27 1-3-1 Nakane,Meguro-ku Linthicum, MD 21090 CH-6210 Sursee Tokyo 152-0031 USA Switzerland SMBC Toritsudai Ekimae Bldg 4F +1 (410) 247 5885 +41 (41) 9 21 97 23 Japan +1 (410) 247 5887 +41 (41)921 97 25 +81357315321 sales@gerstelus.com swiss@ch.gerstel.com +81 357315322 www.gerstelus.com www.gerstel.ch info@gerstel.co.jp Information, descriptions and specifications in thisPublication are subject to change without notice.GERSTEL, GRAPHPACK and TWISTER are registeredtrademarks of GERSTEL GmbH & Co. KG. www.gerstel.co.jp GERSTEL (Shanghai) Co. Ltd GERSTEL Brasil 10 Science Park Road Room 206,2F,Bldg.56 Av. Pascoal da Rocha Falcao, 367 #02-18 The Alpha No.1000,Jinhai Road, 04785-000 Sao Paulo -SP Brasil Singapore 117684 Pudong District +55(11)5665-8931 +65 6779 0933 Shanghai 201206 +55 (11)5666-9084 +65 6779 0938 +86 21 50 93 30 57 gerstel-brasil@gerstel.com SEA@gerstel.com china@gerstel.com www.gerstel.com.br www.gerstel.com # www.gerstel.cn AN/ 对土壤中的多环芳烃使用SBSE-TD-GC/MS搅拌棒吸附萃取联合热脱附和质谱联用分析,可以得到极低的检测下限,非常高的可重复性,并且无需溶剂,所需样品体积小,即环保又经济! 18种多环芳烃标样化合物回收率更高首先看一下与SPME相比,对加标的水样中18种PAH的萃取回收率[1]。比较条件:加标水样都是10毫升;SBSE和SPME都是浸入式萃取60分钟(此处SPME需要额外搅拌棒,而SBSE则自带搅拌功能);SBSE和SPME都是使用PDMS吸附层,SBSE吸附层体积24微升(这是SBSE搅拌棒的最小吸附体积),SPME吸附层体积0.5微升(这是SPME纤维头可含的最大吸附体积)。 萃取结果如下。 事实证明,SBSE由于其更大的吸附层和主动的搅拌萃取模式,对18种PAHs的萃取回收率,远远高于SPME法。对18种多环芳烃的萃取回收率对比检测限更低自然的,检测下限也就更低。。。萃取条件同上对18种多环芳烃的检测下限对比更高的可重复性以下是15次重复试验得到的RSD数据[2],其中SBSE使用的样品浓度为100ppt, SPME使用的样品浓度为2ppb (2000ppt), 样品浓度是根据每个检测技术的最低检测下限来选择的。可见SBSE拥有更好的可重复性,加上其牢固的设计和可重复使用的特性,使其更适合于常规检测。 适用的样品SBSE技术使用的是Twister搅拌棒来完成萃取工作, Twister是一个表面包裹有吸附层的磁力搅拌棒。如下图所示:SBSE技术中所用到的TwisterTwister最适合的样品就是液态样品,因为它可以边搅拌,边主动萃取样品中的化合物,萃取效率最高。当然Twister也可以用来顶空萃取,但是由于是被动萃取,所以萃取效率较浸入式萃取略逊一筹。同样的道理也是为什么SPME对液体样品的萃取不如SBSE,因为SPME主要用于顶空萃取,属于被动萃取。 而液体样品也不光是水样,饮料,酒类这些本身是液态的,而是更多的可能性,如:可以与水混合的:如奶粉,酸奶,水果压榨后的汁水,各种食品如粽子,月饼,咸蛋等使用溶剂萃取后的萃取液,取部分再加水混合,如:蔬菜,水果,土壤等使用QuEChERS净化技术后的萃取液:如蔬菜,水果等萃取原理为什么对于多环芳烃,SBSE较SPME而言是最佳的选择? SBSE较之SPME而言,增加了50-250倍的吸附相的体积,并且通过搅拌加快萃取的效率,所以萃取能力可至SPME的1000倍。根据回收率的公式,在样品体积不变的情况下,萃取层的体积越大,回收率就越高。下图是SBSE和SPME的理论回收率,横坐标是化合物的logKow辛醇-水的分配系数常用对数值。我们可以根据LogKow的大小来大致判定化合物的极性,LogKow 越小,化合物的极性就越高。一般而言,LogKow小于4的化合物属于极性化合物,LogKow大于4的化合物属于中极性到非极性化合物。很自然的非极性的吸附层PDMS对极性化合物的回收率低。下图中,SPME对LogKow大于7的化合物,可以达到100%的回收率,而SBSE通过增大的吸附相的优势,弥补了对中极性化合物的低回收率,对于LogKow小于7的化合物,SBSE比SPME更敏感,而多环芳烃PAHs的LogKow约在3-7之间,固SBSE较SPME而言是最佳的选择。同样的原理,由于SBSE是目前无溶剂萃取层技术中所含萃取层最大的,所以在相同的萃取条件下,SBSE的灵敏度最高。再加上是浸入式搅拌的主动萃取,所以萃取效率更高。例子:可口可乐使用SBSE技术,检测可口可乐的水源,被处理后的水和装瓶后的饮料中的各类污染物,有机氯农药,有机磷农药,多氯联苯,拟除虫菊酯,苯酚,以及其他目标分析物的定量浓度在8-100 ng/L (ppt级别), 多环芳烃在0.4 - 5 ng/L,塑化剂 0.08 -1 µg/L (ppb级别)。使用SBSE技术,多环芳烃的线性非常好,重现性高,平均标准偏差仅为 5.82 %, 平均回收率为101.6% 。 此方法于2010年10月被可口可乐比利时欧洲管理中心所采用。例子:土壤土壤中PAHs的检测,标准方法中使用二氯甲烷对土壤进行萃取,然后使用GC检测[2]。使用Twister,我们也可以使用带10%甲醇的水溶剂对土壤进行萃取。下图是对标准图样 NIST SRM 1939,使用20毫升的10%甲醇的水溶剂在超声下萃取10分钟。取1毫升的萃取液与11毫升的含10%甲醇的水进行混合后,分别用SBSE和SPME技术进行萃取,SBSE和SPME萃取时间都是60分,其中SBSE在常温下边搅拌边萃取,SPME的样品需要加热到35°C并且同时使用额外的搅拌棒来搅拌样品。使用SPME(A)和SBSE(B)技术分别对NIST SRM 1939 土样进行萃取得到的色谱图叠加视图,选择离子(m/z = 178,202, 228)代表各类多环芳烃化合物。上图可见,在ppt范围,SBSE技术的灵敏度远高于SPME。这也使得在检测ppt范围的多环芳烃化合物时,SPME无法胜任定量工作。使用SBSE技术,对10个样品的检测结果重复性在12%到20%之间。土壤的提取主要是使用有机溶剂,如二氯甲烷,因为水提取物不能用于随后的气相色谱分析。使用SBSE技术,水萃取是可能的,因为Twister搅拌棒可以从水溶液中萃取溶解的化合物,随后通过热脱附将样品引入GC系统。下图是对四种土壤(壤土,粘性壤土,粉沙和中沙)在不同的处理条件下,使用SBSE及LE方法的萃取结果比较[4]。总体而言,SBSE与LLE的结果接近,但是使用SBSE技术,检测到土壤中的PAH浓度要略高于LLE,也就是说,灵敏度更高。SBSE不需要溶剂,是绿色的萃取技术,也更加经济。对四种土壤(壤土,粘性壤土,粉沙和中沙)在不同的处理条件下,使用SBSE及LE方法的萃取结果比较参考文献:[1] P. Popp, C. Bauer, B. Hauser, P. Keil, L. Wennrich, Extraction of polycyclic aromatichydrocarbons and organochlorine compounds from water: A comparison betweensolid-phase microextraction and stir bar sorptiveextraction,J. Sep. Sci. 26 (2003) 961-967[2] Gerstel AppNote: 08/2001[3] O. Krüger ∗, G. Christoph, U. Kalbe, W. Berger,Comparison of stir bar sorptive extraction (SBSE) and liquid–liquid extraction(LLE) for the analysis of polycyclic aromatic hydrocarbons (PAH) in complexaqueous matrices,Talanta 85 (2011) 1428–1434
确定


还剩12页未读,是否继续阅读?

产品配置单
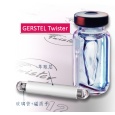
GERSTEL(哲斯泰)为您提供《土壤,水中多环芳烃检测方案(其它萃取设备)》,该方案主要用于环境水(除海水)中有机污染物检测,参考标准--,《土壤,水中多环芳烃检测方案(其它萃取设备)》用到的仪器有GERSTEL 搅拌棒Twister (萃取、固相微萃取)、GERSTEL热脱附单元TDU2 (热解吸,热解析)
推荐专场
固相微萃取仪、固相微萃取装置
更多
相关方案
更多
该厂商其他方案
更多