


采用LaVision公司的形变应变测量系统StrainMaster对Bern大学构造模拟实验室里研究分析正交和旋转延展现象的相似模拟实验对象,构造沙箱模型进行了数字图像相关测量和分析。提供了实验测量结果和数据。
方案详情

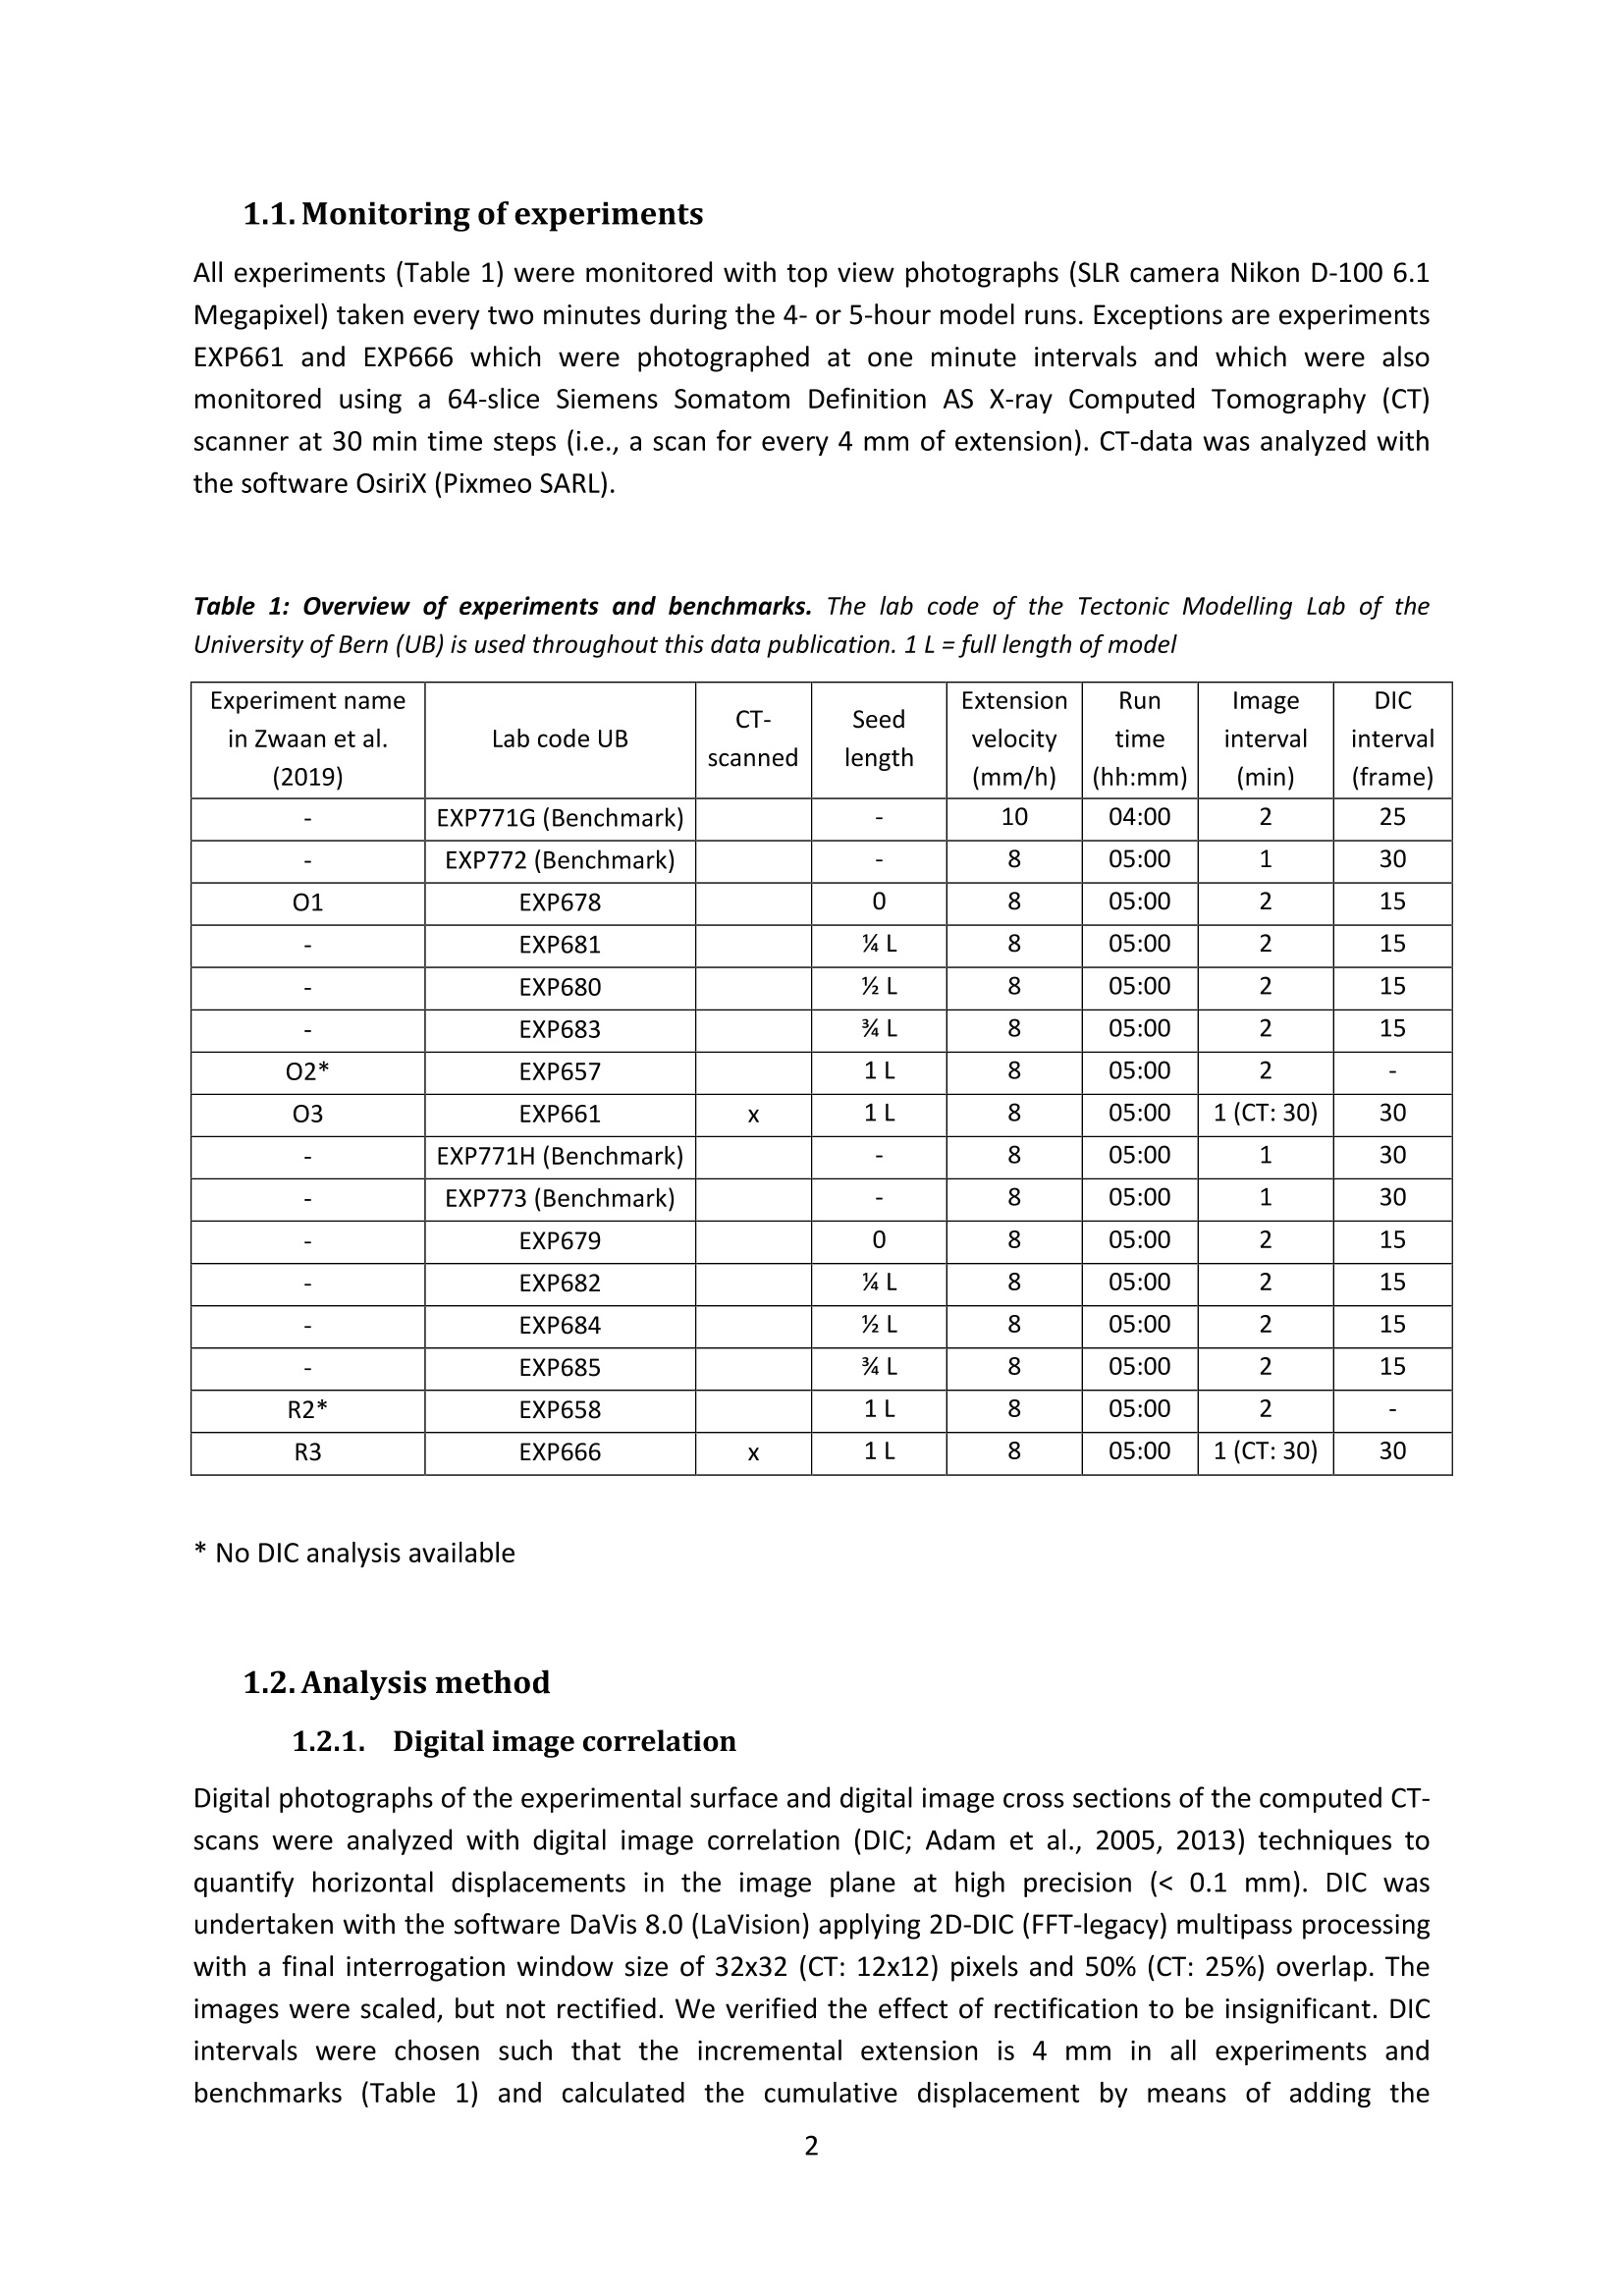
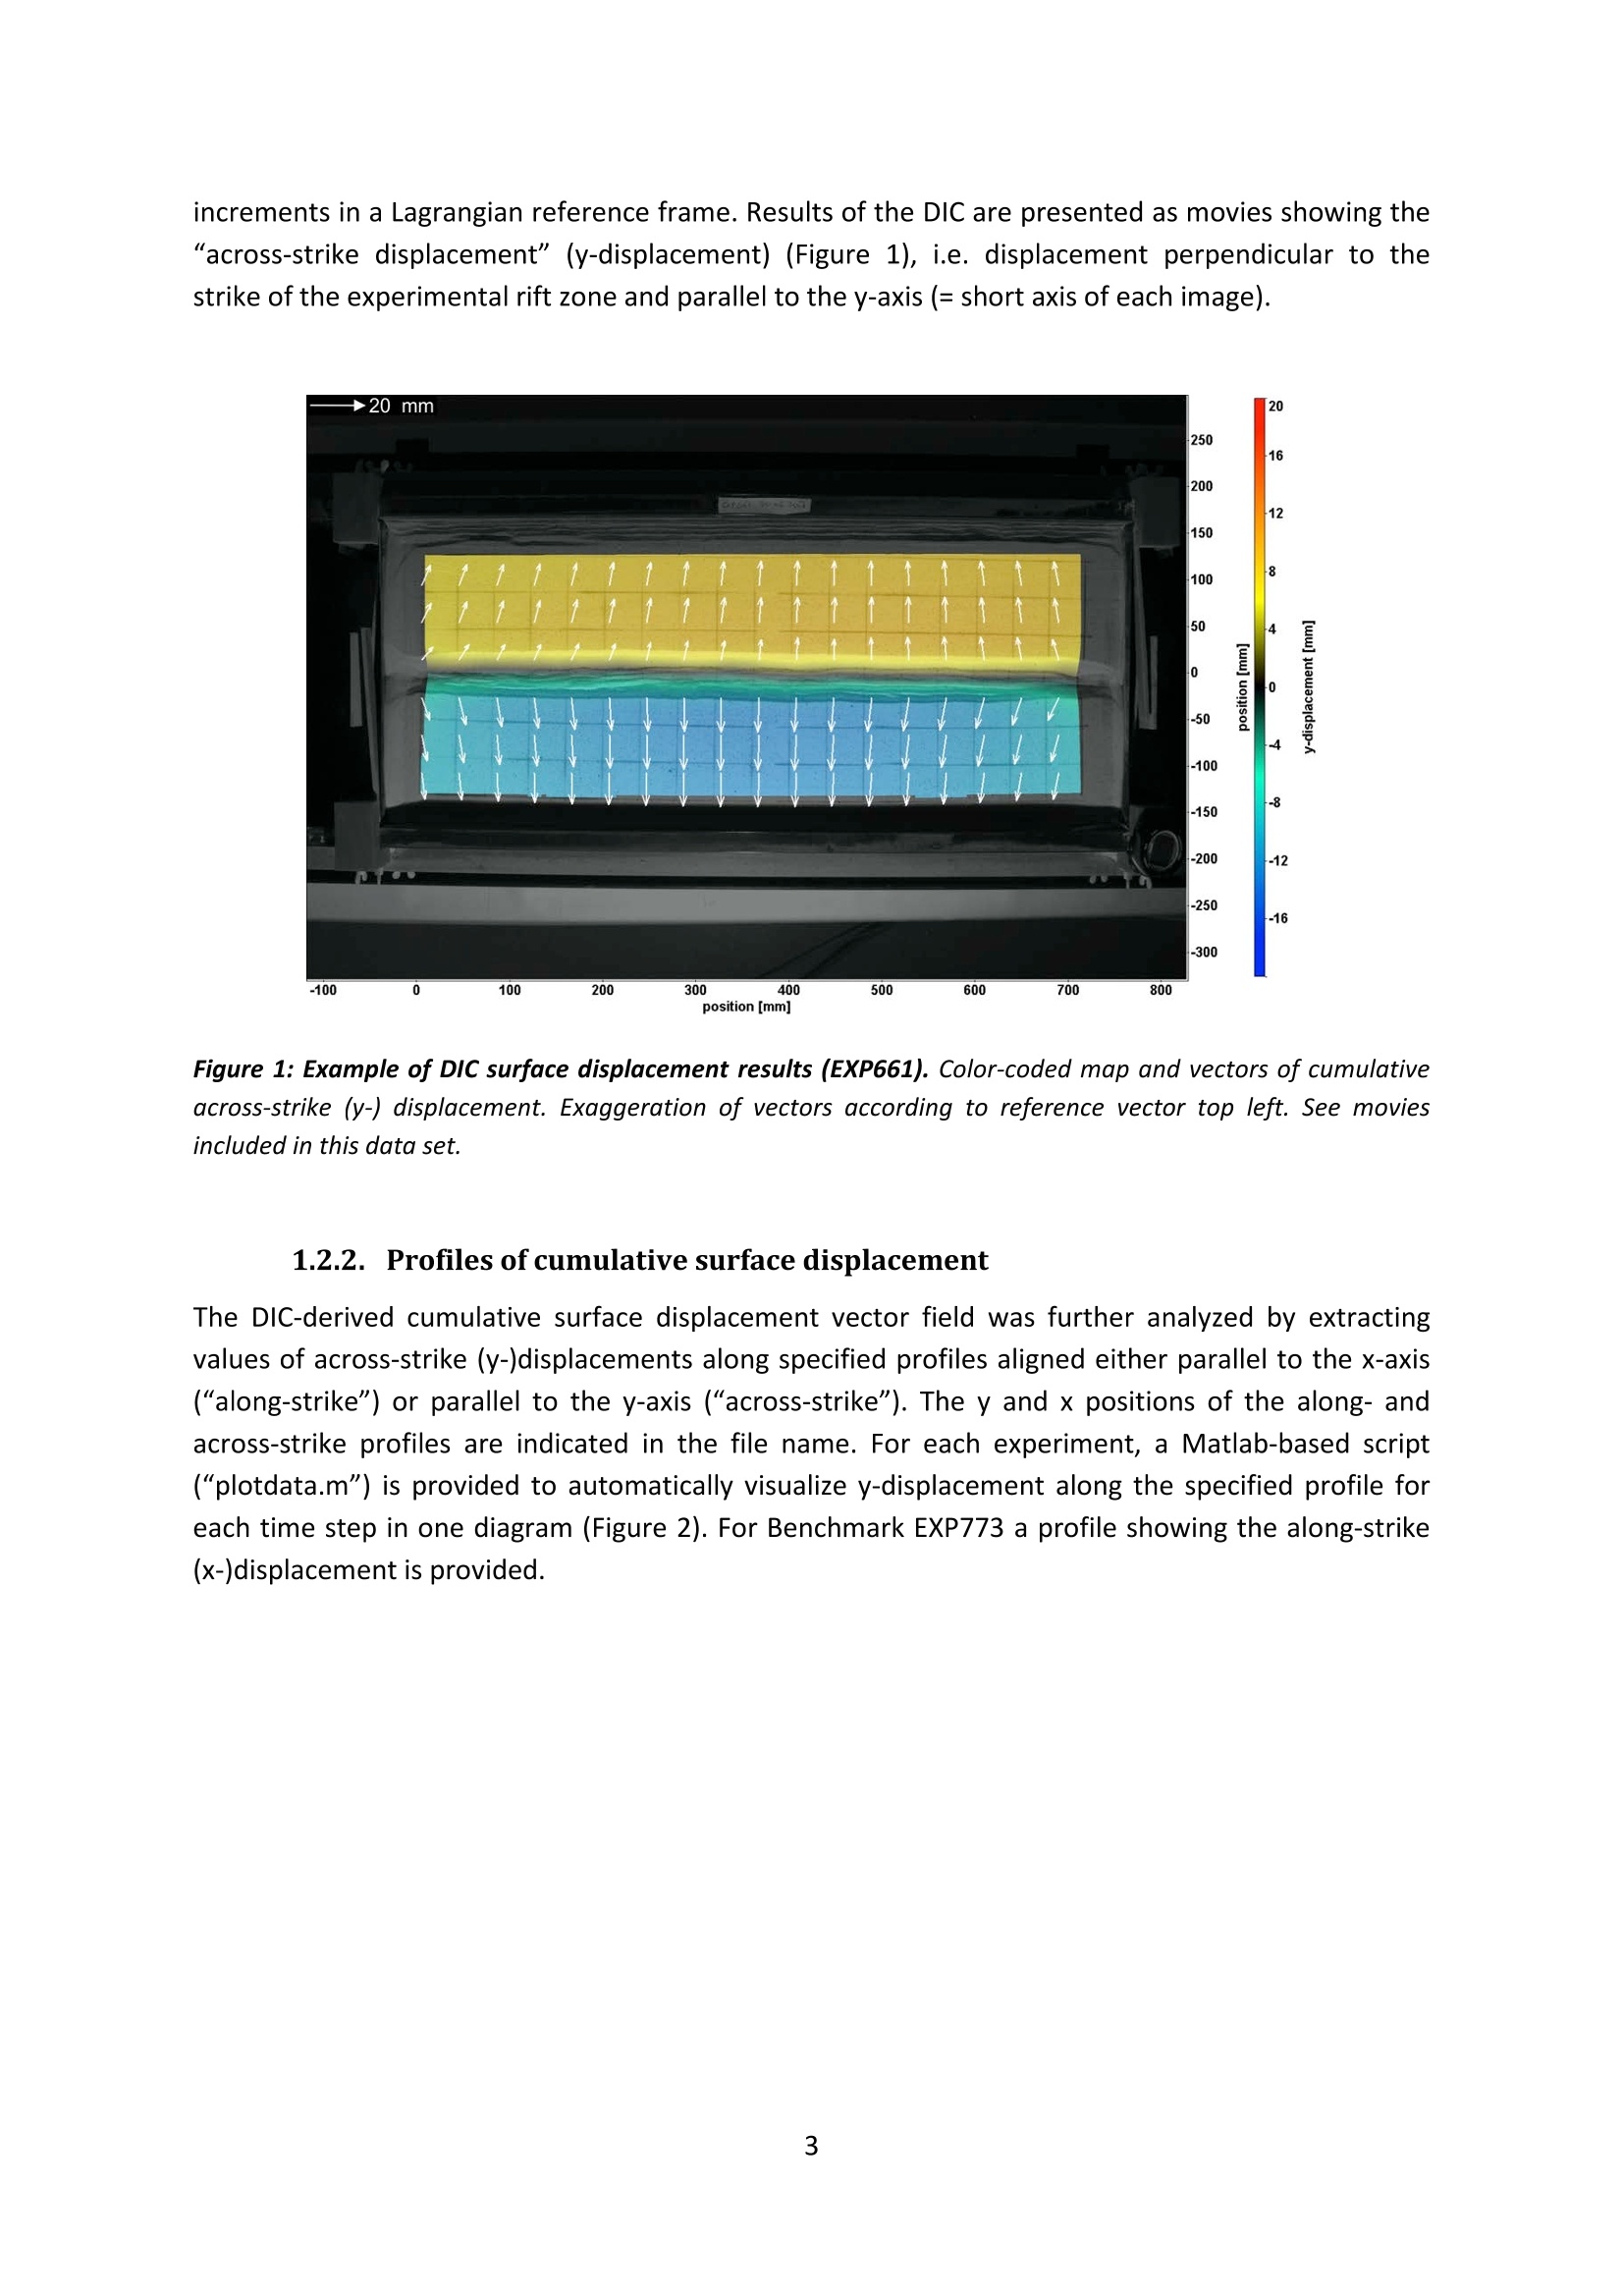
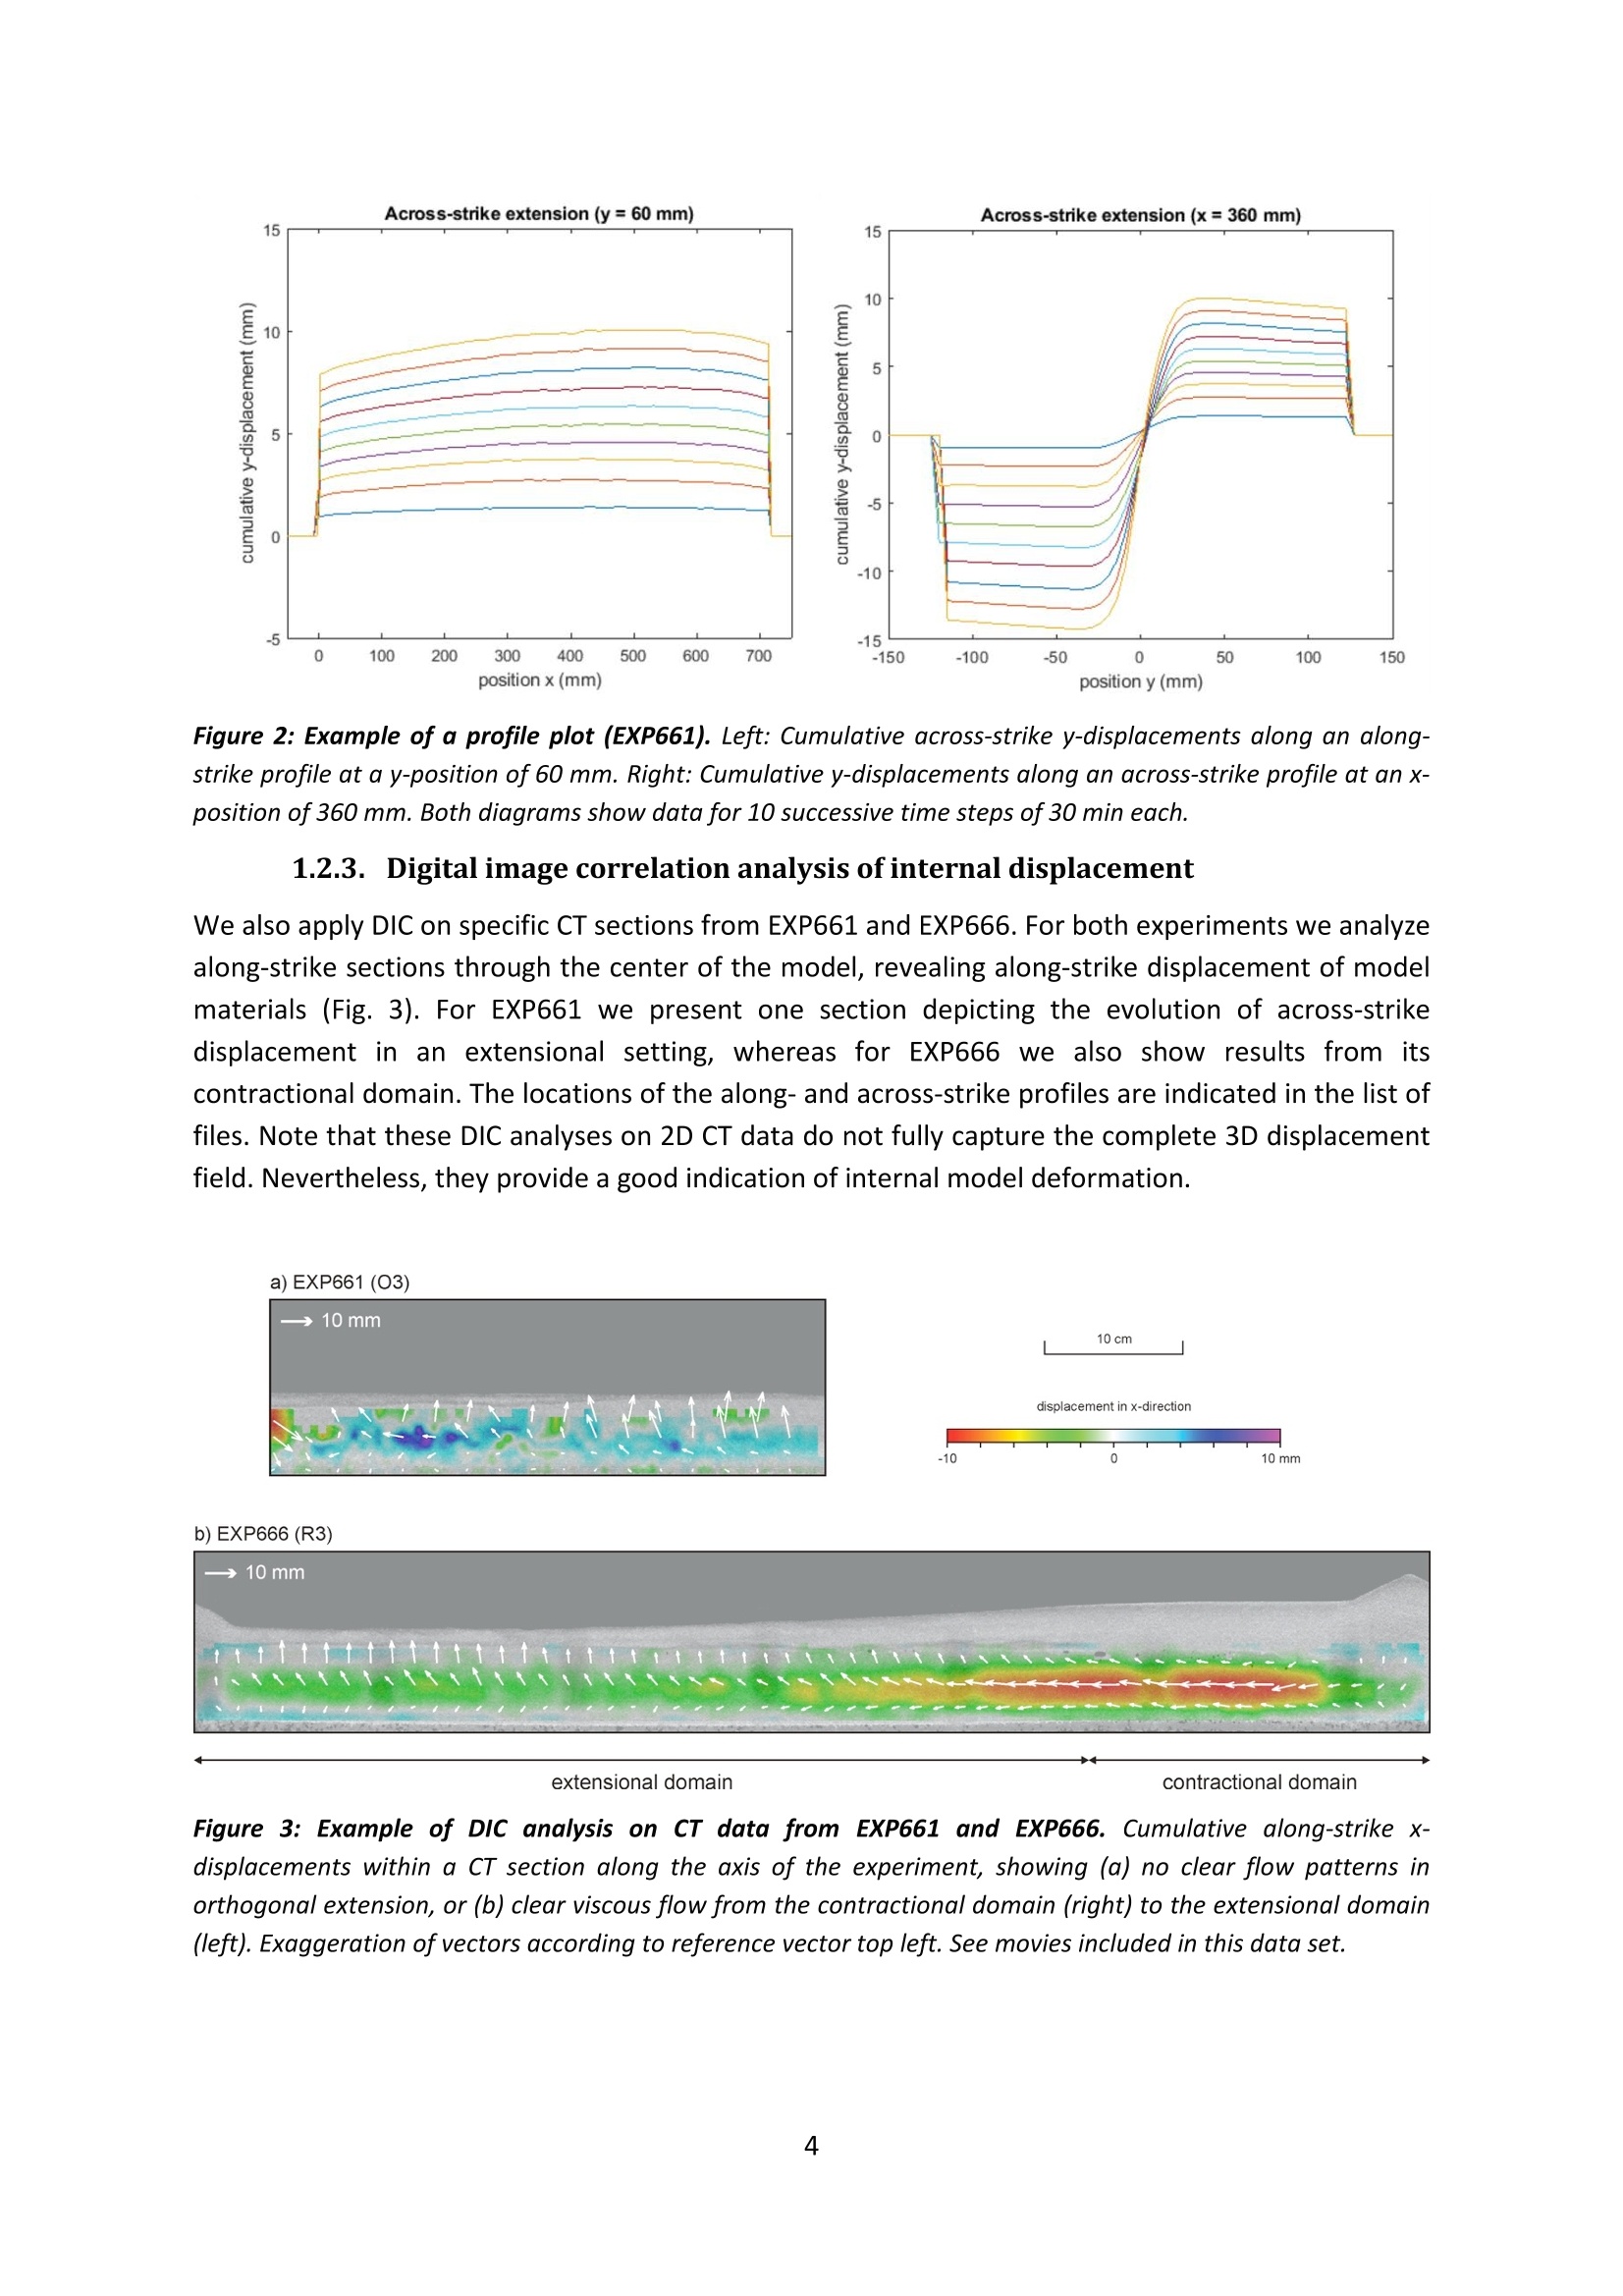
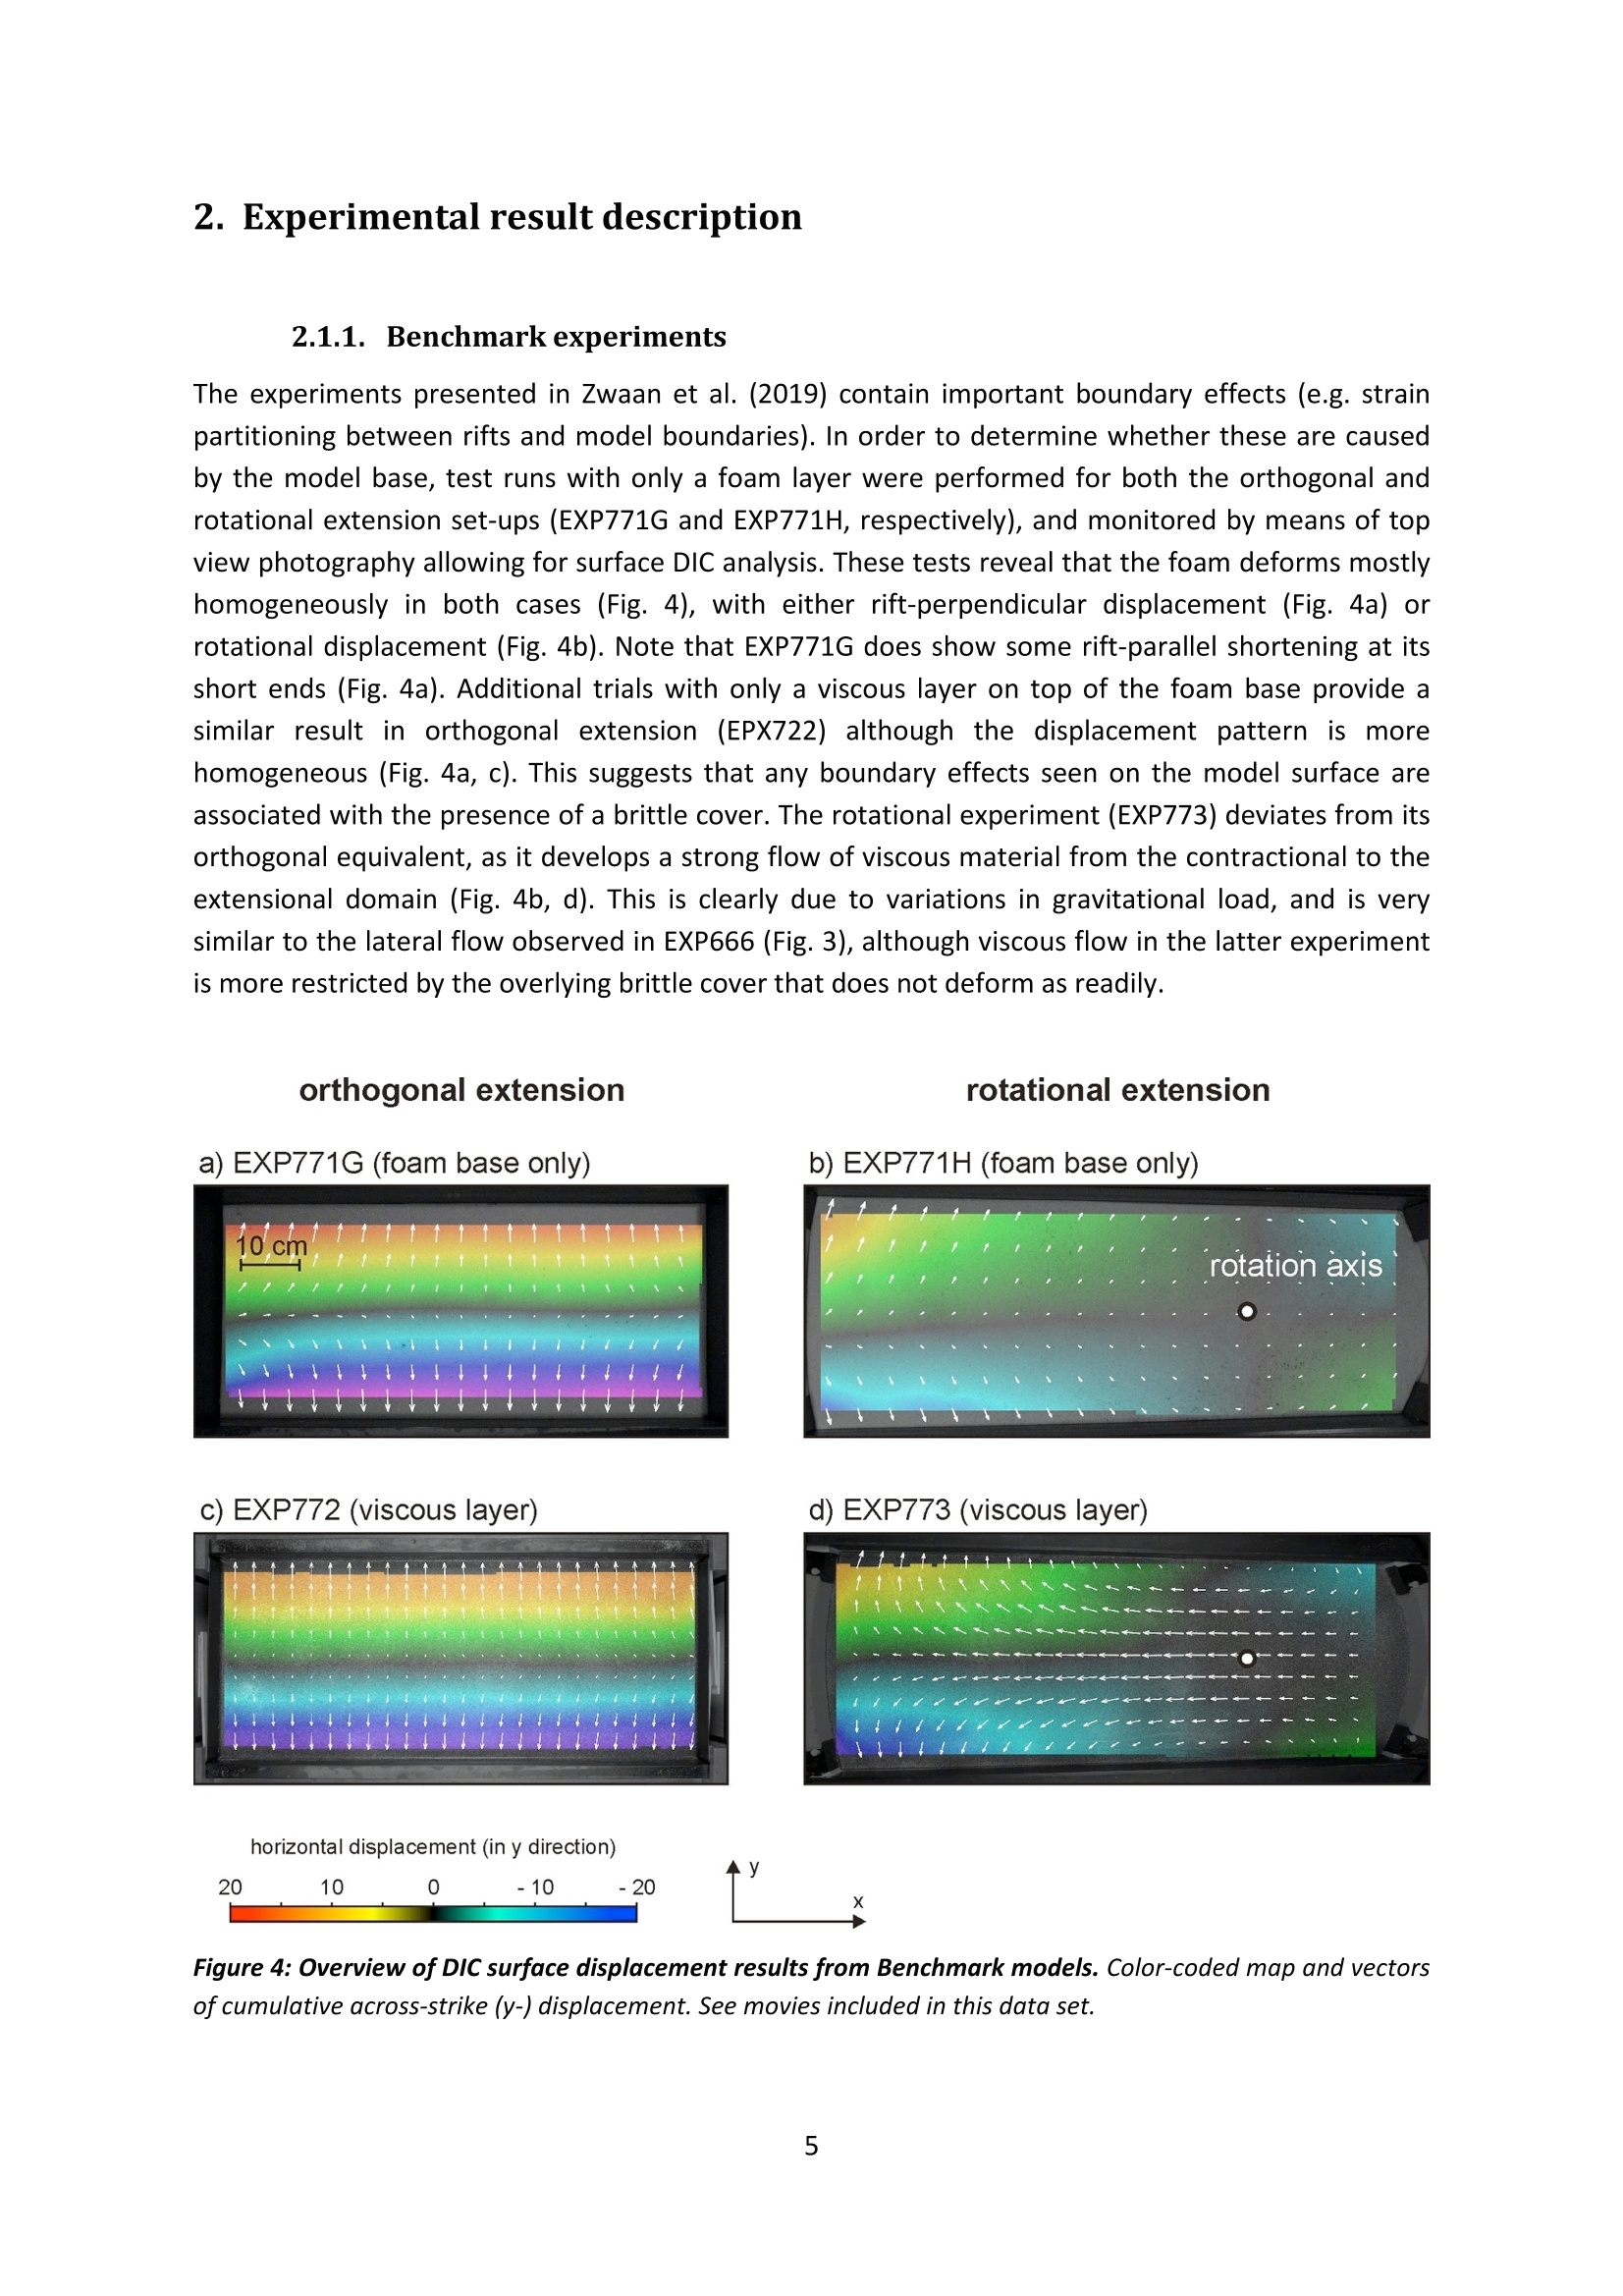
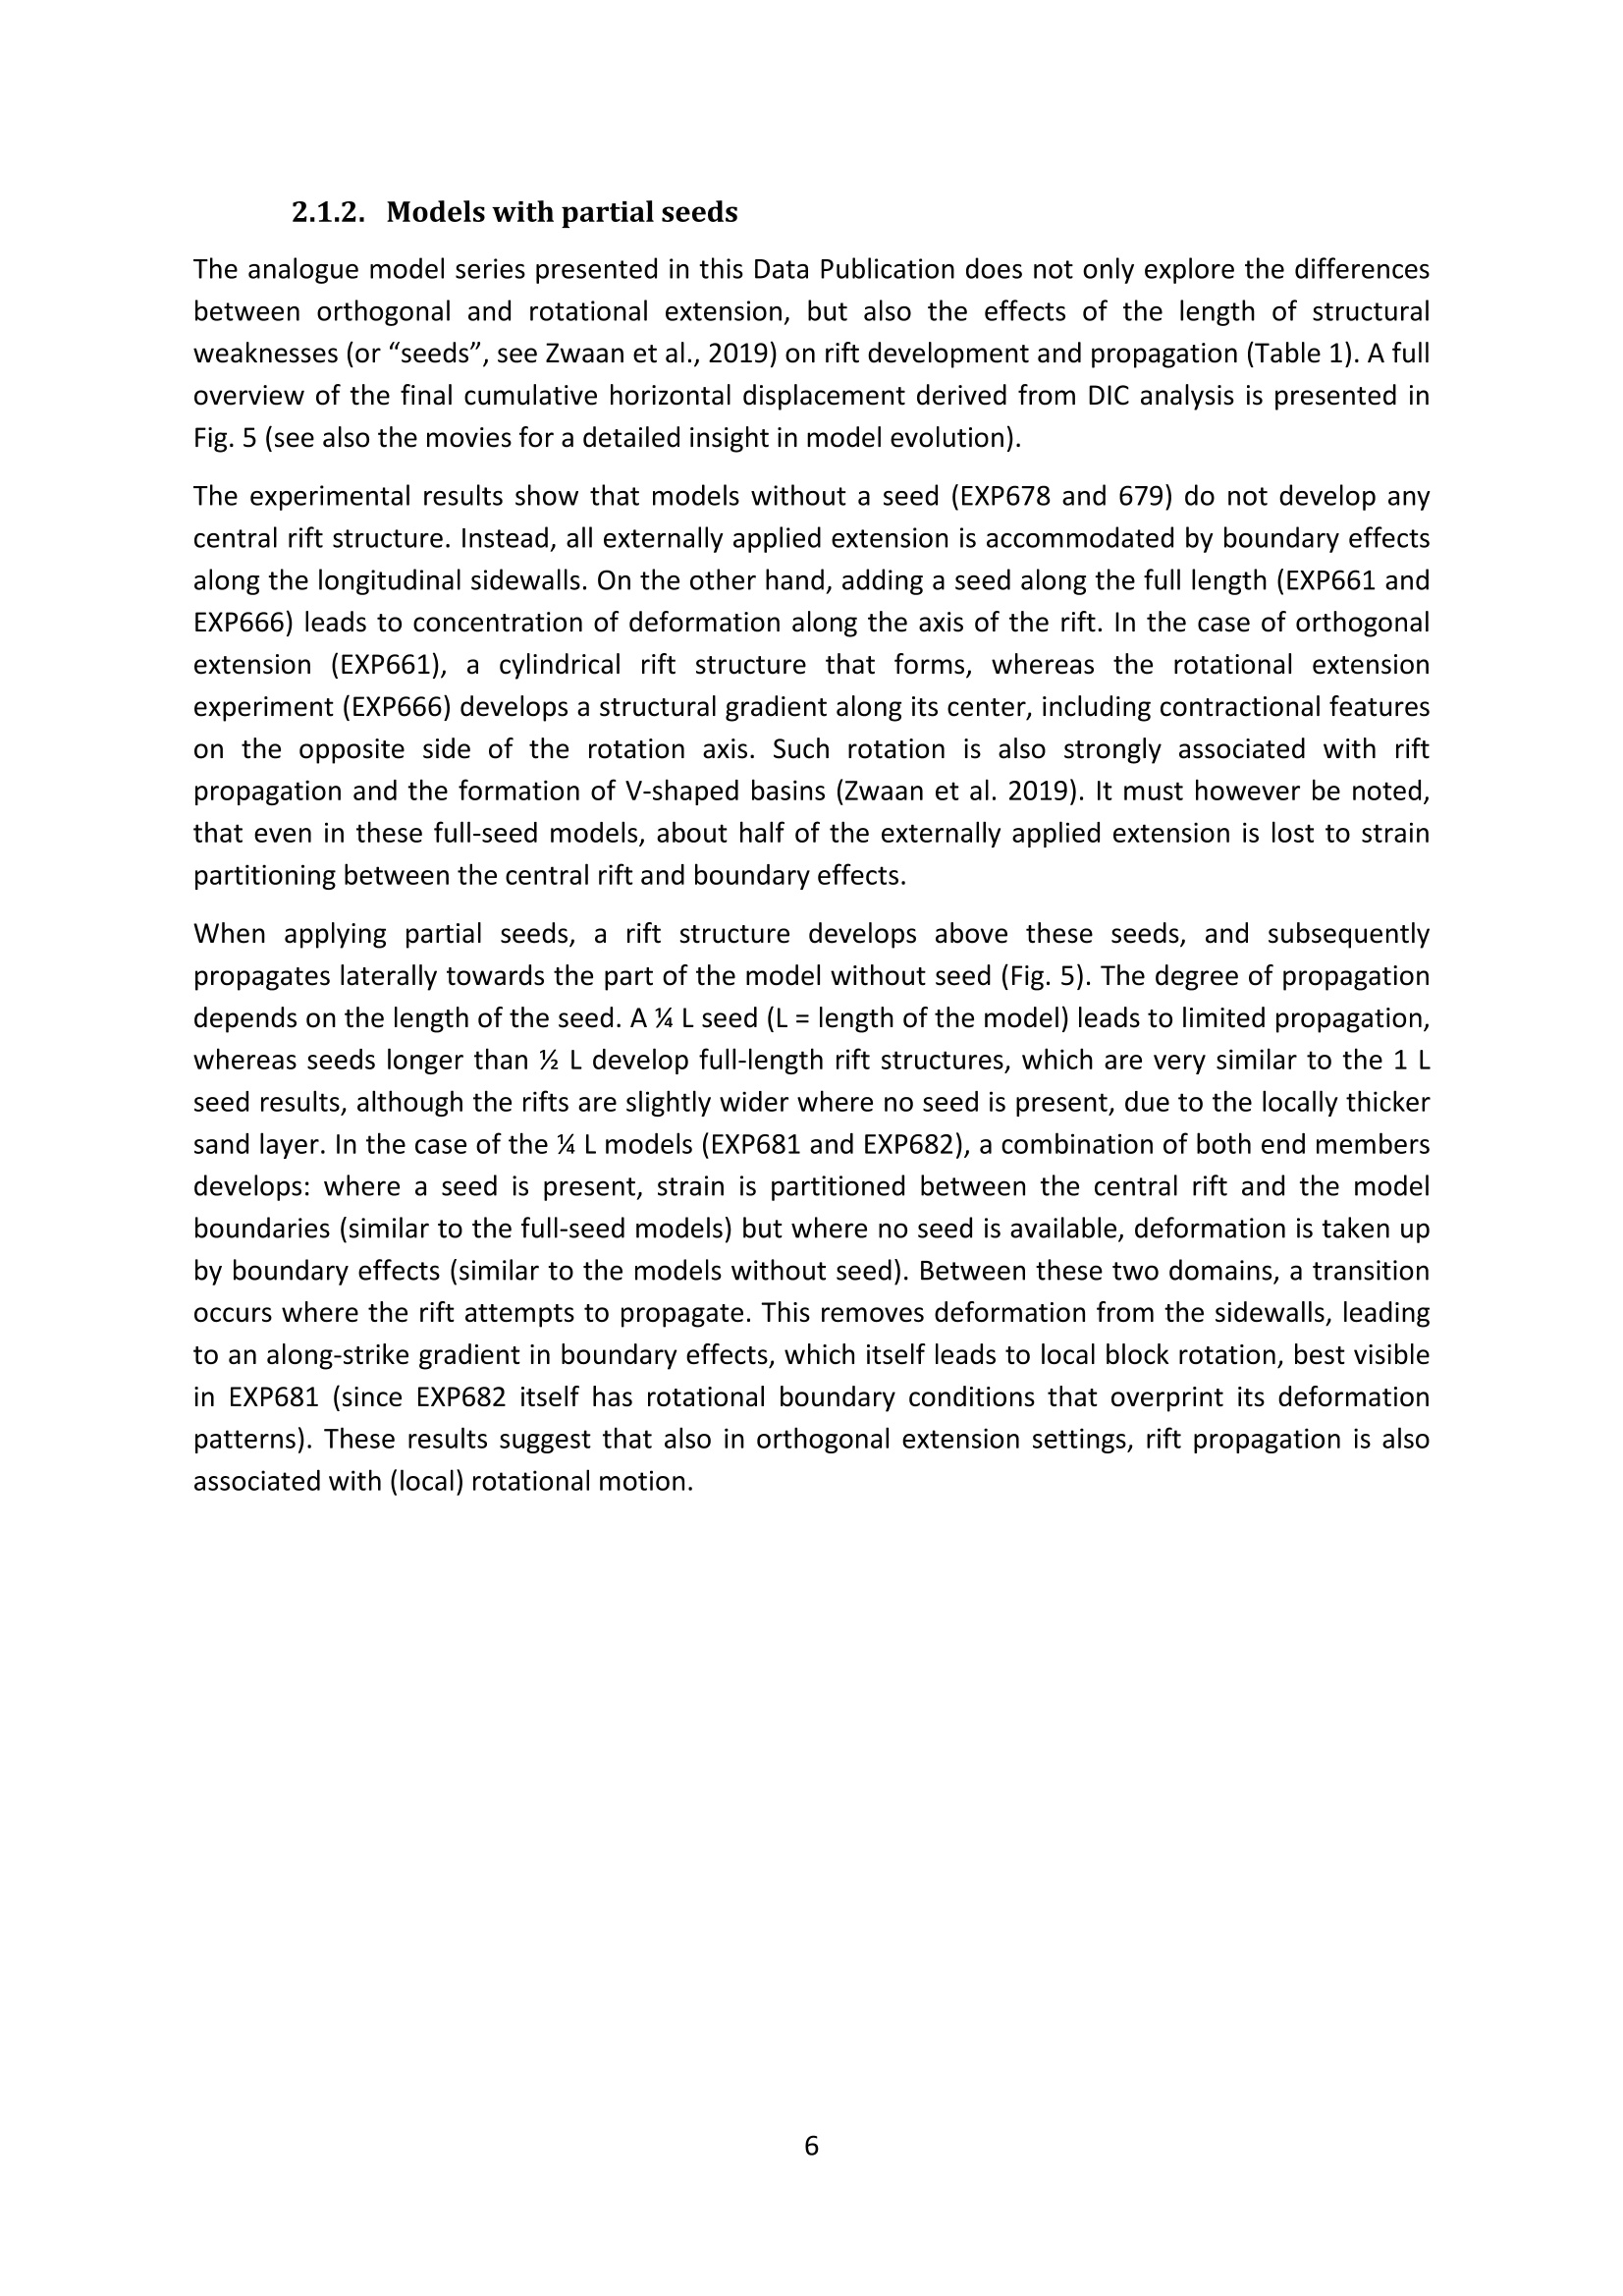
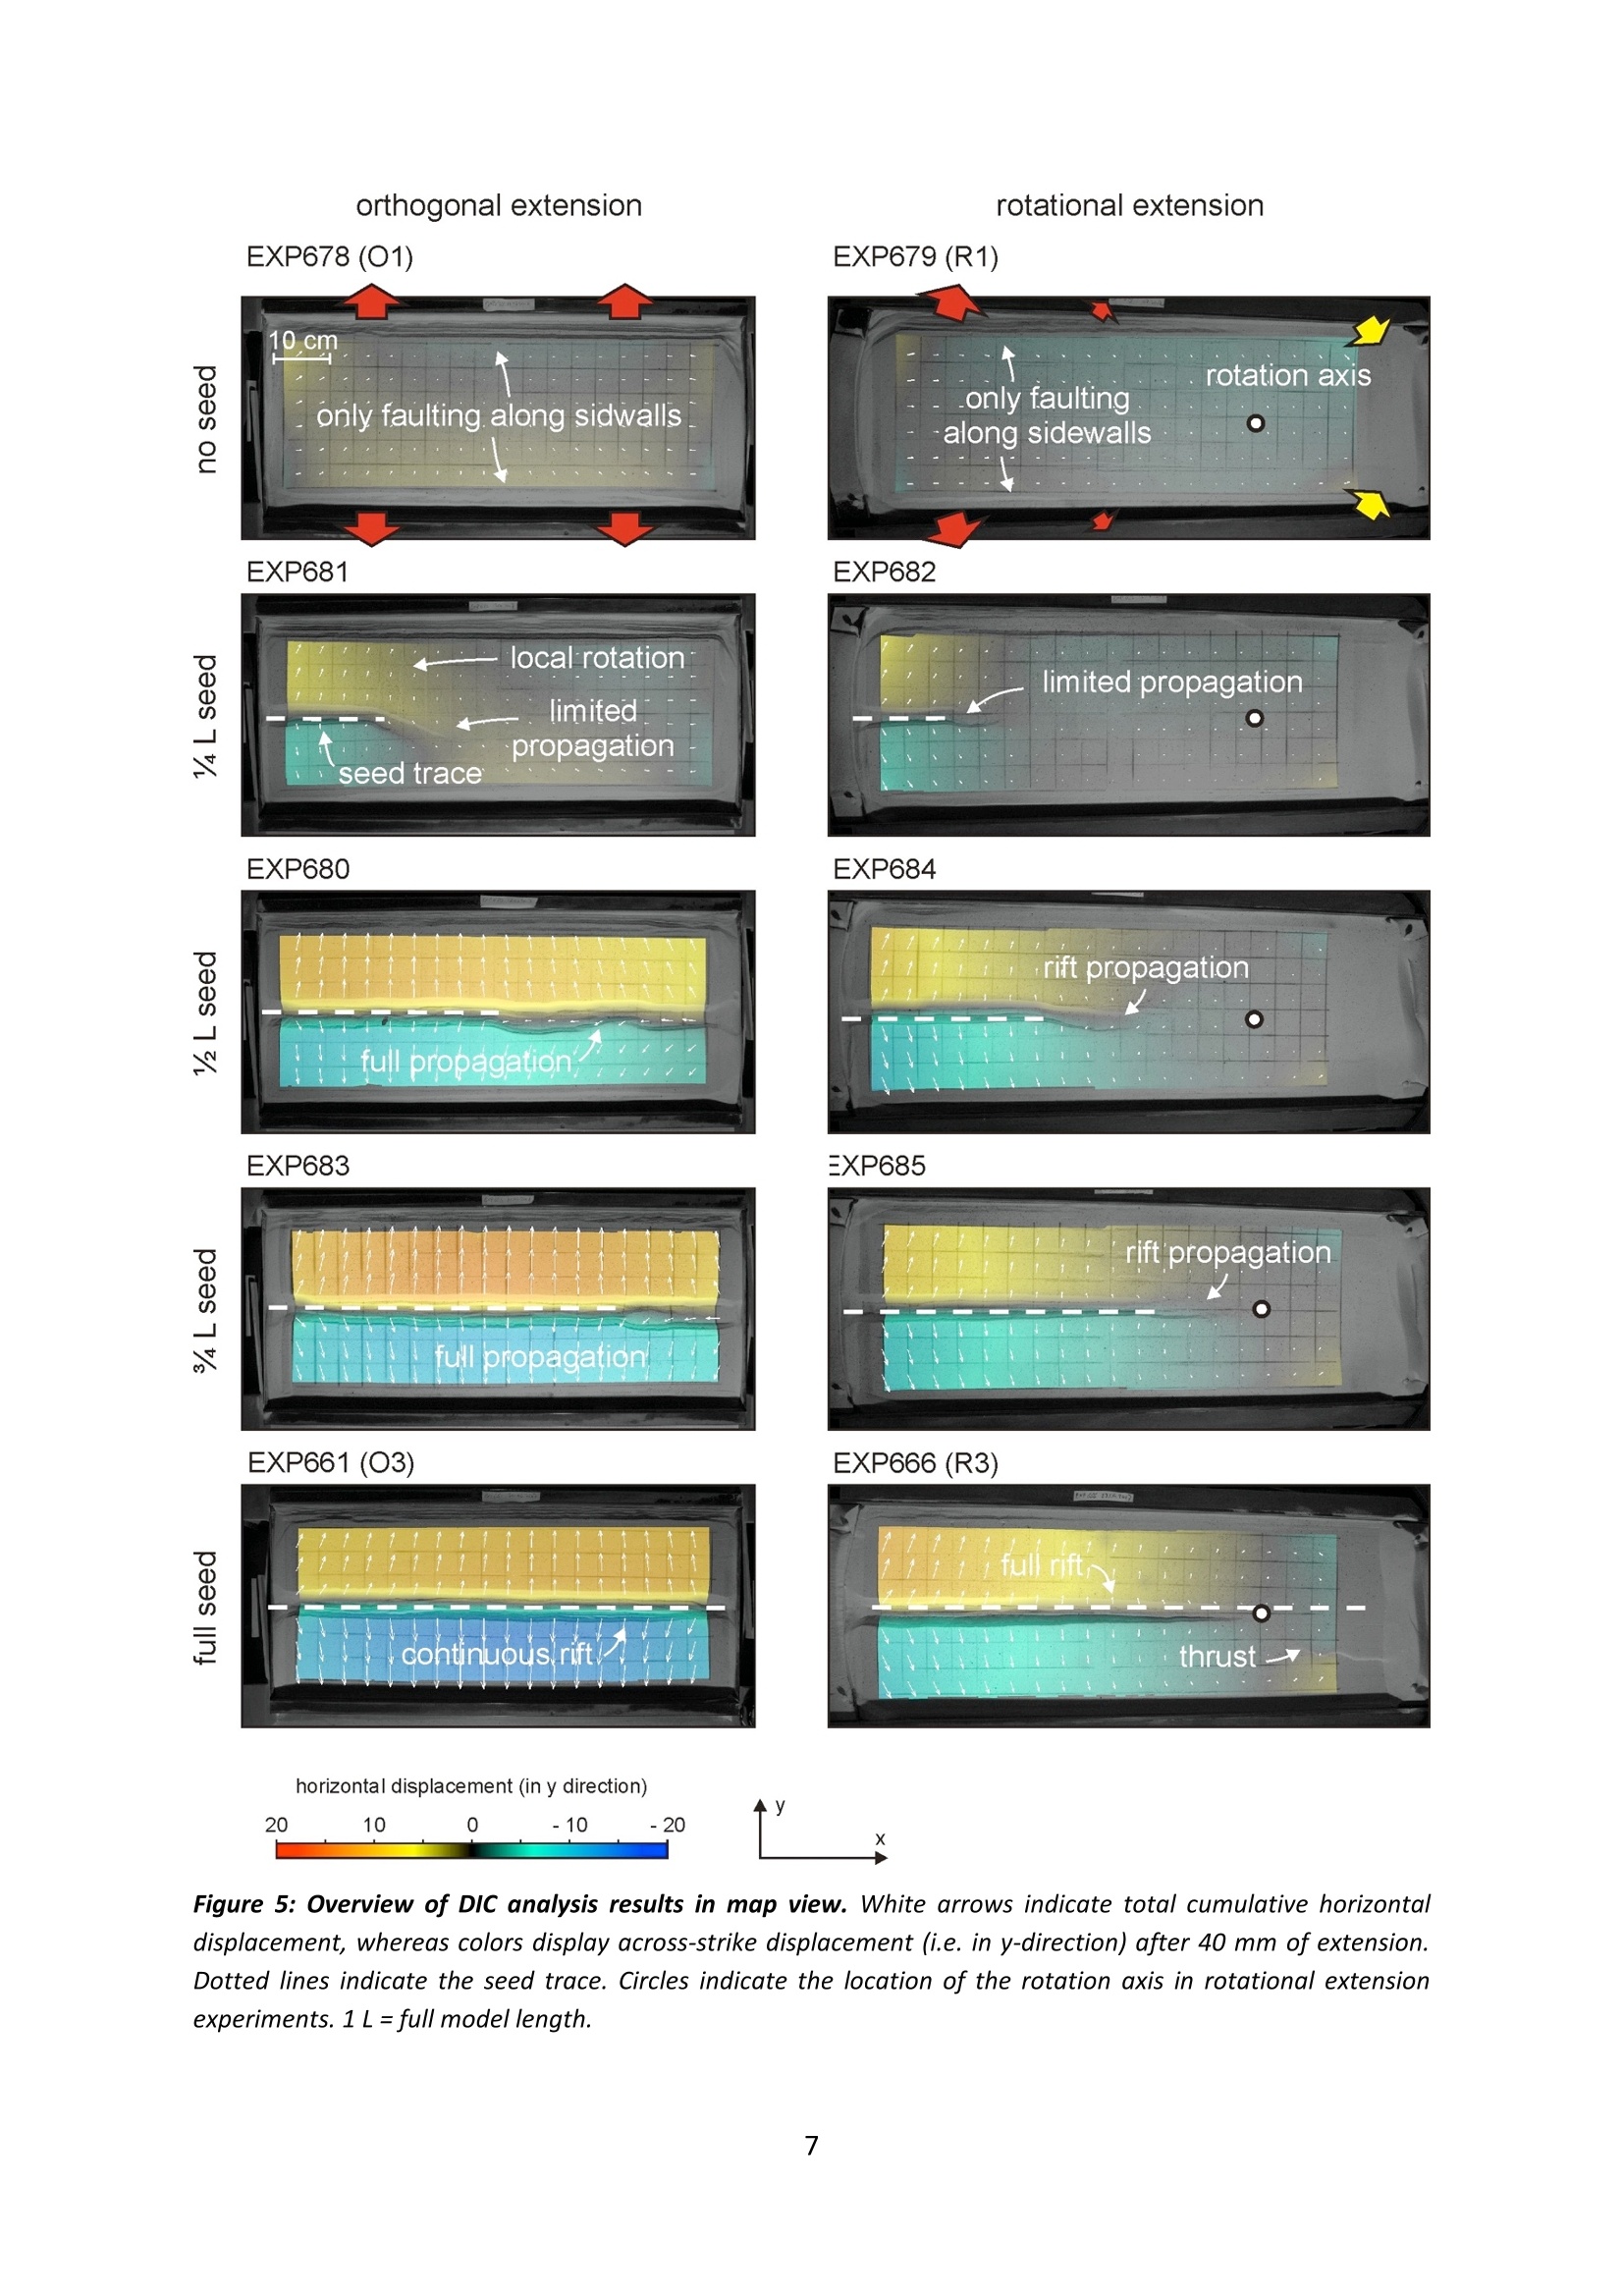
Digital image correlation data from analogue modellingexperimentsaddressing orthogonalandrotationalextension at the Tectonic Modelling Lab of the Universityof Bern (CH) (http://doi.org/10.5880/FIDGEO.2020.001) Frank Zwaan, Guido Schreurs,Timothy Schmid, Michael Warsitzka, Matthias Rosenau’ 1. Dipartimento di Scienze della Terra, Universita di Studi di Firenze, Florence, Italy 2. Institute of Geological Sciences, University of Bern, Switzerland 3. GFZ German Research Centre for Geosciences, Potsdam, Germany *Corresponding author: rosen@gfz-potsdam.de License Creative Commons Attribution 4.0 International License (CC BY 4.0) Citation When using the data please cite: Zwaan, Frank; Schreurs, Guido; Schmid, Timothy; Warsitzka, Michael; Rosenau, Matthias (2020):Digital image correlation data from analogue modelling experiments addressing orthogonal androtational extension at the Tectonic Modelling Lab of the University of Bern (CH). GFZ Data Services.http://doi.org/10.5880/FIDGEO.2020.001 The data are supplementary material to: Zwaan, Frank; Schreurs, Guido; Rosenau, Matthias (2019): Rift propagation in rotational versusorthogonal extension: Insights from4D analogue models. Journal of Structural Geology.https://doi.org/10.1016/j.jsg.2019.103946 1. Data Description This data set includes the results of digital image correlation of ten brittle-viscous experiments oncrustal extension and four benchmarks performed at the Tectonic Modelling Lab of the University ofBern (UB). The experiments demonstrate the differences in rift development in orthogonal versusrotation extension..Detailed descriptions of the experiments and monitoring techniques can befound in Zwaan et al. (2019) to which this data set is supplementary. Additional backgroundinformation concerning the general modelling approach are available in Zwaan et al. (2016). The datapresented hhere consist of movies displaying the analogue model surface with the lateraldisplacement field and profiles of the lateral cumulative displacements. 1.1.Monitoring of experiments All experiments (Table 1) were monitored with top view photographs (SLR camera Nikon D-100 6.1Megapixel) taken every two minutes during the 4- or 5-hour model runs. Exceptions are experimentsEXP661 and EXP666 which were photographed at one minute intervals and which were alsomonitored using a 64-slice Siemens Somatom Definition AS X-ray Computed Tomography (CT)scanner at 30 min time steps (i.e., a scan for every 4 mm of extension). CT-data was analyzed withthe software OsiriX (Pixmeo SARL). Table 1: Overview of experiments and benchmarks. The lab code of the Tectonic Modelling Lab of theUniversity of Bern (UB) is used throughout this data publication. 1 L= full length of model Experiment namein Zwaan et al.(2019) Lab code UB CT-scanned Seedlength Extensionvelocity (mm/h) Run time (hh:mm) Image interval (min) DIC interval(frame) - EXP771G (Benchmark) - 10 04:00 2 25 - EXP772 (Benchmark) - 8 05:00 1 30 01 EXP678 0 8 05:00 2 15 - EXP681 4L 8 05:00 2 15 - EXP680 L 8 05:00 2 15 - EXP683 %L 8 05:00 2 15 02* EXP657 1L 8 05:00 2 - O3 EXP661 X 1L 8 05:00 1 (CT: 30) 30 - EXP771H (Benchmark) - 8 05:00 1 30 - EXP773 (Benchmark) - 8 05:00 1 30 EXP679 0 8 05:00 2 15 - EXP682 %L 8 05:00 2 15 - EXP684 L 8 05:00 2 15 - EXP685 %L 8 05:00 2 15 R2* EXP658 1L 8 05:00 2 - R3 EXP666 X 1L 8 05:00 1 (CT: 30) 30 * No DIC analysis available 1.2. Analysis method 1.2.1.L.D1igital image correlation Digital photographs of the experimental surface and digital image cross sections of the computed CT-scans were analyzed with digital image correlation (DIC; Adam et al., 2005, 2013) techniques toquantify horizontal displacements in the image plane at high precision (<0.1 mm). DIC wasundertaken with the software DaVis 8.0 (LaVision) applying 2D-DIC (FFT-legacy) multipass processingwith a final interrogation window size of 32x32 (CT: 12x12) pixels and 50% (CT: 25%) overlap. Theimages were scaled, but not rectified. We verified the effect of rectification to be insignificant. DICintervals were chosen such that the incremental extension is 4 mm in all experiments andbenchmarks (Table 1) and calculated the cumulative displacement by means of adding the increments in a Lagrangian reference frame. Results of the DIC are presented as movies showing the“across-strike displacement”(y-displacement) (Figure 1), i.e. displacement perpendicular to thestrike of the experimental rift zone and parallel to the y-axis (= short axis of each image). EE> Figure 1: Example of DIC surface displacement results (EXP661). Color-coded map and vectors of cumulativeacross-strike (y-) displacement. Exaggeration of vectors according to reference vector top left. See moviesincluded in thi data set. 1.2.2. Profiles of cumulative surface displacement The DIC-derived cumulative surface displacement vector field was further analyzed by extractingvalues of across-strike (y-)displacements along specified profiles aligned either parallel to the x-axis("along-strike") or parallel to the y-axis ("across-strike"). The y and x positions of the along-andacross-strike profiles are indicated in the file name. For each experiment, a Matlab-based script(“plotdata.m")is provided to automatically visualize y-displacement along the specified profile foreach time step in one diagram (Figure 2). For Benchmark EXP773 a profile showing the along-strike(x-)displacement is provided. Figure 2: Example of a profile plot (EXP661). Left: Cumulative across-strike y-displacements along an along-strike profile at a y-position of 60 mm. Right: Cumulativey-displacements along an across-strike profile at an x-position of 360 mm. Both diagrams show data for 10 successive time steps of 30 min each. 1.2.3. Digital image correlation analysis of internal displacement We also apply DIC on specific CT sections from EXP661 and EXP666. For both experiments we analyzealong-strike sections through the center of the model, revealing along-strike displacement of modelmaterials (Fig. 3). For EXP661 we present one section depicting the evolution of across-strikedisplacement in an extensional setting, whereas for EXP666 we also show results from itscontractional domain. The locations of the along- and across-strike profiles are indicated in the list offiles. Note that these DIC analyses on 2D CT data do not fully capture the complete 3D displacementfield. Nevertheless, they provide a good indication of internal model deformation. Figure 3: Example of DIC analysis on CT data from EXP661 and EXP666. Cumulative along-strike x-displacements within a CT section along the axis of the experiment, showing (a) no clear flow patterns inorthogonal extension, or (b) clear viscous flow from the contractional domain (right) to the extensional domain(left). Exaggeration of vectors according to reference vector top left. See movies included in this data set. 2. Experimental result description 2.1.1. Benchmark experiments The experiments presented in Zwaan et al. (2019) contain important boundary effects (e.g. strainpartitioning between rifts and model boundaries). In order to determine whether these are causedby the model base, test runs with only a foam layer were performed for both the orthogonal androtational extension set-ups (EXP771G and EXP771H, respectively), and monitored by means of topview photography allowing for surface DIC analysis. These tests reveal that the foam deforms mostlyhomogeneously in both cases (Fig. 4), with either rift-perpendicular displacement (Fig. 4a) orrotational displacement (Fig. 4b). Note that EXP771G does show some rift-parallel shortening at itsshort ends (Fig. 4a). Additional trials with only a viscous layer on top of the foam base provide asimilar result in orthogonal extension (EPX722) although the displacement pattern is morehomogeneous (Fig. 4a, c). This suggests that any boundary effects seen on the model surface areassociated with the presence of a brittle cover. The rotational experiment (EXP773) deviates from itsorthogonal equivalent, as it develops a strong flow of viscous material from the contractional to theextensional domain (Fig. 4b, d). This is clearly due to variations in gravitational load, and is verysimilar to the lateral flow observed in EXP666 (Fig.3), although viscous flow in the latter experimentis more restricted by the overlying brittle cover that does not deform as readily. orthogonal extension rotational extension a) EXP771G (foam base only) b) EXP771H (foam base only) c) EXP772 (viscous layer) d) EXP773 (viscous layer) horizontal displacement (in y direction) 4Y20 10 0 -10 -20 Figure 4:Overview of DIC surface displacement results from Benchmark models. Color-coded map and vectorsofcumulative across-strike (y-)displacement. See movies included in this data set. 2.1.2. Models with partial seeds The analogue model series presented in this Data Publication does not only explore the differencesbetween orthogonal and rotational extension, but also the effects of the length of structuralweaknesses (or“seeds", see Zwaan et al., 2019) on rift development and propagation (Table 1). A fulloverview of the final cumulative horizontal displacement derived from DIC analysis is presented inFig. 5 (see also the movies for a detailed insight in model evolution). The experimental results show that models without a seed (EXP678 and 679) do not develop anycentral rift structure. Instead, all externally applied extension is accommodated by boundary effectsalong the longitudinal sidewalls. On the other hand, adding a seed along the full length (EXP661 andEXP666) leads to concentration of deformation along the axis of the rift. In the case of orthogonalextension (EXP661), a cylindrical rift structure that forms, whereas the rotational extensionexperiment (EXP666) develops a structural gradient along its center, including contractional featureson the opposite side of the rotation axis. Such rotation is also strongly associated with riftpropagation and the formation of V-shaped basins (Zwaan et al.2019). It must however be noted,that even in these full-seed models, about half of the externally applied extension is lost to strainpartitioning between the central rift and boundary effects. When applying partial seeds, a rift structure develops above these seeds, and subsequentlypropagates laterally towards the part of the model without seed (Fig. 5). The degree of propagationdepends on the length of the seed. A 1 L seed (L=length of the model) leads to limited propagation,whereas seeds longer than %L develop full-length rift structures, which are very similar to the 1 Lseed results, although the rifts are slightly wider where no seed is present, due to the locally thickersand layer. In the case of the %L models (EXP681 and EXP682), a combination of both end membersdevelops: where a seed is present, strain is partitioned between the central rift and the modelboundaries (similar to the full-seed models) but where no seed is available, deformation is taken upby boundary effects (similar to the models without seed). Between these two domains, a transitionoccurs where the rift attempts to propagate. This removes deformation from the sidewalls, leadingto an along-strike gradient in boundary effects, which itself leads to local block rotation, best visiblein EXP681 (since EXP682 itself has rotational boundary conditions that overprint its deformationpatterns). These results suggest that also in orthogonal extension settings, rift propagation is alsoassociated with (local) rotational motion. Figure 5: Overview of DIC analysis results in map view. White arrows indicate total cumulative horizontaldisplacement, whereas colors display across-strike displacement (i.e. in y-direction) after 40 mm of extension.Dotted lines indicate the seed trace. Circles indicate the location of the rotation axis in rotational extensionexperiments. 1L= full modellength. 3. File description For each of the 10 experiments and four benchmarks we provide: Movies of surface deformation (avi format) Data of cumulative along-strike and across-strike profiles of surface-displacement (prmformat) Movies of internal deformation (avi format)M Matlab-script for plotting the profile data Images of the plotted profile data (bmp format) An overview of all files of the data set is given in the List of Files. For all experiments, movies showcumulative y-displacement of the experimental surface (“Lab code UB_DIC_cum.avi"). For the twoexperiments monitored with the CT-scanner, an additional movie is provided showing thedisplacement field in the across-strike cross sections of the CT-derived imagery. Profile data andcorresponding Matlab-scripts are stored in subfolders (“Lab code UB_DIC_cum_profiles"). The nameof the basic profile data (e.g.“EXP661_Cum30_2D-DIC_TS_MP(1x32x32_50ov)_Vy_x360-y-t.prm")contains information about the DIC parameters (e.g. MP(1x32x32_50ov): interrogation 2D windowsize: 32x32; 50% overlap, Vy: y-component of displacement vector, x360: x-position of the profile).The profile data file is structured as shown in Table 2. Table 2: Example of profile data file (EXP661). For each profile shown in the diagram, the profile position andvalues of the y-displacement are listed in two columns. %position/mm y-displacement/mm position/mm y-displacement/mm m.. 298.825989 0.000000 298.825989 0.000000 ... 293.782501 0.000000 293.782501 0.000000 ... ... ... amm ... ... 4. References Adam, J., Klinkmuller, M., Schreurs, G. & Wieneke, B. (2013). Quantitative 3D strain analysis inanalogue experiments simulating tectonic deformation: Integration of X-ray computedtomography and digital volume correlation techniques. Journal of Structural Geology, 55,127-149, https://doi.org/10.1016/j.jsg.2013.07.011 Adam,J., Urai, J. L., Wieneke, B., Oncken, O., Pfeiffer, K., Kukowski,N., Lohrmann, J.,Hoth,S., van derZee, W & Schmatz,J. (2005). Shear localisation and strain distribution during tectonic faulting- New insights from granular-flow experiments and high-resolution optical image correlationtechniques. Journal of Structural Geology, 27(2), 283-301,https://doi.org/10.1016/j.jsg.2004.08.008 Zwaan, F., Schreurs, G., Naliboff, J. & Buiter, S.J. H., 2016. Insights into the effects of obliqueextension on continental rift interaction from3D analogue and numericalmodels.Tectonophysics, 693, 239-260,https://doi.org/10.1016/j.tecto.2016.02.036 Zwaan, F., Schreurs, G. & Rosenau, M. (2019). Rift development and propagation under orthogonalversus rotational extensionnconditions asobserved in 4Danalogue modelshttps://doi.org/10.1016/j.jsg.2019.103946 This data set includes the results of digital image correlation of ten brittle-viscous experiments on crustal extension and four benchmarks performed at the Tectonic Modelling Lab of the University of Bern (UB). The experiments demonstrate the differences in rift development in orthogonal versus rotation extension. Detailed descriptions of the experiments and monitoring techniques can be found in Zwaan et al. (2019) to which this data set is supplementary. Additional background information concerning the general modelling approach are available in Zwaan et al. (2016). The data presented here consist of movies displaying the analogue model surface with the lateral displacement field and profiles of the lateral cumulative displacements.
确定
还剩6页未读,是否继续阅读?

产品配置单


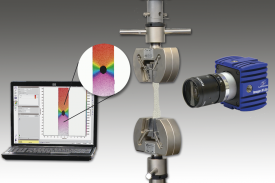
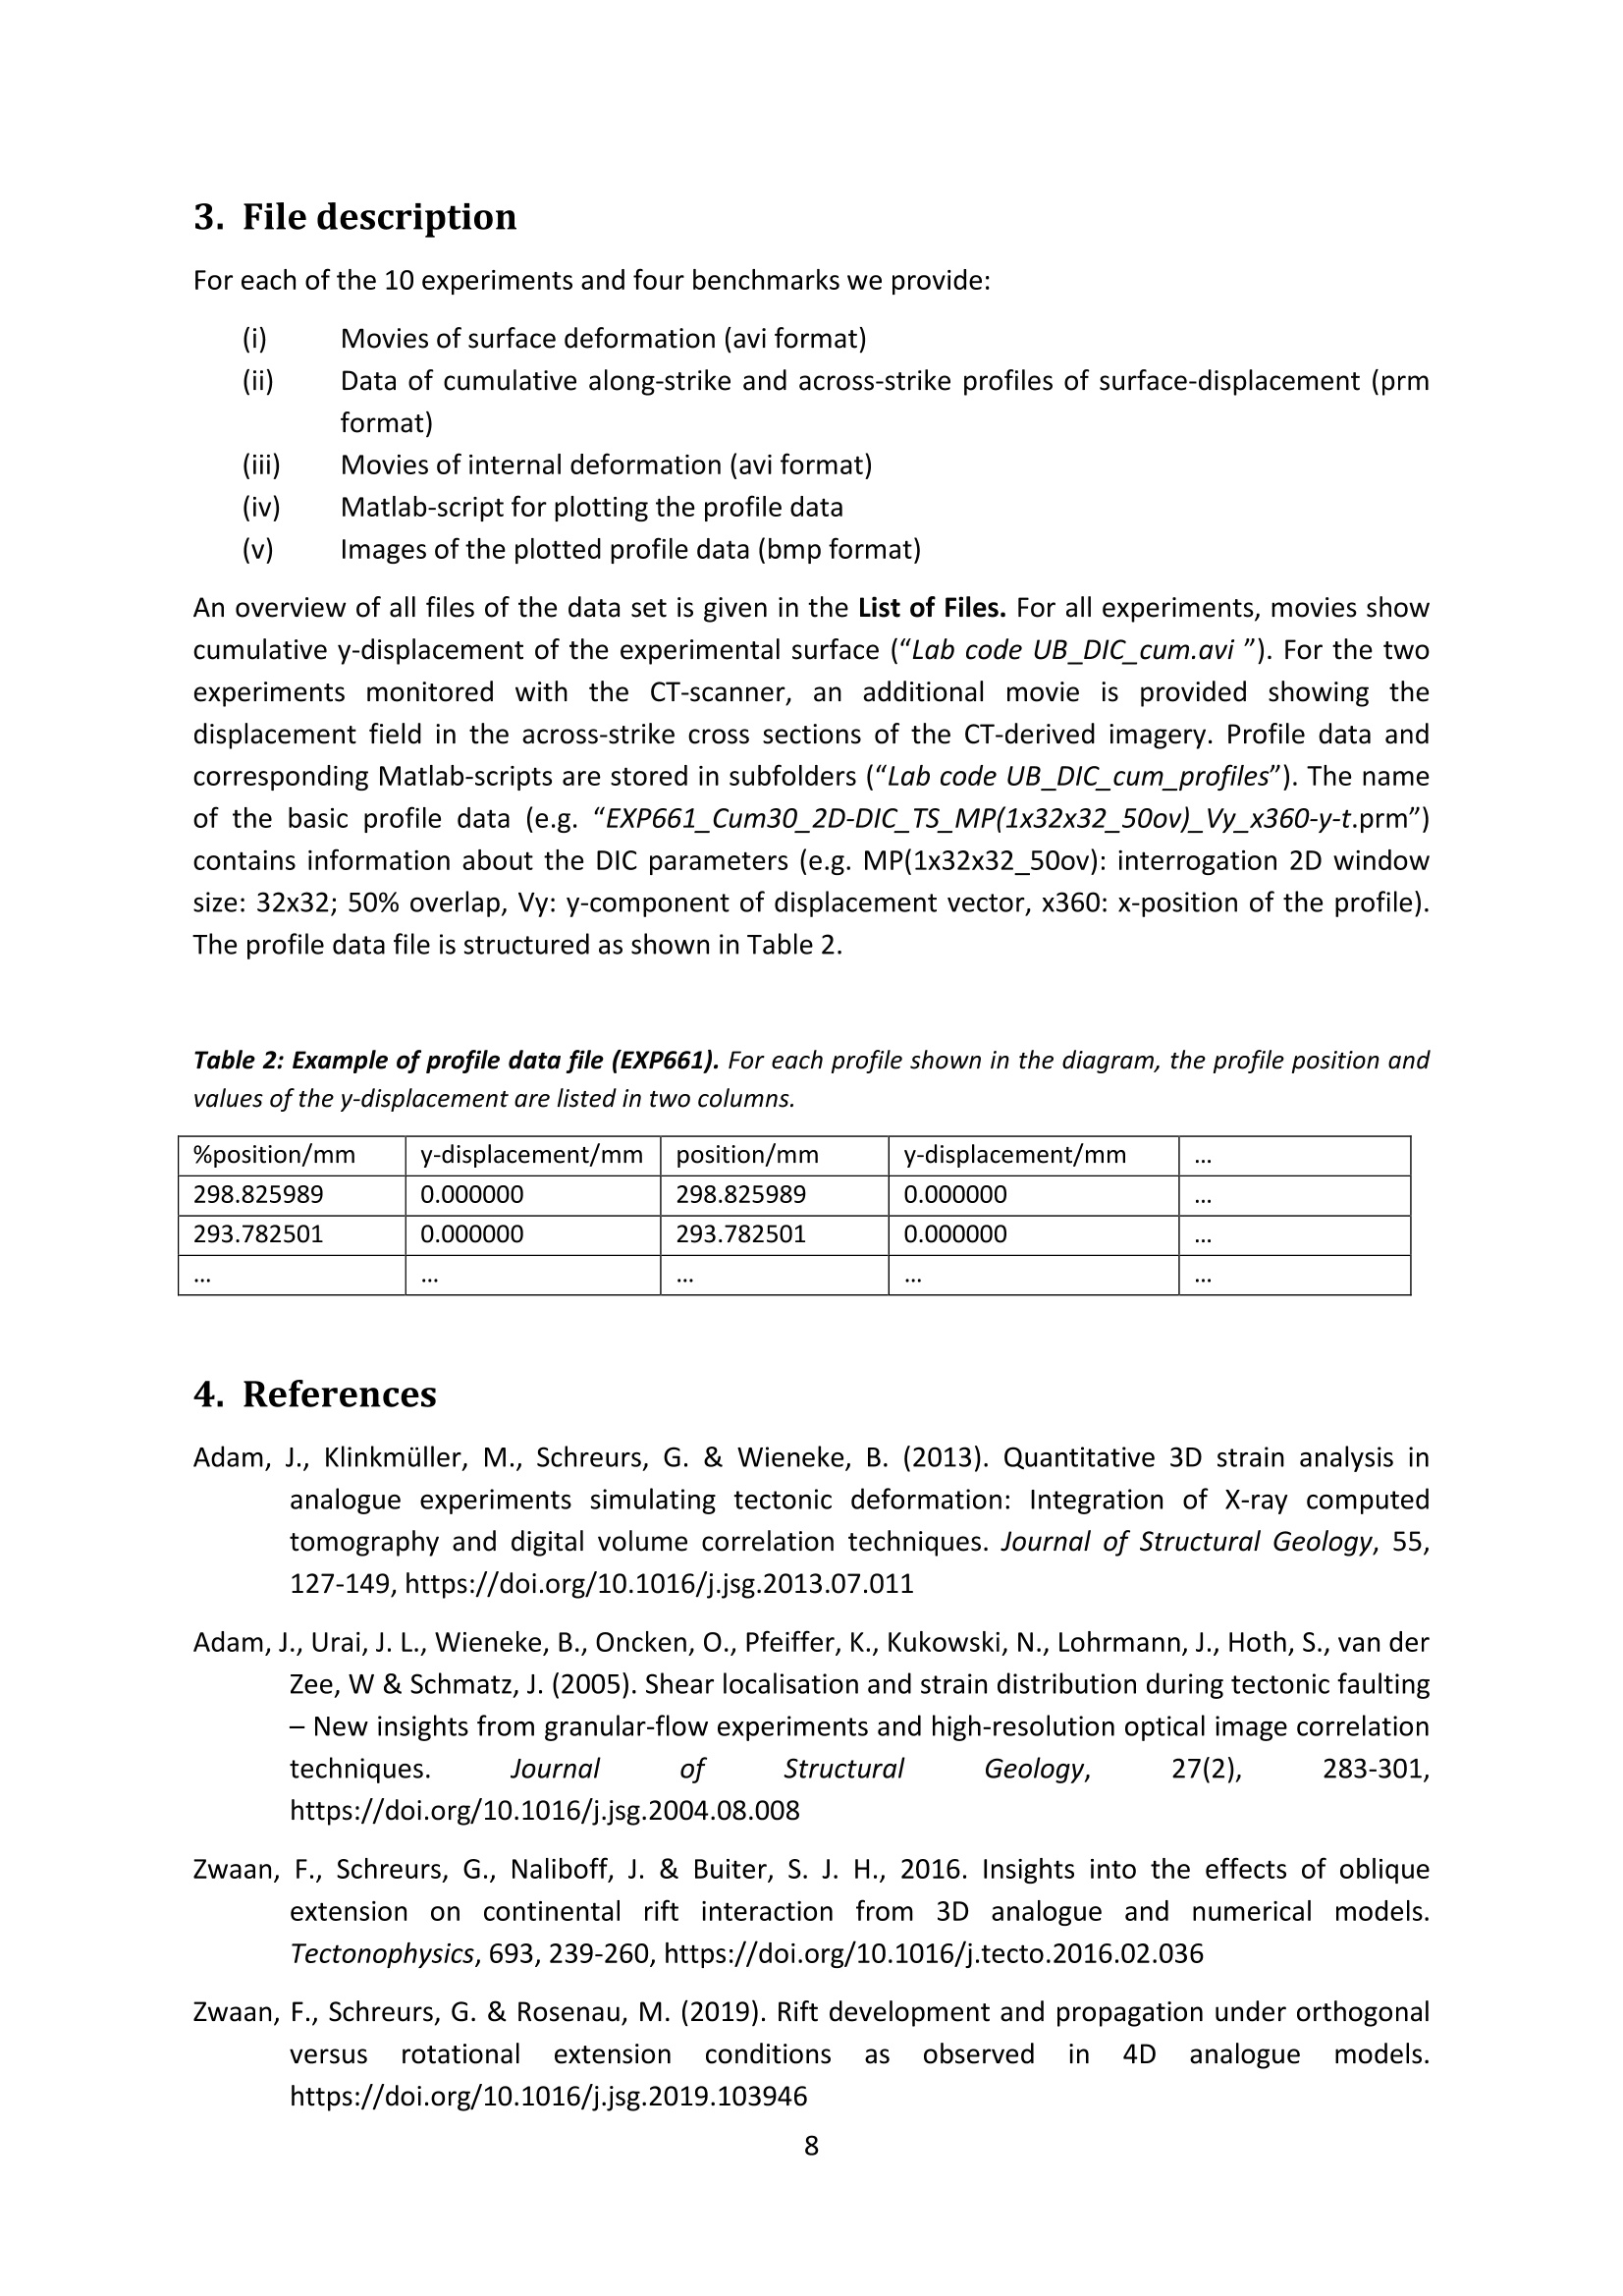
北京欧兰科技发展有限公司为您提供《构造模型沙箱中形变应变场检测方案(其它无损检测仪器/设备)》,该方案主要用于其他中形变应变场检测,参考标准--,《构造模型沙箱中形变应变场检测方案(其它无损检测仪器/设备)》用到的仪器有LaVision StrainMaster材料应变形变成像测量系统、LaVision DaVis 智能成像软件平台
推荐专场


相关方案
更多
该厂商其他方案
更多