


方案详情
文
采用立陶宛Ekspla公司的纳秒激光器构成激光诱导荧光测试系统。对铀样品进行光谱测量,获得了铀热力学数据,并对不同分析技术的实验结果进行了比较和分析。
方案详情

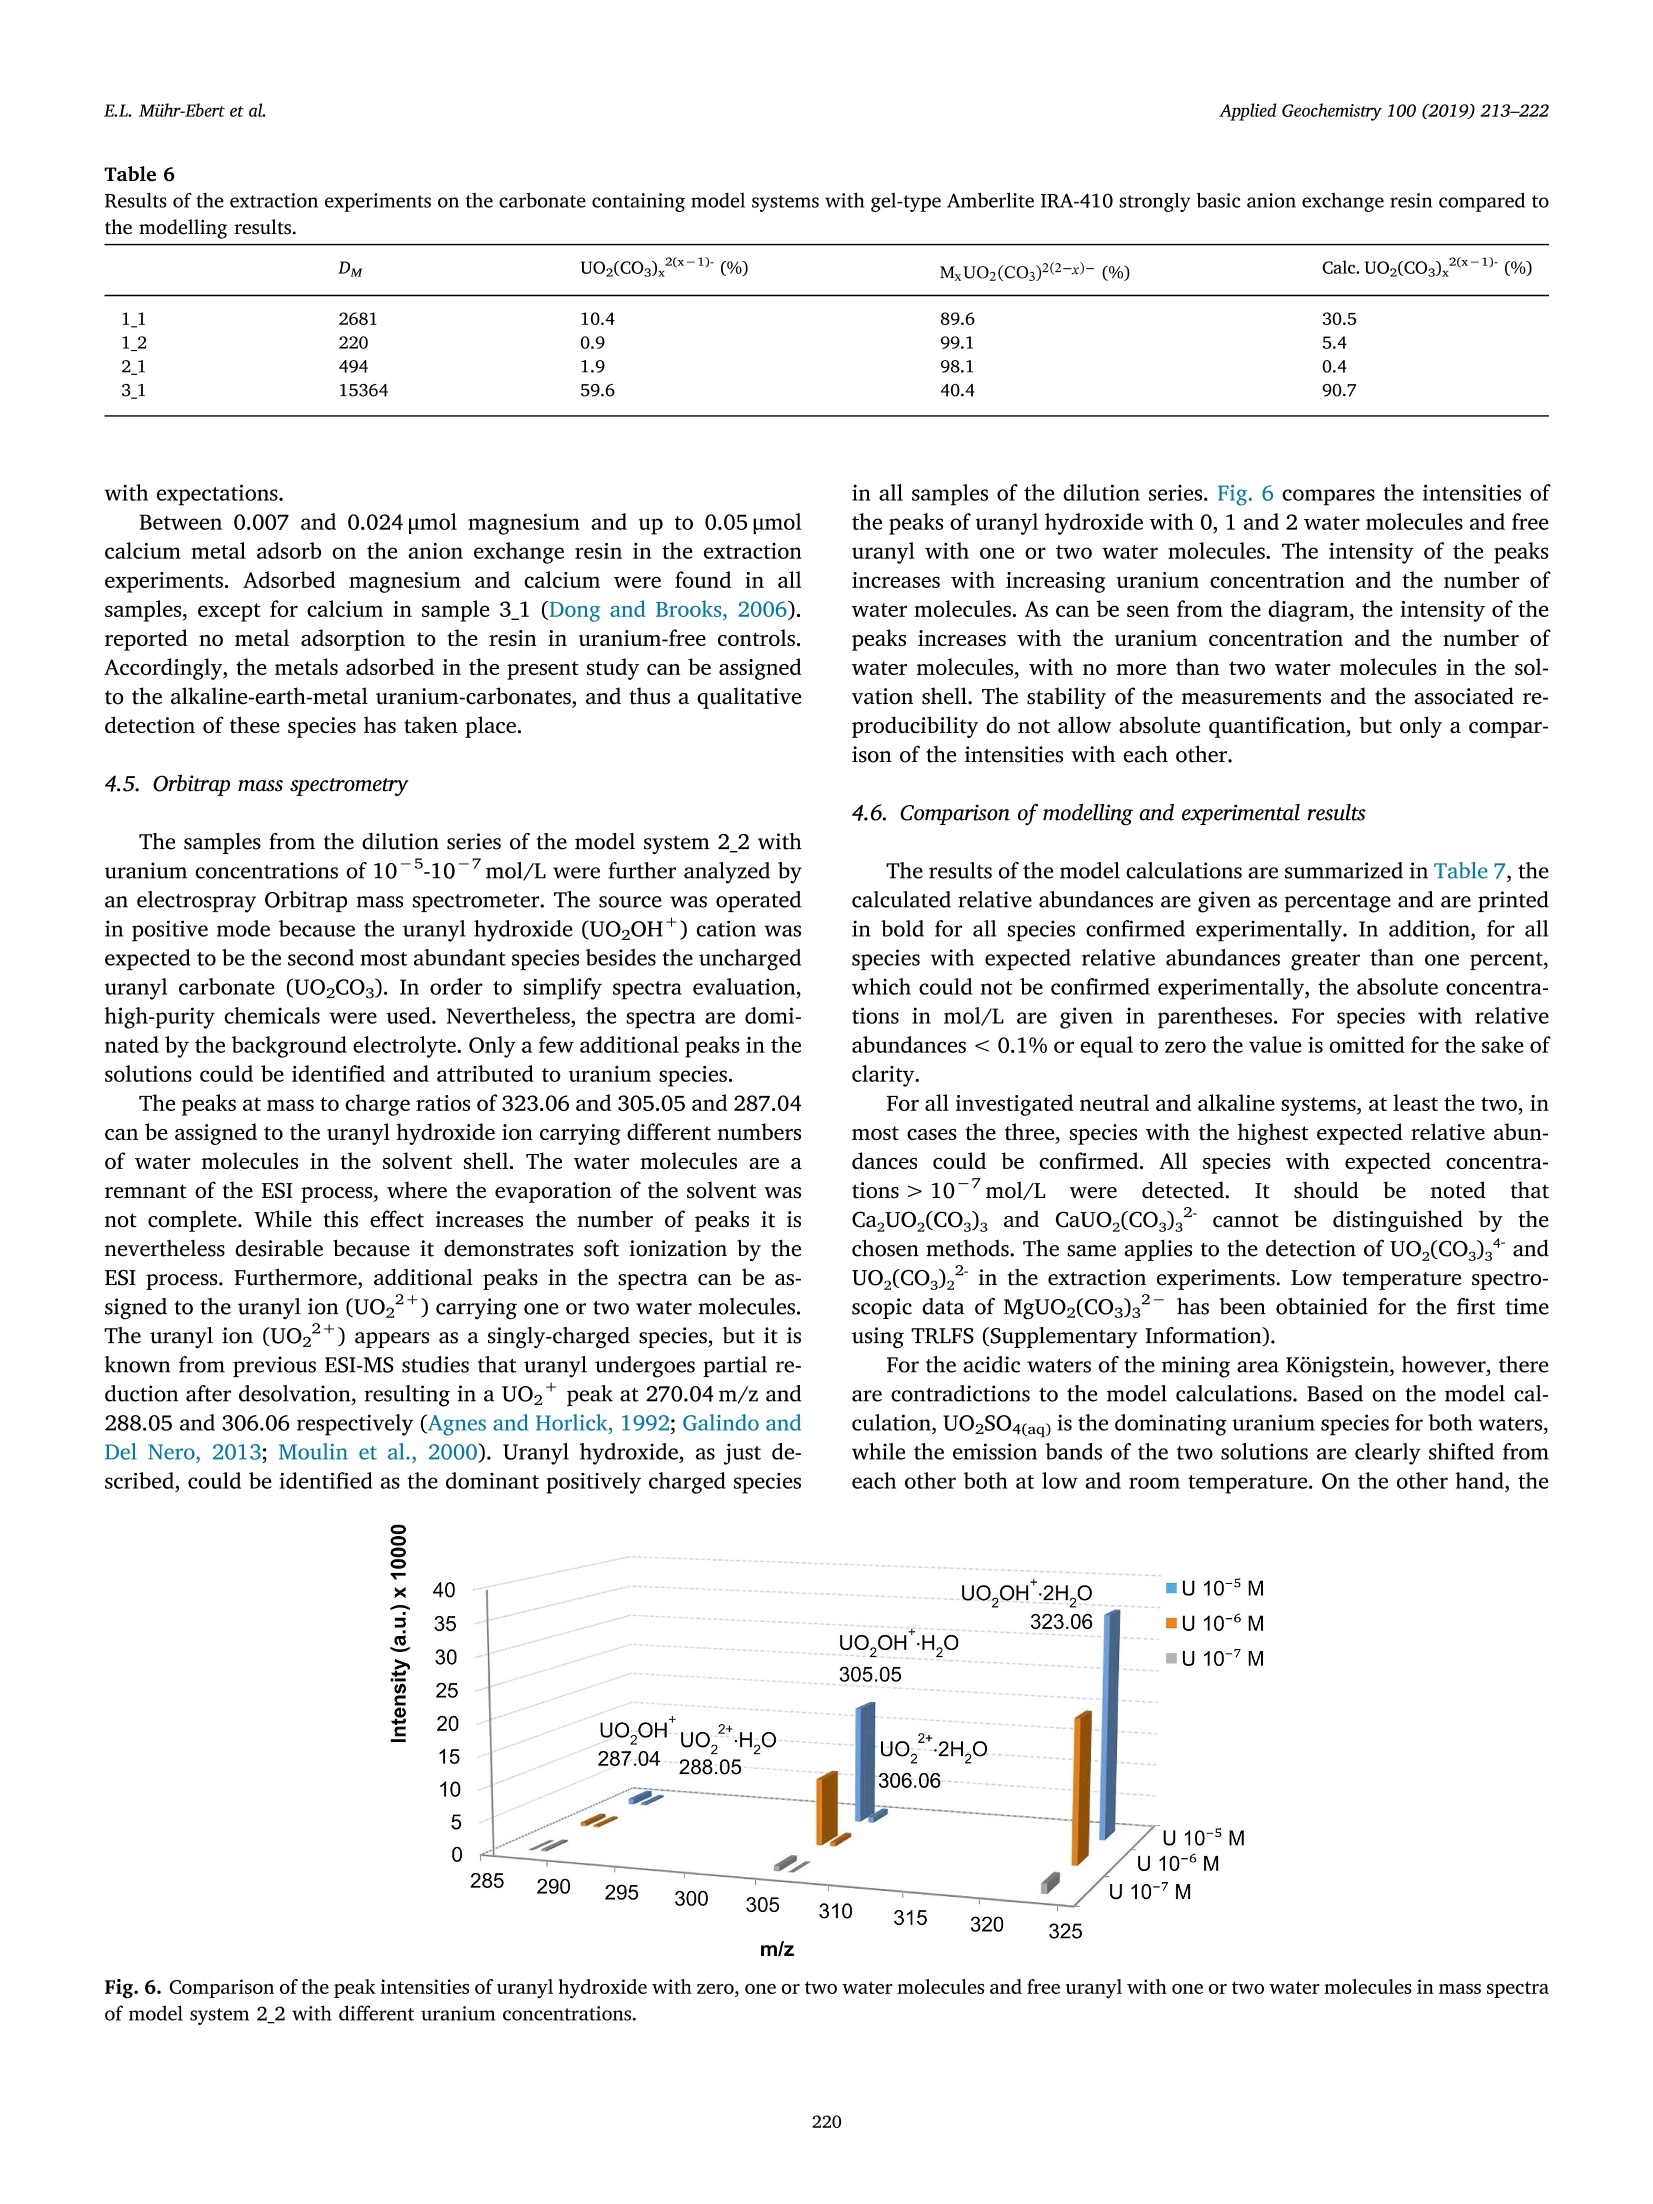
Applied Geochemistry 100 (2019) 213-222Contents lists available at ScienceDirectApplied Geochemistry Applied Geochemistry 100 (2019) 213-222E.L. Miihr-Ebert et al. journal homepage: www.elsevier.com/locate/apgeochem Speciation of uranium: Compilation of a thermodynamic database and itsexperimental evaluation using different analytical techniques Elena L. Muhr-Ebert*, Frank Wagner, Clemens Walther Institute of Radioecology and Radiation Protection, Leibniz Universitat Hannover, Herrenhauser StraSe 2, 30419, Hannover, GermanySub-Department Groundwater Resources - Quality & Dynamics, Federal Institute for Geosciences and Natural Resources (BGR), Stilleweg 2, 30655, Hannover,Germany ABSTRACT The validity of the thermodynamic data for the environmental media affected by uranium mining legacies is of utmost importance. Therefore, a comprehensiveand consistent database was established according to current knowledge. The uranium data included in the database is based on the NEA TDB (Guillaumont et al.,2003) and is modified or supplemented as necessary e.g. for calcium and magnesium uranyl carbonates. The specific ion interaction theory (Bronsted, 1922) is usedto estimate activity constants, which is sufficient for the considered low ionic strengths. The success of this approach was evaluated by comparative experimentalinvestigations and model calculations (PHREEQC (Parkhurst and Appelo, 1999)) for several model systems. The waters differ in pH (2.7-9.8), uranium concentration(10-9-10-(mol/L) and ionic strength (0.002-0.2 mol/L). We used chemical extraction experiments, ESI-Orbitrap-MS and time-resolved laser-induced fluorescencespectroscopy (TRLFS) to measure the uranium speciation. The latter method is nonintrusive and therefore does not change the chemical composition of the in-vestigated waters. This is very important, because any change of the system under study may also change the speciation. Environmental hazards are caused by uranium mining legacies and enhanced radioactivity in utilized groundwater and surface water resources. Knowledge ofuranium speciation in these waters is essential for predicting radionuclide migration and for installing effective water purification technology. 1. Introduction The environmental hazard posed by geogenically increased radio-activity (NORM -Naturally Occurring Radioactive Material) in usablewater resources is not limited to the remediation of contaminated sitesof former uranium mining in Saxony and Thuringia or in Central Asia(Bernhard et al., 1998; Meinrath et al., 1999). Also in the explorationand utilization of new groundwater resources, for example in Burundi(Post et al.,2017), as well as in North Africa (Hakam et al., 2000,2001a, 2001b) and the Middle East (Smith et al., 2000), NORM ratherfrequently poses a problem. The principle hazard associated with ur-anium is the potential for environmental migration through the soil,water, and air. Uranium uptake from these compartments by flora andfauna eventually leads to exposure of man. Isolation of uranium fromthe biosphere needs to be guaranteed on long time scales due to its longhalf-life (4.510° years for 238U). Furthermore, the radioactive daughternuclides (of the 238U decay chain), having very different environmentalmigration properties, need to be considered, (Skeppstrom and Olofsson,2007). The chemistry of the early actinides, of which uranium is amember, can be very complicated and is mainly controlled by the pH,the redox potential, and the type of available complexing agents, suchas carbonates, phosphates, and sulfates, etc. (Langmuir, 1997; Silva andNitsche,1995). The redox chemistry of uranium (dominated by U(IV) and U(VI) at environmental conditions) is especially significant with respect to themobility of uranium in the environment. The reduced species (U(1V),U4+) typically precipitates from natural waters near neutral pH due toits low solubility, and so is usually characterized as relatively immobile(Silva and Nitsche, 1995). In contrast, the oxidized species of uranium,uranyl (U(VI), UO2+), typically forms more stable aqueous complexesand is much more mobile in natural waters (Silva and Nitsche, 1995),although there are many known minerals containing uranium in the VIoxidation state (Finch and Murakami, 1999). The pentavalent uraniumspecies (UO2*) also exists but it is less stable than the other two oxi-dation states and is of no relevance in the environment (Silva andNitsche, 1995). Hydrogen ion concentration (pH) is a significant con-trolling factor in the speciation of uranium because solubility, sorption,complexation and colloid formation are all sensitive to solution pH(Brown and Ekberg, 2016). Natural waters vary in pH from about 2 to10 (Silva and Nitsche, 1995), with groundwater typically ranging from6 to 9. Equilibria are sensitive to pH, since [H*] is a component ofmany reactions, and therefore pH plays an important role in the de-termination of equilibrium component concentrations. Predictive modelling of uranium speciation in natural waters con-taining NORM are often developed on the basis of thermodynamicequilibrium modellingg and adequatespeciationsoftware(e.g.PHREEQC). The thermodynamic data basis readily available are partlyinconsistent and not always based on the current state of knowledge. ( * C orresponding author. Gesellschaft fiir Anlagen - und Reaktorsicherheit (GRS ) gGmbH, S chwertnergasse 1, 50667 Koln, G ermany. ) ( E-mail a ddress: elena.muehr-ebert@grs .de (E . L. Muhr-Ebert). ) ( https://doi.org/ 1 0.1016/j.apgeochem.2018.10.006 ) ( Received 18 M arch 2 0 18; R e ceived in r e vised form 29 S e ptember 2018; Accepted 3 O c t ober 2018 ) ( Available online 06 October 2018 ) ( 0883-2927/ C 2018 The Authors. Publ i shed by Elsevier Ltd. This is an ope n access article under the CC BY lice n se ) Careful attention should be payed when using such a database on thequality, up-to-datedness and range of applicability. The availablethermodynamic datasets are very different in terms of completeness andconsistency of uranium compounds. Furthermore, some specific data-bases for special applications such as in the management of radioactivewaste or in geothermal systems have been developed. Generally, theseare national projects selecting data restricted to use for targeted hostrock, e.g. of a deep geological repository. The databases also differ inthe model used to estimate activity coefficients and in the detail of thedata selection documentation. The scope of ThermoChimie (Grive et al.,2015) e.g. is limited to the pH range of 6-14. Acid solutions thereforedo not fall within the area of application of this database. Contrary toone's own claims, not all data are explicitly assigned references in thedatabase and the discussion of data selection is not accessible, whichmakes it difficult to assess the data quality. The PSI/Nagra database(Hummel et al., 2005) was originally developed to support the perfor-mance assessment of a repository in crystalline rock, was updated tosupport the performance assessment of a repository in a clay formationand may not be applicable to significantly different systems. TheTHEREDA (Moog et al., 2015) database is based on the Pitzer approachand is limitedly operational due to the lack of interaction parameters.However, THEREDA is a work in progress and more elements, reactionsand interaction parameters will be included. All of these databases arebased on the NEA TDB (Guillaumont et al., 2003). The internationalthermodynamical database (TDB) project of the NEA (Nuclear EnergyAgency),a sub-organization of the OECD, has been existing since 1986with the aim of creating a comprehensive, internally consistent, inter-nationally recognized and quality-assured thermodynamic database forselected chemical elements of safety relevance in the final disposal ofnuclear waste. The specific ion interaction theory (SIT) was used toextrapolate experimental data to zero ionic strength. As part of the TDBproject, thermodynamic data from the literature are subjected to acritical review by several international expert panels. The selectedthermodynamic standard data (“selected values") and ion interactioncoefficients compiled in the NEA-TDB form a consistent database(Grenthe et al., 1992; Guillaumont et al., 2003). The“Selected Values”of the NEA-TDB are an incomplete database due to the restrictivehandling of the selection criteria. For practical applications, the closingof data gaps on the basis of well-founded estimates or the inclusion ofless well-secured data is sometimes urgently necessary (Altmaier et al.,2011; Hummel et al., 2005; Vercouter et al., 2015). Modelling the same water composition using different databasesmay lead to very different results (Mahoney, 2013) as is illustrated inFig. 1, which compares Pourbaix diagrams of sample 2_2 with an Fig. 1. Pourbaix diagrams of sample 2_2 with an uranium concentration of [U]=10-5 mol/L (compare Table 2) calculated using a) wateq4.dat (Ball and Nordstrom,1991) and b) the database presented in this work. uranium concentration of [U]=10-5mol/L (compare Table 2) calcu-lated using a) wateq4.dat (Ball and Nordstrom, 1991) and b) the da-tabase presented in this work. This work attempts to optimize the thermodynamic database andconfirm the calculation results by measuring the speciation of uraniumin the different solutions representing a broad range of naturalgroundwaters with high dissolved uranium using time-resolved laser-induced fluorescence spectroscopy, ion extraction on a resin, andelectrospray ionization mass spectrometry. 2. Selected thermodynamic data The quality of geochemical speciation modelling strongly dependson the applied thermodynamic database. Table 1 lists the uranium re-lated thermodynamic data in the selected dataset including the re-spective reference. The data selected for the database essentially fol-lows the NEA TDB (Guillaumont et al., 2003) recommendations and hasbeen modified or supplemented as necessary, with the additions mainlyfollowing the recommendations of THEREDA DB (Moog et al., 2015).Major improvements of the thermodynamic data from (Guillaumontet al., 2003) regarding uranium speciation comprise several alkaline-earth-metal uranium-carbonates, some U(IV) species as well as variousmineral phases. The respective ion interaction coefficients are providedin the supporting information in Table S 1 for cations and in Table S 2for anions. 3. Experimental The optimized thermodynamic database has been evaluated bymeans of model calculations and comparative laboratory tests applyingtime-resolved laser fluorescence spectroscopy (TRLFS), mass spectro-metry and extraction experiments using different waters as model sys-tems. 3.1. Model systems In all experiments, synthetic waters were used to reduce the com-plexity of the system, for example by the presence of unknown organics.The synthetic waters were prepared by dissolving or diluting corre-sponding amounts of CaCl22H20 (Merck, ACS, Reag. Ph Eur), CaCOs(Merck, Reag. Ph Eur), CaSO2H2O (Fluka, p.a.), FeSO47H20 (Fluka,p.a.),H2SO4 (Merck, 95-95%; %, Merck, 96%, suprapur), HgPO4 (Fluka,85%, ACS), HCl (VWR Chemicals,37%), HNO3 (VWR Chemicals, 69%,Merck, 67% suprapur), K2SO4 (Merck, p.a.), KCl (Merck), KOH (Merck), Selected thermodynamic data for reactions involving uranium compounds andcomplexes. All data refer to the reference temperature of 298.15 K and to thestandard state, i.e., a pressure of 0.1 MPa and, for aqueous species, infinitedilution (I=0). All the values adapted from the NEA TDB (Guillaumont et al.,2003) are presented with three digits after the decimal point,regardless of thesignificance of these digits. Saleeite Reaction Log K Ref. Mg(UO2)2(PO4)2=2PO-+Mg2++ 2UO22+ -46.320 l Cernikovite (H-Autunite) UO2HPO44H20=4H20 +PO-+UO 2++ H+ -24.20 a UO2(H2PO4)23H20=2HPO4-+ UO22++3H20-2H* -1.700 m U(HPO4)24H20=4H2O +2HPO4+U4+-4H+ -11.790 a (UO2)3(PO4)24H20=4H20 + 2HPO4 +3UO22+-6H+ -5.960 a CaU203H20=Ca2++6H20-6H++ 2UO2+ 23.400 n Rutherfordine UO2(COs)= CO3-+ UO2+ -14.760 a a (Guillaumont et al., 2003); b (Neck et al., 2001);c (Rai et al., 1998); d(Dongand Brooks, 2006; Richter et al., 2015); e averaged value from (Geipel et al.,2008) and (Dong and Brooks, 2006); f (Altmaier et al., 2004); g (Gorman-Lewiset al., 2007) h (Gorman-Lewis et al., 2008); i (Sandino and Grambow, 1994); j(Muto et al., 1965);k (Gorman-Lewis et al., 2009), 1 (Muto et al., 1968); m(Schreyer and Baes,1954); n (Altmaier et al., 2006). Table 2 Concentrations of major ions of synthetic waters determined by ICP-OES andion chromatography. 1_1 1_2 2_1 2_2 3_1 3_2 4_1 4_2 pH 9.5 8.1 7.3 5.9 9.8 5.0 4.7 2.7 Na mg/L 3066 1406 542 13 2320 2660 674 2110 Cl mg/L 876 901 151 17 1710 1650 6.43 121 Mg²+ mg/L 88 603 62 6 21 20 64 185 Ca2+ mg/L 87 307 130 13 361 522 SO2- mg/L 3519 6632 38 14 4110 2550 1960 6190 HCO3 mg/L n.d. n.d. n.d. n.d. 940 21 - co- mg/L n.d. n.d. n.d. n.d. 560 PO- mg/L 一 0.2 0.2 0.1 3.5 1000 i i U mg/L 13 2 i 0.0003 9.5 一 14.2 62.6 MgCl26H20 (Merck, p.a.), MgSO47H20 (Merck; EMSURE, ACS, Reag.Ph Eur), Na2COs (Merck, ACS, ISO, Reag. Ph Eur), Na2CO310H20(Merck, p.a.), Na2SO4 (Fluka,Puriss. p.a.), NagPO412H2O (Merck, p.a.),and NaCl (Merck, Suprapur). The synthetic water compositions, summarized in Table 2, representvarious natural groundwaters with high dissolved uranium. The modelsystems have been selected to evaluate the validity of the database foruranium speciation in different hydrochemical environments. Thewater compositions 1 (1_1 and 1_2) and 3 (3_1 and 3_2) correspond topore water compositions from monitoring wells in industrial tailingsponds from different uranium mining legacy sites in Saxonia/Thuringia(Eastern Germany). Since no natural water with a uranyl-phosphatedominated speciation was available, the water sample 3_2 was preparedfrom sample 3_1, by treating a partial solution with sodium phosphate(Na2HPO4 (Merck) 0.425 mol/L and NaH2PO4 (Merck, ASC, Reag. PhEur) 0.075 mol/L) to obtain a phosphate concentration of 1000 mg/L. ApH of 5.0 was adjusted by adding dilute sulfuric acid. As a consequence,uranium concentration decreased below the detection limit of the ICP-OES, which is in agreement with the modelling and discussed further inchapter 4.1. Model systems 2_1 and 2_2 correspond to groundwatersamples from selected wells in Burundi in heavily weathered granite(Post et al., 2017). System 2_1, is potentially disturbed by surface waterintrusion because the sampling point is located close to a lake. Twofurther samples correspond to groundwater samples taken from a ur-anium mining legacy site in Saxonia (Eastern Germany), where in-situleaching has been applied (samples 4_1 and 4_2). In the replica of thewaters only the main components, as well as the radionuclide U-238were considered, other trace components were neglected. The concentrations of cations in solution were measured by ICP-OES(SPECTRO ARCOS I, while concentrations of anions in solution(chloride, nitrate and sulfate) has been determined using ion chroma-tography (Dionex ICS 5000+) utilizing a Dionex"M IonPacM AS19 IC column. Phosphate concentration has been calculated based on thedetermination of elemental phosphor (ICP-OES). The carbonate specieshas been derived from sample alkalinity, which has been quantified bytitration (Mettler Toledo T90) with hydrochloric acid. The pH of thesamples was measured using a Orion" Dual Star equipped with aOrion" PerpHecT'M ROSSM combination pH micro electrode both fromThermo Scientific". Calibration was performed with technical buffersolutions pH 4.01 and 7.0 from purchased from WTW and ThermoScientific OrionM pH 9.18 and 12.46 buffer reference standard solution.All water samples were filtered by a 0.2 um mixed cellulose membranefilter from Whatman prior to further treatment. The uranium concentration in the model system 2_2 is too low forTRLFS measurements, the typical uranyl fingerprint is not visible in thespectra, strongly disturbed by scattered laser light. Therefore, a con-centration series was prepared and used for further characterization ofthe system. The composition of the water remained unchanged exceptfor increasing uranium concentrations of [U]=10-5,10-6,10-’ and10-8mol/L. 3.2. Modelling The measured composition of the synthesized waters (Table 2) wereused as data input for the speciation modelling using PhreeqC(Parkhurst and Appelo,1999). Because the filtered sample solutionswere clear, appeared homogeneous and did not show any precipitate,undersaturation with respect to any minerals is assumed. The calcula-tions were carried out for a temperature of 25°C and oxygen and carbondioxide contents in equilibrium with the atmosphere. Thus, the dis-solution of oxygen and carbon dioxide is considered and the carbonatecontent of the solution in equilibrium is taken into account. 3.3. Time-resolved laser fluorescence spectroscopy (TRLFS) In this work two different analysis modes of TRLFS are used. (1)Fluorescence spectra are recorded after excitation at constant laserwavelength. Band positions of the emission spectra intensity distribu-tion depend on the chemical environments of the ions.(2) The fluor-escence lifetimes of the uranyl species in solution are determined byrecording the decrease in fluorescence intensity after different delaytimes after the (pulsed) excitation. U(VI) luminescence spectra were measured using a Nd:YAG lasersystem (PS6100 series, Ekspla, Vilnius, Lithuania) operated at 50 Hzwith a pulse duration of 7ns. The excitation wavelength was 266 nmwith a measured laser power of 7 mW. The luminescence emission wasfocused into a spectrograph (Shamrock 303i, Andor Technology Ltd.,Belfast, UK) with a polychromatographic grating (150 or 300 lines/mm) via fiber optics and detected using a CCD camera system (AndoriStar 743, Andor Technology Ltd., Belfast, UK). For measuring the timedependent emission decay, the delay time between laser pulse andcamera gating was varied between 0 and 10000 us. Time-resolvedspectra were recorded by measuring 80-100 spectra times. For im-proved statistics, at each delay time, 80-100 fluorescence spectra weremeasured and summed. The evaluation of the measurement data to determine the fluores-cence lifetime is carried out software-based on the computer, using anin-house program. The fluorescence intensity is integrated over all ur-anyl bands and plotted as a function of time. The fluorescence lifetimeis subsequently determined by a multi-exponential (usually mono- orbi-exponential) fit (equation (1)) to these data Where I is the number of fitted components, A is a pre-exponentialfactor, which corresponds to the number of the emitted photons of therespective component, and t is the corresponding fluorescence lifetime. The details of lifetime fitting are described, e.g., in (Kimura andChoppin, 1994) for differential lifetime measurements on uranyl in(Geipel et al., 1996) and for the method of integrated lifetime emissionspectroscopy used in the present work in (Freyer et al.,2009). Due to very strong dynamic quenching observed in measurements atroom temperature, which is caused by the in some cases very highchloride contents, the measurements had to be carried out at lowtemperatures. Previous work has shown that under cryogenic tem-peratures, many of the fluorescence quenching and spectral broadeningeffects can be suppressed, resulting in a significant increase in spectralintensity and resolution (Wang et al., 2004, 2008). For cooling pur-poses, a cryostat working at liquid helium temperature (4K) is used inthis work. In the present work, cooling was the only choice for ob-taining spectra at all and was successfully applied to the speciation ofuranyl complexes in aqueous systems (Osman et al., 2013; Steudtneret al.,2010). However, if fast kinetics are involved such as for instancehydrolysis changes in species distributions might occur. 3.4. Extraction experiments The ratio of ternary complexes (MUO2(CO3)3 and M2UO2(CO3)3of uranyl and carbonate with alkaline earth metals (M2+ corresponds toMg+and Ca+)to anionicuranylccarbonate complexes(UO2(CO3)2(x-1)-) was determined by extraction experiments on ananion exchange resin. Uranium sorption on the resin corresponds toanion exchange betweenNO3 and1anioniicc uranyl species(UO2(CO3)3*,UO2(CO3)2,(UO2)2CO3(OH)). As described by(Dong and Brooks, 2006,2008) the uranium absorption on the ionexchange resin in the absence of alkaline earth metals in the pH rangeof 7-10 leads to a constant distribution coefficient D (equation (2)) of25760 mg/L. M-UO2-COs-complexes are not or only weakly adsorbed on theanion exchange resin (Dong and Brooks, 2006), allowing one to cal-culate the proportion of these complexes in the solution from the de-termined partition coefficient. Extraction experiments were carried outfor the model systems 1_1, 1_2, 2_1, and 3_1. For the remaining modelsystems, corresponding investigations were not useful, because at thecorresponding pH no anionic uranyl species are expected for sample2_2, the uranium concentration in sample 3_2 was below the detectionlimit of the ICP-OES and samples 4_1 and 4_2 do not contain any car-bonate. Gel Type Amberlite IRA-410 strong base anion exchange resinwas purchased from Sigma-Aldrich (St. Louis, MO) in the chloride formand converted to the nitrate form prior to use as described in (Dong andBrooks, 2006). Uranium batch adsorption experiments were carried outat 25℃ and atmospheric CO2 in 50 ml polyethylene bottles using 20 mlsolution and 0.05 g air-dry resin. The suspensions were equilibrated ona shaker for 5 days. Thereafter, the solution was filtered and preparedby acidification for U(VI) and metal quantification. The resin beadswere separated by filtration, rinsed rapidly with three 5 ml aliquots ofdistilled water, and transferred to 2.5 ml of 1% HNO3 in a 10 ml poly-ethylene bottle. Desorbed metals were quantified after an extractionperiod of three days either by ICP-MS or ICP-OES. Aqueous Mg, Ca and U concentrations were measured using in-ductively coupled plasma mass spectrometry (ICP-MS, iCAP Q fromThermoFisher), autosampler Cetac ASX-520, concentric atomizer,quartz cyclone spray chamber with inner tube, plasma power 1550 W)and inductively coupled plasma optical emission spectrometry (ICP-OES) with an iCAP 6200 Duo from ThermoFisher (iTeva Software,Cetac ASX-260 autosampler, Mira-Mist nebulizer, cyclone spraychamber, 1150 W plasma power) or an ARCOS from Spectro AnalyticalInstruments GmbH (Kleve, Germany). The measured amount of desorbed metal was used to determine the corrected U(VI) distribution coefficients, as described in (Dong andBrooks, 2006). Thistakes intoaccount the: possibility thatMUO2(CO3)3and M2UO2(CO3) could be adsorbed to the resin ac-cording to the following exchange reactions Where Ris the functional group of the anion-exchange resin. To address this issue (Dong and Brooks, 2006), developed a cor-rection procedure. The total amount of M2+ on the resin phase, either(R*)2MUO2(CO3)3associated or entrained in the resin pore water,was extracted and quantified in acidic solution (1% HNO3) by theaforementioned desorption process. The amount of M2+, correspondingto (R*)2MUO2(CO3)3, M (umol), was obtained from equation (5) With the total metal concentration in the desorption solution Ca(umol/mL), the volume of desorption solution Va (mL), the metalconcentration in the equilibrated bulk solution C (umol/mL) (hereM2+ concentration in resin pore water is assumed to equal that in thebulk solution at equilibrium), the solution density pw (g/cm), the mass(g) of wet resin mw, and the fractional water content of wet resin e.According to the stoichiometric ratio, Me (umol) should correspond tothe amount of U(VI) associated with (R*)2MUO2(CO3)3 . Thus, Mwas used to correct the distribution coefficient D (equation (2)) bysubtracting M/m from the total absorbed [U(VI)]R and adding MR/V tothe aqueous phase [U(VI)]aq. 3.5. Orbitrap mass spectrometry The mass spectrometric measurements were carried out on a hybridmass spectrometer Orbitrap Elite (Thermo Fisher Scientific, Waltham,Massachusetts, USA) equipped with a Nanospray Flex Ion Source. Nano-ESI needles were purchased from New Objective Inc (Woburn, MA,USA). The evaluation of the obtained spectra was carried out with theXcalibur software (Thermo Fisher Scientific, Waltham, Massachusetts,USA). For each sample, a mass spectrum was recorded for 30 s and theintensities were then averaged over time. 4. Results and discussion 4.1. Modelling Species distributions for the model systems are calculated byPhreeqC using the database equilibrium constants of Table 1. All ur-anium species with a relative abundance exceeding 0.01% are plottedin Fig. 2. The polymeric species are weighted with respect to theirnumber of uranyl units. The results for the model system 1_1 and 1_2 are very similar anddominated by alkaline-earth-metal uranium-carbonates. The same ap-plies for sample 2_1, while 2_2 is dominated by UO2CO3. This system ischaracterized by a lower pH and a significantly lower concentration ofuranium. Since the concentrations of calcium and magnesium are low,sample 3_1 is dominated by uranyl carbonate. Samples 4_1 and 4_2 areacidic waters with high sulfate content and are therefore dominated byuranyl sulfates. Sample 3_2 was prepared from sample 3_1 by addition of phosphateions. Uranium speciation is not shown in Fig. 1, since speciation mod-elling revealed the appearance of some supersaturated uranyl phos-phate phases of low solubility, namely uranyl phosphate, autunite, andsaleeite. A precipitate was not observed visually, due to the low U(VI)concentration and the resulting small amount of precipitate. The TRLFS measurement delivered no signal, regardless of the delay time, whichalso indicates precipitation of the U(VI) most likely phosphate com-pounds. The uranium concentration in sample 3_2 was below the de-tection limit of the ICP-OES. The modeled species distribution based onsample 3_1, and the addition of phosphate and pH change, taking theprecipitation of supersaturated phases into account, predicted410-6mol/L of dissolved uranium, which is one order of magnitudeless compared to sample 3_1. The results for the dilution series of sample 2_2 are shown in Fig. 3together with those for the actual system. The uranium speciation in thesystems are relatively similar for uranium concentrations between 10and 10-mol/L and change dramatically as the concentration is furtherincreased. At a uranium concentration of 10-5 mol/L, uranylhydrox-ocarbonate is the dominant uranium species. 4.2. Cryogenic time resolved laser fluorescence spectroscopy To evaluate the thermodynamic calculations, all water sampleswere measured by TRLFS. Uranium speciation can be obtained from thecharacteristic lifetimes and the fluorescence wavelengths of the dif-ferent complexes. Fig. 4 displays the TRLFS spectra of sample 1_1measured at low temperature (4K)with delay times between 0.1 and5 ms. A detailed comparison of the emission band positions of themodel systems together with reference data from (Wang et al., 2004) isgiven in Table 3. Calcium uranyl carbonate can be assigned as the dominant speciesfor samples 1_1, 1_2, and 2_1, which is in agreement with the calcula-tions. However, the two calcium uranyl carbonates (CaUO2(CO3)3and Ca2UO2(CO3)3) cannot be distinguished by TRLFS. Additionally,fluorescence lifetimes were determined for the model systems as de-scribed above. They are also included in Table 3. For the samples 1_1,1_2, and 2_1, the longer lifetime can be attributed to the calcium uranylcarbonate, which has already been identified as the dominant speciesby the band position. A second species cannot be unambiguously as-signed. A comparison of the emission maxima of sample 3_1 with literaturedata (Table 3) identifies UO2(CO3)34 as the most abundant uranium(VI)species. This finding corroborates the results of the speciation cal-culation. The calculated fluorescence lifetimes for sample 3_1 cannot beclearly assigned to any species. The longer calculated lifetime of 1045us agrees reasonably well with the literature value of the uranium (VI)species of the highest expected abundance UO2(CO3)3, whose life-time may be overestimated as the lifetimes of UO2(CO3)3-(t=883us) and CaUO2(CO3)3 (r=1282 us) cannot be resolved. The shorterlifetime (t =241 us) most closely matches the one of MgUO2(CO3)3,although the lifetime is greater than expected. The reason might ori-ginate from the process of data fitting: A biexponential function ischaracterized by five parameters that are to some extent covariantlimiting the robustness of each individual parameter of the fit. Fig. 2. Calculations of the speciation of the model systems applying PhreeqC based on the created database. All uranium species with a relative abundance of morethan 0.1% are plotted. The polymeric species are weighted with respect to their number of uranyl units. U contentration of 2 2 (mol/L) Fig. 3. Calculations of the speciation of the model system 2_2 with different uranium concentrations in mol/L using PhreeqC and equilibrium constants of the createddatabase. All uranium species with a relative abundance of more than 0.1% are plotted. The polymeric species are weighted with respect to their number of uranylunits. uranyl sulfate is expected to be the principal (most abundant) species insample 4_2. As with sample 4_1, however, a comparison with the lit-erature for the sulfate species is not possible. The free uranyl ion, whichin band position and lifetime agrees well with the literature, has anexpected relative abundance of 12.0% in this sample. The band positions of the samples from the dilution series of system2_2 with uranium concentrations of 10-5,10-6,and 10-7mol/L agreequite well. The matching bands are slightly shifted to shorter wave-lengths compared to the UO2CO3(aq). The time resolved spectroscopyresults in lifetimes around 600 us for all three samples which can beassigned to UO2CO3(aq). For samples with higher uranium concentra-tions (10-5 and 10-6mol/L) a second shorter lived species was de-tected and can be assigned as (UO2)2CO3(OH)3-, which is in goodagreement with the modelling results. Table 4 summarizes the results ofthe cryo-TRLFS investigations. 4.3. Time resolved laser fluorescence spectroscopy at room temperature Due to the lack of reference data for TRLFS measurements of uranylsulfate at low temperature, additional investigations were performedfor samples 4_1 and 4_2 at room temperature. Due to quenching effects,the signal to noise ratio was rather low as can be seen in Fig. 5 and theevaluation of the lifetimes was difficult. Nevertheless, two fluorescencelifetimes were determined for both samples. In the case of sample 4_2 the shorter fluorescence lifetime agreesvery well with UO2(SO4)2 -(compare Table 5), while the positions ofthe emission bands are slightly shifted to higher wavelengths. WhileUO2(SO4)2 is identified as major species on the basis of the mea-surement, UO2SO4(aq) is expected as most abundant species in thissample as can be seen in Fig. 2. However, distinguishing the uranylsulfate complexes based on the band position is difficult because the Fig. 4. Set of time-resolved fluorescence spectra with delay times between 0.1and 5 ms for sample 1_1 at low temperature (4K). Table 3 A comparison of TRLFS measurements of the model systems with spectroscopicdata for model complexes (Wang et al., 2004) and own spectroscopic data forMgUO2(CO3)3((details are provided in the Supporting Information). Allmeasurements were conducted at liquid helium temperature. Species/sample Main emission wavelengths t (us) (nm) UO2+ 492-514-538-564-592 270 (UO2)2CO3(OH)3~ 523-542-561 144 UO2CO3 479-498-519-542-567 465 UO2(CO3)22- 477-496-517-540-564 962 UO2(CO3)3 480-499-520-542-566 883 CayUO2(CO3)2(2-X)- 481-501-523-546-572 1282 MgUO(CO3)3 479-498-519-541 170 1_1 481-501-524-549-578 512±44;1237±62 1_2 482-503-526-552-579 606±128: 1404±69 2_1 480-502-524-549-574 479±27;1155±13 2 2 (U 10-5mol/L) 475-494-514-536 118±32;604±100 22(U 10-6mol/L) 470-493-514-530 129±28;666±26 22 (U 10-’mol/L) 475-494-514-536 519±281 3_1 480-499-520-541-565 241±15;1045±9 3_2 一 4_1 481-501-522-544 230±5;747±12 4_2 490-512-535-558 240±90 positions of the main emission bands are very similar (Vercouter et al.,2008). The longer fluorescence lifetimes cannot be assigned to anyspecies expected on the basis of the modelling results. For sample 4_1 anassignment is not possible on the basis of the TRLFS investigation atroom temperature. The difficulties in the interpretation are caused bythe rather low quality of the TRLFS measurements at room temperature,which is due to quenching effects as discussed above, and do not ne-cessarily point to an inaccuracy in the thermodynamic data. Fig. 5. Fluorescence spectrum with a delay time of 1 us for sample 4_2 at roomtemperature. Table 5 A comparison of TRLFS measurements of the model systems with spectroscopicdata for model complexes from (Bernhard et al., 1996). All measurements wereconducted at room temperature. Species/sample Main emission wavelengths (nm) Lifetime r (us) UO2+ 488-510-532-558 2.70±0.5 UO2SO4(aq) 493-514-538-565 4.3± 1.0 UO2(SO4)2 493-514-538-565 11.0±2.0 UO2(SO4)3 493-514-538-565 18.3±3.0 41 486-505-526 7.7±1.2;150±1.3 4_2 498-519-540-565 12.3±3.4;306±42.2 4.4. Extraction experiments Summary of the cryo-TRLFS investigation. All identified species are denoted with X. 11 1_2 21 22(10-5) 22(10-) 22(10-) 3_1 41 4_2 UO2+ (UO2)2CO3(OH)3 UO2CO3 UO2(CO3)3 CaxUO(CO3)2(2-X)- MgUO2(CO3)3 Table 6 Results of the extraction experiments on the carbonate containing model systems with gel-type Amberlite IRA-410 strongly basic anion exchange resin compared tothe modelling results. DM UO2(CO)2(x-1)(%) MxUO2(CO3)2(2-x)-(%) Calc.Uo(CO3)2(x-1)(%) 1_1 2681 10.4 89.6 30.5 1_2 220 0.9 99.1 5.4 2_1 494 1.9 98.1 0.4 3_1 15364 59.6 40.4 90.7 Between 0.007 and 0.024 umol magnesium and up to 0.05 umolcalcium metal adsorb on the anion exchange resin in the extractionexperiments. Adsorbed magnesium and calcium were found in allsamples, except for calcium in sample 3_1 (Dong and Brooks, 2006).reported no metal adsorption to the resin in uranium-free controls.Accordingly, the metals adsorbed in the present study can be assignedto the alkaline-earth-metal uranium-carbonates, and thus a qualitativedetection of these species has taken place. 4.5. Orbitrap mass spectrometry The samples from the dilution series of the model system 2_2 withuranium concentrations of 10-5-10-7mol/L were further analyzed byan electrospray Orbitrap mass spectrometer. The source was operatedin positive mode because the uranyl hydroxide (UO2OH*) cation wasexpected to be the second most abundant species besides the unchargeduranyl carbonate (UO2CO3). In order to simplify spectra evaluation,high-purity chemicals were used. Nevertheless, the spectra are domi-nated by the background electrolyte. Only a few additional peaks in thesolutions could be identified and attributed to uranium species. The peaks at mas to charge ratios of 323.06 and 305.05 and 287.04can be assigned to the uranyl hydroxide ion carrying different numbersof water molecules in the solvent shell. The water molecules are aremnant of the ESI process, where the evaporation of the solvent wasnot complete. While this effect increases the number of peaks it isnevertheless desirable because it demonstrates soft ionization by theESI process. Furthermore, additional peaks in the spectra can be as-signed to the uranyl ion (UO2+) carrying one or two water molecules.The uranyl ion (UO2) appears as a singly-charged species, but it isknown from previous ESI-MS studies that uranyl undergoes partial re-duction after desolvation, resulting in a UO2peak at 270.04 m/z and288.05 and 306.06 respectively (Agnes and Horlick, 1992; Galindo andDel Nero, 2013; Moulin et al., 2000). Uranyl hydroxide, as just de-scribed, could be identified as the dominant positively charged species in all samples of the dilution series. Fig. 6 compares the intensities ofthe peaks of uranyl hydroxide with 0, 1 and 2 water molecules and freeuranyl with one or two water molecules. The intensity of the peaksincreases with increasing uranium concentration and the number ofwater molecules. As can be seen from the diagram, the intensity of thepeaks increases with the uranium concentration and the number ofwater molecules, with no more than two water molecules in the sol-vation shell. The stability of the measurements and the associated re-producibility do not allow absolute quantification, but only a compar-ison of the intensities with each other. 4.6. Comparison of modelling and experimental results The results of the model calculations are summarized in Table 7, thecalculated relative abundances are given as percentage and are printedin bold for all species confirmed experimentally. In addition, for allspecies with expected relative abundances greater than one percent,which could not be confirmed experimentally, the absolute concentra-tions in mol/L are given in parentheses. For species with relativeabundances <0.1% or equal to zero the value is omitted for the sake ofclarity. For all investigated neutral and alkaline systems, at least the two, inmost cases the three, species with the highest expected relative abun-dances could be confirmed. All species with expected concentra-tions > 10-mol/Lwere idetected.h.It sshouldbe noted thatCa,UO,(CO)s and CaUO (CO)scannot be distinguished by thechosen methods. The same applies to the detection of UO,(CO)3andUO(CO)2 in the extraction experiments. Low temperature spectro-scopic data of MgUO2(CO3)3 has been obtainied for the first timeusing TRLFS (Supplementary Information). For the acidic waters of the mining area Konigstein, however, thereare contradictions to the model calculations. Based on the model cal-culation, UO2SO4(aq) is the dominating uranium species for both waters,while the emission bands of the two solutions are clearly shifted fromeach other both at low and room temperature. On the other hand, the 0000>c一 m/z Table 7 Summary of the results of the model calculations, the calculated relative abundances are given as a percentage. The polymeric species are weighted with respect totheir number of uranyl units. For species with relative abundances < 0.1% or equal to zero the value is omitted for the sake of clarity. The relative abundances of allspecies experimentally detected are printed in bold. In addition, for all species with expected relative abundances > 1% that could not be detected experimentally,the absolute concentrations in mol/L are given in parentheses. 1_1 1_2 2_1 2 2 10- 2210-6 2210- 3_1 4_1 4_2 (002)2CO,(OH), 7.3(410-9) 35.4 70.8 Ca,UO,(CO)s 10.1 46.6 71.2 0.1 CaUO,(CO)3 49.1 37.1 26.5 0.1 0.1 MgUO,(CO)3 10.3 10.8 1.8 0.1 0.1 9.0 UO,(CO)2 2.2(210-9) 1.6(210-8) 0.7 UO,(CO)3 30.5 5.4 0.4 0.3 0.2 0.1 90.7 UO,(OH), 0.8 0.5 0.2 UO 2.2 1.5 0.7 14.0 12.0 UO,CO, 77.2 53.7 24 UO,HPO4 1.2(110-9) 0.8 0.4 UO,OH 8.1 5.7 2.5 UO,SO 69.4 62.6 UO,(SO)2 13.8 24.1 evaluation of the fluorescence lifetimes gives comparable results forboth samples. Due to the experimental difficulties described above, noclear statement can be made here. 5. Conclusions and outlook It has been found that common thermodynamic databases for geo-chemical modelling software differ strongly in completeness, con-sistency and recent knowledge about uranium speciation in aquaticenvironments. This affects especially stable earth alkali uranyl carbo-nate and low dissolvable phosphate uranyl complexes that are highlyrelevant for migration behavior of uranium in neutral and alkalinesystems. This paper not only strives to increase the sensitivity of geo-chemical modelers for this fundamental issue. Furthermore, it attemptsto optimize the thermodynamic database and evaluate its validity forvarious natural high uranium aquatic systems. The optimized database was evaluated using model calculations andcomparative laboratory experiments applying time-resolved laserfluorescence spectroscopy (TRLFS), extraction experiments and orbi-trap mass spectrometry. The results reflect the capabilities as well aslimitations of these advanced analytical techniques to quantify uranylspeciation in natural water. In the case of model system 2_2, a con-centration series with uranium concentrations of 10-5, 10-6 und10-mol/L was prepared and used for evaluation because the con-centration of uranium in the natural analogue was below the detectionlimits of TRLFS and Orbitrap-MS. While some contradictions remain forthe acidic waters, in the cases of all neutral and alkaline systems, atleast the two, in most cases the three, species with the highest expectedrelative abundances could be confirmed. The presented database is inherently consistent. Keeping the abovementioned analytical capabilities in mind, it can be considered to meetthe observed uranyl speciation distribution in the used neutral and al-kaline model systems and comparable waters, such as shallowgroundwater and pore water, reasonably well. Additional investigationsare required for waters with significantly different compositions, suchas acidic, sulfate dominated waters. Acknowledgement Financial support for this research was provided by the FederalIWrnstitute for Geosciences and Natural Resources. We thank WismutGmbH for providing natural analogues for groundwater and pore waterchemistry from uranium mining legacy sites, which enabled this studyto select appropriate synthetic water compositions. The authors wouldlike to thank Vivien Schulte for providing us with Fig. 1 and editingFigs. 2 and 3. Supplementary data to this article can be found online at https://doi.org/10.1016/j.apgeochem.2018.10.006. References Agnes, G.R., Horlick, G.,1992. Electrospray mass-spectrometry as a technique for ele-mental analysis - preliminary results. Appl. Spectrosc. 46, 401-406. Altmaier, M., Brendler, V.,Bosbach, D., Kienzler,B., Marquardt, C., Neck, V.,Richter, A.,2004. Sichtung. Zusammenstellung und Bewertung von Daten zur geochemischenModellierung. Altmaier,M., Brendler, V., Bube, C., Marquardt, C., Moog, H.C., Richter, A., Scharge, T.,11mVoigt, W. Wilhelm, S., Wilms, T., Wollmann, G., 2011. THEREDA - Thermodynamische Referenzdatenbasis. GRS. Altmaier, M., Fanghanel, T., Neck, V., 2006. Solubility of Uranium(VI) in Dilute toConcentrated NaCl, MgCl2 and CaCl2 Solutions. Ball, J.W.,Nordstrom, D.K., 1991. WATEQ4F Database. US Geological Survey. Bernhard, G., Geipel,G., Brendler,V., Nitsche, H., 1996. Speciation of uranium in seepage waters of a mine tailing pile studied by time-resolved laser-induced fluorescencespectroscopy (TRLFS). Radiochim. Acta 74, 87-91. Bernhard, G., Geipel, G., Brendler, V., Nitsche, H., 1998. Uranium speciation in waters ofdifferent uranium mining areas. J. Alloy. Comp. 271, 201-205. Bronsted, J.N., 1922. Studies on solubility. Ⅳ. The principle of the specific interaction ofions. J. Am. Chem. Soc. 44, 877-898. Brown, P.L., Ekberg, C., 2016. Hydrolysis of Metal Ions. Wiley. Dong, W., Brooks, S.C., 2006. Determination of the formation consKStants of ternary com-1-,plexes of uranyl and carbonate with alkaline earth metals (Mg, Ca+, Sr1, andBa )using anion exchange method.Environ. Sci. Technol. 40, 4689-4695. Dong, W., Brooks, S.C., 2008. Formation of aqueous MgUO2(CO3)3complex and ur-anium anion exchange mechanism onto an exchange resin. Environ. Sci. Technol. 42,1979-1983. Finch, R., Murakami, T., 1999. Systematics and paragenesis of uranium minerals. Rev.Mineral. Geochem. 91-179. Freyer, M.,Walther, C., Stumpf, T., Buckau, G., Fanghanel, T., 2009. Formation of CmHumate Complexes in aqueous solution at pH 3 to 5.5: the role of fast interchange.Radiochim. Acta 97, 547-558. Galindo, C., Del Nero, M., 2013. Trace level uranyl complexation with phenylphosphonicacid in aqueous solution: direct speciation by high resolution mass spectrometry.Inorg. Chem. 52, 4372-4383. Geipel, G., Amayri, S., Bernhard, G., 2008. Mixed complexes of alkaline earth uranylcarbonates: a laser-induced time-resolved fluorescence spectroscopic study.Spectrochim. Acta Mol. Biomol. Spectrosc. 71, 53-58. Geipel, G., Brachmann, A., Brendler, V., Bernhard, G., Nitsche, H., 1996. Uranium(VI)sulfate complexation studied by time-resolved laser-induced fluorescence spectro-scopy (TRLFS). Radiochim. Acta 75 (4), 199-204. Gorman-Lewis, D., Fein, J.B., Burns, P.C., Szymanowski, J.E.S., Converse, J., 2008. Solubility measurements of the uranyl oxide hydrate phases metaschoepite, com-preignacite, Na-compreignacite, becquerelite, and clarkeite. J. Chem. Therm. 40,980-990. Gorman-Lewis, D., Mazeina, L., Fein, J.B., Szymanowski, J.E.S., Burns, P.C., Navrotsky,A., 2007.Thermodynamic properties of soddyite from solubility and calorimetrymeasurements. J. Chem. Thermodyn. 39, 568-575. Gorman-Lewis, D., Shvareva,T., Kubatko, K.A., Burns, P.C., Wellman, D.M., McNamara,B., Szymanowski, J.E.S., Navrotsky A., Fein, J.B.,2009. Thermodynamic propertiesof autunite, uranyl hydrogen phosphate, and uranyl orthophosphate from solubilityand calorimetric measurements. Environ. Sci. Technol. 43, 7416-7422. Grenthe, I., Fuger, J., Konings, R.J.M., Lemire, R.J., Muller, A.B., Nguyen-Trung, C.,Wanner, H., 1992. Chemical Thermodynamics of Uranium. Grive, M., Duro, L., Colas, E., Giffaut, E., 2015.Thermodynamic data selection applied toradionuclides and chemotoxic elements: an overview of the ThermoChimie-TDB.Appl. Geochem. 55, 85-94. Guillaumont,R., Fanghanel, T., Fuger, J.,Grenthe, I., Neck, V., Palmer, D.A., Rand, M.H.,2003. Update on the Chemical Thermodynamics of U, Am, Np, Pu and Tc. Elsevir,Amsterdam. Hakam, O.K., Choukri, A., Moutia, Z., Chouak, A., Cherkaoui,R., Reyss, J.L., Lferde, M.,2001a. Uranium and radium in groundwater and surface water samples in Morocco.Radiat. Phys. Chem. 61,653-654. Hakam,O.K., Choukri, A., Reyss, J.L., Lferde, M., 2000. Activities and activity ratios of Uand Ra radioisotopes in drinking wells, springs and tap water samples in Morocco.Radiochim. Acta 88, 55-60. Hakam, O.K., Choukri, A., Reyss, J.L., Lferde, M., 2001b. Determination and comparisonof uranium and radium isotopes activities and activity ratios in samples from somenatural water sources in Morocco. J. Environ. Radioact. 57, 175-189. Hummel, W., Anderegg, G., Puigdomenech, I., Rao, L., Tochiyama, O., 2005. PSI/NagraChemical Thermodynamic Database 12/07. PSI/Nagra, Amsterdam. Kimura, T., Choppin, G.R., 1994. Luminescence study on determination of the hydrationnumber of Cm(III). J. Alloy. Comp. 213, 313-317. Langmuir, D., 1997. Aqueous Environmental Geochemistry. Prentice Hall.Mahoney, J.J., 2013. Sensitivity of database selection in modeling the transport of ur- anium. In: Annual International Mine Water Association Conference - Reliable MineWater Technology (IMWA 2013), Golden, Colorado, USA. Meinrath, G., Volke, P., Helling, C.,Dudel, E.G., Merkel, B.J., 1999. Determination andinterpretation of environmental water samples contaminated by uranium miningactivities. Fresen. J. Anal. Chem. 364, 191-202. Moog, H.C., Bok, F., Marquardt, C.M., Brendler, V., 2015. Disposal of nuclear waste inhost rock formations featuring high-saline solutions -implementation of a thermo-dynamic reference database (THEREDA). Appl. Geochem. 55, 72-84. Moulin, C., Charron, N., Plancque, G.,Virelizier, H., 2000. Speciation of uranium byelectrospray ionization mass spectrometry: comparison with time-resolved laser-in-duced fluorescence. Appl. Spectrosc. 54, 843-848. Muto, T., Hirono, S., Kurata, H., 1965. Some aspects of fixation of uranium from naturalwaters. Min. Geol. 15, 287-298. Muto, T., Hirono, S., Kurata, H., 1968. Some Aspects of Fixation of Uranium from NaturalWaters. Japan Atomic Energy Research Inst. Neck,V., Fanghanel, T., Metz, V., Kienzler, B., 2001. Kenntnisstand zur aquatischenChemie und der thermodynamischen Datenbasis von Actiniden und Technetium. In:Abschlussbericht zum BfS-Projekt ,,Erstellung eines Nahfeldmodells von Gebindenhochradioaktiver Abfalle im Salzstock Gorleben: geochemisch fundierter Quelltermfir HAW-Glas, abgebrannte Brennelemente und Zement. ForschungszentrumKarlsruhe. Osman, A.A.A., Geipel, G., Bernhard, G., Worch, E.,2013. Investigation of uraniumbinding forms in selected German mineral waters. Environ. Sci. Pollut. Control Ser.20(12),8629-8635. Parkhurst, D.L., Appelo, C.A.J., 1999. User’s Guide to PHREEQC (Version 2): a ComputerProgram for Speciation, Batch-reaction, One-dimensional Transport, and InverseGeochemical Calculations, Water-resources Investigations Report. - ed.. Post, V.E.A., Vassolo, S.I., Tiberghien, C., Baranyikwa, D., Miburo,D., 2017. Weatheringand evaporation controls on dissolved uranium concentrations in groundwater - acase study from northern Burundi. Sci. Total Environ. 607-608, 281-293. Rai,D., Felmy Andrew, R., Hess Nancy,J., Moore Dean, A., Yui, M., 1998. A thermo-2dynamic model for the solubility of UO2(am) in the aqueous K+-Na+-HCO3-CO3OH -H2O system. Radiochim. Acta 17. Richter, A., Bok, F., Brendler, V., 2015. Data compilation and evaluation of U(IV) and U(VI) for the thermodynamic reference database THEREDA. https://www.thereda.de/de/. Sandino, M.C.A., Grambow, B., 1994. Solubility equilibria in the U(VI)-Ca-K-Cl-H2Osystem: transformation of schoepite into bequerelite and compreignacite. Radiochim.Acta 66-7,37-43. Schreyer, J.M., Baes, C.F., 1954. The solubility of uranium(VI) orthophosphates inphosphoric acid solutions. J. Am. Chem. Soc. 76,354-357. Silva, R.J., Nitsche, H., 1995. Actinide environmental chemistry. Radiochim. Acta 377.Skeppstrom, K., Olofsson, B., 2007. Uranium and radon in groundwater -an overview ofthe problem. European Water 17/18, 51-62. Smith, B., Hutchins, M.G., Powell, J.H., Talbot, D., Trick, J.K., Gedeon, R., Amro, H.,Kilani, S., Constantinou, G., Afrodisis, S., Constantinou, C., 2000. The Distribution ofNatural Radioelements in Ground Waters and Post-Cretaceous Sediments from theSouthern Mediterranean Margin. Steudtner, R., Arnold, T., Geipel, G., Bernhard, G., 2010. Fluorescence spectroscopic studyon complexation of uranium(VI) by glucose: a comparison of room and low tem-f2perature measurements. J. Radioanal. Nucl. Chem. 284 (2), 421-429. Vercouter, T., Reiller, P.E., Ansoborlo, E., Fevrier, L., Gilbin, R., Lomenech,C., Philippini,V., 2015. A modelling exercise on the importance of ternary alkaline earth carbonatespecies of uranium(VI) in the inorganic speciation of natural waters. Appl. Geochem.55,192-198. Vercouter, T., Vitorge, P., Amekraz, B., Moulin, C., 2008. Stoichiometries and thermo-dynamic stabilities for aqueous sulfate complexes of U(VI). Inorg. Chem. 47,2180-2189. Wang, Z.,Zachara John, M., Liu, C., Gassman, P.L., Felmy Andrew, R., Clark Sue, B.,2008. A cryogenic fluorescence spectroscopic study of uranyl carbonate, phosphateand oxyhydroxide minerals. Radiochim.Acta Int. J. Chem. Aspects Nuclear Sci.Technol. 591. Wang, Z.M., Zachara, J.M., Yantasee,W., Gassman, P.L., Liu, C.X., Joly, A.G., 2004.Cryogenic laser induced fluorescence characterization of U(VI) in hanford vadosezone pore waters. Environ. Sci. Technol. 38, 5591-5597. Environmental hazards are caused by uranium mining legacies and enhanced radioactivity in utilized groundwater and surface water resources. Knowledge of uranium speciation in these waters is essential for predicting radionuclide migration and for installing effective water purification technology. The validity of the thermodynamic data for the environmental media affected by uranium mining legacies is of utmost importance. Therefore, a comprehensiveand consistent database was established according to current knowledge. The uranium data included in the database is based on the NEA TDB (Guillaumont et al. 2003) and is modified or supplemented as necessary e.g. for calcium and magnesium uranyl carbonates. The specific ion interaction theory (Brönsted, 1922) is used to estimate activity constants, which is sufficient for the considered low ionic strengths. The success of this approach was evaluated by comparative experimental investigations and model calculations (PHREEQC (Parkhurst and Appelo, 1999)) for several model systems. The waters differ in pH (2.7–9.8), uranium concentration (10−9-10−4 mol/L) and ionic strength (0.002–0.2 mol/L). We used chemical extraction experiments, ESI-Orbitrap-MS and time-resolved laser-induced fluorescencespectroscopy (TRLFS) to measure the uranium speciation. The latter method is nonintrusive and therefore does not change the chemical composition of the investigated waters. This is very important, because any change of the system under study may also change the speciation.
确定


还剩8页未读,是否继续阅读?

产品配置单

北京欧兰科技发展有限公司为您提供《铀中热力学数据库检测方案(激光产品)》,该方案主要用于稀土/稀有金属中热力学数据库检测,参考标准--,《铀中热力学数据库检测方案(激光产品)》用到的仪器有NL300系列高能量电光调Q激光器
推荐专场


相关方案
更多
该厂商其他方案
更多