


方案详情
文
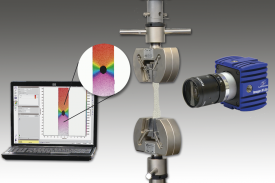
采用LaVision的数字图像相关软件包DIC,对沙箱模型中沙层的运动,形变进行了测量分析,模拟了半地堑俯冲过程,获得了深入的信息信息。该实验结果,有助于对日本海沟浅层边界断层厚变形带动态形成过程的了解。
方案详情

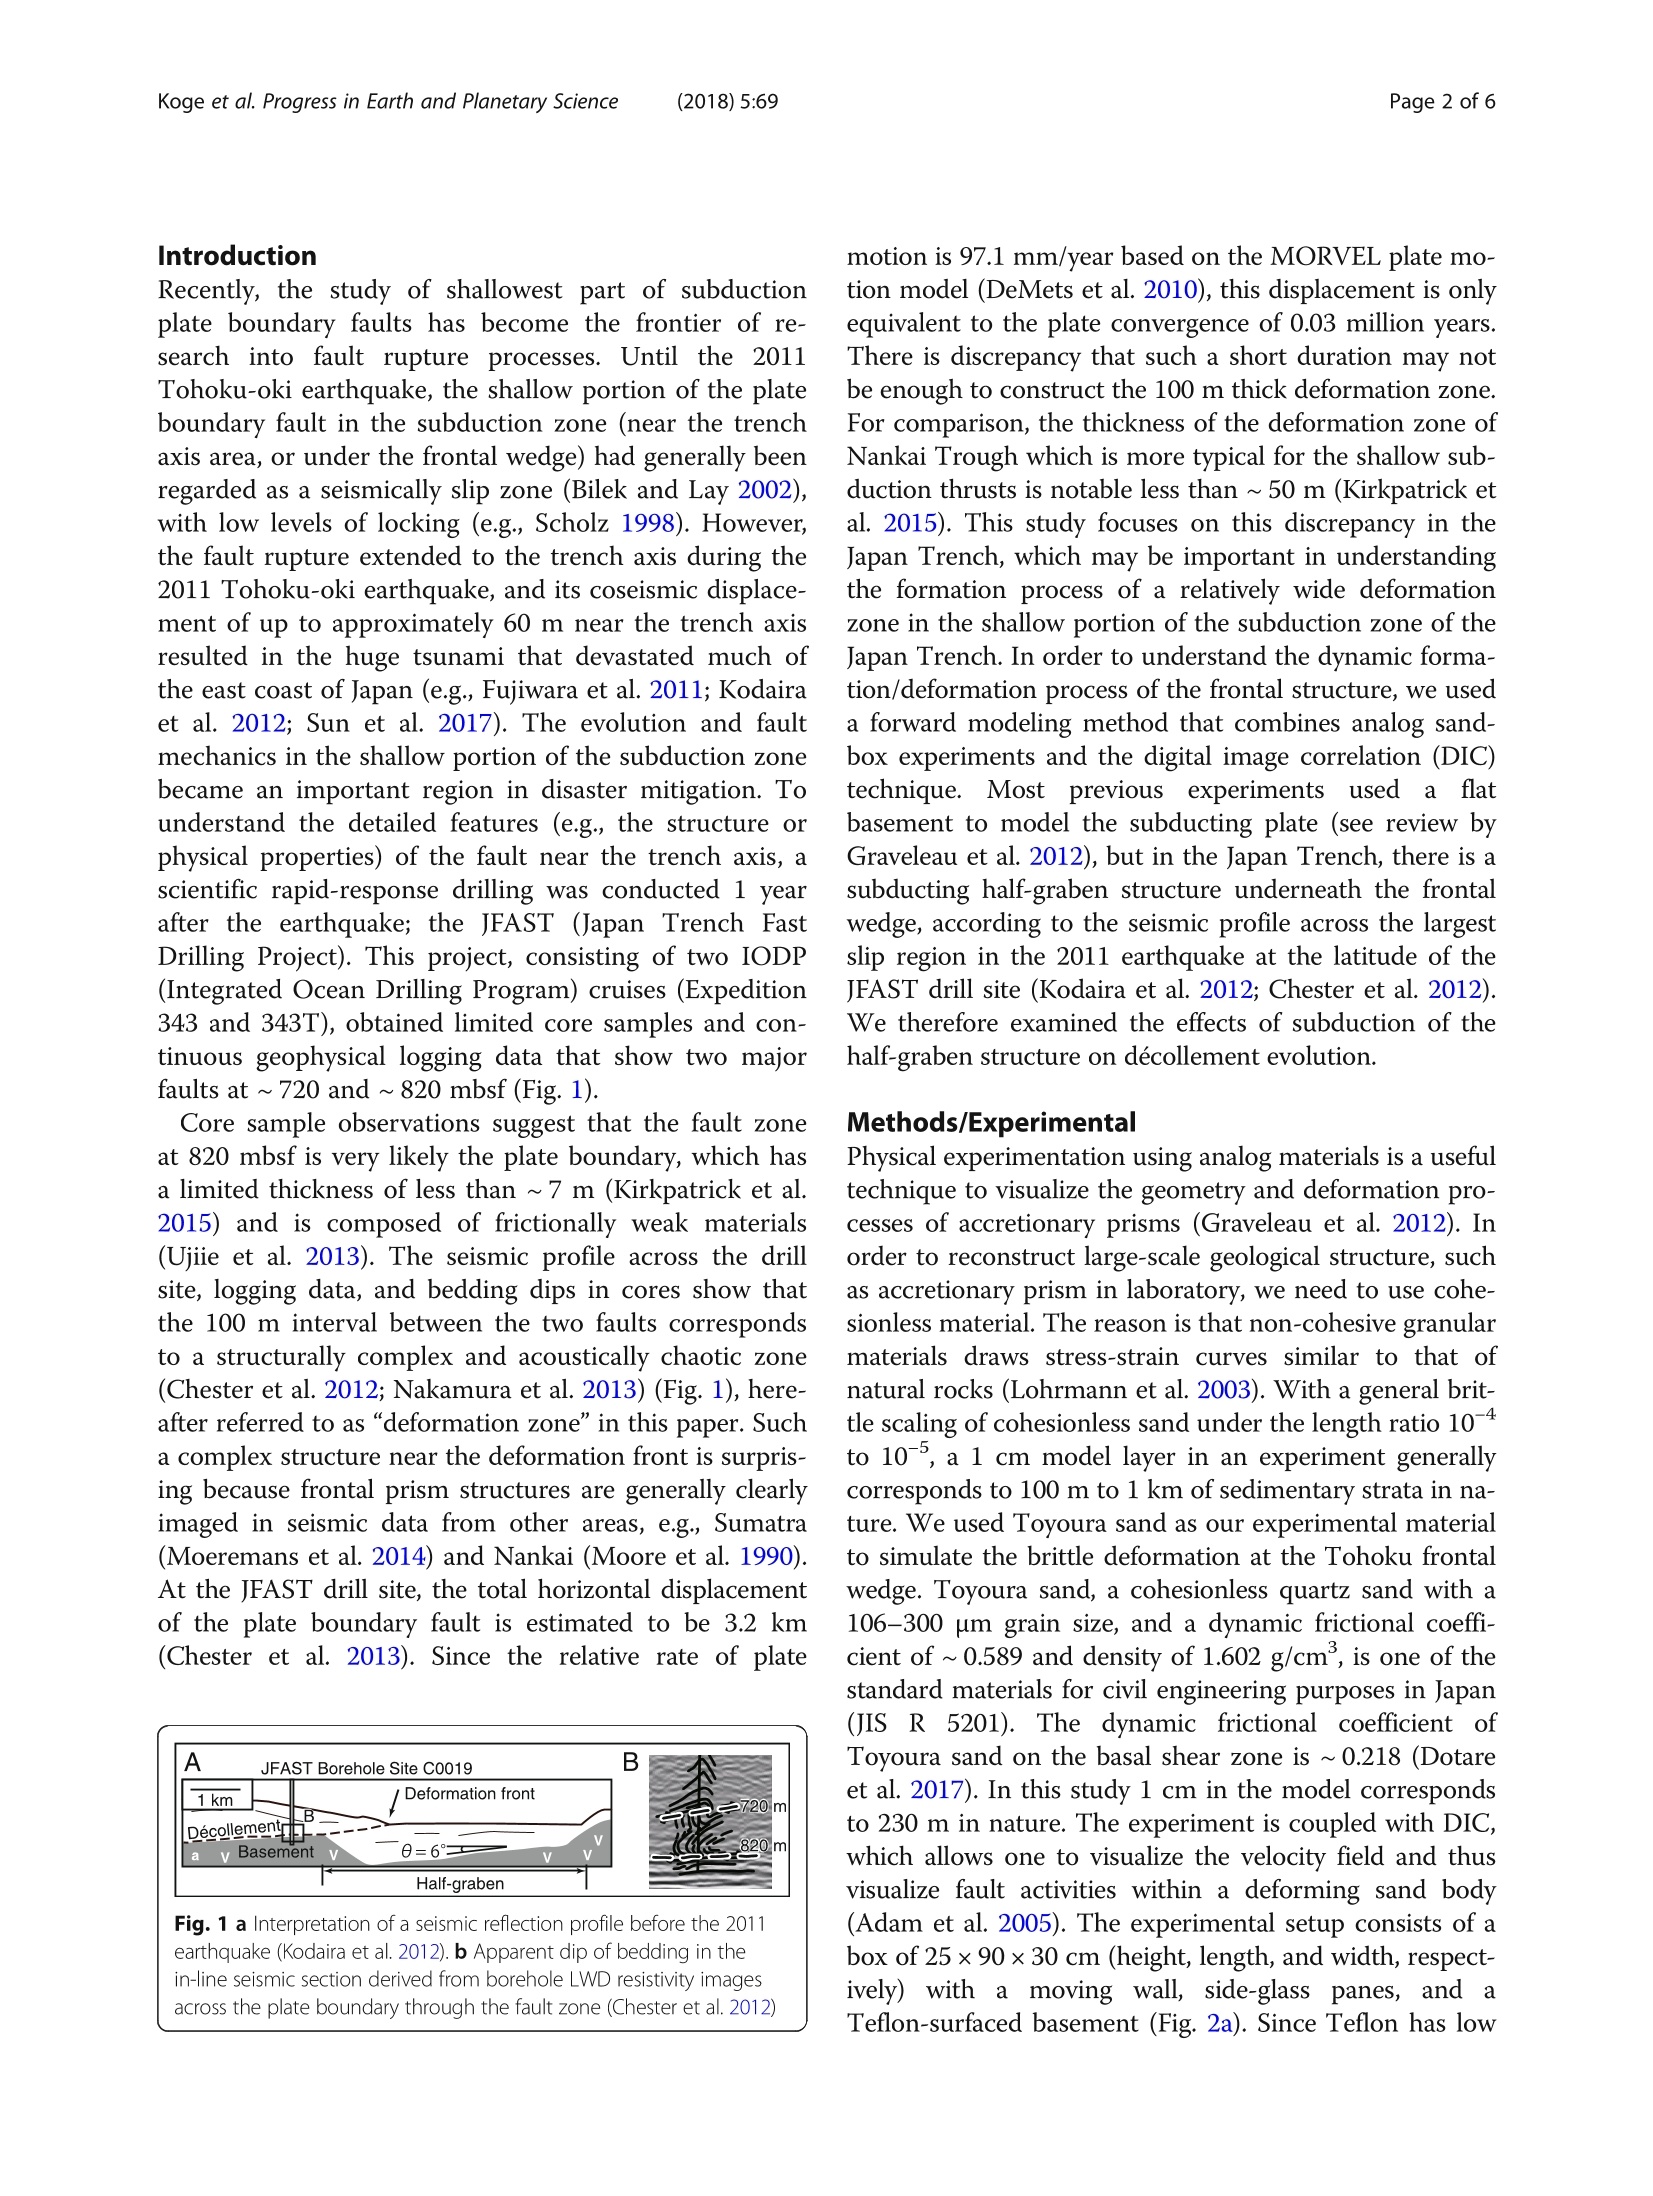
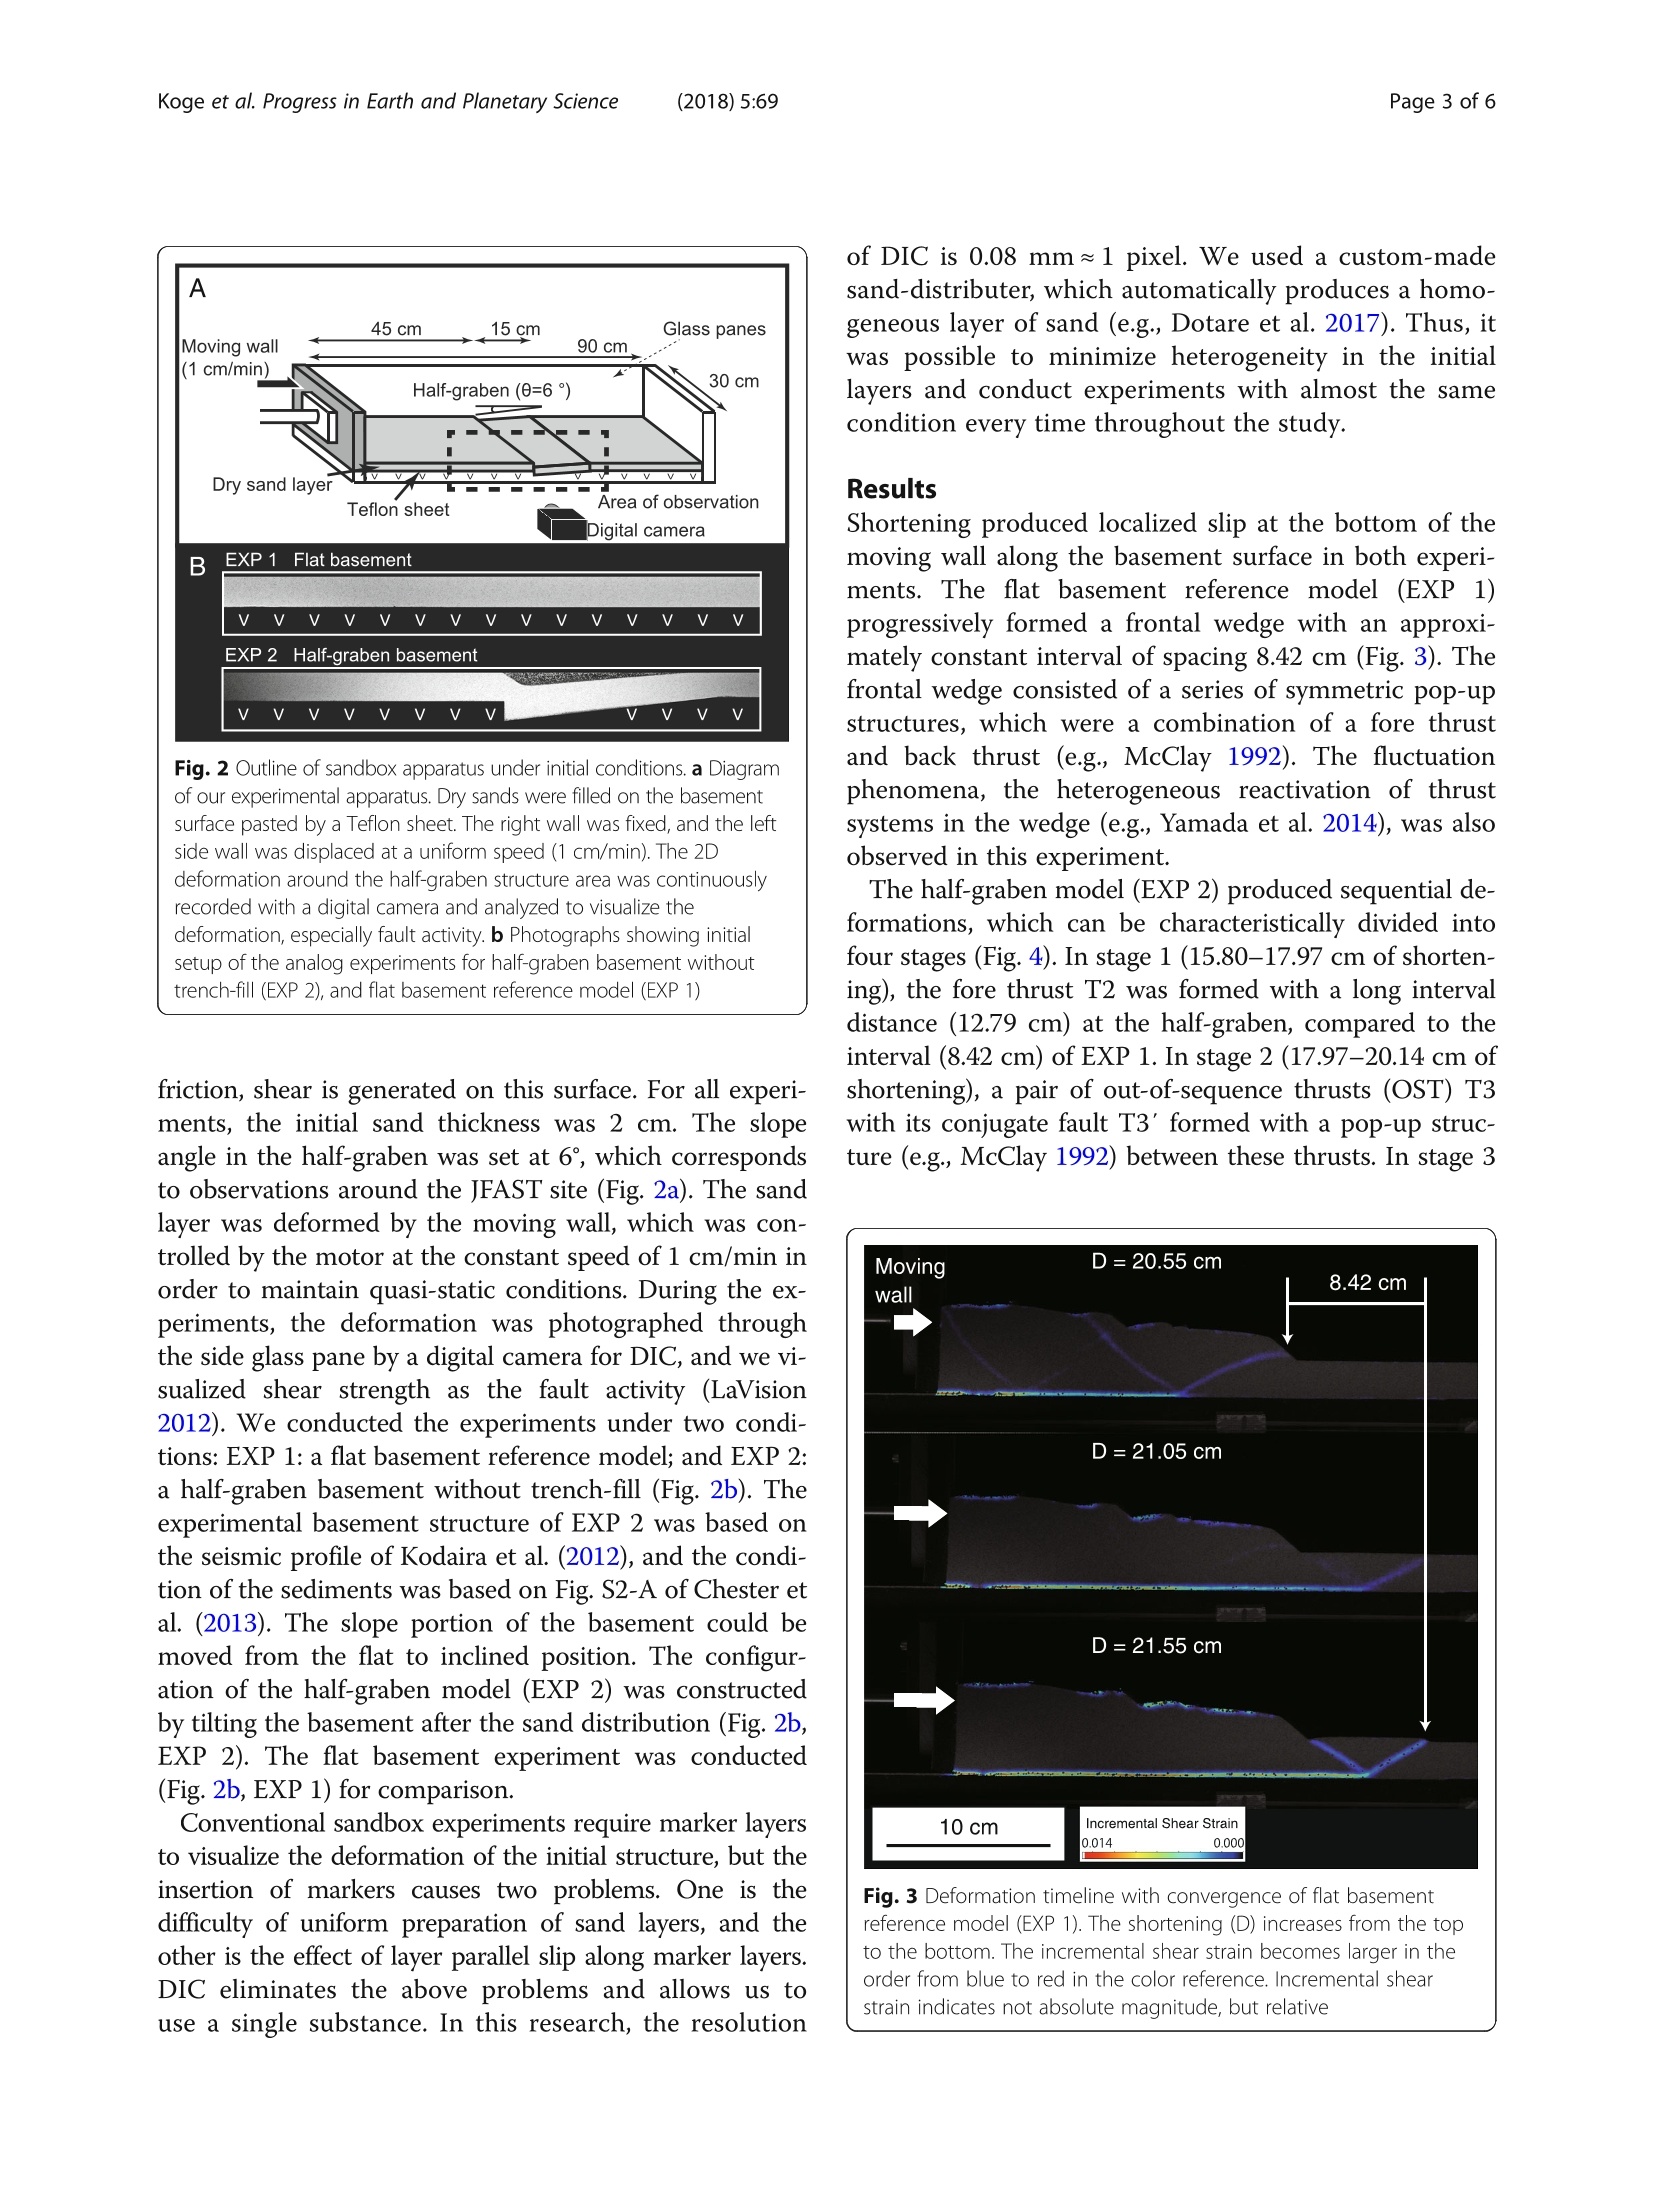
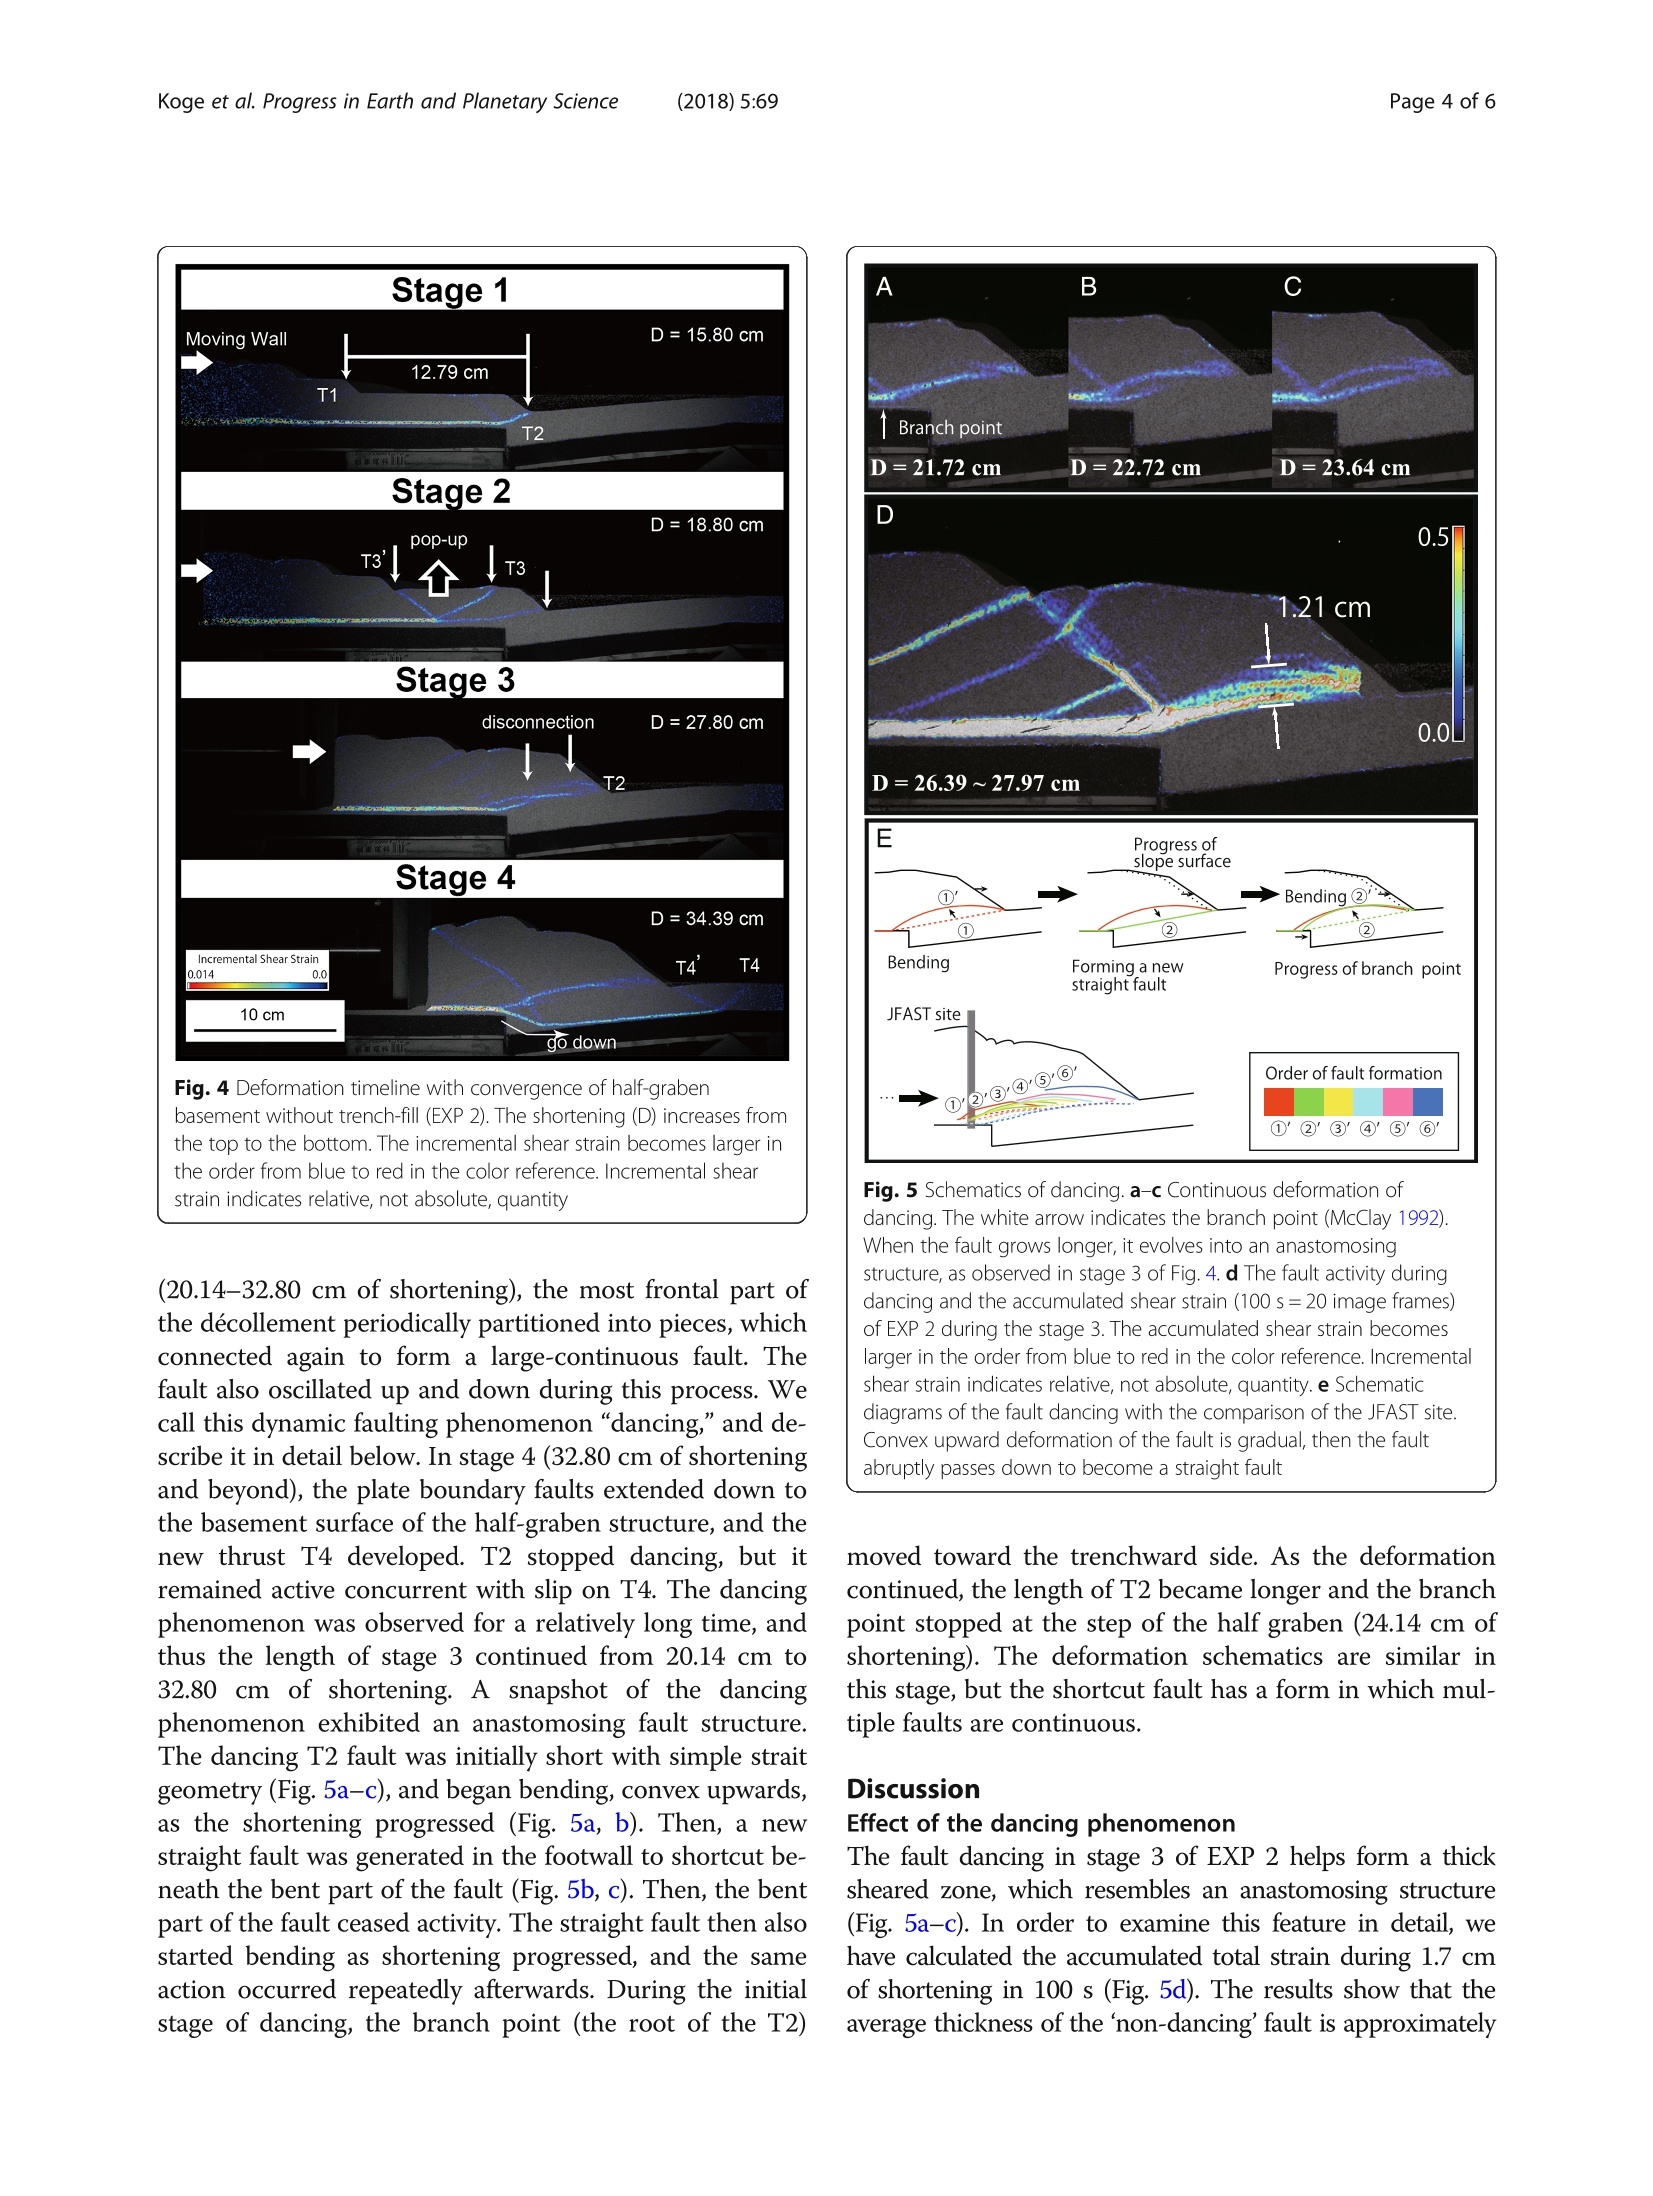
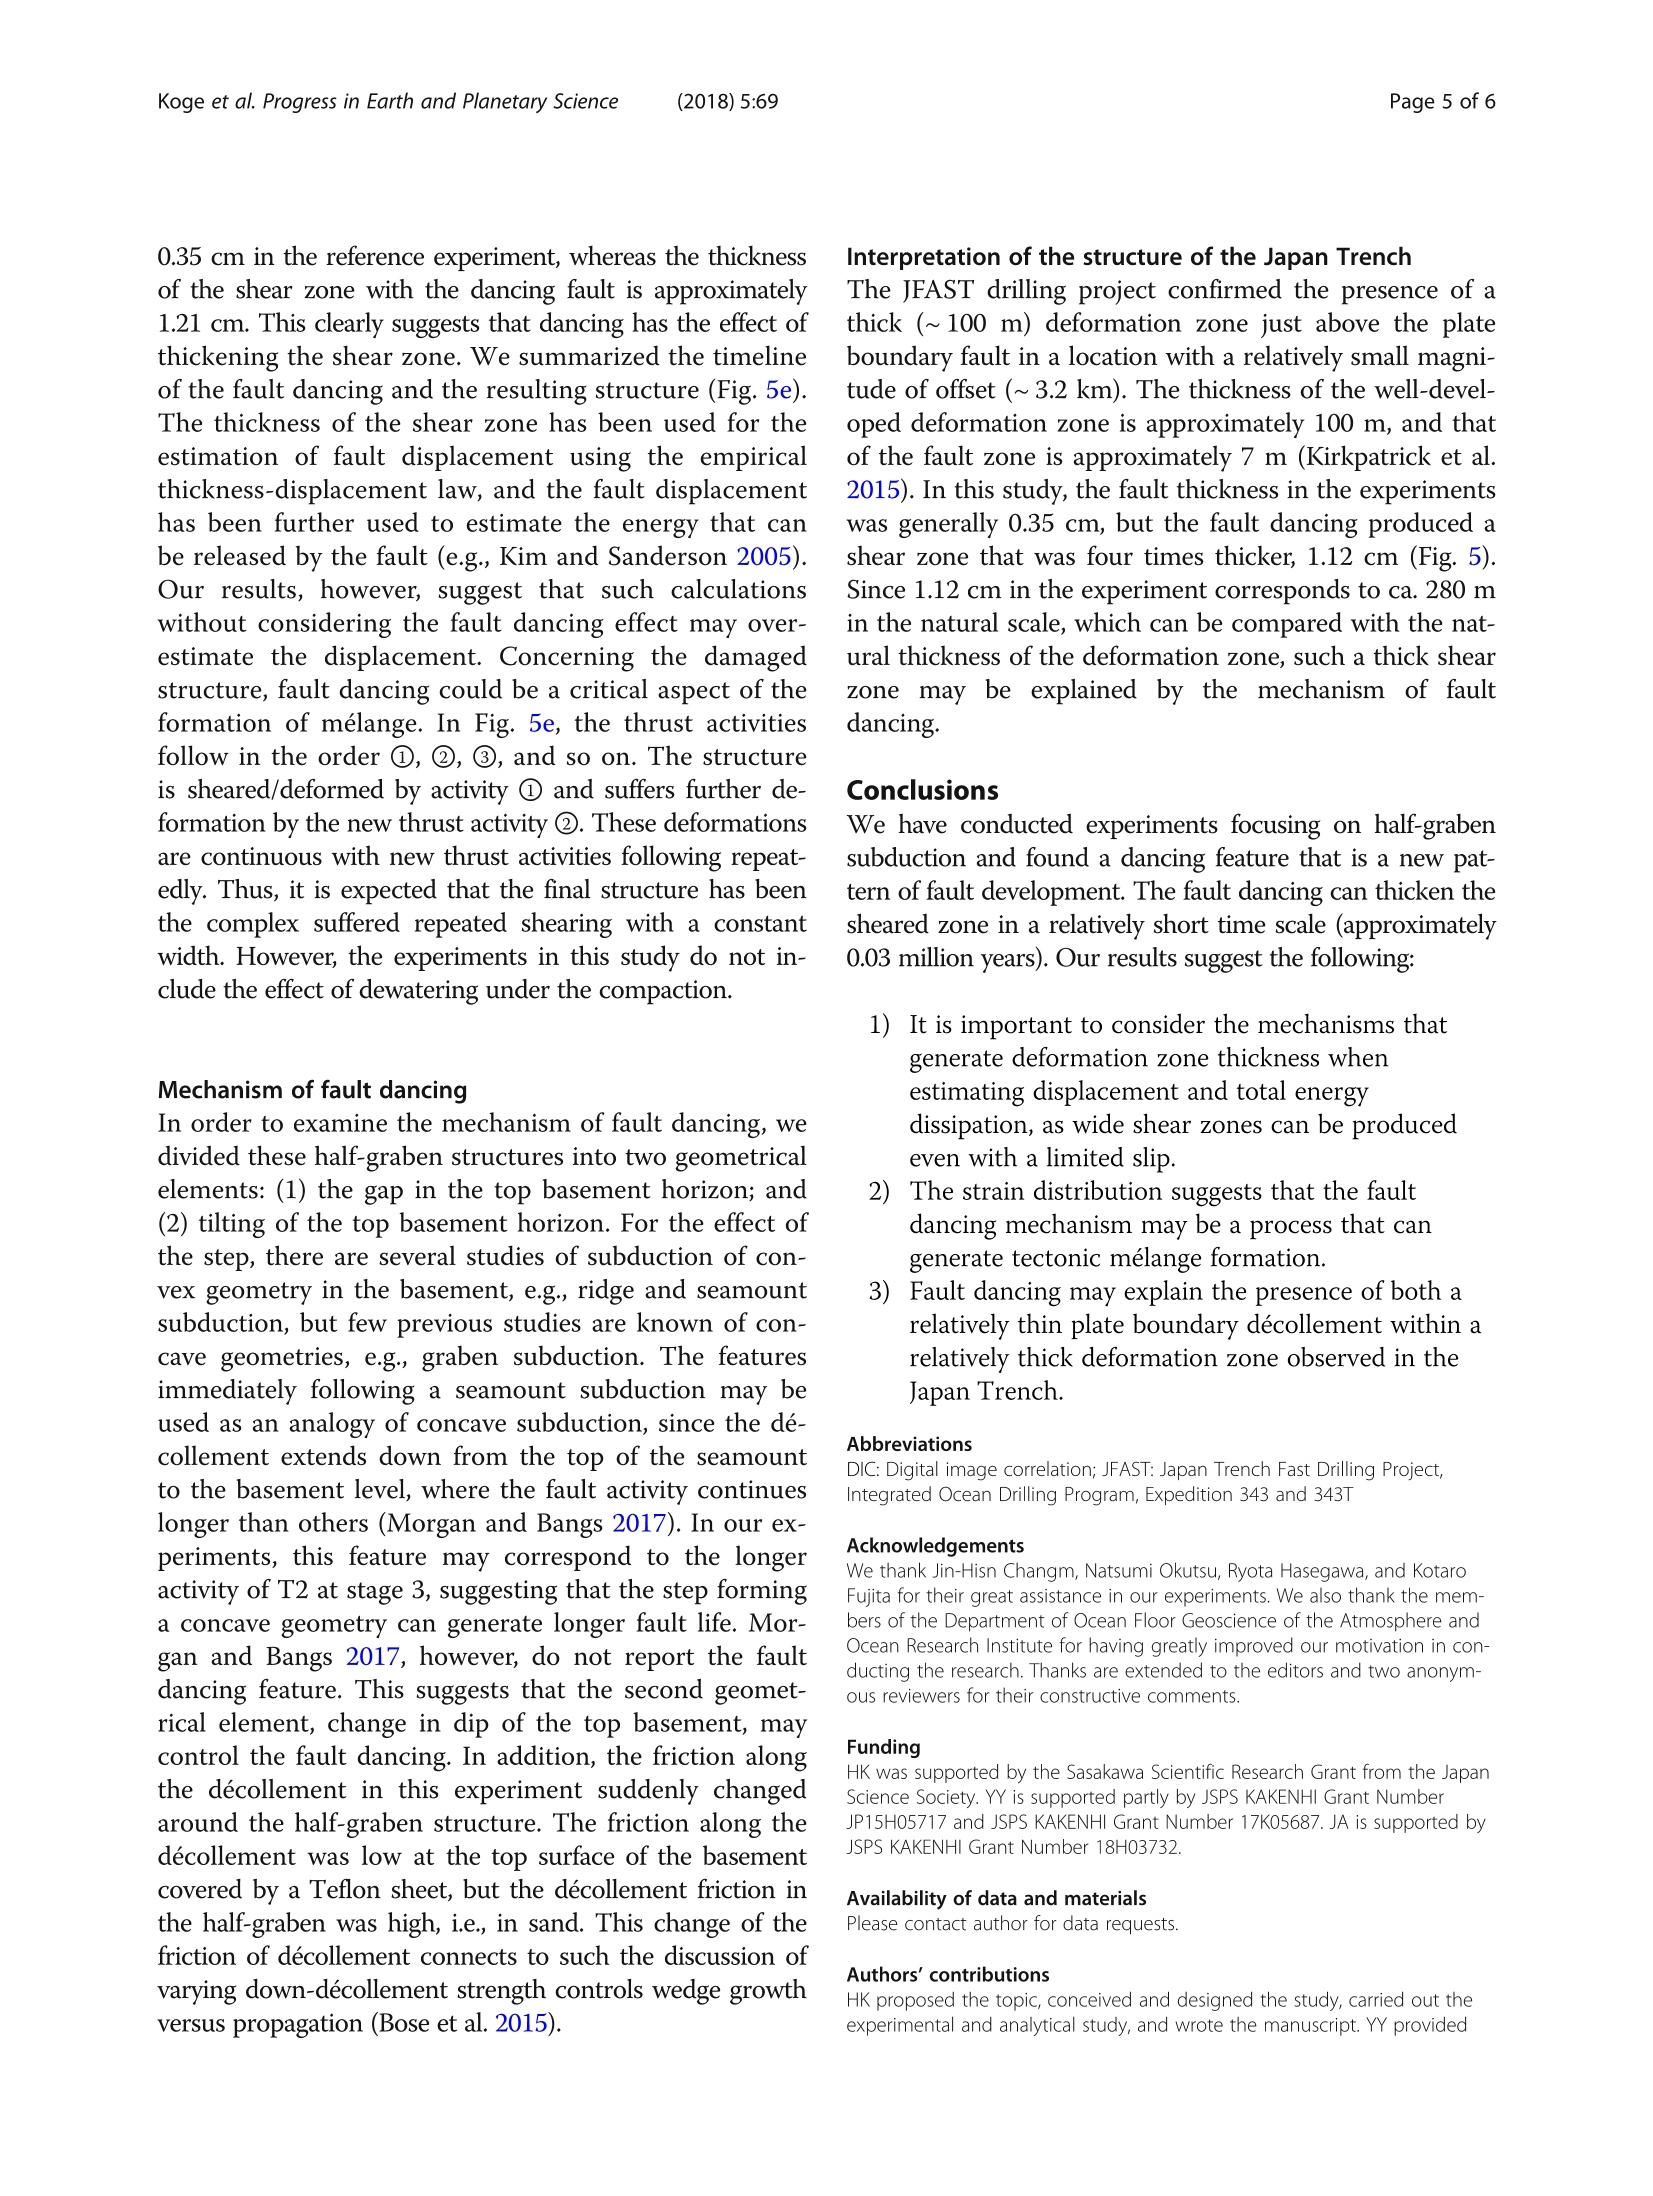
Progress in Earth andPlanetary ScienceKoge et al. Progress in Earth and Planetary Sciencehttps://doi.org/10.1186/s40645-018-0230-5(2018)5:69 Page 2 of 6Koge et al. Progress in Earth and Planetary Science(2018) 5:69 RESEARCH ARTICLE Open Access Dynamic formation process of thickdeformation zone on the shallow plateboundary fault of the Japan Trench: insightfrom analog experiments of half-grabensubduction CrossMark Hiroaki Koge123*), Yasuhiro Yamada34, Akihiro Ohde, Arthur Bauville, Asuka Yamaguchi" and Juichiro Ashi Abstract The 2011 Tohoku-oki earthquake unexpectedly ruptured to the shallowest portion of the plate boundary fault andtriggered a large tsunami. The shallow portion had generally been regarded as a seismically stable zone until thisevent, but its significance has now been dramatically revealed for future disaster mitigation. This research approachesthe shallow portion, especially the formation process of its structure and plate boundary faults. Scientific drillingconducted near the Japan Trench after the earthquake reported a thin plate boundary fault (~7 m) and thickdeformation zone (~ 100 m). This thin fault would be expected given the relatively small displacement near thetrench (~3.2 km), but the deformation zone thickness is anomalously wide given this small magnitude of slip.To understand the dynamic deformation processes that lead to the development of a thick deformation zonesurrounding a thin fault core, we conducted forward modeling of an analog experiment with the technique tovisualize fault activity. Sandbox experiments are effective for the approximation of the geological phenomenonand structure. The seismic profile of the largest slip region in the 2011 earthquake shows that a half-grabenstructure has been subducted underneath the frontal wedge, thus we focused on this structural architecture.As a result, we found a new fault formation pattern, i.e., the frontal thrust (the most frontal part of décollement)periodically partitioned into pieces, which connect again to form a large-continuous fault. The fault also oscillatesup and down during this process, which we call "dancing," and a thick shear zone is formed in a relatively shorttime where this occurs, even though the fault only has a small displacement. By analogy, the thick deformationzone observed at the Japan Trench could be formed by such fault dancing. The energy of the fault activity iscommonly estimated from the fault displacement derived from the thickness of the shear zones. Applying thethickness-displacement law without considering the effect of the dancing may cause overestimation. The architectureof the shear zone formed is similar to that of a melange, and the origin of tectonic melanges may be explainedby this mechanism. Keywords: Analog model, Digital image correlation, Japan Trench, Sandbox, Thrust formation *Correspondence: koge@aori.u-tokyo.ac.jp 'Atmosphere and Ocean Research Institute, The University of Tokyo, 5-1-5 Kashiwanoha, Kashiwa-shi, Chiba 277-8564, Japan Department of Natural Environmental Studies Division of Environmental Studies, Graduate School of Frontier Sciences, The University of Tokyo, 5-1-5 Kashiwanoha, Kashiwa-shi, Chiba 277-8564, Japan Full list of author information is available at the end of the article o The Author(s). 2018 Open Access This article is distributed under the terms of the Creative Commons Attribution 4.0 ( Inter na tional L i cen s e (htt p :/ /cre a ti ve co m m o ns. o r g / l i cen s e s / by / 4 .0 / ) , w hich p er mits u nrestricte d use , dis t ribut i on, an dr epro d u c t i on in any med i um, p rovide d you give a pprop r i a te cr e dit to the o r i ginal auth o r ( s ) and t he so u rce, prov i d e a link t o t he C r e a t ive Com m on s l i ce n se , an d in di cate i f changes were mad e . ) Introduction Recently, the study of shallowest part of subductionplate boundary faults has become the frontier of re-search into fault rupture processes. Until the 2011Tohoku-oki earthquake, the shallow portion of the plateboundary fault in the subduction zone (near the trenchaxis area, or under the frontal wedge) had generally beenregarded as a seismically slip zone (Bilek and Lay 2002),with low levels of locking (e.g., Scholz 1998). However,the fault rupture extended to the trench axis during the2011 Tohoku-oki earthquake, and its coseismic displace-ment of up to approximately 60 m near the trench axisresulted in the huge tsunami that devastated much ofthe east coast of Japan (e.g., Fujiwara et al. 2011; Kodairaet al. 2012; Sun et al. 2017). The evolution and faultmechanics in the shallow portion of the subduction zonebecame an important region in disaster mitigation. Tounderstand the detailed features (e.g., the structure orphysical properties) of the fault near the trench axis, ascientific rapid-response drilling was conducted 1 yearafter the earthquake; the JFAST (Japan Trench FastDrilling Project). This project, consisting of two IODP(Integrated Ocean Drilling Program) cruises (Expedition343 and 343T), obtained limited core samples and con-tinuous geophysical logging data that show two majorfaults at~720 and~820 mbsf (Fig. 1). Core sample observations suggest that the fault zoneat 820 mbsf is very likely the plate boundary, which hasa limited thickness of less than ~7 m (Kirkpatrick et al.2015) and is composed of frictionally weak materials(Ujiie et al. 2013). The seismic profile across the drillsite, logging data, and bedding dips in cores show thatthe 100 m interval between the two faults correspondsto a structurally complex and acoustically chaotic zone(Chester et al. 2012; Nakamura et al. 2013) (Fig.1), here-after referred to as "deformation zone"in this paper. Sucha complex structure near the deformation front is surpris-ing because frontal prism structures are generally clearlyimaged in seismic data from other areas, e.g., Sumatra(Moeremans et al. 2014) and Nankai (Moore et al. 1990).At the JFAST drill site, the total horizontal displacementof the plate boundary fault is estimated to be 3.2 km(Chester et al. 2013). Since the relative rate of plate Fig. 1 a Interpretation of a seismic reflection profile before the 2011earthquake (Kodaira et al. 2012). b Apparent dip of bedding in thein-line seismic section derived from borehole LWD resistivity imagesacross the plate boundary through the fault zone (Chester et al. 2012) motion is 97.1 mm/year based on the MORVEL plate mo-tion model (DeMets et al. 2010), this displacement is onlyequivalent to the plate convergence of 0.03 million years.There is discrepancy that such a short duration may notbe enough to construct the 100 m thick deformation zone.For comparison, the thickness of the deformation zone ofNankai Trough which is more typical for the shallow sub-duction thrusts is notable less than ~50 m (Kirkpatrick etal. 2015). This study focuses on this discrepancy in theJapan Trench, which may be important in understandingthe formation process of a relatively wide deformationzone in the shallow portion of the subduction zone of theJapan Trench. In order to understand the dynamic forma-tion/deformation process of the frontal structure, we useda forward modeling method that combines analog sand-box experiments and the digital image correlation (DIC)technique..Mostt previous experiments used a fflatbasement to model the subducting plate (see review byGraveleau et al. 2012), but in the Japan Trench, there is asubducting half-graben structure underneath the frontalwedge, according to the seismic profile across the largestslip region in the 2011 earthquake at the latitude of theJFAST drill site (Kodaira et al. 2012; Chester et al.2012).We therefore examined the effects of subduction of thehalf-graben structure on décollement evolution. Methods/Experimental Physical experimentation using analog materials is a usefultechnique to visualize the geometry and deformation pro-cesses of accretionary prisms (Graveleau et al. 2012). Inorder to reconstruct large-scale geological structure, suchas accretionary prism in laboratory, we need to use cohe-sionless material. The reason is that non-cohesive granularmaterials draws stress-strain curves similar to that ofnatural rocks (Lohrmann et al. 2003). With a general brit-tle scaling of cohesionless sand under the length ratio 10-*to 10-, a 1 cm model layer in an experiment generallycorresponds to 100 m to 1 km of sedimentary strata in na-ture. We used Toyoura sand as our experimental materialto simulate the brittle deformation at the Tohoku frontalwedge. Toyoura sand, a cohesionless quartz sand with a106-300 um grain size, and a dynamic frictional coeffi-cient of~0.589 and density of 1.602 g/cm, is one of thestandard materials for civil engineering purposes in Japan^...(JIS R5201). The dynamic frictionalcoefficient ofToyoura sand on the basal shear zone is ~0.218 (Dotareet al. 2017). In this study 1 cm in the model correspondsto 230 m in nature. The experiment is coupled with DIC,which allows one to visualize the velocity field and thusvisualize fault activities within a deforming sand body(Adam et al. 2005). The experimental setup consists of abox of 25×90×30 cm (height, length, and width, respect-ively) with a moving wall, side-glass panes, and aTeflon-surfaced basement (Fig. 2a). Since Teflon has low Fig. 2 Outline of sandbox apparatus under initial conditions. a Diagramof our experimental apparatus. Dry sands were filled on the basementsurface pasted by a Teflon sheet. The right wall was fixed, and the leftside wall was displaced at a uniform speed (1 cm/min). The 2Ddeformation around the half-graben structure area was continuouslyrecorded with a digital camera and analyzed to visualize thedeformation, especially fault activity. b Photographs showing initialsetup of the analog experiments for half-graben basement withouttrench-fill (EXP 2), and flat basement reference model (EXP 1) friction, shear is generated on this surface. For all experi-ments, the initial sand thickness was 2 cm. The slopeangle in the half-graben was set at 6°, which correspondsto observations around the JFAST site (Fig. 2a). The sandlayer was deformed by the moving wall, which was con-trolled by the motor at the constant speed of 1 cm/min inorder to maintain quasi-static conditions. During the ex-periments, the deformation was photographed throughthe side glass pane by a digital camera for DIC, and we vi-sualized shear strength as the fault activity (LaVision2012). We conducted the experiments under two condi-tions: EXP 1: a flat basement reference model; and EXP 2:a half-graben basement without trench-fill (Fig. 2b). Theexperimental basement structure of EXP 2 was based onthe seismic profile of Kodaira et al. (2012), and the condi-tion of the sediments was based on Fig. S2-A of Chester etal. (2013). The slope portion of the basement could bemoved from the flat to inclined position. The configur-ation of the half-graben model (EXP 2) was constructedby tilting the basement after the sand distribution (Fig. 2b,EXP 2). The flat basement experiment was conducted(Fig. 2b, EXP 1) for comparison. Conventional sandbox experiments require marker layersto visualize the deformation of the initial structure, but theinsertion of markers causes two problems. One is thedifficulty of uniform preparation of sand layers, and theother is the effect of layer parallel slip along marker layers.DIC eliminates the above problems and allows us touse a single substance. In this research, the resolution of DIC is 0.08 mm~1 pixel. We used a custom-madesand-distributer, which automatically produces a homo-geneous layer of sand (e.g., Dotare et al. 2017). Thus, itwas possible to minimize heterogeneity in the initiallayers and conduct experiments with almost the samecondition every time throughout the study. Results Shortening produced localized slip at the bottom of themoving wall along the basement surface in both experi-ments. The flat basement reference model (EXP 1)progressively formed a frontal wedge with an approxi-mately constant interval of spacing 8.42 cm (Fig. 3). Thefrontal wedge consisted of a series of symmetric pop-upstructures, which were a combination of a fore thrustand back thrust (e.g., McClay 1992). The fluctuationphenomena, the heterogeneous reactivation of thrustsystems in the wedge (e.g., Yamada et al. 2014), was alsoobserved in this experiment. The half-graben model (EXP 2) produced sequential de-formations, which can be characteristically divided intofour stages (Fig. 4). In stage 1 (15.80-17.97 cm of shorten-ing), the fore thrust T2 was formed with a long intervaldistance (12.79 cm) at the half-graben, compared to theinterval (8.42 cm) of EXP 1. In stage 2 (17.97-20.14 cm ofshortening), a pair of out-of-sequence thrusts (OST) T3with its conjugate fault T3’formed with a pop-up struc-ture (e.g.,McClay 1992) between these thrusts. In stage 3 Fig. 3 Deformation timeline with convergence of flat basementreference model (EXP 1). The shortening (D) increases from the topto the bottom. The incremental shear strain becomes larger in theorder from blue to red in the color reference. Incremental shearstrain indicates not absolute magnitude, but relative Fig. 4 Deformation timeline with convergence of half-grabenbasement without trench-fill (EXP 2). The shortening (D) increases fromthe top to the bottom. The incremental shear strain becomes larger inthe order from blue to red in the color reference.Incremental shearstrain indicates relative, not absolute, quantity (20.14-32.80 cm of shortening), the most frontal part ofthe decollement periodically partitioned into pieces, whichconnected again to form a large-continuous fault. Thefault also oscillated up and down during this process. Wecall this dynamic faulting phenomenon"dancing," and de-scribe it in detail below. In stage 4 (32.80 cm of shorteningand beyond), the plate boundary faults extended down tothe basement surface of the half-graben structure, and thenew thrust T4 developed. T2 stopped dancing, but itremained active concurrent with slip on T4. The dancingphenomenon was observed for a relatively long time, andthus the length of stage 3 continued from 20.14 cm to32.80 cm of shortening. A snapshot of the dancingphenomenon exhibited an anastomosing fault structure.The dancing T2 fault was initially short with simple straitgeometry (Fig. 5a-c), and began bending, convex upwards,as the shortening progressed (Fig. 5a, b). Then, a newstraight fault was generated in the footwall to shortcut be-neath the bent part of the fault (Fig. 5b, c). Then, the bentpart of the fault ceased activity. The straight fault then alsostarted bending as shortening progressed, and the sameaction occurred repeatedly afterwards. During the initialstage of dancing, the branch point (the root of the T2) Fig. 5 Schematics of dancing. a-c Continuous deformation ofdancing.The white arrow indicates the branch point (McClay 1992).When the fault grows longer, it evolves into an anastomosingstructure, as observed in stage 3 of Fig. 4.d The fault activity duringdancing and the accumulated shear strain (100 s=20 image frames)of EXP 2 during the stage 3. The accumulated shear strain becomeslarger in the order from blue to red in the color reference. Incrementalshear strain indicates relative, not absolute, quantity. e Schematicdiagrams of the fault dancing with the comparison of the JFAST site.Convex upward deformation of the fault is gradual,then the faultabruptly passes down to become a straight fault moved toward the trenchward side. As the deformationcontinued, the length of T2 became longer and the branchpoint stopped at the step of the half graben (24.14 cm ofshortening). The deformation schematics are similar inthis stage, but the shortcut fault has a form in which mul-tiple faults are continuous. Discussion Effect of the dancing phenomenon The fault dancing in stage 3 of EXP 2 helps form a thicksheared zone, which resembles an anastomosing structure(Fig. 5a-c). In order to examine this feature in detail, wehave calculated the accumulated total strain during 1.7 cmof shortening in 100 s (Fig.5d). The results show that theaverage thickness of the‘non-dancing'fault is approximately 0.35 cm in the reference experiment, whereas the thicknessof the shear zone with the dancing fault is approximately1.21 cm. This clearly suggests that dancing has the effect ofthickening the shear zone. We summarized the timelineof the fault dancing and the resulting structure (Fig. 5e).The thickness of the shear zone has been used for theestimation of fault displacement using the empiricalthickness-displacement law, and the fault displacementhas been further used to estimate the energy that canbe released by the fault (e.g., Kim and Sanderson 2005).Our results, however, suggest that such calculationswithout considering the fault dancing effect may over-estimate the displacement. Concerning the damagedstructure, fault dancing could be a critical aspect of theformation of melange. In Fig. 5e, the thrust activitiesfollow in the order ①,②,③,and so on. The structureis sheared/deformed by activity ① and suffers further de-formation by the new thrust activity ②. These deformationsare continuous with new thrust activities following repeat-edly. Thus, it is expected that the final structure has beenthe complex suffered repeated shearing with a constantwidth. However, the experiments in this study do not in-clude the effect of dewatering under the compaction. . Mechanism of fault dancing In order to examine the mechanism of fault dancing, wedivided these half-graben structures into two geometricalelements: (1) the gap in the top basement horizon; and(2) tilting of the top basement horizon. For the effect ofthe step, there are several studies of subduction of con-vex geometry in the basement, e.g., ridge and seamountsubduction, but few previous studies are known of con-cave geometries, e.g., graben subduction. The featuresimmediately following a seamount subduction may beused as an analogy of concave subduction, since the de-collement extends down from the top of the seamountto the basement level, where the fault activity continueslonger than others (Morgan and Bangs 2017). In our ex-periments, this feature may correspond to the longeractivity of T2 at stage 3, suggesting that the step forminga concave geometry can generate longer fault life. Mor-gan and Bangs 2017, however, do not report the faultdancing feature. This suggests that the second geomet-rical element, change in dip of the top basement, maycontrol the fault dancing. In addition, the friction alongthe decollement in this experiment suddenly changedaround the half-graben structure. The friction along thedecollement was low at the top surface of the basementcovered by a Teflon sheet, but the decollement friction inthe half-graben was high, i.e., in sand. This change of thefriction of decollement connects to such the discussion ofvarying down-decollement strength controls wedge growthversus propagation (Bose et al.2015). Interpretation of the structure of the Japan Trench The JFAST drilling project confirmed the presence of athick (~100 m) deformation zone just above the plateboundary fault in a location with a relatively small magni-tude of offset (~3.2 km). The thickness of the well-devel-oped deformation zone is approximately 100 m, and thatof the fault zone is approximately 7 m (Kirkpatrick et al.2015). In this study, the fault thickness in the experimentswas generally 0.35 cm, but the fault dancing produced ashear zone that was four times thicker, 1.12 cm (Fig. 5).Since 1.12 cm in the experiment corresponds to ca. 280 min the natural scale, which can be compared with the nat-ural thickness of the deformation zone,such a thick shearzone may be explained by the mechanism of faultdancing. Conclusions We have conducted experiments focusing on half-grabensubduction and found a dancing feature that is a new pat-tern of fault development. The fault dancing can thicken thesheared zone in a relatively short time scale (approximately0.03 million years). Our results suggest the following: 1))I1t is important to consider the mechanisms thatgenerate deformation zone thickness whenestimating displacement and total energydissipation, as wide shear zones can be producedeven with a limited slip. 2)The strain distribution suggests that the faultdancing mechanism may be a process that cangenerate tectonic melange formation. 3)Fault dancing may explain the presence of both arelatively thin plate boundary decollement within arelatively thick deformation zone observed in theJapan Trench. Abbreviations DIC: Digital image correlation; JFAST: Japan Trench Fast Drilling Project,Integrated Ocean Drilling Program, Expedition 343 and 343T Acknowledgements We thank Jin-Hisn Changm, Natsumi Okutsu, Ryota Hasegawa, and KotaroFujita for their great assistance in our experiments. We also thank the mem-bers of the Department of Ocean Floor Geoscience of the Atmosphere andOcean Research Institute for having greatly improved our motivation in con-ducting the research. Thanks are extended to the editors and two anonym-ous reviewers for their constructive comments. Funding HK was supported by the Sasakawa Scientific Research Grant from the JapanScience Society. YY is supported partly by JSPS KAKENHI Grant NumberJP15H05717 and JSPS KAKENHI Grant Number 17K05687. JA is supported byJSPS KAKENHI Grant Number 18H03732. Availability of data and materials Please contact author for data requests Authors'contributions HK proposed the topic, conceived and designed the study, carried out theexperimental and analytical study, and wrote the manuscript. YY provided the experimental equipment, guided the basic operation, discussed theresults, and wrote the manuscript. AO helped each time with the operationof the experiment and discussed the results. AB discussed the research fromthe viewpoint of numerical experiments. AY collaborated with the correspondingauthor in the preparation of the manuscript. JA is HK's supervisor, and discussedthe results, supported HK via a grant mainly to attend a conference for thedevelopment of this research, and wrote the manuscript. All authors read andapproved the final manuscript. Authors' information HK is a PhD student and specializes in structural geology, marine geology,and tectonic geomorphology of subduction zones. YY is the head of theResearch and Development Center and specializes in petroleum geology,structural geology,geophysical exploration, and drilling science of subductionzones. AO specializes in marine geology of subduction zones. AB is a researcherspecialized in the mechanics of geological structures. AY is an AssociateProfessor and specializes in marine geology, structural geology, and chemicalgeology of subduction zones. JA is an Associate Professor and specializes inmarine geology of subduction zones. Competing interests The authors declare that they have no competing interests. Publisher's Note Springer Nature remains neutral with regard to jurisdictional claims in publishedmaps and institutional affiliations. Author details Atmosphere and Ocean Research Institute, The University of Tokyo, 5-1-5Kashiwanoha, Kashiwa-shi, Chiba 277-8564, Japan. Department of NaturalEnvironmental Studies Division of Environmental Studies, Graduate School ofFrontier Sciences, The University of Tokyo,5-1-5Kashiwanoha, Kashiwa-shi,Chiba 277-8564, Japan. Japan Agency for Marine-Earth Science andTechnology, 3173-25 Showa-machi Kanazawa, Yokohama 236-0001, Japan.“Faculty of Science and Technology, Kochi University, 2-5-1 akebono-cho,Kochi-shi, Kochi 780-8520,Japan. Received: 2 April 2018 Accepted: 11 October 2018 Published online: 01 November 2018 References ( Adam J , Ura i J L, Wieneke B , Oncken O, Pf e iff e r K, K u k o wski N, Lohrma n n J, H oth S , v an d er Zee W , S c hma tz J (2 0 05) Sh e ar lo c alis a tion and s t ra i n di s trib u tio n duri n g t ectonic faul t i n g—new i n sights f rom g ranular- f lowexper im ents and hi g h -r e soluti o n optical im a ge cor r ela t i o n te c h niq u e s . J S tru c t Geol 27( 2 ):283- 3 01 ) ( B ile k S L , Lay T (2002 ) Tsunami earthquakes p ossibly widespread manife s tation s of f rict i o n al cond i t i onal s t ability. G e oph y s Res Let t 29( 1 4). h ttp s :// d oi .o rg /10. 1 02 9 / 2 0 0 2 G L 0 15 2 15 ) ( B ose S, Saha P, M ori JJ, Rowe C, Uji ie K, Chestere FM, Conin M , Regalla C, Kameda J , Toy V, Kirkpatrick J , R emit ti i F, Moor e J C, W o lfson-Schwehr k M, N a k a mural Y , G up ta A (2015) D e formation struct u res in th e frontal p r ism ne a r the Japan T rench: I nsig h t s fro m sandbox m odel s . J Ge odyn 89:29-38 ) ( Ch e ster F M , M or i J J , T oczko S , Eg u chi N , K i do Y, Sait o S, S anada Y , Anderson L,Behrm a nn J H, Bo se S (2012) Integrated Ocean D rilling Program Ex pedi ti o n 3 43/343T P re li m inary Re p ort, J a pan T re n c h Fas t Dri l l i n g Project (J F A S T). I n : I n t egrated Ocea n Drilling P r ojec t P r el i minary Report, 3 4 3 ) ( Ch e ster F M , R o we C, U j i ie K , Kir k patrick J, Regalla C, Remitt i F, Moore JC , Toy V,Wolfson - S c hwehr M , Bo se S, Kameda J, Mor i JJ, B ro dsky EE, Eg u c h i N , T ocz k o S , E xpedi t ion 3 43 and 3 43 T Scient i sts (201 3 ) St ru cture and co m position of the p l a te- b oundary sli p zone f o r th e 2 0 11 Tohoku- O k i ear t hq u ake. Sci 3 42 ( 6163): 12 08-1211 ) ( D eMets C, G o rdon R G , A r gus DF ( 2 01 0 ) Geologically current plat e m oti o ns. G eophys JI n t 1 8 1 ( 1 ) :1-80 ) Dotare T, Yamada Y, Adam J, Hori T, Sakaguchi H (2017) Initiation of a thrust faultrevealed by analog experiments. Tectonophys 684:148-156 Fujiwara T, Kodaira S, No T, Kaiho Y, Takahashi N, Kaneda Y (2011) The 2011Tohoku-Oki earthquake: displacement reaching the trench axis. Sci334(6060):1240 Graveleau F, Malavieille J, Dominguez S (2012) Experimental modelling oforogenic wedges: a review. Tectonophys 538:1-66 ( K im YS, San d er s on DJ ( 2 005) The r e lat i o nshi p between d i splacement a n d l e n g th o f f aults: a r ev i ew. Ear t h - Sci Rev 6 8(3):317 -33 4 ) ( K irkpatri c k JD, Rowe C D, U j iie K, Moore J C , R egalla C , R emitti F, Toy V, Wolfson- S chwehr M, Kamed a J , B o se S (2015) S t ruct u re and lith o l ogy of the J apan T re n ch subducti o n p l at e bo undar y faul t . T e ct o n 3 4 (1):5 3 -69 ) ( K odaira S , No T , N a kamura Y, Fujiwara T, Kai h o Y, Miura S , Taka h a s hi N, K an ed a Y , T a ira A (201 2 ) C oseis mic f a ult r u ptur e at t h e t r ench axis du r ing the 2 01 1 T o ho ku - o ki ea r t hquake . Nat Ge o sci 5 (9 ) :646 - 650 ) ( L aVi s ion ( 201 2 ) Produ c t - Manual f o r Davis 8.0 Str a inMaster . LaVision Gm bh , Gottingen ) ( L ohr m ann J , Kukowski N, Ada m J, O n cken O ( 2003) The impac t of a n alogue m at er i al p roper ti e s on t h e geo m etry, k i n e ma ti cs, and dy n a mic s o f c onver g en t s a nd wedg e s. J S truct Geo l 25( 1 0):1691- 17 11 ) ( M cClay K (199 2 ) Glos s ary of th ru s t te ct on i cs ter ms . In: M c Clay K (e d ) Thru s t t ecton i cs. S pringer, B erlin ) ( Moerem a ns R, S i ngh S C , Muk t i M, McArdle J, Jo ha nsen K (201 4) S e i s mi c i ma ge s of str u ctur a l va r iations along t h e d e for ma ti o n fr o n t o f t h e A ndaman- S umatra subduction zone: i mplications for rup t ure propagati on and t sunamigenesis . Earth P l a n e t S ci L et t 386 : 75 - 8 5 ) ( M oore GF, S hi p ley T H , S t o f fa PL, K arig DE, T ai r a A, Kuram o to S , T okuyama H, S u y e h i r o K ( 1990) Str u cture of t h e Nankai Trough a c cre ti onary zo n e fr om m ul tichan n e l s eismic re fl ec ti on data. J Geophys R es S oli d E ar t h 95(B6):8753-8765 ) ( M org a n J K, Bang s NL (2017) Reco g nizi n g s e a mount-f o r e arc col l isions at a ccr et i o nary ma rg ins : i ns ights fr o m di s crete n um erical s im u l at ion s. Ge o l 4 5(7):63 5- 638 ) ( N a k amu ra Y, K o daira S , Miura S, R egall a C, Tak a hashi N ( 201 3 ) Hi gh-resolu t ionse i smic imaging i n th e Ja pan T r e nc h ax i s area off M iyagi, n o rth e a s tern Japan. G e o phys R e s L e tt 40(9) : 17 1 3 - 1718 ) ( S cholz CH ( 1 998) Earth q uake s and f r icti o n l a ws. Nat 391 ( 6662): 3 7 ) ( S un T, Wang K, Fu j i w ara T, Kodaira S, He J ( 2 017) L a r g e fa u lt sl i p peaking at t r e n c h in t he 20 11 To h ok u -o k i ear t hquak e. Nat C om mun 8 :14044 ) ( Uji ie K, Tanaka H , S ai t o T, Tsut s umi A, M or i J J , K ameda J , Brodsky E E, Ch e ste r F M, E guc h i N, T oczko S (2013 ) L ow coseis m i c s h e a r s t ress o n the Tohoku-Oki m e g a th r ust de t ermin ed fro m labo r ator y e xpe r iments. S ci 3 42(61 6 3): 1 21 1-12 14 ) ( Y ama da Y, Baba K, Miyakawa A, Matsuoka T (2014) Granular ex p eriments of thr u stwedges: in s igh t s r e l evan t to meth a ne hy d rate explora t ion at t he N a nka i a ccr e tionary pr ism . Mar P e t Geol 5 1 :34 -4 8 ) Submit your manuscript to a SpringerOpen°journal and benefit from: 卜Convenient online submission DRigorous peer review DOpen access: articles freely available online _High visibility within the field DRetaining the copyright to your article Submit your next manuscript at springeropen.com The 2011 Tohoku-oki earthquake unexpectedly ruptured to the shallowest portion of the plate boundary fault and triggered a large tsunami. The shallow portion had generally been regarded as a seismically stable zone until this event, but its significance has now been dramatically revealed for future disaster mitigation. This research approaches the shallow portion, especially the formation process of its structure and plate boundary faults. Scientific drilling conducted near the Japan Trench after the earthquake reported a thin plate boundary fault (~ 7 m) and thick deformation zone (~ 100 m). This thin fault would be expected given the relatively small displacement near the trench (~ 3.2 km), but the deformation zone thickness is anomalously wide given this small magnitude of slip. To understand the dynamic deformation processes that lead to the development of a thick deformation zone surrounding a thin fault core, we conducted forward modeling of an analog experiment with the technique to visualize fault activity. Sandbox experiments are effective for the approximation of the geological phenomenon and structure. The seismic profile of the largest slip region in the 2011 earthquake shows that a half-graben structure has been subducted underneath the frontal wedge, thus we focused on this structural architecture. As a result, we found a new fault formation pattern, i.e., the frontal thrust (the most frontal part of décollement)periodically partitioned into pieces, which connect again to form a large-continuous fault. The fault also oscillates up and down during this process, which we call “dancing,” and a thick shear zone is formed in a relatively short time where this occurs, even though the fault only has a small displacement. By analogy, the thick deformation zone observed at the Japan Trench could be formed by such fault dancing. The energy of the fault activity is commonly estimated from the fault displacement derived from the thickness of the shear zones. Applying the thickness-displacement law without considering the effect of the dancing may cause overestimation. The architecture of the shear zone formed is similar to that of a mélange, and the origin of tectonic mélanges may be explained by this mechanism.
确定
还剩4页未读,是否继续阅读?

产品配置单


北京欧兰科技发展有限公司为您提供《沙箱模型中形变场,应变场检测方案(其它无损检测仪器/设备)》,该方案主要用于其他中形变场,应变场检测,参考标准--,《沙箱模型中形变场,应变场检测方案(其它无损检测仪器/设备)》用到的仪器有LaVision StrainMaster材料应变形变成像测量系统、LaVision DaVis 智能成像软件平台
推荐专场


相关方案
更多
该厂商其他方案
更多